atlas of health care in wisconsin...components driving resource use (emergency department, hospital,...
TRANSCRIPT

isconsinhealth nfo.org | 330 East Lakeside Street Madison, WI 53715 | 608 442-3876March 2015 Vol.1
WHIO
wisconsinhealthinfo.org | 330 East Lakeside Street, Madison, WI 53715 | 608 442-3876
Atlas of Health Carein Wisconsin

Copyright © 2015 Wisconsin Health Information Organization All rights reserved.
WHIO ATLAS OF HEALTH CARE IN WISCONSIN IN WISCONSIN
Direct questions and comments to:[email protected]

Founding Members
The Alliance
Anthem Blue Cross and Blue Shield of Wisconsin
Greater Milwaukee Business Foundation on Health
Humana
UnitedHealthcare of Wisconsin
WEA Trust
Wisconsin Collaborative for Healthcare Quality
Wisconsin Hospital Association
Wisconsin Medical Society
WPS Health Insurance
Special thanks to Dr. John Toussaint for his vision that made WHIO possible


WHIO ATLAS OF HEALTH CARE IN WISCONSIN IN WISCONSIN
Table of Contents
Introduction ______________________________________________________________ 6
Executive Summary _______________________________________________________ 7
Glossary of Terms ________________________________________________________ 8
Analytics _________________________________________________________________ 15
Standard Pricing ______________________________________________________________ 16
De-identification ______________________________________________________________ 16
Imputed Primary Care Physician ______________________________________________ 16
Charts and Tables ________________________________________________________ 17
Overview ______________________________________________________________________ 17
Charts and Tables _____________________________________________________________ 18 Resource Use Per Member Per Month (PMPM) by Imputed PCP Region _____________________ 19 Resource Use PMPM Index for Population-Based Imputed PCP Peer Groups by Region _______ 19 Risk-adjusted Resource Use PMPM Index by Imputed PCP Region __________________________ 20 Risk-adjusted Resource Use PMPM Index by Imputed PCP County __________________________ 21 Risk-adjusted Resource Use PMPM Index by Imputed PCP Zip Code ________________________ 22 Primary Care Resource Use Index by Imputed PCP Region _________________________________ 23 Primary Care Resource Use Index by Imputed PCP County _________________________________ 24 Primary Care Resource Use Index by Imputed PCP Zip Code _______________________________ 25 Specialty Care Resource Use Index by Imputed PCP Region ________________________________ 26 Specialty Care Resource Use Index by Imputed PCP County ________________________________ 27 Specialty Care Resource Use Index by Imputed PCP Zip Code ______________________________ 28 Hospital Services Resource Use Index by Imputed PCP Region _____________________________ 29 Hospital Services Resource Use Index by Imputed PCP County _____________________________ 30 Hospital Services Resource Use Index by Imputed PCP Zip Code ____________________________ 31 Emergency Room Resource Use Index by Imputed PCP Region _____________________________ 32 Emergency Room Resource Use Index by Imputed PCP County _____________________________ 33 Emergency Room Resource Use Index by Imputed PCP Zip Code ___________________________ 34 Laboratory Services Resource Use Index by Imputed PCP Region ___________________________ 35 Laboratory Services Resource Use Index by Imputed PCP County ___________________________ 36 Laboratory Services Resource Use Index by Imputed PCP Zip Code _________________________ 37 Radiology Services Resource Use Index by Imputed PCP Region ____________________________ 38 Radiology Services Resource Use Index by Imputed PCP County ____________________________ 39 Radiology Services Resource Use Index by Imputed PCP Zip Code __________________________ 40 Northeastern Region Imputed PCPs Utilization Index by Service Category ___________________ 41 Northeastern Region Imputed PCPs Risk-adjusted Resource Use PMPM _____________________ 42 Northern Region Imputed PCPs Utilization Index by Service Category _______________________ 43 Northern Region Imputed PCPs Risk-adjusted Resource Use PMPM ________________________ 44 Southeastern Region Imputed PCPs Utilization Index by Service Category ___________________ 45 Southeastern Region Imputed PCPs Risk-adjusted Resource Use PMPM _____________________ 46 Southern Region Imputed PCPs Utilization Index by Service Category _______________________ 47 Southern Region Imputed PCPs Risk-adjusted Resource Use PMPM ________________________ 48 Western Region Imputed PCPs Utilization Index by Service Category ________________________ 49 Western Region Imputed PCPs Risk-adjusted Resource Use PMPM _________________________ 50

WHIO ATLAS OF HEALTH CARE IN WISCONSIN IN WISCONSIN
6
Introduction
WHIO is proud to introduce the initial version of The WHIO Atlas of Health Care in Wisconsin,
the Wisconsin Atlas. Wisconsin has a long and rich history of striving to improve the “value” of
health care delivered to its residents. Businesses, government, health care providers, insurance
companies, public agencies and individuals have all participated in this effort. We believe that
this first version of the Wisconsin Atlas will help all interested parties to better understand
geographically based practice variation in our State as a means to achieve the highest quality of
care possible at the most appropriate cost.
Using the robust WHIO health care claims database, this version of the Atlas maps out
geographically based relative resource use (Resource Use Index) by Dartmouth Atlas regions,
by Wisconsin State County and by zip code. The Atlas allows one to understand the major
components driving resource use (Emergency Department, Hospital, Laboratory, Primary
Care, Radiology, and Specialty Care) in any specific geography.
The Wisconsin Atlas complements the Dartmouth Atlas. The current WHIO claims database
includes commercial, Medicaid and Medicare Advantage insurance claims. The Dartmouth
Atlas uses Medicare fee-for-service claims only. Additional detail regarding the WHIO data
characteristics used to develop the Atlas is outlined in Section IV.
The Atlas visually portrays geographically based clinical practice variation. Variation in clinical
practice in and of itself is not necessarily “good” or “bad.” However, identifying variation
presents an opportunity to understand differences in care delivery, and thereby a means to
identify “best practices,” improve quality and lower costs.
We hope you find this initial version of the Wisconsin Atlas useful. Future versions will portray
larger and increasingly comprehensive data to support WHIO’s mission to improve the quality,
efficiency and affordability of health care for residents of Wisconsin.
We welcome all feedback on the Wisconsin Atlas. Please send any comments, suggestions or
questions to [email protected].
Mark Kaufman, M.D. Retired Internal Medicine physician and former Chief Medical Officer, Dean ClinicConsultant to WHIO

WHIO ATLAS OF HEALTH CARE IN WISCONSIN IN WISCONSIN
7
Executive Summary
The Wisconsin Atlas is the first publication of its kind using WHIO data, highlighting variation
in health care delivery by region. It is inspired by the seminal publication, the Dartmouth Atlas.
The Dartmouth Atlas of Health Care project was founded in 1996 by John E. Wennberg, M.D.,
M.P.H., as part of the Dartmouth Institute for Health Policy and Clinical Practice. The
Dartmouth Atlas of Health Care seeks to better understand the relationship between health care
spending and outcomes. Using data provided by the Centers for Medicare & Medicaid Services,
the Dartmouth Atlas project has analyzed health care expenditures, delivery, utilization and
outcomes at the national, regional and local levels across the United States for more than 20
years. The Dartmouth Atlas of Health Care’s research has revealed that health care spending and
growth varies dramatically across the United States.
The data in the WHIO Atlas of Health Care in Wisconsin are sourced from the Wisconsin Health
Information Organization (WHIO), the voluntary All-Payer Claims Database in Wisconsin, now
in its 10th year of operation.
The Wisconsin Atlas shows striking variation in care delivery by geography. The analysis does
not account for differences in payer mix, which may be significant in areas with large Medicaid
populations.
It is likely that some variation can be explained by elements of demography, socio-economic
status and/or access to care.
This first version of the Wisconsin Atlas points out areas where more investigation may be
warranted. It is a starting point. Using these data, one can begin to identify opportunities for
further research and potentially for improvements in care.

WHIO ATLAS OF HEALTH CARE IN WISCONSIN IN WISCONSIN
8
Glossary of Terms
APCD All-Payer Claims Database. In general, APCDs are data organizations that collect health care claims and related data from a variety of different payers. APCDs are generally associated with a single state. Governance can be collaborative and voluntary, as it is in WHIO, or mandated by state legislation, as in the majority of other state APCDs. WHIO is unique in that participation is voluntary, it is not state-owned, and access to data is not government-controlled.
Attribution Attribution is the method by which a patient is attributed to a responsible provider. In the WHIO Atlas, patients are attributed to primary care physicians using an imputation methodology using medical claims data. See "Imputed PCP."
Average Length of Stay
Index
The Average Length of Stay Index is a utilization measure and is computed as the ratio of Actual average length of stay for a patient population to the Expected average length of stay in the peer group being measured. An index of 1.0 represents the average (expected) amount for the peer group as a whole. An index below 1.0 indicates shorter average length of stay than expected, based on the peer group average for the same mix of patients. An index above 1.0 indicates a longer average length of stay than expected, based on the peer group average for the same mix of patients. In WHIO population measures, admissions for mental health and obstetrics are not included.
Catastrophic Patients
Patients in the WHIO datamart whose annualized standard cost exceeds $50,000 in the 12-month reporting period are considered "catastrophic" and are not included in population-based measurement.
Dartmouth Atlas
The Dartmouth Atlas of Health Care project was founded in 1996 by John E. Wennberg, M.D., M.P.H., as part of the Dartmouth Institute for Health Policy and Clinical Practice. The Dartmouth Atlas of Health Care seeks to better understand the relationship between health care spending and outcomes. Using data provided by the Centers for Medicare & Medicaid Services, the Dartmouth Atlas project has analyzed health care expenditures, delivery, utilization and outcomes at the national, regional and local levels across the United States for more than 20 years. The Dartmouth Atlas of Health Care’s research has revealed that health care spending and growth varies dramatically across the United States.

WHIO ATLAS OF HEALTH CARE IN WISCONSIN IN WISCONSIN
9
ER Visits Index The ER Visits Index is a utilization measure and is computed as the ratio of Actual emergency room visits for a patient population to the Expected number of emergency room visits in the peer group being measured for the same mix of patients. An index of 1.0 represents the average (expected) amount for the peer group as a whole. An index below 1.0 indicates fewer emergency room visits than expected, based on the peer group average for the same mix of patients. An index above 1.0 indicates more emergency room visits than expected, based on the peer group average for the same mix of patients.
Hospital Services Index
The Hospital Services Index is a resource use measure quantified using the standardized cost of inpatient and outpatient services provided at a facility. It is computed as the ratio of Actual Hospital Services resource use (standard cost) to the Expected Hospital Services resource use in the peer group being measured. An index of 1.0 represents the average (expected) amount for the peer group as a whole. An index below 1.0 indicates fewer Hospital Services than expected were used, based on the peer group average for the same mix of patients. An index above 1.0 indicates more Hospital Services were used than expected, based on the peer group average for the same mix of patients.
Hospital Services
Hospital Services is a resource use measure, quantified using standard cost of Inpatient and Outpatient facility-based services. Because Laboratory and Radiology resource use are captured in their own separate categories, they are not included in Hospital Services.
Imputed Primary Care
Physician (PCP)
In WHIO's data process, a patient's primary care provider (PCP) is imputed based on the primary-care related services received by the patient, and observed in the claims data, during the reporting period. This imputed PCP can be different than the “assigned” PCP, if there is one designated by the member’s health plan as part of the submitted enrollment information. Since WHIO data contributors are not uniform in their use of PCPs across their covered populations, the imputed PCP is a consistent approach to using actual primary care service data to align members with primary care physicians and systems.
Index Generally, each Index measure is computed as the ratio of the Actual value (standardized cost or visits) to the Expected value for the peer group, for the same mix of patients.
Inpatient Admits Index
The Inpatient Admits Index is a utilization measure and is computed as the ratio of the Actual number of inpatient admits for a patient population to the Expected number of inpatient admits in the peer group being measured. An index of 1.0 represents the average (expected) amount for the peer group as a whole. An index below 1.0 indicates fewer inpatient admits than expected, based on the peer group average for the same mix of patients. An index above 1.0 indicates more inpatient admits than expected, based on the peer group average for the same mix of patients. In WHIO population measures, admissions for mental health and obstetrics are not included.

WHIO ATLAS OF HEALTH CARE IN WISCONSIN IN WISCONSIN
10
Inpatient Days Index
The Inpatient Days Index is a utilization measure and is computed as the ratio of the Actual number of inpatient hospital days for a patient population to the Expected number of inpatient hospital days in the peer group being measured. An index of 1.0 represents the average (expected) amount for the peer group as a whole. An index below 1.0 indicates fewer inpatient hospital days than expected, based on the peer group average for the same mix of patients. An index above 1.0 indicates more inpatient hospital days than expected, based on the peer group average for the same mix of patients. In WHIO population measures, admissions for mental health and obstetrics are not included.
Laboratory Procedures
Index
The Laboratory Procedures Index is a utilization measure and is computed as the ratio of Actual laboratory procedures performed for a patient population to the Expected number of laboratory procedures performed in the peer group being measured for the same mix of patients. An index of 1.0 represents the average (expected) amount for the peer group as a whole. An index below 1.0 indicates fewer laboratory procedures were performed than expected, based on the peer group average for the same mix of patients. An index above 1.0 indicates more laboratory procedures were performed than expected, based on the peer group average for the same mix of patients.
MRI Procedures
Index
The MRI Procedures Index is a utilization measure and is computed as the ratio of Actual MRI/MRA procedures performed for a patient population to the Expected number of MRI/MRA procedures performed in the peer group being measured for the same mix of patients. An index of 1.0 represents the average (expected) amount for the peer group as a whole. An index below 1.0 indicates fewer MRI/MRA procedures were performed than expected, based on the peer group average for the same mix of patients. An index above 1.0 indicates more MRI/MRA procedures were performed than expected, based on the peer group average for the same mix of patients.
Northeastern Region
The Northeastern Region is a county-based region definition modeled after Dartmouth Atlas service areas. The region consists of the following Wisconsin counties: Brown, Calumet, Door, Fond Du Lac, Green Lake, Kewaunee, Manitowoc, Marinette, Marquette, Menominee, Oconto, Outagamie, Shawano, Sheboygan, Waupaca, Waushara, and Winnebago.
Northern Region
The Northern Region is a county-based region definition modeled after Dartmouth Atlas service areas. The region consists of the following Wisconsin counties: Ashland, Bayfield, Florence, Forest, Iron, Langlade, Lincoln, Marathon, Oneida, Portage, Price, Sawyer, Taylor, Vilas, and Wood.
Primary Care Physician
(PCP)
A PCP is a provider with a specialty of Family Medicine, Internal Medicine, or Pediatrics.

WHIO ATLAS OF HEALTH CARE IN WISCONSIN IN WISCONSIN
11
PCP Visits Index
The PCP Visits Index is a utilization measure and is computed as the ratio of Actual primary care visits for a patient population to the Expected number of primary care visits in the peer group being measured for the same mix of patients. An index of 1.0 represents the average (expected) amount for the peer group as a whole. An index below 1.0 indicates fewer primary care visits than expected, based on the peer group average for the same mix of patients. An index above 1.0 indicates more primary care visits than expected, based on the peer group average for the same mix of patients.
Peer Group A Peer Group in WHIO specifies the characteristics of providers to enable an appropriate comparison of a physician to a group of his or her peers. In the WHIO Atlas, WHIO has used imputed PCP peer groups to compare utilization and resource use measures across Family Medicine, Internal Medicine, and Pediatric physicians in Wisconsin.
PMPM PMPM, an acronym for Per Member Per Month, is a calculated measure to quantify total resource use of a patient population and to support risk-adjusted calculations and comparisons.
Primary Care Services,
Primary Care Resource Use
Primary Care Services is a resource use measure quantified using the standard cost of primary care services, which are those typically delivered by a primary care physician in an office setting, and includes office visits and some minor diagnostic and procedural services.
Profile Service Categories,
PSCs
Profile Service Categories are a classification scheme for health care services designed specifically to support provider measurement analytics. These categories describe the services rendered in caring for a patient. They provide an element of whether the service can be considered a service typically performed by an individual’s primary care provider or by a specialist or other provider.
Radiology Procedures
Index
The Radiology Procedures Index is the ratio of Actual radiology procedures performed for a patient population to the Expected number of radiology procedures performed in the peer group being measured for the same mix of patients. An index of 1.0 represents the average (expected) amount for the peer group as a whole. An index below 1.0 indicates fewer radiology procedures were performed than expected, based on the peer group average for the same mix of patients. An index above 1.0 indicates more radiology procedures were performed than expected, based on the peer group average for the same mix of patients.
Radiology Services (PSC)
Radiology services is a resource use measure quantified using the standard cost of professional and facility components of radiology services. Not included are minor diagnostic procedures that are performed in the primary care setting and are grouped to Primary Care Services. Radiation Oncology is also not included.

WHIO ATLAS OF HEALTH CARE IN WISCONSIN IN WISCONSIN
12
Referral Visits Index
The Referral Visits Index is a utilization measure and is computed as the ratio of Actual specialist referral visits for a patient population to the Expected number of specialist referral visits in the peer group being measured for the same mix of patients. An index of 1.0 represents the average (expected) amount for the peer group as a whole. An index below 1.0 indicates fewer specialist referral visits than expected, based on the peer group average for the same mix of patients. An index above 1.0 indicates more specialist referral visits than expected, based on the peer group average for the same mix of patients.
Region The geographical area where the physician practices; the Wisconsin Atlas uses counties to assign PCPs to one of five geographical regions: Northeastern, Northern, Southeastern, Southern, and Western.
Reporting Period
The measures included in this report reflect dates of service in the range 4/1/2013 through 3/31/2014. The data were sourced from the WHIO Datamart version 12 (DMV12), published on 1/1/2015.
Resource Use Measure
The term “resource use measure” is intended to broadly capture indicators of the cost and efficiency of health care provision, and specifically enable the measurement of the mix and intensity of services. From the Agency for Healthcare Research and Quality (AHRQ.gov) report on selecting quality and resource use measures: Health care resource use measures reflect the amount or cost of resources used to create a specific product of the health care system. The specific product could be a visit or procedure, all services related to a health condition, all services during a period of time, or a health outcome. In WHIO analytics and throughout this Atlas, resource use measures are quantified using Standard Pricing. See Standard Pricing.
Risk Adjustment
Risk Adjustment is the process of using the results of risk assessment to adjust for differences in patient illness burden to support measurement. WHIO uses a Symmetry Risk model to assess and stratify patient risk using medical claims.
Risk Adjusted Resource Use
PMPM
Risk Adjusted Resource Use PMPM is a resource use measure, quantified using the total standard cost for a patient population, risk adjusting for differences in illness burden, and normalizing for months of eligibility in the 12 month reporting period. A PMPM measure is commonly used in quantifying per-member resource use. The risk adjustment is applied to ensure valid comparisons of population-based measures.
Southeastern Region
The Southeastern Region is a county-based region definition modeled after Dartmouth Atlas service areas. The region consists of the following Wisconsin counties: Jefferson, Kenosha, Milwaukee, Ozaukee, Racine, Walworth, Washington, and Waukesha.
Southern Region
The Southern Region is a county-based region definition modeled after Dartmouth Atlas service areas. The region consists of the following Wisconsin counties: Adams, Columbia, Crawford, Dane, Dodge, Grant, Green, Iowa, Juneau, Lafayette, Richland, Rock, Sauk, and Vernon.

WHIO ATLAS OF HEALTH CARE IN WISCONSIN IN WISCONSIN
13
Specialist Care Referral Visits
Index
The Specialist Care Referral Visits Index is a utilization measure and is computed as the ratio of Actual specialist visits for a patient population to the Expected number of specialist visits in the peer group being measured for the same mix of patients. An index of 1.0 represents the average (expected) amount for the peer group as a whole. An index below 1.0 indicates fewer specialist visits than expected, based on the peer group average for the same mix of patients. An index above 1.0 indicates more specialist visits than expected, based on the peer group average for the same mix of patients.
Specialty Care Services
Specialty Care Services is a resource use measure quantified using the standard cost of physician and ancillary services not included in the other categories. Includes surgery, consultations, office visits performed by specialist physicians, anesthesia, but does not include lab or radiology.
Standard Cost Standard Cost is the measure of resource use which is used throughout WHIO analytics. WHIO's data vendor, OptumInsight, applies a Standard Pricing methodology to all medical and pharmacy claims submitted by WHIO Member/data contributors. Standard pricing is the process of creating a uniform and consistent approach to classifying and pricing all services. The process removes variations that may exist in allowed or paid amounts that are driven by differences in contractual arrangements, geographic regions, timeframes of data, and the health care setting or organization from which services are provided.
Standard Cost Index
Standard Cost Index is a resource use measure, quantified using the standard cost for all health care services rendered for a patient population. It includes all types of service: Primary Care, Specialty Care, Ancillary services (e.g. Laboratory and Radiology), Pharmacy, and Hospital Services. The Index is a ratio of the Actual Standard Cost for a patient population to the Expected Standard Cost in the peer group being measured for the same mix of patients. An index of 1.0 represents the average (expected) amount for the peer group as a whole. An index below 1.0 indicates fewer total resources than expected were used, based on the peer group average for the same mix of patients. An index above 1.0 indicates more total resources than expected were used, based on the peer group average for the same mix of patients.
Standard Pricing
Standard Pricing refers to the methodology applied to WHIO claims data to arrive at a Standard Cost for every health care service. See Standard Cost.
Western Region
The Western Region is a county-based region definition modeled after Dartmouth Atlas service areas. The region consists of the following Wisconsin counties: Barron, Buffalo, Burnett, Chippewa, Clark, Douglas, Dunn, Eau Claire, Jackson, La Crosse, Monroe, Pepin, Pierce, Polk, Rusk, St. Croix, Trempealeau, and Washburn.
WHIO WHIO, or Wisconsin Health Information Organization, is the Wisconsin All Payer Claims Data organization. WHIO was founded in 2005 by a small group of health care thought leaders in the state, convened by Dr. John Toussaint.

WHIO ATLAS OF HEALTH CARE IN WISCONSIN IN WISCONSIN
14
WHIO Members
WHIO Members are organizations who submit administrative health care data to WHIO. WHIO Members consist of national insurance carriers, Wisconsin-based provider-owned and other commercial health plans, an employer cooperative, and the State of Wisconsin Medicaid program. As of February 2015, WHIO Members include the following (founding members are noted with an asterisk): The Alliance,* Anthem Blue Cross Blue Shield of Wisconsin,* Dean Health Plan, Group Health Cooperative of Eau Claire, Group Health Cooperative of Southcentral Wisconsin, Gundersen Health Plan, HealthPartners, Health Tradition Health Plan, Humana,* Medical Associates, MercyCare Insurance Company, Network Health Plan, Physicians Plus Insurance Corporation, Security Health Plan, UnitedHealthcare of Wisconsin,* Unity Health Plan, WEA Trust Insurance,* Wisconsin Department of Health Services (Medicaid) and WPS Health Insurance.*

WHIO ATLAS OF HEALTH CARE IN WISCONSIN IN WISCONSIN
15
Analytics
Information in the WHIO Atlas of Health Care in Wisconsin is sourced from data in the WHIO
Datamart, one of the largest voluntary All-Payer Claims Databases (APCD) in the country. It
offers WHIO’s diverse members and subscribers access to reliable, actionable information to
improve the quality, efficiency and transparency of health care in Wisconsin. This section briefly
describes the data sources, data processing, and enhancements applied to WHIO data.
WHIO data are provided by participating Member organizations, consisting of health plans in
Wisconsin and Wisconsin Medicaid. WHIO Members submit large sets of administrative claims
and eligibility data to WHIO’s data vendor twice annually. Each semiannual datamart cycle
consists of data submissions, data quality-checks, consolidation and integration steps to
combine the data across the (currently) 16 data sources, and application of data enhancements
to enable powerful analytics. WHIO Members that contribute data are listed below:
The Alliance
Anthem Blue Cross and Blue Shield of WI
Dean Health Plan
GHC of Eau Claire*
GHC of Southcentral WI
Gundersen Health Plan
HealthPartners*
Health Tradition Health Plan
Humana
Medical Associates*
MercyCare Insurance Company
Network Health Plan
Physicians Plus Insurance Corporation
Security Health Plan
UnitedHealthcare of Wisconsin
Unity Health Plan
WEA Trust Insurance
WI Dept. of Health Services (WI
Medicaid)
WPS Health Insurance
* These Members are in the implementation phase and have not yet begun submitting data for inclusion in WHIO
datamarts.
Data Integration
Data Integration processes are applied to match both providers and covered members
across the 16 WHIO Member data sources. These are complex algorithms with the goal to
represent each patient and each provider uniquely and consistently across time and across
WHIO datamarts. If members change health plans, the member matching process is
designed to combine eligibility information from disparate sources such that the patient is
represented only once. Similarly, the same provider can be found in multiple health plans’
billing data. The provider matching algorithm uses demographic information to identify
the same provider across all data sources, such that all care provided by him or her is
appropriately attributed to the same provider identity.

WHIO ATLAS OF HEALTH CARE IN WISCONSIN IN WISCONSIN
16
Standard Pricing
An important data enhancement applied to WHIO claim data is the standardized pricing
methodology. Standard pricing is the process of creating a uniform and consistent approach
to classifying and pricing all services. The algorithm removes variations that may exist in
allowed or paid amounts that are driven by differences in contractual arrangements,
geographic regions, timeframes of data, and the health care setting or organization from
which services are provided. Standard pricing normalizes the unit price of each health
service, which enables apples to apples comparisons across providers, geography, and place
of service. The end result is a measure of mix and intensity of services.
De-identification
One of the founding principles in WHIO’s data policy is that certain attributes of the
administrative data are de-identified. Once the data vendor has received and integrated the
fully-identified claim and eligibility data from all data sources, applied quality checks, and
matching algorithms, all personal identifiers for patients, health plans, and employers are
de-identified. There are still patient characteristics that remain for population-based
analytics such as gender, age in years, and county of residence.
Imputed Primary Care Physician
The analytics of the WHIO Wisconsin Atlas are centered on the concept of imputed primary
care physicians (PCPs). Not all health plans require their members to choose a PCP. In
order to attribute patients to a PCP or a PCP system, an imputation process is applied which
examines claims for primary care services and seeks to impute a PCP for each individual
patient in a 12 month period.

WHIO ATLAS OF HEALTH CARE IN WISCONSIN IN WISCONSIN
17
Charts and Tables
Overview
This section of charts and maps visually portrays variation in resource use across imputed Primary Care Physician (PCP) geography. Measures of actual resource use in the WHIO patient population have been aggregated, attributed to imputed PCPs, and stratified by service category and provider geography. Measures are reported in the form of an Index, a comparative measure which is a ratio of the actual to the expected amount for the combined peer group of all PCPs for the same mix of patients.
The patient populations represented in WHIO data are comprised of those with commercial, Medicaid, and Medicare Advantage insurance. While these summary measures are composites for the combined population, it is likely that some variation is driven by differences in payer mix, which could be the focus of future investigation.
Not all individuals utilize health care services and incur claims in a 12 month period. Even if they do, they may be only prescription drug refills or care not considered preventive/primary care. These individuals would likely not have an imputed PCP, and (as such) their resource use will not be reflected in this analysis. Also, patients with significant resource use, in excess of $50,000 in standard cost, are considered “catastrophic” and are also not reflected in this analysis.
The population of patients included in the WHIO Atlas of Health Care in Wisconsin consists of those whose medical claims revealed a patient-care relationship with a PCP in the period April 1, 2013 through March 31, 2014.

WHIO ATLAS OF HEALTH CARE IN WISCONSIN IN WISCONSIN
18
Charts and Tables

WHIO ATLAS OF HEALTH CARE IN WISCONSIN IN WISCONSIN
19
Resource Use Per Member Per Month (PMPM) by Imputed PCP Region
Figure 1: WHIO resource use data are summarized here by region of the patient population’s imputed PCP. The stacked bars represent the overall health care resource use, in standardized cost, for the WHIO patient population with an imputed PCP. The costs are subcategorized into service categories: Primary Care, Specialty Care, Hospital, Emergency Room, Laboratory, and Radiology. These are the measures that will be used throughout the WHIO Atlas of Health Care in Wisconsin.
Resource Use PMPM Index for Population-Based Imputed PCP Peer Groups by Region
Figure 2: The WHIO Atlas of Health Care in Wisconsin represents data as an Index, and relative to the primary care peer group statewide average, which is noted as an index value of 1.0. This chart, and graphics that follow, depict regional variation by the region of the imputed PCP of the WHIO patient population, stratified by service category. The index is a ratio of actual resource use to expected resource use for the same case mix of patients.
0
50
100
150
200
250
300
350
NORTHEASTERN NORTHERN SOUTHEASTERN SOUTHERN WESTERN
ER Hospital Services Laboratory Primary Care Core Radiology Specialty Care
0.80
0.85
0.90
0.95
1.00
1.05
1.10
1.15
1.20
NORTHEASTERN NORTHERN SOUTHEASTERN SOUTHERN WESTERN
ER Hospital Services Laboratory Primary Care Core Radiology Specialty Care

WHIO ATLAS OF HEALTH CARE IN WISCONSIN IN WISCONSIN
20
Risk-adjusted Resource Use PMPM Index by Imputed PCP Region
Figure 3: Risk-adjusted Resource Use PMPM Index is a measure that quantifies all services rendered to a patient population in the reporting period. The patients are grouped by the region of their imputed PCP, and their resource use is risk-adjusted using a retrospective claims-based risk model. This chart and the corresponding shaded regions on the map indicate that the patients treated by PCPs located in the Northeastern and Southeastern regions utilize above average resources on a risk-adjusted basis, than the populations in the other regions of the state. The bar chart graphically depicts the Risk-adjusted Resource Use PMPM Index where the value of 1.0 is the statewide average. Regions shaded in hues of green indicate below average resource use compared to the statewide average; hues of yellow and orange indicate above average resource use. This color formatting scheme is used throughout the Wisconsin Atlas.

WHIO ATLAS OF HEALTH CARE IN WISCONSIN IN WISCONSIN
21
Risk-adjusted Resource Use PMPM Index by Imputed PCP County
Figure 4: This county map is a more granular depiction of the previous regional map, comparing the Risk-adjusted Resource Use PMPM Index for the patient population by the imputed PCP’s county of practice. The map uses gradient shading in hues of green, yellow, and orange, to indicate the Index values relative to the statewide average of 1.0. The data are grouped by the county of the imputed PCP of the patient population. Regions shaded in hues of green indicate below average resource use compared to the statewide average; hues of yellow and orange indicate above average resource use. Florence County is unshaded, indicating that there are no PCPs imputed to patients in the WHIO data.

WHIO ATLAS OF HEALTH CARE IN WISCONSIN IN WISCONSIN
22
Risk-adjusted Resource Use PMPM Index by Imputed PCP Zip Code
Figure 5: Consistent with the previous regional and county shaded maps, this map is the most granular, grouped by the zip code of the imputed PCP’s practice location. Unshaded zip code areas are generally rural and indicate that there is no PCP in that zip code with an imputed WHIO patient population.

WHIO ATLAS OF HEALTH CARE IN WISCONSIN IN WISCONSIN
23
Primary Care Resource Use Index by Imputed PCP Region
Figure 6: Primary Care Services are a subset of the overall resources used by a patient population. The Primary Care Resource Use Index is a risk-adjusted measure that compares actual Primary Care Services rendered to a patient population in a region to the expected Primary Care Services for the same mix of patients, determined by the statewide peer group average. The patient population is grouped by the region of their imputed PCP, and their resource use is risk-adjusted using a retrospective claims-based risk model. This chart and the corresponding shaded regions on the map indicate that the patients treated by PCPs located in the Northeastern and Southeastern regions utilize above average primary care resources on a risk-adjusted basis compared to the populations in the other regions of the state. The bar chart graphically depicts the Primary Care Resource Use Index where the value of 1.0 is the statewide average.

WHIO ATLAS OF HEALTH CARE IN WISCONSIN IN WISCONSIN
24
Primary Care Resource Use Index by Imputed PCP County
Figure 7: This county map is a more granular depiction of the previous regional map, comparing the Primary Care Resource Use Index for the patient population by the imputed PCP’s county of practice. The map uses gradient shading in hues of green, yellow, and orange, to indicate the Index values relative to the statewide average of 1.0. The data are grouped by the county of the imputed PCP of the patient population. Regions shaded in hues of green indicate below average resource use compared to the statewide average; hues of yellow and orange indicate above average resource use. Florence County is unshaded, indicating that there are no PCPs imputed to patients in the WHIO data.

WHIO ATLAS OF HEALTH CARE IN WISCONSIN
25
Primary Care Resource Use Index by Imputed PCP Zip Code
Figure 8: Consistent with the previous regional and county shaded maps, this map is the most granular, grouped by the zip code of the imputed PCP’s practice location. Unshaded zip code areas are generally rural and indicate that there is no PCP in that zip code with an imputed WHIO patient population.

WHIO ATLAS OF HEALTH CARE IN WISCONSIN IN WISCONSIN
26
Specialty Care Resource Use Index by Imputed PCP Region
Figure 9: Specialty Care Services are a subset of the overall resources used by a patient population. The Specialty Care Resource Use Index is a risk-adjusted measure that compares actual Specialty Care Services rendered to a patient population in a region to the expected Specialty Care Services for the same mix of patients, determined by the statewide peer group average. The patient population is grouped by the region of their imputed PCP, and their resource use is risk-adjusted using a retrospective claims-based risk model. This chart and the corresponding shaded regions on the map indicate that the patients with imputed PCPs located in the Western, Northern, and Northeastern regions utilize above average specialty care resources on a risk-adjusted basis compared to the populations in the southern regions of the state. The bar chart graphically depicts the Specialty Care Resource Use Index where the value of 1.0 is the statewide average.

WHIO ATLAS OF HEALTH CARE IN WISCONSIN IN WISCONSIN
27
Specialty Care Resource Use Index by Imputed PCP County
Figure 10: This county map is a more granular depiction of the previous regional map, comparing the Specialty Care Resource Use Index for the patient population by the imputed PCP’s county of practice. The map uses gradient shading in hues of green, yellow, and orange, to indicate the Index values relative to the statewide average of 1.0. The data are grouped by the county of the imputed PCP of the patient population. Regions shaded in hues of green indicate below average resource use compared to the statewide average; hues of yellow and orange indicate above average resource use. Florence County is unshaded, indicating that there are no PCPs imputed to patients in the WHIO data.

WHIO ATLAS OF HEALTH CARE IN WISCONSIN IN WISCONSIN
28
Specialty Care Resource Use Index by Imputed PCP Zip Code
Figure 11: Consistent with the previous regional and county shaded maps, this map is the most granular, grouped by the zip code of the imputed PCP’s practice location. Unshaded zip code areas are generally rural and indicate that there is no PCP in that zip code with an imputed WHIO patient population.

WHIO ATLAS OF HEALTH CARE IN WISCONSIN IN WISCONSIN
29
Hospital Services Resource Use Index by Imputed PCP Region
Figure 12: Hospital Services are a subset of the overall resources used by a patient population. The Hospital Services Resource Use Index is a risk-adjusted measure that compares actual Hospital Services rendered to a patient population in a region to the expected Hospital Services for the same mix of patients, determined by the statewide peer group average. The patient population is grouped by the region of their imputed PCP, and their resource use is risk-adjusted using a retrospective claims-based risk model. This chart and the corresponding shaded regions on the map indicate that the patients with imputed PCPs located in the Northeastern and Southeastern regions utilize above average hospital resources on a risk-adjusted basis compared to the populations in the other regions of the state. The bar chart graphically depicts the Hospital Services Resource Use Index where the value of 1.0 is the statewide average.

WHIO ATLAS OF HEALTH CARE IN WISCONSIN IN WISCONSIN
30
Hospital Services Resource Use Index by Imputed PCP County
Figure 13: This county map is a more granular depiction of the previous regional map, comparing the Hospital Services Resource Use Index for the patient population by the imputed PCP’s county of practice. The map uses gradient shading in hues of green, yellow, and orange, to indicate the Index values relative to the statewide average of 1.0. The data are grouped by the county of the imputed PCP of the patient population. Regions shaded in hues of green indicate below average resource use compared to the statewide average; hues of yellow and orange indicate above average resource use. Florence County is unshaded, indicating that there are no PCPs imputed to patients in the WHIO data.

WHIO ATLAS OF HEALTH CARE IN WISCONSIN IN WISCONSIN
31
Hospital Services Resource Use Index by Imputed PCP Zip Code
Figure 14: Consistent with the previous regional and county shaded maps, this map is the most granular, grouped by the zip code of the imputed PCP’s practice location. Unshaded zip code areas are generally rural and indicate that there is no PCP in that zip code with an imputed WHIO patient population.

WHIO ATLAS OF HEALTH CARE IN WISCONSIN IN WISCONSIN
32
Emergency Room Resource Use Index by Imputed PCP Region
Figure 15: Emergency Room Services are a subset of the overall resources used by a patient population. The Emergency Room Resource Use Index is a risk-adjusted measure that compares actual Emergency Room Services rendered to a patient population in a region, to the expected Emergency Room Services for the same mix of patients, determined by the statewide peer group average. The patient population is grouped by the region of their imputed PCP, and their resource use is risk-adjusted using a retrospective claims-based risk model. This chart and the corresponding shaded regions on the map indicate that the patients with imputed PCPs located in the Western, Northern, and Southeastern regions utilize above average emergency room resources on a risk-adjusted basis compared to the populations in the other regions of the state. The bar chart graphically depicts the Emergency Room Resource Use Index where the value of 1.0 is the statewide average.

WHIO ATLAS OF HEALTH CARE IN WISCONSIN IN WISCONSIN
33
Emergency Room Resource Use Index by Imputed PCP County
Figure 16: This county map is a more granular depiction of the previous regional map, comparing the Emergency Room Resource Use Index for the patient population by the imputed PCP’s county of practice. The map uses gradient shading in hues of green, yellow, and orange, to indicate the Index values relative to the statewide average of 1.0. The data are grouped by the county of the imputed PCP of the patient population. Regions shaded in hues of green indicate below average resource use compared to the statewide average; hues of yellow and orange indicate above average resource use. Florence County is unshaded, indicating that there are no PCPs imputed to patients in the WHIO data.

WHIO ATLAS OF HEALTH CARE IN WISCONSIN IN WISCONSIN
34
Emergency Room Resource Use Index by Imputed PCP Zip Code
Figure 17: Consistent with the previous regional and county shaded maps, this map is the most granular, grouped by the zip code of the imputed PCP’s practice location. Unshaded zip code areas are generally rural and indicate that there is no PCP in that zip code with an imputed WHIO patient population.

WHIO ATLAS OF HEALTH CARE IN WISCONSIN IN WISCONSIN
35
Laboratory Services Resource Use Index by Imputed PCP Region
Figure 18: Laboratory Services are a subset of the overall resources used by a patient population. The Laboratory Services Resource Use Index is a risk-adjusted measure that compares actual Laboratory Services rendered to a patient population in a region, to the expected Laboratory Services for the same mix of patients, determined by the statewide peer group average. The patient population is grouped by the region of their imputed PCP, and their resource use is risk-adjusted using a retrospective claims-based risk model. This chart and the corresponding shaded regions on the map indicate that the patients with imputed PCPs located in the Southeastern region utilize above average laboratory resources on a risk-adjusted basis compared to the populations in the other regions of the state. The bar chart graphically depicts the Laboratory Resource Use Index where the value of 1.0 is the statewide average.

WHIO ATLAS OF HEALTH CARE IN WISCONSIN IN WISCONSIN
36
Laboratory Services Resource Use Index by Imputed PCP County
Figure 19: This county map is a more granular depiction of the previous regional map, comparing the Laboratory Services Resource Use Index for the patient population by the imputed PCP’s county of practice. The map uses gradient shading in hues of green, yellow, and orange, to indicate the Index values relative to the statewide average of 1.0. The data are grouped by the county of the imputed PCP of the patient population. Regions shaded in hues of green indicate below average resource use compared to the statewide average; hues of yellow and orange indicate above average resource use. Florence County is unshaded, indicating that there are no PCPs imputed to patients in the WHIO data.

WHIO ATLAS OF HEALTH CARE IN WISCONSIN IN WISCONSIN
37
Laboratory Services Resource Use Index by Imputed PCP Zip Code
Figure 20: Consistent with the previous regional and county shaded maps, this map is the most granular, grouped by the zip code of the imputed PCP’s practice location. Unshaded zip code areas are generally rural and indicate that there is no PCP in that zip code with an imputed WHIO patient population.
WHIO ATLAS OF HEALTH CARE IN WISCONSIN IN WISCONSIN
38
Radiology Services Resource Use Index by Imputed PCP Region
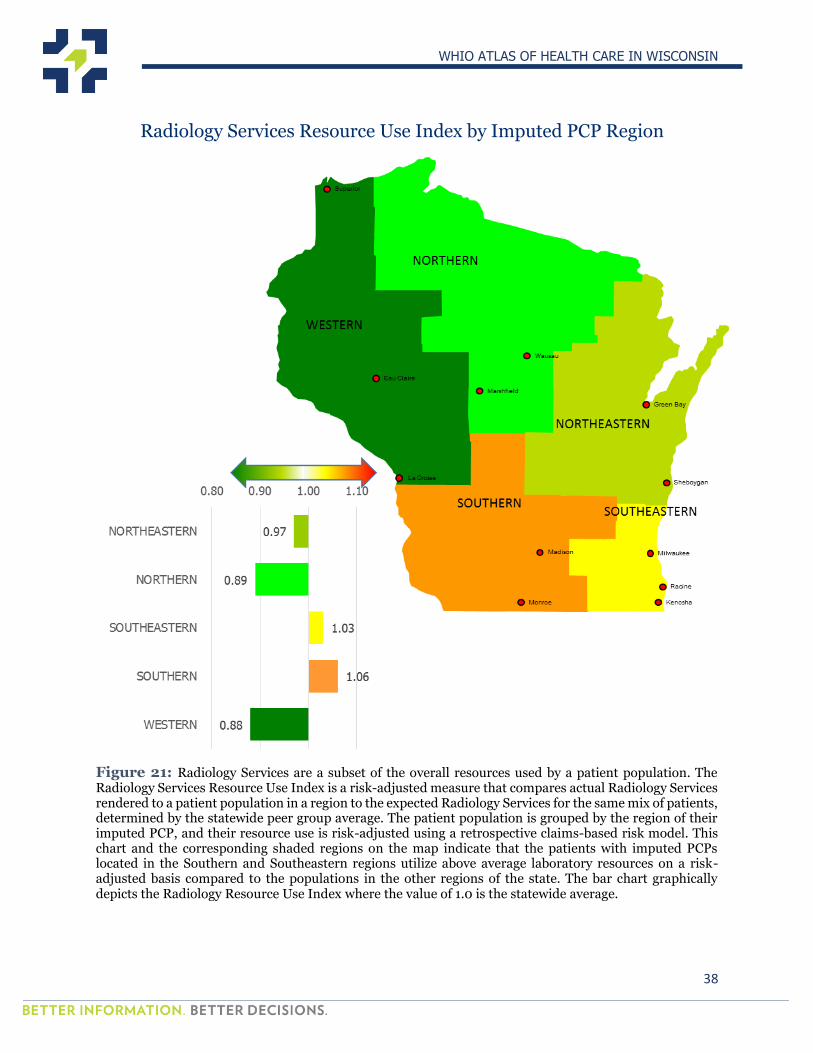
Figure 21: Radiology Services are a subset of the overall resources used by a patient population. The Radiology Services Resource Use Index is a risk-adjusted measure that compares actual Radiology Services rendered to a patient population in a region to the expected Radiology Services for the same mix of patients, determined by the statewide peer group average. The patient population is grouped by the region of their imputed PCP, and their resource use is risk-adjusted using a retrospective claims-based risk model. This chart and the corresponding shaded regions on the map indicate that the patients with imputed PCPs located in the Southern and Southeastern regions utilize above average laboratory resources on a risk-adjusted basis compared to the populations in the other regions of the state. The bar chart graphically depicts the Radiology Resource Use Index where the value of 1.0 is the statewide average.

WHIO ATLAS OF HEALTH CARE IN WISCONSIN IN WISCONSIN
39
Radiology Services Resource Use Index by Imputed PCP County
Figure 22: This county map is a more granular depiction of the previous regional map, comparing the Radiology Services Resource Use Index for the patient population by the imputed PCP’s county of practice. The map uses gradient shading in hues of green, yellow, and orange, to indicate the Index values relative to the statewide average of 1.0. The data are grouped by the county of the imputed PCP of the patient population. Regions shaded in hues of green indicate below average resource use compared to the statewide average; hues of yellow and orange indicate above average resource use. Florence County is unshaded, indicating that there are no PCPs imputed to patients in the WHIO data.

WHIO ATLAS OF HEALTH CARE IN WISCONSIN IN WISCONSIN
40
Radiology Services Resource Use Index by Imputed PCP Zip Code
Figure 23: Consistent with the previous regional and county shaded maps, this map is the most granular, grouped by the zip code of the imputed PCP’s practice location. Unshaded zip code areas are generally rural and indicate that there is no PCP in that zip code with an imputed WHIO patient population.

WHIO ATLAS OF HEALTH CARE IN WISCONSIN IN WISCONSIN
41
Northeastern Region Imputed PCPs Utilization Index by Service Category
Figure 24: These charts summarize utilization index measures by service category for the patient population treated by imputed PCPs located in the Northeastern Region. The measures are for the patient population for all health care services rendered by all providers, not just the imputed PCP. An index value greater than 1.0 indicates the population utilizes more of that particular type of service than the population average. The chart with yellow bars is a summary of the three imputed PCP peer groups. The chart on the right displays the same set of measures, but delineated by the respective primary care specialties.

WHIO ATLAS OF HEALTH CARE IN WISCONSIN IN WISCONSIN
42
Northeastern Region Imputed PCPs Risk-adjusted Resource Use PMPM
Figure 25: Risk-adjusted Resource Use is a measure that quantifies all services rendered to a patient population in the 12 month reporting period. This table summarizes the Risk-adjusted Resource Use PMPM Index, computed as the ratio of the Actual value to the Expected value for the peer group. The data are grouped by service category and county of imputed PCPs located in the Northeastern Region. Values shaded in hues of green indicate below average resource use compared to the statewide average; hues of red indicate above average resource use.

WHIO ATLAS OF HEALTH CARE IN WISCONSIN IN WISCONSIN
43
Northern Region Imputed PCPs Utilization Index by Service Category
Figure 26: These charts summarize utilization index measures by service category for the patient population treated by imputed PCPs located in the Northern Region. The measures are for the patient population for all health care services rendered by all providers, not just the imputed PCP. An index value greater than 1.0 indicates the population utilizes more of that particular type of service than the population average. The chart with yellow bars is a summary of the three imputed PCP peer groups. The chart on the right displays the same set of measures, but delineated by the respective primary care specialties.

WHIO ATLAS OF HEALTH CARE IN WISCONSIN IN WISCONSIN
44
Northern Region Imputed PCPs Risk-adjusted Resource Use PMPM
Figure 27: Risk-adjusted Resource Use is a measure that quantifies all services rendered to a patient population in the 12 month reporting period. This table summarizes the Risk-adjusted Resource Use PMPM Index, computed as the ratio of the Actual value to the Expected value for the peer group. The data are grouped by service category and county of imputed PCPs located in the Northern Region. Values shaded in hues of green indicate below average resource use compared to the statewide average; hues of red indicate above average resource use.

WHIO ATLAS OF HEALTH CARE IN WISCONSIN IN WISCONSIN
45
Southeastern Region Imputed PCPs Utilization Index by Service Category
Figure 28: These charts summarize utilization index measures by service category for the patient population treated by imputed PCPs located in the Southeastern Region. The measures are for the patient population for all health care services rendered by all providers, not just the imputed PCP. An index value greater than 1.0 indicates the population utilizes more of that particular type of service than the population average. The chart with yellow bars is a summary of the three imputed PCP peer groups. The chart on the right displays the same set of measures, but delineated by the respective primary care specialties.

WHIO ATLAS OF HEALTH CARE IN WISCONSIN IN WISCONSIN
46
Southeastern Region Imputed PCPs Risk-adjusted Resource Use PMPM
Figure 29: Risk-adjusted Resource Use is a measure that quantifies all services rendered to a patient population in the 12 month reporting period. This table summarizes the Risk-adjusted Resource Use PMPM Index, computed as the ratio of the Actual value to the Expected value for the peer group. The data are grouped by service category and county of imputed PCPs located in the Southeastern Region. Values shaded in hues of green indicate below average resource use compared to the statewide average; hues of red indicate above average resource use.

WHIO ATLAS OF HEALTH CARE IN WISCONSIN IN WISCONSIN
47
Southern Region Imputed PCPs Utilization Index by Service Category
Figure 30: These charts summarize utilization index measures by service category for the patient population treated by imputed PCPs located in the Southern Region. The measures are for the patient population for all health care services rendered by all providers, not just the imputed PCP. An index value greater than 1.0 indicates the population utilizes more of that particular type of service than the population average. The chart with yellow bars is a summary of the three imputed PCP peer groups. The chart on the right displays the same set of measures, but delineated by the respective primary care specialties.

WHIO ATLAS OF HEALTH CARE IN WISCONSIN IN WISCONSIN
48
Southern Region Imputed PCPs Risk-adjusted Resource Use PMPM
Figure 31: Risk-adjusted Resource Use is a measure that quantifies all services rendered to a patient population in the 12 month reporting period. This table summarizes the Risk-adjusted Resource Use PMPM Index, computed as the ratio of the Actual value to the Expected value for the peer group. The data are grouped by service category and county of imputed PCPs located in the Southern Region. Values shaded in hues of green indicate below average resource use compared to the statewide average; hues of red indicate above average resource use.

WHIO ATLAS OF HEALTH CARE IN WISCONSIN IN WISCONSIN
49
Western Region Imputed PCPs Utilization Index by Service Category
Figure 32: These charts summarize utilization index measures by service category for the patient population treated by imputed PCPs located in the Western Region. The measures are for the patient population for all health care services rendered by all providers, not just the imputed PCP. An index value greater than 1.0 indicates the population utilizes more of that particular type of service than the population average. The chart with yellow bars is a summary of the three imputed PCP peer groups. The chart on the right displays the same set of measures, but delineated by the respective primary care specialties.

WHIO ATLAS OF HEALTH CARE IN WISCONSIN IN WISCONSIN
50
Western Region Imputed PCPs Risk-adjusted Resource Use PMPM
Figure 33: Risk-adjusted Resource Use is a measure that quantifies all services rendered to a patient population in the 12 month reporting period. This table summarizes the Risk-adjusted Resource Use PMPM Index, computed as the ratio of the Actual value to the Expected value for the peer group. The data are grouped by service category and county of imputed PCPs located in the Western Region. Values shaded in hues of green indicate below average resource use compared to the statewide average; hues of red indicate above average resource use.

Copyright © 2015 Wisconsin Health Information Organization All rights reserved.
WHIO ATLAS OF HEALTH CARE IN WISCONSIN IN WISCONSIN
Direct questions and comments to:[email protected]

isconsinhealth nfo.org | 330 East Lakeside Street Madison, WI 53715 | 608 442-3876March 2015
WHIO
wisconsinhealthinfo.org | 330 East Lakeside Street, Madison, WI 53715 | 608 442-3876
Atlas of Health Carein Wisconsin