atmospheric aerosol properties over the equatorial indian ...atmospheric aerosol properties over the...
TRANSCRIPT

Atmospheric aerosol properties over the equatorial Indian Oceanand the impact of the Madden-Julian Oscillation
H. Langley DeWitt,1,2 Derek J. Coffman,1 Kristen J. Schulz,1 W. Alan Brewer,3
Timothy S. Bates,1 and Patricia K. Quinn1
Received 15 October 2012; revised 15 April 2013; accepted 16 April 2013; published 3 June 2013.
[1] The chemical, physical, and optical properties of sub- and supermicrometer aerosolsover the equatorial Indian Ocean were measured on board the R/V Revelle during thefall 2011 Dynamics of the Madden-Julian Oscillation field campaign. During this time,both the retreating of the Asian monsoon and two Madden-Julian Oscillation (MJO)events were observed. The R/V Revelle was on station (0.1!N and 80.5!E) to measureatmospheric and oceanic conditions between 4 October and 30 October 2011 (Leg 2)and 11 November and 4 December 2011 (Leg 3). Throughout the campaign,background marine atmospheric conditions were usually observed. As the Asianmonsoon season retreated over the boreal fall and the general wind direction changedfrom southerly to northerly transporting, respectively, clean marine and pollutedcontinental air masses, the average submicrometer aerosol mass nearly doubled fromLeg 2 to Leg 3 and the aerosol appeared to be more influenced by continental sources.The effect of MJO-associated convection anomalies on aerosols in the remote marineboundary layer (MBL) was measured during November when a complete MJOconvection wave moved over the equatorial Indian Ocean and during October when apartial MJO event was observed. MJO-associated convection strongly affected the localaerosol as increased vertical mixing introduced new particles into the MBL, rainoutcleared the atmosphere of submicrometer aerosol particles, and high winds enhancedthe concentration of sea salt aerosol particles in the local atmosphere. Four stages ofMJO-affected aerosol population changes in the remote Indian Ocean are defined.
Citation: Langley DeWitt, H., D. J. Coffman, K. J. Schulz, W. Alan Brewer, T. S. Bates, and P. K. Quinn (2013),Atmospheric aerosol properties over the equatorial Indian Ocean and the impact of the Madden-Julian Oscillation,J. Geophys. Res. Atmos., 118, 5736–5749, doi:10.1002/jgrd.50419.
1. Introduction
[2] The Madden-Julian Oscillation (MJO) [Lau andWaliser, 2012; Madden and Julian, 1972; Zhang, 2005] isone of the largest source of sub-seasonal weather variabilityin the tropics and has been linked to large-scale weather andclimate phenomena such as the El Nino Southern Oscillation[Kessler and McPhaden, 1995], variability in the strength ofthe monsoon season in Asia and Africa [Annamalai andSlingo, 2001], and the formation and propagation of tropical
cyclones [Liebmann et al., 2004]. Predictability of theinitiation and propagation of the MJO in the equatorialIndian Ocean, and thus its effects on local and global scaleweather patterns, is currently quite low. To increase scien-tific understanding of the oceanic and atmospheric pro-cesses governing the MJO initiation, the Dynamics of theMadden-Julian Oscillation (DYNAMO) field campaigntook place in conjunction with the international Coopera-tive Indian Ocean Experiment on Intraseasonal Variabilityin the equatorial Indian Ocean during the boreal fall andwinter of 2011/2012 [Yoneyama et al., 2013]. Two groundsites (Gan and Diego Garcia) and two shipboard sites(the R/V Revelle and the R/V Mirai) were active during anintense measurement period from late September to mid-December. In addition, measurements were made at buoysand atmospheric sounding sites throughout the boreal falland winter of 2011/2012. The R/V Revelle was stationed atapproximately 0.1!N and 80.5!E and carried on board a suiteof instruments designed to characterize the composition of theatmosphere and ocean from 200m above to 200m below theocean’s surface. A subset of these measurements was focusedon the characterization of the physical, chemical, and opticalproperties of aerosols in the remote equatorial Indian Ocean.
1Pacific Marine Environmental Laboratory, NOAA, Seattle, Washington,USA.
2Aix Marseille Univ., Laboratoire Chemie Environnement (LCE),Equipe Instrumentation et Réactivité Atmosphérique (IRAA), Marseille,France.
3Earth System Research Laboratory, NOAA, Boulder, Colorado, USA.
Corresponding author: H. Langley DeWitt, Aix Marseille Univ.,Laboratoire Chemie Environnement (LCE), Equipe Instrumentationet Réactivité Atmosphérique (IRAA), 13 331 Marseille, France.([email protected]; [email protected])
©2013. American Geophysical Union. All Rights Reserved.2169-897X/13/10.1002/jgrd.50419
5736
JOURNAL OF GEOPHYSICAL RESEARCH: ATMOSPHERES, VOL. 118, 5736–5749, doi:10.1002/jgrd.50419, 2013

[3] Aerosols can perturb the earth’s radiation balancedirectly through the scattering (e.g., by sea salt) and absorp-tion (e.g., by soot) of incoming solar radiation and indirectlythrough aerosol-cloud interactions that can change themicrophysical properties, lifetime, and extent of clouds.The sources of aerosol in a given region affect the chemical,physical, and optical properties of the aerosol, the total aero-sol concentration, and its climate forcing capability andinfluence on local weather patterns. In the equatorial IndianOcean, southerly winds bring background marine air andnortherly winds bring continental air from Asia. The typi-cally low biological primary productivity in the IndianOcean [Dasgupta et al., 2009] and low-wind speeds overthe equator reduce the influence of biogenic emissions andprimary marine emissions on aerosol properties. During thefall season, the wind direction over the Indian Oceanchanges from primarily southerly to primarily northerly asthe Asian summer monsoon retreats. Large differences inthe properties of aerosol from the northern hemisphere(NH) versus the southern hemisphere (SH) have beenobserved, with higher submicrometer mass concentrationand absorption observed in NH aerosol [Quinn et al.,2002; Ramanathan et al., 2001; Spencer et al., 2008].[4] An MJO event is characterized by a period of
enhanced convection preceded and followed by periods ofsuppressed convection. Anomalous low level easterly(preceding) and westerly (following) winds flank theenhanced convection of the MJO, combined with anoverturning of the troposphere [Zhang, 2005]. These chang-ing wind directions introduce new aerosol mass to the equa-torial ocean, and air masses from the upper atmosphere aremixed down into the MBL as the troposphere overturns.Increased wind speeds, often in the form of a westerly windburst, are common during and following the enhanced MJOconvection [Zhang, 2005]. High winds are associated withincreases in primary marine aerosol, thus the enhanced con-vection from an MJO event may introduce more sea sprayaerosol mass to the atmosphere. The suppressed convectionperiods, with low-wind speeds and dry conditions, couldaffect aerosol concentration in the opposite way such thatprimary marine aerosol would be reduced due to low windsand calm ocean conditions. However, secondary marine andtransported continental aerosol could build up in the atmo-sphere during the suppressed phase due to dry conditionsand subsequently reduced rainout rates. The MJO is moreactive during boreal winter when the Australian monsoonis active [Zhang, 2005]. During this time, continental aerosolconcentrations are also greatest over the equatorial ocean. Asthe MJO could affect the aerosol population in the MBL, theaerosol’s direct and indirect effects on the local cloud andradiative budget could also affect the MJO convection.[5] Previous work has analyzed aerosol, carbon dioxide,
and ozone (O3) data from satellite observations to determinethe effect of enhanced convection (as indicated by rainfall)associated with an MJO event on aerosol and gas concentra-tions [Li et al., 2010; Tian and Waliser, 2012; Tian et al.,2007; Tian et al., 2008]. Convection associated with theMJO (i.e., vertical motions in the atmosphere, rainfall) wasfound to affect the concentrations of these species in theremote marine atmosphere [Li et al., 2010; Tian et al.,2007, 2008]. The Aerosol Index (AI) calculated fromthe Total Ozone Mapping Spectrometer (TOMS), which
measures the concentration of ultraviolet absorbing aerosols(e.g., smoke, dust, and ash), was found to have negativeanomalies at times when the rainfall in the area was foundto have positive anomalies. In other words, increased rainfallled to decreased absorbing aerosol in the atmosphere, likelythrough wet deposition, although possibly due to a samplingartifact in the TOMS AI data [Tian et al., 2008]. ModerateResolution Imaging Spectroradiometer (MODIS) data wereused to study the relation of MJO phase and fire count in themaritime continent of Malaysia and Indonesia where biomassburning provides a large source of submicrometer aerosol[Reid et al., 2012]. The authors found that while the activephase of the MJO was over the Indian Ocean fires weresuppressed, which would also decrease the concentration ofabsorbing aerosols in the Indian Ocean [Reid et al., 2012]. Incontrast, the Aerosol Optical Thickness (AOT) derived fromthe MODIS, which measures both absorbing and non-absorbing aerosols, was found to have a positive anomalyweakly correlated to positive rainfall anomalies [Tian et al.,2008]. An increase in sea salt aerosol concentrations due toincreased wind speeds concurrent with the enhanced MJOrainfall may be one cause of this observation [Tian et al.,2008]. Cloud contamination in the satellite signal and animperfect cloud retrieval algorithm is also discussed as anotherreason for this correlation between rainfall and increased AOT[Tian et al., 2008]. In situ measurements of the aerosolresponse to MJO convection are essential to increase scientificunderstanding of the feedback between the MJO and aerosol.[6] Here, we discuss the in situ aerosol measurements
made on board the R/V Revelle throughout the shoulder sea-son (September through October) and beginning of the dryseason (November onwards) of the Asian monsoon overthe equatorial Indian Ocean. This data set represents the firstin situ measurements of the effect of MJO-related convec-tion on aerosol properties in the remote Indian Ocean. Wespecifically focus on the changing aerosol population asthe Asian monsoon retreats and on the aerosol response toa fully observed MJO event in late November. By examin-ing the effect of intraseasonal (MJO events) and seasonal(the Asian monsoon) convection on aerosols, we hope tounderstand the feedback between routinely occurringclimatological events and aerosol concentration in theremote Indian Ocean. The implications of these observationsare discussed.
2. Measurements
[7] Aerosol measurements onboard the R/V Revelle dur-ing DYNAMO included real-time (5min. time resolution)and filter-based (12 to 24 h time resolution) analyses of aero-sol chemical composition, size, concentration, and opticalproperties. Aerosol measurements were made at 60% rela-tive humidity (RH).
2.1. Aerosol Inlet[8] An aerosol inlet 18m above the surface of the ocean on
the forward deck of the R/V Revelle was used to samplesub- (<1.1mm in aerodynamic diameter at 60% RH) andsupermicrometer (>1.1mm in aerodynamic diameter at 60%RH) aerosol particles for both filter-based and real-timeanalysis. This inlet has been described in greater detailelsewhere [Bates et al., 2005, 2008; Quinn et al., 2008].
DEWITT ET AL.: AEROSOLS AND THE MJO
5737

Briefly, flow was maintained at 1m3min"1, and the mastwas heated at the bottom 1.5m to maintain the RH ofaerosols at 60# 5%. The inlet has greater than 95% trans-mission efficiency for particles less than 6.5mm based onwind tunnel tests [Bates et al., 2002]. To prevent contam-ination from the ship’s stack, an anemometer and computercontrol were used to automatically shut off flow throughthe impactors in the case of wind from the aft of the ship(relative wind direction of #100! off the bow) or windspeed below 0.5m s"1. In addition, the mast was automatedto turn into the wind to maintain pseudo iso-kinetic flow tominimize particle losses. Particle number concentrationsand relative wind direction were used to remove samplingperiods from the real-time data that appeared to be contami-nated by the ship’s exhaust.
2.2. Impactor Measurements[9] Two and seven stage multi-jet cascade impactors
[Berner et al., 1979] with sampling times of 12–24 h wereused to determine sub- and supermicrometer concentrationsof aerosol mass, inorganic ions (chloride (Cl"), nitrate(NO3
"), sulfate (SO4"2), methanesulfonate (MSA"), bromide
(Br"), oxalate (C2O4"2), sodium (Na+), ammonium (NH4
+),potassium (K+), magnesium (Mg+2), calcium (Ca+2)), andtotal carbon (TC). Specific details on the impactor methodsand filters used are described in Bates et al. [2005].Inorganic ion concentrations were measured using ion chro-matography (IC) [Quinn and Coffman, 1998]. TC concentra-tion was measured using a Sunset Laboratories OC/ECthermal/optical analyzer instrument. Elemental carbon (EC)was close to blank levels for the samples collected, thusorganic carbon (OC) and EC are reported together hereas TC. The thermal program was the same as that used inprevious field campaigns [Bates et al., 2012].[10] A two-stage multi-jet cascade impactor sampling
at 60% RH was used to determine the sub-1.1 mm and1.1–10 mm diameter aerosol mass. Millipore Fluoroporefilms and Teflo filters were used in the impactor. Films werecleaned in an ultrasonic bath in 10% H2O2 for 30min, rinsedin distilled, deionized water, and dried in an NH3
" andSO2-free glove box. Films and filters were weighed backin the laboratory with a Cahn Model 29 and Sartorius modelSE2 balance, respectively. The balances are housed in aglove box kept at a humidity of 65# 4%. The resulting massconcentrations from the gravimetric analysis include thewater mass that is associated with the aerosol at 65% RH.[11] The glove box was continually purged with room air
that had passed through a scrubber of activated charcoal,potassium carbonate, and citric acid to remove gas phaseorganics, acids, and ammonia. Static charging, which canresult in balance instabilities, was minimized by coatingthe walls of the glove box with a static dissipative polymer(Tech Spray, Inc.), placing an anti-static mat on the glovebox floor, using anti-static gloves while handling thesubstrates, and exposing the substrates to a 210Po sourceto dissipate any charge that had built up on the substrates.Before and after sample collection, substrates were storeddouble-bagged with the outer bag containing citric acid toprevent absorption of gas phase ammonia. More details ofthe weighing procedure can be found in previous papers[Quinn and Coffman, 1998].
2.3. Aerosol Mass Spectrometry[12] An Aerodyne Quadrupole Aerosol Mass Spectrometer
(Q-AMS) was used to measure the chemical composition ofsubmicrometer non-refractory aerosol particles [Canagaratnaet al., 2007] in real-time. Sample air was drawn from the inlet(section 2.1), through an impactor with a jet plate having a50% aerodynamic cut-off diameter of 1.1mm, through temper-ature controlled (23!C) stainless steel tubing and then into theAerodyne aerodynamic lens. The aerodynamic lens hasan approximate 100% transmission efficiency for particles70–500 nm in diameter. For particles with vacuum aerody-namic diameters between 30 to 70 nm and 500 nm to 1.0mm,transmission efficiencies decrease from 100% to 50% [Bateset al., 2008; Canagaratna et al., 2007]. Gaseous species arepumped away upon entering the instrument measurementchamber. A rotating chopper is used to set start times for aero-dynamic sizing from particle flight time in the time of flight(ToF) chamber and to block aerosol flow to measure theinstrument background. Particles exiting the ToF chamberare vaporized at approximately 600!C, ionized at 70 eV usingelectron ionization, and analyzed using a quadrupole massspectrometer. Measured species include organics, SO4
"2,NO3
", and NH4+. Five-minute averages of the aerosol mass
spectrum (in terms of mass-to-charge ratios m/z) werecollected. Limits of detection were calculated using themethod described by Bates et al. [2008] and DeCarloet al. [2006] and were found to be 0.31mgm"3 for organics,0.25mgm"3 for NH4
+, 0.02mgm"3 for NO3", and 0.04mgm"3
for SO4"2. The collection efficiency was calculated to be 1.0
for data collected from 1 October to 29 November and0.75 for data collected from 29 November onward. The collec-tion efficiency was calculated by comparing concentrations ofSO4
"2 measured by the AMS to those derived from theimpactor/IC measurements.
2.4. Aerosol Size and Optical Property Measurements[13] Aerosol size distributions from 0.02 to 10 mm geo-
metric diameter were measured using three different instru-ments at 60% RH including an ultrafine differentialmobility particle sizer (from 3 to 26 nm), a differential mo-bility particle sizer (from 20 to 671 nm), and an aerodynamicparticle sizer (APS, from 0.542 to 20 mm). APS diameterswere originally measured in aerodynamic diameters andconverted to geometric diameters. Exact specifications aredescribed by Bates et al. [2005]. Distributions were sampledevery 15min.[14] Sub-10 (aerosols with geometric diameters <10 mm)
and submicrometer aerosol scattering coefficients were mea-sured at 60% RH with two integrating nephelometers(Model 3563, TSI, Inc.) at three wavelengths (450, 550,and 700 nm). Scattering coefficients were corrected for anyoffset using filtered air and also for instrument error andnon-ideality [Anderson and Ogren, 1998]. The sub-10micrometer aerosol scattering coefficient measurement errorvaried from #3.8Mm"1 for the maximum measured scatter-ing coefficient of 450Mm"1 to 0.7Mm"1 for the minimummeasured scattering coefficient of 12Mm"1.[15] A separate humidity controlled system measured
submicrometer light scattering at low and high humiditywith two TSI integrating three-wavelength nephelometersoperated in series downstream of a Berner impactor. The
DEWITT ET AL.: AEROSOLS AND THE MJO
5738

60% RH conditioned aerosol from the inlet was dried to25% RH using a PermaPure, multiple-tube Nafion dryermodel PR-94. The first nephelometer measured scatteringof the 25% RH aerosol. Downstream of this nephelometer,a humidifier was used to add water vapor to the sample flow(six microporous Teflon tubes surrounded by a heatablewater-jacket). The sample was conditioned to approximately85% RH, and the scattering of these humidified particles wasmeasured by the second TSI nephelometer. Humidity wasmeasured with a chilled mirror dew point hygrometer down-stream of the second nephelometer. The slope of a regres-sion between the high and low RH scattering coefficientswas used to scale scattering measurements made at 60%RH to aerosol scattering at ambient RH.[16] Sub-10- and submicrometer aerosol absorption coeffi-
cients were measured using two particle soot absorptionphotometers at three wavelengths (467, 530, and 660 nm).Error varied from #0.4Mm"1 for an absorption measure-ment of 4.6Mm"1 to# 0.08 for absorption measurements<0.1Mm"1.[17] A handheld Microtops sunphotometer (Solar Light
Co.) with five channels (380, 440, 500, 675, and 870 nm)was used to derive AOT. The raw Microtops data wereprocessed and used to calculate AOT by the NASAMaritime Aerosol Network in conjunction with the AerosolRobotic Network [Smirnov et al., 2009]. Data were onlycollected during days when there were no visible clouds inthe path between the ship location and the sun.
2.5. Additional Measurements[18] Radon (an indicator of air masses recently over land)
and ozone (O3), an indicator of air masses mixed down fromthe upper atmosphere, were also measured on the ship. Airwas sampled from 18m above sea level down the 20 cminner diameter (ID) powder coated aluminum aerosol sam-pling mast (6m) at approximately 1m3min"1. At the baseof the sampling mast, a 1 Lmin"1 flow was pulled througha 0.32 cm ID, 2m long Teflon tube into a Thermo Environ-mental Instruments Model 49c ozone analyzer. The datahave been filtered to remove zero-air periods and periodsof obvious ship contamination from the R/V Revelle. Radongas was measured using a dual flow loop, two-filter radon
detector [Whittlestone and Zahorowski, 1998]. The sampleflow rate into and out of the tank was typically 70 Lmin"1.The response time of the radon instrument is limited to about30min by the radiological decay time constants of the radondaughters on the wire screen filter. The instrument was cali-brated with a known radon source in Seattle on 7 June 2011.[19] NOAA’s High Resolution Doppler Lidar (HRDL)
provided profiles of the horizontal wind speed, aerosol back-scatter intensity, and vertical velocity variance within theMBL every 20min throughout Legs 1–3 of the campaign.HRDL utilizes a motion-stabilized hemispheric scanner toorient the beam in the atmosphere, and a high-repetition-rate, solid state laser operating at a 2.02 mm wavelengthprovides 30m range resolved measurements of the line-of-sight wind speed and aerosol backscatter intensity twice asecond [Grund et al., 2001; Tucker et al., 2009]. Aerosolbackscatter intensity measurements were most sensitive tosupermicrometer aerosols due to the wavelength of the laser[Grund et al., 2001][20] Meteorological data (wind speed, stress and direction,
temperature, and precipitation rate) and oceanographic(significant wave height) were also collected. Seven-dayback trajectories from the Hybrid Single Particle LagrangianIntegrated Trajectory Model (HYSPLIT, NOAA) were runfor three arrival heights—200, 1000, and 3000m—at 24 hincrements to determine the approximate source, transportpath, and age of aerosols measured at the ship site.
3. Experimental Conditions
3.1. Convection Over the DYNAMO Experiment asMeasured Onboard the R/V Revelle[21] We show the changing vertical velocity variance
(column averaged over three altitude ranges), precipitation,O3, radon, wind direction, and wind stress in Figure 1 forthe entire October–December sampling period. Notedare the two Madden-Julian Oscillation events, MJO1(enhanced convection beginning on 30 October) and MJO2(enhanced convection beginning on 24 November)[Yoneyama et al., 2013]. Detailed descriptions of MJO-related convection as observed during DYNAMO arebeyond the scope of our measurements and will be analyzed
Figure 1. (a) Wind stress (Nm"2) (left axis), Wind direction (right axis in Figure 1a), (b) Vertical VelocityVariance, (c) Ozone (O3) (left axis), Radon, mBqm"3 (right axis in Figure 1c), and (d) Precipitation(mmday"1).
DEWITT ET AL.: AEROSOLS AND THE MJO
5739

by other research groups and reported in the future. TheMJO index [Wheeler and Hendon, 2004] reported byYoneyama et al. [2013] for the entirety of DYNAMOobservations shows that clear anomalies of outgoinglongwave radiation and zonal winds characteristic of MJO-related convection were observed over the Indian Oceanduring the month of November.[22] At the ship location, rainfall and high wind stress
observed shipboard on 24 November flanked on either sideby periods of low wind and dry conditions, indicate thatthe full MJO cycle was observed by instruments onboardthe R/V Revelle. Increases in precipitation for MJO1 andMJO2 are clearly visible in Figure 1. While the wind stressincreased for MJO1, the magnitude of the wind stressincrease was less for MJO1 than for MJO2. The verticalvelocity variance, a good indicator of local mixing andvertical transport, also increased during the periodsbefore and during MJO enhanced convection. The combina-tion of increased vertical velocity variance along withincreased O3 indicates that there was more downwardmotion in the lower atmosphere just prior to and during theMJO convection.
3.2. Changing Aerosol Transport Direction as theAsian Summer Monsoon Retreats[23] MODIS-derived AOT from the Aqua satellite for the
months of October and November (2011) is shown for theIndian Ocean in Figure 2. The dark areas south of the equa-tor are due to cloud coverage related to the intertropical con-vergence zone [Yoneyama et al., 2013]. For both Octoberand November, AOT values ranged from around 0.16(mid-ocean) to 0.5 (Indian subcontinent). However, thedirection of the calculated air mass back trajectories, alsoshown in Figure 2, reversed from primarily southerly to pri-marily northerly as the boreal fall progressed and the Asianmonsoon retreated. The change from southerly to northerlyflow resulted in an increase in the transport of continentaland anthropogenic aerosol from India and Sri Lanka to theequatorial Indian Ocean.
4. Aerosols Over the Indian Ocean
4.1. Aerosol Properties During Monsoon Reversal[24] Due to the change in wind direction over the Indian
Ocean from southerly to northerly that accompanied the on-set of the dry season, continental aerosol was observed morefrequently in the later months of the DYNAMO researchproject. Figure 3 shows the time series concentration ofSO4
"2, organics, and NH4+ for both Leg 2 and Leg 3. Also
shown are impactor measurements of MSA", K+, andradon as well as the gravimetric mass concentration ofsupermicrometer aerosol. As the Asian monsoon retreatedover October and November, note the increase in periodsof enhanced radon and enhanced submicrometer particles(Figure 3). The average submicrometer aerosol mass con-centration almost doubled from Leg 2 to Leg 3 (increasingfrom 1.8# 1.1 mgm"3 to 3.3# 2.2 mgm"3). For both legs,the submicrometer aerosol was primarily SO4
"2 in composi-tion. On average, the molar ratio of NH4
+ to SO4"2 was
around one throughout the field campaign (0.98# 0.18 forLeg 2, 0.93# 0.14 for Leg 3). As the submicrometer aerosolconcentration increased, the AOT (500 nm) measuredaboard the ship nearly doubled from Leg 2 to Leg 3(0.07# 0.02 to 0.13# 0.05). Note that the averagesupermicrometer aerosol mass remained approximately thesame, increasing slightly from an on-station average of7.8# 4.5 (Leg 2) to 9.3# 8.4 mgm"3 (Leg 3), and was pri-marily sea salt in composition. The largest concentrationsof supermicrometer aerosol were observed during enhancedconvection associated with MJO1 and MJO2. The overallrise in submicrometer aerosol mass and AOT over the mea-surement period is likely due to the increase in anthropo-genic aerosol over the Indian Ocean in the boreal winter.
4.2. Investigation of Specific Aerosol Sources to theMBL: Marine and Continental[25] Aerosol particles can be introduced to the remote
MBL through a variety of sources [Quinn and Bates,2011], including long-range transport from continentalregions, primary ocean-derived sea spray aerosol formed
Figure 2. HYSPLIT 7 day calculated air mass backtrajectories at an arrival height at the ship of 200mfor Leg 2 (Figure 2, left; 4 October–30 October) and Leg 3 (Figure 2, right; 11 November–4 December).Day of the month indicated by color (see rainbow color scale). Trajectories are overlaid on the averageaerosol optical thickness from MODIS Aqua Satellite data for October (Figure 2, left) and November(Figure 2, right).
DEWITT ET AL.: AEROSOLS AND THE MJO
5740

through wind-driven bubble bursting at the ocean surface[de Leeuw et al., 2011; O’Dowd et al., 2008], and the mixingdown of particles formed in the free troposphere [Clarkeet al., 1998b]. Once in the remote MBL, aerosol particlesbecome further processed by gas to particle conversion,heterogeneous reactions, photochemical aging, and cloudprocessing. The result is a mixture of aerosol particles fromdifferent sources modified both chemically and physicallysince emission. Wind speed and direction, vertical mixing,and precipitation all affect aerosol formation, lifetime, andtransport in the remote marine environment. Here we discussthe specific types and sources of aerosol observed duringOctober, November, and December 2011 on the equatorialIndian Ocean and show example mass spectra of eachaerosol type.[26] Although SO4
"2 dominated the submicrometer aerosolmass throughout the observation period, distinct aerosolevents stood out from the marine background aerosol signal(defined by a threshold of approximately 1mgm"3 ofsubmicrometer aerosol mass (Figure 3)). The Q-AMS massspectra, normalized to the highest mass peak, of four uniquetypes of aerosol are shown in Figure 4. Sources of MBLaerosol during DYNAMO were investigated by assessingconcentrations of inorganic ions, Q-AMS mass spectra, O3,and radon (Figure 3). Specific aerosol types observed were:Primary marine aerosol measured during a period of highwinds on 24 November (Figure 4a); a period of continentalaerosol associated with easterly flow and a slight rise inradon on 17October (Figure 4b); aerosol that was mixed downfrom the upper atmosphere to the MBL (here on 15 October),indicated by a period of enhanced O3 and high verticalvelocity variance as measured by the HRDL (Figure 4c); andaerosol measured during enhanced secondary marine particleproduction, indicated by an elevated peak in MSA concentra-tion (here on 11 October) (Figure 4d). Each of these aerosoltypes had significant concentrations of SO4
"2 (1.5–4mgm"3)and organic aerosol (0.4–1mgm"3).[27] For both the high MSA period (11 October) and the
continental period (17 October), the COO+ peak (m/z 44),an indicator of aged/oxidized organic aerosol [Zhang et al.,
2005a], contributed the most mass to the organic fractionof the aerosol. During the high MSA" period on 11 October,hydrocarbon-like aerosol fragments also were observed,possibly from primary sea spray emissions [Ovadnevaiteet al., 2011]. Additionally, m/z 79, which has been associatedwith a fragment of MSA" (CH3SO2
") in aerosol measuredover the ocean [Zorn et al., 2008], was observed in the averagemass spectrum during this time period.[28] During the continental aerosol period (17 October),
the 39/41m/z peaks were significantly higher than duringthe other aerosol events. These peaks are most likely K+ asthe ratio of these two peaks in the averaged mass spectra isvery close to the K39/K41 isotopic ratio. In the 15 October
Figure 4. Normalized Quardupole Aerosol Mass Spectrom-eter spectra of four distinct aerosol events during (a) primarymarine aerosol from a high wind event, (b) continental aerosolfrom easterly flow, (c) downward transport of aerosol to themarine boundary layer, and (d) aerosol from a high methylsulfonic acid (MSA") period. The spectra have been normal-ized to the highest peak in the 20–100m/z range to show eachspectrum on the same scale. Filtered blank air has beensubtracted from the mass spectra, as has the gas signal.
Figure 3. (a) Radon, (b) impactor measurements of submicrometer non-sea salt potassium (K+) andmethylsulfonic acid (MSA–) (b), (c) gravimetric submicrometer and supermicrometer aerosol mass concentra-tion, (d) and non-refractory (NR) submicrometer concentrations of sulfate (SO4
"2), organic, ammonia(NH4
+), and nitrate (NO3") aerosol from Quadrupole Aerosol Mass Spectrometry measurements.
DEWITT ET AL.: AEROSOLS AND THE MJO
5741

spectrum, the aerosols mixed down from the free tropo-sphere were primarily composed of acidic sulfate. This find-ing agrees with previously reported results from bothmeasurement and modeling studies [Clarke et al., 1998b]of the nucleation of new particles from water vapor andH2SO4 in the free troposphere. Both anthropogenic sourcesand marine sources (such as the photooxidation of dimethylsulfide (DMS) emitted from ocean biota) can introduceH2SO4 to the marine atmosphere [Andreae et al., 1983].[29] Aged continental and secondary marine aerosol were
characterized by the presence of oxidized organic species inthe mass spectra. These oxidized organic aerosols were mostlikely the photolysis end product of a multitude of morehydrocarbon-like primary emissions [Jimenez et al., 2009;Quinn et al., 2006; Q Zhang et al., 2005b] and were eithermixed down from the free troposphere into the MBL ortransported in the MBL to the ship location. Both continentaland marine aerosol could be mixed down from the upper at-mosphere and this aerosol could also be a combination ofmarine and continental aerosol. For example, aged continen-tal aerosol that was mixed down from the free troposphere tothe MBL on 22–23 November 2011 had a lower NH4
+ toSO4
"2 molar ratio than continental aerosol transported inthe MBL (0.79# 0.03 versus 1.00# 0.16). The lower NH4
+
to SO4"2 molar ratio associated with aerosol from the free
troposphere most likely is a result of the nucleation of newparticles involving H2SO4 from both marine and continentalsources and a lack of sources of NH3 [Clarke et al., 1998a;Clarke et al., 1998b; Hegg et al., 1990; Zorn et al., 2008].[30] Aerosol sampled during a period of high winds and rain-
fall that accompanies increased convection associated with anMJO event on 24November showed high concentrations of pri-mary marine aerosol. The measured primary marine aerosolwas mainly composed of sea salt as found from IC analysisof filter samples (sea salt is refractory, and thus not effec-tively measured by the Q-AMS), but some non-refractorysubmicrometer aerosol was analyzed by the Q-AMS. This aero-sol contained m/z fragments including m/z 23 (Na+, from seasalt) and m/z peaks most likely from C2H5
+, HCN+, and C3H3+
aerosol fragments which have been associated with primarymarine aerosol [Bates et al., 2012; Ovadnevaite et al., 2011].[31] These four defined aerosol types were present in vary-
ing concentrations throughout the DYNAMO field campaigndepending on the dominant aerosol transport direction, meteo-rological conditions, and oceanic conditions.
4.3. Comparison of Aerosol Properties ObservedDuring DYNAMO to Previous Field Campaigns in theIndian Ocean
[32] HYSPLIT back trajectory calculations for an arrivalheight of 200m were used to categorize the impactor sam-pling periods by the prevailing air mass transport direction(Table 1). Aerosols transported from the north to the shipcontained significantly more nss K+, nss SO4
"2, and NH4+
and had higher levels of aerosol light absorption than aero-sols transported from other directions (Table 1). DuringLeg 3, more northerly continental aerosol transport and moresubmicron aerosol mass were observed than during Leg 2(Figure 3). Submicrometer nss K+ and aerosol light absorp-tion were well correlated over all sampling periods(r2 = 0.83), indicating a possible biomass burning source ofnss K+. Submicrometer aerosol light absorption was alsocorrelated, although not as strongly, with submicrometeraerosol mass concentration (r2 = 0.75), NH4
+ (r2 = 0.72), andSO4
"2 (r2 = 0.77). These results suggest that the majority ofthe submicrometer aerosol mass observed during the experi-ment, including nss SO4
"2, was transported from the conti-nent and was associated with the K+ biomass burningcomponent. Additionally, sub-10 micrometer single scatter-ing albedos (SSA) were slightly lower during northerlywinds (0.96# 0.02) than those measured during southerlywinds (0.99# 0.01), but these differences are within uncer-tainties. The close to unity SSA values even for continentalaerosol is likely due to the high water uptake from the sulfateand sea salt portion of these particles, which would increaseaerosol scattering while aerosol absorption would remain thesame. These values were calculated from sub-10 micrometerscattering and absorption coefficients measured at 60% RHand corrected for ambient RH (section 2.4).[33] The aerosol sources and chemistry observed during
DYNAMO were similar to findings from the Indian OceanExperiment (INDOEX), which took place in the winter andearly spring of 1999 in the Indian Ocean [Quinn et al.,2002], and the Atmospheric Brown Cloud Post MonsoonalExperiment [Spencer et al., 2008], which took place duringthe shoulder season (boreal fall) of the Asian monsoon in2004. During INDOEX, the nss SO4
2" andNH4+ concentrations
in submicrometer aerosol were higher in air masses from theNH versus the SH (0.52# 0.18 to 1.8# 0.24 and 0.09# 0.04to 0.5# 0.12, respectively) (Table 1) [Quinn et al., 2002].
Table 1. Submicrometer Aerosol Inorganic and Organic Components (24 h Time Resolution) and Aerosol Single Scattering Albedo (SSA)Divided Into Sectors Based on Back Trajectory Analysisa
(mgm"3) N S E W NHIOb SHIOb
Sea Salt 0.05# 0.05 .06# 0.05 0.03# 0.01 0.06# 0.01 0.09# 0.03 0.07# 0.08NH4 0.35# 0.23 0.12# 0.09 0.01# 0.01 0.20# 0.09 0.5# 0.12 0.09# 0.04nssK 0.06# 0.04 0.03# 0.02 BDL 0.03# 0.02MSA 0.01# 0.006 0.01# 0.006 0.004# 0.001 0.02# 0.005NO3 0.004# 0.004 0.009# 0.003 0.008# 0.003 0.01# 0.002 0.007# 0.007 <0.001nssSO4 1.95# 1.17 0.62# 0.42 0.09# 0.09 1.10# 0.53 1.8# 0.24 0.52# 0.18Oxalate 0.006# 0.004 0.004# 0.004 0.001# 0.001 0.005# 0.004Total Carbon 0.45# 0.27 0.41# 0.31 0.18# 0.04 0.45# 0.14SSAc 0.96# 0.02 0.99# 0.01 0.98# 0.02 0.98# 0.01 0.91# 0.01 1.0# 0.02
aData from the northern and southern hemisphere Indian Ocean [Quinn et al., 2002] are shown for comparison.b[Quinn et al., 2002].cSSA calculated at 530 nm, sub-10-mm. DYNAMO data are calculated from 60% RH optical data corrected for ambient RH using f(RH)measurements.
Sub-1-mm SSA for the INDOEX data was calculated at 75% RH [Quinn et al., 2002].
DEWITT ET AL.: AEROSOLS AND THE MJO
5742

In addition,Quinn et al. [2002] found that submicrometer aero-sols sampled over the NH Indian Ocean had lower singlescattering albedos (SSA) at 75% RH (0.91# 0.01) thansubmicrometer aerosols over the SH Indian ocean (1.0# 0.02).[34] Spencer et al. [2008] measured the chemical composi-
tion of individual aerosol particles 300 nm in diameter andlarger to examine the effect of changing circulation patternsassociated with the end of the monsoon season on the sources,concentrations, and composition of aerosol transported to theMaldives. They found that northern hemisphere aerosolswere enriched in nss SO4
"2, EC, and nss K+ while SH aerosolswere enriched in unreacted sea salt. More NH aerosols wereobserved later in the fall due to the changing circulationover the Indian Ocean, similar to observations during the latterhalf of the DYNAMO measurement period.
5. Aerosol Response to the MJO
5.1. Defining Four Stages of Aerosol Response[35] Two MJO events, one weak (October, MJO1) and one
enhanced by a nearby tropical cyclone (November, MJO2),occurred over the Indian Ocean during the DYNAMO aerosolmeasurement period [Yoneyama et al., 2013] (section 3.1).Only the beginning of the weak MJO1 was directly observedonboard the R/V Revelle as the ship left station for port shortlyafter the convectively active MJO cycle began to pass over thecentral Indian Ocean (Figure 1). The complete MJO2 waveand its effect on aerosol properties, however, were fullyobserved. Here we present shipboard observations of evolvingaerosol properties in the context of the classicMJO convectiondescription to assess the overall effect of the MJO on theregional aerosol and vice versa. Changes in aerosol concentra-tion and properties directly related to MJO convection arediscussed in this section. Convection associated with theMJO (rain, wind speed, and wind direction) was found tomodify the relative importance of natural and anthropogenicaerosol to the remote marine environment (aerosol typesdescribed in section 4.2).
[36] Four stages are defined to describe the aerosolresponse to the MJO using meteorological and chemical data(significant wave height, wind speed, precipitation, ozone,vertical velocity variance, and radon) and aerosol data (num-ber and surface area size distributions and concentrations)(Figures 5–8). These stages are meant to assist in thedescription of changes in aerosol concentration and proper-ties during MJO-related convection. More in situ observa-tions or detailed satellite and modeling studies are neededto create statistical definitions of aerosol response to theMJO. Figure 5 shows the meteorological conditions throughthe full suppressed-active-suppressed MJO2 cycle and theaerosol surface area and number concentration (as a functionof aerosol geometric diameter) response to these changingmeteorological conditions. Stages 1 and 2 describe theperiod prior to the passing of the active convective center overthe ship location, stage 3 the convectively active phase of theMJO wave, and stage 4 the return to suppressed convection.Only stages 1–3 were clearly observed in Leg 2 (MJO1) whileall four stages were fully observed during Leg 3 (MJO2). Herewe discuss in detail MJO2 and later compare/contrastMJO1 and MJO2 in terms of their observed effect on the localaerosol population.[37] Initially, dry conditions associated with the suppressed
convection period of the MJO led to a slight build up ofsulfate-dominated submicrometer continental aerosol whentransport was northerly. Low-wind stress and thus low-waveheight also associated with suppressed convection (Figure 5a)resulted in low concentrations of supermicrometer or coarse-mode sea salt aerosol. This dry, calm period is defined as stage1. During stage 1, the MJO suppressed convection facilitateslonger aerosol lifetimes for continental aerosol (low-rain rates)if aerosol transport is from a continental direction while simul-taneously reducing the formation of primary marine aerosol(due to low-wind speeds). During stage 2, the local atmo-sphere became more disturbed with increased vertical mixingand increased precipitation rates. Radon and O3 increased(Figure 5b) as air masses in the free troposphere were mixed
Figure 5. Four stages of aerosol response to MJO-related convection for the November MJO2 event: (a)significant wave height in meters (left axis), wind stress in Nm–2 (Figure 5a, right axis), (b) ozone (O3)concentrations in parts per billion by volume (ppbv) (left axis) and radon in mBqm"3 (Figure 5b,right axis), (c) surface area concentration of aerosols as a function of aerosol diameter (Figure 5c), (d)number concentration of aerosols as a function of aerosol diameter, and precipitation in mmday"1
(Figures 5c and 5d, right axis).
DEWITT ET AL.: AEROSOLS AND THE MJO
5743

down to the MBL. A few precipitation events occurred duringstage 2 (Figure 5c and 5d). Both the aerosol number andsurface area concentrations increased with mode diameters at50 nm and 300 nm, respectively (Figure 5d and 5c). Thegreatest increase in aerosol number and surface area concen-tration during stage 2 occurred at 19Z on 22 November2011, corresponding to a rapid increase in radon indicatingthat an air mass recently over land was being mixed downinto the MBL.
[38] Wind stress and significant wave height increasedsharply on 24 November 2011 as the enhanced section ofthe MJO convective wave moved through, defined here asstage 3 (Figure 5a). Supermicrometer aerosol concentrationalso rose during this wind burst due to sea salt aerosols beinglofted into the atmosphere in response to breaking wavesfrom high winds (Figure 5a) [O’Dowd and De Leeuw,2007]. Figure 6 shows the vertical velocity variance asmeasured by the HRDL LIDAR (which indicates the
Figure 6. The median Vertical Velocity Variance (m2 s"2) (Figure 6, left) and (range corrected) aerosolbackscatter intensity (dB) (Figure 6, right) profiles calculated as a function of height and aerosol responsestage for the MJO2 in November event.
Figure 7. Three observed stages of aerosol response to MJO-related convection for the October MJO1event: (a) wind stress in Nm"2 (left axis), (b) ozone (O3) concentrations in parts per billion by volume(ppbv) (left axis), and radon in mBqm"3 (Figure 7b, right axis), (c) surface area concentration of aerosolsas a function of aerosol diameter, (d) number concentration of aerosols as a function of aerosol diameter,and accumulated precipitation in mmday"1 (Figures 7c and 7d, right axis).
DEWITT ET AL.: AEROSOLS AND THE MJO
5744

strength of vertical motion in the atmosphere) and aerosolbackscatter intensity (range corrected) as a function of alti-tude, averaged over the defined MJO aerosol responsestages. Progressing from stage 1 to stage 3, there is anincrease in mixing and vertical transport (as indicated bythe vertical velocity variance) and an associated increase inthe concentration of sea salt aerosol, extended through theMBL, to a height of 1000m (as indicated by the increasein aerosol backscatter intensity in Figure 6). At the begin-ning of stage 3 and again on 28 November 2011, there is asharp increase in the strength of the vertical velocity vari-ance and aerosol backscatter to a height of 1000m (Figures 1and 6). Bursts of increased, deep vertical velocity variancewere observed late in stage 2, and these bursts transitionedinto a sustained increase in vertical velocity variancethrough atmospheric heights of 1000m or greater duringstage 3 (Figures 1 and 6). The average vertical velocityvariance and transport during the MJO-related convectionwas more sustained and, averaged over the time of theconvectively active wave (stage 3), greater than duringconvectively suppressed periods at lower altitudes for bothMJO1 and MJO2 (Figures 8 and 6, respectively). Backscatterintensity (from supermicrometer—i.e., sea salt—aerosols) isalso shown to increase in stage 3 as sea salt aerosol is loftedinto the atmosphere. This effect persists through stage 4 assome of the sea salt aerosol remained in the atmosphere afterthe winds reduced in speed.[39] As the MJO2 progressed, heavy precipitation led to
the wet deposition of submicrometer aerosol, and the atmo-sphere was left clean aside from sea salt during periods ofhigh winds and some continuous mixing down of small par-ticles from the upper troposphere (stage 3). During stage 3,
the air mass transport direction, as calculated by HYSPLITback trajectories, was primarily south-easterly (backgroundmarine). Stage 4 shows a return to suppressed convectionbased on measured reduced wave height and wind stress.Northerly flow during late November/early December (fromHYSPLIT backtrajectory calculations) quickly reintroducedsubmicrometer continental aerosol to the local MBL as theprecipitation decreased.
5.2. Comparison of MJO1 and MJO2[40] Figure 7 shows the meteorological data (wind stress,
O3, radon, precipitation) and aerosol concentration as a func-tion of geometric diameter for aerosol surface area and aero-sol number for stages 1, 2, and 3 of the weak MJO eventobserved in the eastern Indian Ocean in October (Yoneyamaet al., submitted manuscript, 2013). Like stage 1 for MJO2,stage 1 for MJO1 is characterized by low levels of windstress and thus low levels of primary marine (sea salt)supermicrometer aerosols. Some buildup of submicrometeraerosols can be observed; however, as the primary aerosoltransport direction during the month of October was south-erly (clean marine) rather than northerly (continental),aerosol levels were generally low. During stage 2, periods ofhigher wind stress began to occur (increasing supermicrometeraerosol) and O3 began to rise (as submicrometer aerosol wastransported from the upper atmosphere into the MBL). Radonremained low for the entire MJO1 period, indicating that therewas little continental influence on the aerosol populationduring this MJO cycle. During MJO1, there was no sharplydefined wind burst initiating the convectively active stage;rather, for MJO1, stage 3 is defined by a burst of enhancedrainfall accompanied by an increase in O3 and small increases
Figure 8. The median Vertical Velocity Variance (m2 s"2) (Figure 8, left) and (range corrected) aerosolbackscatter intensity (dB) (Figure 8, right) profiles calculated as a function of height and aerosol responsestage for the MJO1 event in October. There is no stage 4 profile as the ship left the observational area priorto the onset of that stage.
DEWITT ET AL.: AEROSOLS AND THE MJO
5745

in wind stress. Figure 8 shows the vertical velocity varianceand range corrected backscatter intensity for MJO1 stages1–3. Again, stage 3 shows the highest vertical velocity vari-ance and an increase in the aerosol backscatter through1500m in altitude from the less convectively active stages.[41] An aerosol size regime change from submicrometer to
supermicrometer was observed in the MJO1 similar to that ob-served in the MJO2 (section 5.1); however, the low initialaerosol levels (due to the more southerly aerosol transport di-rection) and the lower wind stress levels in stage 3 of MJO1versus MJO2 reduced the net effect on MJO-related convec-tion on aerosol. Likely, the defined aerosol responses toMJO convection occur for each MJO convection cycle thatoccurs over the Indian Ocean but the magnitude of the effecton the remotemarine aerosol population varies with the seasons.
5.3. MJO-Related Convection and AerosolChemical Composition[42] While the MJO may increase the lifetime of continen-
tal aerosol transported to the Indian Ocean, and changes incirculation due to the MJO may introduce new continentalaerosol to the MBL, the MJO’s most dramatic effect onaerosol chemistry is the rainout of primarily sulfatesubmicrometer aerosol particles (both marine and continen-tal in origin) and the introduction of fresh supermicrometersea salt particles to the MBL. The total mass concentrationof supermicrometer and submicrometer aerosol changedsignificantly as the MJO convection progressed fromsuppressed (stage 1) to increasingly active (stages 2–3) andback to suppressed (stage 4) (Figure 9). Shown in Figure 9is the chemical speciation of sub- and supermicrometeraerosol from filter-based impactor IC and gravimetric data.Impactor measurements were used here instead of theQ-AMS real-time data because the Q-AMS is unable toquantitatively measure submicrometer refractory species(such as sea salt) and cannot measure any supermicrometerparticles. Note that the total gravimetric mass shown of thebulk sub- and supermicrometer aerosol includes both dustand water (at 60% RH) and thus is greater than the sumof the chemically analyzed mass. Additionally, some mass
from organic aerosol may be part of the unknown mass asmgCm"3 not total particulate organic mass was measured.[43] Due to high winds and heavy precipitation during
stage 3, the submicrometer aerosol concentration was drasti-cally reduced and supermicrometer sea salt aerosol (NaCl)dominated the aerosol mass. Sea salt was the primary com-ponent of the submicrometer as well as supermicrometeraerosol mass during stage 3. Conversely, during stages 1,2, and 4, the concentration of submicrometer aerosolincreased relative to sea salt due to northerly transport ofcontinental air and lower wind speeds reducing the emissionof primary marine aerosol from the ocean surface. Winddirection and aerosol transport would change the characteris-tics of aerosol during these stages (i.e., southerly backgroundmarine in the boreal fall and spring, northerly in the boreal latefall and winter). Continental influence was greatest in stage 4as even the supermicrometer aerosol was affected by anthro-pogenic influence. NO3
" (from HNO3 uptake by sea salt)increased in concentration in comparison to the fresher, pri-marily marine-influenced supermicrometer aerosol that wassampled during stage 3.
5.4. The Effect of the MJO on Aerosol Number andCloud Condensation Nuclei (CCN) Concentrations[44] As the aerosol chemistry and aerosol mass changed,
the aerosol number concentration and size distribution alsochanged during the MJO progression for both the MJO1(Figure 10a, stages 1–3) and the MJO2 event (Figure 10b,stages 1–4). Aerosol number concentration, rather thansurface area or volume, controls cloud condensation nuclei(CCN) concentrations. During MJO2, the aerosol numberconcentration was higher during the suppressed periods(stages 1, 2, and 4) due to the dry conditions and northerlyflow associated with the end of the Asian monsoonseason. The number size distribution was bimodal with anAitkin mode peak around 50 nm from particles mixed intothe MBL from the free troposphere and an accumulationmode at approximately 200–300 nm (at 60%# 10% RH)resulting from cloud processing of the Aitken mode parti-cles. These largely sulfate submicrometer aerosol particles
Figure 9. The aerosol sub- and supermicrometer chemistryfor the stages of aerosol response to the MJO convection. (a)Supermicrometer aerosol chemistry and (b) submicrometeraerosol chemistry. Total aerosol mass is gravimetric massmeasured at 60% RH. The disparity between total aerosolmass and measured chemical mass is due to water at 60%RH and unanalyzed chemical mass (e.g., dust).
Figure 10. (a) Aerosol number size distribution at 60%relative humidity during stages 1–3 of the MJO-relatedconvection in October and (b) during all four stages of theMJO-related convection in November.
DEWITT ET AL.: AEROSOLS AND THE MJO
5746
(e.g., Figure 9) could nucleate water and act as CCN forsupersaturations typical of MBL clouds in the region [Kohler,1936]. Based on an ammonium bisulfate composition, 200 to300 nm particles (accumulation mode) activate at a criticalsupersaturation of 0.1% or less while the smaller 50 nm parti-cles (Aitken mode) would need a higher supersaturation(>0.5%) to activate [Petters and Kreidenweis, 2007]. Supersat-urations at tropical maritime cloud bases typically do not exceed0.5% [Khain et al., 2012]. However, supersaturations withintropical clouds are on average 0.5–2% and can be upwards of20% during periods of deep convection. Thus, smaller particlesmay be important in CCN [Khain et al., 2012]. The interplaybetween aerosol and clouds is complex such that more CCNdoes not necessarily equate to more cloud cover. The hydrolog-ical cycle, radiative balance, and wider-scale weather patternshave greater effects on cloudiness and precipitation thanaerosols and thus may reduce the effects aerosols have on localconvection [Stevens and Feingold, 2009]. TheMJO is governedby large-scale convection and ocean conditions and thus anyaerosol effect may be small to negligible, though some aerosoleffect on local weather patterns may still be important.[45] Rosenfeld et al. [2008] suggest that there is an aerosol
level in the tropics that results in optimal cloud developmentover both the land and the ocean. Using a simple model,Rosenfeld et al. [2008] found that a CCN concentration of1200 cm"3 at 0.4% supersaturation, corresponding to an aero-sol optical thickness of 0.25, causes maximum convectiveavailable potential energy to be consumed by clouds and stormsystems in the area. Increases in CCN concentration can lead toa decrease in the CCN coalescence rate and thus a delay ofrainfall [Twomey and Warner, 1967]. Delaying the conversionof CCN to rain droplets allows clouds to ascend higher in theatmosphere past the freezing level. Past a CCN concentrationof approximately 1200 cm"3 and an AOT of 0.25, the reduc-tion in solar radiation reaching the surface due to the aerosollayer lowers the surface heating and thus could in theoryreduce convection [Bell et al., 2008; Rosenfeld et al., 2008],At the DYNAMO field site, submicrometer aerosol numberconcentrations were on average <300 cm"3, more typical ofremote marine than polluted conditions [Pruppacher andKlett, 1997; Roberts et al., 2006]. The total number of aerosolparticles available as CCN before the MJO event increasedfrom 250 cm"3 during October to 570 cm"3 during November.The aerosol concentration limit where aerosol begins to sup-press convection was not reached in these measurements[Rosenfeld et al., 2008].
[46] During the MJO rainfall event, background and conti-nental aerosols were removed by wet deposition and primarymarine aerosol increased due to the higher wind speeds. Likethe submicrometer sulfate aerosols, the coarse-mode sea saltaerosols can act as CCN, although their number concentra-tion was much less. The incorporation of a few of theselarger sized sea salt aerosols into clouds has been shown insome cases to increase rainout rates as opposed to anincrease in more numerous but smaller submicrometerCCN, though giant (5–10 mm) CCN were found to havethe greatest effect [Rudich et al., 2002].
5.5. MJO and Aerosol: Comparison to PreviousObservations[47] Although this work only measures aerosol in the
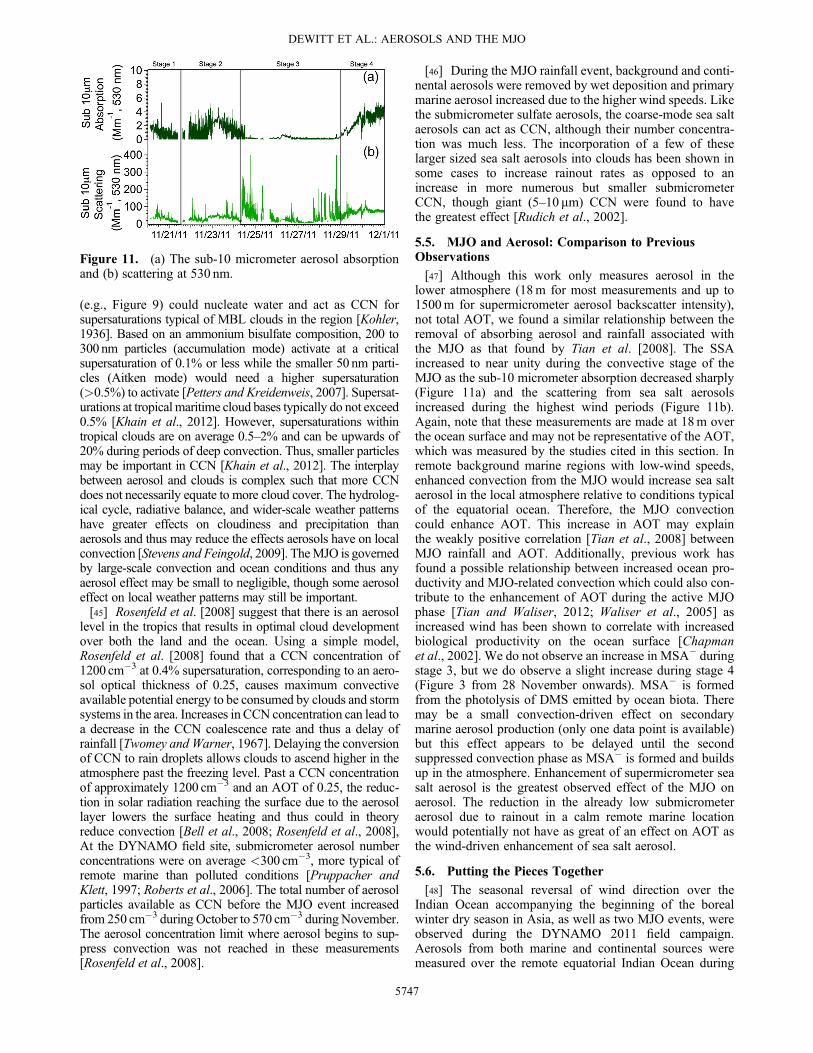
lower atmosphere (18m for most measurements and up to1500m for supermicrometer aerosol backscatter intensity),not total AOT, we found a similar relationship between theremoval of absorbing aerosol and rainfall associated withthe MJO as that found by Tian et al. [2008]. The SSAincreased to near unity during the convective stage of theMJO as the sub-10 micrometer absorption decreased sharply(Figure 11a) and the scattering from sea salt aerosolsincreased during the highest wind periods (Figure 11b).Again, note that these measurements are made at 18m overthe ocean surface and may not be representative of the AOT,which was measured by the studies cited in this section. Inremote background marine regions with low-wind speeds,enhanced convection from the MJO would increase sea saltaerosol in the local atmosphere relative to conditions typicalof the equatorial ocean. Therefore, the MJO convectioncould enhance AOT. This increase in AOT may explainthe weakly positive correlation [Tian et al., 2008] betweenMJO rainfall and AOT. Additionally, previous work hasfound a possible relationship between increased ocean pro-ductivity and MJO-related convection which could also con-tribute to the enhancement of AOT during the active MJOphase [Tian and Waliser, 2012; Waliser et al., 2005] asincreased wind has been shown to correlate with increasedbiological productivity on the ocean surface [Chapmanet al., 2002]. We do not observe an increase in MSA" duringstage 3, but we do observe a slight increase during stage 4(Figure 3 from 28 November onwards). MSA" is formedfrom the photolysis of DMS emitted by ocean biota. Theremay be a small convection-driven effect on secondarymarine aerosol production (only one data point is available)but this effect appears to be delayed until the secondsuppressed convection phase as MSA" is formed and buildsup in the atmosphere. Enhancement of supermicrometer seasalt aerosol is the greatest observed effect of the MJO onaerosol. The reduction in the already low submicrometeraerosol due to rainout in a calm remote marine locationwould potentially not have as great of an effect on AOT asthe wind-driven enhancement of sea salt aerosol.
5.6. Putting the Pieces Together[48] The seasonal reversal of wind direction over the
Indian Ocean accompanying the beginning of the borealwinter dry season in Asia, as well as two MJO events, wereobserved during the DYNAMO 2011 field campaign.Aerosols from both marine and continental sources weremeasured over the remote equatorial Indian Ocean during
Figure 11. (a) The sub-10 micrometer aerosol absorptionand (b) scattering at 530 nm.
DEWITT ET AL.: AEROSOLS AND THE MJO
5747

the boreal fall of 2011 onboard the R/V Revelle as part of theDYNAMO 2011 field campaign. During this measurementperiod, the winds transitioned from predominately southerly(Asian monsoon season) to predominately northerly(Asian dry season). With this reversal of wind directioncame a shift in aerosol properties, from primarily back-ground marine aerosol observed in October to more conti-nentally influenced aerosol in November and earlyDecember. The more continentally influenced air mass hadhigher submicrometer aerosol concentrations and increasedaerosol light absorption. Drier conditions and northerly airflow during boreal winter have previously been associatedwith increased continental aerosol over the remote IndianOcean [Ramanathan et al., 2001].[49] During October and November 2011, the aerosol
response to a partial (October) and a full (November) cycleof an MJO wave was observed on the equatorial IndianOcean. From these data, four stages in the aerosol responseto the MJO wave were identified and are summarized incartoon form in Figure 12.[50] 1. Low rainout rates associated with the convectively
suppressed period of the MJO increase the lifetime ofsubmicrometer aerosol in the marine atmosphere allowingconcentrations of submicrometer aerosol to build up.[51] 2. Tropospheric turnover just prior to the MJO event
introduces aerosol from the upper atmosphere. Theseparticles, primarily SO4"2, are of a size to act as CCN atsupersaturations of 0.1% (for the 200–300 nm number modediameter aerosol) and 0.5% or greater (for the 50 nm numbermode diameter aerosol).[52] 3. High surface wind speeds increase the concentra-
tion of sub- and supermicrometer primary ocean-derivedparticles (sea spray), both of which could also act as CCN.Rains quickly following the initial wind burst removesubmicrometer aerosol through wet deposition, while highwind bursts continuously resupply sea spray aerosol.[53] 4. As the convectively active period ends and the
wind speeds return to suppressed levels, primary sea sprayaerosol decreases and submicrometer secondary aerosolfrom the free troposphere builds up again in the MBL.
6. Conclusions
[54] From the measurements presented in this work, we havedetermined that MJO-associated convection does not solelyaffect aerosol by rainout; rather, increased wind speeds duringconvectively active periods greatly enhances the concentrationof sea salt aerosols over the equatorial Indian Ocean and down-ward motion in the atmosphere just prior to and during theMJO enhanced convection introduces new submicrometer par-ticles to theMBL. Suppressed convection periods could lead tolonger aerosol lifetimes and thus longer aerosol transport dis-tances, although the interplay between the beginning of theAsian winter dry season and the MJO events observed makesthe exact magnitude of this effect difficult to determine.[55] Likely, the four defined stages in aerosol response to
MJO convection (section 5) occur during each MJO event;however, the net effect would vary with each MJO wave, withinterference from coincidingmeteorology, andwith the ambientaerosol population. Increased continental transport during thebeginning of the Asian dry season would enhance the effectof stages 1, 2, and 4. An increase in CCN concentrations duringthe suppressed phase from longer aerosol lifetime and transportcould lead to more energetic convection [Bell et al., 2008;Rosenfeld et al., 2008]. In general, the MJO signal peaks inboreal winter and spring [Zhang, 2005], which coincides withthe Asian dry season, the formation of the Indo-Asian Hazelayer in Asia [Ramanathan et al., 2001], and increased northerlyflow over the Indian Ocean. Stronger MJO-related convectionthus overlaps with higher aerosol concentrations, and the effectof theMJO on the aerosol population could be greatly enhancedin the boreal winter. While a multitude of meteorological andoceanographic factors affect the initiation and propagation ofthe MJO, it is possible submicrometer continental aerosol fromAsia could have some influence in enhancing MJO-associatedconvection as the MJO itself changes the aerosol populationand concentration. Modeling work is needed to fully explorethe effect of aerosols, and specifically continental and anthropo-genic aerosols, on the MJO. Regardless of anthropogenic influ-ence, MJO-related convection has been shown to have a largeeffect on the aerosol population over the equatorial ocean.
[56] Acknowledgments. The authors would like to acknowledge theNational Research Council and the NOAA Climate Program Office (CPOEarth SystemScience Program) for fundingH. LangleyDeWitt and the aerosolmeasurement component of the DYNAMO research project. We would alsolike to acknowledge the captain and crew of the R/V Revelle as well as ChiefScientist Jim Moum and the other scientists onboard the Revelle for their helpfacilitating this science cruise and the scientific discussions onboard. Alexan-der Smirnov at NASA Aeronet analyzed the Microtops AOT data. LudovichBariteau at NOAAESRL provided the wind stress and significant wave heightdata reported in the paper. Thanks also go to James Johnson and Drew Ham-ilton at the Joint Institute for the Study of the Atmosphere and Ocean (JISAO)for their help with instrument calibration and shipping.
ReferencesAnderson, T. L., and J. A. Ogren (1998), Determining aerosol radiativeproperties using the TSI 3563 integrating nephelometer, Aerosol Sci.Tech., 29(1), 57–69.
Andreae, M. O., W. R. Barnard, and J. M. Ammons (1983), The biologicalproduction of dimethylsulfide in the ocean and its role in the globalatmospheric sulfur budget, Ecol. Bull., 35, 167–177.
Annamalai, H., and J. M. Slingo (2001), Active/break cycles: Diagnosis ofthe intraseasonal variability of the Asian Summer Monsoon, Clim.Dynam., 18(1-2), 85–102.
Bates, T. S., D. J. Coffman, D. S. Covert, and P. K. Quinn (2002), Regionalmarine boundary layer aerosol size distributions in the Indian, Atlantic,and Pacific Oceans: A comparison of INDOEX measurements with
Figure 12. A representative cartoon of the aerosol responseto MJO-related convection. Stage 1: Suppressed convection,longer aerosol lifetime. Stage 2: Disturbed convection,overturning of the troposphere, and introduction of aerosolfrom the upper atmosphere. Stage 3: Enhanced wind and pre-cipitation, increased sea salt aerosol mass, eventual rainout ofaerosol. Stage 4: Return to suppressed convection.
DEWITT ET AL.: AEROSOLS AND THE MJO
5748

ACE-1, ACE-2, and Aerosols99, J. Geophys. Res. Atmos., 107(D19),8026, doi:10.1029/2001JD001174.
Bates, T. S., P. K. Quinn, D. J. Coffman, J. E. Johnson, andA.M.Middlebrook(2005), Dominance of organic aerosols in themarine boundary layer over theGulf of Maine during NEAQS 2002 and their role in aerosol light scattering,J. Geophys. Res. Atmos., 110, D18202, doi:10.1029/2005JD005797.
Bates, T. S., et al. (2008), Boundary layer aerosol chemistry during TexAQS/GoMACCS 2006: Insights into aerosol sources and transformation pro-cesses, J. Geophys. Res. Atmos., 113, D00F01, doi:10.1029/2008JD010023.
Bates, T. S., et al. (2012), Measurements of ocean derived aerosol off the coast ofCalifornia, J. Geophys. Res. Atmos., 117, D00V15, doi:10.1029/2012JD017588.
Bell, T. L., D. Rosenfeld, K. M. Kim, J. M. Yoo, M. I. Lee, andM. Hahnenberger (2008), Midweek increase in US summer rain andstorm heights suggests air pollution invigorates rainstorms, J. Geophys.Res. Atmos., 113, D02209, doi:10.1029/2007JD008623.
Berner, A., C. Lurzer, F. Pohl, O. Preining, and P. Wagner (1979), Size distri-bution of the urban aerosol in Vienna, Sci. Total Environ., 13(3), 245–261.
Canagaratna, M. R., et al. (2007), Chemical and microphysical characteriza-tion of ambient aerosols with the aerodyne aerosol mass spectrometer,Mass Spectrom. Rev., 26(2), 185–222.
Chapman, E. G., W. J. Shaw, R. C. Easter, X. Bian, and S. J. Ghan (2002), Influ-ence of wind speed averaging on estimates of dimethylsulfide emission fluxes,J. Geophys. Res. Atmos., 107(D23), 4672, doi:10.1029/2001JD001564.
Clarke, A. D., J. L. Varner, F. Eisele, R. L. Mauldin, D. Tanner, and M. Litchy(1998a), Particle production in the remote marine atmosphere: Cloud outflowand subsidence duringACE1, J.Geophys. Res. Atmos., 103(D13), 16397–16409.
Clarke, A. D., et al. (1998b), Particle nucleation in the tropical boundary layerand its coupling to marine sulfur sources, Science, 282(5386), 89–92.
Dasgupta, S., R. P. Singh, andM. Kafatos (2009), Comparison of global chloro-phyll concentrations using MODIS data, Adv. Space Res., 43(7), 1090–1100.
DeCarlo, P. F., et al. (2006), Field-deployable, high-resolution, time-of-flightaerosol mass spectrometer, Anal Chem, 78(24), 8281–8289.
Grund, C. J., R.M. Banta, J. L. George, J. N. Howell, M. J. Post, R. A. Richter,and A. M. Weickmann (2001), High-resolution Doppler lidar for boundarylayer and cloud research, J. Atmos. Ocean. Tech., 18(3), 376–393.
Hegg, D. A., L. F. Radke, and P. V. Hobbs (1990), Particle-production associ-ated with marine clouds, J. Geophys. Res. Atmos., 95(D9), 13917–13926.
Jimenez, J. L., et al. (2009), Evolution of organic aerosols in the atmo-sphere, Science, 326(5959), 1525–1529.
Kessler, W. S., and M. J. McPhaden (1995), Oceanic equatorial waves andthe 1991–93 El-Nino, J. Climate, 8(7), 1757–1774.
Khain, A. P. P., V. Phillips, N. Benmoshe, A. Pokrovsky (2012), The role ofsmall soluble aerosols in the microphysics of deep maritime clouds,J. Atmos. Sci., 69, 20.
Kohler, H. (1936), The nucleus in and the growth of hygroscopic droplets,T. Faraday Soc., 43, 9.
Lau, A. K. H., and D. Waliser (2012), Intraseasonal Variability in theAtmosphere-Ocean Climate System, p. 613, Springer-Praxis Books inEnvironmental Sciences, Heidelberg, Germany.
de Leeuw, G., E. L. Andreas, M. D. Anguelova, C. W. Fairall, E. R. Lewis,C. O’Dowd, M. Schulz, and S. E. Schwartz (2011), Production flux of seaspray aerosol, Rev. Geophys., 49, RG2001, doi:10.1029/2010RG000349.
Li, K.-F., B. Tian, D. E. Waliser, and Y. L. Yung (2010), Tropical mid-tropospheric CO2 variability driven by the Madden–Julian oscillation,Proceedings of the National Academy of Sciences.
Liebmann, B., G. N. Kiladis, C. S. Vera, A. C. Saulo, and L. M. V. Carvalho(2004), Subseasonal variations of rainfall in South America in the vicinity ofthe low-level jet east of the Andes and comparison to those in the SouthAtlantic convergence zone, J. Climate, 17(19), 3829–3842.
Madden, R. A., and P. R. Julian (1972), Description of global-scale circula-tion cells in the tropics with a 40-50 Day Period, J. Atmos. Sci., 29, 15.
O’Dowd, C. D., andG. De Leeuw (2007),Marine aerosol production: A reviewof the current knowledge, Philos. T. R. Soc. A, 365(1856), 1753–1774.
O’Dowd, C. D., B. Langmann, S. Varghese, C. Scannell, D. Ceburnis, andM. C. Facchini (2008), A combined organic-inorganic sea-spray sourcefunction, Geophys. Res. Lett., 35, L01801, doi:10.1029/2007GL030331.
Ovadnevaite, J., C. O’Dowd, M. Dall’Osto, D. Ceburnis, D. R. Worsnop,and H. Berresheim (2011), Detecting high contributions of primaryorganic matter to marine aerosol: A case study, Geophys. Res. Lett., 38,L02807, doi:10.1029/2010GL046083.
Petters, M. D., and S. M. Kreidenweis (2007), A single parameter represen-tation of hygroscopic growth and cloud condensation nucleus activity,Atmos. Chem. Phys., 7(8), 1961–1971.
Pruppacher, H. R., and J. D. Klett (1997), Microphysics of Clouds andPrecipitation, 2nd rev. and enl. ed., xx, 954 pp., Kluwer Academic Pub-lishers, Dordrecht; Boston.
Quinn, P. K., and T. S. Bates (2011), The case against climate regulation viaoceanic phytoplankton sulphur emissions, Nature, 480(7375), 51–56.
Quinn, P. K., and D. J. Coffman (1998), Local closure during the firstaerosol characterization experiment (ACE 1): Aerosol mass concentration
and scattering and backscattering coefficients, J. Geophys. Res. Atmos.,103(D13), 16575–16596.
Quinn, P. K., D. J. Coffman, T. S. Bates, T. L.Miller, J. E. Johnson, E. J.Welton,C. Neususs, M. Miller, and P. J. Sheridan (2002), Aerosol optical propertiesduring INDOEX1999:Means, variability, and controlling factors, J. Geophys.Res. Atmos., 107(D19), 8020, doi:10.1029/2000JD000037.
Quinn, P. K., et al. (2006), Impacts of sources and aging on submicrometeraerosol properties in the marine boundary layer across the Gulf of Maine,J. Geophys. Res. Atmos., 111, D23S36, doi:10.1029/2006JD007582.
Quinn, P. K., T. S. Bates, D. J. Coffman, and D. S. Covert (2008), Influenceof particle size and chemistry on the cloud nucleating properties ofaerosols, Atmos. Chem. Phys., 8(4), 1029–1042.
Ramanathan, V., et al. (2001), Indian Ocean experiment: An integratedanalysis of the climate forcing and effects of the great Indo-Asian haze,J. Geophys. Res. Atmos., 106(D22), 28371–28398.
Reid, J. S., P. Xian, E. J. Hyer, M. K. Flatau, E. M. Ramirez, F. J. Turk,C. R. Sampson, C. Zhang, E. M. Fukada, and E. D. Maloney (2012),Multi-scale meteorological conceptual analysis of observed active firehotspot activity and smoke optical depth in the Maritime Continent,Atmos. Chem. Phys., 12(4), 2117–2147.
Roberts, G., G. Mauger, O. Hadley, and V. Ramanathan (2006), NorthAmerican and Asian aerosols over the eastern Pacific Ocean and their rolein regulating cloud condensation nuclei, J. Geophys. Res. Atmos., 111,D13205, doi:10.1029/2005JD006661.
Rosenfeld, D., U. Lohmann, G. B. Raga, C. D. O’Dowd, M. Kulmala,S. Fuzzi, A. Reissell, and M. O. Andreae (2008), Flood or drought:How do aerosols affect precipitation?, Science, 321(5894), 1309–1313.
Rudich, Y., O. Khersonsky, and D. Rosenfeld (2002), Treating clouds with agrain of salt,Geophys. Res. Lett., 29(22), 2060, doi:10.1029/2002GL016055.
Smirnov, A., et al. (2009), Maritime aerosol network as a componentof aerosol robotic network, J. Geophys. Res. Atmos., 114, D06204,doi:10.1029/2008JD011257.
Spencer, M. T., J. C. Holecek, C. E. Corrigan, V. Ramanathan, andK. A. Prather (2008), Size-resolved chemical composition of aerosolparticles during a monsoonal transition period over the Indian Ocean,J. Geophys. Res. Atmos., 113, D16305, doi:10.1029/2007JD008657.
Stevens, B., and G. Feingold (2009), Untangling aerosol effects on cloudsand precipitation in a buffered system, Nature, 461(7264), 607–613.
Tian, B. J., and D.Waliser (2012), Madden-JulianOscillation, inEncyclopediaof Remote Sensing, edited by E. Njoku, pp. 569-584, SpringerReference,Berlin Heidelberg.
Tian, B. J., Y. L. Yung, D. E. Waliser, T. Tyranowski, L. Kuai, E. J. Fetzer,and F. W. Irion (2007), Intraseasonal variations of the tropical total ozoneand their connection to the Madden-Julian Oscillation, Geophys. Res.Lett., 34, L08704, doi:10.1029/2007GL029451.
Tian, B. J., D. E. Waliser, R. A. Kahn, Q. Li, Y. L. Yung, T. Tyranowski,I. V. Geogdzhayev, M. I. Mishchenko, O. Torres, and A. Smirnov(2008), Does the Madden-Julian oscillation influence aerosol variability?,J. Geophys. Res. Atmos., 113, D12215, doi:10.1029/2007JD009372.
Tucker, S. C., W. A. Brewer, R. M. Banta, C. J. Senff, S. P. Sandberg,D. C. Law, A. M. Weickmann, and R. M. Hardesty (2009), Doppler lidarestimation of mixing height using turbulence, shear, and aerosol profiles,J. Atmos. Ocean Tech., 26(4), 673–688.
Twomey, S., and J. Warner (1967), Comparison of measurements of clouddroplets and cloud nuclei, J. Atmos. Sci., 24(6), 702–703.
Waliser, D. E., R. Murtugudde, P. Strutton, and J. L. Li (2005), Subseasonalorganization of ocean chlorophyll: Prospects for prediction based on theMadden-Julian Oscillation, Geophys. Res. Lett., 32, L23602, doi:10.1029/2005GL024300.
Wheeler, M. C., and H. H. Hendon (2004), An all-season real-time multi-variate MJO index: Development of an index for monitoring and predic-tion, Mon. Weather Rev., 132(8), 1917–1932.
Whittlestone, S., andW. Zahorowski (1998), Baseline radon detectors for ship-board use: Development and deployment in the first aerosol characterizationexperiment (ACE 1), J. Geophys. Res. Atmos., 103(D13), 16743–16751.
Yoneyama, K., C. Zhang, andC.N. Long (2013), Tracking pulses of theMadden-Julian Oscillation, B Am Meteorol Soc., doi:10.1175/BAMS-D-12-00157.1.
Zhang, C. (2005), Madden-Julian oscillation, Rev. Geophys., 43, RG2003,doi:10.1029/2004RG000158.
Zhang, Q., M. R. Canagaratna, J. T. Jayne, D. R. Worsnop, and J. L. Jimenez(2005a), Time- and size-resolved chemical composition of submicron parti-cles in Pittsburgh: Implications for aerosol sources and processes, J.Geophys. Res. Atmos., 110, D07S09, doi:10.1029/2004JD004649.
Zhang,Q.,M.R.Alfarra, D. R.Worsnop, J. D. Allan, H. Coe,M.R. Canagaratna,and J. L. Jimenez (2005b), Deconvolution and quantification ofhydrocarbon-like and oxygenated organic aerosols based on aerosol massspectrometry, Environ. Sci. Technol., 39(13), 4938–4952.
Zorn, S. R., F. Drewnick,M. Schott, T. Hoffmann, and S. Borrmann (2008), Char-acterization of the South Atlantic marine boundary layer aerosol using an aero-dyne aerosol mass spectrometer, Atmos. Chem. Phys., 8(16), 4711–4728.
DEWITT ET AL.: AEROSOLS AND THE MJO
5749