atmospheric energy cr mega packet
TRANSCRIPT

ATMOSPHERIC ENERGY CR MEGA PACKET
Base your answers to questions 1 through 3 on the data table below and on your knowledge of Earthscience. The data table shows the average percentage of insolation from 2006 to 2012 that wasreflected during the summer months by the ice sheet that covers a large portion of Greenland.
1. Describe one characteristic of the ice sheet that makes it a good reflector of insolation.
2. Describe the general trend for the average insolation reflected by the Greenland ice sheet from 2006 to2012 and state what can be inferred about the change in size of the Greenland ice sheet during thistime period.
3. On the grid below, construct a line graph by plotting the average insolation reflected during thesummer by the Greenland ice sheet from 2006 to 2012. Connect all seven plots with a line.

ATMOSPHERIC ENERGY CR MEGA PACKET
Base your answers to questions 4 through 7 on the graph below and on your knowledge of Earthscience. The graph shows changes in hours of daylight during the year at the latitudes of 0°, 30° N,50° N and 60° N.
4. The graph below shows a curve for the changing length of daylight over the course of one year thatoccurs for an observer at 50° N latitude. On this same graph, draw a line to show the changing lengthof daylight over the course of one year that occurs for an observer at 50° S latitude.
5. Explain why all four latitudes have the same number of hours of daylight on March 20 and September22.
6. Identify the latitude shown on the graph that has the earliest sunrise on June 21. Include the units andcompass direction in your answer.
7. Estimate the number of daylight hours that occur on January 1 at 40° N latitude.

ATMOSPHERIC ENERGY CR MEGA PACKET
Base your answers to questions 8 and 9 on the passage and diagram below and on your knowledge ofEarth science. The diagram represents a house located in New York State.
Solar Heating
Solar collectors in solar heating systems harness the power of the Sun to provide thermalenergy for heating hot water and house interiors. There are several types of solar heating systems.The best system will depend on the geographic location and the intensity of the Sun. A solarheating system saves energy, reduces utility costs, and produces clean energy. The efficiency andreliability of solar heating systems have increased dramatically in recent years.
8. State one advantage of using solar energy instead of burning fossil fuels to produce thermal energy foryour home.
9. Explain why solar energy can still be collected on cloudy days.

ATMOSPHERIC ENERGY CR MEGA PACKET
Base your answers to questions 10 through 13 on the diagram below. The diagram represents daytimeand nighttime on Earth. Point X is a location on Earth's surface. Earth's rotational surface velocity isshown in miles per hour (mi/h) at specific latitudes.
10. Identify the Northern Hemisphere season that is just beginning when Earth is at the positionrepresented in this diagram.
11. On the grid below, draw a line to show the general relationship between distance from the equatorand Earth's rotational surface velocity.
12. Record, to the nearest hour, the duration of insolation at location X for one Earth rotation.
13. What is Earth's rotational surface velocity, in miles per hour, at 23.5° south latitude?

ATMOSPHERIC ENERGY CR MEGA PACKET
Base your answers to questions 14 through 16 on the experiment description and diagram below.
A student was interested in how the angle of insolation affects absorption of radiation. Thestudent took three black metal plates, each containing a built-in thermometer, and placed them atthe same distance from three identical lamps. The plates were tilted so that the light from thelamps created three different angles of incidence with the center of the plates, as shown in thediagram. The starting temperatures of the plates were recorded. The lamps were turned on for 10minutes. Then the final temperatures were recorded.
14. The metal plate at a 90° angle of incidence represents a location on Earth at solar noon on March 21.What is the latitude of this location?
15. How would the final temperatures of the three metal plates be different if the experiment wasrepeated using white metal plates? Explain why the white plates would have these final temperatures.
16. Explain why the metal plate at a 90° angle of incidence had a final temperature higher than the othertwo plates.
ATMOSPHERIC ENERGY CR MEGA PACKET
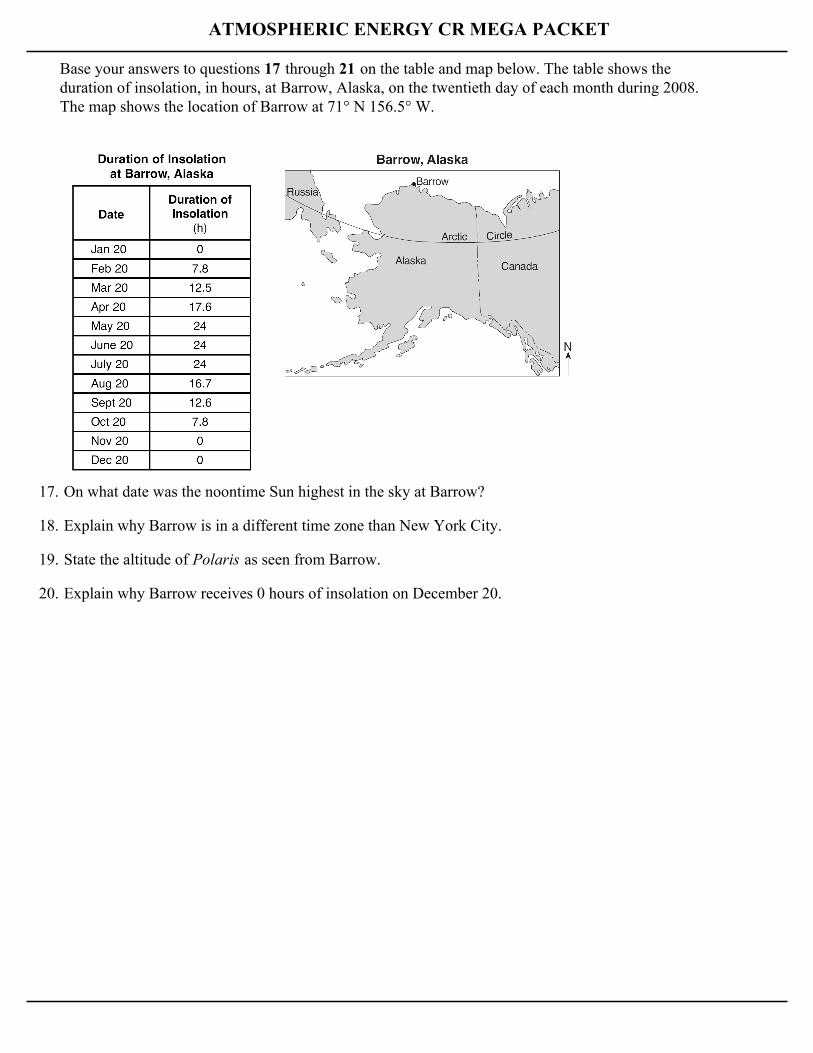
Base your answers to questions 17 through 21 on the table and map below. The table shows theduration of insolation, in hours, at Barrow, Alaska, on the twentieth day of each month during 2008.The map shows the location of Barrow at 71° N 156.5° W.
17. On what date was the noontime Sun highest in the sky at Barrow?
18. Explain why Barrow is in a different time zone than New York City.
19. State the altitude of Polaris as seen from Barrow.
20. Explain why Barrow receives 0 hours of insolation on December 20.

ATMOSPHERIC ENERGY CR MEGA PACKET
21. On the grid below, construct a line graph by plotting the data for the duration of insolation at Barrowfor each date shown on the data table. Connect the plots with a line.
Base your answers to questions 22 and 23 on the diagram below, which shows incoming solarradiation passing through the glass of a greenhouse and then striking the floor.
22. Describe one way the glass in the greenhouse acts like the greenhouse gases in Earth's atmosphere.
23. Some of the incoming solar radiation is absorbed by the floor. Identify the type of electromagneticenergy reradiated by the floor.

ATMOSPHERIC ENERGY CR MEGA PACKET
24. Base your answer to the following question on the field map below. The field map showstemperatures, in degrees Fahrenheit, taken at several locations on a blacktop parking lot in New YorkState. The temperatures were recorded at 11:00 a.m. in early June.
On the field map above, draw the 70°F and 80°F isotherms. The isotherms should be extended to theedges of the map.

ATMOSPHERIC ENERGY CR MEGA PACKET
Base your answers to questions 25 through 28 on the model and data table shown below. A studentconstructed a model to demonstrate how water is recycled by natural processes on Earth. The modelconsisted of a clear plastic tent over a pan containing a bowl of water. The model was sealed so no aircould enter or leave the tent. The data table shows the observations recorded when the model wasplaced in direct sunlight for 60 minutes.

ATMOSPHERIC ENERGY CR MEGA PACKET
25. A student glues a Y-shaped piece of plastic, as shown below, near the top of the inside of the tent andrepeats the demonstration. Drops of water are seen dripping from the bottom of the Y after 60minutes. Which process of the water cycle is represented by the dripping water?
26. If the model is changed and the bowl of water is replaced with a green plant, by which process wouldthe plant supply water vapor to the air inside the tent?
27. How much heat energy, in joules per gram, is released as water droplets are formed on the insidewalls of the tent?
28. Identify the process that caused the water level in the bowl to decrease.
ATMOSPHERIC ENERGY CR MEGA PACKET
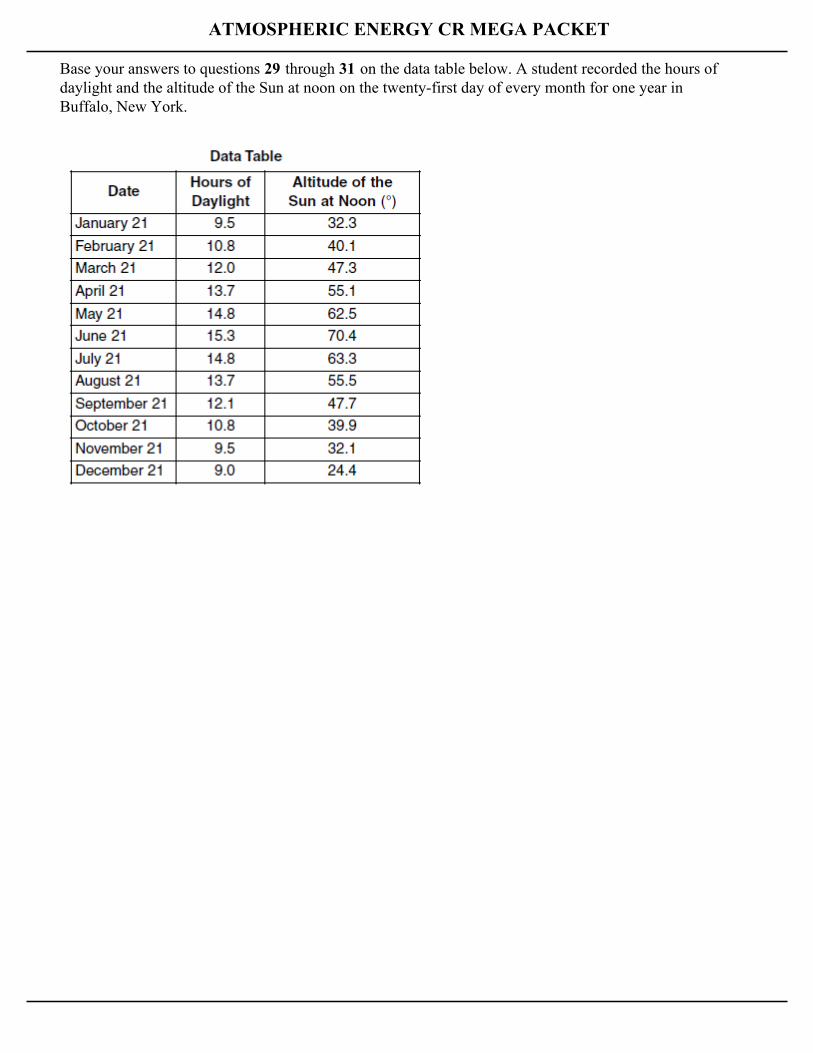
Base your answers to questions 29 through 31 on the data table below. A student recorded the hours ofdaylight and the altitude of the Sun at noon on the twenty-first day of every month for one year inBuffalo, New York.

ATMOSPHERIC ENERGY CR MEGA PACKET
29. On the same sky model above, place an asterisk (*) at the apparent position of the North Star as seenfrom Buffalo.

ATMOSPHERIC ENERGY CR MEGA PACKET
30. The sky model diagram above shows the apparent path of the Sun on March 21 for an observer inBuffalo, New York. Draw a line to represent the apparent path of the Sun from sunrise to sunset atBuffalo on May 21. Be sure your path indicates the correct altitude of the noon Sun and begins andends at the correct positions on the horizon.
31. On the graph below, draw a line to represent the general relationship between the altitude of the Sunat noon and the number of hours of daylight throughout the year at Buffalo.

ATMOSPHERIC ENERGY CR MEGA PACKET
Base your answers to questions 32 through 34 on the passage below.
Ozone in Earth's Atmosphere
Ozone is a special form of oxygen. Unlike the oxygen we breathe, which is composed of twoatoms of oxygen, ozone is composed of three atoms of oxygen. A concentrated ozone layerbetween 10 and 30 miles above Earth's surface absorbs some of the harmful ultraviolet radiationcoming from the Sun. The amount of ultraviolet light reaching Earth's surface is directly related tothe angle of incoming solar radiation. The greater the Sun's angle of insolation, the greater theamount of ultraviolet light that reaches Earth's surface. If the ozone layer were completelydestroyed, the ultraviolet light reaching Earth's surface would most likely increase human healthproblems, such as skin cancer and eye damage.
32. Assuming clear atmospheric conditions, on what day of the year do people in New York State mostlikely receive the most ultraviolet radiation from the Sun?
33. Explain how the concentrated ozone layer above Earth's surface is beneficial to humans.
34. State the name of the temperature zone of Earth's atmosphere where the concentrated layer of ozonegas exists.
Base your answers to questions 35 and 36 on the data table below, which shows the azimuths ofsunrise and sunset on August 2 observed at four different latitudes. Azimuth is the compass directionmeasured, in degrees, along the horizon, starting from north.
35. State the relationship at sunrise between the latitude and the azimuth.

ATMOSPHERIC ENERGY CR MEGA PACKET
36. On the outer edge of the azimuth circle below, mark with an X the positions of sunrise and sunset for each latitude shown in the data table. Write the correct letter code beside each X. The positions ofsunrise and sunset for 30° N have been plotted and labeled with letters A and B.

ATMOSPHERIC ENERGY CR MEGA PACKET
Base your answers to questions 37 through 40 on the diagram below, which shows Earth as seen fromabove the North Pole. The curved arrows show the direction of Earth's motion. The shaded portionrepresents the nighttime side of Earth. Some of the latitude and longitude lines have been labeled.Points A and B represent locations on Earth's surface.
37. Explain why the angle of insolation at solar noon is greater at point B than at point A.
38. Identify one possible date that is represented by the diagram.
39. If it is 4:00 p.m. at point B, what is the time at point A?
40. On the diagram above, draw a curved arrow, starting at point B, showing the general direction thatplanetary surface winds flow between 30° N and 60° N latitude.

ATMOSPHERIC ENERGY CR MEGA PACKET
41. The diagram below represents a beaker of water that is being heated. As the colored dye pelletdissolves, the dye will show the movement of water in the beaker. On the diagram, draw arrows inthe water to show the direction the colored dye will move when the water is heated as shown.
Earth Science
Name _________________ Class _________________ Date _________
1.2.3.4.5.6.7.8.9.10.11.12.13.14.15.16.17.18.19.20.21.22.23.24.25.26.27.28.29.30.31.32.33.34.35.
36.37.38.39.40.41.