atomic force microscopy to study intermolecular forces...
TRANSCRIPT
Atomic Force Microscopy to Study Intermolecular Forces and Bonds Associated with Bacteria Steven K. Lower (2011) Advances in Experimental Medicine and Biology 715: 285-299. DOI 10.1007/978-94-007-0940-9_18

Chapter 18Atomic Force Microscopy to StudyIntermolecular Forces and Bonds Associatedwith Bacteria
Steven K. Lower
Abstract Atomic force microscopy (AFM) operates on a very different principlethan other forms of microscopy, such as optical microscopy or electron microscopy.The key component of an AFM is a cantilever that bends in response to forces thatit experiences as it touches another surface. Forces as small as a few picoNewtonscan be detected and probed with AFM. AFM has become very useful in biologicalsciences because it can be used on living cells that are immersed in water. AFM isparticularly useful when the cantilever is modified with chemical groups (e.g. amineor carboxylic groups), small beads (e.g. glass or latex), or even a bacterium. Thischapter describes how AFM can be used to measure forces and bonds between abacterium and another surface. This paper also provides an example of the use ofAFM on Staphylococcus aureus, a Gram-positive bacterium that is often associatedwith biofilms in humans.
18.1 Introduction to AFM
In most microbiology laboratories, students are taught how to culture bacteria inenclosed vessels that contain nutrient broth. The growth cycle of a bacteria popula-tion is determined by measuring the optical density of cell suspensions. However,most bacteria do not naturally live as suspended entities within a solution. In nature,most bacteria live attached to or in contact with a solid surface (Parsek and Fuqua,2004; Watnick and Kolter, 2000; Whitman et al., 1998). The planktonic mode of lifeis simply a means to move from one surface to another.
What forces allow a bacterium to make contact with an inorganic surface? Howdoes a bacterium form a bond with a protein-coated material? It wasn’t until veryrecently that we were able to directly probe the interface between a mineral or
S.K. Lower (B)Ohio State University, Columbus, OH 43210, USAe-mail: [email protected]
285D. Linke, A. Goldman (eds.), Bacterial Adhesion, Advances in ExperimentalMedicine and Biology 715, DOI 10.1007/978-94-007-0940-9_18,C© Springer Science+Business Media B.V. 2011

286 S.K. Lower
Fig. 18.1 (Left) Image of living Staphylococcus aureus on a glass slide immersed in a salinebuffer. This image was collected with an AFM. The image size is 25 μm × 25 μm. (Right) Opticalmicrograph that shows the positions of the AFM cantilever and tip (square pyramid near end ofcantilever) as well as cocci-shaped S. aureus cells on the glass slide. The bacteria are blurredbecause the plane of focus is on the AFM tip. Scale bar is approximately 10 μm
material and a living bacterium. The invention of the atomic force microscope(AFM) (Binnig et al., 1986) opened the door to investigations into the fundamentalforces and bonds that control how a bacterium interacts with a solid surface.
Figure 18.1 shows the Gram-positive bacteria Staphylococcus aureus on a silicasurface, that is, a glass slide. This image was collected by scanning a relatively sharpAFM tip over the S. aureus cells (see right image in Fig. 18.1). Images like thisAFM micrograph provide a visual depiction of a bacterium in contact with anothersurface. However, the actual interface is hidden from view. One would need to probeunder the bacterium to reveal the true region of interest.
Intermolecular forces, such as van der Waals, electrostatic, solvation, and stericinteractions (Leckband and Israelachvili, 2001), control how a bacterium’s cell wallphysically interacts with another surface. The small magnitude of these forces andthe small length scale over which they operate make it a challenge to probe theseforces. AFM has the force- and space-sensitivity to accomplish this task. The firstpapers describing the use of AFM to study adhesion forces of bacteria began toappear in the literature about a decade ago (Camesano and Logan, 2000; Loweret al., 1999, 2000; Razatos et al., 1998). Since then, AFM has been used countlesstimes to study the fundamental forces that direct adhesion and biofilm formation.
This chapter provides readers with a brief overview of AFM. For a more exten-sive review of AFM the reader is referred to the following publications: (Cappellaand Dietler, 1999; Kendall and Lower, 2004; Yongsunthon and Lower, 2006). Thischapter also provides examples to illustrate how AFM can be used to study (i)forces as a bacterium approaches a surface, and (ii) bonds that may rupture as abacterium is pulled away from the surface. These examples will draw primarilyupon my knowledge and experience with S. aureus.

18 Atomic Force Microscopy 287
18.2 The Main Components of AFM
AFM is a scanning probe microscopy instrument that consists of a force-sensingcantilever, a piezoelectric scanner, and a photodiode detector (Fig. 18.2). The can-tilever bends upwards due to repulsive forces, or downwards due to attractiveforces, between a sample (e.g. a bacterium) and a small tip that is an integratedpart of the end of the cantilever. The deflection of the cantilever is monitoredby reflecting a laser off the top of the free-end of the cantilever and into thephotodetector.
The cantilever behaves like a spring such that the force (F in Newtons) acting onthe cantilever tip is given by Hooke’s Law F = – (Ksp) (x), where Ksp is the cantileverspring constant (N m–1) and x is the deflection of the free-end of the lever (in m). Thepiezoelectric scanner moves the fixed-end of the cantilever towards and away fromthe sample (see Fig. 18.2), or in some systems the sample moves towards or awayfrom the cantilever. In essence, the piezoelectric scanner allows one to preciselycontrol the formation and subsequent destruction of a contact event between twosurfaces. Simultaneously, the optical lever detection system of the AFM allows thequantitative measure of forces between the two surfaces.
This chapter will focus primarily on the one-dimension “force curves” that aregenerated as a cantilever tip is brought into contact with a bacterium and then pulledaway from the bacterium. It is important to note that AFM can also be used tocreate a three-dimensional topographic image like the one shown in Fig. 18.1. This
Fig. 18.2 Schematic diagram showing the key components of an AFM. A piezoelectric scanner(not shown) moves the “fixed end” of the cantilever relative to the sample (cell or substrate). Forcesbetween the sample and tip cause the “free end” of the cantilever to deflect or bend. The behaviourof the cantilever is monitored by tracking a laser beam reflected off the top side of the cantileverand onto a photodetector. One can use this setup to measure forces as the tip approaches, makescontact with, and is subsequently retracted from the sample. A topographic image of the samplecan also be collected by laterally scanning the tip across the sample while measuring the deflectionof the cantilever
288 S.K. Lower
is accomplished by monitoring the vertical deflection of the cantilever as the tip isscanned laterally across the sample.
18.2.1 Modification of AFM Cantilever and Tipfor Biological Experiments
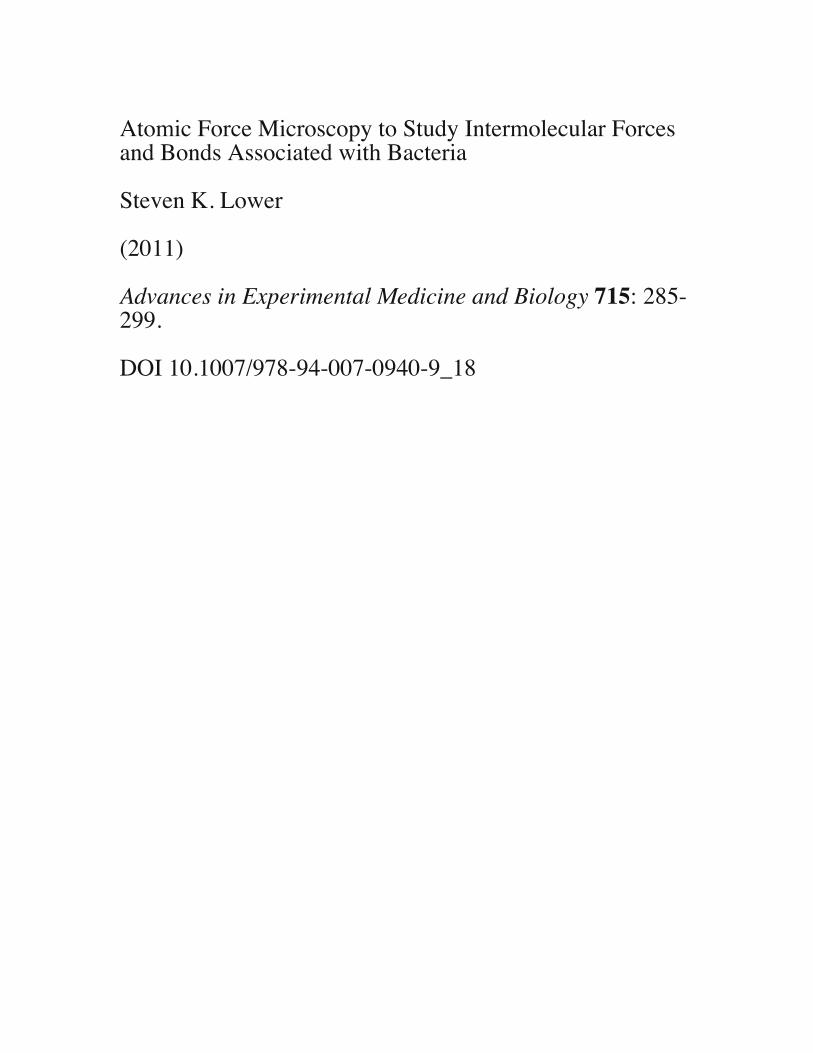
Commercially available force-transducing cantilevers may be V-shaped siliconnitride levers or single beam silicon levers (Albrecht et al., 1990; Tortonese, 1997).However, these materials may not be the most interesting substrates for microbi-ological investigations. Therefore, the cantilever (or tip) is often modified prior touse. For example, the tip may be functionalised with various chemical groups (Noyet al., 1997). Small (2–10 μm radius) beads may be glued to the end of an AFMcantilever (Ducker et al., 1991, 1992). Living cells can even be linked to the end ofan AFM cantilever (Lower et al., 2000, 2001b).
Figure 18.3 shows a glass bead, approximately 10 μm in diameter, on the end ofthe AFM cantilever. The tip is still visible in this image, although its size (∼4 μm)means that a sample will interact with the bead rather than the tip. Figure 18.3 alsoshows a bacteria-coated bead on the end of an AFM cantilever. These cells on theend of the cantilever are living (Lower et al., 2000). A single bacterium can also beattached to an AFM tip (Jericho et al., 2004; Lower et al., 2001b).
It is important to note that a cantilever’s nominal spring constant (N m–1), asquoted by the manufacturer, can vary significantly from the actual value (Sendenand Ducker, 1994). Therefore, one should always calibrate the spring constantof a cantilever. There are a number of methods including the Cleveland method(Cleveland et al., 1993), the hydrodynamic drag method (Craig and Neto, 2001),and the resonant frequency method (Hutter and Bechhoefer, 1993).
Fig. 18.3 (Left) Scanning electron microscopy image of a glass bead that is attached to the free endof the cantilever. (Right) Optical micrograph of a bacteria-coated bead on the end of the cantilever.The cells are expressing an intracellular green fluorescent protein so that they can be visualised onthe cantilever
18 Atomic Force Microscopy 289
18.2.2 Collection and Analysis of Force Data
Each force curve consists of two parts: approach of the tip toward the sample and thesubsequent retraction of the tip from the sample. The rate of the approach-retractioncycle may be controlled by the operator. A typical approach-retraction curve takesabout 1 s.
In raw form, AFM force data are measured as (i) the output voltage from a pho-todiode detector in response to the deflection of the cantilever deflection, and (ii)the displacement (or movement) of the cantilever relative to the sample. To convertthe raw measurements into meaningful physical quantities, the photodiode outputvoltage must be converted to force values and the displacement must be convertedto distance or separation between the tip and sample.
18.2.2.1 Converting Photodetector Voltage into Force Values
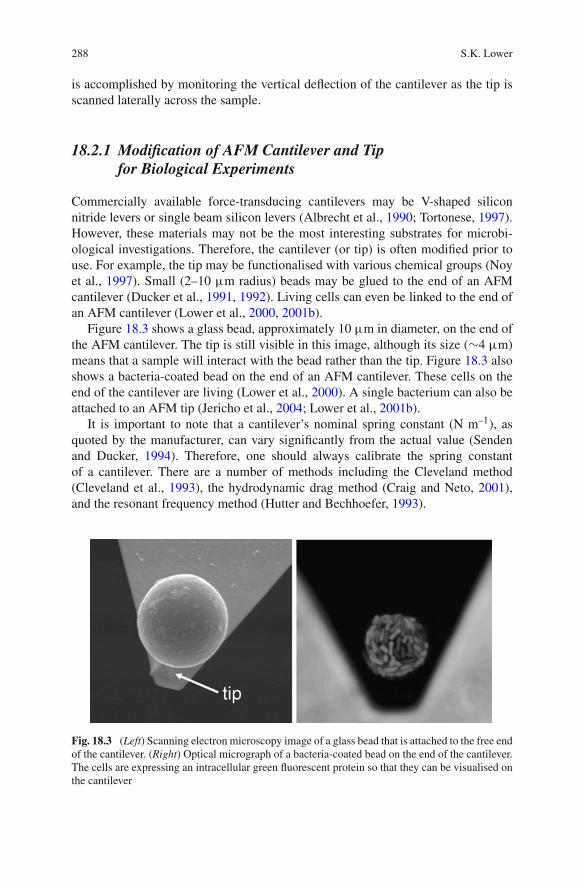
The photodiode output signal, which is related to the position of the reflected laserspot (see Fig. 18.2), is measured in volts. These voltages correspond to the upwardsor downwards movement of the free end of the cantilever in response to repulsive orattractive forces between the tip and sample. Detector voltage measurements mustbe converted into force values using the spring constant of the cantilever (N m–1;see above) and a “volts to nm” conversion factor called the optical lever sensitivity(in nm V–1).
The optical lever sensitivity allows the signal from the photodiode detector (involts) to be converted into deflection (in nm) values for the cantilever. When thecantilever is pressed into contact with a hard surface, each unit of piezo movementideally corresponds to an equivalent deflection of the cantilever. The inverse slopeof the region of contact (also referred to as the region of constant compliance) isthe optical lever sensitivity (Fig. 18.4). For the data shown in Fig. 18.4, the opticallever sensitivity is ∼120 nm V–1. Each voltage value is multiplied by the opticallever sensitivity to determine the upwards or downwards deflection of the cantileverin response to repulsive or attractive forces, respectively.
One important point to consider is that this conversion is accurate only if thecantilever itself is the most compliant or flexible component of the system. Thisincludes not only the cantilever but also the sample and any cells or biological poly-mers that may be attached to the cantilever. This criterion may not be met for manysoft materials such as biological cells. Therefore, it is best to calibrate the opticallever sensitivity on bare glass prior to measuring forces on bacteria that are depositedon the same piece of bare glass.
Once the photodiode signal (V) is converted into the deflection of the can-tilever (m), the spring constant (N m–1) is used to convert the deflection values intoforce data (N). The region of no contact is defined as zero force (see Fig. 18.4).Any value above this line (i.e. positive) indicates repulsion whereas any valuebelow this line (i.e. negative) indicates attractive forces between the tip andsample.

290 S.K. Lower
Fig. 18.4 (Top) The approach (dotted) and retraction (solid) curves for an AFM tip on a hardsubstrate. The y-axis shows the raw voltage output of the photodetector in response to the deflectionof the free-end of the cantilever. The x-axis shows the vertical movement of the piezoelectricscanner, which translates the fixed-end of the cantilever. In the region of contact, each unit of piezomovement results in equivalent cantilever deflection (e.g. the cantilever deflects 1 nm if the piezomoves 1 nm). The inverse slope in this region yields the optical lever sensitivity, ∼120 nm V–1,which is a measure of how the photodetector responds to the flexure of the cantilever. (Bottom) Thephotodetector output (top plot) was converted to cantilever deflection (in nm) which in turn wasconverted to force, assuming a spring constant of 0.01 nN/nm. The piezo movement was correctedto account for deflection of the cantilever and yields the separation between tip and sample. Byconvention, repulsive forces are positive and attractive forces negative. The “jump-from” or “jump-to” contact features result from the mechanical instability of the cantilever relative to the forces itis probing. Jump-from contact features can be seen in retraction curves when the cantilever springconstant exceeds the actual force gradient at the tip-glass interface (Ksp label on bottom figure).Jump-to contact features may be present in approach data when the actual force gradient exceedsthe spring constant of the cantilever (see distance from 0 to 10 nm in approach curve in the bottomfigure)
18.2.2.2 Converting Piezoelectric Scanner Movement into Separation values
The movement of the piezoelectric scanner must be corrected by the deflection ofthe free end of the cantilever to obtain an absolute separation distance betweena sample (e.g. a cell attached to a substrate) and the tip on the cantilever. The

18 Atomic Force Microscopy 291
separation between the tip and sample can be determined once the photodiode signalis converted into deflection values for the cantilever. Absolute separation is deter-mined by correcting the movement of the piezoelectric scanner by the cantileverdeflection. For example, if the piezoelectric scanner moves the cantilever 10 nmtowards the sample, but the free end of the cantilever deflects upwards by 2 nm, theactual separation has changed by only 8 nm (Fig. 18.4).
The origin of the separation axis (i.e. distance of zero) is defined by using “jump-to-contact” and “jump-from-contact” events for approach and retraction curves,respectively (see Fig. 18.4). In instances where only repulsive forces are measured(i.e. no jump to/from contact) it is more difficult to define a separation distance ofzero. This is typically accomplished by defining the initial point on the region ofcontact as the origin of the separation axis.
18.3 Examples of AFM Force Measurements on Living Bacteria
In the late 1990s, a few groups of researchers began to use AFM to study forcesassociated with bacterial adhesion (Camesano and Logan, 2000; Lower et al., 1999,2000; Razatos et al., 1998). Since then there have been countless publications inwhich AFM has been used to probe forces and bonds associated with bacteria. Overthe years, a number of researchers have led this effort, including Terrance Beveridge,Terri Camesano, Yves Dufrene, and the current author. Below I will provide twoexamples to illustrate how AFM can be used to gain a unique perspective of theforces, bonds, and macromolecules that operate at the interface between a bacteriumand another surface.
18.3.1 Intermolecular Forces as Staphylococcus aureus Comesinto Contact with Silica (SiO2)
Quartz (SiO2), or its amorphous form silica, is probably the most common surfacethat bacteria encounter in nature. This is mainly due to the fact that the two ele-ments silicon and oxygen make up 74 wt% (95 vol%) of the Earth’s crust (Kleinand Hurlbut, 1985). On an atomic scale, the Earth’s crust consists of a packing ofoxygen atoms with interstitial metal ion, mainly Si. Quartz and silica are also foundwithin humans in the form of implanted medical devices, like catheters for example.Bacteria are known to form infectious biofilms on such surfaces. Finally, silica glassslides are the substrate of choice for viewing bacteria with an optical microscope.
AFM can be used to measure the attractive or repulsive intermolecular forces thata bacterium experiences as it approaches a surface of quartz or silica. The follow-ing discussion will show force-distance curves that were collected between a glassbead attached to the end of a cantilever (Fig. 18.3, left panel), and living cells ofS. aureus, which were sitting on a glass slide (Fig. 18.1, right panel). The observedforce-distance relationship will be compared to theoretical models of two important
292 S.K. Lower
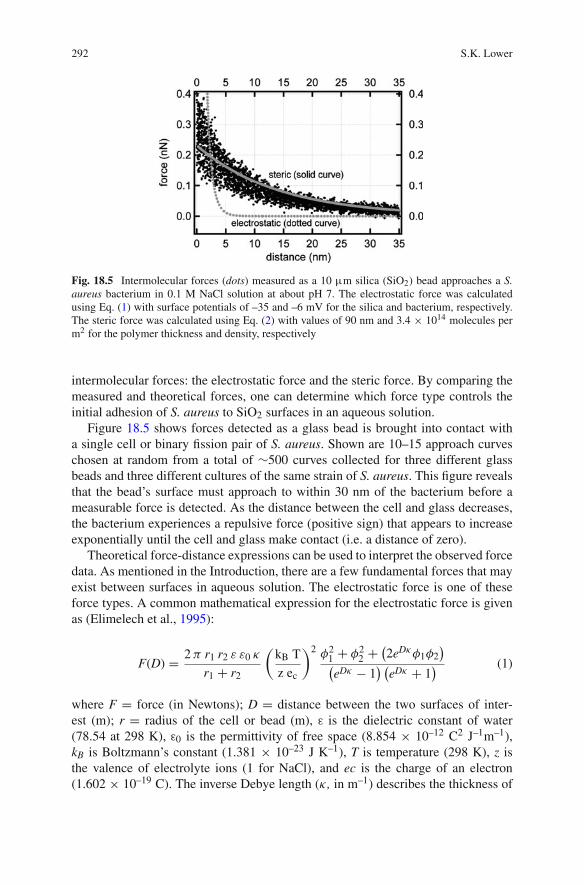
Fig. 18.5 Intermolecular forces (dots) measured as a 10 μm silica (SiO2) bead approaches a S.aureus bacterium in 0.1 M NaCl solution at about pH 7. The electrostatic force was calculatedusing Eq. (1) with surface potentials of –35 and –6 mV for the silica and bacterium, respectively.The steric force was calculated using Eq. (2) with values of 90 nm and 3.4 × 10¹⁴ molecules perm2 for the polymer thickness and density, respectively
intermolecular forces: the electrostatic force and the steric force. By comparing themeasured and theoretical forces, one can determine which force type controls theinitial adhesion of S. aureus to SiO2 surfaces in an aqueous solution.
Figure 18.5 shows forces detected as a glass bead is brought into contact witha single cell or binary fission pair of S. aureus. Shown are 10–15 approach curveschosen at random from a total of ∼500 curves collected for three different glassbeads and three different cultures of the same strain of S. aureus. This figure revealsthat the bead’s surface must approach to within 30 nm of the bacterium before ameasurable force is detected. As the distance between the cell and glass decreases,the bacterium experiences a repulsive force (positive sign) that appears to increaseexponentially until the cell and glass make contact (i.e. a distance of zero).
Theoretical force-distance expressions can be used to interpret the observed forcedata. As mentioned in the Introduction, there are a few fundamental forces that mayexist between surfaces in aqueous solution. The electrostatic force is one of theseforce types. A common mathematical expression for the electrostatic force is givenas (Elimelech et al., 1995):
F(D) = 2π r1 r2 ε ε0 κ
r1 + r2
(kB T
z ec
)2 φ21 + φ2
2 + (2eDκφ1φ2
)(eDκ − 1
) (eDκ + 1
) (1)
where F = force (in Newtons); D = distance between the two surfaces of inter-est (m); r = radius of the cell or bead (m), ε is the dielectric constant of water(78.54 at 298 K), ε0 is the permittivity of free space (8.854 × 10⁻¹² C2 J–1m–1),kB is Boltzmann’s constant (1.381 × 10⁻²³ J K–1), T is temperature (298 K), z isthe valence of electrolyte ions (1 for NaCl), and ec is the charge of an electron(1.602 × 10⁻¹⁹ C). The inverse Debye length (κ , in m–1) describes the thickness of

18 Atomic Force Microscopy 293
the electrostatic double layer of counter-ions that surrounds charged particles (glassbead or bacterium) in solution. For monovalent electrolytes (e.g. NaCl) at 298 K, theDebye length (κ–1, in nm) is given by 0.304/(c) –1/2, where c is the concentration ofthe electrolyte (mol L–1). The final parameter is the surface potential (φ) describedas [(zeψ)/(kT)], where ψ is the surface potential of the cell or glass bead (in V) andall other parameters are as described above.
For an aqueous solution at around pH 7 and ionic strength ∼0.1 M, the surfacepotentials of a glass bead and S. aureus are, respectively, –35 mV (Ducker et al.,1992) and –6 mV (Prince and Dickinson, 2003). By using these values in Eq. (1),one may calculate the theoretical electrostatic force between an S. aureus bacteriumand a glass bead. This theoretical force-distance relationship is shown in Fig. 18.5.
The electrostatic force is expected to be repulsive and short range (<5 nm) ina 0.1 M saline solution. While the observed interaction is repulsive, the measuredforces are clearly longer range than expected based solely on electrostatic interac-tions. Therefore, another intermolecular force must also be involved in how thisparticular bacterium interacts with the surface of glass.
Staphylococcus cells, like all bacteria, have a surface that is studded withbiological polymers. One of the most common biopolymers on S. aureus is β-1,6-linked glucosaminoglycan, also know as the polysaccharide intercellular adhesin(PIA) (Heilmann et al., 1996; Ziebuhr et al., 1997). Polymers such as these causesteric repulsion when they are confined to a narrow space (Israelachvili, 1992;Israelachvili and McGuiggan, 1988; Taylor and Lower, 2008). This repulsion isdriven by a decrease in entropy that occurs when a polymer is no longer free to moveat random. Polymers that are free to move and rotate in random orientations withina solution are in a higher state of disorder relative to the same polymer that has beenconfined to a smaller volume of space. This is precisely what occurs when a poly-mer on a bacterium is confined to a narrowing interface created by an approachingsurface (e.g. a glass bead).
Like the electrostatic force (see Eq. (1)), the steric force (F) has been describedas a function of the distance (D) between two surfaces. This expression, known asthe modified Alexander-de Gennes equation, is given by (Butt et al., 1999; Taylorand Lower, 2008):
F(D) = 50 r kB T L0 �3/2e−2πD/L0 (2)
where r = radius of the cell (m), kB is Boltzmann’s constant (1.381 × 10⁻²³ J K–1),T is temperature (298 K), L0 is the equilibrium thickness of a polymer (in m) on thecell surface, Γ is the surface density of that same polymer on the cell surface (inm–2).
One can determine the theoretical steric force between S. aureus and glass byusing the thickness and surface density of PIA. Staphylococcus have PIA moleculescomposed of at least 130 sugar residues (Mack et al., 1996), which correspondsto a value for L0 of ∼90 nm assuming 0.7 nm per glucose residue (Yongsunthonand Lower, 2006). While not measured directly, the surface density (Γ ) of PIAon a staphylococci cell can be estimated from previous studies (Mack et al.,

294 S.K. Lower
1996; Madigan et al., 2003). Using these references, there are about 4300 PIApolysaccharides per bacterium. For a 2 μm bacterium (i.e. proxy for a fission pairof Staphylococci cells) this is equivalent to approximately 3.4 × 10¹⁴ PIA per m2.Using these values for L0 and Γ in Eq. (2) results in a theoretical expression of thesteric force between a Staphylococcus cell and a glass bead (see Fig. 18.5).
Comparing the measured forces to the theoretical models reveals that the stericforce and to a lesser extent the electrostatic force dominate the interactions betweenS. aureus and a glass surface in saline solution. The glass substrate must be within30 nm of the bacterium surface before the forces between the two are measurable(above noise). Steric forces then cause the bacterium to be repelled until the cellis within ∼5 nm of the glass. At this close distance, repulsive, electrostatic forcesbegin to impact the final approach.
18.3.2 Bonds that Form Between Staphylococcus aureusand a Silica Surface That Is Coated with a Protein Layer
The above example focuses only on the forces that occur as a cell approachesanother surface. However, adhesion may occur and bonds may form once a cellcomes into contact with another surface. AFM can be used to probe the forcerequired to rupture a bond that forms between a biomolecule on a bacteriumand a reactive site on a material surface. AFM can also be used the probe thebiomechanical properties of cell wall macromolecules.
The following discussion will show force-distance curves that were collected as aprotein coated probe was pulled from contact with living cells of S. aureus. For thesemeasurements, the AFM tip was coated with fibronectin (Fn), a human protein thatcommonly coats implanted medical devices. The measured force-distance curveswill be compared to a worm-like chain model, which predicts the force-distance tra-jectory for a protein that is mechanically perturbed into an unfolded conformation.By comparing the measured and theoretical forces, one can identify an adhesin andunderstand the intrinsic biomechanical properties of that adhesin.
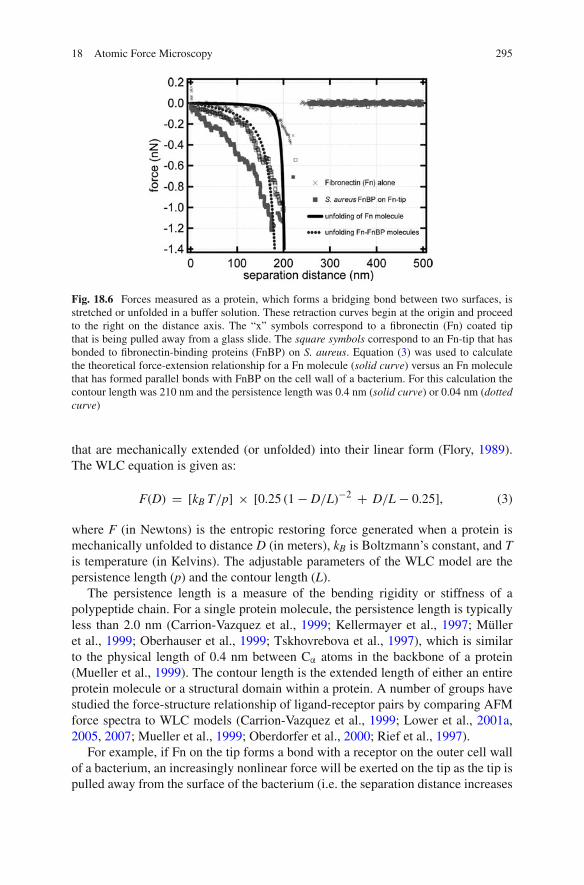
Figure 18.6 shows the force-extension curves for Fn on a glass slide versus Fnin contact with a strain of S. aureus that overexpresses fibronectin-binding protein(FnBP) on its cell wall. Many of these curves exhibit a distinct, non-linear, sawtooth-shaped, force-distance relationship. For example, the Fn molecules (X-symbols inFig. 18.6) unravel to approximately 200 nm where they rupture at a force of ∼0.4nN. This non-linear, sawtooth-shaped feature becomes more pronounced for Fn thathas formed a bond with putative FnBPs on S. aureus.
Such signatures have been attributed to specific binding events mediated by pro-teins (Carrion-Vazquez et al., 1999; Lower et al., 2001a, 2005; Mueller et al., 1999;Müller et al., 1999; Oberdorfer et al., 2000; Oberhauser et al., 1999; Rief et al.,1997). The shape profile of the binding event can be explained by the unfoldingmechanics of the bound protein. The worm-like chain (WLC) model approximatesthe biomechanical force-extension relationship of folded-polymers (e.g. proteins)
18 Atomic Force Microscopy 295
Fig. 18.6 Forces measured as a protein, which forms a bridging bond between two surfaces, isstretched or unfolded in a buffer solution. These retraction curves begin at the origin and proceedto the right on the distance axis. The “x” symbols correspond to a fibronectin (Fn) coated tipthat is being pulled away from a glass slide. The square symbols correspond to an Fn-tip that hasbonded to fibronectin-binding proteins (FnBP) on S. aureus. Equation (3) was used to calculatethe theoretical force-extension relationship for a Fn molecule (solid curve) versus an Fn moleculethat has formed parallel bonds with FnBP on the cell wall of a bacterium. For this calculation thecontour length was 210 nm and the persistence length was 0.4 nm (solid curve) or 0.04 nm (dottedcurve)
that are mechanically extended (or unfolded) into their linear form (Flory, 1989).The WLC equation is given as:
F(D) = [kB T/p] × [0.25 (1 − D/L)−2 + D/L − 0.25], (3)
where F (in Newtons) is the entropic restoring force generated when a protein ismechanically unfolded to distance D (in meters), kB is Boltzmann’s constant, and Tis temperature (in Kelvins). The adjustable parameters of the WLC model are thepersistence length (p) and the contour length (L).
The persistence length is a measure of the bending rigidity or stiffness of apolypeptide chain. For a single protein molecule, the persistence length is typicallyless than 2.0 nm (Carrion-Vazquez et al., 1999; Kellermayer et al., 1997; Mülleret al., 1999; Oberhauser et al., 1999; Tskhovrebova et al., 1997), which is similarto the physical length of 0.4 nm between Cα atoms in the backbone of a protein(Mueller et al., 1999). The contour length is the extended length of either an entireprotein molecule or a structural domain within a protein. A number of groups havestudied the force-structure relationship of ligand-receptor pairs by comparing AFMforce spectra to WLC models (Carrion-Vazquez et al., 1999; Lower et al., 2001a,2005, 2007; Mueller et al., 1999; Oberdorfer et al., 2000; Rief et al., 1997).
For example, if Fn on the tip forms a bond with a receptor on the outer cell wallof a bacterium, an increasingly nonlinear force will be exerted on the tip as the tip ispulled away from the surface of the bacterium (i.e. the separation distance increases

296 S.K. Lower
from left to right in a force-distance profile). This process causes the mechanicalunfolding of the protein(s) bridging the bacterium to the AFM tip. At some distancefrom the surface, the force exerted by the tip’s spring constant will exceed the toler-ance of the ligand/receptor interaction, and the bond will break or the load-bearingdomain will unravel. At this point, the tip will “snap” back to its index position,producing a sawtooth-shaped profile or waveform.
Figure 18.6 (solid black curve) shows the WLC force-extension relationship for525 amino acids (L = 210 nm) at the N-terminal domain of Fn. This is the regionof Fn that binds to FnBP on S. aureus (Foster and Höök, 1998; Greene et al., 1995;Schwarz-Linek et al., 2004). The WLC prediction compares well with the forcespectra corresponding to an Fn-coated tip on a glass substrate (Fig. 18.6). There isa nonlinear force-distance (or force-extension) relationship until the Fn breaks freeof the glass slide at an extension distance of ∼200 nm, which corresponds to theextended length of the N-terminal domains on Fn.
The WLC model can also be used to explain what happens when FnBP on S.aureus forms a bond with Fn molecules on the AFM tip. Parallel bonds that formalong the length of Fn and FnBP would cause a stiffening (i.e. decreasing persistencelength, p, in Eq. (3)) of the protein–protein bond. Figure 18.6 (dotted black curve)shows the hypothetical sawtooth-shaped binding profile for FnBP that forms parallelbonds with the N-terminal region of Fn. For this curve the persistence length wasset at 0.04 nm, which is smaller than the physical dimension of an amino acid.
Others have attributed such small values for persistence length to a responsecaused by multiple protein chains acting in parallel (Bemis et al., 1999; Dugdaleet al., 2005, 2006; Higgins et al., 2002; Kellermayer et al., 1997; Lee et al., 2006).For example, ten protein chains in parallel, each with the same contour length, wouldexert a force ten times that of a single chain. Fitting this response by a single chainmodel, such as the WLC, would result in one-tenth the true persistence length value.This may be the situation for S. aureus FnBP as other studies suggest that one FnBPhas the capacity to bind to multiple copies (2–9) of Fn (Fröman et al., 1987; Huffet al., 1994).
18.3.3 Other Uses of AFM: Loading Rate and Affinity Maps
The two examples above provide only small glimpses into the possibilities that AFMoffers to investigators who wish to explore the interface between a living bacteriumand another surface. Recently, it was demonstrated that individual proteins on thesurface of a living bacterium could be mapped across the cell wall (Lower et al.,2009). This was accomplished by tuning into a specific force-signature, like theone shown in Fig. 18.6. Other researchers have begun to use AFM to study thefundamental binding properties (e.g. dissociation rate constant) of protein bonds.These investigations rely upon the fact that the rupture force of a ligand–receptorpair should depend upon the loading rate (N s–1) of the bond (Bell, 1978; Evans,2001). The loading rate of a bond can be easily manipulated with the AFM by simply

18 Atomic Force Microscopy 297
varying the retraction velocity (m s–1) and spring constant (N m–1) of the cantilever.Benoit et al. (2000) and Hanley et al. (2003) provide an excellent description of thiswork on large eukaryotic cells. This type of research could also be applied to studyfundamental aspects of bacterial adhesion.
References
Albrecht TR, Akamine S, Carver TE, Quate CF (1990) Microfabrication of cantilever styli for theatomic force microscope. J Vac Sci Technol A 8:3386–3396
Bell GI (1978) Models for specific adhesion of cells to cells. Science 200:618–627Bemis JE, Akhremitchev BB, Walker GC (1999) Single polymer chain elongation by atomic force
microscopy. Langmuir 15:2799–2805Benoit M, Gabriel D, Gerisch G, Gaub HE (2000) Discrete interactions in cell adhesion measured
by single-molecule force spectroscopy. Nat Cell Biol 2:313–317Binnig G, Quate CF, Gerber C (1986) Atomic force microscope. Phys Rev Lett 56:930–933Butt HJ, Kappl M, Mueller H, Raiteri R, Meyer W, Ruhe J (1999) Steric forces measured with the
atomic force microscope at various temperatures. Langmuir 15:2559–2565Camesano TA, Logan BE (2000) Probing bacterial electrosteric interactions using atomic force
microscopy. Environ. Sci. Technol. 34:3354–3362Cappella B, Dietler G (1999) Force-distance curves by atomic force microscopy. Surf Sci Rep
34:1–44Carrion-Vazquez M, Oberhauser AF, Fowler SB, Marszalek PE, Broedel SE, Clarke J, Fernandez
JM (1999) Mechanical and chemical unfolding of a single protein: a comparison. Proc NatlAcad Sci USA 96:3694–3699
Cleveland JP, Manne S, Bocek D, Hansma PK (1993) A nondestructive method for determiningthe spring constant of cantilevers for scanning force microscopy. Rev Sci Instrum 64:403–405
Craig VSJ, Neto C (2001) In situ calibration of colloid probe cantilevers in force microscopy:hydrodynamic drag on a sphere approaching a wall. Langmuir 17:6018–6022
Ducker WA, Senden TJ, Pashley RM (1991) Direct measurement of colloidal forces using anatomic force microscope. Nature 353:239–241
Ducker WA, Senden TJ, Pashley RM (1992) Measurements of forces in liquids using a forcemicroscope. Langmuir 8:1831–1836
Dugdale TM, Dagastine R, Chiovitti A, Mulvaney P, Wetherbee R (2005) Single adhesivenanofibers from a live diatom have the signature fingerprint of modular proteins. Biophys J89:4252–4260
Dugdale TM, Dagastine R, Chiovitti A, Wetherbee R (2006) Diatom adhesive mucilage containsdistinct supramolecular assemblies of a single modular protein. Biophys J 90:2987–2993
Elimelech M, Gregory J, Jia X, Williams R (1995) Particle deposition & aggregation: measure-ment, modeling, and simulation. Butterworth-Heinemann, Oxford
Evans E (2001) Probing the relation between force – lifetime – and chemistry in single molecularbonds. Annu Rev Biophys Biomol Struct 30:105–128
Flory PJ (1989) Statistical mechanics of chain molecules. Hanser Publisher, Munich, GermanyFoster TJ, Höök M (1998) Surface protein adhesins of Staphylococcus aureus. Trends Microbiol
6:484–488Fröman G, Switalski LM, Speziale P, Höök M (1987) Isolation and characterization of a fibronectin
receptor from Staphylococcus aureus. J Biol Chem 262:6564–6571Greene C, McDevitt D, Francois P, Vaudaux PE, Lew DP, Foster TJ (1995) Adhesion properties of
mutants of Staphylococcus aureus defective in fibronectin-binding proteins and studies on theexpression of fnb genes. Mol Microbiol 17:1143–1152
Hanley W, McCarty O, Jadhav S, Tseng Y, Wirtz D, Konstantopoulos K (2003) Single moleculecharacterization of P-selectin/ligand binding. J Biol Chem 278:10556–10561

298 S.K. Lower
Heilmann C, Schweitzer O, Gerke C, Vanittanakom N, Mack D, Götz F (1996) Molecular basisof intercellular adhesion in the biofilm-forming Staphylococcus epidermidis. Mol Microbiol20:1083–1091
Higgins MJ, Crawford SA, Mulvaney P, Wetherbee R (2002) Characterization of the adhe-sive mucilages secreted by live diatom cells using atomic force microscopy. Protist 153:25–38
Huff S, Matsuka YV, McGavin MJ, Ingham KC (1994) Interaction of N-Terminal frag-ments of fibronectin with synthetic and recombinant-D motifs from its binding-protein onStaphylococcus aureus studied using fluorescence anisotropy. J Biol Chem 269:15563–15570
Hutter JL, Bechhoefer J (1993) Calibration of atomic-force microscope tips. Rev Sci Instrum64:1868–1873
Israelachvili JN (1992) Intermolecular and surface forces. Academic, LondonIsraelachvili JN, McGuiggan PM (1988) Forces between surfaces in liquids. Science 241:
795–800Jericho SK, Jericho MH, Hubbard T, Kujath M (2004) Micro-electro-mechanical systems
microtweezers for the manipulation of bacteria and small particles. Rev Sci Instrum 75:1280–1282
Kellermayer MSZ, Smith SB, Granzier HL, Bustamante C (1997) Folding-unfolding transitions insingle titin molecules characterized with laser tweezers. Science 276:1112–1116
Kendall TA, Lower SK (2004) Forces between minerals and biological surfaces in aqueoussolution. Adv Agronom 82:1–54
Klein C, Hurlbut CS (1985) Manual of mineralogy. Wiley, New York, NYLeckband D, Israelachvili JN (2001) Intermolecular forces in biology. Quart Rev Biophys 34:
105–267Lee G, Abdi K, Jiang Y, Michaely P, Bennett V, Marszalek PE (2006) Nanospring behaviour of
ankyrin repeats. Nature 440:246–249Lower SK, Hochella MF, Beveridge T (2001a) Bacterial recognition of mineral surfaces: nanoscale
interactions between Shewanella and alpha-FeOOH. Science 292:1360–1363Lower BH, Shi L, Yongsunthon R, Droubay TC, McCready DE, Lower SK (2007) Specific
bonds between an iron oxide surface and outer membrane cytochromes MtrC and OmcA fromShewanella oneidensis MR-1. J Bacteriol 189:4944–4952
Lower SK, Tadanier CJ, Hochella MF (2000) Measuring interfacial and adhesion forces betweenbacteria and mineral surfaces with biological force microscopy. Geochim Cosmochim Acta64:3133–3139
Lower SK, Tadanier CJ, Hochella MF (2001b) Dynamics of the mineral-microbe interface: useof biological force microscopy in biogeochemistry and geomicrobiology. Geomicrobiol J 18:63–76
Lower SK, Tadanier CJ, Hochella MF, Berry DF, Potts M (1999) The bacteria-mineral inter-face: probing nanoscale forces with biological force microscopy. Geol Soc Am Abstr Prog31(7):A394
Lower BH, Yongsunthon R, Shi L, Wildling L, Gruber HJ, Wigginton NS, Reardon CL, PinchukGE, Droubay TC, Boily JF, Lower SK (2009) Antibody recognition force microscopy showsthat outer membrane cytochromes OmcA and MtrC are expressed on the exterior surface ofShewanella oneidensis MR-1. Appl Environ Microbiol 75:2931–2935
Lower BH, Yongsunthon R, Vellano FP, Lower SK (2005) Simultaneous force and fluorescencemeasurements of a protein that forms a bond between a living bacterium and a solid surface. JBacteriol 187:2127–2137
Mack D, Fischer W, Krokotsch A, Leopold K, Hartmann R, Egge H, Laufs R (1996) Theintercellular adhesin involved in biofilm accumulation of Staphylococcus epidermidis is alinear beta-1,6-linked glucosaminoglycan: purification and structural analysis. J Bacteriol178:175–183
Madigan MT, Martinko JM, Parker J (2003) Brock biology of microorganisms. Prentice Hall,Upper Saddle River, NJ

18 Atomic Force Microscopy 299
Mueller H, Butt HJ, Bamberg E (1999) Force measurements on myelin basic protein adsorbedto mica and lipid bilayer surfaces done with the atomic force microscope. Biophys J 76:1072–1079
Müller DJ, Baumeister W, Engel A (1999) Controlled unzipping of a bacterial surface layer withatomic force microscopy. Proc Natl Acad Sci USA 96:13170–13174
Noy A, Vezenov DV, Lieber CM (1997) Chemical force microscopy. Annu Rev Mater Sci 27:381–421
Oberdörfer Y, Fuchs H, Janshoff A (2000) Conformational analysis of native fibronectin by meansof force spectroscopy. Langmuir 16:9955–9958
Oberhauser AF, Marszalek PE, Carrion-Vazquez M, Fernandez JM (1999) Single protein misfold-ing events captured by atomic force microscopy. Nat Struct Biol 6:1025–1028
Parsek MR, Fuqua C (2004) Biofilms 2003: emerging themes and challenges in studies of surface-associated microbial life. J Bacteriol 186:4427–4440
Prince JL, Dickinson RB (2003) Kinetics and forces of adhesion for a pair of capsular/unencapsulated Staphylococcus mutant strains. Langmuir 19:154–159
Razatos A, Ong Y-L, Sharma MM, Georgiou G (1998) Molecular determinants of bacterialadhesion monitored by atomic force microscopy. Proc Natl Acad Sci USA 95:11059–11064
Rief M, Gautel M, Oesterhelt F, Fernandez JM, Gaub HE (1997) Reversible unfolding of individualtitin immunoglobulin domains by AFM. Science 276:1109–1112
Schwarz-Linek U, Höök M, Potts JR (2004) The molecular basis of fibronectin-mediated bacterialadherence to host cells. Mol Microbiol 52:631–641
Senden TJ, Ducker WA (1994) Experimental determination of spring constants in atomic-forcemicroscopy. Langmuir 10:1003–1004
Taylor ES, Lower SK (2008) Thickness and surface density of extracellular polymers onAcidithiobacillus ferrooxidans. Appl Environ Microbiol 74:309–311
Tortonese M (1997) Cantilevers and tips for atomic force microscopy. IEEE Eng Med Biol Mag16:2833
Tskhovrebova L, Trinick J, Sleep JA, Simmons RM (1997) Elasticity and unfolding of singlemolecules of the giant muscle protein titin. Nature 387:308–312
Watnick P, Kolter R (2000) Biofilm, city of microbes. J Bacteriol 182:2675–2679Whitman WB, Coleman DC, Wiebe WJ (1998) Prokaryotes: the unseen majority. Proc Natl Acad
Sci USA 95:6578–6583Yongsunthon R, Lower SK (2006) Force measurements between a bacterium and another surface
in situ. Adv Appl Microbiol 58:97–124Ziebuhr W, Heilmann C, Götz F, Meyer P, Wilms K, Straube B, Hacker J (1997) Detection of
the intercellular adhesion gene cluster (ica) and phase variation in Staphylococcus epidermidisblood culture strains and mucosal isolates. Infect Immun 65:890–896