;atory s1 jrt tey report quehan na issionin gp ‘roject … · mdc mdcr mev mmc min cm mg/m2 mm/y...
TRANSCRIPT

;ATORY S1 QUEHAN ISSIONIN JS, PENNS
JRT NA G P IYL’
TEY REPORT
‘ROJECT VANIA
A.da:ps I
I I I I I I
:itute for Sciencc
further dissemii
? and
natior
Education
1 unlimited.
ORlSE 07-IEAV-0988
CONFIRMATORY SURVEY REPORT FOR THE QUEHANNA DECOMMISSIONING PROJECT
KARTHAUS, PENNSYLVANIA
Prepared by
w. c. Adams
Oak Ridge Institute for Science and Education Oak Ridge, Tennessee 37831-0117
Prepared for the Office of Federal and State Materials and Environmental Management Programs
W.S. Nuclear Regulatory Commission
FINAZ, REPORT
AUGUST 2007
This report is based on work performed under an Interagency Agreement (NRC Fin. No. F1008) between the U.S. Nuclear Regulatory Commission and the U.S. Department of Energy. The Oak Ridge Institute for Science and Education perfonns complementary work under a contract with the U.S. Department of Energy.
Quehanna Decommissiomng Project (QDP) 172G/Reports/2007-0&03 Final Confirmatoty Survey Report
CONFIRMATORY SURVEY REPORT FOR THE QUEHAMVA DECOMMISSIONING PROJECT
KARTHAUS, PENNSYLVANIA
Prepared by: W. C. Adams, Project Leader
Reviewed by: -. .-.
S. J. Roberts, Survey Projects Manager
Reviewed by: - - R. D. Condra, Laboratory Manager
Reviewed by: k?, A. T. Payne, Quality Manaber
Reviewed by: c_ LJ- @L&&?f E. W. Abelquist, Vice-Presided& Director Independent Environmental Assessment and Verification
Date: -LL 8 3 m?
Date: Ej?ln7
Quehanna Decommissioning Project (QDP) 172G/Reports/2007-08-03 Find Cafirmatory Survey Report
ACKNOWLEDGMENTS
The author would like to acknowledge the slgnshcant contributions of the following staff members:
FIELD STAFF
T. L. Brown T. D. Herrera E. Montdvo
LABORATORY STAFF
R. D. Condlra W. P. Ivey J. S. Cox W. F. S m i t h
CLERICAL STAFF
A. Ramsey K. M. Moore
ILLUSTRATOR
T. L. Brown T. D. Herrera
Quehanna Decommissioning Project (QDP) 1726/Rep0~t~/2007-0803 Final Confirmatory Survey Report
TABLE OF CONTENTS
PAGE
Table of Contents ............................................................................................................................................... i
List of Flgures ............................................,................# ....................................................................................... ii
List of Tables ................................................... 1 ................................................................................................. IU
Abbreviations and Acronyms ......................................................................................................................... iv
Introduction and Site History .......................................................................................................................... 1
Site Description ................................................................................................................................................. 4
Objectives ........................................................................................................................................................... 4
Document Review ............................................................................................................................................. 4
Procedures .......................................................................................................................................................... 5
Sample Analysis and Data Interpretation ...................................................................................................... 8
Findtngs and Results ......................................................................................................................................... 8
Comparison of Results with Guidelines ........................................................................................................ 9
...
summary ........................................................................................................................................................... 10
Figures ................................................................................................................................................................ 11
Tables ................................................................................................................................................................. 26
References .......................................................................................................................................................... 31
Appendices:
Appendix A: Miscellaneous Sample Locations
Appendix B: Major Instrumentation
Appendix C: Survey Procedures
Quehanna Decommissioning Project (QDP) i 1726/Reports/2007-08-03 Find Confirmatory Survey Report
LIST OF FIGURES
FIGURE 1: Location of the Quehanna Facility.Karthaus. Pennsylvania ........................................ 12
FIGURE 2: Plot Plan of the Quehanna Facility--Karthaus. Pennsylvania ....................................... 13
FIGURE 3:
FIGURE 4:
Quehanna Facility Floor Plan ............................................................................................. 14
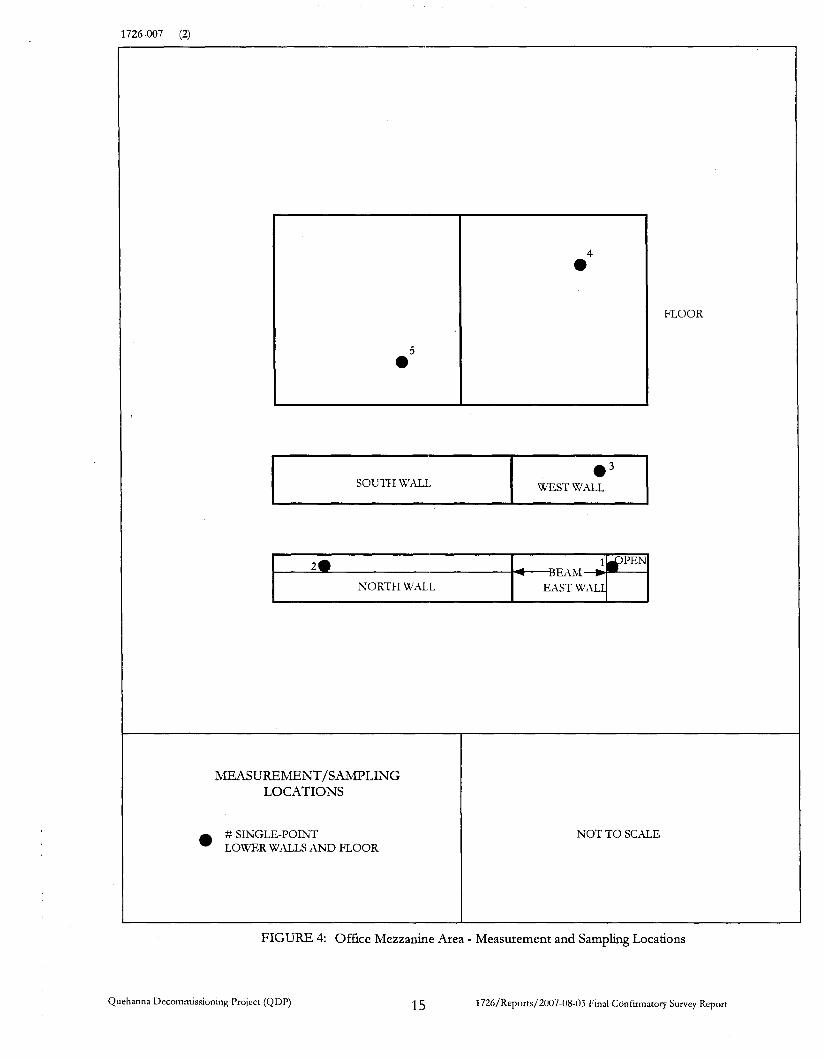
Office Mezzanine Area-Measurement and Sampling Locations ................................. 15
FIGURE 5: Service Area. South Wall-Measurement and Sampling Locations .............................. 16
FIGURE 6:
FIGURE 7:
FIGURE 8:
Chem Lab and Decon Room Walls-Measurement and Sampling Locations ............ 17
Service Area Vestibule-Measurement and Sampling Locations .................................. 18
Admin Area. North and East Walls-Measurement and Sampling Locations ............ 19
FIGURE 9: Reactor Bay. North and South Walls-Measurement and Sampling Locations .......... 20
FIGURE 10:
FIGURE 11:
Boiler Room Walls-Measurement: and Sampling Locations ........................................ 21
Old Dock and Hydroblast Room-Measurement and Sampling Locations ............... 22
FIGURE 12: Finishing Area Walls-Measurement and Sampling Locations ..................................... 23
FIGURE 13: Finishing Area Office. Electrical R.oom, Bunker Office and Tool Crib Walls-Measurement and Sampling Locations ................................................................ 24
FIGURE 14: Waste Water Treatment Building-Measurement and Sampling Locations ................ 25
Quehanna Decommissioning Project (QDP) 11 1726/Rep0aS/ZOO7-OS-O3 Final Conhrmatoq S ~ r r v Report

LIST OF TABLES
TABLE 1:
TABLE 2:
TABLE 3:
Survey Unit Scan Percentages .............................................................................................. 6
Range of S d a c e Activity Measurements .......................................................................... 9
Derived Concentration Guideline Levels from Quehanna Decommissioning 10 Project DP ............................................................................................................................
TABLE 4:
TABLE 5:
Surface Activity Measurements ......................................................................................... 27
Radionuclide Concentrations in Miscellaneous Samples ............................................... 30
Quehanna Dec&ssi&g Project (QDP) ... 1726/Reposts/2007-08-03 Final Cdirmatory Sun.ey w o r t 111

ABBREVIATIONS AND ACRONYMS
bl d’
El
E,
E,, AEC ARC BKG CFR
cm2 CO-60 cpm CS-137 cwc D&D DCGL DCNR DOE DP dpm/100 cm2 ESL FA FSS FSSP FSSR GM ha ISM I S 0 ITP keV k m LLRW m MAPEP MARSSIM MDC MDCR MeV MMC min
cm
m g / m 2 m m / y
number of background counts in the interval index of sensitivity instrument efficiency surface efficiency total efficiency U.S. Atomic Energy Commission Atlantic-Rrchfield Corporation background Code of Federal Regulations centimeter square centimeters
counts per minute cesium-1 37 Curtis-Wnght Corporation decontamination and decommissioning derived coricentration guideline level Department of Conservation and Natural Resources U.S. Department of Energy decommissioning plan disintegrations per minute per 100 square centimeters EnergyJohtions, LLC Finishing Area final status survey final status survey plan hnal status survey report Geiger-Muller hectare integrated safety management International Organization for Standardization Intercomparison Testing Program kiloelectron volt kilometers low-level radioactive waste meter Mixed Analyte Performance Evaluation Program Multi-Agency Radiation Survey and Site Invesagation Manual minimum detectable concentration minimum detectable count rate million electron volts Martin Marietta Corporation minute rml l lgrams per square centimeter millit-= per year
cobalt-60
Quehanna Decommissioning Project (QDP) iv 1726/Reports/2007-08-03 Final Codnnatory Survey Report

NaI NIST NRC NRIP NUMEC ORISE PADEP
PSU
ROC
SNAP Sr-90 SrTiO, STI su TAP WWTB
p w g
QDP
S
ABBREVIATIONS AND ACRONYMS (continued)
sodium ioclide National Iristitute of Standards and Technology U.S. Nuclear Regulatory Commission NIST Radiochemistry Intercomparison Program Nuclear Materials and Equipment Corporation Oak Ridge Institute for Science and Education Pennsylvania Department of Environmental Protection picocujies per gram Pemsylvarlia State University Quehanna Decommissioning Project radionuclides-o f-concern second Systems for Nuclear Auxllrary Power stronitum-90 strontium ititanate Scientech, Incorporated survey unit total absorption peak Waste Water Treatment Building
Quehanna Decommissioning Project (QDP) V 1726/Rep0rts/2007-08-03 Final Confirmatory Sunrey Report

CONFIRMATORY SURVEY REPORT FOR THE QUEHANNA DECOMMISSIONING PROJECT
KARTHAUS, PENNSYLVANIA
INTRODUCTION AND SITE HISTORY
In 1957, the Curtis-Wright Corporation (CWC) finished construction of a jet engine and nuclear
research facility at the Quehanna Site located in ISarthaus, Pennsylvania. Following the construction
of the facility, the U.S. Atomic Energy Commission (AEC), a precursor to the U.S. Nuclear
Regulatory Commission (NRC), issued a license to CWC in 1958 to operate a swimming pool
research reactor. The license also included the use of hot cells, laboratories, and support features
(STI 2004).
In September 1960, CWC donated the facility and land to Pennsylvania State University (PSU)
which subsequently leased the hot cells to Martin Marietta Corporation (MMC). In 1962, MMC
used the hot cells to manufacture several prototype thermoelectric generators, known as Systems for
Nuclear Aux~haxy Power (SNAP) generators, for the AEC. These power sources, which were
designed to furnish power for remotely operated, automatically reporting weather stations,
navigation buoys, etc., contained very hgh spec5c activity strontium-90 (Sr-90) in the form of
strontium titanate (SrTiO,). MMC’s radioactive material license allowed them to maintain megacurie
quantities of Sr-90. When MMC terminated its lease in 1967, they partially decontaminated the
facility. However, licensable quantities of Sr-90 remained behind as structural contamination. MMC
was the last licensee to use Sr-90 at the Quehanna Site (STI 2004).
In 1967, PSU gave its interest in the Quehanna Site back to the Commonwealth of Pennsylvania
which in turn leased the facility to the Nuclear Materials and Equipment Corporation (NUMEC), a
subsidmy of the Atlantic-Richfield Corporation (ARC). NUMEC used the reactor pool to hold a
large cobalt-60 (CO-60) irradiator containing in excess of 1 million Curies of CO-60 for projects
involving food irradiation and irradiation of polymer-impregnated hardwood, and other applications
of intense gamma radiation. In 1978, a group of iiRC employees bought the wood irradiation
process at the Quehanna Site, including the CO-60 irradiator and related equipment. The new
company, PermaGrain, was issued Radioactive Materials License Number 37-17860-01 by the NRC
for the irradiator and also assumed “caretaker” responsibilities for the material left behind by
previous tenants (STI 2004).
Quehanna Decommissioning Project (QDP) 1726/Rep0~/2007-08-03 Final ConFlrmatoT Report

The Pennsylvania Department of Environmental Protection (PADEP) assumed the official
radioactive materials license since PermaGrain filed for bankruptcy in December 2002. PADEP
renewed the license in September 2003 under NRC Radioactive Materials License Number
37-17860-02. Currently, the Commonwealth of Pertnsylvania owns the Quehanna Site and the
surrounding real estate and the Pennsylvania Department of Conservation and Natural Resources
(DCNR) Bureau of Forestry administers the land.
The contaminants of concern at the Quehanna Site are Sr-90 with possible residual CO-60 from the
use of and manufacture of cobalt irradiators. However, measurable quantities of CO-60 are not
expected since extensive remediation has taken place in the localized areas where CO-60 was known
to exist. There is also a small potential for activation products from operations of the test reactor
(STI 2004).
The onginal objective of the decontamination and decommissioning (D8c.D) project was to
decontaminate and free-release the entire Quehanna Site for reuse for industrial purposes by the
existing tenant, and to terminate NRC Radioactive Materials License Number 37-17860-02. The
initial Quehanna Decommissioning Plan (DP), prepared by Scientech, Inc. (STI), was prepared
based on the requirements of NRC Regulatory Guide 1.86 (STI 2004). STI’s decommissioning
activities included: 1) the removal of the Hot Cell 4 process system by the use of a remotely
controlled robot, 2) the removal of the CO-60 irradiator sources from the reactor pool and hot cells,
3) decontamination of areas such as the laboratories, production and storage areas, and offices,
4) surveys and demolishing of interior structures north of the reactor bay and cell face (e.g. walls,
ceiling and floor des, etc.), and 5) the disposal of debris as clean waste or low-level radioactive
waste [LLRW (STI 2004)l.
STI performed final status surveys (FSS) on the site and submitted a final status survey report
(FSSR) on the FSS findings and submitted the report to the NRC (ESL 2005) for review and
approval. Based on this FSSR, the NRC Headquarters and Region I Offices requested that the Oak
Ridge Institute for Science and Education (ORISE) perform c o n h a t o r y surveys at the Quehanna
Site. The initial c o n h a t o r y surveys were conducted during the p d o d s of November 8 through 10,
2004 and May 3 through 4,2005. The previous c o n h a t o r y survey activities for the formerly
classified Class 1 and Class 2 interior building areas failed to confirm that the radiological conditions
at the Quehanaa Decommissioning Project (QDP) met the approved unrestricted release limits
Quehanna D e c d s i o n i n g Project (QDP) 2 1726/Reports/2007-08-03 Fmd Confirmatoiy Survey Report

specified in the ongvlal DP (ESL 2003). Beta surface scans during the previous survey activities
identified several areas of elevated activity; 66 of the 120 direct measurements collected during the
previous survey activities exceeded the maximum criterion of 3,000 disintegrations per minute per
100 square centimeters (dpm/100 cm? for Sr-90 .with the beta surface activities rangmg from -275
to 182,800 dpm/100 an2. Removable beta activity ranged from -5 to 178 dpm/100 cm2 (ORISE
2005a and b).
Subsequently, the decommissioning contractor, EnergyJalutiions, LLC (ESL), formerly STI, issued a
revised DP with dose-based release criteria replacing the surface contamination guidelines taken
from Regulatory Guide 1.86 that were specified kt the previous version of the DP (ESL 2006a). The
DP was revised and submitted to the NRC in March of 2006. The revisions were based on the fact
that: 1) ORISE identified areas of elevated activity above the unrestricted release gudelines during
the confurmatory survey activities performed in May of 2005; and 2) the end use of the site changed
when the existing tenant declared bankruptcy and vacated the site. The current plan is to designate
the site property as a ‘Wild Area”. The revised approach followed the requirements of Title 10,
Code of Federal Regulations (CFR), Part 20, Subpart E which specfies that the unrestricted release
of a site shall assure that the average member of the critical group shall receive no more than 25
millirem per year (mrem/y) after the site has been closed and the license terminated (ESL 2006a).
The NRC issued a license amendment needed to approve the revised DP.
The revised FSS approach is based on the p d a n c e of the Multi-Agency Radiation Survey and Site
Investigation Manual W R S S I M (NRC 2000)], and specifies the requirements for structural surface
surveys, concrete core samples, and surface and subsurface soil sampling (ESL 2006b).
Currently, the site decommissioning contractor, ESL, has performed FSS of the Quehanna Site
based on a NRC-approved revised final status survey plan [FSSP (ESL 2006b)l. The objective of
the FSSP was to demonstrate that the radiological condtions at the Quehanna Site satisfy the release
criteria specdied in the revised DP so that the site can be released for unrestricted use (ESL 2006a).
Regulators that are involved in the D&D project include the NRC, the DCNR, and PADEP. The
PADEP maintains the license for the site. Based on the updated FSS requirements, the NRC’s
Office of Federal and State Materials and Environmental Management Programs and the Regon I
Quehanna Decommissioning Project (QDP) 3 172G/Reposts/2007-08-03 Final Confirmatory Survey Report
Office requested that ORISE perform additional confirmatory surveys of the Quehanna Site in
Karthaus, Pennsylvania.
SITE DESCRIPTION
The Quehanna Site is located at 115 Reactor Road., Karthaus, Clearfield County, Pennsylvania
(Figwe 1). The site is approximately 35 kilometers pZm (21 miles)] northeast of Clearfield,
Pennsylvania and is located in the 20,000-hectare [ha (5OY000-acre)] Quehanna Wild Area of the
Moshannon State Forest. The area is heavily wooded and sparsely populated. The Quehanna Facility
has a basement, main and second floor area of approximately 3,700 meters [m (40,000 square feet)].
The Quehanna Site includes or included many affected structures and systems, such as the hot cells
complex (Cell Structure), the Waste Water Treatment Building (WWTB) with associated
underground tanks and piping, the Reactor Bay, a id the hot cell ventilation system. Some of these
systems and structures have been removed as clean debris or partially decontaminated and disposed
of as X R W . The facility also includes other laboratories, production areas, storage areas, and offices
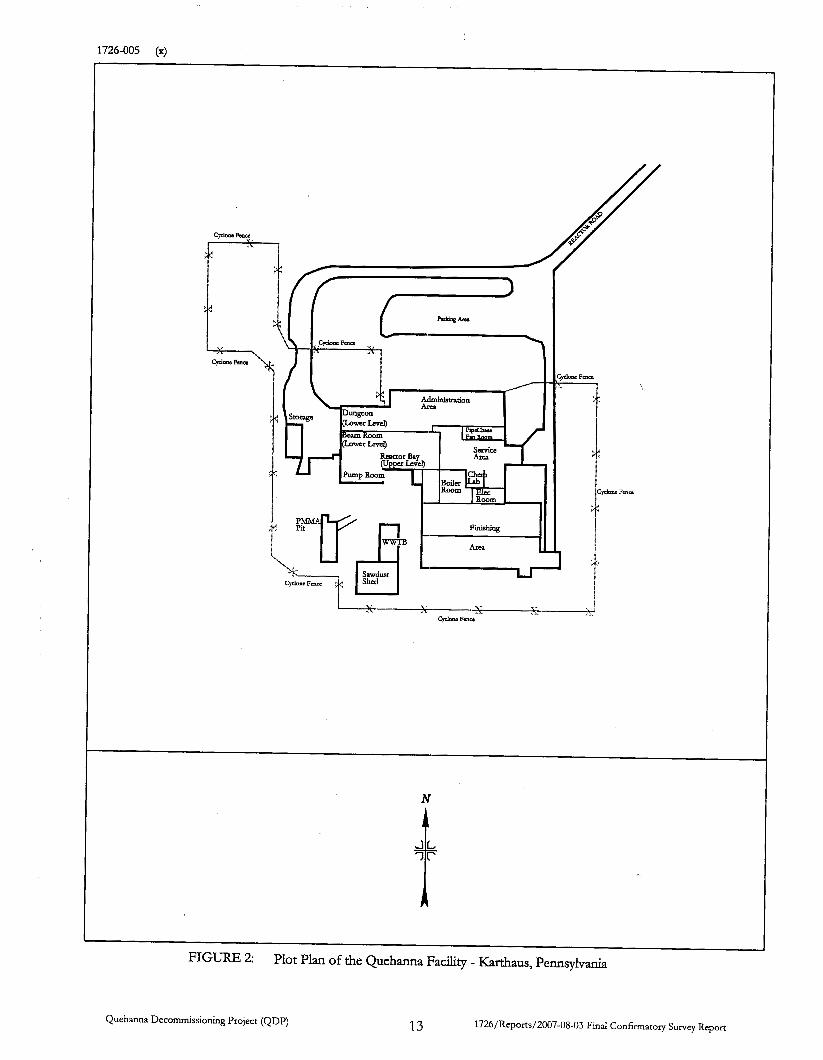
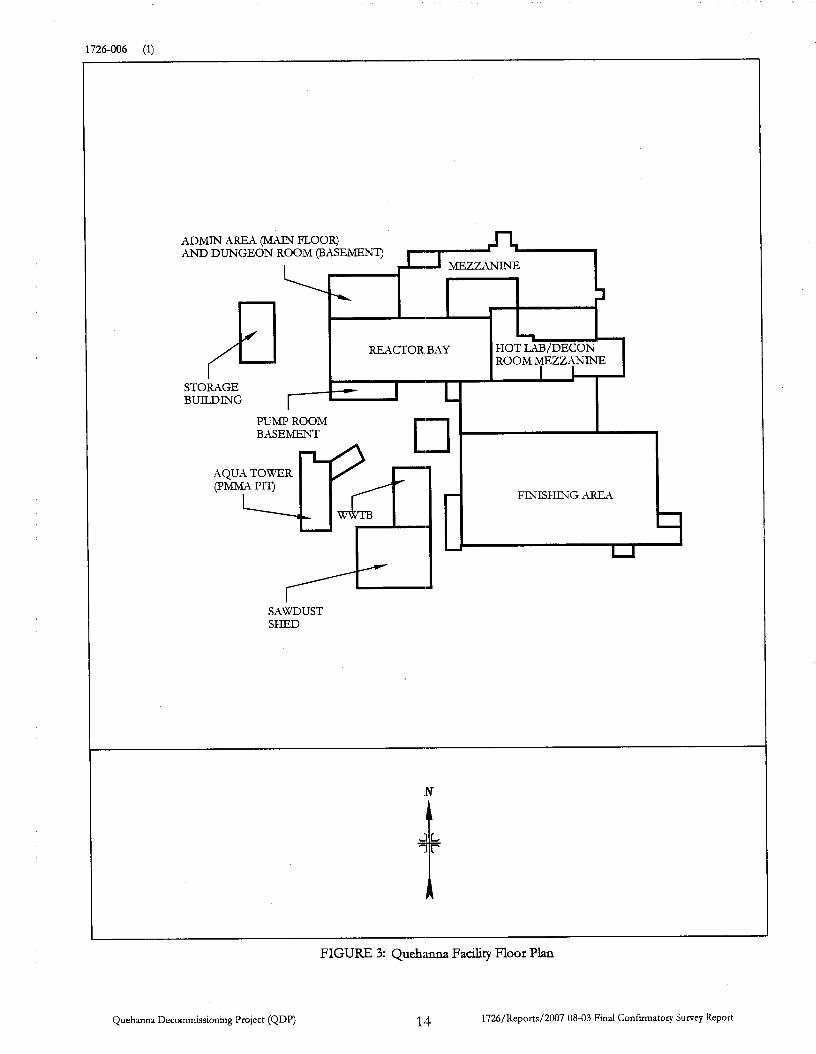
formerly used by the previous licensee, PermaGrain. The Quehaana site and facility plot plans are
provided in Flgures 2 and 3.
OBJECTIVES
The objectives of the confirmatory survey were to provide independent field data reviews and to
generate independent radiological data for use by the NRC in evaluating the adequacy and accuracy
of the licensee’s procedures and FSS data. Additionally, this review provided assurkce that the
licensee adequately deslgned the FSS and fulfilled the commitments contained in the DP.
DOCUMENT REVIEW
ORISE has reviewed ESL’s revised DP and revised FSSP for adequacy and appropriateness taking
into account commitments contained in these docnunents that were approved by the NRC (ESL
2006a and b). These documents contain the release criteria for the site, along with the
documentation on the derivation of the release criteria. The hnal survey data for the survey units
(SU) to be evaluated were reviewed by ORISE prior to mobilization to the site and while at the site
during confirmatory survey activities. ORISE reviewed and evaluated the radiological data, in
Quehanna Decommissioning Project (QDP) 4 1726/Reports/2007-08-03 Final Cdirmatory Survey Report

accordance with the ORISE survey plan and other referenced documents, to ensure that FSS
procedures and results adequately met site DP and FSSP commitments.
PROCEDURES
ORISE visited the Quehaana Site and performed visual inspections and surface activity
measurements. The confirmatory survey activities, performed on December 5 and 6,2006, were
conducted in accordance with a site-specific survey plan and with the ORISE Survey Procedures and
Quality Program Manuals (ORISE 2006a, 2006b and 2007).
The following radiological survey procedures were used by ORISE to conduct confirmatory surveys
of the QDP facility above grade structural surfaces. ORISE selected 16 of the SUs from Table 2-2 in
the FSSP for which ESL had provided FSS data for c o n h a t o r y surveys. The SUs were selected
based on FSS results and previous ORISE site racliological survey results which indicated the
presence of discrete Sr-90 particles throughout the main floor portions of the facility during the
previous ORISE confirmatory survey activities (ORISE 2005b).
Since the above grade structures, excluding the floor, will be disposed of as LLRW, at the request of
the NRC site representative, ORISE performed confirmatory surveys on the lower and upper walls
of the main floor. In addition to the confinnatory surveys on the above grade structural surfaces,
ORISE performed beta surfaces scans on the main floor surfaces since the majority of the
contamination found during the ORISE 2005 confirmatory surveys was identified on the floor.
ORISE's previous confirmatory survey results corroborated ESL's subsequent &dings that a
recontamination event had occurred which affected the entire interior footprint of the structure with
the heaviest concentration of contamination being found on the floors of the former Decon and
Chem Lab Rooms. To a much lesser extent, contamination was found by ORISE in the A b
Area, Reactor Bay, and Finishing Area (ESL 200611).
ORISE also performed beta and gamma scans on the floors and lower walls of the basement level
Storage and Pump Rooms. ORISE did not perform surface activity measurements in the basement
level areas since previous and present ORISE c o n h a t o r y surveys did not idenafp residual surface
contamination in those areas (ORISE 2005a and b).
Quehmna Decommissioning Project (QDP) 5 172G/R~0~ts/2007-08-03 Find con fir ma to^ S U S T ~ Repoa

SURVEY U N I T CLASSIFICATION
Finishing Area PA) 75 50 50 -- FA Electtical Room 75 50 25 -
L i
ESL surveyed all above-grade structures in accordance with MARSSIM. All above-grade structures
were classified as Class 3 SUs since the levels of residual radioactivity in these areas exist at a small
fraction of the revised release criteria (ESL 20062) ESL stated that if any areas demonstrated
removable activity greata than the removable criteria, those areas would be decontaminated,
reclassified, and surveyed as Class 1 SUs; however, no FSS removable activity data exceeded the
removable release criteria @SL 2006b).
REFERENCE SYSTEM
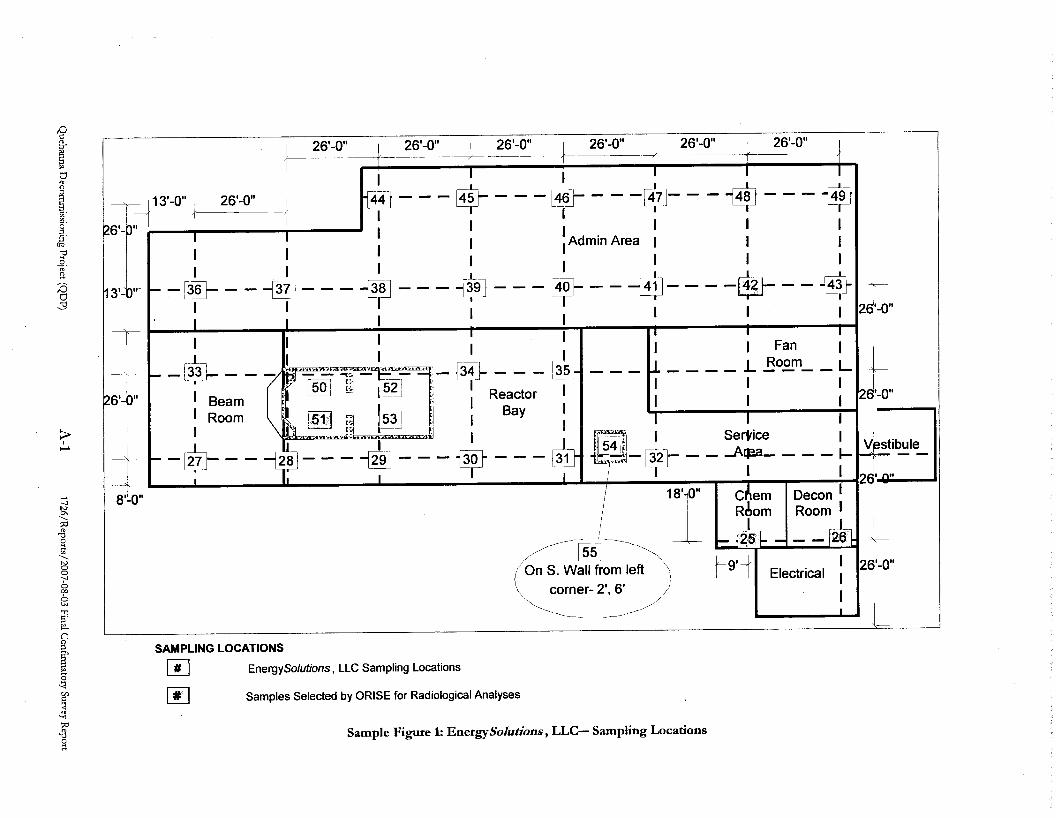
Direct measurement locations were referenced to prominent building features and recorded on SU
figures prepared by ESL.
SURFACE SCANS
ORISE performed beta and gamma radiation surface scans within each of the SUs selected for
confirmatory surveys. The percentages of scan coverage for each SU selected for confirmatory
surveys are presented in Table 1 below:
TABLE 1: SURVEY UNIT SCAN PERCENTAGES
Scan Percenta
I Service Area I 75 I 50 I 50 I 5 II ~~ ~~
Decon Room 75 Chem Lab 75
Vestibule 75 Admin Area 75 50
Reactor Bay 50 50 5
Boiler Room 50 50 __ Area Near Old Dock 50 50 --
Hydroblast Area 50 50 __
1726/Rep0rts/2007-0803 Final Confirmatory Survey Report 6 Quehanna Decommissioning Project (QDP)

TABLE 1: SURVEY UNIT SCAN PERCENTAGES (continued)
WWTB Storage Room
Pump Room
Survev Unit Scan Percentages II
75 50 25 --
75 50 25 _- 75 50 25 _-
Floor Gamma
It _- II FA Office I 75 I 50 I 25 I H __ N FA Tool Crib I 75 I 50 I 25 I
*Measurement not performed.
During the surface scans, particular attention was given to cracks and joints where material may have
accumulated. Scans were performed using Geiger-Md.ler (GM), hand-held gas proportional and
sodlum iodide (Nag scintillation detectors coupled to ratemeters or ratemeter-scalers with audible
indicators.
SURFACE ACTMTY MEASUREMENTS
Since the levels of residual radioactivity in these areas were expected to exist at a small fraction of
the revised release criteria, with concurrence from the NRC site representative, it was deemed
unnecessary to obtain construction material backgrounds for correcting gross beta activity
measurements performed on structural and/or system surface SUs. The ambient instrument
backgrounds were used in the activity calculations.
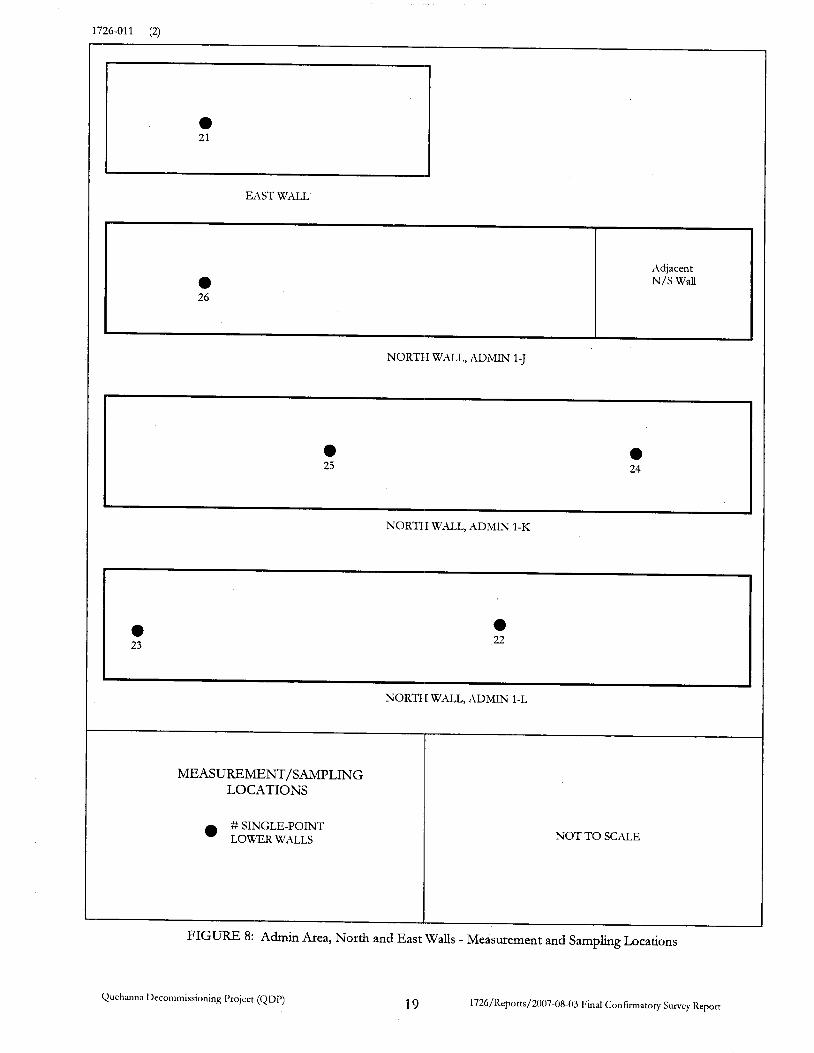
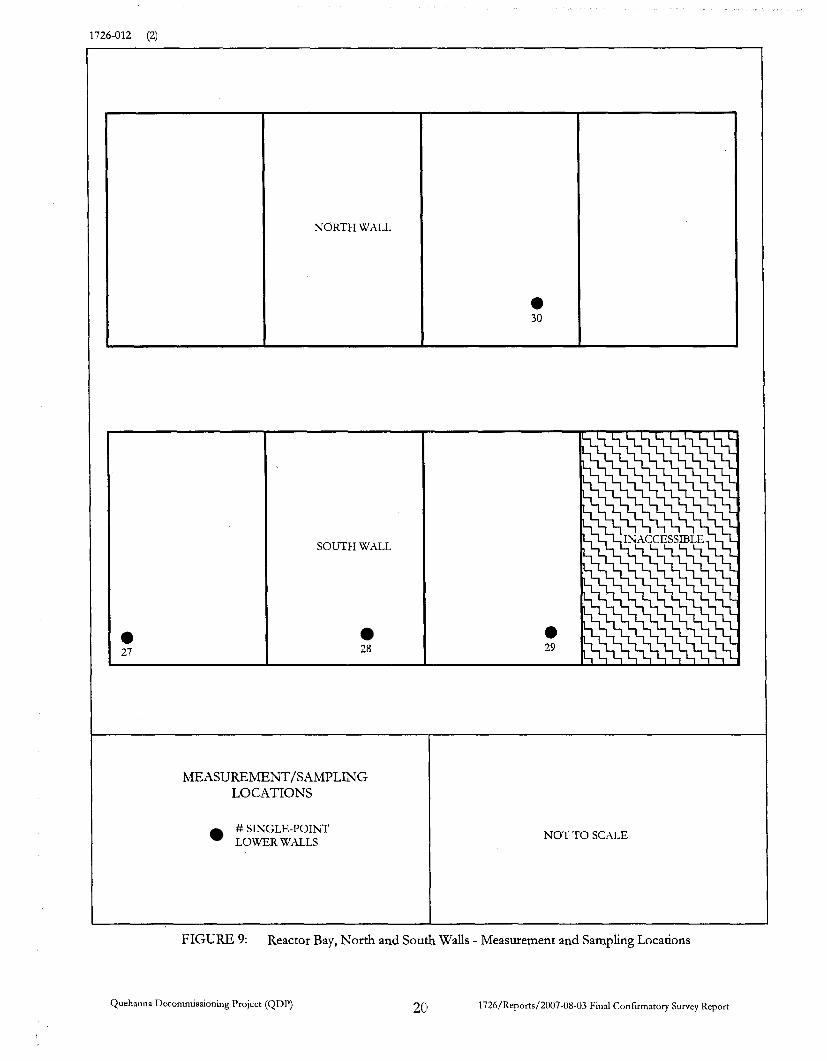
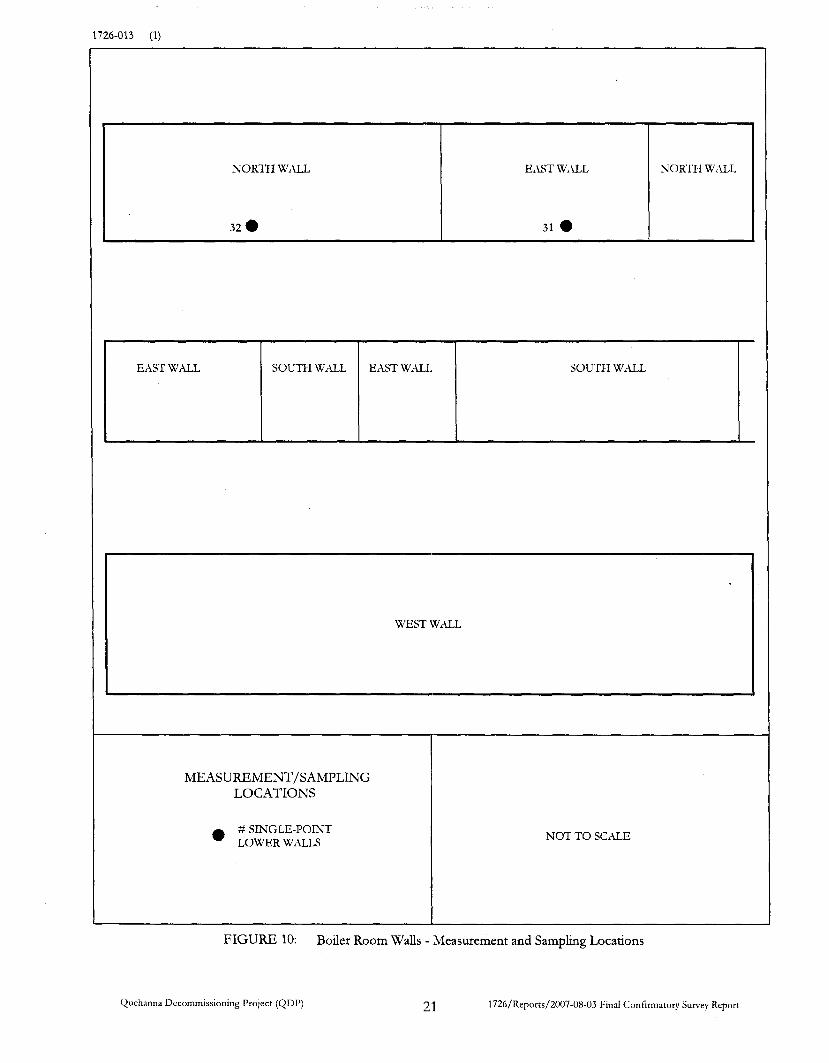
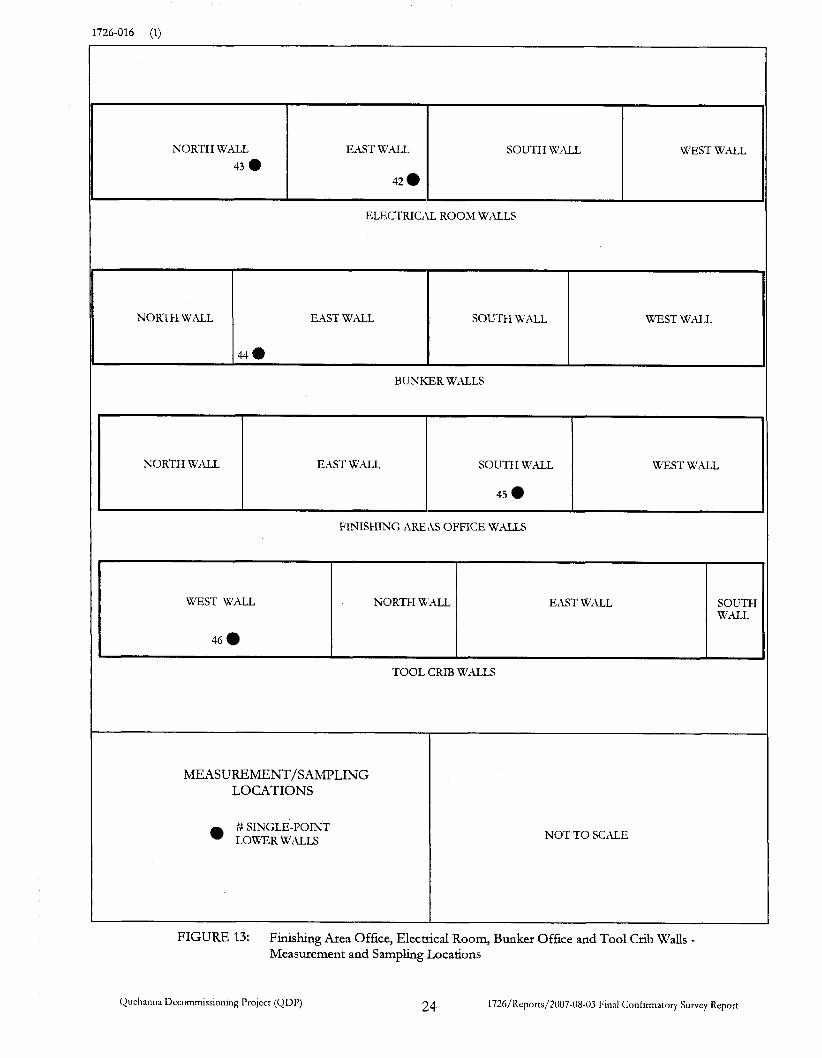
Surface activity measurements for beta activity were performed at judgmentally (based on surface
scans) selected locations within the SUs to determine if residual activity levels met the release
criteria. Forty-qht ditect measurements were collected within the SUs where confirmatory surveys
were performed (Figures 4 through 14). Direct measurements were collected using GM and
hand-held gas proportional detectors coupled to ratemeter-scalers. A smeat sample for determining
removable gross beta activity levels was collected at each direct measurement location.
1726/Reports/2007-0E03 Find Confirmatory Surrey Report 7

MISCELLANEOUS SAMPLING
Nine concrete core samples and four metal roof samples, previously collected by ESL personnel,
were submitted to ORISE for radiological analyses. Miscellaneous sampling locations were provided
by ESL personnel (Appendix A).
SAMPLE ANALYSIS AND DATA INTERPRETATION
Samples and data were returned to ORISE's laboratory in Oak Ridge, Tennessee for analysis and
interpretation. Sample analyses were performed hi accordance with the ORISE Laboratory
Procedures Manual (ORISE 2006~). The radionuclides-of-concern (ROC), as identified by ESL,
were Sr-90, CO-60 and cesium-137 (Cs-137). Miscellaneous material samples (concrete cores and
metal roof) were analyzed by gamma spectroscopy for CO-60 and Cs-137, and Sr-90 by wet
chemistry. Gamma spectra were also reviewed for other identifiable total absorption peaks
(photopeaks). Miscellaneous material sample results were reported in units of picocuries per gram
(pCi/g). Smear samples were analyzed for gross beta activity using a low-background gas
proportional counter. Smear results and direct measurements for total surface activity were
converted to units of dpm/100 cm2. Additional information concerning major instrumentation and
analyttcal procedures is provided in Appendices B and C.
FINDINGS AND RESULTS
DOCUMENT REVIEW
ORISE reviewed ESL's DP, FSSP and FSS prelirrjnary data (ESL 2005 and 2006a and b). The
procedures, methods, and data submitted by ESL accurately documented the radiological status of
the QDP above grade structures per the DP commitments. However, the FSSR for ESL's survey
activities in 2006 has not been submitted to ORISE for review.
SURFACE SCANS
The OFUSE confirmatory surveys did not detect my elevated radiation levels above the established
release criteria within any of the SUs in which surveys were performed. The surface scan results for
beta activity indicated several areas that were above background levels. These areas were marked for
further investgation.
Quehanna Decommissioning Project (QDP) 8 1726/Reports/2007-08-03 Fmd Confirmatory Survey Report

SURFACE ACTMTY LEVELS
Reactor Bay Boiler Room
Direct measurement activity results for the main floor above ground structures ranged from -253 to
48,900 dpm/100 cm2 for total beta activity. The surface activity level ranges for the SUs surveyed by
ORISE are presented in Table 2.
~~
-253 to 310 50 to 230
-2 to 2 -3 to 4
TABLE 2: RANGE OF SURFACE ACTIVITY MEASUREMENTS
Hydroblast Area Finishing Area (FA) FA Electrical Roon)
II Decon Room I -110 to 16.220 I -4 to 3
-10 to 70 -190 to -100 -80 to 290
-1 to 1 -2 to -1 -2 to -1
~ ~
Chem Lab 130 to 370 -4 to 4 Vestibule -130 to -40 -3 to 1
II Admin Area I -202 to 170 I -1 to 4
n Area Near Old Dock I -140 to -130 I -1 to 1 N
II FA Bunker I 80 I -2 II
A complete listing of the c o n h a t o r y surface activity results is presented in Table 4.
MISCELLANEOUS SAMPLES
With one exception, the radionuclide concentrations for the concrete and roof samples were at or
below the minimum detectable concentration (MDC) for the analytical procedure. The one
exception was the roof sample from ESL sampling location #10 (1726M0010) which had a positive
value of 0.49 k 0.12 pCi/g of Cs-137.
COMPARISON OF RESULTS WITH GUIDELINES
The primary ROCs for the QDP are Sr-90 and CO-60 which were identified during characterization,
as the predominant radionuclides present. The applicable structural and remaining concrete derived
Quehanna Decommissioning Project (QDP) 9 1726/Reports/2007-08-03 Final Confirmatory S w e y Report

concentration guideline levels (DCGLs) specified in the DP and approved by the NRC are as
follows (ESL 2006b):
TABLE 3: DERIVED CONCENTRATION GUIDELINE LEVELS FROM QUEHANNA DECOMMISSIONING PROJECT DP
surface contamination Guide 1.86 levels of 200 dpm/100 a n 2
Concrete includes an der blocks that will
*DCGL values taken from the LTP and LTR (ESL 2006b).
All direct measurement, smear, and miscellaneous sample results, presented in Tables 4 and 5, were
less than the applicable DCGLs as listed in Table 3.
SUMMARY
At the request of the Office of Federal and State Materials and Environmental Management
Programs, U.S. Nuclear Regulatory Commission (NRC), the Oak Ridge Institute for Science and
Education (ORISE) conducted confirmatory surveys of the Quehanna Decommissioning Project
(QDP) above grade structures during the period of December 5 and 6,2006. The survey activities
consisted of visual inspections and radiological surveys including beta and gamma surface scans and
surface beta activity measurements. Cursory beta and gamma scans were performed on below grade
structures in the basement. ORISE &d not perform surface activiq measurements in the basement
seas since previous ORISE c o n h a t o r y surveys did not identlfy residual surface contamination in
those areas. ORISE also performed radiological analyses on 13 concrete and metal roof samples that
were previously collected by EnergySolutions, U C (ESL) personnel.
The results of the confirmatory surveys indicated that the beta surface activity levels were less than
the applicable NRC-approved release criteria for the QDP. All confirmatory surface activity level
results were less than the derived concentration guideline levels (DCGLs) for the Sr-90 as speafied
in the decommissioning plan P P @SL 2006a)l. The ORISE results are also consistent with the
radiological survey results in the final s ta tus survey (FSS) preliminary data provided to ORISE for
review.
Quehanna Decommissioning Project (QDP) 10 172G/Reports/2007-08-03 Final C o n f m t q Survey Report

FIGIJRES
Quehanna Decommissioning Project (QDP)

1726-004 (x)
f FIGURE 1 : Location of the Quehanna Facility - Karthaus, Pennsylvania
Quehanna Decommissioning Project (QDP) 12 1726/Reports/2007-08-03 Final Confirmatory Survey Report
1726-005 (x)
Quehanna Decommissioning Project (QDP) 13 1726/Reports/2007-08-03 Final Confirmatory Survey Report
1726-006 (1)
ADMIN AREA (MAIN FLOOR) AND DUNGEON ROOM (BASEMENT)
I I
STORAGE BUILDING
PUMP ROOM I BASEMENT ~
FINISHING AREA - -
SAWDUST SHED
Quehanna Decommissioning Project (QDP) 1 ‘1 1726/Reports/2007-08-03 Final Confirmatory Survey Report
1726-007 (2)
FLOOR
SOUT€I “ALL I
I WEST WALL
I I, B EAM 2.
I I NORT€I WALL EAST W
MEASUREMENTIS AMPLING LOCATIONS
# SINGLE-POINT LOWER WALLS AND FLOOR
NOT T O SCALE
FIGURE 4: Office Mezzanine Area - Measurement and Samplmg Locations
Quehanna Decommissioning Projcct (QDP) 15 172(,/Reports/2007-08-1)3 Final Confirmatory Survey Report
1726-008 (2)
10 .&--
8
DECON ROOM I CHEM LAB
A 6
MEASUREMENT/SAMPLING LOCATIONS
# SINGLE-POINT ' LOWERWALLS
A # SINGLE-POINT UPPER WALLS
NOT TO SCALE
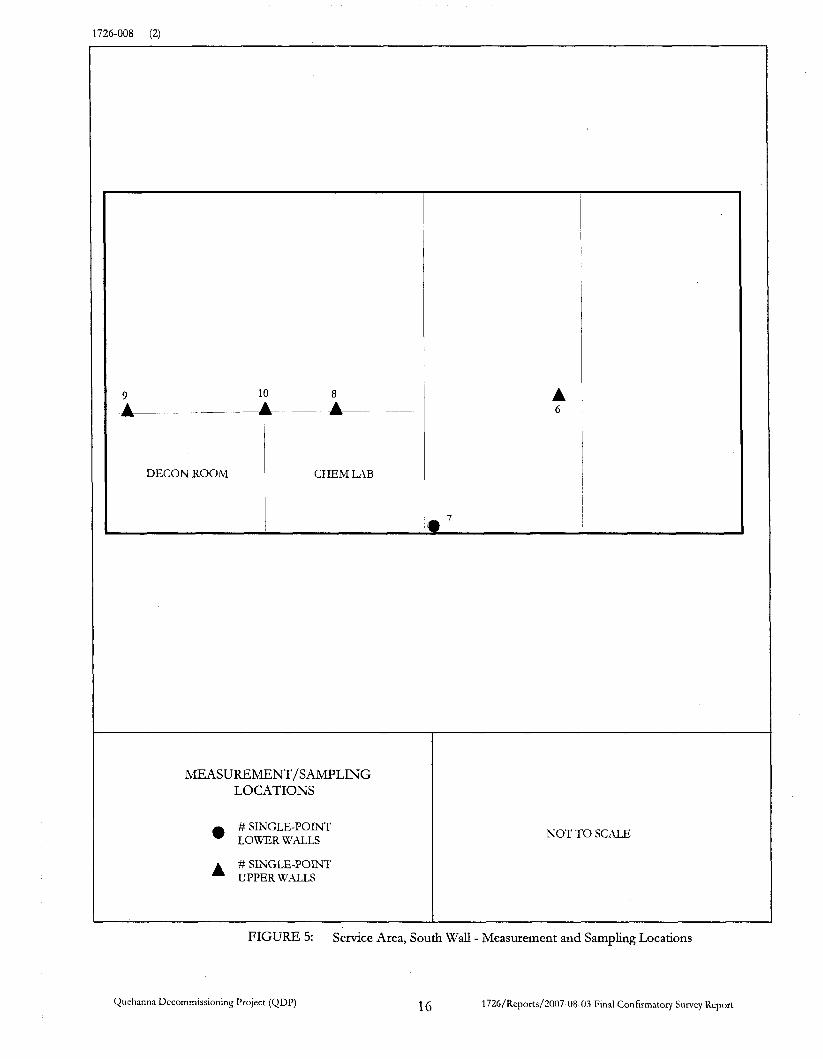
FIGURE 5: Service Area, South Wall - Measurement and Samphg Locations
Quehanna Decommissioning Project (QDP) 1726/Reports/2007-08-03 Final Confirmatory Survey Report 16
726-009 (1)
EAST WALL
15.
13 . DECON ROOM
EAST WALL
16 . SOUTH WALL . 17
CHIEM LAB
.18 WEST WALL
MEASUREMECNT/SAMPLING LOCATIONS
# SINGLE-POINT * LOWER WALLS NOT TO SCALE
I
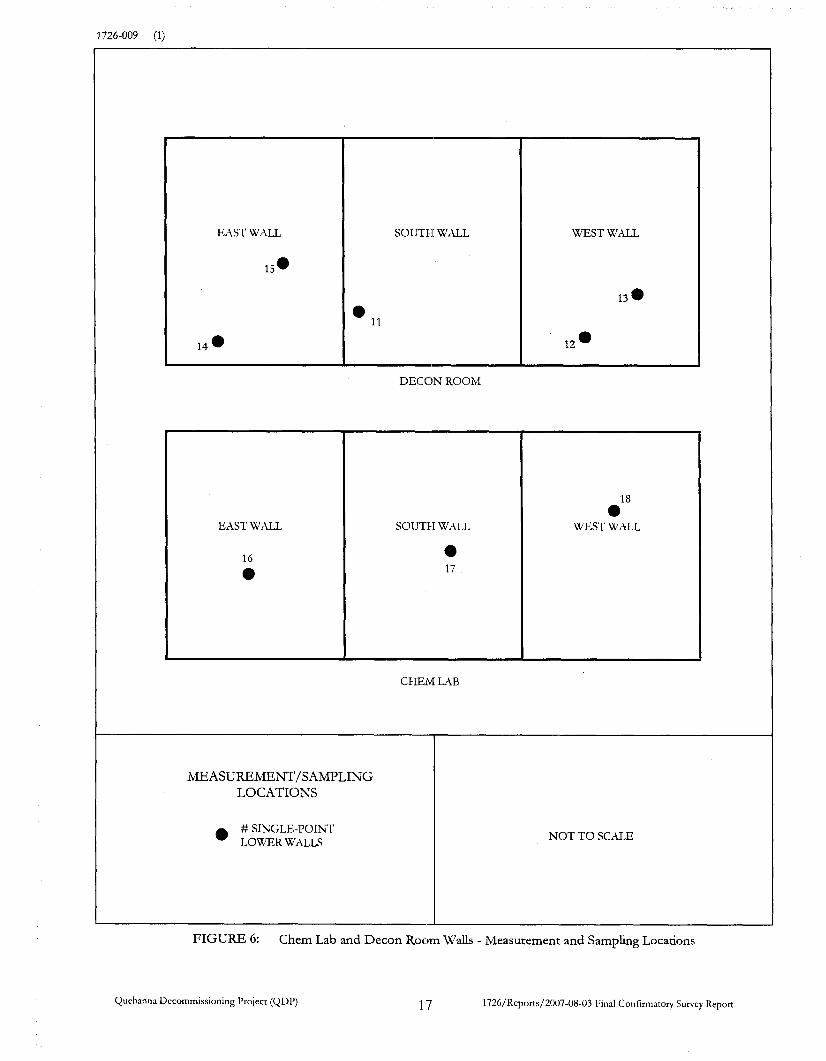
FIGURE 6: Chem Lab and Decon Room Walls - Measurement and Samphg Locations
Quehanna Decommissioning Project (QD1’) 1726/Reports/2007-08-03 Final Confirmatory Survey Report 17
1726-010 (1)
WEST WALL
I
m Roll Up Door
,oo!& Into Reactor bay
-
EAST WALL
e 20
NORTH WALL
0 19
SOUTH WALL
MEASUREMENT/SAMPLING LO CATIONS
# SINGLE-POINT LOWERWALLS NOT T O SCALE
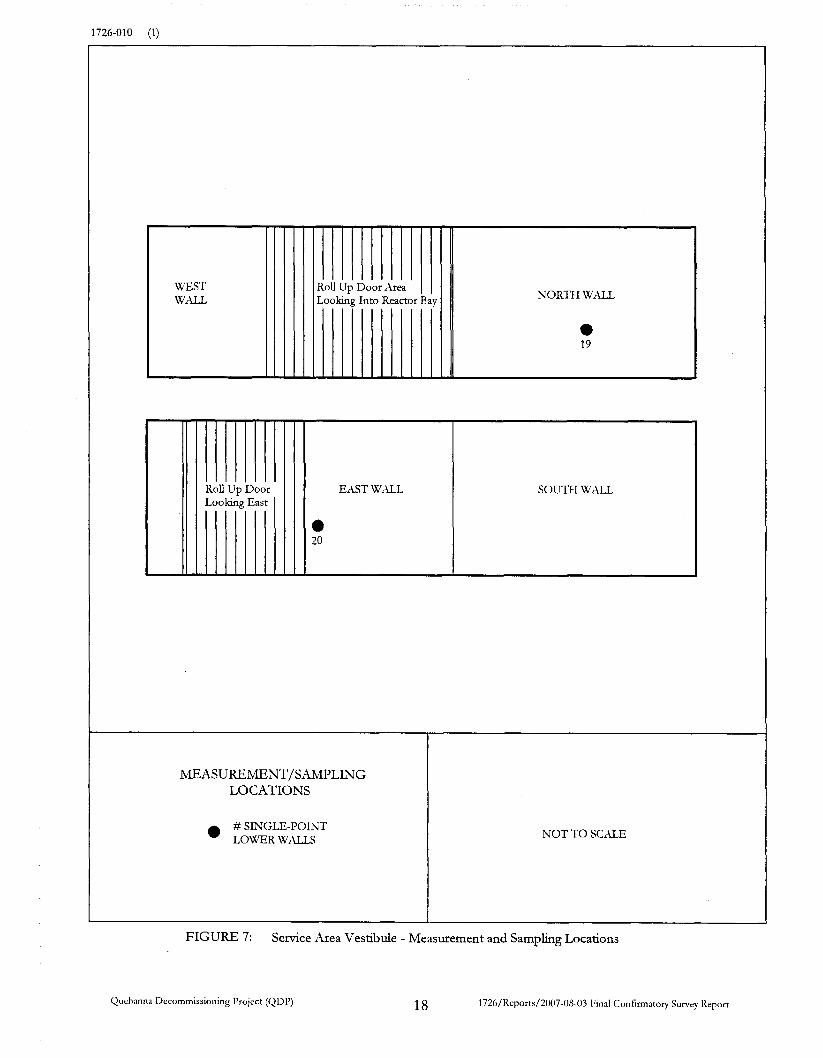
FIGURE 7: Service Area Vestibule - Measurement and Samplmg Locations
Quehanna Decommissioning l’roject (Q1>1’) 18 172h/Reports/2007-(18-03 I:inal Confirmatory Survey Ikport
1726-011 (2)
e 26
0 21
EAST WALL
Adjacent N/S Wall
e e 25 24
NORTI-I WALL, ADMIN 1-K
e 22 e
23
NORTI I WALL, ADiMIN 1-L
MEASUREMENT/SAMPLING LOCATIONS
# SINGLE-POINT LOWER WALLS NOT T O SCALE
FIGURE 8: Admin Area, North and East Walls - Measurement and Sampling Locations
Quchanna Ilecommissioning Projcct (QDl’) 19 1726/Reports/2007-08-03 Final Confirmatory Survey Report
1726-012 (2)
I
0 27
NORTH WALL
SOUTH WALL
28
MEASUREMENT/SAMPLING LOCATIONS
# SINGLE-POINT LOWERWULS
0 30
0 29
NOT T O SCALE
FIGURE 9: Reactor Bay, North and South Walls - Measurement and Sampltng Locations
Quehanna Dccornrnissioning Project (QDP) 20 1726/11eports/2007-08-03 Final Confirmatory Survey Report
NORTH WALL
32 0
I
EAST WALL
31 0
~~~
NORTH WALL
EAST WALL SOUTH WALL
I I
EAST WALL SOUTH WALL
WEST WALL
NOT TO S C U E
Quehanna Decommissioning Projcct (QD1’) 21 1726/Reports/2007-08-03 Final Confirmatory Survey Report

1726-014 (2)
SOUTH WALL
EAST WALL
WEST WALL 1
WEST WALL 2
35
NORTM WALL (Entrance 'to Reactor Bay)
I 33 0
Old Dock
WEST WALL
0 34
NORTII WALL EAST WALL 1 I €Iydroblast Room
EAST WALL 2
36 I
MEASUREMENT/SAMPLING LOCATIONS
# SINGLE-POINT LOWERWALLS NOT T O SCALE
FIGURE 11: Old Dock and Hydroblast Room - Measurement and Samplmg Locations
Quehanna llecommissioning Project (QDP) 22 172(,/Reports/2007-08-03 Final Confirmatory Survey Report

1726-015 (x)
EAST R ALL 38 0 NORTH WALL
TC&Otfice \Tall
Rr Bay Entrance EAST \TALL L NORTH \TALL I Rr Bay Entrance
Loaa!mg Dock L o a h g Dock NORTH \TALL EAST \\ .ALL
\Tall South o f I Boder Room
Rr Bay Entrance 41 0 K'EST R ALL WEST WALL 1
soLm RALI 39 0 Loadmg Doch
S0Ll-H \X'ALL
K'EST R ALL Rr Bay Entrance WEST WALL
MEASUREMENT/SAMl?LING LOCATIONS
# SINGLE-POINT LOWER WALLS
NOT TO SCALE
FIGURE 12: Finishing Area Walls - Measurement and Sampling Locations
Quehanna llecommissioning Project (QD1') 23 1726/Reports/2007-08-03 Final Confirmatory Survey Report
1726-016 (1)
NORT€I WALL EAST WALL 43 e
42
SOUTH WALL WEST WALL
~
NORTH WALL EAST WALL
44 a
SOUTH WALL WEST WALL
NORTH WALL EAST WALL SOUTH WALL WEST WALL
45
MEASUREMENT/SAMPLING LOCATIONS
WEST WALL
46
# SINGLE-POINT LOWERWALLS
SOUTE WALL
NORTH WALL EAST WALL
NOT T O SCALE
FIGURE 13: Finishing Area Office, Electrical Room, Bunker Office and Tool Crib Walls - Measurement and Sampling ;Locations
1726/Reports/2007-08-03 Final Confirmatory Survey lieport 24 Quchanna llccomrnissioning Prolcct (QDI’)
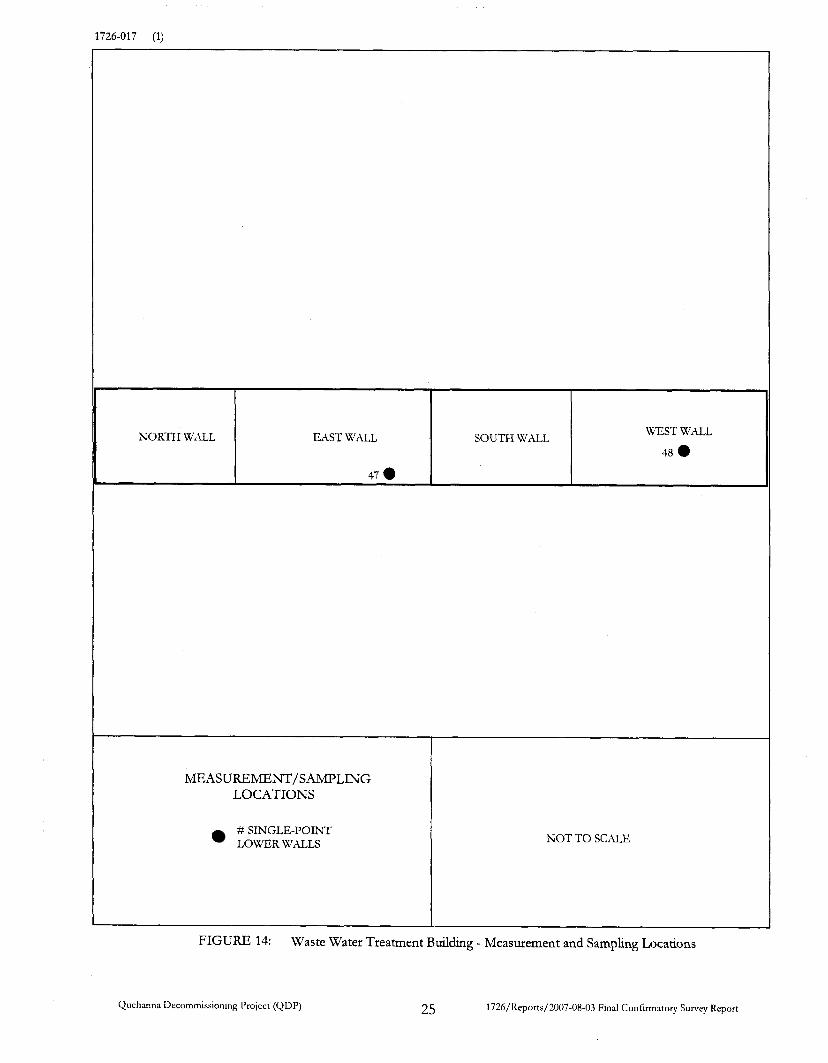
726-017 (1)
NORTH WALL EAST WALL SOUTH WALL I WEST WALL
48 0
MEASUREMENT/SAMPLING LOCATIONS
# SINGLE-POINT LOWERWALLS NOT TO SCXLE
FIGURE 14: Waste Water Treatment Bddmg - Measurement and Sampling Locations
1726/Keports/2007-0t)-03 Final Confirmatory Survey Report 25 Quehanna Decommissioning Project (QDP)

Quehanna Decommissioning Project (QDP)
TABLES
1726/Reports/2007-08-03 Final Confirmatory Survey Report
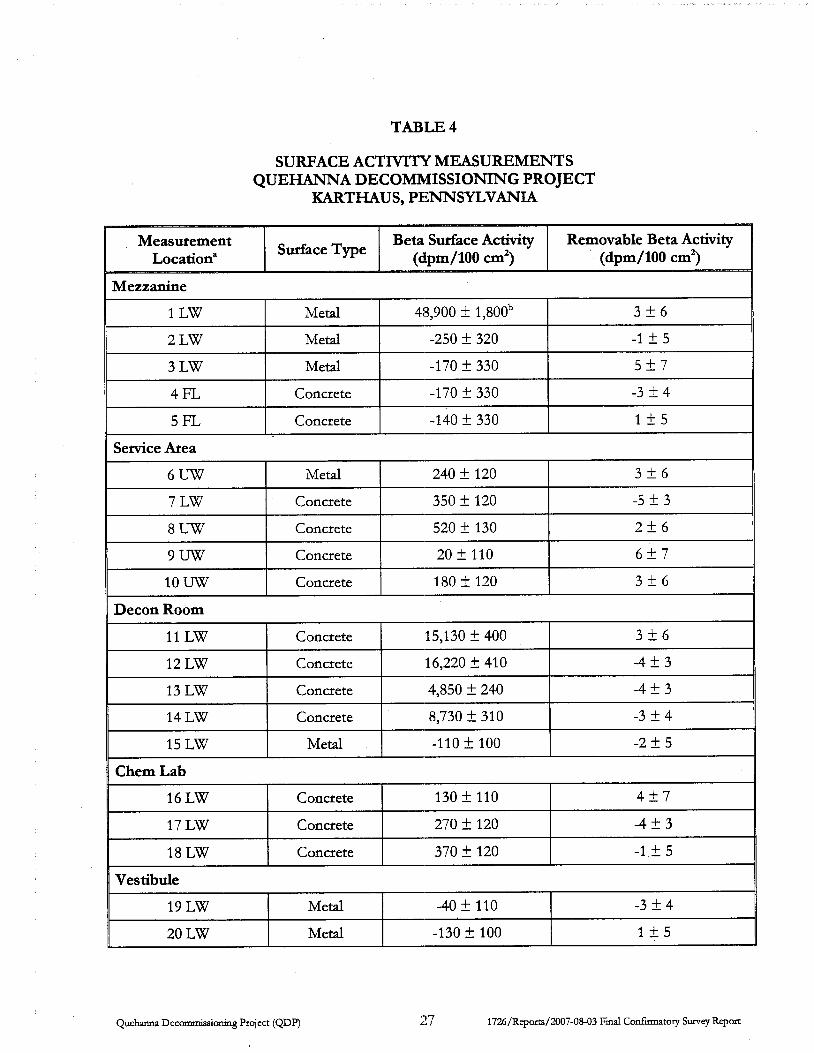
TABLE 4
SURFACE ACTIVITY MEASUREMENTS QUEHANNA DECOMMISSIONING PROJECT
KARTHAUS, PENNSYLVANIA
Measurement
Mezzanine
1 LW Metal 413,900 + 1,800b 3+6
2 LW Metal -250 + 320 -1 + 5 3 LW Metal -170 + 330 5+7
4 FL Concrete -170 + 330 -3 + 4 5FL Concrete -140 f 330 lL5
II Servicekea ~~
6 U W Metal 240 + 120 3+6
7 LW Concrete 350 f 120 -5 + 3 v ~~~~~
8 U W Concrete 520 f: 130 9 U W Concrete 20 + 110
10 UW Concrete 180 + 120 3+6
Decon Room 11 LW Concrete 15,130 + 400 3+6
12 LW Concrete 16,220 f 410 -4 + 3 13 LW Concrete 4,850 + 240 -4 + 3
~~
14 LW Concrete 8,730 f 310 -3 + 4 15 LW Metal -110 t 100 -2 + 5
130 f 110 4+7
270 f 120 -4 + 3 370 f. 120 -1 k 5
-40 + 110 -3 + 4 -130 f. 100 1+5
Quehanna Decommissioning Project (QDF') :!7 1726/Reports/2007-0803 Final C d m t o r y Survey Report
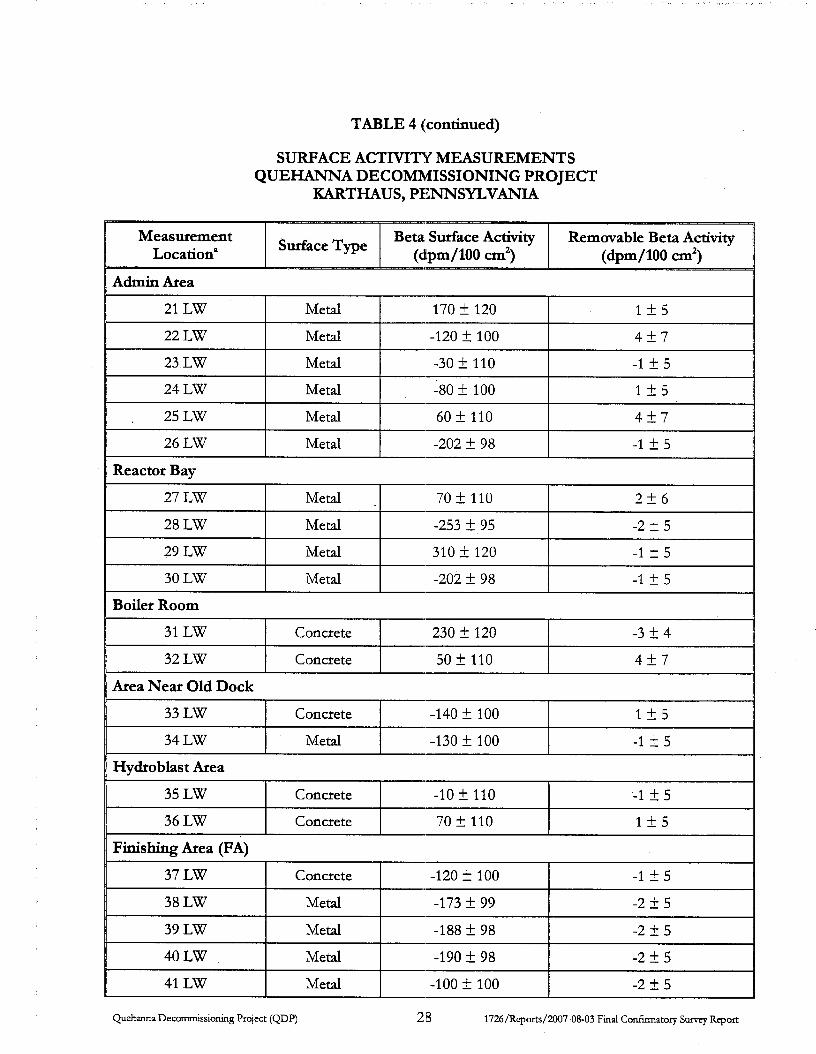
TABLE 4 (continued)
25 LW
26 LW
SURFACE ACTIVITY MEASUREMENTS QUEHANNA DECOMMISSIONING PROJECT
KARTHAUS, PIDJNSYLVANIA
Metal 60 k 110 4 + 7
Metal -202 k 98 -1 & 5
Measurement
27 LW
28 LW
29 LW
30 LW
21 LW 1 Metal 170 + 120 1 + 5 I
Metal . 70 f 110 2 + 6
Metal -253 2 95 -2 k 5
Metal 310 + 120 -1 + 5
Metal -202 & 98 -1 + 5
-120 + 100
24 LW -80 + 100
31 LW
32 LW
Concrete 230 k 120 -3 k 4
Concrete 50 + 110 4 k 7
1 Area Near Old Dock - P I 33 LW
34 LW
Concrete -140 + 100 1 + 5
Metal -130 & 100 -1 k 5
35 LW
36 LW
-120 k 100
39 LW -188 k 98 -2 f 5
Concrete -10 k 110 -1 + 5
Concrete 70 f 110 1 k 5
40 LW
41 LW
Quehanna Decommissioning Project (QDP)
Metal -190 k 98 -2 + 5
Metal -100 k 100 -2 f 5

TABLE 4 (continued)
SURFACE ACTMTY MEASUREMENTS QUEHANNA DECOMMISSIONING PROJECT
KARTHAUS, PENNSYLVANIA
Beta Surface Activity Removable Beta Activity I (dpm/100 cm') (dpm/100 cm') Surface Type Measurement Locationa
Electrical Room
42 LW Concrete -80 k 100 -2 k 5
43 LW Concrete 290 k 120 -1 k5 Bunker
44 LW 1 Concrete I 80 k 110 I -2 k 5
Office
45 LW Concrete -120 k 100 1 k 5
Tool Crib
46 LW Concrete -168 +_ 99 3 + 6
Waste Water Treatment Building
&Refer to Figures 4 to 14. FL. = floor, LW = lower wall, and UW = upper .wall. bUncertamties represent the %'/o confidence level based on countlng statistics only
Quehanna Decommissioning Project (QDP) 29 1726/Reports/2007-08-03 Fmal Confirmatory Survey Report

TABLE 5
RADIONUCLIDE CONCENTRATIONS I N MISCELLANEOUS SAMPLES QUEHANNA DECOMMISSIONING PROJECT
KARTHAUS, PENNSYLVANIA
1726M0012
1726M0013 17 Roof 3.6 k 7.9 (14) 0.09 ? 0.43 (0.77) 9 & 10 (14)
‘Sample identdkahons provided by EnergyJohtmrrr bhalysls by gamma spectroscopy cha lysn by wet chmstry Wncertamttes represent the 95% confidence level base on total propagated uncertamhes ‘Mmmurn detectable concentrations (MDC) for the analyhcal results are in parentheses %Zero values due to rounding pCc~60 and Cs 137 analytical results for these samples are q d i e d due to gamma spectroscopy geometry problema asaociated with the sample

REFERENCES
EnergySolutions, LLC PSL). Decommissioning Plan for the Quehanna, Pennsylvania Site. Document Number 82A9089, Revision 3. New Milford, Connecticut; January 2005.
EnergySoltltions, U C . Quehanna Decommissioning Project Final Status Survey Report. Document Number 82A9554, Revision 0. New Milford, Connecticut; January 2005.
EnergySoltltions, LLC. Decommissioning Plan for the Quehanna, Pennsylvania Site. Document number 82A9089, Revision 4. New Milford, Connecticut; March 2006a.
EnergySolutions, LLC. Final Status Survey Plan far the Quehanna, Pennsylvania Site. Document Number 82A9604, Revision 1. New Milford, Connecticut; October 2006b.
Oak Ridge Institute for Science and Education (ORISE). Interim Confirmatory Letter Report for the Quehanna Decommissioning Project, Karthais, Pennsylvania pocket No. 30-29288; RFTA No. OCOOS]. Oak Ridge, Tennessee; February 1 1 , 2005a.
Oak Rtdge Institute for Science and Education. Confirmatory Survey Results for Class 1 and Class 2 Interior Building Areas, Quehanna Decommissioning Project, Karthaus, Pennsylvania pocket No. 30-29288; RFTA no. 04-0081. Oak Ridge, Tennessee; May 24,2005b.
Oak Ridge Institute for Science and Education. Final Confirmatory Survey Plan for the Quehanna Decommissioning Project in Karthaus, Pennsylvania (Docket No. 30-29288; RFTA No. 06-012). Oak Ridge, Tennessee; November 30,2006a.
Oak Ridge Institute for Science and Education. Survey Procedures Manual for the Independent Environmental Assessment and Verification Program. Oak Ridge, Tennessee; August 7,2006b.
Oak Ridge Institute for Science and Education. Laboratory Procedures Manual for the Environmental Survey and Site Assessment Program. Oak Ridge, Tennessee; April 18,2006~.
Oak Rtdge Institute for Science and Education. Quahty Program Manual for the Independent Environmental Assessment and Verijication Program. Oak Ridge, Tennessee; March 1,2007.
Scientech, Incorporated (STI). Quehanna Decoadssioning Project, Final Status Survey Plan. Revision 0, New Milford, Connecticut; June 22,2,004.
U.S. Atomic Energy Commission (AEC). Regulatory Guide 1.86 - Termination of Operating Licenses for Nuclear Reactors. Washington, DC;, June 1974.
U.S. Nuclear Regulatory Commission (NRC). Multi-Agency Radiation Survey and Site Investigation Manual (MARSSIh4). NUREG-1575; Revision 1. Washington, DC; August 2000.
Quehanna Decommissioning Project (QDP) .3 1 172G/Rqports/2007-0&03 Final Confirmatory S w e y Report

APPENDIX A
MISCELLANEOUS SAMPLE LOCATIONS
Quehanna Decommissioning Project (QDP) 1726/Reports/2007-0&03 Final Confirmatory Survey Report
I I
I I
I I
I I
I I
I I I I I
---@-
. - -b- I I I I I
I
Im
I
’, L!?
I I I
I I ln
o
I EE
a0
,L
*E
Quehanna D
ecomm
issioning Project (QD
P) A
-1 1726/R
eports/2007-08-03 Final Confirm
atory Sunrey Report
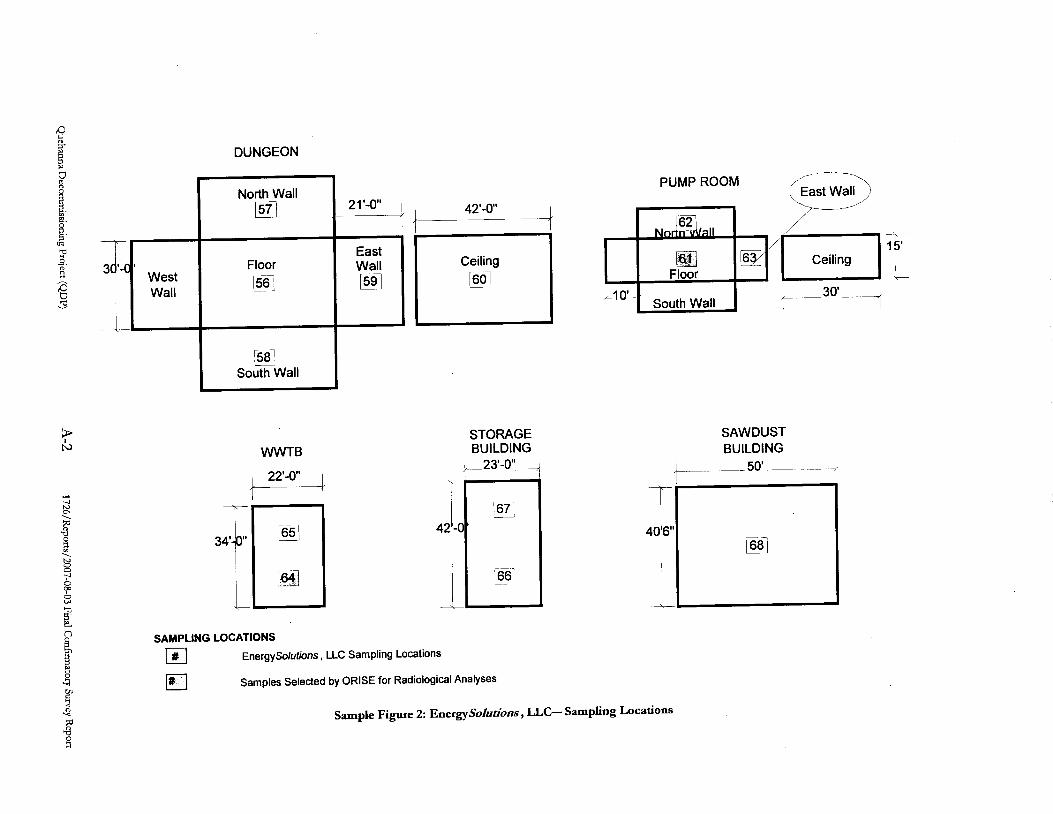
? DUNGEON
40 rO'- 6 ' --'
? N
T Ceiling
-i
PUMP ROOM
42'-0'
Ceiling Floor
South Wall i - 3 0 - 3 A10 -
South Wall I WWTB
w STORAGE BUILDING
+23'-0" -
SAMPLING LOCATIONS a El
EnergySolutions , LLC Sampling Locations
Samples Selected by ORlSE for Radiological Analyses
sample Figure 2: Energysohtions, Uc- Sampling Locations

k
I I
/
-I--
I ,
lI/
Quehanna D
ecomm
issioning Project (QD
P) .A-3
1726/Reports/2007-08-03 Final C
onfirmatory Survey Report

CINDERBLOCK SAMPLING LOCATIONS
lo'-"'
I , 1 L Boiler Room
Decpn 1 Room
24-0''
Flectrical I
91- Inside Chern Room 92- Inside Decon Room 93- Inside Electrical Room
94- Inside Boiler Room
95- Outside Boiier Room
All heights at 3 feet.
SAMPLING LOCATIONS
la El
EnergySolutions , LLC Sampling Locations
Samples Selected by ORISE for Radiological Analyses
Sample Figure 4: EnergySolutions, LLC- Sampling Locations

? cn
H ?,
Administrative Area
m
Finishing Area 1 SAMPLING LOCATIONS
EnergySolufions , LLC Sampling Locations
El Samples Selected by ORlSE for Radiological Analyses
Sample Figure 5: EnergySofutions , LLC- Sampling Locations
Q u h a Decommissioning Project (QDP)
APPENDIX B
MAJOR INSTRUMENTATION
1726/Reports/2007-0803 Find Confirmatory Survey Report

APPENDIX B
MAJOR INSTRUMENTATION
The display of a specific product is not to be construed as an endorsement of the product or its manufacturer by the author or his employer.
SCANNING INSTRUMENT/DETECTOR COMBINATIONS
Ludlum Floor Monitor Model 239-1 combined with Ludlum Ratemeter-Scaler Model 2221 coupled to Ludlum Gas Proportional Detector Model 43-37, Physical Area: 550 cm2 (Ludlum Measurements, Inc., Sweetwater, TX)
Ludlum Ratemeter-Scaler Model 2221 coupled to Ludlum Gas Proportional Detector Model 43-68, Physical Area: 126 cm2 (Ludlum Measurements, Inc., Sweetwater, TX)
Ludlum Ratemeter-Scaler Model 2221 coupled to E b e h e Geiger-Muller (GM) Detector Model HP-260, Physical Probe Area, 20 cm2 (Eberline, Sante Fe, NM)
Gamma
Ludlum Pulse Ratemeter Model 12 (Ludlm Measurements, Inc., Sweetwater, TX) coupled to Victoreen NaI Scintillation Detector Model 489-5.5, Crystal: 3.2 cm x 3.8 cm (Victoreen, Cleveland, OH)
LABORATORY ANALYTICAL INSTRUMENTATION
Low Background Gas Proportional Counter Model LB-5100-W (Tennelec/Canberra, Meriden, CT)
Quehanna Decommissioning Project (QDF') 1726/Reports/2007-0&03 Fmal C o n f i t o r y Surrey Report B- 1

LABORATORY ANALYTICAL INSTRUMENTATION (CONTINUED)
High Purity Extended Range Intrinsic Detector CANBERRA/Tennelec Model No: ERVDS30-25195 (Canberra, Meriden, CT) Used in conjunction with: Lead Shield Model G-11 (Nuclear Lead, Oak Ridge, TN) and Multichannel Analyzer DEC ALPHA Workstation (Canberra, Meriden, CT)
High Purity Extended Range Intrinsic Detector Model No. GMX-45200-5 (AMETEK/ORTEC, Oak Ridge, TN) used in conjunction with: Lead Shield Model SPG-16-IC8 (Nuclear Data) Multichannel Analyzer DEC ALPHA Workstation (Canberra, Meriden, CT)
High-Purity Germanium Detector Model GMX-30-P4, 30% Eff. (AMETEK/ORTEC, Oak Ridge, TN) Used in conjunction with: Lead Shield Model G-16 (Gamma Products, Palos Hills, E) and Multichannel Analyzer DEC ALPHA Workstation (Canberra, Meriden, CT)
Quehanna Decommissioning Project (QDP) B-2 1726/Reports/2007-08-03 Final C d i a t o r y Survey Report

APPENDIX C
SURVEY PROCEDURES
Quehanna Decommissioning Project (QDP) 172G/Reports/2007-08-03 Final Confirmatory Survey Report

APPENDIX C
SURVEY PROCEDURES
PROJECT HEALTH AND SAFETY
Pre-survey activities included the evaluation and identification of potential health and safety issues.
Tripping hazards over budding debris and other m a t e d s in the facility were of particular concern
for the indoor area surveys. Survey work was performed per the ORISE generic health and safety
plans and a site-specific integrated safety management (ISM) pre-job hazard checklist which was
completed and discussed with field personnel. EnergySolutians, U C (ESL) also provided site-
specific safety awareness training. All survey activities were conducted in accordance with ORISE
health and safety and radiation protection procedures.
QUALITY ASSURANCE
Field survey activities were conducted in accordance with procedures from the following
documents:
Survey Procedures Manual (August 7,2006)
Laboratory Procedures Manual (April 18,2006)
Quality Program Manual (March 1,2007)
The procedures contained in these manuals were developed to meet the requirements of the
U.S. Department of Energy (DOE) Order 414.1C: and the U.S. Nuclear Regulatory Commission
QHahp Assurance Manualfor the Ofice oflvuclear Material S a j p and Sq%guardr and contain measures to
assess processes during their performance.
Quality control procedures include:
Daily instrument background and check-source measurements to confirm that equipment
operation is within acceptable statistical fluctuations.
Participation in MAPEP, NRIP, and ITl' Laboratory Quality Assurance Programs.
Training and certihcation of all individual:s performing procedures
Periodic internal and external audits.
Quehanna Decommissioning Project (QDP) c:-1 1726/Reports/2007-08-03 Final C d m a t o r y Surrey Report

CALIBRATION PROCEDURES
Calibration of all field and laboratory instrumentation was based on standards/sources, traceable to
the National Institute of Standards and Technology (NET), when such standards/sources were
available. In cases where they were not available, standards of an industry-recogntzed organization
were used.
Detectors used for assessing surface activity were calibrated in accordance with ISO-7503'
recommendations. The total efficiency (ctotJ was determined for each instrument/detector
combination and consisted of the product of the 2n instrument efficiency (EJ and surface efficiency
(EJ: Etoral = E, x E,.
ORISE selected Sr-90 as the beta calibration source (maximum beta energy of 1410 keV) as it
provides a conservative representation of the primary beta emitters (CO-60 and Sr-90) and since the
release criteria was based on Sr-90 as per the DP and FSSP. ISO-7503 recommends an E, of 0.25
for beta emitters with a maximum energy of less than 0.4 MeV (400 k e y and an E, of 0.5 for
maximum beta energies greater than 0.4 MeV. Since the maximum beta energy for the chosen QDP
facility calibration source was greater than 0.4 MeV, an E, of 0.5 was used to calculate
Surface Scans
Hand-held detectors were placed on contact with the calibration sources. A postulated hot-spot size
of 100 cm' was assumed apriori for determining sc.anning instrument efficiencies. The beta scanning
Sr-90 E, value was 0.087 for the Geger-Muller (GM) detectors and 0.44 for the hand-held gas
proportional detectors; the calculated scanning Sr-90 E,, value was 0.05 for the GM detectors and
0.22 for the hand-held gas proportional detectors'. For the calibration source, emission rates were
not corrected for geometry when sources larger than the detectors were used.
The scanning
held gas proportional detectors with the exception that typical efficiencies for the floor monitor
were used for these survey activities rather than specific calibration efficiencies. For the floor
monitor, the scanning E, for Sr-90 was 0.42; the sc,anning E,, was 0.21'.
was determined for the floor monitor in the same fashion as above for the hand-
~~~ ~~
1Intemational Standard. IS0 7503-1, Evaluation of Surface Contarnination - Part 1: Beta-emitters (maximum beta energy greater than 0.15 MeV) and alpha-emitters. August 1,1988. 2 Decommissioning Health Physics: A Handbook for MARSSIM Users. E.W. Abelquist. Institute of Physics. 2001.
Quehanna Decommissioning Project (QDP) c-2 1726/Reports/2007-08-03 Final Confirmatory Surrey Report
Surface Activitv Measurements
The calibration E, values for the GM and hand-held gas proportional detectors used for the
c o n h a t o r y survey were 0.64 and 0.66 for Sr-90, respectively. Calibration source emission rates
were corxected to the active area of the detector when the calibration source area exceeded the
detector area. The static Sr-90 E,, values used were 0.32 for the GM detector and 0.33 for the gas
proportional detector.
SURVEY PROCEDURES
Surface Scans
Structural surface scans were performed by passing the detectors slowly over the surface; the
distance between the detector and the surface was maintained at a minimum-nominally about
1 cm. A large surface area, gas proportional floor monitor with a 0.8 milligram per square
centimeter (mg/cm’) window and a NaI scintillation detector were used to scan the floors of the
surveyed areas. Wall surfaces were scanned using small area hand-held gas proportional (126 cm’)
detectors with a 0.8 mg/cm2 window and GM (20 an’) detectors. Identification of elevated levels
was based on increases in the audible signal from the recording and/or indicating instrument.
Scan minimum detectable concentrations (MDCs) were estimated using the calculational approach
described in NUREG-15073. The scan MDC is a function of many variables, including the
background level. Site surface activity background levels were within the typical range of
800 to 1,400 counts per minute (cpm) for the large area gas proportional detectors (floor monitors)
and 200 to 450 cpm for the hand-held gas proportional detectors. The hand-held gas proportional
background for surface activity was re-determined on site and was 248 cpm; the GM background
was 60 cpm. Additional parameters selected for die calculation of scan MDC included a one-second
observation interval, a specified level of performance at the first scanning stage of 95% true positive
rate and 25% false positive rate, which yields a d’ value of 2.32 (NUREG-1507, Table 6.1), and a
surveyor efficiency of 0.5. To illustrate an example for the hand-held gas proportional detectors
with 0.8 mg/cm’ wiudows, the minimum detectable count rate (MDCR) and scan MDC can be
calculated as follows:
3NUREG-1507. Minunurn Detectable Concentrations with Typical Radiation Survey Instruments for Various Contaminants and Field Conditions. US Nuclear Regulatory Commission. Washington, DC; June 1998.
Quehanna Decommissicming Project (QDP) c-3 1726/Reports/2007-08-03 Final Confirmatory Surrey Report

bi = (248 cpm) (1 s) (1 min/60 s) = 4.13 counts
MDCR = (2.32) (4.13 counts)”’ [(60 s / W ) / (1 s)] = 283 cpm
MDCR-,,, = 283 / (0.5) ’’ = 400 cpm
The scan MDC is calculated using the total scanning efficiency (q0J of 0.22:
dpd100 cm2 scan MDC = -- MDC%rveyor
&,*,I
The scan MDC for the hand-held gas proportional. detector was calculated to be
1,820 dpm/100 cm‘; the scan MDC for the GM detector using the same calculational approach
was 3,940 cpm. For the given floor monitor backgpound ranges, the scan MDC ranged from
3,420 to 4,530 dpm/l00 cm’.
Specftc scan MDCs for the NaI scintillation detector for CO-60 and Cs-137 in concrete were not
determined as the instrument was used solely as a qualitative means to idenafy elevated gamma
activity. MDCs for radionuclides in the concrete would approximate those contained in NUREG-
1507 which are 5.8 and 10.4 pCi/g, respectively.
Surface Activity Measurements
Measurements of total beta surface activity levels were performed using hand-held gas proportional
and GM detectors coupled to portable ratemeter-scalers. Count rates (cprn), which were integrated
over one minute with the detector held in a static position, were converted to activity levels
(dpm/100 cm’) by dividing the count rate by the total static efficiency (E~XEJ and correcting for the
physical area of the detector. ORISE did not determine construction material-specific background
for each surface type encountered for determining net count rates. Instead, ORISE took a
conservative approach and did not subtract material specific backgrounds in determining surface
activity levels. At the request of the NRC, ORISE also determined the uncertainties for the h e c t
measurement results. The single-point 95% confidence level uncertainties were calculated as follows:
f i o u n t s + BKG TsT G
2 a = 2 x -
Quehama Decommissioning Project (QDP) c-4 1726/Reports/2007-0803 Final Confurnatory Surrey Report
where, rs = standard deviation of the count T = time (min) (same count time for Counts and BKG) + = total efficiency G = geometry factor BKG = background counts Counts = gross activity counts (source plus background)
Surface activity measurements were performed on concrete, brick, metal, and wood. The static
surface activity MDC was 185 dpm/lOO cm’ for tbie gas proportional detector and
609 dpm/100 cm2 for the GM detector. The physical surface areas assessed by the gas proportional
and GM detectors were 126 and 20 cm’, respectively.
Miscellaneous Samplinz
Concrete bore and metal roof samples were colleci;ed by EnergySolzttions personnel. These samples
were placed in plastic bags and sealed. ORISE selected several samples and labeled them in
accordance with ORISE survey procedures.
RADIOLOGICAL ANALYSIS
Gross Beta
Smears were counted for two minutes on a low-background gas proportional system for gross beta
activity. The MDC of the gross beta procedure was 15 dpm/100 cm’.
Gamma SDectrometrv
Miscellaneous (concrete bore and metal roof) samples were placed in an appropriate container. The
container was placed approximately 10 cm above the detector in an air filter geometry to minimize
the affect of the sample quantity. Samples of concrete were dried, mixed, crushed, and/or
homogenized as necessary, and a portion sealed in an appropriate container-the quantity placed in
the container was chosen to reproduce the calibrated counting geometry. Net material weghts were
determined and the samples counted using intrinsi~c germanium detectors coupled to a pulse heght
analyzer system. Background and Compton stripping, peak search, peak identification, and
concenttation calculations were performed using the computer capabilities inherent in the analyzer
system.
Quehanna Decommissioning Project (QDP) c-5 1726/Reports/2007-08-03 Find C d i a t o r y Surrey Report

All total absorption peaks (TAP) associated with die radionuclides-of-concern were reviewed for
consistency of activity. TAPS used for determining the activities of radionuclides of concern and the
typical associated MDCs for a one-hour count time were:
CO-60 Cs-137
1.173 0.05 0.662 0.05
Spectra were also reviewed for other identifiable TAPS.
Strontium Analvses
Solid samples were ashed and dissolved as necessaq. Samples with hgh calcium concentrations had
carriers and ethylenediaminetetraacetate (Na,EDTA) added and were passed through a cation
exchange resin. Alkali metals and most alkalrne earths were absorbed on the cation resin, and the
complexed calcium passed through unabsorbed. Alkaline earth metals were removed from the
cation resin by elution with a sodium chloride solution and precipitated as carbonates. Barium was
removed by chromate precipitation.
Strontium concentrations within the samples were then detemined in a low-background gas
proportional counter, and the count rate was corrected for p u m ingrowth. The chemical yield
was determined gravimetrically. The typical MDC of the procedure is 2 pCi/g wet weight for
concrete.
DETECTION LIMITS
The uncertainties associated with the analpcal data presented in the tables of t h i s report represent
the total propagated uncertainties for that data. These uncertainties were calculated based on both
the gross sample count levels and the associated background count levels.
Detection limits, referred to as minimum detectable concen.tration (MDC), were based on 3 plus
4.65 times the standard deviation of the background count [3 + (4.65 (BKG)””>. Because of
vadations in background levels, measurement efficiencies, and contributions from other
radionuclides in samples, the detection limits drffer from sample to sample and instrument to
instrument. The uncertainties associated with the direct measurement data presented in the tables of
this report were calculated based on counting statistics only.
Quehanna Decommissioning Project (QDP) C-6 1726/R~01B/2007-08-03 Find Confirmatory R ~ o I T