atrial fibrillation: risk factor or risk marker? what are ... · pdf fileatrial fibrillation:...
TRANSCRIPT

Atrial Fibrillation:Risk factor or risk marker? What are the differences?
Jeff Healey MD, MSc, FRCPC
Population Health Research Institute
McMaster University
Hamilton, Canada

Disclosures
• Research Grants
• Medtronic, Boston Scientific, St. Jude Medical, Boehringer-Ingelheim, Bayer,
Bristol-Meyers-Squibb
• Speaking Fees
• Medtronic, Boston Scientific, St. Jude Medical, Boehringer-Ingelheim, Bayer,
Bristol-Meyers-Squibb
Speaker
What is Causality?
• Aristotle
• Formal, Material, Efficient and Final causes
• Hume
• Can never be sure;
• Cause and effect must be contiguous in space and time; cause must occur before
the effect and there be a constant union between the two
• Similar constructs in Hindu and Buddhist philosophy
• Multiple causal models and theories to help “prove” causation
Speaker

Criteria for Causation: Sir Austin Bradford Hill
Factor AF and Stroke
Strength 2-6-fold increased RR, OR, HR; PAR high, but confounding
Consistency Observation in many populations, CHADS-VASc
Specificity Difficult –many types and “causes” of stroke
Temporality Difficulty defining all AF; post-stroke monitoring studies
Biological gradient Unclear AF threshold for clinical AND sub-clinical AF
Plausibility Pathology and TE echo studies; but small and/or old; cannot see all thrombi
Coherence Animal models; but easy to adapt; relevance to SCAF?
Experimental Data lacking, RCTs in AF – both drug and device
Analogy Many but not specific
Speaker

“Serial sections of the left atrial appendage were prepared
[in AF-patients with embolic stroke]…in every case mural
thrombus, not obvious to the naked eye, was found in the
interstices of the trabeculae carneae.”
C.M. Fisher. Can Med Assoc J 1953; 69: 257.
1913-2012 (b. Waterloo, Ontario)
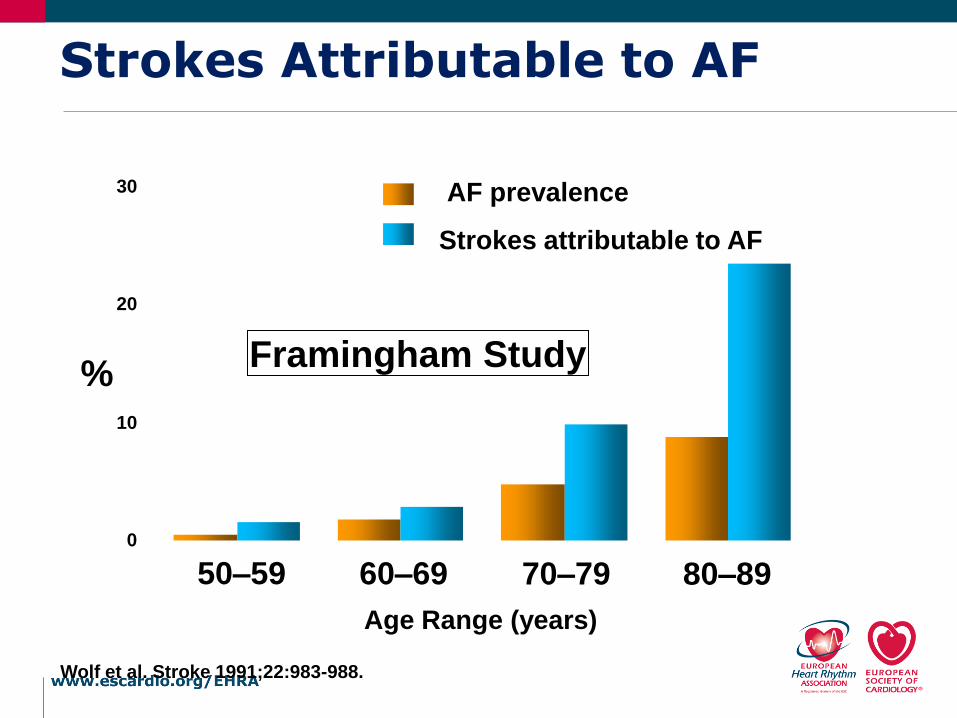
0
10
20
30
Wolf et al. Stroke 1991;22:983-988.
50–59 60–69 70–79 80–89
%
AF prevalence
Strokes attributable to AF
Age Range (years)
Strokes Attributable to AF
Framingham Study

ACTIVE-AVERROESN=6563, ASA-treated
Venassche T. Eur Heart J. 2014

ASSERT: Clinical OutcomesHealey JS, NEJM 2012
Event
Device-Detected Atrial Tachyarrhythmia Device-Detected Atrial
Tachyarrhythmia Present vs. absentAbsent
N=2319PresentN= 261
events %/year events %/ year RR 95% CI p
Ischemic Stroke or Systemic Embolism
40 0.69 11 1.69 2.49 1.28 – 4.85 0.007
Vascular Death 153 2.62 19 2.92 1.11 0.69 – 1.79 0.67
Stroke / MI / VascularDeath
206 3.53 29 4.45 1.25 0.85 – 1.84 0.27
Clinical Atrial Fibrillation or Flutter
71 1.22 41 6.29 5.56 3.78 – 8.17 <0.001
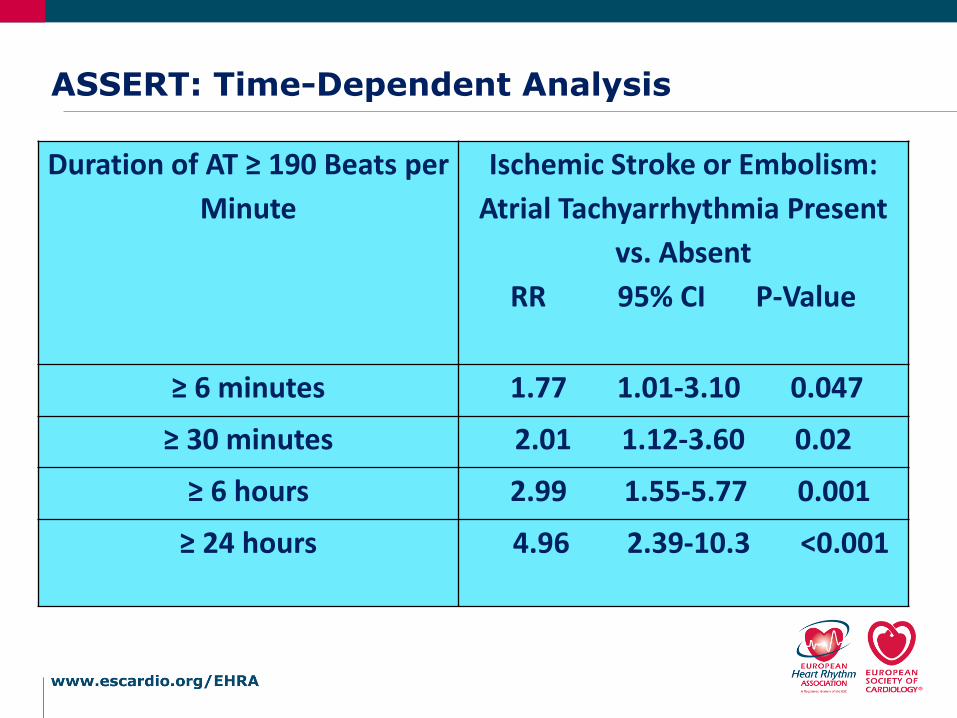
ASSERT: Time-Dependent Analysis
Duration of AT ≥ 190 Beats per
Minute
Ischemic Stroke or Embolism:
Atrial Tachyarrhythmia Present
vs. Absent
RR 95% CI P-Value
≥ 6 minutes 1.77 1.01-3.10 0.047
≥ 30 minutes 2.01 1.12-3.60 0.02
≥ 6 hours 2.99 1.55-5.77 0.001
≥ 24 hours 4.96 2.39-10.3 <0.001

ASSERT: Outcomes by CHADS2Healey JS, NEJM 2012
CHADS2
ScoreTotal Pts.
Sub-clinical Atrial Tachyarrhythmia between enrollment and 3 months Sub-clinical Atrial
Tachyarrhythmia
Present vs. absentPresent Absent
Pts. events%/yea
rPts.
events
%/year HR 95% CIP
(trend)
1 600 68 1 0.56 532 4 0.28 2.110.23 –18.9
0.352 1129 119 4 1.29 1010 22 0.77 1.830.62 –5.40
>2 848 72 6 3.78 776 18 0.97 3.931.55 –9.95

Risk Factor Score
Congestive Heart
Failure
1
Hypertension 1
Age ≥ 75 1
Diabetes Mellitus 1
Stroke/TIA/
Thromboembolism
2
Maximum Score 6
0
4
8
12
16
20
0 1 2 3 4 5 6
Stroke rate/ 100 patient yr
CHADS2
1.9%
Stroke Risk by Clinical Factors

Outcomes of Cohort StudyBinici, Circulation 2010
Death or Stroke Hospitalization for AF
P=0.0366 P=0.014
Copenhagen Holter Study: Age 55-75. One 48 hour Holter.Positive defined as > 30 PACs per hour or any run ≥ 20 beats. Mean follow-up of 6.3 years

Relationship between AF and Stroke
Brambatti MCirculation 2014
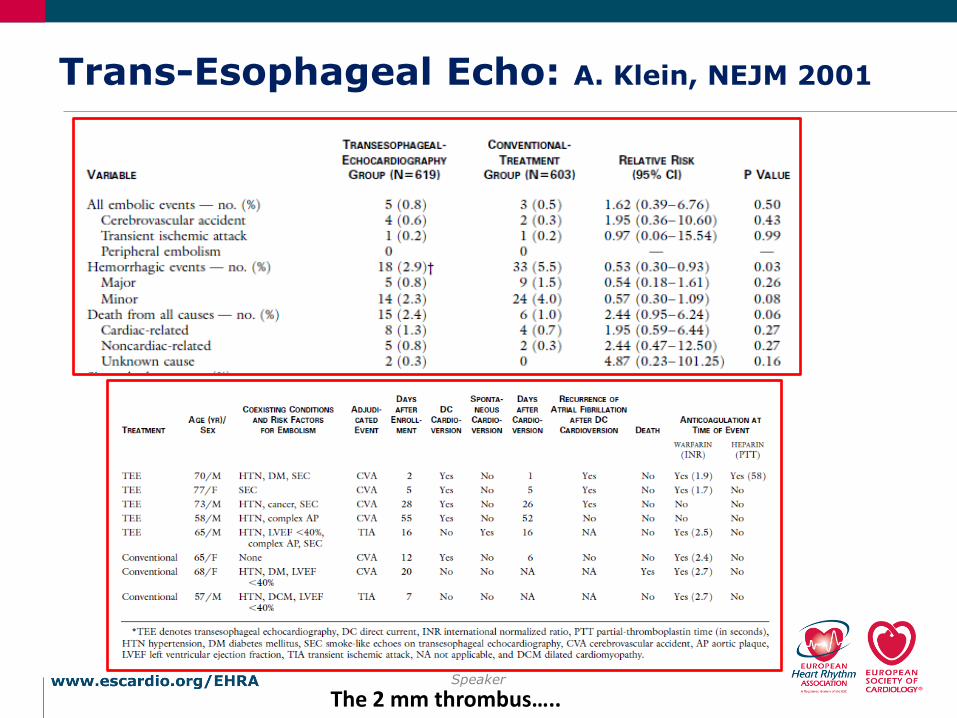
Trans-Esophageal Echo: A. Klein, NEJM 2001
Speaker
The 2 mm thrombus…..

Challenges to Proof of Causality
• Defining AF
• Monitoring studies
• AF vs. SCAF vs. atrial tachycardia vs. PACs
• Historical studies mostly persistent/permanent AF
• Defining Surrogates
• LAA clot vs. spontaneous echo contrast (smoke)
• Defining Outcomes
• Stroke
• Covert stroke
• Cognitive decline
• Determining Temporal Relationship
• Experiment…
Speaker

Hart RG, Pearce LA, Aguilar MI. Ann Intern Med 2007: 146: 857-67.
64% (95%CI 49,74)
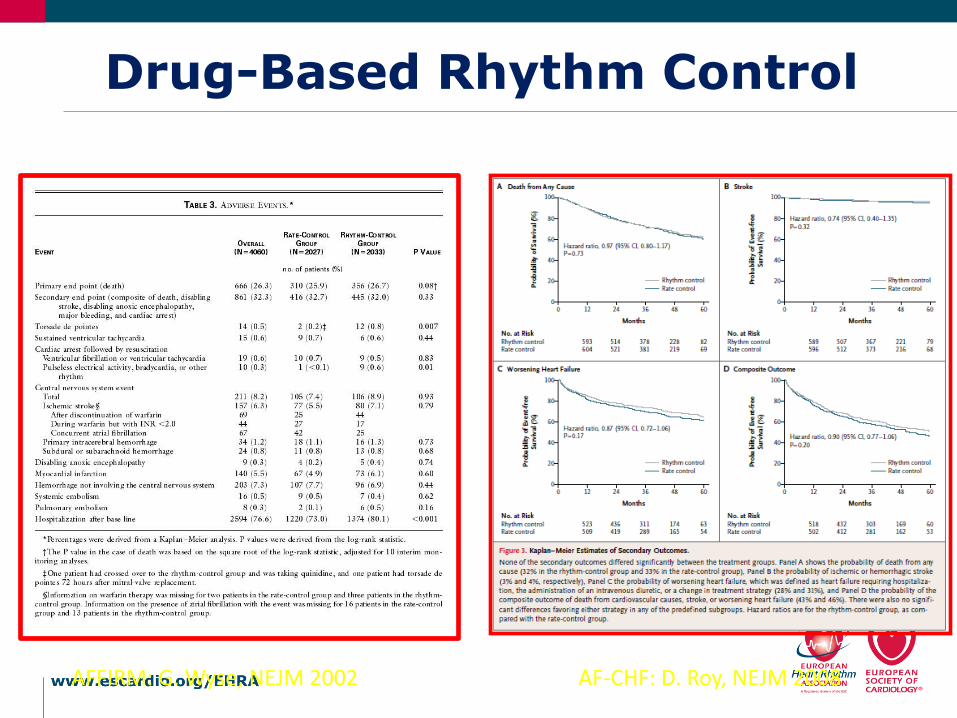
Drug-Based Rhythm Control
AF-CHF: D. Roy, NEJM 2008AFFIRM: G. Wyse, NEJM 2002

Centres N Follow-
up (mo)
CHADS2 score OAC stopped Events per year in OAC
stopped
Oral 200644 Single US 522 25 Not stated 78% of CHADS
0 and 68% ≥1
0
Nademanee 200845 Single US 517 26 Not stated; mean about 1 84% 0.4% per year
Themistoclakis
201046
5 US/ Europe 3555 28 60%=0, 27%=1, 13% =2 80.2% 0.04% strokes per year
Chao 201147 Single Taiwan 565 39 Median 1 Not clear 1.5% stroke/TIA per year for
whole group (i.e on and off
OAC)
Saad 201148 Single Brazil 327 46 Mean 1.89 91% 0
Yagishita 201149 Single Japan 524 44 0-1=85%, 2 or more=15% 82% 0.16% per year
Hunter 201250 7 UK/
Australia
1273 36 (in those stopping OAC) 57%
=0, 34% =1, 7% >1
64% 0.16% stroke/TIA Per year
Guiot 201251 Single US 1016 34 Mean 1.1 60% 1% stroke per year
Reynolds 201252 US
multicenter
812 36 40% 3.4 % stroke/TIA per year for
whole group (i.e. on and off
OAC)
Bunch 201353 Single US 4212 36 20%=0, 20%=1, 5%=2, 56%>2 Not included 1.5% risk of stroke per year in
ablation arm
Gaita 201454 Single Italy 766 60.5 84%=0 or 1, 16%= 2+, 5%=3+ 64% (all pts
with CHADS or
more)
0.2 per 100 patient years for
those off OAC
Stroke risk after AF ablation

Pacing Mode and Outcomes
Atrial Fibrillation Stroke
Healey JS, Circulation 2006

Does atrial fibrillation cause stroke?
• Difficult to say with certainty in all cases where the two conditions are sequentially associated
• In some cases, the conventional paradigm is undoubtedly true
• In others, it is undoubtedly false
• Some strategies to prevent AF-associated stroke depend on our understanding of causality, while others do not
Speaker

LAAOS-III
• Most strokes (70%) in AF patients are cardio-embolic originating from the LAA
• 90% of the clots are in the LAA in AF patients
• N=3500; both receiving and not receiving OAC
=
The Optimal Anticoagulation for Enhanced Risk Patients Post-AF Ablation (OCEAN) Trial
Atul Verma David Birnie
O C E A NThe Optimal Anticoagulation for Enhanced Risk Patients Post-AF
Ablation TrialDavid Birnie, Ottawa Heart Institute
Atul Verma, Southlake Regional Health Centre