ats company reports: accelya kale
TRANSCRIPT


Company Details
Accelya Kale Solutions Limited is part of the Accelya Group, a leading solutions provider to the Airline and Travel industry.
Formerly known as Kale Consultants Limited, the company became part of the Accelya Group in 2011.
As part of the Accelya Group, we help over 200 airline customers streamline their financial processes. We also help them gain
insights on business performance using decision support tools and data analytics. The company expertise spans across
Revenue Accounting, Audit & Revenue Recovery, Credit Card Management, Miscellaneous Billing, F&A Processes and Decision
Support & Analytics. As a strategic partner to IATA, we deliver robust industry solutions including BSP, BSP Link, Neutral Fare
Proration (NFP) and Simplified Interline Settlement (SIS).
The company has launched new version of its flagship product called ‘REVERA NEXT’. The enhanced version of REVERA sets
new benchmarks in Revenue Accounting on accuracy, speed and intelligence – across passenger, cargo and airmail. REVERA
NEXT is now ready from technology perspective to meet demands of global airlines for the next decade. It will also help in
creating further differentiation vis-à-vis our competitors. REVERA NEXT also addresses the needs of Low Cost Carriers who are
moving to hybrid models. Accelya Kale’s Finesse suite of products has been well received by the Airline industry. On the back of
excellent traction to miscellaneous billing solution- FinesseMBSTM, the Company launched FinesseCostTM to help airlines
prevent overpayments to suppliers and efficiently manage their Direct Operating Costs (DOC).
The management is confident that new version places the company relatively in better position in comparison to competitors.
Moreover, they have come out with a solution specially customized for low-cost carriers, which provides new avenue for growth,
going forward.
Currently the company is primarily dependent on traditional airliners for majority portion of its revenue. Experience and
knowledge of the airline industry enables the company to upgrade processes to industry best standards. The company is present
in 10 countries and employ over 2000 professionals across the globe.
The current market capitalization stands at Rs 1,376.57 crore. The company has reported a consolidated sales of Rs 77.05 crore
and a Net Profit of Rs 17.07 crore for the quarter ended Dec 2014.

Category No. of Shares Percentage
Other Companies 545,526 3.65
Foreign Promoters 11,143,295 74.66
General Public 2,421,629 16.22
Foreign Institutions 364,157 2.44
NBFC and Mutual Funds 273,831 1.83
Foreign - NRI 145,050 0.97
Foreign Industries 19,682 0.13
Financial Institutions 9,926 0.07
Others 3,165 0.02
Market Cap (Rs Cr) – 1376.57
Company P/E – 16.69
Industry P/E – 24.71
Book Value (Rs) – 53.81
Dividend (%) – 490 %
EPS (TTM) – 55.26
Dividend Yield (%) – 5.31%
Face Value (Rs) - 10
Share Holding Pattern Financial Details

Balance Sheet
Jun '14 Jun '13 Jun '12 Jun '11 Mar '10
Sources Of Funds
Total Share Capital 14.93 14.93 14.93 15.88 13.81
Equity Share Capital 14.93 14.93 14.93 15.88 13.81
Reserves 65.39 61.37 91.01 113.88 97.74
Networth 80.32 76.30 105.94 129.76 112.35
Secured Loans 0.00 0.00 0.07 1.36 4.56
Total Debt 0.00 0.00 0.07 1.36 4.56
Total Liabilities 80.32 76.30 106.01 131.12 116.91
Application Of Funds
Gross Block 65.94 61.09 50.47 66.26 78.24
Less: Accum. Depreciation 34.04 28.47 24.54 51.37 48.73
Net Block 31.90 32.62 25.93 14.89 29.51
Capital Work in Progress 1.06 1.94 2.82 3.78 0.28
Investments 72.40 75.78 40.35 41.15 33.02
Sundry Debtors 27.98 26.82 23.38 25.53 33.25
Cash and Bank Balance 9.86 18.22 20.16 8.29 21.22
Total Current Assets 37.84 45.04 43.54 33.82 54.47
Loans and Advances 39.48 44.41 52.72 48.48 31.93
Fixed Deposits 0.00 0.00 0.00 17.94 4.19
Total CA, Loans & Advances 77.32 89.45 96.26 100.24 90.59
Current Liabilities 29.59 16.46 25.29 20.16 24.83
Provisions 72.77 107.02 34.08 8.78 11.65
Total CL & Provisions 102.36 123.48 59.37 28.94 36.48
Net Current Assets -25.04 -34.03 36.89 71.30 54.11
Total Assets 80.32 76.31 105.99 131.12 116.92
Contingent Liabilities 2.17 3.68 5.36 1.61 1.99
Book Value (Rs) 53.81 51.11 70.97 81.71 80.76

Profit and Loss Account
Jun '14 Jun '13 Jun '12 Jun '11 Mar '10
Income
Sales Turnover 283.21 262.38 181.29 170.27 126.73
Net Sales 283.21 262.38 181.29 170.27 126.73
Other Income 19.35 4.72 8.92 0.13 0.55
Total Income 302.56 267.10 190.21 170.40 127.28
Expenditure
Power & Fuel Cost 0.00 0.00 2.23 2.71 2.28
Employee Cost 110.70 94.25 78.15 85.58 10.80
Other Manufacturing Expenses 0.00 0.00 0.00 9.18 57.96
Selling and Admin Expenses 0.00 0.00 0.00 31.47 20.27
Miscellaneous Expenses 50.79 57.02 55.34 11.40 5.48
Preoperative Exp Capitalised 0.00 0.00 0.00 -3.41 -3.11
Total Expenses 161.49 151.27 135.72 136.93 93.68
Operating Profit 121.72 111.11 45.57 33.34 33.05
PBDIT 141.07 115.83 54.49 33.47 33.60
Interest 0.41 0.46 0.73 1.75 0.26
PBDT 140.66 115.37 53.76 31.72 33.34
Depreciation 12.17 10.90 7.12 15.89 6.21
Other Written Off 0.00 0.00 0.00 0.00 6.89
Profit Before Tax 128.49 104.47 46.64 15.83 20.24
Extra-ordinary items 0.00 0.00 0.00 -0.82 0.31
PBT (Post Extra-ord Items) 128.49 104.47 46.64 15.01 20.55
Tax 38.90 33.23 15.21 1.69 1.12
Reported Net Profit 89.59 71.24 31.41 13.33 19.14
Total Value Addition 161.49 151.27 135.73 136.93 93.67
Equity Dividend 73.14 104.48 36.36 3.40 2.76
Corporate Dividend Tax 12.43 17.76 5.90 0.55 0.46
Per share data (annualised)
Shares in issue (lakhs) 149.26 149.26 149.26 158.80 138.14
Earning Per Share (Rs) 60.02 47.73 21.05 8.39 13.86
Equity Dividend (%) 490.00 700.00 235.00 20.00 20.00

Dividend History

Index and Company Comparison
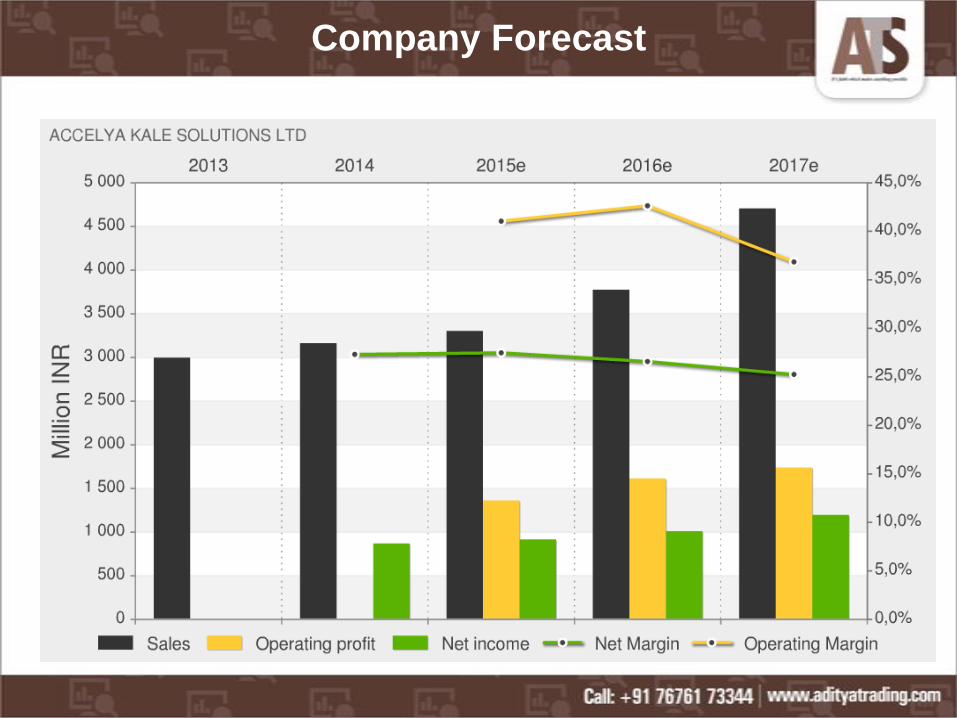
Company Forecast

PBIT – 36.2 v/s 37.51
RoCE – 160.48 v/s 137.53
RoE – 114.42 v/s 78.19
Net Profit Margin – 29.61 v/s 26.67
Return on net worth – 111.54 v/s 93.38
D/ E Ratio – Nil
Interest Cover – 318.21 v/s 226.68
Current Ratio – 0.76 v/s 0.72
Reserves – 65.39 cr v/s 61.37 cr
PAT – 89.59 cr v/s 71.24 cr
Total assets – 80.32 cr v/s 76.31 cr
Net sales – 283.21 cr v/s 263.38 cr
Book Value – 53.81 cr v/s 51.11 cr
Important Ratios
Days BSE NSE
30 989.01 989.98
50 986.76 987.76
150 820.27 820.96
200 783.51 784.01
Simple Moving Average

Symbol Value Action
RSI(14) 68.648 Buy
STOCH(9,6) 62.558 Buy
STOCHRSI(14) 41.281 Sell
MACD(12,26) 152.070 Buy
ADX(14) 46.717 Buy
Williams %R -31.419 Buy
CCI(14) 124.1875 Buy
ATR(14) 130.9500 Less Volatility
Highs/Lows(14) 76.9500 Buy
Ultimate Oscillator 56.339 Buy
ROC 21.731 Buy
Bull/Bear Power(13) 286.5580 Buy
Technical Indicators

Recommendations
Buy Accelya Kale Solutions Ltd. at current or
lower market levels
Reasons for the recommendations are :
Zero debt company with healthy ratios.
Up gradation of technology products will increase the efficiency and market share of the
company.
Lack of market competition in this segment of software industry.
Highly impressive dividend history of the company.
With airline industry always struggling for more efficiency and low overheads, this company
stands for a better future ahead.
Business model and products are sticky in nature and hence will make their customers
dependent on them for long term-A moat.
