ats company reports: elgi equipments ltd
TRANSCRIPT


Current price 140.65
Sector Compressors
No of shares 158454508
52 week high 174.80
52 week low 93.95
BSE Sensex 27457.58
Nifty 8342.15
Average Volume 54,748
BSE Code 522074
NSE Symbol ELGIEQUIP
Elgi Equipments Ltd.
Recommendation
– BUY/HOLD
Date – 26/03/2015
Company Overview
Elgi Equipments Limited is a leading air compressor manufacturer with a broad line of innovative and
technologically superior compressed air systems. Elgi has earned worldwide distinction for designing
sustainable solutions that help companies achieve their productivity goals and keep the cost of ownership low.
Elgi offers a complete range of compressed air solutions from oil-lubricated and oil-free rotary screw
compressors, oil-lubricated and oil-free reciprocating compressors and centrifugal compressors, to dryers,
filters and downstream accessories. ELGI has received ISO 9001:2000 certification for its quality
management.
Companies subsidiary includes Adisons Precision Instruments Manufacturing Company Limited, ATS Elgi
Limited, Elgi-Gulf (FZE), Elgi Equipments (Zhejiang) Limited (China), Elgi Compressors Trading (Shanghai)
Co. Ltd. (China), SAS Belair (France), Elgi Compressores DO BRASIL IMP. E.EXP. Ltda, Elgi Australia Pty
Ltd., Elgi Compressors Italy S.r.l., Elgi Compressors USA Inc, Rotair Spa (Italy), Patton's Inc (USA), Patton's
Medical LLC. (USA) and PT Elgi Equipments Indonesia.
The products range includes Rotary Screw Air Compressors, Reciprocating Air Compressors , Automotive
Equipments , Railway Compressor and OE and ELGI New Generation Compressors.
The company’s portfolio of over 400 products has found wide application across industries. Whether it is the
paint on your wall, the car you drive, the medicines you take or the leather bag you carry, Elgi products have
been used either in their production, maintenance or usage. ELGI has a presence in all the major markets
across the world covering Europe, North America, Latin America, Africa, Australia, Middle East, South East
Asia, West Asia and the Far East. The current market capitalization stands at Rs 2,242.13 crore.
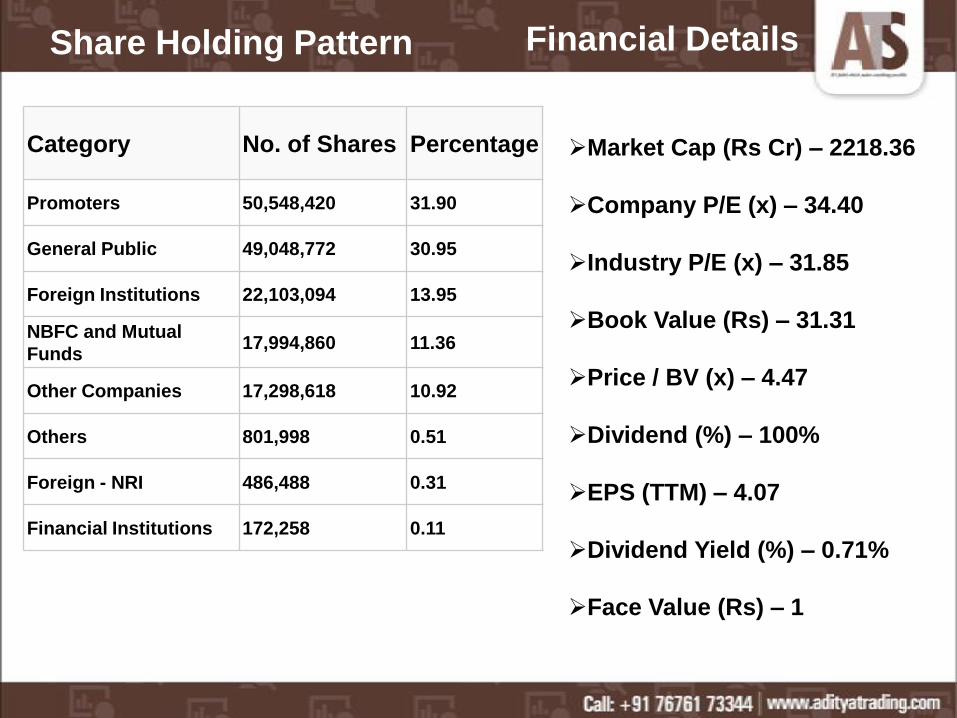
Category No. of Shares Percentage
Promoters 50,548,420 31.90
General Public 49,048,772 30.95
Foreign Institutions 22,103,094 13.95
NBFC and Mutual
Funds17,994,860 11.36
Other Companies 17,298,618 10.92
Others 801,998 0.51
Foreign - NRI 486,488 0.31
Financial Institutions 172,258 0.11
Market Cap (Rs Cr) – 2218.36
Company P/E (x) – 34.40
Industry P/E (x) – 31.85
Book Value (Rs) – 31.31
Price / BV (x) – 4.47
Dividend (%) – 100%
EPS (TTM) – 4.07
Dividend Yield (%) – 0.71%
Face Value (Rs) – 1
Share Holding Pattern Financial Details
Industry Overview
The industrial compressors industry in India, currently valued at INR 33bn (~USD 550mn) in FY 2014, has
been growing at a CAGR of ~7% for the last three years. Value Notes estimates that the industry will be worth
approximately INR 50bn (~USD 833 million) by FY 2019, growing at CAGR of ~9%
Though screw compressors have captured 50% of the overall industrial compressors market (by value) in
India, centrifugal compressors are currently in a state of growth with 30% of the market (by value). In the
future, centrifugal compressors will have a ~38% share of the overall industrial compressors market (by
value).
Growth in the automobile, steel, power, oil & gas and cement industries are generating demand for industrial
compressors. Emerging industries like geo thermal and waste heat will boost the demand for industrial
compressors. The report includes profiles of the top-5 players with a brief overview about their service
offerings, key financial ratios, expansion strategies, etc.
Industrial compressors industry is used to create a high pressure for functioning heavy machines in industries
such as cement, steel, oil & gas, petroleum, textile, etc. Industrial compressors can be classified into
reciprocation, centrifugal and screw compressors. Screw compressors are highest selling compressors in
India followed by centrifugal compressors. Centrifugal compressors are slowly replacing screw compressors
because of their higher energy efficiency, high level of compression and noise free operations.
Many expansion projects, which are in the pipeline in the oil & gas, cement and steel industries, will be
executed in the next 4-5 years and this will generate overall demand for industrial compressors in India.
Balance Sheet
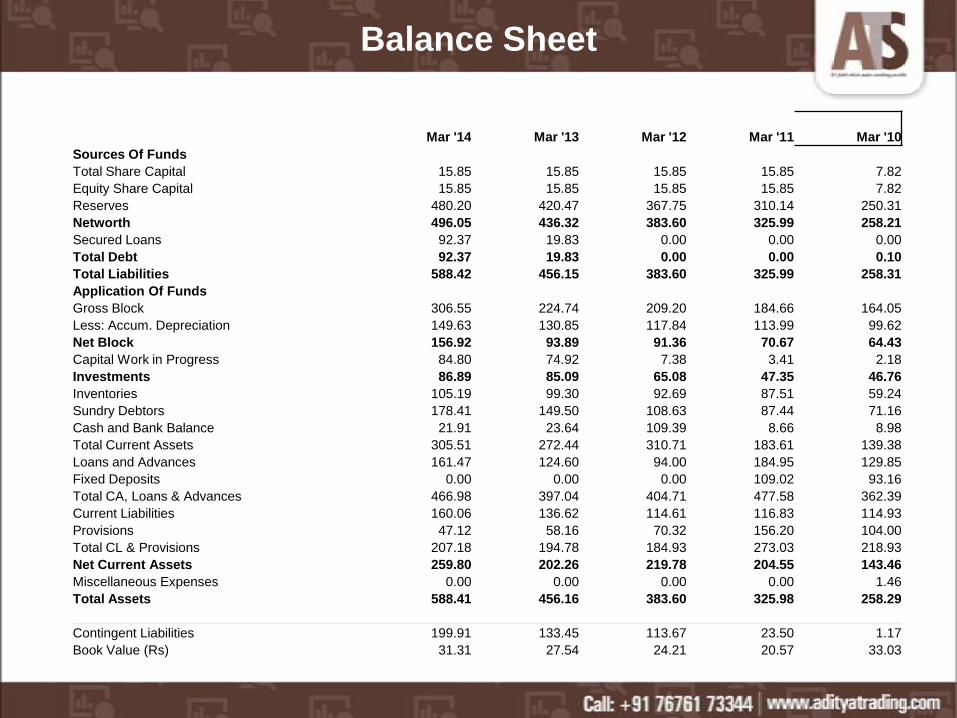
Mar '14 Mar '13 Mar '12 Mar '11 Mar '10
Sources Of Funds
Total Share Capital 15.85 15.85 15.85 15.85 7.82
Equity Share Capital 15.85 15.85 15.85 15.85 7.82
Reserves 480.20 420.47 367.75 310.14 250.31
Networth 496.05 436.32 383.60 325.99 258.21
Secured Loans 92.37 19.83 0.00 0.00 0.00
Total Debt 92.37 19.83 0.00 0.00 0.10
Total Liabilities 588.42 456.15 383.60 325.99 258.31
Application Of Funds
Gross Block 306.55 224.74 209.20 184.66 164.05
Less: Accum. Depreciation 149.63 130.85 117.84 113.99 99.62
Net Block 156.92 93.89 91.36 70.67 64.43
Capital Work in Progress 84.80 74.92 7.38 3.41 2.18
Investments 86.89 85.09 65.08 47.35 46.76
Inventories 105.19 99.30 92.69 87.51 59.24
Sundry Debtors 178.41 149.50 108.63 87.44 71.16
Cash and Bank Balance 21.91 23.64 109.39 8.66 8.98
Total Current Assets 305.51 272.44 310.71 183.61 139.38
Loans and Advances 161.47 124.60 94.00 184.95 129.85
Fixed Deposits 0.00 0.00 0.00 109.02 93.16
Total CA, Loans & Advances 466.98 397.04 404.71 477.58 362.39
Current Liabilities 160.06 136.62 114.61 116.83 114.93
Provisions 47.12 58.16 70.32 156.20 104.00
Total CL & Provisions 207.18 194.78 184.93 273.03 218.93
Net Current Assets 259.80 202.26 219.78 204.55 143.46
Miscellaneous Expenses 0.00 0.00 0.00 0.00 1.46
Total Assets 588.41 456.16 383.60 325.98 258.29
Contingent Liabilities 199.91 133.45 113.67 23.50 1.17
Book Value (Rs) 31.31 27.54 24.21 20.57 33.03
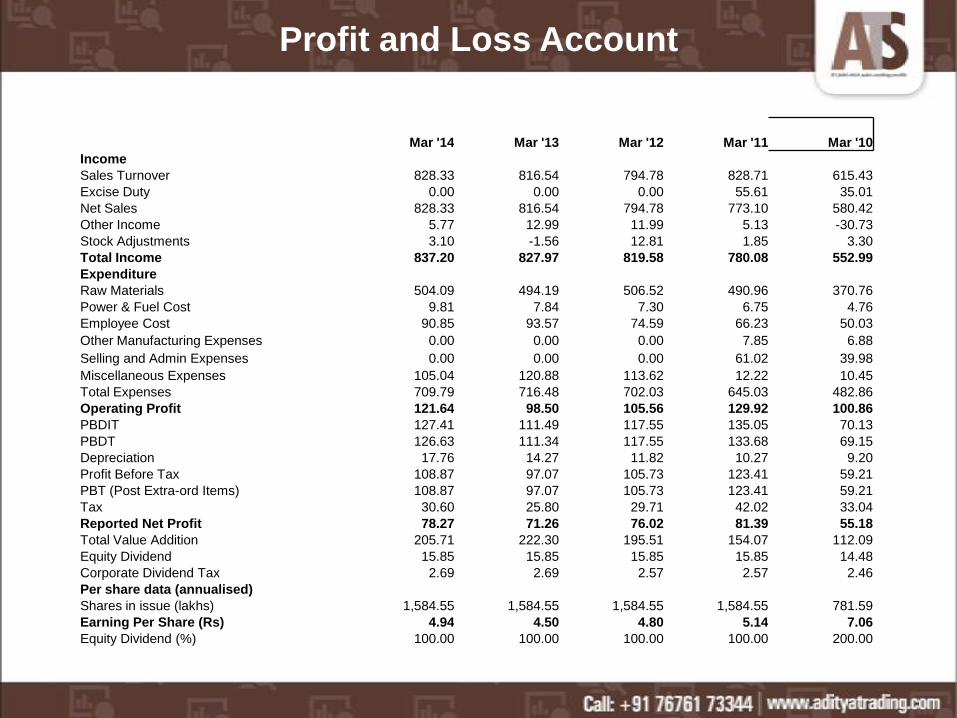
Profit and Loss Account
Mar '14 Mar '13 Mar '12 Mar '11 Mar '10
Income
Sales Turnover 828.33 816.54 794.78 828.71 615.43
Excise Duty 0.00 0.00 0.00 55.61 35.01
Net Sales 828.33 816.54 794.78 773.10 580.42
Other Income 5.77 12.99 11.99 5.13 -30.73
Stock Adjustments 3.10 -1.56 12.81 1.85 3.30
Total Income 837.20 827.97 819.58 780.08 552.99
Expenditure
Raw Materials 504.09 494.19 506.52 490.96 370.76
Power & Fuel Cost 9.81 7.84 7.30 6.75 4.76
Employee Cost 90.85 93.57 74.59 66.23 50.03
Other Manufacturing Expenses 0.00 0.00 0.00 7.85 6.88
Selling and Admin Expenses 0.00 0.00 0.00 61.02 39.98
Miscellaneous Expenses 105.04 120.88 113.62 12.22 10.45
Total Expenses 709.79 716.48 702.03 645.03 482.86
Operating Profit 121.64 98.50 105.56 129.92 100.86
PBDIT 127.41 111.49 117.55 135.05 70.13
PBDT 126.63 111.34 117.55 133.68 69.15
Depreciation 17.76 14.27 11.82 10.27 9.20
Profit Before Tax 108.87 97.07 105.73 123.41 59.21
PBT (Post Extra-ord Items) 108.87 97.07 105.73 123.41 59.21
Tax 30.60 25.80 29.71 42.02 33.04
Reported Net Profit 78.27 71.26 76.02 81.39 55.18
Total Value Addition 205.71 222.30 195.51 154.07 112.09
Equity Dividend 15.85 15.85 15.85 15.85 14.48
Corporate Dividend Tax 2.69 2.69 2.57 2.57 2.46
Per share data (annualised)
Shares in issue (lakhs) 1,584.55 1,584.55 1,584.55 1,584.55 781.59
Earning Per Share (Rs) 4.94 4.50 4.80 5.14 7.06
Equity Dividend (%) 100.00 100.00 100.00 100.00 200.00

Dividend and Bonus History

Index and Company Price Movement Comparison
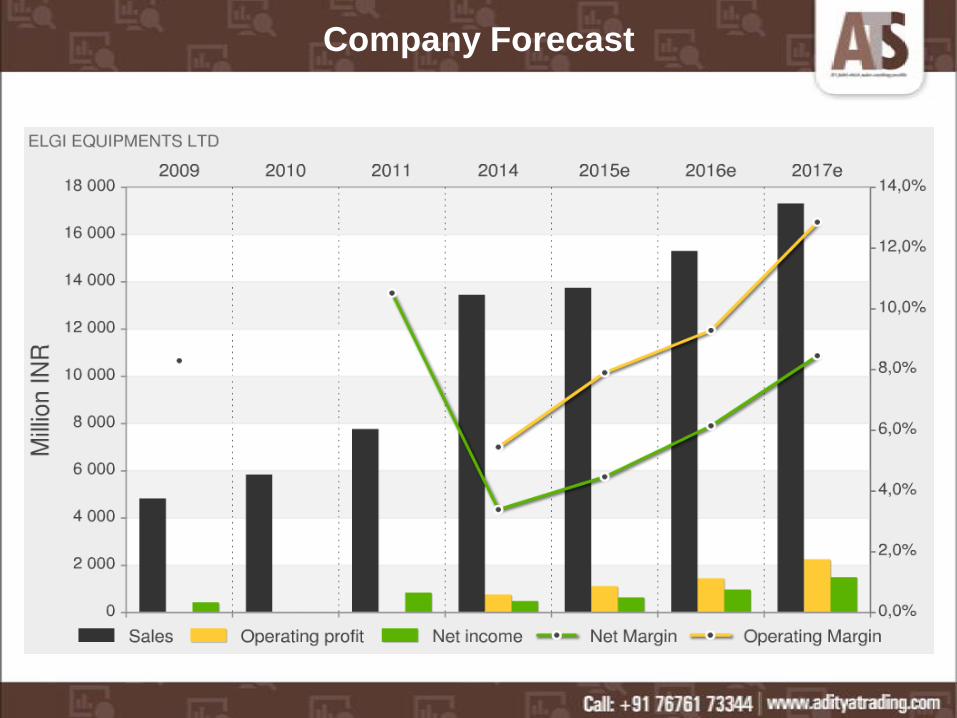
Company Forecast

Symbol Value Action
RSI(14) 63.918 Buy
STOCH(9,6) 61.915 Buy
STOCHRSI(14) 16.369 Oversold
MACD(12,26) 17.120 Buy
ADX(14) 76.159 Overbought
Williams %R -39.401 Buy
CCI(14) 99.9926 Buy
ATR(14) 22.2750 High Volatility
Highs/Lows(14) 0.4750 Buy
Ultimate Oscillator 40.587 Sell
ROC 58.697 Buy
Bull/Bear Power(13) 52.3000 Buy
Technical Indicators

PBIT – 12.45 v/s 10.15
RoCE – 15.00 v/s 17.00
RoE – 16.65 v/s 16.59
Net Profit Margin – 9.40 v/s 8.69
Return on net worth – 16.8 v/s 17.4
D/E Ratio – 0.19 v/s 0.05
Interest Cover – 141.10 v/s 661.32
Current Ratio – 2.25 v/s 2.04
Reserves – 480.20 cr v/s 420.47 cr
PAT – 78.27 cr v/s 71.26 cr
Total assets – 588.41 cr v/s 456.16 cr
Net sales – 828.33 cr v/s 816.54 cr
Book Value – 31.31 v/s 27.54
Important Ratios (YoY)
Days BSE NSE
30 149.00 149.42
50 153.19 153.40
150 142.57 142.72
200 136.79 136.91
Simple Moving Average

Investment Rationalize
Elgi Equipments is one of the leading player in Indian Compressor market with a market share of 29% and
CAGR of 13% in revenue current numbers stands at Rs.922 crore.
Elgi Equipments have invested heavily in increasing the manufacturing capacity and improvements in
technology, which will intern help the company in order to capitalize on market demand for products when the
economic condition and product demands increases.
The company is able to sustain growth in revenue and profits even in the adverse market situations, at
healthy Net Profit Margin of 9.40%.
The company has expanded its presence in China, Brazil, Middle East and Australia through organic route
and in US & Europe through inorganic route.
Company have inventory worth Rs.105.19 crore and help the management to capitalize the inventory when
the demand for the product increases.
Governments policy of ‘Make in India’ and improvement sectors such as automobiles, engineering and
construction will help the company to grow into new levels.
The company is able to maintain cash flow even after the scale of investments made by the company and
have a reserves of Rs.480 crore.
Good after sales services and well quipped distribution network helps the company to meet market
competition in an effective manner.