ats company reports: lloyd eletricals
TRANSCRIPT


Company Details
Lloyd Electric & Engineering Ltd. With proven blend of value-added engineering, leading edge technology,
flexible production capacity, and individual customer satisfaction that makes us the preferred supplier of high
quality coils and heat transfer products. Since 1989, LOYD ELECTRIC has evolved into a world class
manufacturer by providing product support that is unsurpassed in the industry.
Since 1989 ,Lloyd Electric has evolved rapidly and come to be respected as a dependable supplier of high
quality coils to original Equipment Manufacturers of Heating, Ventilation, Air conditioning and Refrigeration
equipment.
Today, Lloyd Electric and Engineering Limited is a publicly traded company with its headquarters in New
Delhi. It is the leading and largest producer of Coils / Heat Exchangers (Fin and Tube type) in India, serving
the entire spectrum of HVAC & R industry in the country as well as OEM’s in North America, Europe, Middle
East and Australia. Lloyd Electric also manufactures Air conditioners for the Indian Railways, Metro Rail and
Buses at its Bhiwadi factory.
As part of its global aspiration and encourages by the preference it enjoys amongst its international clientele,
Lloyd Electric and Engineering LTD. acquired Lloyd coils Europe s.r.o.. (formerly known as Luvatat Czech,
SRO) facility in Czech Republic in May, 2008. With this strategic acquisition the company has entered the
European Market, thus becoming a truly global with a truly global range of activities and perspective.
The current market capitalization stands at Rs 409.36 crore. The company has reported a standalone sales
of Rs 304.41 crore and a Net Profit of Rs 4.39 crore for the quarter ended Sep 2014.

Category No. of Shares Percentage
Promoters 17,652,396 49.98
General Public 9,256,143 26.21
Other
Companies6,453,824 18.27
Others 963,718 2.73
Foreign - NRI 514,771 1.46
Foreign
Institutions462,168 1.31
Financial
Institutions1,240 0.00
Market Cap (Rs Cr) – 409.36
Company P/E – 4.95
Industry P/E – 27.67
Book Value (Rs) – 179.73
Dividend (%) – 10%
EPS (TTM) – 23.4
Dividend Yield (%) – 0.86%
Face Value (Rs) - 10
Share Holding Pattern Financial Details

Industry Details
Consumer durables refer to those goods that do not quickly wear out and yields utility over a long period of
time. Indian consumer durables industry has become one of the fastest growing sectors in India, primarily
driven by growing Indian economy. With the uninterrupted inflow of disposable incomes and the
development of product technology, the demand for the diverse consumer durable goods are growing.
The sector has been witnessing significant growth in recent years, helped by several drivers such as rising
disposable income, emerging real estate and housing demand, easy access to credit and an overall
increase in the level of affluence of a significant section of the population. Indian consumer durables marker
size has been increased by double digit CAGR at 13 percent to around $10 billion in FY14 from $3.8 billion
in FY06.
Some eminent industry side advantages like low priced energy efficient products, constant product up
gradation with advance technology and improved distribution network of players all have provided the much
needed impetus to industry’s growth. Despite having limited control prices due to high competitive pressure,
industry players have been able to maintain their margins at a decent level on the back of superior operating
margins and healthy demand scenario in the country. With the appearance of cheap finance schemes such
as zero equated monthly installment (EMI) charges, quick and easy loan, loan through credit card, it has
now become easy for Indian consumers to purchase product.
Although, over 60 percent of the country’s population resides in rural India, it represents only 35 percent of
the total domestic sale. India is still an urban centric market with around two-thirds of the total domestic
demand of the consumer appliances triggered by the top 40 cities of the country. However, the ratio of
demand is transforming on the back of growing demand in rural markets. Growing rural income with higher
non-farm income, increasing availability of power, rising product awareness through advertising and
customized products for rural consumers are the major factors for such a tremendous change in the
purchasing power of the rural customers.
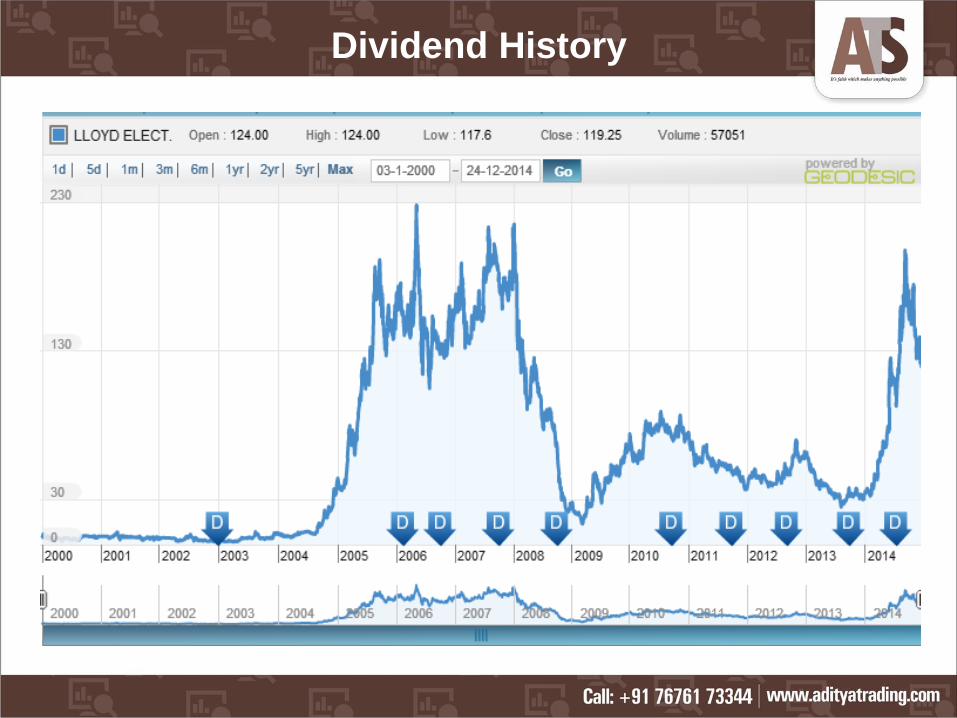
Dividend History

Company Index Comparison

Balance Sheet
Sources Of FundsMar '14 Mar '13 Mar '12 Mar '11 Mar '10
Total Share Capital 35.33 31.01 31.01 31.01 31.01
Equity Share Capital 35.33 31.01 31.01 31.01 31.01
Reserves 604.57 515.69 437.86 388.36 360.13
Revaluation Reserves 0.00 0.00 0.00 0.00 0.35
Networth 639.90 551.02 468.87 419.37 391.49
Secured Loans 646.27 351.89 365.50 384.37 233.01
Unsecured Loans 0.00 94.67 0.00 0.00 25.00
Total Debt 646.27 446.56 365.50 384.37 258.01
Total Liabilities 1,286.17 997.58 834.37 803.74 649.50
Application Of Funds
Gross Block 652.51 598.91 351.23 454.34 413.94
Less: Accum. Depreciation 229.01 203.28 0.00 150.54 131.54
Net Block 423.50 395.63 351.23 303.80 282.40
Capital Work in Progress 6.14 6.07 9.70 22.34 18.13
Investments 1.75 2.67 3.15 4.94 4.94
Inventories 617.94 490.31 353.13 242.40 172.58
Sundry Debtors 409.18 303.17 215.13 284.19 228.55
Cash and Bank Balance 55.34 21.45 29.35 65.96 12.75
Total Current Assets 1,082.46 814.93 597.61 592.55 413.88
Loans and Advances 127.14 81.07 78.04 47.96 47.69
Fixed Deposits 0.00 0.00 0.00 0.00 15.71
Total CA, Loans & Advances 1,209.60 896.00 675.65 640.51 477.28
Current Liabilities 321.91 263.44 179.02 158.17 118.29
Provisions 32.91 39.35 26.35 18.03 22.96
Total CL & Provisions 354.82 302.79 205.37 176.20 141.25
Net Current Assets 854.78 593.21 470.28 464.31 336.03
Miscellaneous Expenses 0.00 0.00 0.00 8.35 8.02
Total Assets 1,286.17 997.58 834.36 803.74 649.52
Book Value (Rs) 181.17 176.35 151.25 135.28 126.17

Profit and Loss Account
IncomeMar '14 Mar '13 Mar '12 Mar '11 Mar '10
Sales Turnover 1,775.97 1,474.31 1,204.36 1,022.86 823.88
Excise Duty 0.00 0.00 8.24 7.98 6.76
Net Sales 1,775.97 1,474.31 1,196.12 1,014.88 817.12
Other Income 49.05 5.03 9.95 0.96 2.78
Stock Adjustments 145.62 82.50 132.25 18.23 2.46
Total Income 1,970.64 1,561.84 1,338.32 1,034.07 822.36
Expenditure
Raw Materials 1,483.03 1,176.63 1,057.34 814.89 669.15
Power & Fuel Cost 0.00 0.00 2.80 4.59 5.29
Employee Cost 108.84 99.81 97.38 68.50 41.66
Other Manufacturing Expenses 0.00 0.00 2.40 9.56 6.28
Selling and Admin Expenses 0.00 0.00 0.00 0.00 14.85
Miscellaneous Expenses 164.48 129.54 73.58 43.07 2.06
Total Expenses 1,756.35 1,405.98 1,233.50 940.61 739.29
Operating Profit 165.24 150.83 94.87 92.50 80.29
PBDIT 214.29 155.86 104.82 93.46 83.07
Interest 85.50 52.70 33.83 23.17 18.44
PBDT 128.79 103.16 70.99 70.29 64.63
Depreciation 31.76 31.62 28.41 21.13 19.74
Other Written Off 0.00 0.00 0.00 1.91 0.00
Profit Before Tax 97.03 71.54 42.58 47.25 44.89
Extra-ordinary items 0.00 0.00 1.47 0.00 0.00
PBT (Post Extra-ord Items) 97.03 71.54 44.05 47.25 44.89
Tax 7.91 18.76 13.21 9.67 11.10
Reported Net Profit 89.12 52.78 29.37 37.57 33.81
Net P/L After Minority Interest & Share Of
Associates89.12 52.78 29.37 37.57 33.81
Total Value Addition 273.32 229.35 176.16 125.72 70.14
Equity Dividend 3.53 3.53 3.10 4.65 3.10
Corporate Dividend Tax 0.60 0.60 0.50 0.75 0.51
Per share data (annualised)
Earning Per Share (Rs) 25.23 17.03 9.48 12.12 10.91

PBIT – 7.31 v/s 8.05
ROCE – 14.19 v/s 12.45
Net Profit Margin – 4.88 v/s 3.56
Return on net worth – 13.92 v/s 9.65
Reserves – 604.57 cr v/s 515.69 cr
PAT – 89.12 cr v/s 52.78 cr
Total assets – 1286.17 cr v/s 997.58 cr
Net sales – 1775.97 cr v/s 1474 cr
Days BSE NSE
30 131.90 131.95
50 143.27 143.37
150 134.21 134.32
200 115.02 115.11
Simple Moving AverageImportant Ratios
Recommendations
Buy Lloyd Electric & Engineering Ltd at current or
lower market levels
Reasons for the recommendations are :
Production units in tax holiday zone to provide financial benefits.
Book Value of the company is Rs.179.73.
Huge growth potential of the industry.
Market leader in the rapidly growing Heat exchangers and coil business.
Positive response by the government in terms of interest rates will increase
the demand for the products.
OEM manufacturer to Air Conditioner manufacturing companies.