attached is a report on residual dry matter (rdm) monitoring at
TRANSCRIPT

Attached is a report on Residual Dry Matter (RDM) monitoring at Point Reyes National Seashore. The purpose of the report is to evaluate data collected from 1987-2014 to determine if the methods and standard used remain appropriate for monitoring grazing activities managed by the Seashore. The analysis, conducted by the UC Berkeley Range Ecology Lab, finds that 1,200 lbs/acre RDM is the appropriate standard. RDM is the plant material remaining in a field at the end of the season. Samples are collected and weighed in the fall and the RDM values are calculated. Managing for a specific RDM level is a common practice used to protect soils from erosion and nutrient loss and to maximize forage production in the following year. Several conditions, including RDM, influence which plants will grow and how much forage is produced at a particular site. The strongest influences on RDM are the amount and timing of rain and the local site conditions (such as soil type). The past several years have been particularly challenging, with an historic drought in California. Annual mean precipitation has been below average, with 2014 being among the lowest on record. With adverse conditions such as the multi-year drought, RDM values below the standard can be expected. This report will help establish a baseline from which to work together with ranchers to achieve our shared stewardship goals.

1987-2014 Residual Dry Matter Analysis Report and Updated Rangeland Monitoring Guidelines for Livestock Grazed Grasslands within Point Reyes National Seashore
and Golden Gate National Recreation Area
Point Reyes National Seashore (PORE) Project Phase 1: CESU Task Agreement # P11AC91045
James Bartolome1, Michele Hammond1, Peter Hopkinson1 and Felix Ratcliff2 Range Ecology Lab
Department of Environmental Science, Policy, and Management University of California, Berkeley
1Certified Rangeland Manager, State of California
2Graduate Student, Range Ecology Lab, U.C. Berkeley
August 30, 2015

Range Ecology Lab CESU Task Agreement # P11AC91045
2
Table of Contents
Part I. 1987-2014 Residual Dry Matter Analysis Report
1. Introduction
1.1 Background
1.2 History of PORE livestock grazing monitoring
1.3 PORE 1990 - 2014 Residual Dry Matter monitoring method descriptions
1.4 1987-2014 RDM dataset description
2. RDM calculation methods
2.1 Dry weight correction ratio
2.2 Double-sampling RDM calculation
3. Results
3.1 RDM Results 1987-1996
3.2 RDM Results 1998-1999
3.3 RDM Results 2001-2002
3.4 RDM Results 2008-2011
3.5 RDM Results 2012-2014
4. Discussion
4.1 Drought 2013-2014
4.2 Comparison areas 1990-2014

Range Ecology Lab CESU Task Agreement # P11AC91045
3
4.3 Non-compliance key area transects in 2012-2014
4.4 2012-2014 key area transect monitoring issues
Part II. PORE Residual Dry Matter (RDM) monitoring update
5. Residual Dry Matter (RDM) monitoring introduction
6. Proposed RDM Monitoring Guidelines
6.1 RDM monitoring overview
6.2 Proposed RDM monitoring updates
6.2.1 Types of RDM monitoring
6.2.2 RDM target minimum and maximum
6.3.3 Management action triggers requiring additional RDM monitoring
7. Future directions
7.1 RDM monitoring as part of an integrated grazing management plan
7.2 Ranch grazing management plans/Ranch unit plans
7.3 Potential additional monitoring topics for future recommendations
8. References
Appendix A
A.1 Final RDM summary tables: includes worksheets 1) Final RDM with CI 1987_2014 and 2) Key area transect name and years surveyed. A.2 Figures: RDM by key area transect for all years A.3 Figures: PORE maps with ranch boundaries and transect locations

Range Ecology Lab CESU Task Agreement # P11AC91045
4
Appendix B
B.1 Checklist of supplies needed for RDM clipping and mapping
B.2 RDM clipping instructions
B.3 RDM mapping instructions
B.4 Photo point instructions
B.5 References

Range Ecology Lab CESU Task Agreement # P11AC91045
5
Part I. 1987-2014 Residual Dry Matter Analysis Report
1. Introduction
The Rangeland Monitoring Guidelines for Point Reyes National Seashore (PORE) were last updated and revised in 1990. Following these and earlier guidelines, PORE staff have been measuring residual dry matter (RDM) and conducting condition/trend monitoring at the Seashore consistently since the early 1980s. Over the last several decades, technology and methods for RDM monitoring have improved substantially. The Range Ecology Lab (REL) and PORE’s work under this Task Agreement will improve the efficiency and effectiveness of the Seashore’s RDM monitoring. Improved monitoring will allow National Park Service (NPS) staff to communicate more clearly with ranchers and make better informed management decisions. This report will complete Phase 1 of the Californian Cooperative Ecosystem Studies Unit Cooperative and Joint Venture Agreement, #P11AC91045: Developing updated RDM monitoring methods for Point Reyes National Seashore (PORE) Project. This project includes 1) an analysis of historic PORE RDM monitoring data and 2) an update of PORE RDM monitoring guidelines and methods.
1.1 Background
The Range Ecology Lab (REL) conducted an analysis and interpretation of 27 years of PORE residual dry matter (RDM) monitoring data, 1987-2014. The techniques used by PORE for RDM monitoring are double-sampling, visual estimation, and RDM zone mapping. Point Reyes National Seashore (PORE) and Golden Gate National Recreation Area (GOGA) have ranch and dairy operations that occur over approximately 28,000 acres in both in the pastoral zone of PORE and in the north district of GOGA. Currently, there are 6 dairies, 18 beef ranches and one heifer grazing operation in the parks.
Point Reyes National Seashore is unique in the National Park Service because dairying and ranching operations were an integral part of the formation of the park. During the 1950s and 1960s, development pressure from real estate developers and speculators was strong, and at the same time dairies were struggling. To secure their place at Point Reyes, the dairy and cattle ranchers formed an alliance with the Sierra Club in hopes of preserving their ranches and west Marin open space. The National Park Service had actively sought to establish a literal beachhead on the California coast and at Point Reyes in particular as early as 1936. Federal legislators were approached to help solve the pressing needs of many local and national constituencies. The compromise hammered out by Congress and signed by President Kennedy in 1962 provided for

Range Ecology Lab CESU Task Agreement # P11AC91045
6
the retention of the ranches in a designated pastoral zone, with ranchers signing reservations of use and occupancy, and special use permits for cattle grazing.
Secretary of the Interior, Ken Salazar, recently directed PORE to develop 20-year lease permits for ranchers in the park, an increase from the existing 5- and 10-year lease permits. The Secretary’s memorandum demonstrates the support of the NPS and the Department of the Interior for the continued presence of dairy and beef operations within these NPS lands. Rangeland monitoring is essential to ensure that National Park Service standards and standards of rangeland health are being met by ranchers in the park. RDM is a key component to monitor and is described clearly by Bartolome et al. (2006):
Residual dry matter (RDM) is a standard used by land management agencies in California for assessing the level of grazing use on annual rangelands and associated savannas and woodlands. Residual dry matter is the old plant material left standing or on the ground at the beginning of a new growing season. It indicates the combined effects of the previous season’s forage production and its consumption by grazing animals of all types. Properly managed RDM can be expected to provide a high degree of protection from soil erosion and nutrient losses. Applications of specific RDM standards based on a limited research base and experience have demonstrated the effectiveness of this approach to grazing management.
1.2 History of PORE livestock grazing monitoring
Rangeland Monitoring Guidelines were originally developed for the park in 1983 (Sugnet and Bartolome) and were revised in 1990 by Shook. Two types of monitoring for livestock grazed grasslands have been conducted at PORE since the early 1980s: residual dry matter in the fall and grassland species composition in the spring.
RDM monitoring began on livestock-grazed grassland in Point Reyes National Seashore and Golden Gate National Recreation Area as a way to assess grazing operations management and its effect on the ecology of the grasslands within the parks. Public meetings and several pilot years of RDM data collection led to the creation of the currently used monitoring protocol included in the Range Management Guidelines and Range Monitoring Handbook (Shook 1990). Two types of livestock grazing monitoring are conducted every year according to the 1990 guidelines: spring condition and trend and fall RDM. The spring condition and trend monitoring analysis of the grassland species composition dataset is not included in Phase 1 of task agreement #P11AC91045. The long-term species composition dataset will be analyzed in Phase

Range Ecology Lab CESU Task Agreement # P11AC91045
7
2 of the task agreement and is described in the Grasslands chapter of the 2015 Natural Resource Condition Assessment for PORE.
The PORE fall RDM monitoring dataset summarized in this report includes RDM double-sampling, zone mapping, and visual estimation measurements that were collected from 1987-2014.
1.3 PORE 1990-2014 Residual Dry Matter monitoring method descriptions
The RDM measurement protocols are based on a key area within each ranch unit or pasture unit selected by PORE staff. The following are explanations of range terminology and RDM monitoring methods derived from notes on PORE datasheets, conversations with PORE staff Devii Rao and Dylan Voeller, and two internal documents, the PORE Range Management Guidelines and Range Monitoring Handbook (Shook 1990).
a) Key Area Key areas are a widely used rangeland monitoring concept to focus fall surveys for
livestock grazing use of the ranch unit. The majority of key areas across PORE and GOGA were chosen during the pilot years 1987-1990 using the following basic criteria (Rangeland Monitoring Guidelines 1990):
● 2 acres in size and a single “range site” or soil and vegetation type; ● responsive to livestock grazing management practices; ● reflective of the current grazing regime; ● representative of the average grazing use of the pasture.
b) Double-sampling RDM measurement
The PORE double-sampling method measures the RDM of the key area with a combination of clipped quadrats and visually estimated quadrats of residual dry matter along a 100m transect within the designated key area. This method gives an upper and lower 95% confidence interval for the RDM value in a given year. The double-sampling allows a more precise RDM measurement, which includes a confidence interval or calculation of error. The double-sampling RDM monitoring method improves the statistical reliability of the measurement at least cost. This method is, however, more time intensive than other current methods (Shook 1990, BLM 1996).

Range Ecology Lab CESU Task Agreement # P11AC91045
8
c) RDM zone mapping The PORE RDM zone mapping method has one surveyor use a topographic
map of the park with pasture fences and key area/transect locations. Each ranch pasture is hand-colored on the map with the levels of RDM estimated. In most years where mapping occurred, the RDM mapping unit was at a smaller scale than the pasture. In other words, some pastures have multiple zones of RDM levels with a minimum mapping unit of 2-5 acres. The RDM zones on the map are coded: red 0-600 lbs/acre, orange 600-1,200 lbs/acre, yellow 1,200-1,800 lbs/acre, no color >1,800 lbs/acre. Non-grassland vegetation such as shrubs or wetland rushes is excluded from the mapping. Spot clipping for eye-calibration is also suggested for this method. RDM zone mapping is prioritized for ranch units that had problems with meeting the minimum target RDM or pending a lease renewal (Shook 1990).
d) Visual RDM estimation The PORE visual RDM estimation values were occasionally substituted for
double-sampling for key area transects throughout the early years of fall monitoring. They are based on expert opinion by PORE staff conducting the double-sampling or RDM zone mapping. Although not written into the 1990 Guidelines or Handbook, notes on the double-sampling datasheets include some key area ocular or visual assessments reported in lbs/acre.
1.4 1987-2014 RDM dataset description
The following is a summary of the long-term PORE RDM monitoring dataset over 1987-2014. PORE staff followed Rangeland Monitoring Handbook (1990) protocols to monitor, every September-October, between 40-50 key areas within the livestock grazed area of the Seashore. The first few years of RDM monitoring, 1986-1990, before the handbook was finalized, are pilot years during which PORE staff chose the key areas and tested the adequate number of quadrat clippings and estimates.
From 1987-1996, key area monitoring for each ranch or dairy was consistently conducted to determine grazing use with a combination of the double-sampling method and the pasture-based RDM zone mapping. From 1989-1990, the majority of grazed areas have RDM maps. During 1998-1999, PORE staff only created RDM zone maps for priority ranch units within the park; priority ranch units or pastures were those that were either not meeting the minimum target RDM (>1,200 lbs/acre) or were up for lease renewal (Shook 1990).

Range Ecology Lab CESU Task Agreement # P11AC91045
9
Between 1996 and 2011, there was occasional RDM sampling of priority key areas with the combination of the visual estimation alone or the double-sampling method. The last few years, 2012-2014, PORE staff measured RDM every year with the double-sampling method for all 52 existing key area transects.
Within the 52 transects measured in 2012-2014, there are key area transects in livestock-grazed pastures and in other grasslands that are not grazed by livestock. The transects that are not livestock-grazed are located in grassland areas where livestock grazing ended at some point during 1987-2014, livestock grazing was removed with the creation of the park or before 1987, or grazing over the RDM sampling period is only by PORE tule elk. These transects without livestock grazing are included in the analysis to allow for a comparison with the livestock-grazed transects and will be referred to as ungrazed transects.
For this report, ranch unit names for the key area transects are the current ranch names, and do not necessarily reflect the ranch unit names in the early years of the dataset.
2. RDM calculation methods
2.1 Dry weight correction ratio
The purpose of a dry weight correction ratio calculation is to standardize the key area RDM estimate against the variable moisture content of a clipped sample. From year to year or pasture to pasture, the amount of fog or precipitation can affect the weight of the RDM clipped estimate and skew the final value. A yearly dry weight correction factor for each estimate of residual dry matter is calculated using the ratio of dry weight to wet weight. The wet weight is the clipped biomass (approximately 10 quadrat clippings) that is weighed on site during sampling. This clipped biomass is allowed to air dry for several days and then combined to create the air-dry weight. The combined dry weight is divided by the combined wet weight to calculate the dry weight correction ratio.
If there was a missing dry weight correction ratio within the dataset (primarily in 2001-2002), or the combined dry weight for a key area transect in a given year was heavier than the combined wet weight, the closest adjacent key area transect dry weight correction ratio was used.

Range Ecology Lab CESU Task Agreement # P11AC91045
10
2.2 Double-sampling RDM calculation Double-sampling RDM measurements for 1987-2014 were calculated for the years and
transects available. The RDM quadrat visually estimated weights, clipped weights, and their combined dry weights were used to calculate the RDM values with a 95% level of confidence or interval. The upper and lower limits to the 95% confidence interval (CI) show the amount of variation in the sample of clipped and estimated weights. Double-sampling RDM calculations were made using R software (version 3.2.0). 3. Results
Results are presented below for the years of RDM monitoring that had either double-sampling, visual estimation, or RDM mapping. For more detail see Appendix A tables. Appendix A tables contain the full set of RDM values for all years and transects and a summary table that organizes which years and transects had double sampling and visual estimation surveys. Summary figures that graph RDM values for all transects from 1987-2014 are in Appendix A.
3.1 RDM Results 1987-1996
Summary key area transect double-sampling and visual estimates.
During this period, from 1987-1996, double-sampling or visual estimate RDM measurements were conducted for most existing key area transects. The years 1987-1990 were pilot years during which transects were added over time. Table 3.1 includes the average RDM for each year during this period and the number of key area transects.
Table 3.1. 1987-1996 park-wide average of RDM estimates and number of transects surveyed; averaged values include double-sampling and visual estimates.
Year Average RDM in lbs/acre
# of Transects surveyed
1987 1238 38 1988 1160 40 1989 1786 46 1990 1904 51 1991 2641 53

Range Ecology Lab CESU Task Agreement # P11AC91045
11
Year Average RDM in lbs/acre
# of Transects surveyed
1992 2695 50 1993 3595 49 1994 3380 51 1995 4089 52 1996 3135 29
3.1.1 Summary of RDM zone mapping
RDM zone mapping was conducted from 1986-1996 for ranch units that were considered priority areas to measure. The year 1989 RDM zone mapping has the most complete RDM zone mapping of the ranching areas with approximately 45 ranch pastures mapped. There are different ranch boundaries and names in the early years of the mapping effort.
3.2 RDM Results 1998-1999
There were no double-sampling or visual estimates recorded for this time period.
3.2.1 Summary RDM zone mapping
RDM zone mapping was conducted from 1998-1999 for ranch units that were considered priority areas to measure. Only Kehoe J Ranch was mapped in 1998. In 1999, nine ranch units were mapped.
3.3 RDM Results 2001-2002
3.3.1 Summary key area transect double-sampling and visual estimates
During this period, from 2001–2002, double-sampling RDM measurements were conducted only for priority key area transects. Table 3.3 includes the average RDM for each year during this period and the number of key area transects.

Range Ecology Lab CESU Task Agreement # P11AC91045
12
Table 3.3. 2001-2002 park-wide average of RDM estimates and number of transects surveyed; averaged values include double-sampling and visual estimates.
Year Average RDM in lbs/acre
# of Transects surveyed
2001 1802 20 2002 1583 27
3.3.4. Summary RDM zone mapping 2001-2012
There was no RDM zone mapping from 2001-2012.
3.4 RDM Results 2008-2011
3.4.1 Summary key area transect double-sampling and visual estimates.
During this period, from 2008–2009, double-sampling RDM measurements were conducted for the majority of key area transects, while in 2011 only priority transects were assessed. Table 3.4 includes the average RDM for each year sampled during this period and the number of key area transects.
Table 3.4. 2008-2011 park-wide average of RDM estimates and number of transects surveyed; averaged values include double-sampling and visual estimates.
Year Average RDM in lbs/acre
# of Transects surveyed
2008 1066 45 2009 1073 46 2011 1572 24
3.4.2 Summary RDM zone mapping (2008-2011)
There was no RDM zone mapping from 2008-2011.
3.5 RDM Results 2012-2014
Summary key area transect double-sampling and visual estimates.

Range Ecology Lab CESU Task Agreement # P11AC91045
13
In this period, from 2012 - 2014, double-sampling RDM measurements were conducted for almost all existing key area transects. Following the 1990 RDM guidelines, for the key area transects 38 and 39 in 2013, the RDM values were calculated using weights that excluded Juncus spp. (transects 38a and 39a in raw data file). Table 3.5.1 includes the average RDM for each year sampled during this period and the number of key area transects.
Table 3.5.1. 2012 – 2014 park-wide average of RDM estimates and number of transects surveyed; averaged values include double-sampling and visual estimates.
Year Average RDM in lbs/acre
# of Transects surveyed
2012 2581 51 2013 1927 52 2014 1410 51
3.5.1 Summary RDM zone mapping (2012-2014)
There was no RDM zone mapping from 2012-2014.
4. Discussion
The long-term dataset of PORE RDM monitoring is a good representation of livestock use of PORE and GOGA rangeland over time. This monitoring dataset was essentially set up properly from the beginning and included the most rigorous and standard RDM monitoring protocol for the time. The twenty-five year length of the dataset allows for some interesting comparisons including the effects of the current drought and the removal of livestock grazing.
4.1 Drought 2013-2014
Over all the years surveyed, 2013-2014 have among the lowest RDM values across the park. The California-wide, multi-year drought is an obvious explanation for this phenomenon. The average RDM value for 2014, 1,410 lbs/acre, is the lowest over all the years (Table 4.1). For comparison purposes, Table 4.1 only includes average RDM values for years with consistent and full RDM estimate coverage (50 or more transects measured).

Range Ecology Lab CESU Task Agreement # P11AC91045
14
Table 4.1. PORE park-wide average RDM values in lbs/acre in years where at least 50 transects included RDM estimates.
Year Average RDM (lbs/acre)
1990 1,904 1991 2,641 1992 2,695 1993 3,595 1994 3,380 1995 4,089 2012 2,581 2013 1,927 2014 1,410
4.2 Comparison areas 1990-2014
Ungrazed comparison areas 1--Strain Hill, 11--Beebe East, 20--Abbots Lagoon, 23--Beebe South, and 24--Limantour were added to the RDM monitoring survey in 1990. In spite of the small number of transects (n=5), these transects make an interesting qualitative comparison for what happens to a coastal grassland with different types of disturbance over twenty-five years: burning, livestock grazing removal, and introduction of elk grazing. Livestock grazing was removed from Strain Hill in 1971 and from the Beebe transect areas in approximately 1976 following purchase of the property by the federal government (Livingston 1995). Timing of cessation of livestock grazing for the other two transects is less certain; Limantour was likely grazed until 1970 (see Livingston 1994), and presumably grazing ceased at Abbotts in this same general timeframe. These ungrazed transects were surveyed occasionally throughout 1990-2014, although not in consecutive years.
Comparison area transects with relatively little known cattle grazing disturbance from 1990-2014, (11, 20, 23), show initial years with high RDM values that in later years are closer to or below the minimum RDM target of 1,200 lbs/acre. These three transects range from 3,000-9,000 lbs/acre RDM in the period 1990-1996. In the latest years of measurement, 2012-2014, the ungrazed comparison transects range much lower, with RDM values of 500–3,500 lbs/acre. Notes from the double-sampling datasheets indicate a potential switch from grassland to shrubland with dominance of shrub plant species in 2013. There are no notations of dominance

Range Ecology Lab CESU Task Agreement # P11AC91045
15
by shrubs in the earlier years of these three transects. Woody plants like coyote brush (Baccharis pilularis) are not included in the RDM weight measurement and shade out grassland species which make up the bulk of a quadrat estimate. Shrubland conversion potentially could be one explanation for the lower RDM values from 2012-2014. Conversion to a coastal scrub vegetation type is a common effect of livestock grazing removal in coastal prairie. Along the coast of California, disturbance, whether by fire, grazing, or mowing, is often necessary to maintain open grassland areas (Ford and Hayes 2007).
The Strain Hill comparison area (transect 1) also had no livestock grazing disturbance during 1990-2014; however, controlled burning for fuel reduction and non-native species control was recorded for this area on eight of the twenty-five years. Strain Hill (1) RDM values show a less pronounced difference between the two time periods; the RDM values range from 2,900-4,500 lbs/acre in the period 1990-2002 (additional years surveyed for this transect) and slightly lower with a range of 1,300-3,000 lbs/acre in 2009-2014. In 2013, occasional shrubs are noted as present on the transect. Burning is an effective method for the reduction in shrub cover especially B. pilularis and potentially explains the less variable RDM values.
The Limantour comparison area (transect 24) has no livestock grazing disturbance from 1990-1998. The lower RDM values in 1996 may reflect the burn in 1995. In 1999, tule elk were re-located to the Limantour area and are noted as grazing on this transect. The RDM values do not reflect any pattern from the introduction of elk grazing and do not indicate the dominance of shrubs along the transect in 2013.

Range Ecology Lab CESU Task Agreement # P11AC91045
16
Figure 4.1. RDM estimates on five ungrazed comparison area transects from 1990 to 2014.
1990 1992 1994 1996 2002 2012 2014
1 -- Strain Hill
010
0020
0030
0040
000
1000
2000
3000
4000
1990 1992 1994 1996 2013
11 -- Beebe East
010
0030
0050
000
1000
3000
5000
1990 1992 1994 2012 2014
20 -- Abbots Lagoon
Res
idua
l Dry
Ma
0
1000
3000
5000
010
0030
0050
00
1990 1992 1994 1996 2012 2014
23 -- Beebe South
020
0060
0010
000
020
0060
0010
000
1990 1992 1994 1996 2013
24 -- Limantour
010
0030
0050
000
1000
3000
5000

Range Ecology Lab CESU Task Agreement # P11AC91045
17
4.3 Non-compliance key area transects in 2012-2014
A standard condition of most grazing management plans and grazing leases is to allow for one year of non-compliance during which it is acceptable to be under the minimum RDM standard. If the pasture or key area is under the RDM standard the following year, this would trigger additional monitoring and alternative management actions. Key area transects considered not in compliance for 2014 would need to have been also under the minimum RDM standard for 2013. Table 4.4 below is a list of key area transects that are below the 1,200 lbs/acre standard for both 2013 and 2014 RDM estimates. Notes from the 2013 datasheets show that the majority of the non-compliant transects are representative of the field or pasture.
Table 4.2. RDM estimates for 2012-2013 that are under the 1,200 lbs/acre minimum RDM standard in both 2013 and 2014
Transect 2012 2013 2014 8 855 888 857 10 1080 1091 964 15 964 1077 624 16 429 505 1184 21 1007 808 943 25 730 461 342 26 1409 620 755 29 1041 960 622 32 777 521 389 34 383 204 250 37 566 465 487 42 3049 719 1071 45 1852 1168 898 47 365 401 165 50 147 392 581

Range Ecology Lab CESU Task Agreement # P11AC91045
18
4.4 2012-2014 key area transect monitoring issues
While there are definite benefits to permanent monitoring areas, at this point, there are transects or key areas in the PORE RDM monitoring dataset that require review. Table 4.5 includes key areas where problems were noted on the 2013 datasheets such as invasive shrub or noxious plants. Ranch use information is from the site information excel file.
Table 4.5 Key area transects with RDM monitoring issues; NG is not grazed
Transect Problem Recommendation Ranch Use 11 Shrub dominance Burn or Re-locate Comparison area NG 12 Teasel dominance Weed management NG since 1998 20 Shrub dominance Burn or Re-locate Comparison area NG 23 Shrub dominance Burn or Re-locate Comparison area NG 36 Shrub dominance Burn or Re-locate NG since 2001 41 Not representative Re-locate Beef ranch 48 Fence through middle Re-locate Beef ranch

Range Ecology Lab CESU Task Agreement # P11AC91045
19
PART II. PORE Residual Dry Matter (RDM) monitoring update
5. Residual Dry Matter (RDM) monitoring introduction
As noted above, this report completes Phase 1 of the Californian Cooperative Ecosystem Studies Unit Cooperative and Joint Venture Agreement, #P11AC91045: Developing updated RDM monitoring methods for Point Reyes National Seashore Project. This section of the report comprises an update of PORE residual dry matter monitoring guidelines and methods.
Monitoring of livestock grazing falls into two general categories: 1) compliance monitoring, which determines if a management action complies with expectations or regulations; and 2) effectiveness monitoring, which determines if management actions are achieving the desired results (Bush 2006). The results from a well-designed monitoring program provide guidance both for compliance and effectiveness and are used to improve management practices. A good range monitoring program can address goals at the pasture, ranch, and landscape levels and efficiently produces the information required to accomplish those stated goals at minimum cost.
Compliance monitoring generally produces information about the number of livestock animals, timing of livestock grazing, distribution of grazing, and the intensity of grazing. In California, the distribution and intensity of grazing are commonly monitored through assessment of RDM. This report addresses the RDM monitoring component of compliance monitoring. We recommend, however, that PORE develop full compliance monitoring and, if desired, effectiveness monitoring, plans as part of a grazing management plan (see “Future Directions” section below).
Current PORE RDM monitoring protocols follow the PORE Range Management Guidelines and Range Monitoring Handbook developed by Shook in 1990. The goals and objectives and monitoring protocols therein have proved serviceable for PORE but need updating at this point. Some Tomales Bay watershed ranches already have “Ranch Water Quality Plans”, as required by the Regional Water Quality Control Board’s Waiver of Waste Discharge Requirements for Grazing Operations in the Tomales Bay Watershed (Tomales Bay, Lagunitas Creek, Walker Creek, and Olema Creek) in the San Francisco Bay Region.

Range Ecology Lab CESU Task Agreement # P11AC91045
20
The 1990 Handbook minimum RDM target of 1,200 lbs/acre was recommended by the Soil Conservation Service (now Natural Resources Conservation Service). Where soils are rocky or shallow, the minimum RDM target is 1,000 lbs/acre (Shook 1990). Recommendations in the 1990 Handbook for monitoring the livestock-grazed areas of the park were as follows:
● All monitoring focused on key areas within livestock-grazed pastures; ● Fall RDM monitoring (double sampling 100 meter transect, 50 quadrats estimated, 10
clipped); ● Fall RDM zone mapping (4 zones: 0-600, 600-1,200, 1,200-1,800, >1,800 lbs/acre); ● Spring Condition and Trend assessment(8 30-meter line-point transects of 50 points each,
400 points total); ● Permanent Photo points.
6. Proposed RDM Monitoring Guidelines
6.1 RDM monitoring overview
Fall RDM monitoring provides guidance related to how well grazing management is being applied to conservation goals. Published minimum RDM standards exist that are applicable to livestock grazing management and can be used for enhancing species of special concern in PORE and GOGA grasslands (Bartolome et al. 2006).
Generalized RDM guidelines, the targets or standards for minimum Fall RDM levels judged necessary for sustained livestock production, have been published for three broad precipitation zones in California’s Mediterranean climate grasslands and savannas. Within each of three precipitation zones (less than 12 inches of mean annual precipitation, between 12 and 40 inches, and coastal prairie with typically more than 35 inches), standards vary by percent slope and with percent woody plant cover. The published guidelines also recommend that local standards or targets be developed as data and experience become available and as different management goals are prioritized (Bartolome et al. 2006).
RDM-based management has been successfully applied on California annual range for over 30 years. The basic relationships among RDM and rainfall, plant production, and composition were established in a long-term statewide experiment (Bartolome et al. 1980; Jackson and Bartolome 2002). A follow-up study examined the effects of RDM, slope, and aspect on forage production, forage composition, and water quality (Bartolome et al. 2006). That study also showed that the flexible RDM standards based on slope may not always work well for

Range Ecology Lab CESU Task Agreement # P11AC91045
21
grazing management. However, the exact mechanisms linking RDM to ecosystem processes remain undemonstrated. The application of RDM principles has been widely shown as useful in grazing practice (Bush 2006). It is important to note that minimum RDM standards are probably best considered targets and may differ for many reasons other than livestock grazing, including ecological site, weather, and rodent activity.
During drought years, RDM can fall below minimum standards, even in areas not grazed by livestock due to drought curtailed biomass production for that growing season). A recommended response is to plan the livestock grazing for the coming grazing season based on RDM remaining from the previous grazing season (Bartolome et al. 2006). If RDM had fallen below the minimum standard before the start of the grazing season, the stocking rate (number of animal units per area for a given period) for the following year’s grazing season should be reduced. The reduced stocking rate is likely to ensure that RDM minimum standards are achieved for that grazing season. Livestock grazing to below the RDM minimum may occasionally occur but typically only within a single season, which is unlikely to result in long-term damage to the range resource. Of course, in extreme drought years when forage production fails, the grazing season may have to be curtailed.
With the advent of climate change, extreme drought years and/or multiyear droughts may become more common in California (Polley et al. 2013, Chaplin-Kramer and George 2013), which will significantly affect livestock grazing management. Specifically, planning for such events is highly recommended, and management contingencies for severe drought are a necessary component of a grazing management plan. Drought contingencies include moving cattle to more productive pastures, reducing overall herd size, early weaning, and supplemental feeding (McDougald et al. 2001).
6.2 Proposed RDM monitoring updates
6.2.1 Types of RDM monitoring
i. Key Area: characteristics of the key area concept: we recommend PORE continue using the key area concept as defined in the Rangeland Monitoring Guidelines (Shook 1990) but modify the definition to reflect the following important characteristics:
● the key area should be representative of the pasture; ● the key area should reflect typical, average livestock use for that pasture; ● the key area should be responsive to changes in management;

Range Ecology Lab CESU Task Agreement # P11AC91045
22
● the key area should not be a high impact area, e.g., next to a water trough, mineral lick, or other intensively used location;
● the key area should comprise only one ecological site (previously called range site); ● the key area should be approximately 100 meters in diameter
ii. We recommend that PORE use the following monitoring methods within a key area for Fall
monitoring RDM measurement: ● permanent photo point, ● Clip 3 representative RDM quadrats or hoops, weigh and average air-dry weight ● Ocularly estimate and average percent bare ground in the three clipped quadrats or
hoops (note: standards for bare ground have not yet been developed for coastal prairie but can easily and cheaply be developed by adding in this measure.)
iii. Some of the current key areas present problems that need to be addressed to ensure accurate RDM estimates (see RDM analysis section 4.5). These problems include:
● invasive plants, e.g., thistle or teasel, dominate the key area; ● key area has converted to a shrub-dominated site; ● key area is no longer representative of the pasture.
Addressing these problems may require adding new key areas within the pasture or re-locating the key area within the pasture.
6.2.2 RDM target minimum and maximum
Although RDM estimates are typically compared to a minimum standard to minimize soil erosion and optimize forage production, a maximum standard may also be important, depending on management goals for the area. Maximum RDM standards may be necessary to meet wildlife habitat requirements, to control invasive species, or to reduce fuel loading.
For PORE, we recommend a minimum standard of 1,200 lbs/acre, based on the RDM guidelines developed by UC researchers for coastal prairie (Bartolome et al. 2006). We do not recommend the general use of flexible, slope-based standards because they do not appear to be applicable to PORE and GOGA sites. However, site-specific conditions and management goals may call for adjustment of the minimum standard for particular sites. Adjustment of RDM standards requires site-specific evaluation and planning as recommended below.

Range Ecology Lab CESU Task Agreement # P11AC91045
23
Similarly, for particular sites, a maximum RDM standard may be appropriate. Determining whether a site needs a maximum RDM standard requires site-specific evaluation and planning as recommended below. For example, grazing has proven an effective method of reducing cover of the invasive velvet grass (Holcus lanatus; Johnson and Cushman 2007, Hayes and Holl 2003) and slowing shrub encroachment (McBride and Heady 1968). Ensuring sufficient levels of grazing by establishing maximum RDM standards may help PORE control velvet grass and inhibit shrub encroachment. We know of no research that provides specific RDM guidelines for meeting these goals, although research from Europe and Canada suggests that higher intensity livestock grazing and trampling could reduce abundance of velvet grass while low-intensity grazing may actually encourage its spread (Pitcher and Russo 1988). Conducting a modest adaptive management experiment may provide some useful site-specific information on the RDM levels that best control velvet grass invasion and shrub encroachment without harming other resource values.
6.2.3 Management action triggers requiring additional RDM monitoring
We recommend that PORE develop management action triggers that indicate when additional or more intensive monitoring is necessary. For example, if a key area does not meet its target RDM standard (or a percent bare ground guideline if that is developed), additional monitoring at that key area may be warranted. We recommend the following intensive monitoring methods for use on such occasions:
● RDM zone mapping (2 zones: below 1,200 lbs/acre RDM and above1,200lbs/acre RDM) to assess entire pasture;
● More precise RDM clipping estimate: apply the previously used double sampling methodology within key area;
● Consider adding additional key areas or moving existing key areas; ● Additional photo points targeting problem areas, e.g., bare ground, Cal-IPC high level
invasive plants, soil erosion, plants toxic to livestock.
7. Future directions
7.1 RDM monitoring as part of an integrated grazing management plan
Livestock grazing is a complex ecosystem process for which management involves site-specific control of intensity, timing, and distribution (Jackson and Bartolome 2007). This

Range Ecology Lab CESU Task Agreement # P11AC91045
24
complexity has reduced the generality of results from grazing experiments. For example, an evaluation of 30 grazing studies in California grasslands showed that effects on vegetation were primarily dependent on soil properties and weather, with variable and probably site-dependent effects of the grazing treatments (Huntsinger et al. 2007). Another issue with grazing evaluations is that spatial and temporal variation at the pasture, ranch, and landscape scales need to be linked to match variable management objectives (Huntsinger et al. 2007). Any kind of grazed site monitoring, therefore, is best developed and implemented within the context of an overall grazing management plan.
This report’s recommendations for Fall RDM monitoring are potentially the first step of a collaboration between PORE and REL to develop up-to-date natural resource management goals for the livestock-grazed areas within PORE and Golden Gate National Recreation Area. PORE is currently involved in a Ranch Comprehensive Management Plan/Environmental Assessment (RCMP) planning process. The RCMP will analyze numerous proposed ranching activities on PORE and GOGA lands. There is a pending proposal for REL and PORE to collaboratively create a grazing management plan that will guide the development of specific monitoring objectives for park lands. Grazing management plans are required to implement the RCMP at the ranch level and to protect and enhance sensitive resources within PORE and GOGA livestock-grazed areas.
7.2 Ranch grazing management plans/Ranch unit plans
Ranch grazing management plans or Ranch unit plans need to be developed to finalize specific RDM targets based on site-specific needs. Site-specific needs might include:
● Tomales Bay Watershed ranches have specific RDM targets due to water quality regulations;
● dairy irrigated pasture may have different RDM targets compared to those for beef ranching pasture;
● native grasslands or wetland areas within pastures may require RDM levels different than those for areas dominated by non-native species;
● unique ecological sites or sites with sensitive species may need RDM standards tailored to their particular requirements.
Range Ecology Lab CESU Task Agreement # P11AC91045
25
Ranch grazing management plans or Ranch unit plans would include:
● ranch-specific guidelines with goals and objectives for monitoring to target; ● grazing management compliance monitoring goals and objectives; ● management effectiveness monitoring goals and objectives.
7.3 Potential additional monitoring topics for future recommendations
1) Tomales Bay Watershed pastures – Repeated intra-annual monitoring requirements for Water Quality Control Board impaired water body regulation;
2) Dairy pasture monitoring -- Additional methods or monitoring on intensive-use pastures; 3) Spring species composition monitoring or condition and trend monitoring (Phase 2 of this
task agreement).
8. References
Bartolome, J.W., W.E. Frost, N.K. McDougald, and J.M. Connor. 2006. California guidelines for Residual Dry Matter (RDM) management on coastal and foothill annual rangelands. University of California Division of Agricultural Natural Resources Rangeland Management Series Publication 8092 (Revised). 8p. Available online at: http://anrcatalog.ucdavis.edu/Details.aspx?itemNo=8092
Bureau of Land Management (BLM). 1996. Sampling Vegetation Attributes: Interagency Technical Reference. National Applied Resource Sciences Center, Bureau of Land Management. Available online at: http://www.blm.gov/nstc/library/pdf/samplveg.pdf
Bush, L. 2006. Grazing handbook: a guide for resource managers in coastal California. Santa Rosa, CA: Sotoyome Resource Conservation District. Available online at: http://www.sonomarcd.org/documents/Grazing-Handbook.pdf.
Chaplin-Kramer, R. and M.R. George. 2013. Effects of climate change on range forage production in the San Francisco Bay Area. PloS One 8:e57723.
Ford, L.D. and G.F. Hayes. 2007. Northern coastal scrub and coastal prairie. Pages 180-207 in M.G. Barbour, T. Keeler-Wolf, and A.A. Schoenherr, eds., Terrestrial vegetation of California. Berkeley, CA: University of California Press.
Hayes, G.F., and K.D. Holl. 2003. Cattle grazing impacts on annual forbs and vegetation composition of mesic grasslands in California. Conservation Biology 17:1694–1702.

Range Ecology Lab CESU Task Agreement # P11AC91045
26
Herrick, J.E., J.W. Van Zee, K.M. Havstad, L.M. Burkett and W.G. Whitford. 2005. Monitoring Manual for Grassland, Shrubland and Savanna Ecosystems, Volumes I and II. Las Cruces, NM:USDA-ARS, Jornada Experimental Range. Available online at: http://jornada.nmsu.edu/monit-assess/manuals/monitoring.
Huntsinger, L., J.W. Bartolome, and C.M. D’Antonio. 2007. Grazing management on California’s Mediterranean grasslands. Pages 233-253 in: M.R. Stromberg, J.D. Corbin, and C.M. D’Antonio (eds.), California grasslands: ecology and management. Berkeley, CA: University of California Press.
Jackson, R.D. and J.W. Bartolome. 2007. Grazing ecology of California’s grasslands. Pages 197-206 in: M.R. Stromberg, J.D. Corbin, and C.M. D’Antonio (eds.), California grasslands: ecology and management. Berkeley, CA: University of California Press.
Johnson, B.E. and J.H. Cushman. 2007. Influence of a large herbivore reintroduction on plant invasions and community composition in a California grassland. Conservation Biology 21:515–516.
Livingston, D. 1994. Ranching on the Point Reyes Peninsula: a history of the dairy and beef ranches within Point Reyes National Seashore, 1834-1992. Rev. July 1994. Point Reyes Station, Calif.: Point Reyes National Seashore, National Park Service.
Livingston, D.S., & United States. National Park Service. 1995. A good life: dairy farming in the Olema Valley: a history of the dairy and beef ranches of the Olema Valley and Lagunitas Canyon, Golden Gate National Recreation Area and Point Reyes National Seashore, Marin County, California. San Francisco: National Park Service, Dept. of the Interior.
McBride, J.R. and H.F. Heady. 1968. Invasion of grassland by Baccharis pilularis DC. Journal of Range Management 21: 106-108.
McDougald, N., W. Frost, and R. Phillips. 2001. Livestock management during drought. Univ. Calif. Div. Agric. Nat. Res. Pub. 8034. 6p. Available online at: http://anrcatalog.ucdavis.edu/Details.aspx?itemNo=8034
Pitcher, D. and M.J. Russo. 1988. Element stewardship abstract for Holcus lanatus. Arlington, VA: The Nature Conservancy.

Range Ecology Lab CESU Task Agreement # P11AC91045
27
Polley, H.W., D.D. Briske, J.A. Morgan, K. Wolter, D.W. Bailey, and J.R. Brown. 2013. Climate change and North American rangelands: Trends, projections, and implications. Rangeland Ecology and Management 66:493– 511.
Shook, W. 1990 Range Management Guidelines. Point Reyes National Seashore: National Park Service. U.S. Department of Interior.
Shook, W. 1990 Range Management Handbook. Point Reyes National Seashore: National Park Service. U.S. Department of Interior.
Sugnet, P.W. and J.W. Bartolome. 1983. A Guide to Monitoring Livestock Use within the Pastoral Zone at Point Reyes National Seashore. Department of Forestry and Resource Management: University of California, Berkeley. 38 pp.
Wildland Solutions. 2008. Monitoring Annual Grassland Residual Dry Matter: A Mulch Manager’s Guide for Monitoring Success, 2nd ed. Brewster, WA: Guenther, K. and Hayes, G.

Range Ecology Lab CESU Task Agreement # P11AC91045
28
Appendix A
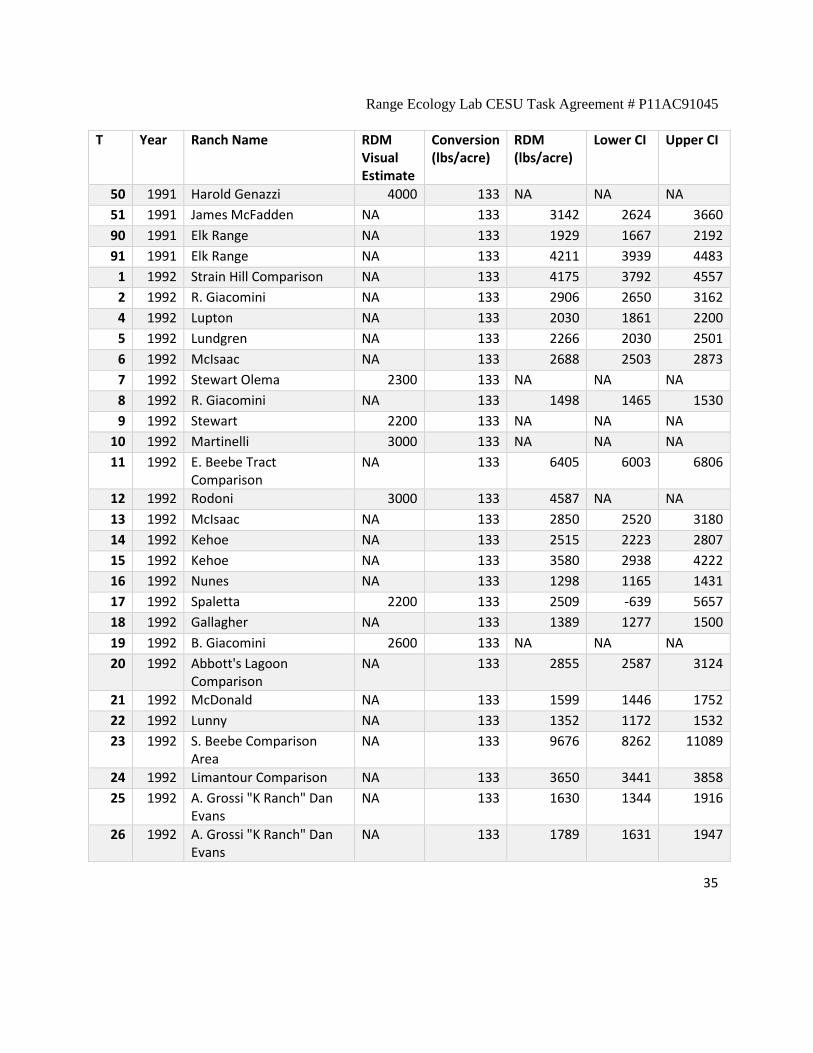
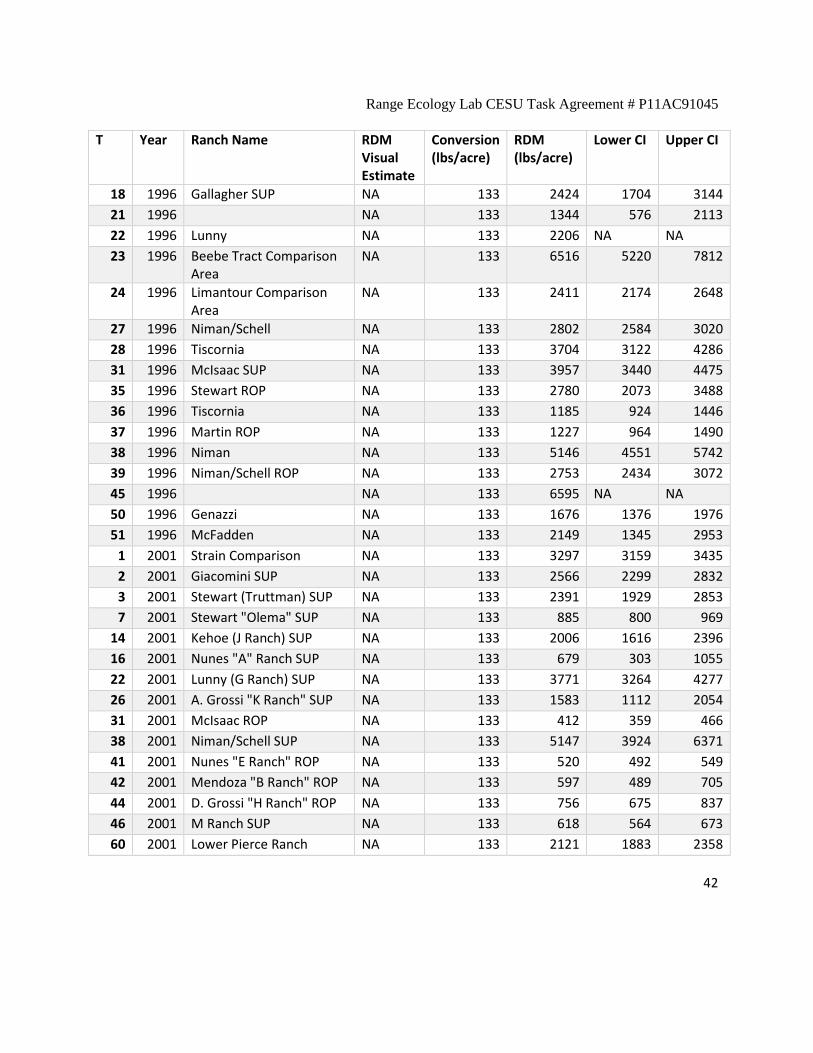
Table A.1: Final RDM Summaries with Confidence Intervals 1987-2014
T Year Ranch Name RDM Visual Estimate
Conversion (lbs/acre)
RDM (lbs/acre)
Lower CI Upper CI
2 1987 Giacomini SUP NA 133 1293 1250 1335 3 1987 Truttman NA 133 883 848 918 4 1987 Lupton NA 133 1099 1050 1149 5 1987 Lundgren NA 133 447 434 461 6 1987 McIsaac NA 133 941 920 961 8 1987 Giacomini NA 133 1226 1180 1272
14 1987 Kehoe SUP NA 133 1093 1061 1125 15 1987 Kehoe SUP NA 133 1871 1777 1966 16 1987 Nunes SUP NA 133 948 927 968 17 1987 Spalletta SUP NA 133 1064 1020 1108 18 1987 NA 133 1079 1056 1101 21 1987 McDonald SUP NA 133 1581 1496 1666 22 1987 Lunny SUP NA 133 823 807 839 25 1987 Evans NA 133 803 773 832 26 1987 Evans NA 133 2024 1947 2101 27 1987 Stewart (Palomarin) NA 133 3002 2859 3144 28 1987 Tiscornia SUP NA 133 2382 2287 2477 29 1987 Murphy SUP NA 133 1241 1189 1293 30 1987 Stewart (Olema) NA 133 2254 2207 2301 31 1987 D. McIsaac ROP NA 133 805 788 822 32 1987 Percy SUP NA 133 524 487 560 33 1987 C. Rogers ROP NA 133 837 817 857 34 1987 Cheda ROP NA 133 469 458 479 35 1987 Stewart ROP NA 133 1836 1774 1897 36 1987 Commonweal/Tacherra NA 133 1340 1286 1394 37 1987 Zanardi ROP NA 133 934 906 963 38 1987 Commonweal ROP NA 133 728 715 741 39 1987 Nimon/Schell ROP NA 133 2039 1961 2117 40 1987 Nunes (A Ranch) ROP NA 133 565 553 576 41 1987 Nunes (E Ranch) ROP NA 133 553 540 567

Range Ecology Lab CESU Task Agreement # P11AC91045
29
T Year Ranch Name RDM Visual Estimate
Conversion (lbs/acre)
RDM (lbs/acre)
Lower CI Upper CI
42 1987 Mendoza ROP NA 133 1456 1404 1507 43 1987 Horick ROP NA 133 1117 1084 1149 44 1987 Rich Grossi ROP NA 133 296 290 303 45 1987 McClure ROP NA 133 3205 3063 3346 46 1987 Al Grossi ROP NA 133 1052 1022 1081 47 1987 Kehoe ROP NA 133 721 679 764 48 1987 Rogers ROP NA 133 1800 1763 1838 49 1987 Lobaugh ROP NA 133 713 701 725
2 1988 NA 133 1415 1305 1524 3 1988 NA 133 1495 1381 1610 4 1988 NA 133 1448 1388 1509 5 1988 NA 133 946 899 993 6 1988 NA 133 514 483 546 8 1988 NA 133 895 850 940
13 1988 NA 133 639 603 675 14 1988 NA 133 1541 1479 1604 15 1988 NA 133 1845 1743 1946 16 1988 NA 133 1702 1571 1833 17 1988 NA 133 1526 1411 1641 18 1988 NA 133 1752 1688 1815 21 1988 NA 133 1744 1672 1815 22 1988 NA 133 943 895 991 25 1988 NA 133 748 716 780 26 1988 NA 133 1435 1371 1500 28 1988 NA 133 1187 1099 1275 29 1988 NA 133 809 770 847 30 1988 NA 133 1506 1464 1548 31 1988 NA 133 504 457 552 32 1988 NA 133 629 566 692 33 1988 NA 133 794 638 950 34 1988 NA 133 554 516 593 35 1988 NA 133 982 914 1050 36 1988 NA 133 719 697 741

Range Ecology Lab CESU Task Agreement # P11AC91045
30
T Year Ranch Name RDM Visual Estimate
Conversion (lbs/acre)
RDM (lbs/acre)
Lower CI Upper CI
37 1988 NA 133 845 788 902 38 1988 NA 133 408 382 435 39 1988 NA 133 746 714 778 40 1988 NA 133 1608 1531 1685 41 1988 NA 133 1529 1475 1583 42 1988 NA 133 1192 1145 1240 43 1988 NA 133 1210 1125 1296 44 1988 NA 133 1586 1485 1688 46 1988 NA 133 2103 2001 2206 47 1988 Kehoe ROP NA 133 987 912 1062 48 1988 NA 133 1284 1205 1363 90 1988 So. Of Abbot's Lagoon NA 133 605 581 628 91 1988 So. Of Abbot's Lagoon NA 133 624 587 660 92 1988 So. Of Abbot's Lagoon NA 133 536 517 555 93 1988 So. Of Abbot's Lagoon NA 133 920 896 944
2 1989 2200 133 NA NA NA 3 1989 1800 133 NA NA NA 4 1989 1500 133 NA NA NA 5 1989 2200 133 NA NA NA 6 1989 1800 133 NA NA NA 7 1989 3500 133 NA NA NA 8 1989 NA 133 1322 1255 1390 9 1989 2000 133 NA NA NA
10 1989 2500 133 NA NA NA 12 1989 2000 133 NA NA NA 13 1989 1900 133 NA NA NA 14 1989 1800 133 NA NA NA 15 1989 1500 133 NA NA NA 16 1989 NA 133 2492 2286 2698 17 1989 NA 133 2591 2471 2711 18 1989 NA 133 1699 1636 1761 19 1989 1400 133 NA NA NA 21 1989 2000 133 NA NA NA

Range Ecology Lab CESU Task Agreement # P11AC91045
31
T Year Ranch Name RDM Visual Estimate
Conversion (lbs/acre)
RDM (lbs/acre)
Lower CI Upper CI
22 1989 NA 133 1789 1680 1897 25 1989 1300 133 NA NA NA 26 1989 1500 133 NA NA NA 27 1989 2000 133 NA NA NA 28 1989 2400 133 NA NA NA 29 1989 1900 133 NA NA NA 30 1989 3000 133 NA NA NA 31 1989 2200 133 NA NA NA 32 1989 1800 133 NA NA NA 33 1989 2200 133 NA NA NA 34 1989 NA 133 1229 1149 1310 35 1989 2600 133 NA NA NA 36 1989 1500 133 NA NA NA 37 1989 NA 133 1181 1121 1241 38 1989 2500 133 NA NA NA 39 1989 2500 133 NA NA NA 40 1989 2000 133 NA NA NA 41 1989 NA 133 2015 1950 2080 42 1989 NA 133 1989 1897 2081 43 1989 NA 133 2223 2020 2426 44 1989 3000 133 NA NA NA 45 1989 3000 133 NA NA NA 46 1989 2300 133 NA NA NA 47 1989 NA 133 1118 1046 1190 48 1989 3000 133 NA NA NA 49 1989 2500 133 NA NA NA 50 1989 6000 133 NA NA NA 51 1989 1900 133 NA NA NA
1 1990 Strain Hill Comparison Area
NA 133 2852 2725 2979
2 1990 NA 133 2237 2062 2412 3 1990 Truttman NA 133 1392 1154 1629 4 1990 NA 133 730 560 900

Range Ecology Lab CESU Task Agreement # P11AC91045
32
T Year Ranch Name RDM Visual Estimate
Conversion (lbs/acre)
RDM (lbs/acre)
Lower CI Upper CI
5 1990 Lundgren NA 133 2008 1675 2342 6 1990 NA 133 1476 1323 1629 7 1990 Stewart NA 133 3580 3354 3806 8 1990 Giacomini NA 133 1098 980 1215 9 1990 NA 133 2483 2224 2742
10 1990 Martinelli NA 133 5178 4936 5419 11 1990 NA 133 3012 2810 3214 12 1990 Rodoni NA 133 2421 2082 2760 13 1990 NA 133 2313 2111 2515 14 1990 NA 133 1637 1290 1985 15 1990 NA 133 1697 1526 1868 16 1990 NA 133 2226 1777 2675 17 1990 Spaletta NA 133 861 664 1058 18 1990 Gallagher NA 133 583 500 666 19 1990 Giacomini NA 133 1266 1061 1471 20 1990 Abbotts Comparison NA 133 4231 NA NA 21 1990 NA 133 419 372 467 22 1990 Lunny NA 133 874 797 952 23 1990 3000 133 NA NA NA 24 1990 Limantour NA 133 2858 2527 3189 25 1990 NA 133 625 523 727 26 1990 K Ranch NA 133 968 859 1076 27 1990 NA 133 748 654 842 28 1990 Tiscornea NA 133 2428 2246 2609 29 1990 Murphy NA 133 606 528 685 30 1990 Stewart NA 133 2442 2296 2587 31 1990 McIsaac ROP NA 133 2648 2513 2782 32 1990 Percy SUP NA 133 1799 1572 2026 33 1990 C. Rogers NA 133 4771 4456 5086 34 1990 Cheda Ranch ROP NA 133 526 451 600 35 1990 NA 133 2877 2456 3298 36 1990 NA 133 473 425 522 37 1990 Martinelli NA 133 941 755 1128

Range Ecology Lab CESU Task Agreement # P11AC91045
33
T Year Ranch Name RDM Visual Estimate
Conversion (lbs/acre)
RDM (lbs/acre)
Lower CI Upper CI
38 1990 Niman/Schell NA 133 1240 990 1489 39 1990 NA 133 2043 1734 2352 40 1990 Nunes ROP NA 133 1070 887 1252 41 1990 Nunes NA 133 1068 889 1247 42 1990 Mendoza NA 133 749 654 844 43 1990 Horick NA 133 193 136 251 44 1990 D. Grossi NA 133 1553 1405 1702 45 1990 McClure NA 133 2559 2401 2716 46 1990 NA 133 2001 1626 2375 47 1990 Kehoe ROP NA 133 590 540 641 48 1990 D. Rogers NA 133 2216 1935 2498 49 1990 NA 133 1870 1635 2105 50 1990 Genazzi NA 133 6246 5765 6726 51 1990 NA 133 2517 2209 2826
1 1991 Strain Hill Comparison Area
NA 133 2771 2522 3021
2 1991 Ralf Giacomini NA 133 2219 1809 2629 3 1991 Truttman 2600 133 3208 NA NA 4 1991 Earl Lupton NA 133 2995 2701 3290 5 1991 Lungren NA 133 2268 2155 2381 6 1991 Don McIsaac NA 133 2228 2143 2312 7 1991 Boyd Stewart NA 133 4437 4101 4773 8 1991 Ralph Giacomini NA 133 1974 1882 2067 9 1991 Stewart 4300 133 5453 NA NA
10 1991 Leroy Martinelli 2800 133 1406 197 2614 11 1991 Comparison Area NA 133 3916 3330 4502 12 1991 Fred Rodoni 2500 133 NA NA NA 13 1991 Don McIsaac NA 133 1959 1885 2033 14 1991 Ken Kehoe NA 133 2555 2439 2670 15 1991 Ken Kehoe NA 133 2322 2082 2562 16 1991 G. Nunes NA 133 2283 2208 2358 17 1991 E. Spalletta NA 133 3264 2972 3556 18 1991 Gallagher NA 133 1935 1815 2055

Range Ecology Lab CESU Task Agreement # P11AC91045
34
T Year Ranch Name RDM Visual Estimate
Conversion (lbs/acre)
RDM (lbs/acre)
Lower CI Upper CI
19 1991 Bob Giacomini NA 133 1723 1544 1902 20 1991 Abbots Lagoon
Comparison Area NA 133 3026 2718 3334
21 1991 McDonald NA 133 1685 1415 1956 22 1991 Joe Lunny NA 133 1362 1282 1442 23 1991 Comparison Area NA 133 4719 4284 5154 24 1991 Limantour Comparison
Area NA 133 3395 3204 3587
25 1991 Dan Evans 3200 133 3657 NA NA 26 1991 Dan Evans NA 133 2104 1905 2302 27 1991 Bill Niman NA 133 4112 3728 4496 28 1991 Mary T NA 133 2653 2436 2871 29 1991 L Murphy NA 133 2195 2094 2295 30 1991 Stewart NA 133 2856 2297 3415 31 1991 Don McIsaac NA 133 2656 2567 2744 32 1991 M. Percy NA 133 1141 1010 1272 33 1991 C. Rogers 3500 133 NA NA NA 34 1991 Don McIsaac NA 133 1057 1006 1108 35 1991 B. Stewart 2200 133 NA NA NA 36 1991 Jim Tacherra NA 133 2618 2502 2734 37 1991 Pat Martin NA 133 1544 1443 1644 38 1991 Bill Niman 3500 133 NA NA NA 39 1991 Bill Niman NA 133 3163 2912 3415 40 1991 G. Nunes NA 133 2002 1847 2158 41 1991 G. Nunes NA 133 1588 1476 1699 42 1991 Joe Mendoza NA 133 1562 1447 1676 43 1991 Horick NA 133 3045 2935 3155 44 1991 Rich Grossi 3000 133 4323 NA NA 45 1991 Bob McClure 2300 133 3458 NA NA 46 1991 Dan Evans 2500 133 2926 NA NA 47 1991 Ken Kehoe NA 133 1499 1380 1619 48 1991 D. Rogers NA 133 2616 2460 2771 49 1991 G. W. Lobough NA 133 2451 2221 2681
Range Ecology Lab CESU Task Agreement # P11AC91045
35
T Year Ranch Name RDM Visual Estimate
Conversion (lbs/acre)
RDM (lbs/acre)
Lower CI Upper CI
50 1991 Harold Genazzi 4000 133 NA NA NA 51 1991 James McFadden NA 133 3142 2624 3660 90 1991 Elk Range NA 133 1929 1667 2192 91 1991 Elk Range NA 133 4211 3939 4483
1 1992 Strain Hill Comparison NA 133 4175 3792 4557 2 1992 R. Giacomini NA 133 2906 2650 3162 4 1992 Lupton NA 133 2030 1861 2200 5 1992 Lundgren NA 133 2266 2030 2501 6 1992 McIsaac NA 133 2688 2503 2873 7 1992 Stewart Olema 2300 133 NA NA NA 8 1992 R. Giacomini NA 133 1498 1465 1530 9 1992 Stewart 2200 133 NA NA NA
10 1992 Martinelli 3000 133 NA NA NA 11 1992 E. Beebe Tract
Comparison NA 133 6405 6003 6806
12 1992 Rodoni 3000 133 4587 NA NA 13 1992 McIsaac NA 133 2850 2520 3180 14 1992 Kehoe NA 133 2515 2223 2807 15 1992 Kehoe NA 133 3580 2938 4222 16 1992 Nunes NA 133 1298 1165 1431 17 1992 Spaletta 2200 133 2509 -639 5657 18 1992 Gallagher NA 133 1389 1277 1500 19 1992 B. Giacomini 2600 133 NA NA NA 20 1992 Abbott's Lagoon
Comparison NA 133 2855 2587 3124
21 1992 McDonald NA 133 1599 1446 1752 22 1992 Lunny NA 133 1352 1172 1532 23 1992 S. Beebe Comparison
Area NA 133 9676 8262 11089
24 1992 Limantour Comparison NA 133 3650 3441 3858 25 1992 A. Grossi "K Ranch" Dan
Evans NA 133 1630 1344 1916
26 1992 A. Grossi "K Ranch" Dan Evans
NA 133 1789 1631 1947

Range Ecology Lab CESU Task Agreement # P11AC91045
36
T Year Ranch Name RDM Visual Estimate
Conversion (lbs/acre)
RDM (lbs/acre)
Lower CI Upper CI
27 1992 Stewart "Bolinas" NA 133 2214 1917 2510 28 1992 Tiscornia NA 133 2929 2607 3252 29 1992 Murphy NA 133 1706 1557 1854 30 1992 Stewart "Olema" 2000 133 NA NA NA 31 1992 McIsaac 2600 133 3768 1594 5942 32 1992 Percy NA 133 2079 1682 2476 33 1992 C. Rogers 2300 133 NA NA NA 34 1992 Cheda NA 133 1492 1347 1637 35 1992 Stewart 3200 133 5067 NA NA 36 1992 Tacherra NA 133 1203 1104 1301 37 1992 Zanardi NA 133 852 720 984 38 1992 Niman/Schell 1800 133 2101 NA NA 39 1992 Niman/Schell 2900 133 3689 -6225 13602 40 1992 Nunes NA 133 1958 1824 2093 41 1992 Nunes NA 133 1485 1348 1622 42 1992 Mendoza NA 133 2200 1963 2438 43 1992 Horick NA 133 2336 1996 2675 44 1992 D. Grossi 2300 133 NA NA NA 45 1992 McClure 2500 133 NA NA NA 46 1992 A. Grossi NA 133 3214 2843 3585 47 1992 Kehoe NA 133 851 745 957 48 1992 D. Rogers NA 133 2151 1899 2403 49 1992 Lobaugh 2600 133 NA NA NA 50 1992 Genazzi 2100 133 3245 -5598 12088 51 1992 McFadden 3600 133 NA NA NA
1 1993 Strain Hill Comparison 3000 133 4080 3746 4415 2 1993 R. Giacomini 2500 133 3087 1732 4443 3 1993 Truttman NA 133 2530 2253 2806 4 1993 Lupton NA 133 3682 -191 7555 5 1993 Lundgren NA 133 2256 2035 2478 6 1993 McIsaac NA 133 2727 886 4569 7 1993 Stewart 2700 133 3691 NA NA 8 1993 B. Giacomini NA 133 2449 2239 2659

Range Ecology Lab CESU Task Agreement # P11AC91045
37
T Year Ranch Name RDM Visual Estimate
Conversion (lbs/acre)
RDM (lbs/acre)
Lower CI Upper CI
9 1993 Stewart NA 133 4345 NA NA 10 1993 L. Martinelli 2900 133 3977 NA NA 11 1993 E. Beebe Tract
Comparison Area NA 133 5048 4427 5670
12 1993 Frerd Rodoni 4500 133 7541 NA NA 13 1993 McIsaac NA 133 4689 2135 7243 14 1993 Kehoe NA 133 3024 2739 3310 15 1993 Kehoe NA 133 2840 2608 3072 16 1993 Nunes NA 133 2299 2019 2580 17 1993 E. Spalletta NA 133 3568 3324 3812 18 1993 Gallagher NA 133 2664 1880 3448 19 1993 B. Giacomini 3000 133 5119 1028 9209 20 1993 Abbotts Lagoon NA 133 3172 2907 3437 21 1993 McDonald NA 133 2235 2078 2393 22 1993 Lunny 1500 133 1809 1651 1967 23 1993 S. Beebe Tract
Comparison Area NA 133 7050 6525 7575
24 1993 Limantour Comparison NA 133 5107 4788 5427 25 1993 Grossi "K Ranch" NA 133 1663 1415 1910 26 1993 Grossi "K Ranch" NA 133 2318 2150 2485 27 1993 Stewart "Bolinas" NA 133 2505 2327 2684 28 1993 Tiscornia NA 133 4394 975 7814 29 1993 S. Murphy NA 133 2709 2369 3050 30 1993 Stewart 2600 133 3584 NA NA 31 1993 McIsaac 3500 133 5292 2487 8096 32 1993 Percy NA 133 1807 1564 2051 33 1993 C. Rogers 4000 133 5841 NA NA 34 1993 Cheda Ranch NA 133 1463 1390 1537 35 1993 Stewart 3500 133 5464 NA NA 36 1993 Tacherra NA 133 1956 1782 2131 37 1993 Zanardi NA 133 1485 1412 1557 38 1993 Niman/Schell NA 133 4406 NA NA 39 1993 Niman/Schell NA 133 3639 3289 3989

Range Ecology Lab CESU Task Agreement # P11AC91045
38
T Year Ranch Name RDM Visual Estimate
Conversion (lbs/acre)
RDM (lbs/acre)
Lower CI Upper CI
40 1993 Nunes 3500 133 7208 NA NA 41 1993 Nunes (E Ranch) NA 133 1952 1793 2110 43 1993 V. Horich NA 133 6424 NA NA 44 1993 D. Grossi ROP NA 133 2940 2689 3191 45 1993 McClure 4000 133 5045 NA NA 46 1993 Dan Evans NA 133 3731 3281 4181 47 1993 Kehoe NA 133 878 794 962 48 1993 D. Rogers ROP NA 133 3547 1399 5694 49 1993 Lobaugh 2500 133 3139 -345 6623 51 1993 McFadden 2800 133 3755 NA NA
1 1994 Strain Hill Comparison Area
NA 133 2996 2712 3281
2 1994 R. Giacomini NA 133 2028 -1248 5305 3 1994 Truttman (Stewart) NA 133 4498 3422 5573 4 1994 Lupton NA 133 2336 2159 2514 5 1994 Merz NA 133 2122 1947 2297 6 1994 McIsaac NA 133 2723 2559 2887 7 1994 Stewart (Olema) NA 133 5437 4339 6534 8 1994 R. Giacomini NA 133 1782 1711 1853 9 1994 Stewart 1800 133 4371 3355 5388
10 1994 Martinelli NA 133 2602 2306 2897 11 1994 Beebe Comparison Area NA 133 3827 3368 4286 12 1994 Rodoni NA 133 5833 4701 6964 13 1994 McIsaac 1800 133 3489 2704 4273 14 1994 Kehoe NA 133 3922 3482 4361 15 1994 Kehoe NA 133 3346 2929 3763 16 1994 Nunes (A Ranch) NA 133 3109 2808 3409 17 1994 Spaletta NA 133 3951 3211 4690 18 1994 Gallagher NA 133 2250 2073 2426 19 1994 B. Giacomini NA 133 3084 2407 3761 20 1994 Abbotts Lagoon
Comparison Area NA 133 4897 4343 5450
21 1994 McDonald NA 133 2477 2224 2731

Range Ecology Lab CESU Task Agreement # P11AC91045
39
T Year Ranch Name RDM Visual Estimate
Conversion (lbs/acre)
RDM (lbs/acre)
Lower CI Upper CI
22 1994 Lunny NA 133 2037 1862 2213 23 1994 S. Beebe Tract
Comparison Area 1800 133 6810 6031 7589
24 1994 Limantour Comparison Area
NA 133 4395 3987 4803
25 1994 D. Evans (K Ranch) NA 133 1849 1610 2088 26 1994 D. Evans (K Ranch) NA 133 2093 1891 2295 27 1994 Niman/Schell NA 133 2708 2505 2912 28 1994 Tiscornia NA 133 3554 3149 3959 29 1994 Murphy NA 133 2371 2186 2556 30 1994 Stewart (Olema) NA 133 4360 3539 5181 31 1994 McIsaac 1800 133 4693 4079 5308 32 1994 Percy NA 133 1893 1595 2190 33 1994 Rogers ROP NA 133 3304 3088 3519 34 1994 Cheda 1200 133 1432 1343 1521 35 1994 Stewart NA 133 3132 2658 3606 36 1994 Tacherra NA 133 2213 2018 2408 37 1994 Zanardi (Martin) NA 133 3139 3069 3209 38 1994 Niman/Schell NA 133 3840 3676 4005 39 1994 Niman/Schell NA 133 5035 4545 5524 40 1994 Nunes (A Ranch) NA 133 5573 4061 7084 41 1994 Nunes "E Ranch" NA 133 1874 1689 2059 42 1994 Mendoza NA 133 2991 2762 3220 43 1994 Horick NA 133 5209 4013 6406 44 1994 R. Grossi NA 133 3877 3564 4190 45 1994 McClure 1800 133 4529 3698 5360 46 1994 D. Evans NA 133 2724 2491 2957 47 1994 Kehoe NA 133 1077 1015 1140 48 1994 D. Rogers NA 133 2770 2583 2957 49 1994 Lobough 1800 133 4472 3274 5670 50 1994 Genazzi NA 133 2627 2417 2837 51 1994 McFadden NA 133 4745 3496 5994
1 1995 Strain Hill Comparison Area
NA 133 4063 3695 4430

Range Ecology Lab CESU Task Agreement # P11AC91045
40
T Year Ranch Name RDM Visual Estimate
Conversion (lbs/acre)
RDM (lbs/acre)
Lower CI Upper CI
2 1995 R. Giacomini NA 133 3914 3183 4644 3 1995 Truttman (Stewart) 6000 133 9103 5971 12234 4 1995 Lupton 3000 133 3767 3055 4480 5 1995 Merz NA 133 2558 2392 2724 6 1995 McIsaac NA 133 3754 3482 4026 7 1995 Stewart NA 133 4344 3806 4882 8 1995 R. Giacomini NA 133 3050 2493 3608 9 1995 Stewart NA 133 5736 4646 6827
10 1995 Martinelli NA 133 2457 2266 2649 11 1995 Beebe Comparison Area NA 133 4998 4450 5547 12 1995 Rodoni 4000 133 4891 3167 6616 13 1995 McIsaac NA 133 4346 3343 5348 14 1995 Kehoe NA 133 4854 4308 5401 15 1995 Kehoe NA 133 4374 3894 4855 16 1995 Nunes NA 133 5676 3822 7530 17 1995 Spaletta 3100 133 4613 3668 5558 18 1995 R. Gallagher NA 133 2590 2294 2887 19 1995 B. Giacomini 2500 133 3742 2153 5331 20 1995 Abbotts Lagoon
Comparison Area NA 133 5701 5017 6385
21 1995 McDonald NA 133 3699 3327 4072 22 1995 J. Lunny NA 133 2940 2667 3214 23 1995 N. Beebe Tract
Comparison Area NA 133 6921 6182 7661
24 1995 Limantour Comparison Area
NA 133 4375 3936 4814
25 1995 K Ranch (Evans) NA 133 1919 1611 2227 26 1995 K Ranch (Evans) NA 133 4461 3415 5507 27 1995 Niman/Schell 2700 133 3376 3154 3599 28 1995 Tiscornia NA 133 3191 2917 3464 29 1995 Murphy NA 133 3692 3035 4348 31 1995 McIsaac 3000 133 4275 3134 5416 32 1995 Mike Percy NA 133 2631 2344 2917 33 1995 C. Rogers 3700 133 4173 2793 5553

Range Ecology Lab CESU Task Agreement # P11AC91045
41
T Year Ranch Name RDM Visual Estimate
Conversion (lbs/acre)
RDM (lbs/acre)
Lower CI Upper CI
34 1995 Cheda Ranch 1600 133 2098 1819 2376 35 1995 Stewart 4500 133 5579 4370 6789 36 1995 Tascherra 2800 133 3768 3540 3995 37 1995 Martin NA 133 1754 1600 1909 38 1995 Niman/Schell 5000 133 6542 5895 7189 39 1995 Niman/Schell 2100 133 2894 2703 3085 40 1995 Nunes NA 133 6341 4307 8375 41 1995 E Ranch NA 133 2307 2106 2509 42 1995 Mendoza NA 133 3946 3422 4470 43 1995 Horick 3500 133 3876 3217 4535 44 1995 R. Grossi NA 133 5152 3780 6524 45 1995 McClure NA 133 7757 6037 9478 46 1995 D. Evans (H Ranch) NA 133 2801 2394 3209 47 1995 Kehoe NA 133 1044 966 1122 48 1995 D. Rogers 3100 133 4023 3398 4647 49 1995 Lobough NA 133 4171 2869 5474 50 1995 Genazzi 1500 133 2249 1926 2572 51 1995 McFadden 3800 133 3948 2860 5036 52 1995 McDonald (Burn Site) NA 133 6777 6136 7418 53 1995 McDonald (Burn Site) NA 133 6257 5776 6738
1 1996 Strain Hill Comparison NA 133 4265 3836 4694 2 1996 R. Giacomini ROP NA 133 3568 2792 4345 4 1996 Lupton SUP NA 133 3312 2525 4099 5 1996 NA 133 2972 2824 3120 6 1996 NA 133 2786 1959 3613 7 1996 Stewart "Olema" SUP 2800 133 4103 NA NA 8 1996 R. Giacomini SUP NA 133 1216 335 2097 9 1996 Stewart ROP 2900 133 4721 NA NA
10 1996 Martinelli ROP 2000 133 2160 NA NA 11 1996 Beebee Tract NA 133 3808 3422 4194 13 1996 NA 133 3090 2418 3762 15 1996 NA 133 3064 NA NA 17 1996 Spaletta SUP NA 133 2975 2753 3197
Range Ecology Lab CESU Task Agreement # P11AC91045
42
T Year Ranch Name RDM Visual Estimate
Conversion (lbs/acre)
RDM (lbs/acre)
Lower CI Upper CI
18 1996 Gallagher SUP NA 133 2424 1704 3144 21 1996 NA 133 1344 576 2113 22 1996 Lunny NA 133 2206 NA NA 23 1996 Beebe Tract Comparison
Area NA 133 6516 5220 7812
24 1996 Limantour Comparison Area
NA 133 2411 2174 2648
27 1996 Niman/Schell NA 133 2802 2584 3020 28 1996 Tiscornia NA 133 3704 3122 4286 31 1996 McIsaac SUP NA 133 3957 3440 4475 35 1996 Stewart ROP NA 133 2780 2073 3488 36 1996 Tiscornia NA 133 1185 924 1446 37 1996 Martin ROP NA 133 1227 964 1490 38 1996 Niman NA 133 5146 4551 5742 39 1996 Niman/Schell ROP NA 133 2753 2434 3072 45 1996 NA 133 6595 NA NA 50 1996 Genazzi NA 133 1676 1376 1976 51 1996 McFadden NA 133 2149 1345 2953
1 2001 Strain Comparison NA 133 3297 3159 3435 2 2001 Giacomini SUP NA 133 2566 2299 2832 3 2001 Stewart (Truttman) SUP NA 133 2391 1929 2853 7 2001 Stewart "Olema" SUP NA 133 885 800 969
14 2001 Kehoe (J Ranch) SUP NA 133 2006 1616 2396 16 2001 Nunes "A" Ranch SUP NA 133 679 303 1055 22 2001 Lunny (G Ranch) SUP NA 133 3771 3264 4277 26 2001 A. Grossi "K Ranch" SUP NA 133 1583 1112 2054 31 2001 McIsaac ROP NA 133 412 359 466 38 2001 Niman/Schell SUP NA 133 5147 3924 6371 41 2001 Nunes "E Ranch" ROP NA 133 520 492 549 42 2001 Mendoza "B Ranch" ROP NA 133 597 489 705 44 2001 D. Grossi "H Ranch" ROP NA 133 756 675 837 46 2001 M Ranch SUP NA 133 618 564 673 60 2001 Lower Pierce Ranch NA 133 2121 1883 2358

Range Ecology Lab CESU Task Agreement # P11AC91045
43
T Year Ranch Name RDM Visual Estimate
Conversion (lbs/acre)
RDM (lbs/acre)
Lower CI Upper CI
64 2001 White Gulch NA 133 3344 3100 3588 74 2001 NA 133 2636 2183 3088
400 2001 Bird Rock NA 133 415 282 547 401 2001 NA 133 759 662 856 402 2001 White Gulch NA 133 473 NA NA
1 2002 McCurdy Ranch - Strain Hill
NA 133 3645 3510 3781
4 2002 Lupton NA 133 1764 1669 1859 6 2002 McIsaac SUP NA 133 1400 1282 1518 8 2002 R. Giacomini NA 133 417 390 443
14 2002 Kehoe SUP NA 133 1695 1513 1878 15 2002 NA 133 838 738 938 17 2002 C Ranch NA 133 1607 1477 1736 18 2002 Bull Point NA 133 921 847 996 21 2002 N Ranch NA 133 909 822 995 25 2002 NA 133 1105 1009 1202 28 2002 Milkins Ranch NA 133 3098 2889 3307 29 2002 Home Ranch NA 133 798 705 892 32 2002 Percy NA 133 978 923 1034 36 2002 Tacherra NA 133 2570 2448 2693 37 2002 Zanardi NA 133 541 496 587 43 2002 D-Ranch NA 133 4353 4132 4574 45 2002 McClure NA 133 2202 1975 2430 48 2002 NA 133 417 380 454 49 2002 L Ranch NA 133 1846 1589 2104 50 2002 Genazzi NA 133 543 515 572 57 2002 AT&T NA 133 1603 1137 2070 60 2002 NA 133 1422 1249 1594 64 2002 Tomales Point NA 133 1757 1590 1923 74 2002 Tomales Point NA 133 1767 1449 2084
400 2002 Elk Range NA 133 1106 996 1215 401 2002 NA 133 1384 1041 1726 402 2002 NA 133 1735 1495 1974

Range Ecology Lab CESU Task Agreement # P11AC91045
44
T Year Ranch Name RDM Visual Estimate
Conversion (lbs/acre)
RDM (lbs/acre)
Lower CI Upper CI
2 2008 Giacomini NA 133 667 626 708 3 2008 NA 133 1222 1122 1322 4 2008 Lupton SUP NA 133 861 770 951 5 2008 NA 133 3109 2880 3338 6 2008 NA 133 484 445 522 7 2008 Stewart Olema NA 133 2355 2191 2518 8 2008 Giacomini SUP NA 133 177 161 193 9 2008 NA 133 1140 1057 1223
10 2008 NA 133 198 181 215 13 2008 McIsaac NA 133 866 794 938 14 2008 Kehoe NA 133 501 451 550 16 2008 A Ranch NA 133 428 394 461 17 2008 NA 133 1345 1121 1570 18 2008 NA 133 369 334 404 19 2008 B. Giacomini (Gallagher) NA 133 2751 2573 2929 21 2008 N Ranch NA 133 280 242 318 22 2008 Lunny NA 133 1569 1361 1777 23 2008 NA 133 2101 1934 2267 25 2008 NA 133 395 339 452 26 2008 NA 133 286 256 316 27 2008 NA 133 2263 2214 2311 28 2008 NA 133 2245 2031 2459 29 2008 Murphy SUP NA 133 302 276 327 30 2008 Stewart NA 133 1416 1292 1539 31 2008 McIsaac ROP NA 133 556 514 598 32 2008 Percy NA 133 218 202 235 33 2008 Rogers NA 133 282 236 328 34 2008 Cheda NA 133 107 107 107 35 2008 NA 133 1991 1822 2160 36 2008 NA 133 4538 4280 4795 37 2008 Zanardi NA 133 280 259 302 38 2008 Niman NA 133 1931 1821 2042 39 2008 NA 133 1161 1103 1218

Range Ecology Lab CESU Task Agreement # P11AC91045
45
T Year Ranch Name RDM Visual Estimate
Conversion (lbs/acre)
RDM (lbs/acre)
Lower CI Upper CI
40 2008 A Ranch Nunes NA 133 1767 1611 1924 41 2008 Nunes "E" Ranch NA 133 2420 2179 2662 42 2008 NA 133 798 672 924 43 2008 Horick (D Ranch) NA 133 1124 1035 1214 44 2008 NA 133 1112 984 1239 45 2008 McClure NA 133 886 831 942 46 2008 A. Grossi (Evans) NA 133 429 403 454 47 2008 Kehoe NA 133 136 127 146 48 2008 NA 133 298 275 321 49 2008 NA 133 371 331 411 50 2008 NA 133 100 100 100 51 2008 McFadden NA 133 118 99 138
1 2009 Strain Hill NA 133 1377 1329 1424 2 2009 Giacomini NA 133 1508 1376 1640 3 2009 Stweart (Truttman) NA 133 4180 3871 4488 4 2009 Lupton SUP NA 133 1286 1154 1418 5 2009 Lundgren (Jewel) NA 133 4728 4404 5052 6 2009 McIsaac NA 133 653 555 751 7 2009 Stewart NA 133 2458 2274 2642 8 2009 R. Giacomini SUP NA 133 222 212 232 9 2009 Stewart ROP NA 133 1254 1153 1355
10 2009 Martinelli NA 133 633 610 657 13 2009 McIsaac NA 133 849 770 928 14 2009 Kehoe NA 133 328 293 363 15 2009 Kehoe NA 133 144 130 157 16 2009 Nunes "A" NA 133 186 159 213 17 2009 Spaletta "C Ranch" NA 133 386 317 454 18 2009 Gallagher NA 133 231 187 274 19 2009 NA 133 2906 2731 3081 21 2009 McDonald NA 133 139 133 145 22 2009 Lunny SUP NA 133 2473 1903 3043 25 2009 A. Grossi "K" Ranch NA 133 323 289 357 26 2009 Grossi/Evans NA 133 229 204 255

Range Ecology Lab CESU Task Agreement # P11AC91045
46
T Year Ranch Name RDM Visual Estimate
Conversion (lbs/acre)
RDM (lbs/acre)
Lower CI Upper CI
27 2009 Stewart "Bolinas" NA 133 1321 1241 1400 28 2009 NA 133 1819 1549 2088 29 2009 Murphy NA 133 232 182 282 30 2009 Stewart "Olema" NA 133 1948 1891 2006 31 2009 McIsaac NA 133 929 857 1000 32 2009 Percy NA 133 543 485 600 33 2009 C. Rogers NA 133 717 623 810 34 2009 Cheda NA 133 129 129 129 35 2009 Stewart NA 133 3053 2876 3231 36 2009 Tacherra NA 133 3231 3031 3431 37 2009 Zanardi NA 133 813 721 905 38 2009 Niman/Schell NA 133 1056 869 1243 39 2009 Niman/Schell NA 133 363 289 438 40 2009 Nunes "A" NA 133 1158 980 1336 41 2009 Nunes "E Ranch" NA 133 825 714 936 42 2009 Mendoza NA 133 285 226 344 43 2009 Horick NA 133 553 488 617 44 2009 Grossi NA 133 675 609 742 45 2009 McClure NA 133 1097 1043 1152 46 2009 Evans NA 133 656 557 754 47 2009 Kehoe NA 133 124 124 124 48 2009 D. Rogers NA 133 337 313 361 49 2009 Lobaugh NA 133 719 630 808 50 2009 Genazzi NA 133 125 103 146 51 2009 NA 133 154 142 167
2 2011 Giacomini NA 133 1948 1821 2076 3 2011 Stewart-Truttman SUP NA 133 3671 3441 3900 4 2011 Truttman SUP NA 133 942 877 1007 5 2011 Lundgren NA 133 4094 3841 4347 6 2011 McIsaac SUP NA 133 1379 1290 1469 7 2011 Stewart "Olema" NA 133 2224 2002 2446 8 2011 Giacomini-SUP NA 133 690 637 742 9 2011 Stewart-ROP NA 133 2011 1803 2220

Range Ecology Lab CESU Task Agreement # P11AC91045
47
T Year Ranch Name RDM Visual Estimate
Conversion (lbs/acre)
RDM (lbs/acre)
Lower CI Upper CI
10 2011 Martinelli NA 133 748 666 829 13 2011 McIsaac-SUP NA 133 1863 1738 1988 19 2011 Gallagher NA 133 2344 2229 2460 27 2011 Stewart Bolinas NA 133 2192 1999 2384 30 2011 Stewart Olema NA 133 1335 1233 1436 31 2011 McIsaac-ROP NA 133 1404 1278 1530 32 2011 Percy NA 133 845 762 928 33 2011 C. Rogers NA 133 1386 1282 1489 34 2011 Cheda NA 133 188 159 217 35 2011 Stewart ROP NA 133 1615 1514 1717 37 2011 Zanardi NA 133 533 477 589 38 2011 Niman/Schell NA 133 1723 1539 1906 39 2011 Niman/Schell-ROP NA 133 1782 1623 1940 45 2011 I Ranch NA 133 1670 1570 1770 50 2011 Genazzi NA 133 231 209 253 51 2011 McFadden NA 133 900 766 1034
1 2012 Strain Hill NA 133 2180 1984 2377 2 2012 Giacomini NA 133 3585 3392 3778 3 2012 Stewart-Truttman SUP NA 133 6697 6376 7018 4 2012 Lupton NA 133 2803 2462 3144 5 2012 Lundgren NA 133 6592 6103 7082 6 2012 McIsaac SUP NA 133 1019 867 1171 7 2012 Stewart "Olema" NA 133 3114 2804 3424 8 2012 Giacomini-SUP NA 133 855 775 935 9 2012 Stewart-ROP NA 133 2547 2418 2676
10 2012 Martinelli NA 133 1080 993 1167 11 2012 E. Beebe Tract
Comparison Area NA 133 2141 1931 2351
12 2012 Rodoni SUP NA 133 5378 5030 5725 13 2012 McIsaac-SUP NA 133 2001 1851 2151 14 2012 Kehoe SUP NA 133 1668 1546 1791 15 2012 Kehoe SUP NA 133 964 870 1059 16 2012 A Ranch SUP NA 133 429 384 474

Range Ecology Lab CESU Task Agreement # P11AC91045
48
T Year Ranch Name RDM Visual Estimate
Conversion (lbs/acre)
RDM (lbs/acre)
Lower CI Upper CI
17 2012 C Ranch NA 133 1846 1702 1991 18 2012 Gallagher SUP NA 133 2284 2153 2415 19 2012 Gallagher NA 133 3466 3251 3680 20 2012 Abbotts Lagoon
Comparison area NA 133 825 727 924
21 2012 N Ranch NA 133 1007 907 1108 22 2012 Lunny SUP NA 133 5640 5291 5989 23 2012 S. Beebe Tract
Comparison Area NA 133 4221 3722 4720
24 2012 Limantour comparison area
NA 133 5996 5740 6253
25 2012 A. Grossi "K" Ranch NA 133 730 634 826 26 2012 K Ranch SUP NA 133 1409 1177 1641 27 2012 Stewart Bolinas NA 133 3642 3403 3882 28 2012 Wilkins Ranch NA 133 10791 10099 11482 29 2012 Home Ranch NA 133 1041 959 1123 30 2012 Stewart Olema NA 133 2329 2176 2483 31 2012 McIsaac-ROP NA 133 1663 1542 1784 32 2012 Percy NA 133 777 721 832 33 2012 C. Rogers NA 133 1366 1195 1537 34 2012 Cheda NA 133 383 340 426 35 2012 Stewart ROP NA 133 3066 2777 3356 36 2012 Tacherra SUP NA 133 4509 4156 4862 37 2012 Zanardi NA 133 566 509 624 38 2012 Niman/Schell NA 133 2105 1718 2491 39 2012 Niman/Schell-ROP NA 133 2305 2168 2442 40 2012 Nunes "A" Ranch ROP NA 133 3007 2772 3243 41 2012 Nunes "E" Ranch ROP NA 133 5231 4922 5539 42 2012 Mendoza ROP NA 133 3049 2864 3234 43 2012 Horick ROP NA 133 3336 2984 3687 44 2012 D. Grossi ROP NA 133 2604 2503 2705 45 2012 I Ranch NA 133 1852 1745 1959 46 2012 A. Grossi ROP NA 133 2291 2105 2476 47 2012 Kehoe ROP NA 133 365 341 390

Range Ecology Lab CESU Task Agreement # P11AC91045
49
T Year Ranch Name RDM Visual Estimate
Conversion (lbs/acre)
RDM (lbs/acre)
Lower CI Upper CI
48 2012 D. Rogers NA 133 1686 1483 1889 49 2012 Lobaugh ROP NA 133 1711 1602 1819 50 2012 Genazzi NA 133 147 129 165 51 2012 McFadden NA 133 1330 1213 1447
1 2013 Strain Hill NA 100 2966 2742 3189 2 2013 Giacomini NA 100 1534 1438 1631 3 2013 Stewart-Truttman SUP NA 100 2527 2411 2644 4 2013 Lupton NA 100 2686 2366 3005 5 2013 Lundgren NA 100 5592 5109 6074 6 2013 McIsaac SUP NA 100 1315 1233 1397 7 2013 Stewart "Olema" NA 100 3272 3087 3456 8 2013 Giacomini-SUP NA 100 888 798 978 9 2013 Stewart-ROP NA 100 1739 1632 1846
10 2013 Martinelli NA 100 1091 1004 1177 11 2013 E. Beebe Tract
Comparison Area NA 100 1360 1232 1487
13 2013 McIsaac-SUP NA 100 1358 1252 1463 14 2013 Kehoe SUP NA 100 1440 1342 1539 15 2013 Kehoe SUP NA 100 1077 1001 1153 16 2013 A Ranch SUP NA 100 505 461 548 17 2013 C Ranch NA 100 1340 1245 1436 18 2013 Gallagher SUP NA 100 1700 1583 1817 19 2013 Gallagher NA 100 3689 3196 4182 20 2013 Abbotts Lagoon
Comparison area NA 100 1804 1658 1950
21 2013 N Ranch NA 100 808 761 856 22 2013 Lunny SUP NA 100 5579 5129 6028 23 2013 S. Beebe Tract
Comparison Area NA 100 2781 2288 3273
24 2013 Limantour comparison area
NA 100 2868 2643 3093
25 2013 A. Grossi "K" Ranch NA 100 461 420 503 26 2013 K Ranch SUP NA 100 620 550 689 27 2013 Stewart Bolinas NA 100 3363 3037 3689

Range Ecology Lab CESU Task Agreement # P11AC91045
50
T Year Ranch Name RDM Visual Estimate
Conversion (lbs/acre)
RDM (lbs/acre)
Lower CI Upper CI
28 2013 Wilkins Ranch NA 100 2058 1953 2163 29 2013 Home Ranch NA 100 960 906 1013 30 2013 Stewart Olema NA 100 2185 2016 2354 31 2013 McIsaac-ROP NA 100 1299 1213 1385 32 2013 Percy NA 100 521 487 555 33 2013 C. Rogers NA 100 1138 1057 1218 34 2013 Cheda NA 100 204 184 223 35 2013 Stewart ROP NA 100 3311 3101 3520 36 2013 Tacherra SUP NA 100 5777 5340 6215 37 2013 Zanardi NA 100 465 408 521 38 2013 Niman/Schell NA 100 2533 2192 2874 39 2013 Niman/Schell-ROP NA 100 2364 2127 2601 40 2013 Nunes "A" Ranch ROP NA 100 1849 1707 1990 41 2013 Nunes "E" Ranch ROP NA 100 3264 3074 3454 42 2013 Mendoza ROP NA 100 719 642 795 43 2013 Horick ROP NA 100 1167 1021 1314 44 2013 D. Grossi ROP NA 100 2292 2089 2495 45 2013 I Ranch NA 100 1168 1062 1275 46 2013 A. Grossi ROP NA 100 1867 1762 1972 47 2013 Kehoe ROP NA 100 401 368 434 48 2013 D. Rogers NA 100 2143 1930 2357 49 2013 Lobaugh ROP NA 100 1983 1759 2208 50 2013 Genazzi NA 100 392 360 424 51 2013 McFadden NA 100 2328 2170 2486
38a 2013 Niman/Schell NA 100 2311 1973 2650 39a 2013 Niman/Schell-ROP NA 100 2188 2015 2361
1 2014 Strain Hill NA 100 1886 1750 2021 2 2014 Giacomini NA 100 608 557 659 3 2014 Stewart-Truttman SUP NA 100 2242 2108 2375 4 2014 Lupton NA 100 1140 1046 1235 5 2014 Lundgren NA 100 3270 3015 3524 6 2014 McIsaac SUP NA 100 1193 1071 1316 7 2014 Stewart "Olema" NA 100 2528 2379 2677

Range Ecology Lab CESU Task Agreement # P11AC91045
51
T Year Ranch Name RDM Visual Estimate
Conversion (lbs/acre)
RDM (lbs/acre)
Lower CI Upper CI
8 2014 Giacomini-SUP NA 100 857 797 916 9 2014 Stewart-ROP NA 100 987 931 1042
10 2014 Martinelli NA 100 964 902 1027 11 2014 E. Beebe Tract
Comparison Area NA 100 348 279 418
13 2014 McIsaac-SUP NA 100 1138 1057 1218 14 2014 Kehoe SUP NA 100 770 703 837 15 2014 Kehoe SUP NA 100 624 550 698 16 2014 A Ranch SUP NA 100 1184 1072 1297 17 2014 C Ranch NA 100 793 733 852 18 2014 Gallagher SUP NA 100 1412 1305 1518 19 2014 Gallagher NA 100 3256 3120 3393 20 2014 Abbotts Lagoon
Comparison area NA 100 626 547 705
21 2014 N Ranch NA 100 943 904 982 22 2014 Lunny SUP NA 100 2919 2677 3161 23 2014 S. Beebe Tract
Comparison Area NA 100 1101 239 1964
24 2014 Limantour comparison area
NA 100 2040 1905 2175
25 2014 A. Grossi "K" Ranch NA 100 342 309 375 26 2014 K Ranch SUP NA 100 755 650 861 27 2014 Stewart Bolinas NA 100 3840 3467 4214 28 2014 Wilkins Ranch NA 100 2235 2112 2359 29 2014 Home Ranch NA 100 622 582 662 30 2014 Stewart Olema NA 100 2249 2004 2494 31 2014 McIsaac-ROP NA 100 1795 1705 1886 32 2014 Percy NA 100 389 351 427 33 2014 C. Rogers NA 100 1535 1449 1620 34 2014 Cheda NA 100 250 229 271 35 2014 Stewart ROP NA 100 1934 1828 2041 36 2014 Tacherra SUP NA 100 3648 3336 3960 37 2014 Zanardi NA 100 487 453 521 38 2014 Niman/Schell NA 100 1204 1138 1271

Range Ecology Lab CESU Task Agreement # P11AC91045
52
T Year Ranch Name RDM Visual Estimate
Conversion (lbs/acre)
RDM (lbs/acre)
Lower CI Upper CI
39 2014 Niman/Schell-ROP NA 100 1234 1132 1336 40 2014 Nunes "A" Ranch ROP NA 100 3170 2930 3410 41 2014 Nunes "E" Ranch ROP NA 100 1193 1036 1351 42 2014 Mendoza ROP NA 100 1071 997 1145 43 2014 Horick ROP NA 100 1451 1366 1536 44 2014 D. Grossi ROP NA 100 1232 1174 1290 45 2014 I Ranch NA 100 898 783 1014 46 2014 A. Grossi ROP NA 100 2388 2201 2575 47 2014 Kehoe ROP NA 100 165 153 176 48 2014 D. Rogers NA 100 1185 1100 1270 49 2014 Lobaugh ROP NA 100 837 738 935 50 2014 Genazzi NA 100 581 549 612 51 2014 McFadden NA 100 993 900 1087 57 2014 AT&T NA 100 1239 1100 1378

Table A.2: Key area transect name and years surveyed; No surveys 1997-2000, 2003-2007, 2010; 1 = double sampling or visual estimate survey conducted.
T Current name
1987 1988 1989 1990 1991 1992 1993 1994 1995 1996 2001 2002 2008 2009 2011 2012 2013 2014 Total
1 Strain Hill 1 1 1 1 1 1 1 1 1 1 1 1 1 13 2 R Giacomini 1 1 1 1 1 1 1 1 1 1 1 1 1 1 1 1 1 17 3 Stewart
Truttman 1 1 1 1 1 1 1 1 1 1 1 1 1 1 1 15
4 Stewart Lupton
1 1 1 1 1 1 1 1 1 1 1 1 1 1 1 1 1 17
5 Jewell 1 1 1 1 1 1 1 1 1 1 1 1 1 1 1 1 16 6 McIsaac
Bolinas 1 1 1 1 1 1 1 1 1 1 1 1 1 1 1 1 1 17
7 Bear Valley 1 1 1 1 1 1 1 1 1 1 1 1 1 1 1 15 8 R Giacomini 1 1 1 1 1 1 1 1 1 1 1 1 1 1 1 1 1 17 9 Stewart 1 1 1 1 1 1 1 1 1 1 1 1 1 1 14
10 Martinelli 1 1 1 1 1 1 1 1 1 1 1 1 1 1 14 11 Beebe East 1 1 1 1 1 1 1 1 1 1 10 12 Olema Marsh 1 1 1 1 1 1 1 1 8 13 McIsaac
Bolinas 1 1 1 1 1 1 1 1 1 1 1 1 1 1 1 15
14 J Ranch North
1 1 1 1 1 1 1 1 1 1 1 1 1 1 1 1 16
15 J Ranch East 1 1 1 1 1 1 1 1 1 1 1 1 1 1 1 15 16 A Ranch 1 1 1 1 1 1 1 1 1 1 1 1 1 1 1 15 17 C Ranch 1 1 1 1 1 1 1 1 1 1 1 1 1 1 1 1 16 18 F Ranch 1 1 1 1 1 1 1 1 1 1 1 1 1 1 1 1 16 19 E Gallagher 1 1 1 1 1 1 1 1 1 1 1 1 1 13 20 Abbots
Lagoon 1 1 1 1 1 1 1 1 1 9
21 N Ranch 1 1 1 1 1 1 1 1 1 1 1 1 1 1 1 1 16 22 G Ranch 1 1 1 1 1 1 1 1 1 1 1 1 1 1 1 1 16 23 Beebe South 1 1 1 1 1 1 1 1 1 1 1 11 24 Limantour 1 1 1 1 1 1 1 1 1 1 10 25 K Ranch 1 1 1 1 1 1 1 1 1 1 1 1 1 1 1 15

Range Ecology Lab CESU Task Agreement # P11AC91045
2
T Current name
1987 1988 1989 1990 1991 1992 1993 1994 1995 1996 2001 2002 2008 2009 2011 2012 2013 2014 Total
Kehoe 26 K Ranch
Evans 1 1 1 1 1 1 1 1 1 1 1 1 1 1 1 15
27 Commonweal 1 1 1 1 1 1 1 1 1 1 1 1 1 1 1 15 28 Dogtown 1 1 1 1 1 1 1 1 1 1 1 1 1 1 1 1 16 29 Home Ranch 1 1 1 1 1 1 1 1 1 1 1 1 1 1 1 15 30 Bear Valley 1 1 1 1 1 1 1 1 1 1 1 1 1 1 14 31 McIsaac
West 1 1 1 1 1 1 1 1 1 1 1 1 1 1 1 1 1 17
32 Percy 1 1 1 1 1 1 1 1 1 1 1 1 1 1 1 1 16 33 C Rogers 1 1 1 1 1 1 1 1 1 1 1 1 1 1 1 15 34 Cheda 1 1 1 1 1 1 1 1 1 1 1 1 1 1 1 15 35 Stewart 1 1 1 1 1 1 1 1 1 1 1 1 1 1 1 1 16 36 Tacherra 1 1 1 1 1 1 1 1 1 1 1 1 1 1 1 1 16 37 Zanardi 1 1 1 1 1 1 1 1 1 1 1 1 1 1 1 1 1 17 38 Commonweal 1 1 1 1 1 1 1 1 1 1 1 1 1 1 1 1 1 17 39 Niman 1 1 1 1 1 1 1 1 1 1 1 1 1 1 1 1 16 40 A Ranch 1 1 1 1 1 1 1 1 1 1 1 1 1 1 14 41 E Ranch 1 1 1 1 1 1 1 1 1 1 1 1 1 1 1 15 42 B Ranch 1 1 1 1 1 1 1 1 1 1 1 1 1 1 14 43 D Ranch
Nunes 1 1 1 1 1 1 1 1 1 1 1 1 1 1 1 15
44 M Ranch 1 1 1 1 1 1 1 1 1 1 1 1 1 1 1 15
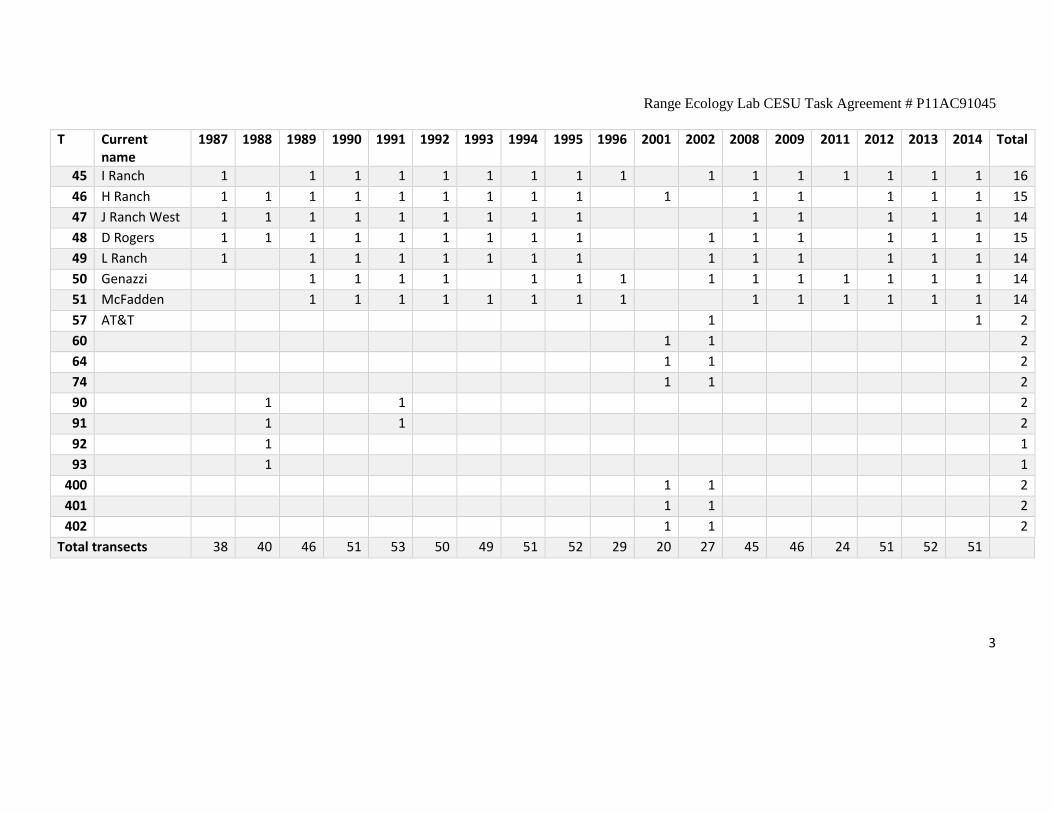
Range Ecology Lab CESU Task Agreement # P11AC91045
3
T Current name
1987 1988 1989 1990 1991 1992 1993 1994 1995 1996 2001 2002 2008 2009 2011 2012 2013 2014 Total
45 I Ranch 1 1 1 1 1 1 1 1 1 1 1 1 1 1 1 1 16 46 H Ranch 1 1 1 1 1 1 1 1 1 1 1 1 1 1 1 15 47 J Ranch West 1 1 1 1 1 1 1 1 1 1 1 1 1 1 14 48 D Rogers 1 1 1 1 1 1 1 1 1 1 1 1 1 1 1 15 49 L Ranch 1 1 1 1 1 1 1 1 1 1 1 1 1 1 14 50 Genazzi 1 1 1 1 1 1 1 1 1 1 1 1 1 1 14 51 McFadden 1 1 1 1 1 1 1 1 1 1 1 1 1 1 14 57 AT&T 1 1 2 60 1 1 2 64 1 1 2 74 1 1 2 90 1 1 2 91 1 1 2 92 1 1 93 1 1
400 1 1 2 401 1 1 2 402 1 1 2
Total transects 38 40 46 51 53 50 49 51 52 29 20 27 45 46 24 51 52 51

Figure A.2 1987-2014 RDM by key area transect
The figures for the following RDM values show annual variation in RDM for all years that are sampled with visual estimation or double-sampling monitoring. The solid grey bars with whiskers show the double-sampling RDM estimates and the corresponding 95% confidence interval. Whiskers are not shown for incomplete double-sampling estimates where a confidence interval is not calculated. The bars with only hash marks show visual estimates of RDM. Any bar that shows grey and hash marks represents a transect that in one year had some clipped estimates and visual estimation but only double-sampling if there are whiskers to represent the 95% confidence interval. The solid black line marks the 1,200 lbs/acre minimum RDM standard.

Range Ecology Lab CESU Task Agreement # P11AC91045
2
1990 1991 1992 1993 1994 1995 1996 2001 2002 2009 2012 2013 2014
1 Strain Hill
Res
idua
l Dry
Mat
ter (
lbs/
acre
)0
1000
2000
3000
4000
010
0020
0030
0040
00
1987 1988 1989 1990 1991 1992 1993 1994 1995 1996 2001 2008 2009 2011 2012 2013 2014
2 R Giacomini
Res
idua
l Dry
Mat
ter (
lbs/
acre
)0
1000
2000
3000
4000
5000
010
0020
0030
0040
0050
00

Range Ecology Lab CESU Task Agreement # P11AC91045
3
1987 1988 1989 1990 1991 1993 1994 1995 2001 2008 2009 2011 2012 2013 2014
3 Stewart Truttman
Res
idua
l Dry
Mat
ter (
lbs/
acre
)0
2000
4000
6000
8000
1000
012
000
020
0040
0060
0080
0010
000
1200
0
1987 1988 1989 1990 1991 1992 1993 1994 1995 1996 2002 2008 2009 2011 2012 2013 2014
4 Stewart Lupton
Res
idua
l Dry
Mat
ter (
lbs/
acre
)0
1000
2000
3000
4000
5000
6000
7000
010
0020
0030
0040
0050
0060
0070
00
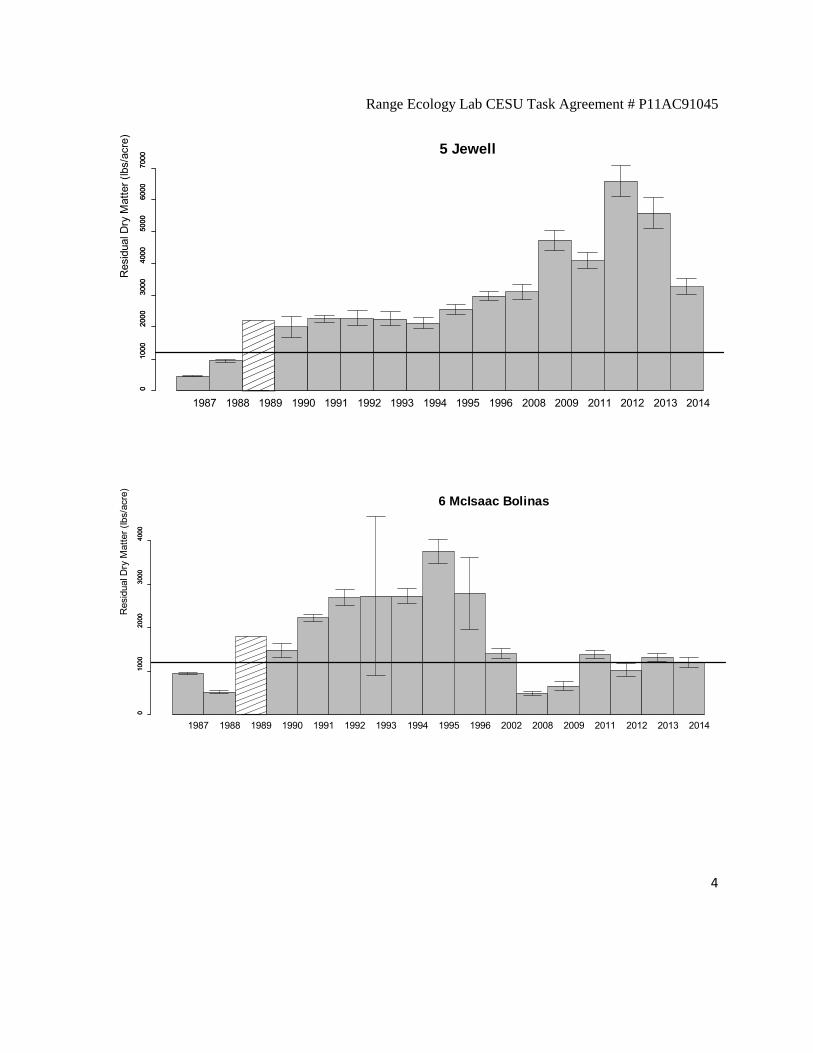
Range Ecology Lab CESU Task Agreement # P11AC91045
4
1987 1988 1989 1990 1991 1992 1993 1994 1995 1996 2008 2009 2011 2012 2013 2014
5 Jewell
Res
idua
l Dry
Mat
ter (
lbs/
acre
)0
1000
2000
3000
4000
5000
6000
7000
010
0020
0030
0040
0050
0060
0070
00
1987 1988 1989 1990 1991 1992 1993 1994 1995 1996 2002 2008 2009 2011 2012 2013 2014
6 McIsaac Bolinas
Res
idua
l Dry
Mat
ter (
lbs/
acre
)0
1000
2000
3000
4000
010
0020
0030
0040
00

Range Ecology Lab CESU Task Agreement # P11AC91045
5
1989 1990 1991 1992 1993 1994 1995 1996 2001 2008 2009 2011 2012 2013 2014
7 Bear Valley
Res
idua
l Dry
Mat
ter (
lbs/
acre
)0
1000
2000
3000
4000
5000
6000
010
0020
0030
0040
0050
0060
00
1987 1988 1989 1990 1991 1992 1993 1994 1995 1996 2002 2008 2009 2011 2012 2013 2014
8 R Giacomini
Res
idua
l Dry
Mat
ter (
lbs/
acre
)0
500
1000
1500
2000
2500
3000
3500
050
010
0015
0020
0025
0030
0035
00

Range Ecology Lab CESU Task Agreement # P11AC91045
6
1989 1990 1991 1992 1993 1994 1995 1996 2008 2009 2011 2012 2013 2014
9 Stewart
Res
idua
l Dry
Mat
ter (
lbs/
acre
)0
1000
2000
3000
4000
5000
6000
010
0020
0030
0040
0050
0060
00
1989 1990 1991 1992 1993 1994 1995 1996 2008 2009 2011 2012 2013 2014
10 Martinelli
Res
idua
l Dry
Mat
ter (
lbs/
acre
)0
1000
2000
3000
4000
5000
010
0020
0030
0040
0050
00

Range Ecology Lab CESU Task Agreement # P11AC91045
7
1990 1991 1992 1993 1994 1995 1996 2012 2013 2014
11 Beebe East
Res
idua
l Dry
Mat
ter (
lbs/
acre
)0
1000
2000
3000
4000
5000
6000
010
0020
0030
0040
0050
0060
00
1989 1990 1991 1992 1993 1994 1995 2012
12 Olema Marsh
Res
idua
l Dry
Mat
ter (
lbs/
acre
)0
1000
2000
3000
4000
5000
6000
7000
010
0020
0030
0040
0050
0060
0070
00

Range Ecology Lab CESU Task Agreement # P11AC91045
8
1988 1989 1990 1991 1992 1993 1994 1995 1996 2008 2009 2011 2012 2013 2014
13 McIsaac Bolinas
Res
idua
l Dry
Mat
ter (
lbs/
acre
)0
1000
2000
3000
4000
5000
6000
7000
010
0020
0030
0040
0050
0060
0070
00
1987 1988 1989 1990 1991 1992 1993 1994 1995 2001 2002 2008 2009 2012 2013 2014
14 J Ranch North
Res
idua
l Dry
Mat
ter (
lbs/
acre
)0
1000
2000
3000
4000
5000
010
0020
0030
0040
0050
00

Range Ecology Lab CESU Task Agreement # P11AC91045
9
1987 1988 1989 1990 1991 1992 1993 1994 1995 1996 2002 2009 2012 2013 2014
15 J Ranch East
Res
idua
l Dry
Mat
ter (
lbs/
acre
)0
1000
2000
3000
4000
010
0020
0030
0040
00
1987 1988 1989 1990 1991 1992 1993 1994 1995 2001 2008 2009 2012 2013 2014
16 A Ranch
Res
idua
l Dry
Mat
ter (
lbs/
acre
)0
1000
2000
3000
4000
5000
6000
7000
010
0020
0030
0040
0050
0060
0070
00

Range Ecology Lab CESU Task Agreement # P11AC91045
10
1987 1988 1989 1990 1991 1992 1993 1994 1995 1996 2002 2008 2009 2012 2013 2014
17 C Ranch
Res
idua
l Dry
Mat
ter (
lbs/
acre
)0
1000
2000
3000
4000
5000
010
0020
0030
0040
0050
00
1987 1988 1989 1990 1991 1992 1993 1994 1995 1996 2002 2008 2009 2012 2013 2014
18 F Ranch
Res
idua
l Dry
Mat
ter (
lbs/
acre
)0
500
1000
1500
2000
2500
3000
050
010
0015
0020
0025
0030
00

Range Ecology Lab CESU Task Agreement # P11AC91045
11
1989 1990 1991 1992 1993 1994 1995 2008 2009 2011 2012 2013 2014
19 E Gallagher
Res
idua
l Dry
Mat
ter (
lbs/
acre
)0
2000
4000
6000
8000
020
0040
0060
0080
00

Range Ecology Lab CESU Task Agreement # P11AC91045
12
1987 1988 1989 1990 1991 1992 1993 1994 1995 1996 2002 2008 2009 2012 2013 2014
21 N Ranch
Res
idua
l Dry
Mat
ter (
lbs/
acre
)0
1000
2000
3000
4000
010
0020
0030
0040
00
1987 1988 1989 1990 1991 1992 1993 1994 1995 1996 2001 2008 2009 2012 2013 2014
22 G Ranch
Res
idua
l Dry
Mat
ter (
lbs/
acre
)0
1000
2000
3000
4000
5000
6000
010
0020
0030
0040
0050
0060
00

Range Ecology Lab CESU Task Agreement # P11AC91045
13
1990 1991 1992 1993 1994 1995 1996 2008 2012 2013 2014
23 Beebe South
Res
idua
l Dry
Mat
ter (
lbs/
acre
)0
2000
4000
6000
8000
1000
00
2000
4000
6000
8000
1000
0
1990 1991 1992 1993 1994 1995 1996 2012 2013 2014
24 Limantour
Res
idua
l Dry
Mat
ter (
lbs/
acre
)0
1000
2000
3000
4000
5000
6000
010
0020
0030
0040
0050
0060
00
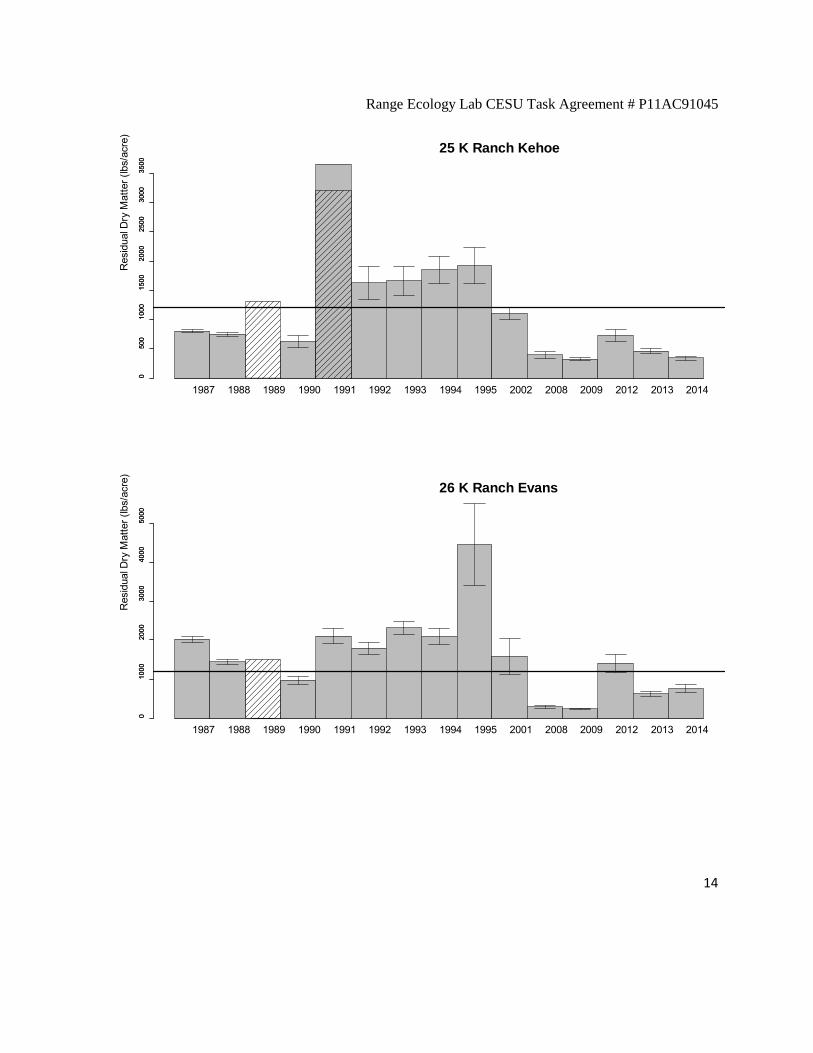
Range Ecology Lab CESU Task Agreement # P11AC91045
14
1987 1988 1989 1990 1991 1992 1993 1994 1995 2002 2008 2009 2012 2013 2014
25 K Ranch Kehoe
Res
idua
l Dry
Mat
ter (
lbs/
acre
)0
500
1000
1500
2000
2500
3000
3500
050
010
0015
0020
0025
0030
0035
00
1987 1988 1989 1990 1991 1992 1993 1994 1995 2001 2008 2009 2012 2013 2014
26 K Ranch Evans
Res
idua
l Dry
Mat
ter (
lbs/
acre
)0
1000
2000
3000
4000
5000
010
0020
0030
0040
0050
00

Range Ecology Lab CESU Task Agreement # P11AC91045
15
1987 1989 1990 1991 1992 1993 1994 1995 1996 2008 2009 2011 2012 2013 2014
27 Commonweal
Res
idua
l Dry
Mat
ter (
lbs/
acre
)0
1000
2000
3000
4000
010
0020
0030
0040
00
1987 1988 1989 1990 1991 1992 1993 1994 1995 1996 2002 2008 2009 2012 2013 2014
28 Dogtown
Res
idua
l Dry
Mat
ter (
lbs/
acre
)0
2000
4000
6000
8000
1000
00
2000
4000
6000
8000
1000
0

Range Ecology Lab CESU Task Agreement # P11AC91045
16
1987 1988 1989 1990 1991 1992 1993 1994 1995 2002 2008 2009 2012 2013 2014
29 Home Ranch
Res
idua
l Dry
Mat
ter (
lbs/
acre
)0
1000
2000
3000
4000
010
0020
0030
0040
00
1987 1988 1989 1990 1991 1992 1993 1994 2008 2009 2011 2012 2013 2014
30 Bear Valley
Res
idua
l Dry
Mat
ter (
lbs/
acre
)0
1000
2000
3000
4000
5000
010
0020
0030
0040
0050
00

Range Ecology Lab CESU Task Agreement # P11AC91045
17
1987 1988 1989 1990 1991 1992 1993 1994 1995 1996 2001 2008 2009 2011 2012 2013 2014
31 McIsaac West
Res
idua
l Dry
Mat
ter (
lbs/
acre
)0
2000
4000
6000
8000
020
0040
0060
0080
00
1987 1988 1989 1990 1991 1992 1993 1994 1995 2002 2008 2009 2011 2012 2013 2014
32 Percy
Res
idua
l Dry
Mat
ter (
lbs/
acre
)0
500
1000
1500
2000
2500
050
010
0015
0020
0025
00

Range Ecology Lab CESU Task Agreement # P11AC91045
18
1987 1988 1989 1990 1991 1992 1993 1994 1995 2008 2009 2011 2012 2013 2014
33 C Rogers
Res
idua
l Dry
Mat
ter (
lbs/
acre
)0
1000
2000
3000
4000
5000
010
0020
0030
0040
0050
00
1987 1988 1989 1990 1991 1992 1993 1994 1995 2008 2009 2011 2012 2013 2014
34 Cheda
Res
idua
l Dry
Mat
ter (
lbs/
acre
)0
500
1000
1500
2000
050
010
0015
0020
00

Range Ecology Lab CESU Task Agreement # P11AC91045
19
1987 1988 1989 1990 1991 1992 1993 1994 1995 1996 2008 2009 2011 2012 2013 2014
35 Stewart
Res
idua
l Dry
Mat
ter (
lbs/
acre
)0
1000
2000
3000
4000
5000
6000
010
0020
0030
0040
0050
0060
00
1987 1988 1989 1990 1991 1992 1993 1994 1995 1996 2002 2008 2009 2012 2013 2014
36 Tacherra
Res
idua
l Dry
Mat
ter (
lbs/
acre
)0
1000
2000
3000
4000
5000
6000
010
0020
0030
0040
0050
0060
00

Range Ecology Lab CESU Task Agreement # P11AC91045
20
1987 1988 1989 1990 1991 1992 1993 1994 1995 1996 2002 2008 2009 2011 2012 2013 2014
37 Zanardi
Res
idua
l Dry
Mat
ter (
lbs/
acre
)0
500
1000
1500
2000
2500
3000
050
010
0015
0020
0025
0030
00
1987 1988 1989 1990 1991 1992 1993 1994 1995 1996 2001 2008 2009 2011 2012 2013 2014
38 Commonweal
Res
idua
l Dry
Mat
ter (
lbs/
acre
)0
1000
2000
3000
4000
5000
6000
7000
010
0020
0030
0040
0050
0060
0070
00
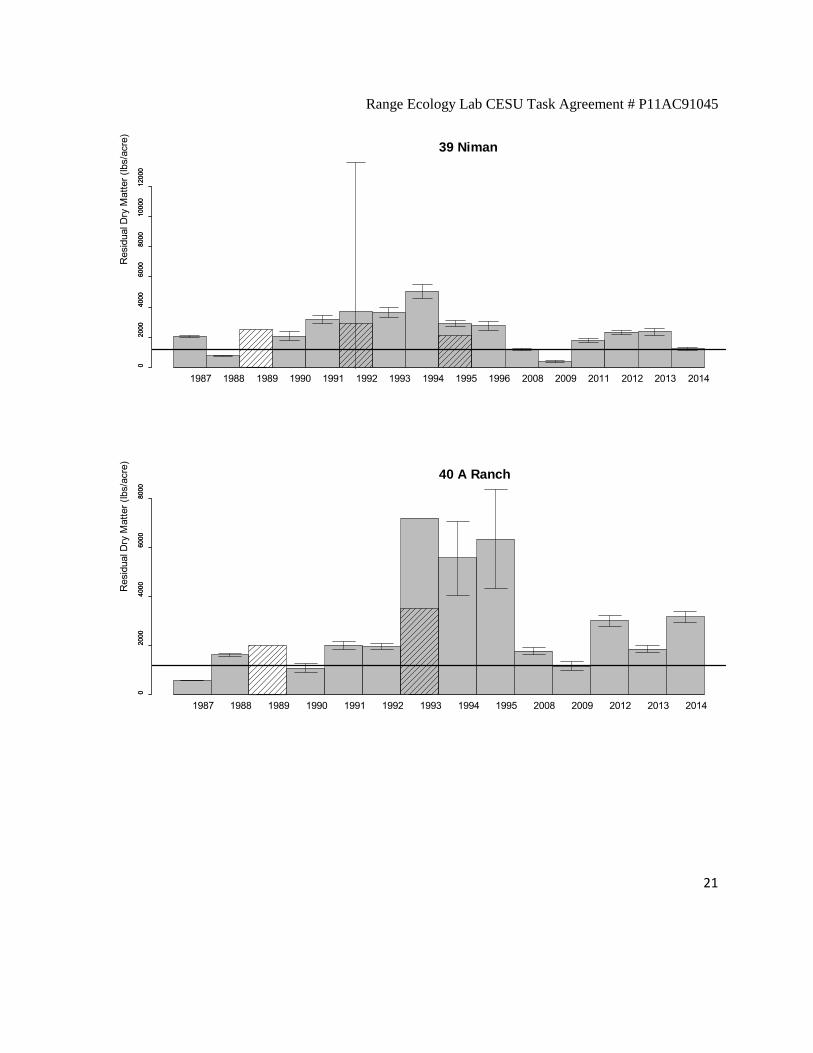
Range Ecology Lab CESU Task Agreement # P11AC91045
21
1987 1988 1989 1990 1991 1992 1993 1994 1995 1996 2008 2009 2011 2012 2013 2014
39 Niman
Res
idua
l Dry
Mat
ter (
lbs/
acre
)0
2000
4000
6000
8000
1000
012
000
020
0040
0060
0080
0010
000
1200
0
1987 1988 1989 1990 1991 1992 1993 1994 1995 2008 2009 2012 2013 2014
40 A Ranch
Res
idua
l Dry
Mat
ter (
lbs/
acre
)0
2000
4000
6000
8000
020
0040
0060
0080
00

Range Ecology Lab CESU Task Agreement # P11AC91045
22
1987 1988 1989 1990 1991 1992 1993 1994 1995 2001 2008 2009 2012 2013 2014
41 E Ranch
Res
idua
l Dry
Mat
ter (
lbs/
acre
)0
1000
2000
3000
4000
5000
010
0020
0030
0040
0050
00
1987 1988 1989 1990 1991 1992 1994 1995 2001 2008 2009 2012 2013 2014
42 B Ranch
Res
idua
l Dry
Mat
ter (
lbs/
acre
)0
1000
2000
3000
4000
010
0020
0030
0040
00

Range Ecology Lab CESU Task Agreement # P11AC91045
23
1987 1988 1989 1990 1991 1992 1993 1994 1995 2002 2008 2009 2012 2013 2014
43 D Ranch Nunes
Res
idua
l Dry
Mat
ter (
lbs/
acre
)0
1000
2000
3000
4000
5000
6000
010
0020
0030
0040
0050
0060
00
1987 1988 1989 1990 1991 1992 1993 1994 1995 2001 2008 2009 2012 2013 2014
44 M Ranch
Res
idua
l Dry
Mat
ter (
lbs/
acre
)0
1000
2000
3000
4000
5000
6000
010
0020
0030
0040
0050
0060
00

Range Ecology Lab CESU Task Agreement # P11AC91045
24
1987 1989 1990 1991 1992 1993 1994 1995 1996 2002 2008 2009 2011 2012 2013 2014
45 I Ranch
Res
idua
l Dry
Mat
ter (
lbs/
acre
)0
2000
4000
6000
8000
020
0040
0060
0080
00
1987 1988 1989 1990 1991 1992 1993 1994 1995 2001 2008 2009 2012 2013 2014
46 H Ranch
Res
idua
l Dry
Mat
ter (
lbs/
acre
)0
1000
2000
3000
4000
010
0020
0030
0040
00

Range Ecology Lab CESU Task Agreement # P11AC91045
25
1987 1988 1989 1990 1991 1992 1993 1994 1995 2008 2009 2012 2013 2014
47 J Ranch West
Res
idua
l Dry
Mat
ter (
lbs/
acre
)0
500
1000
1500
050
010
0015
00
1987 1988 1989 1990 1991 1992 1993 1994 1995 2002 2008 2009 2012 2013 2014
48 D Rogers
Res
idua
l Dry
Mat
ter (
lbs/
acre
)0
1000
2000
3000
4000
5000
010
0020
0030
0040
0050
00

Range Ecology Lab CESU Task Agreement # P11AC91045
26
1987 1989 1990 1991 1992 1993 1994 1995 2002 2008 2009 2012 2013 2014
49 L Ranch
Res
idua
l Dry
Mat
ter (
lbs/
acre
)0
1000
2000
3000
4000
5000
6000
010
0020
0030
0040
0050
0060
00
1989 1990 1991 1992 1994 1995 1996 2002 2008 2009 2011 2012 2013 2014
50 Genazzi
Res
idua
l Dry
Mat
ter (
lbs/
acre
)0
2000
4000
6000
8000
1000
012
000
020
0040
0060
0080
0010
000
1200
0

Range Ecology Lab CESU Task Agreement # P11AC91045
27
1989 1990 1991 1992 1993 1994 1995 1996 2008 2009 2011 2012 2013 2014
51 McFadden
Res
idua
l Dry
Mat
ter (
lbs/
acre
)0
1000
2000
3000
4000
5000
010
0020
0030
0040
0050
00

Range Ecology Lab CESU Task Agreement # P11AC91045
28
Figure A.3 PORE maps with ranch boundaries and transect locations

Range Ecology Lab CESU Task Agreement # P11AC91045
29

Range Ecology Lab CESU Task Agreement # P11AC91045
30

Range Ecology Lab CESU Task Agreement # P11AC91045
31
Appendix B. Checklists for RDM clipping and mapping
B1. Checklist of upplies to bring for RDM monitoring
- topo maps and any other information necessary for locating base stakes, photo points, etc.
- RDM sampling hoop
- RDM calculation: clipped sample weight (grams) X 100 = RDM lbs/acre
- vegetation clippers/shears
- one 100g scale; one 300 g scale
- bucket (to weigh samples in the wind)
- paper (not plastic!) bags for clipped biomass
- compass
- clipboards
- RDM data sheets
- field notebook
- field pens and pencils
- Sharpie marker for bag labels
- first aid kit
- camera with spare batteries
- info sheet with azimuth and field of view for each permanent photo point
- GPS device loaded with any necessary coordinates and with spare batteries
- binoculars

Range Ecology Lab CESU Task Agreement # P11AC91045
32
B.2 RDM clipping instructions
These clipping instructions are adapted from the UC RDM guidelines’ instructions for clipping RDM samples (Bartolome et al. 2006):
1. Place the hoop on the ground surface. Hoop circular diameter is 13.25 feet. Calculation formula: clipped weight (grams) X 100 = RDM lbs/acre
2. Remove from the area within the hoop all tree leaves and summer annuals such as tarweed, yellow starthistle, and turkey mullein. The PORE Range Monitoring Handbook (Shook 1990) also excludes any material from shrubs, vines, ferns, rushes, sticks, manure, hay, and unpalatable plants such as iris, blackberry, thistles, poison hemlock, cocklebur, Eryngium. To maintain consistency with previous RDM clipping results at PORE, we recommend that these plants continue to be excluded from the collected plant material.
3. Clip the remaining plant material within the hoop as close to the ground as you can without disturbing the soil surface.
4. Collect as much of the clipped plant material as is practical without inadvertently including bits of soil.
5. Air-dry the plant material for 24 hours.
6. Weigh the plant material with scale in grams.
B.3 RDM mapping instructions
Within the last decade, the RDM mapping technique has been developed and implemented in California, an innovation that allows for a clearer picture of the spatial distribution of RDM (Wildland Solutions 2008; Harris et al. 2002). RDM mapping is easy to learn and often requires less time to complete than the traditional permanent plot-based method, while still producing robust information. Sites with too little or too much RDM can be quickly identified, and solutions based on manipulating animal distribution may also be more easily developed. Time-series of annual RDM maps can be assessed for areas requiring management attention.
RDM mapping requires developing RDM classes (e.g., 0-1,200 lbs/acre, 1,200-2,000 lbs/acre, >2,000 lbs/acre) based on the manager’s goals, and then mapping RDM classes based

Range Ecology Lab CESU Task Agreement # P11AC91045
33
on visual estimation of fairly large areas (up to several hectares), with either a paper map or Global Positioning System (GPS) device in-hand. Visual estimations are calibrated during the mapping process by clipping and weighing RDM from small, representative plots (e.g., RDM 13.25 foot diameter hoop or 25cm x 25cm quadrat). Photographs are taken of large areas of representative RDM classes and of the plots prior to clipping.
B.4 Photo point instructions
Permanent photo points retaken every year can be an inexpensive but broadly effective method of monitoring for large changes in vegetation, such as increases in invasive plant cover or coyote brush encroachment into coastal prairie. They can also serve as useful indexes of annual herbaceous production and of residual dry matter (RDM).
A permanent photo point should be established with location recorded by a GPS device and, if desired, a witness post. An azimuth should be selected and thereafter fixed for that photo point. The field of view should also be defined for the photo point and always used thereafter for that photo point.
B.5 References
Bartolome, J.W., W.E. Frost, N.K. McDougald, and J.M. Connor. 2006. California guidelines for Residual Dry Matter (RDM) management on coastal and foothill annual rangelands. University of California Division of Agricultural Natural Resources Rangeland Management Series Publication 8092 (Revised). 8p. Available online at: http://anrcatalog.ucdavis.edu/Details.aspx?itemNo=8092
Harris, N.R., W.E. Frost, N.K. McDougald, M.R. George, and D.L. Nielsen. 2002. Long-term residual dry matter mapping for monitoring California hardwood rangelands. Pages 87-96 in: Standiford, Richard B., et al., tech. editor. Proceedings of the fifth symposium on oak woodlands: oaks in California's challenging landscape. Gen. Tech. Rep. PSW-GTR-184. Albany, CA: USDA Pacific Southwest Research Station. Available at: http://www.treesearch.fs.fed.us/pubs/26112.