attachment 4 2016 smarter state summary school performance and participation · 2016-08-26 ·...
TRANSCRIPT

Office of Assessment
Attachment 4 – 2016 Smarter State Summary
School Performance and Participation

Office of Assessment
Page | 1
Table of Contents
Smarter School Performance & Participation ............................................................. 1
Smarter Special Schools Performance & Participation ............................................... 48

Attachment 4 – 2016 Smarter State Summary – School Performance & Participation Office of Assessment
Page | 1
Appoquinimink School District Performance and Participation By School and By Grade
Smarter Balanced ELA
School Statewide
School Name Grade
Mean Scale Score
Percent Proficiency
Participation Rate
Mean Scale Score
Percent Proficient
Participation Rate
Brick Mill Elementary School
3 2461 66 > 99 2440 54 99
4 2510 69 96 2483 56 99
5 2574 84 > 99 2519 60 99
Bunker Hill Elementary School
3 2449 61 > 99 2440 54 99
4 2492 61 > 99 2483 56 99
5 2526 61 > 99 2519 60 99
Cedar Lane Elementary School
3 2466 66 97 2440 54 99
4 2511 68 99 2483 56 99
5 2537 70 97 2519 60 99
Loss (Olive B.) Elementary School
3 2503 88 99 2440 54 99
4 2549 86 98 2483 56 99
5 2590 91 98 2519 60 99
Meredith (Everett) Middle School
6 2542 60 97 2531 52 98
7 2581 63 97 2553 53 98
8 2565 49 94 2571 54 97
Old State Elementary School
3 2469 70 99 2440 54 99
4 2510 72 > 99 2483 56 99
5 2542 72 98 2519 60 99
Redding (Louis L.) Middle School
6 2554 64 98 2531 52 98
7 2574 63 97 2553 53 98
8 2582 62 98 2571 54 97
Silver Lake Elementary School
3 2460 57 99 2440 54 99
4 2499 63 > 99 2483 56 99
5 2538 64 > 99 2519 60 99

Attachment 4 – 2016 Smarter State Summary – School Performance & Participation Office of Assessment
Page | 2
Townsend Elementary School
3 2449 59 98 2440 54 99
4 2512 73 > 99 2483 56 99
5 2507 58 97 2519 60 99
Waters (Alfred G.) Middle School
6 2574 74 98 2531 52 98
7 2605 76 98 2553 53 98
8 2613 72 96 2571 54 97

Attachment 4 – 2016 Smarter State Summary – School Performance & Participation Office of Assessment
Page | 3
Appoquinimink School District Performance and Participation By School and By Grade
Smarter Balanced Mathematics
School Statewide
School Name Grade Mean
Scale Score Percent
Proficiency Participation
Rate Mean
Scale Score Percent
Proficient Participation
Rate
Brick Mill Elementary School 3 2458 69 > 99 2444 55 99
4 2508 64 96 2485 51 99
5 2554 65 > 99 2507 42 99
Bunker Hill Elementary School 3 2448 60 > 99 2444 55 99
4 2495 54 > 99 2485 51 99
5 2529 46 > 99 2507 42 99
Cedar Lane Elementary School 3 2478 73 98 2444 55 99
4 2529 73 97 2485 51 99
5 2530 53 97 2507 42 99
Loss (Olive B.) Elementary School 3 2497 84 99 2444 55 99
4 2549 85 98 2485 51 99
5 2561 70 98 2507 42 99
Meredith (Everett) Middle School 6 2524 40 93 2517 37 98
7 2548 40 96 2535 40 98
8 2542 34 91 2549 38 97
Old State Elementary School 3 2463 62 99 2444 55 99
4 2502 60 > 99 2485 51 99
5 2526 46 98 2507 42 99
Redding (Louis L.) Middle School 6 2534 44 97 2517 37 98
7 2533 41 97 2535 40 98
8 2581 52 98 2549 38 97
Silver Lake Elementary School 3 2466 74 99 2444 55 99
4 2492 56 > 99 2485 51 99
5 2522 46 98 2507 42 99
Townsend Elementary School 3 2448 57 97 2444 55 99
4 2522 72 > 99 2485 51 99
5 2496 37 97 2507 42 99
Waters (Alfred G.) Middle School 6 2588 72 98 2517 37 98
7 2597 66 98 2535 40 98
8 2625 65 96 2549 38 97

Attachment 4 – 2016 Smarter State Summary – School Performance & Participation Office of Assessment
Page | 4
Brandywine School District Performance and Participation By School and By Grade
Smarter Balanced ELA
School Statewide
School Name Grade Mean
Scale Score Percent
Proficiency Participation
Rate Mean
Scale Score Percent
Proficient Participation
Rate
Carrcroft Elementary School 3 2402 40 97 2440 54 99
4 2455 45 99 2483 56 99
5 2533 68 > 99 2519 60 99
Claymont Elementary School 3 2405 39 96 2440 54 99
4 2519 67 99 2483 56 99
5 2556 69 99 2519 60 99
duPont (Pierre S.) Middle School 6 2565 64 98 2531 52 98
7 2572 58 97 2553 53 98
8 2583 51 93 2571 54 97
Forwood Elementary School 3 2439 47 94 2440 54 99
4 2476 49 99 2483 56 99
5 2522 67 98 2519 60 99
Hanby Elementary School 3 2435 51 > 99 2440 54 99
4 2466 55 > 99 2483 56 99
5 2535 65 > 99 2519 60 99
Harlan (David W. ) Elementary School
3 2428 54 98 2440 54 99
4 2441 38 98 2483 56 99
5 2482 42 > 99 2519 60 99
Lancashire Elementary School 3 2465 71 98 2440 54 99
4 2499 65 > 99 2483 56 99
5 2543 73 99 2519 60 99
Lombardy Elementary School 3 2450 66 > 99 2440 54 99
4 2489 63 > 99 2483 56 99
5 2536 69 > 99 2519 60 99
Maple Lane Elementary School 3 2431 56 98 2440 54 99
4 2453 41 > 99 2483 56 99
5 2504 53 99 2519 60 99
Mount Pleasant Elementary School 3 2463 60 > 99 2440 54 99
4 2431 28 99 2483 56 99
5 2488 46 > 99 2519 60 99
Attachment 4 – 2016 Smarter State Summary – School Performance & Participation Office of Assessment
Page | 5
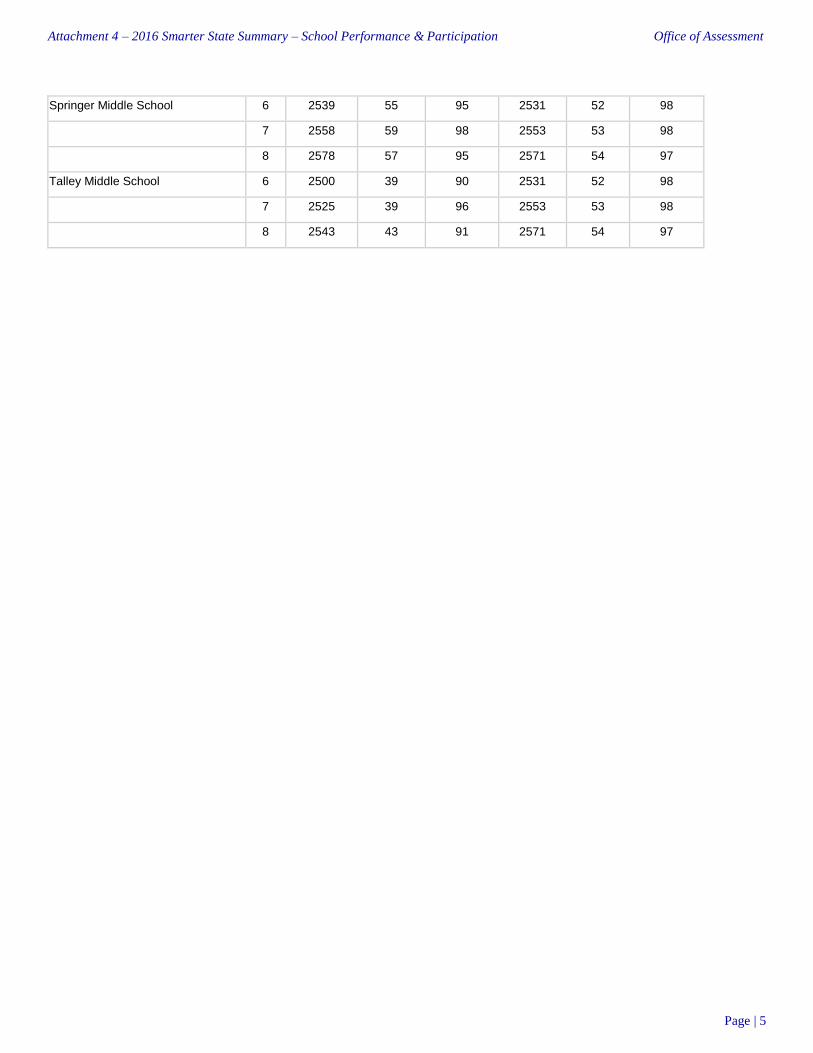
Springer Middle School 6 2539 55 95 2531 52 98
7 2558 59 98 2553 53 98
8 2578 57 95 2571 54 97
Talley Middle School 6 2500 39 90 2531 52 98
7 2525 39 96 2553 53 98
8 2543 43 91 2571 54 97

Attachment 4 – 2016 Smarter State Summary – School Performance & Participation Office of Assessment
Page | 6
Brandywine School District Performance and Participation By School and By Grade
Smarter Balanced Mathematics
School Statewide
School Name Grade Mean
Scale Score Percent
Proficiency Participation
Rate Mean
Scale Score Percent
Proficient Participation
Rate
Carrcroft Elementary School 3 2405 40 97 2444 55 99
4 2465 38 99 2485 51 99
5 2522 55 99 2507 42 99
Claymont Elementary School 3 2411 36 96 2444 55 99
4 2526 66 98 2485 51 99
5 2565 66 98 2507 42 99
duPont (Pierre S.) Middle School 6 2549 48 97 2517 37 98
7 2557 48 97 2535 40 98
8 2552 39 98 2549 38 97
Forwood Elementary School 3 2456 66 94 2444 55 99
4 2482 42 > 99 2485 51 99
5 2521 48 98 2507 42 99
Hanby Elementary School 3 2442 60 97 2444 55 99
4 2474 50 99 2485 51 99
5 2526 48 > 99 2507 42 99
Harlan (David W. ) Elementary School
3 2427 46 96 2444 55 99
4 2456 36 96 2485 51 99
5 2467 22 > 99 2507 42 99
Lancashire Elementary School 3 2475 76 98 2444 55 99
4 2498 65 > 99 2485 51 99
5 2532 59 99 2507 42 99
Lombardy Elementary School 3 2449 59 > 99 2444 55 99
4 2501 63 > 99 2485 51 99
5 2518 50 > 99 2507 42 99
Maple Lane Elementary School 3 2460 63 98 2444 55 99
4 2459 37 > 99 2485 51 99
5 2497 28 99 2507 42 99
Mount Pleasant Elementary School 3 2455 58 > 99 2444 55 99
4 2436 24 99 2485 51 99
5 2472 23 > 99 2507 42 99

Attachment 4 – 2016 Smarter State Summary – School Performance & Participation Office of Assessment
Page | 7
Springer Middle School 6 2518 40 97 2517 37 98
7 2541 49 98 2535 40 98
8 2566 48 96 2549 38 97
Talley Middle School 6 2486 18 94 2517 37 98
7 2517 29 95 2535 40 98
8 2527 23 93 2549 38 97

Attachment 4 – 2016 Smarter State Summary – School Performance & Participation Office of Assessment
Page | 8
Caesar Rodney School District Performance and Participation By School and By Grade
Smarter Balanced ELA
School Statewide
School Name Grade Mean
Scale Score Percent
Proficiency Participation
Rate Mean
Scale Score Percent
Proficient Participation
Rate
Allen Frear Elementary School 3 2461 64 > 99 2440 54 99
4 2518 73 > 99 2483 56 99
5 2557 76 > 99 2519 60 99
Dover Air Force Base Middle School 6 2595 86 > 99 2531 52 98
7 2627 89 > 99 2553 53 98
8 2641 90 > 99 2571 54 97
F. Niel Postlethwait Middle School 6 2554 63 > 99 2531 52 98
7 2581 64 99 2553 53 98
8 2608 71 > 99 2571 54 97
Fred Fifer III Middle School 6 2557 65 97 2531 52 98
7 2553 52 96 2553 53 98
8 2591 65 95 2571 54 97
Major George S. Welch Elementary School
3 2484 75 > 99 2440 54 99
4 2532 83 > 99 2483 56 99
5 2556 84 99 2519 60 99
Nellie Hughes Stokes Elementary School
3 2467 69 99 2440 54 99
4 2477 55 99 2483 56 99
5 2553 74 99 2519 60 99
Star Hill Elementary School 3 2473 77 99 2440 54 99
4 2541 82 99 2483 56 99
5 2561 80 > 99 2519 60 99
W. B. Simpson Elementary School 3 2465 68 > 99 2440 54 99
4 2523 78 99 2483 56 99
5 2566 82 > 99 2519 60 99
W. Reily Brown Elementary School 3 2428 46 99 2440 54 99
4 2495 68 99 2483 56 99
5 2514 63 98 2519 60 99

Attachment 4 – 2016 Smarter State Summary – School Performance & Participation Office of Assessment
Page | 9
Caesar Rodney School District Performance and Participation By School and By Grade
Smarter Balanced Mathematics
School Statewide
School Name Grade Mean
Scale Score Percent
Proficiency Participation
Rate Mean
Scale Score Percent
Proficient Participation
Rate
Allen Frear Elementary School 3 2463 65 > 99 2444 55 99
4 2518 68 > 99 2485 51 99
5 2562 65 > 99 2507 42 99
Dover Air Force Base Middle School 6 2596 69 > 99 2517 37 98
7 2622 79 > 99 2535 40 98
8 2631 72 > 99 2549 38 97
F. Niel Postlethwait Middle School 6 2545 45 > 99 2517 37 98
7 2562 52 99 2535 40 98
8 2583 50 > 99 2549 38 97
Fred Fifer III Middle School 6 2533 42 98 2517 37 98
7 2542 41 99 2535 40 98
8 2549 37 97 2549 38 97
Major George S. Welch Elementary School
3 2497 80 > 99 2444 55 99
4 2516 76 > 99 2485 51 99
5 2534 50 99 2507 42 99
Nellie Hughes Stokes Elementary School
3 2483 79 99 2444 55 99
4 2495 52 98 2485 51 99
5 2567 82 99 2507 42 99
Star Hill Elementary School 3 2482 82 99 2444 55 99
4 2543 81 > 99 2485 51 99
5 2549 65 > 99 2507 42 99
W. B. Simpson Elementary School 3 2459 66 > 99 2444 55 99
4 2507 63 99 2485 51 99
5 2540 63 > 99 2507 42 99
W. Reily Brown Elementary School 3 2424 48 99 2444 55 99
4 2492 62 99 2485 51 99
5 2496 36 98 2507 42 99

Attachment 4 – 2016 Smarter State Summary – School Performance & Participation Office of Assessment
Page | 10
Cape Henlopen School District Performance and Participation By School and By Grade
Smarter Balanced ELA
School Statewide
School Name Grade Mean
Scale Score Percent
Proficiency Participation
Rate Mean
Scale Score Percent
Proficient Participation
Rate
Beacon Middle School 6 2561 68 97 2531 52 98
7 2600 74 98 2553 53 98
8 2629 78 98 2571 54 97
H. O. Brittingham Elementary School
3 2403 37 > 99 2440 54 99
4 2459 39 99 2483 56 99
5 2497 47 > 99 2519 60 99
Mariner Middle School 6 2541 56 98 2531 52 98
7 2574 63 > 99 2553 53 98
8 2603 70 96 2571 54 97
Milton Elementary School 3 2440 49 > 99 2440 54 99
4 2496 60 > 99 2483 56 99
5 2553 77 > 99 2519 60 99
Rehoboth Elementary School 3 2477 77 > 99 2440 54 99
4 2538 77 > 99 2483 56 99
5 2557 84 98 2519 60 99
Shields (Richard A.) Elementary School
3 2496 80 97 2440 54 99
4 2528 73 96 2483 56 99
5 2584 83 98 2519 60 99

Attachment 4 – 2016 Smarter State Summary – School Performance & Participation Office of Assessment
Page | 11
Cape Henlopen School District Performance and Participation By School and By Grade
Smarter Balanced Mathematics
School Statewide
School Name Grade Mean
Scale Score Percent
Proficiency Participation
Rate Mean
Scale Score Percent
Proficient Participation
Rate
Beacon Middle School 6 2552 50 97 2517 37 98
7 2617 74 97 2535 40 98
8 2648 70 98 2549 38 97
H. O. Brittingham Elementary School
3 2412 32 > 99 2444 55 99
4 2485 51 99 2485 51 99
5 2497 38 > 99 2507 42 99
Mariner Middle School 6 2528 36 98 2517 37 98
7 2561 52 > 99 2535 40 98
8 2576 46 97 2549 38 97
Milton Elementary School 3 2448 60 99 2444 55 99
4 2509 64 > 99 2485 51 99
5 2539 58 > 99 2507 42 99
Rehoboth Elementary School 3 2453 60 > 99 2444 55 99
4 2526 75 > 99 2485 51 99
5 2545 61 98 2507 42 99
Shields (Richard A.) Elementary School
3 2496 81 97 2444 55 99
4 2524 76 97 2485 51 99
5 2573 73 98 2507 42 99

Attachment 4 – 2016 Smarter State Summary – School Performance & Participation Office of Assessment
Page | 12
Capital School District Performance and Participation By School and By Grade
Smarter Balanced ELA
School Statewide
School Name Grade Mean
Scale Score Percent
Proficiency Participation
Rate Mean
Scale Score Percent
Proficient Participation
Rate
Booker T. Washington Elementary School
3 2494 81 > 99 2440 54 99
4 2519 67 97 2483 56 99
Central Middle School 7 2530 38 97 2553 53 98
8 2557 48 95 2571 54 97
East Dover Elementary School 3 2414 40 97 2440 54 99
4 2436 31 97 2483 56 99
Fairview Elementary School 3 2440 53 > 99 2440 54 99
4 2477 58 96 2483 56 99
Hartly Elementary School 3 2486 76 99 2440 54 99
4 2523 79 > 99 2483 56 99
North Dover Elementary School 3 2471 71 99 2440 54 99
4 2505 72 > 99 2483 56 99
South Dover Elementary School 3 2413 37 99 2440 54 99
4 2467 48 99 2483 56 99
Towne Point Elementary School 3 2428 47 > 99 2440 54 99
4 2488 62 > 99 2483 56 99
William Henry Middle School 5 2506 52 97 2519 60 99
6 2521 46 96 2531 52 98

Attachment 4 – 2016 Smarter State Summary – School Performance & Participation Office of Assessment
Page | 13
Capital School District Performance and Participation By School and By Grade
Smarter Balanced Mathematics
School Statewide
School Name Grade Mean
Scale Score Percent
Proficiency Participation
Rate Mean
Scale Score Percent
Proficient Participation
Rate
Booker T. Washington Elementary School
3 2468 69 > 99 2444 55 99
4 2513 60 97 2485 51 99
Central Middle School 7 2500 22 96 2535 40 98
8 2525 28 95 2549 38 97
East Dover Elementary School 3 2428 42 97 2444 55 99
4 2447 30 97 2485 51 99
Fairview Elementary School 3 2444 53 > 99 2444 55 99
4 2481 44 96 2485 51 99
Hartly Elementary School 3 2462 76 99 2444 55 99
4 2508 68 > 99 2485 51 99
North Dover Elementary School 3 2464 65 99 2444 55 99
4 2501 57 99 2485 51 99
South Dover Elementary School 3 2393 33 98 2444 55 99
4 2466 37 99 2485 51 99
Towne Point Elementary School 3 2409 29 > 99 2444 55 99
4 2463 33 > 99 2485 51 99
William Henry Middle School 5 2485 29 97 2507 42 99
6 2516 36 97 2517 37 98

Attachment 4 – 2016 Smarter State Summary – School Performance & Participation Office of Assessment
Page | 14
Christina School District Performance and Participation By School and By Grade
Smarter Balanced ELA
School Statewide
School Name Grade Mean
Scale Score Percent
Proficiency Participation
Rate Mean
Scale Score Percent
Proficient Participation
Rate
Bancroft Elementary School 3 2353 10 98 2440 54 99
4 2410 24 > 99 2483 56 99
5 2432 24 98 2519 60 99
Bayard Middle School 6 2413 5 96 2531 52 98
7 2432 6 88 2553 53 98
8 2474 14 93 2571 54 97
Brader (Henry M.) Elementary School
3 2412 43 97 2440 54 99
4 2480 59 94 2483 56 99
5 2470 41 96 2519 60 99
Brookside Elementary School 3 2411 31 > 99 2440 54 99
4 2472 55 91 2483 56 99
5 2483 44 96 2519 60 99
Downes (John R.) Elementary School
3 2452 56 96 2440 54 99
4 2529 79 98 2483 56 99
5 2541 73 98 2519 60 99
Elbert-Palmer Elementary School 3 2358 17 > 99 2440 54 99
4 2369 5 98 2483 56 99
5 2417 16 97 2519 60 99
Gallaher (Robert S.) Elementary School
3 2436 53 99 2440 54 99
4 2505 65 98 2483 56 99
5 2554 78 > 99 2519 60 99
Gauger-Cobbs Middle School 6 2472 25 98 2531 52 98
7 2514 35 96 2553 53 98
8 2505 28 97 2571 54 97
Jones (Albert H.) Elementary School 3 2447 60 > 99 2440 54 99
4 2483 53 97 2483 56 99
5 2498 50 99 2519 60 99
Keene (William B.) Elementary School
3 2425 51 97 2440 54 99
4 2454 41 98 2483 56 99

Attachment 4 – 2016 Smarter State Summary – School Performance & Participation Office of Assessment
Page | 15
5 2501 51 99 2519 60 99
Kirk (George V.) Middle School 6 2493 33 98 2531 52 98
7 2519 39 97 2553 53 98
8 2518 29 97 2571 54 97
Leasure (May B.) Elementary School
3 2424 42 > 99 2440 54 99
4 2470 50 > 99 2483 56 99
5 2496 52 > 99 2519 60 99
Maclary (R. Elisabeth) Elementary School
3 2421 40 98 2440 54 99
4 2449 38 97 2483 56 99
5 2535 64 98 2519 60 99
Marshall (Thurgood) Elementary School
3 2462 69 > 99 2440 54 99
4 2499 65 96 2483 56 99
5 2527 61 > 99 2519 60 99
McVey (Joseph M.) Elementary School
3 2422 40 98 2440 54 99
4 2462 42 > 99 2483 56 99
5 2481 42 99 2519 60 99
Oberle (William) Elementary School 3 2405 35 97 2440 54 99
4 2380 11 > 99 2483 56 99
5 2451 31 > 99 2519 60 99
Pulaski (Casimir) Elementary School 3 2369 15 99 2440 54 99
4 2411 25 97 2483 56 99
5 2464 33 99 2519 60 99
Shue-Medill Middle School 6 2489 36 99 2531 52 98
7 2517 36 98 2553 53 98
8 2530 36 > 99 2571 54 97
Smith (Jennie E.) Elementary School
3 2453 59 > 99 2440 54 99
4 2483 58 > 99 2483 56 99
5 2510 57 95 2519 60 99
Stubbs (Frederick Douglass) Elementary School
3 2354 14 93 2440 54 99
4 2395 20 98 2483 56 99
5 2415 14 98 2519 60 99
West Park Place Elementary School 3 2470 64 > 99 2440 54 99
4 2510 66 > 99 2483 56 99

Attachment 4 – 2016 Smarter State Summary – School Performance & Participation Office of Assessment
Page | 16
5 2559 83 98 2519 60 99
Wilson (Etta J.) Elementary School 3 2454 57 98 2440 54 99
4 2487 64 99 2483 56 99
5 2507 52 97 2519 60 99

Attachment 4 – 2016 Smarter State Summary – School Performance & Participation Office of Assessment
Page | 17
Christina School District Performance and Participation By School and By Grade
Smarter Balanced Mathematics
School Statewide
School Name Grade Mean
Scale Score Percent
Proficiency Participation
Rate Mean
Scale Score Percent
Proficient Participation
Rate
Bancroft Elementary School 3 2361 14 96 2444 55 99
4 2402 10 > 99 2485 51 99
5 2406 6 98 2507 42 99
Bayard Middle School 6 2407 3 94 2517 37 98
7 2381 2 89 2535 40 98
8 2439 5 91 2549 38 97
Brader (Henry M.) Elementary School
3 2408 39 97 2444 55 99
4 2486 48 94 2485 51 99
5 2460 29 95 2507 42 99
Brookside Elementary School 3 2440 46 > 99 2444 55 99
4 2466 39 88 2485 51 99
5 2473 13 94 2507 42 99
Downes (John R.) Elementary School
3 2462 62 95 2444 55 99
4 2529 69 98 2485 51 99
5 2518 49 98 2507 42 99
Elbert-Palmer Elementary School 3 2367 11 > 99 2444 55 99
4 2401 12 98 2485 51 99
5 2426 3 95 2507 42 99
Gallaher (Robert S.) Elementary School
3 2449 65 98 2444 55 99
4 2492 53 98 2485 51 99
5 2543 56 98 2507 42 99
Gauger-Cobbs Middle School 6 2459 16 98 2517 37 98
7 2499 20 96 2535 40 98
8 2488 17 97 2549 38 97
Jones (Albert H.) Elementary School 3 2472 73 > 99 2444 55 99
4 2482 47 97 2485 51 99
5 2477 22 99 2507 42 99
Keene (William B.) Elementary School
3 2437 54 96 2444 55 99
4 2457 32 98 2485 51 99

Attachment 4 – 2016 Smarter State Summary – School Performance & Participation Office of Assessment
Page | 18
5 2497 38 99 2507 42 99
Kirk (George V.) Middle School 6 2490 22 97 2517 37 98
7 2518 30 97 2535 40 98
8 2522 27 97 2549 38 97
Leasure (May B.) Elementary School
3 2443 59 > 99 2444 55 99
4 2459 37 > 99 2485 51 99
5 2464 22 > 99 2507 42 99
Maclary (R. Elisabeth) Elementary School
3 2427 43 98 2444 55 99
4 2456 33 97 2485 51 99
5 2535 48 98 2507 42 99
Marshall (Thurgood) Elementary School
3 2469 63 > 99 2444 55 99
4 2509 61 96 2485 51 99
5 2521 45 > 99 2507 42 99
McVey (Joseph M.) Elementary School
3 2433 48 98 2444 55 99
4 2478 51 > 99 2485 51 99
5 2467 18 99 2507 42 99
Oberle (William) Elementary School 3 2411 35 97 2444 55 99
4 2412 11 > 99 2485 51 99
5 2447 19 > 99 2507 42 99
Pulaski (Casimir) Elementary School 3 2379 21 99 2444 55 99
4 2424 21 96 2485 51 99
5 2453 15 99 2507 42 99
Shue-Medill Middle School 6 2485 24 99 2517 37 98
7 2512 31 97 2535 40 98
8 2520 23 > 99 2549 38 97
Smith (Jennie E.) Elementary School
3 2455 61 97 2444 55 99
4 2469 40 99 2485 51 99
5 2489 29 94 2507 42 99
Stubbs (Frederick Douglass) Elementary School
3 2358 13 95 2444 55 99
4 2420 11 98 2485 51 99
5 2410 4 96 2507 42 99
West Park Place Elementary School 3 2495 72 > 99 2444 55 99
4 2513 61 > 99 2485 51 99

Attachment 4 – 2016 Smarter State Summary – School Performance & Participation Office of Assessment
Page | 19
5 2558 64 98 2507 42 99
Wilson (Etta J.) Elementary School 3 2461 65 98 2444 55 99
4 2489 47 99 2485 51 99
5 2507 44 97 2507 42 99

Attachment 4 – 2016 Smarter State Summary – School Performance & Participation Office of Assessment
Page | 20
Colonial School District Performance and Participation By School and By Grade
Smarter Balanced ELA
School Statewide
School Name Grade Mean
Scale Score Percent
Proficiency Participation
Rate Mean
Scale Score Percent
Proficient Participation
Rate
Bedford (Gunning) Middle School 6 2532 52 98 2531 52 98
7 2534 41 97 2553 53 98
8 2574 58 > 99 2571 54 97
Castle Hills Elementary School 3 2418 40 97 2440 54 99
4 2449 34 99 2483 56 99
5 2515 58 97 2519 60 99
Downie (Carrie) Elementary School 3 2385 25 > 99 2440 54 99
4 2469 49 99 2483 56 99
5 2489 48 > 99 2519 60 99
Eisenberg (Harry O.) Elementary School
3 2403 29 > 99 2440 54 99
4 2453 43 99 2483 56 99
5 2476 39 97 2519 60 99
McCullough (Calvin R. ) Middle School
6 2517 44 97 2531 52 98
7 2532 44 98 2553 53 98
8 2537 39 94 2571 54 97
New Castle Elementary School 3 2420 41 99 2440 54 99
4 2485 55 > 99 2483 56 99
5 2512 60 > 99 2519 60 99
Pleasantville Elementary School 3 2423 41 > 99 2440 54 99
4 2468 50 98 2483 56 99
5 2507 58 > 99 2519 60 99
Read (George) Middle School 6 2531 54 99 2531 52 98
7 2534 43 98 2553 53 98
8 2560 51 98 2571 54 97
Southern Elementary School 3 2424 47 99 2440 54 99
4 2454 43 > 99 2483 56 99
5 2497 52 97 2519 60 99
Wilbur (Kathleen H.) Elementary 3 2431 52 > 99 2440 54 99
4 2497 65 > 99 2483 56 99
5 2542 74 > 99 2519 60 99

Attachment 4 – 2016 Smarter State Summary – School Performance & Participation Office of Assessment
Page | 21
Wilmington Manor Elementary School
3 2439 53 98 2440 54 99
4 2464 48 98 2483 56 99
5 2509 53 > 99 2519 60 99

Attachment 4 – 2016 Smarter State Summary – School Performance & Participation Office of Assessment
Page | 22
Colonial School District Performance and Participation By School and By Grade
Smarter Balanced Mathematics
School Statewide
School Name Grade Mean
Scale Score Percent
Proficiency Participation
Rate Mean
Scale Score Percent
Proficient Participation
Rate
Bedford (Gunning) Middle School 6 2501 29 98 2517 37 98
7 2520 31 97 2535 40 98
8 2546 38 > 99 2549 38 97
Castle Hills Elementary School 3 2422 46 98 2444 55 99
4 2458 36 99 2485 51 99
5 2492 34 98 2507 42 99
Downie (Carrie) Elementary School 3 2388 25 > 99 2444 55 99
4 2457 38 99 2485 51 99
5 2473 25 > 99 2507 42 99
Eisenberg (Harry O.) Elementary School
3 2386 27 > 99 2444 55 99
4 2453 32 99 2485 51 99
5 2472 27 96 2507 42 99
McCullough (Calvin R. ) Middle School
6 2472 15 96 2517 37 98
7 2485 19 98 2535 40 98
8 2486 14 94 2549 38 97
New Castle Elementary School 3 2433 49 98 2444 55 99
4 2464 40 > 99 2485 51 99
5 2503 41 > 99 2507 42 99
Pleasantville Elementary School 3 2415 39 > 99 2444 55 99
4 2458 38 98 2485 51 99
5 2481 29 > 99 2507 42 99
Read (George) Middle School 6 2481 25 > 99 2517 37 98
7 2497 23 98 2535 40 98
8 2510 20 99 2549 38 97
Southern Elementary School 3 2428 52 99 2444 55 99
4 2473 49 > 99 2485 51 99
5 2480 28 97 2507 42 99
Wilbur (Kathleen H.) Elementary 3 2426 43 > 99 2444 55 99
4 2484 49 > 99 2485 51 99
5 2501 38 > 99 2507 42 99

Attachment 4 – 2016 Smarter State Summary – School Performance & Participation Office of Assessment
Page | 23
Wilmington Manor Elementary School
3 2441 51 98 2444 55 99
4 2466 39 99 2485 51 99
5 2492 37 > 99 2507 42 99

Attachment 4 – 2016 Smarter State Summary – School Performance & Participation Office of Assessment
Page | 24
Delmar School District Performance and Participation By School and By Grade
Smarter Balanced ELA
School Statewide
School Name Grade Mean
Scale Score Percent
Proficiency Participation
Rate Mean
Scale Score Percent
Proficient Participation
Rate
Delmar Middle School 5 2513 59 99 2519 60 99
6 2512 42 > 99 2531 52 98
7 2560 59 98 2553 53 98
8 2589 60 > 99 2571 54 97

Attachment 4 – 2016 Smarter State Summary – School Performance & Participation Office of Assessment
Page | 25
Delmar School District Performance and Participation By School and By Grade
Smarter Balanced Mathematics
School Statewide
School Name Grade Mean
Scale Score Percent
Proficiency Participation
Rate Mean
Scale Score Percent
Proficient Participation
Rate
Delmar Middle School 5 2513 43 99 2507 42 99
6 2507 29 > 99 2517 37 98
7 2540 44 98 2535 40 98
8 2600 56 > 99 2549 38 97

Attachment 4 – 2016 Smarter State Summary – School Performance & Participation Office of Assessment
Page | 26
Indian River School District Performance and Participation By School and By Grade
Smarter Balanced ELA
School Statewide
School Name Grade Mean
Scale Score Percent
Proficiency Participation
Rate Mean
Scale Score Percent
Proficient Participation
Rate
Clayton (John M.) Elementary School
3 2443 54 > 99 2440 54 99
4 2492 61 > 99 2483 56 99
5 2523 71 > 99 2519 60 99
East Millsboro Elementary School 3 2454 66 > 99 2440 54 99
4 2525 75 > 99 2483 56 99
5 2559 81 > 99 2519 60 99
Georgetown Elementary School 3 2437 53 > 99 2440 54 99
4 2465 50 > 99 2483 56 99
5 2508 56 > 99 2519 60 99
Georgetown Middle School 6 2530 52 > 99 2531 52 98
7 2557 56 > 99 2553 53 98
8 2580 59 > 99 2571 54 97
Long Neck Elementary School 3 2458 63 > 99 2440 54 99
4 2481 55 > 99 2483 56 99
5 2537 69 > 99 2519 60 99
Lord Baltimore Elementary School 3 2492 76 > 99 2440 54 99
4 2526 80 > 99 2483 56 99
5 2562 81 > 99 2519 60 99
Millsboro Middle School 6 2550 62 99 2531 52 98
7 2569 61 > 99 2553 53 98
8 2585 63 > 99 2571 54 97
North Georgetown Elementary School
3 2390 25 > 99 2440 54 99
4 2465 48 > 99 2483 56 99
5 2506 52 98 2519 60 99
Selbyville Middle School 6 2572 71 > 99 2531 52 98
7 2573 61 > 99 2553 53 98
8 2600 68 > 99 2571 54 97
Showell (Phillip C.) Elementary School
3 2437 47 > 99 2440 54 99
4 2469 47 > 99 2483 56 99

Attachment 4 – 2016 Smarter State Summary – School Performance & Participation Office of Assessment
Page | 27
5 2529 67 > 99 2519 60 99
Southern Delaware School of the Arts
3 2501 87 98 2440 54 99
4 2544 84 > 99 2483 56 99
5 2595 96 98 2519 60 99
6 2594 81 96 2531 52 98
7 2652 96 98 2553 53 98
8 2657 96 96 2571 54 97

Attachment 4 – 2016 Smarter State Summary – School Performance & Participation Office of Assessment
Page | 28
Indian River School District Performance and Participation By School and By Grade
Smarter Balanced Mathematics
School Statewide
School Name Grade Mean
Scale Score Percent
Proficiency Participation
Rate Mean
Scale Score Percent
Proficient Participation
Rate
Clayton (John M.) Elementary School
3 2475 75 > 99 2444 55 99
4 2510 63 > 99 2485 51 99
5 2521 46 99 2507 42 99
East Millsboro Elementary School 3 2457 71 > 99 2444 55 99
4 2517 66 > 99 2485 51 99
5 2543 65 > 99 2507 42 99
Georgetown Elementary School 3 2439 54 > 99 2444 55 99
4 2472 41 > 99 2485 51 99
5 2497 36 > 99 2507 42 99
Georgetown Middle School 6 2491 25 > 99 2517 37 98
7 2540 43 > 99 2535 40 98
8 2549 36 99 2549 38 97
Long Neck Elementary School 3 2450 59 > 99 2444 55 99
4 2490 51 > 99 2485 51 99
5 2529 54 > 99 2507 42 99
Lord Baltimore Elementary School 3 2497 82 > 99 2444 55 99
4 2527 77 > 99 2485 51 99
5 2545 64 > 99 2507 42 99
Millsboro Middle School 6 2534 46 99 2517 37 98
7 2535 34 > 99 2535 40 98
8 2557 40 99 2549 38 97
North Georgetown Elementary School
3 2419 38 99 2444 55 99
4 2474 44 > 99 2485 51 99
5 2507 37 98 2507 42 99
Selbyville Middle School 6 2551 52 99 2517 37 98
7 2559 48 > 99 2535 40 98
8 2555 41 > 99 2549 38 97
Showell (Phillip C.) Elementary School
3 2431 47 > 99 2444 55 99
4 2489 57 > 99 2485 51 99

Attachment 4 – 2016 Smarter State Summary – School Performance & Participation Office of Assessment
Page | 29
5 2552 68 > 99 2507 42 99
Southern Delaware School of the Arts
3 2494 80 98 2444 55 99
4 2538 82 > 99 2485 51 99
5 2583 85 98 2507 42 99
6 2574 68 96 2517 37 98
7 2595 69 98 2535 40 98
8 2610 63 95 2549 38 97

Attachment 4 – 2016 Smarter State Summary – School Performance & Participation Office of Assessment
Page | 30
Lake Forest School District Performance and Participation By School and By Grade
Smarter Balanced ELA
School Statewide
School Name Grade Mean
Scale Score Percent
Proficiency Participation
Rate Mean
Scale Score Percent
Proficient Participation
Rate
Chipman (W.T.) Middle School 6 2537 55 98 2531 52 98
7 2556 54 97 2553 53 98
8 2567 56 97 2571 54 97
Lake Forest Central Elementary School
4 2494 63 > 99 2483 56 99
5 2528 64 99 2519 60 99
Lake Forest East Elementary School 3 2463 67 99 2440 54 99
Lake Forest North Elementary School
3 2501 83 > 99 2440 54 99
Lake Forest South Elementary School
3 2434 49 > 99 2440 54 99

Attachment 4 – 2016 Smarter State Summary – School Performance & Participation Office of Assessment
Page | 31
Lake Forest School District Performance and Participation By School and By Grade
Smarter Balanced Mathematics
School Statewide
School Name Grade Mean
Scale Score Percent
Proficiency Participation
Rate Mean
Scale Score Percent
Proficient Participation
Rate
Chipman (W.T.) Middle School 6 2535 42 98 2517 37 98
7 2551 49 97 2535 40 98
8 2547 38 97 2549 38 97
Lake Forest Central Elementary School
4 2506 64 > 99 2485 51 99
5 2513 43 99 2507 42 99
Lake Forest East Elementary School 3 2476 69 99 2444 55 99
Lake Forest North Elementary School
3 2493 79 > 99 2444 55 99
Lake Forest South Elementary School
3 2443 55 > 99 2444 55 99

Attachment 4 – 2016 Smarter State Summary – School Performance & Participation Office of Assessment
Page | 32
Laurel School District Performance and Participation By School and By Grade
Smarter Balanced ELA
School Statewide
School Name Grade Mean
Scale Score Percent
Proficiency Participation
Rate Mean
Scale Score Percent
Proficient Participation
Rate
Laurel Intermediate Middle School 5 2494 54 98 2519 60 99
6 2494 35 > 99 2531 52 98
7 2549 51 99 2553 53 98
8 2538 39 96 2571 54 97
North Laurel Elementary School 3 2388 26 > 99 2440 54 99
4 2440 37 > 99 2483 56 99

Attachment 4 – 2016 Smarter State Summary – School Performance & Participation Office of Assessment
Page | 33
Laurel School District Performance and Participation By School and By Grade
Smarter Balanced Mathematics
School Statewide
School Name Grade Mean
Scale Score Percent
Proficiency Participation
Rate Mean
Scale Score Percent
Proficient Participation
Rate
Laurel Intermediate Middle School 5 2489 31 97 2507 42 99
6 2484 21 > 99 2517 37 98
7 2518 27 > 99 2535 40 98
8 2536 30 98 2549 38 97
North Laurel Elementary School 3 2411 31 > 99 2444 55 99
4 2453 37 > 99 2485 51 99

Attachment 4 – 2016 Smarter State Summary – School Performance & Participation Office of Assessment
Page | 34
Milford School District Performance and Participation By School and By Grade
Smarter Balanced ELA
School Statewide
School Name Grade Mean
Scale Score Percent
Proficiency Participation
Rate Mean
Scale Score Percent
Proficient Participation
Rate
Banneker (Benjamin) Elementary School
3 2451 66 > 99 2440 54 99
4 2491 61 > 99 2483 56 99
5 2523 61 > 99 2519 60 99
Milford Central Academy 6 2511 45 98 2531 52 98
7 2539 44 97 2553 53 98
8 2560 47 97 2571 54 97
Mispillion Elementary 3 2439 50 > 99 2440 54 99
4 2455 40 > 99 2483 56 99
5 2506 53 > 99 2519 60 99
Ross (Lulu M.) Elementary School 3 2432 48 > 99 2440 54 99
4 2483 57 > 99 2483 56 99
5 2517 60 99 2519 60 99

Attachment 4 – 2016 Smarter State Summary – School Performance & Participation Office of Assessment
Page | 35
Milford School District Performance and Participation By School and By Grade
Smarter Balanced Mathematics
School Statewide
School Name Grade Mean
Scale Score Percent
Proficiency Participation
Rate Mean
Scale Score Percent
Proficient Participation
Rate
Banneker (Benjamin) Elementary School
3 2474 71 > 99 2444 55 99
4 2498 56 > 99 2485 51 99
5 2512 38 > 99 2507 42 99
Milford Central Academy 6 2513 34 98 2517 37 98
7 2528 37 97 2535 40 98
8 2541 35 98 2549 38 97
Mispillion Elementary 3 2457 58 > 99 2444 55 99
4 2480 43 > 99 2485 51 99
5 2493 32 > 99 2507 42 99
Ross (Lulu M.) Elementary School 3 2441 49 > 99 2444 55 99
4 2463 37 > 99 2485 51 99
5 2510 38 99 2507 42 99

Attachment 4 – 2016 Smarter State Summary – School Performance & Participation Office of Assessment
Page | 36
Red Clay Consolidated School District Performance and Participation By School and By Grade
Smarter Balanced ELA
School Statewide
School Name Grade Mean
Scale Score Percent
Proficiency Participation
Rate Mean
Scale Score Percent
Proficient Participation
Rate
Baltz (Austin D.) Elementary School 3 2397 36 99 2440 54 99
4 2415 19 > 99 2483 56 99
5 2460 38 > 99 2519 60 99
Brandywine Springs School 3 2467 68 97 2440 54 99
4 2545 85 > 99 2483 56 99
5 2560 80 97 2519 60 99
6 2584 71 > 99 2531 52 98
7 2594 70 > 99 2553 53 98
8 2609 67 > 99 2571 54 97
Calloway (Cab) School of the Arts 6 2595 83 > 99 2531 52 98
7 2627 83 98 2553 53 98
8 2661 90 97 2571 54 97
Conrad Schools of Science 6 2559 61 > 99 2531 52 98
7 2575 64 > 99 2553 53 98
8 2601 68 91 2571 54 97
Delaware College Preparatory Academy
3 2331 4 > 99 2440 54 99
4 2397 19 > 99 2483 56 99
5 2416 12 > 99 2519 60 99
Dickinson (John) High School 6 2567 72 89 2531 52 98
7 2632 93 96 2553 53 98
8 2637 78 > 99 2571 54 97
duPont (Alexis I.) Middle School 6 2458 14 89 2531 52 98
7 2463 15 96 2553 53 98
8 2489 18 > 99 2571 54 97
duPont (H.B.) Middle School 6 2533 52 98 2531 52 98
7 2561 55 98 2553 53 98
8 2580 57 98 2571 54 97
Forest Oak Elementary School 3 2420 36 > 99 2440 54 99
4 2475 47 96 2483 56 99
5 2490 43 99 2519 60 99

Attachment 4 – 2016 Smarter State Summary – School Performance & Participation Office of Assessment
Page | 37
Heritage Elementary School 3 2448 59 95 2440 54 99
4 2475 58 96 2483 56 99
5 2533 66 98 2519 60 99
Highlands Elementary School 3 2402 34 > 99 2440 54 99
4 2439 38 > 99 2483 56 99
5 2473 33 > 99 2519 60 99
Lewis (William C.) Dual Language Elementary School
3 2425 55 > 99 2440 54 99
4 2456 42 > 99 2483 56 99
5 2485 43 > 99 2519 60 99
Linden Hill Elementary School 3 2463 68 97 2440 54 99
4 2529 76 95 2483 56 99
5 2556 81 98 2519 60 99
Marbrook Elementary School 3 2408 35 > 99 2440 54 99
4 2438 33 > 99 2483 56 99
5 2498 42 > 99 2519 60 99
Mote (Anna P.) Elementary School 3 2380 28 99 2440 54 99
4 2427 28 > 99 2483 56 99
5 2496 50 > 99 2519 60 99
North Star Elementary School 3 2511 86 > 99 2440 54 99
4 2535 75 > 99 2483 56 99
5 2601 96 > 99 2519 60 99
Richardson Park Elementary School 3 2371 27 > 99 2440 54 99
4 2394 21 99 2483 56 99
5 2455 29 99 2519 60 99
Richey Elementary School 3 2450 66 > 99 2440 54 99
4 2437 35 > 99 2483 56 99
5 2490 42 > 99 2519 60 99
Skyline Middle School 6 2503 41 96 2531 52 98
7 2548 48 98 2553 53 98
8 2552 48 97 2571 54 97
Stanton Middle School 6 2488 29 99 2531 52 98
7 2477 23 99 2553 53 98
8 2505 28 99 2571 54 97
Warner Elementary School 3 2372 23 99 2440 54 99

Attachment 4 – 2016 Smarter State Summary – School Performance & Participation Office of Assessment
Page | 38
4 2367 13 > 99 2483 56 99
5 2441 26 > 99 2519 60 99
William F. Cooke Jr. Elementary 3 2454 62 98 2440 54 99
4 2525 78 > 99 2483 56 99
5 2563 83 92 2519 60 99

Attachment 4 – 2016 Smarter State Summary – School Performance & Participation Office of Assessment
Page | 39
Red Clay Consolidated School District Performance and Participation By School and By Grade
Smarter Balanced Mathematics
School Statewide
School Name Grade Mean
Scale Score Percent
Proficiency Participation
Rate Mean
Scale Score Percent
Proficient Participation
Rate
Baltz (Austin D.) Elementary School 3 2388 22 99 2444 55 99
4 2423 16 > 99 2485 51 99
5 2443 13 > 99 2507 42 99
Brandywine Springs School 3 2460 67 96 2444 55 99
4 2537 79 > 99 2485 51 99
5 2540 61 96 2507 42 99
6 2572 56 > 99 2517 37 98
7 2596 64 98 2535 40 98
8 2602 58 > 99 2549 38 97
Calloway (Cab) School of the Arts 6 2557 55 > 99 2517 37 98
7 2586 59 98 2535 40 98
8 2609 55 97 2549 38 97
Conrad Schools of Science 6 2556 49 > 99 2517 37 98
7 2599 65 > 99 2535 40 98
8 2643 72 93 2549 38 97
Delaware College Preparatory Academy
3 2344 4 97 2444 55 99
4 2430 12 96 2485 51 99
5 2410 6 > 99 2507 42 99
Dickinson (John) High School 6 2546 47 89 2517 37 98
7 2580 59 96 2535 40 98
8 2588 67 > 99 2549 38 97
duPont (Alexis I.) Middle School 6 2452 11 93 2517 37 98
7 2458 10 97 2535 40 98
8 2463 10 99 2549 38 97
duPont (H.B.) Middle School 6 2518 32 99 2517 37 98
7 2561 51 99 2535 40 98
8 2577 45 98 2549 38 97
Forest Oak Elementary School 3 2426 42 > 99 2444 55 99
4 2468 40 96 2485 51 99
5 2486 30 99 2507 42 99

Attachment 4 – 2016 Smarter State Summary – School Performance & Participation Office of Assessment
Page | 40
Heritage Elementary School 3 2441 54 95 2444 55 99
4 2447 27 96 2485 51 99
5 2498 34 98 2507 42 99
Highlands Elementary School 3 2408 34 > 99 2444 55 99
4 2434 25 > 99 2485 51 99
5 2428 7 > 99 2507 42 99
Lewis (William C.) Dual Language Elementary School
3 2443 64 > 99 2444 55 99
4 2485 48 > 99 2485 51 99
5 2453 10 > 99 2507 42 99
Linden Hill Elementary School 3 2470 69 96 2444 55 99
4 2514 71 95 2485 51 99
5 2550 65 98 2507 42 99
Marbrook Elementary School 3 2403 35 > 99 2444 55 99
4 2429 20 > 99 2485 51 99
5 2490 30 > 99 2507 42 99
Mote (Anna P.) Elementary School 3 2365 11 97 2444 55 99
4 2424 22 > 99 2485 51 99
5 2460 12 > 99 2507 42 99
North Star Elementary School 3 2507 81 > 99 2444 55 99
4 2524 72 > 99 2485 51 99
5 2588 76 > 99 2507 42 99
Richardson Park Elementary School 3 2379 28 98 2444 55 99
4 2408 10 99 2485 51 99
5 2427 10 99 2507 42 99
Richey Elementary School 3 2450 64 > 99 2444 55 99
4 2445 22 > 99 2485 51 99
5 2476 31 > 99 2507 42 99
Skyline Middle School 6 2479 26 94 2517 37 98
7 2519 32 98 2535 40 98
8 2532 33 95 2549 38 97
Stanton Middle School 6 2463 21 99 2517 37 98
7 2444 13 97 2535 40 98
8 2449 9 98 2549 38 97
Warner Elementary School 3 2368 15 99 2444 55 99

Attachment 4 – 2016 Smarter State Summary – School Performance & Participation Office of Assessment
Page | 41
4 2389 9 > 99 2485 51 99
5 2428 9 > 99 2507 42 99
William F. Cooke Jr. Elementary 3 2438 56 98 2444 55 99
4 2514 72 99 2485 51 99
5 2546 62 92 2507 42 99

Attachment 4 – 2016 Smarter State Summary – School Performance & Participation Office of Assessment
Page | 42
Seaford School District Performance and Participation By School and By Grade
Smarter Balanced ELA
School Statewide
School Name Grade Mean
Scale Score Percent
Proficiency Participation
Rate Mean
Scale Score Percent
Proficient Participation
Rate
Blades Elementary School 3 2402 37 99 2440 54 99
4 2474 51 > 99 2483 56 99
5 2521 54 99 2519 60 99
Frederick Douglass Elementary School
3 2424 48 98 2440 54 99
4 2473 46 98 2483 56 99
5 2507 53 98 2519 60 99
Seaford Central Elementary School 3 2468 71 > 99 2440 54 99
4 2511 60 98 2483 56 99
5 2536 69 > 99 2519 60 99
Seaford Middle School 5 2467 37 > 99 2519 60 99
6 2505 42 99 2531 52 98
7 2543 51 99 2553 53 98
8 2550 46 98 2571 54 97
West Seaford Elementary School 3 2432 54 99 2440 54 99
4 2447 39 > 99 2483 56 99
5 2464 33 > 99 2519 60 99

Attachment 4 – 2016 Smarter State Summary – School Performance & Participation Office of Assessment
Page | 43
Seaford School District Performance and Participation By School and By Grade
Smarter Balanced Mathematics
School Statewide
School Name Grade Mean
Scale Score Percent
Proficiency Participation
Rate Mean
Scale Score Percent
Proficient Participation
Rate
Blades Elementary School 3 2417 45 99 2444 55 99
4 2485 54 > 99 2485 51 99
5 2502 38 99 2507 42 99
Frederick Douglass Elementary School
3 2459 65 98 2444 55 99
4 2493 48 97 2485 51 99
5 2504 39 98 2507 42 99
Seaford Central Elementary School 3 2475 68 > 99 2444 55 99
4 2528 72 98 2485 51 99
5 2511 42 > 99 2507 42 99
Seaford Middle School 5 2453 17 > 99 2507 42 99
6 2485 26 99 2517 37 98
7 2522 39 99 2535 40 98
8 2513 21 97 2549 38 97
West Seaford Elementary School 3 2445 57 97 2444 55 99
4 2460 37 > 99 2485 51 99
5 2440 18 > 99 2507 42 99

Attachment 4 – 2016 Smarter State Summary – School Performance & Participation Office of Assessment
Page | 44
Smyrna School District Performance and Participation By School and By Grade
Smarter Balanced ELA
School Statewide
School Name Grade Mean
Scale Score Percent
Proficiency Participation
Rate Mean
Scale Score Percent
Proficient Participation
Rate
Clayton Elementary School 3 2452 59 99 2440 54 99
4 2504 78 > 99 2483 56 99
Clayton Intermediate School 5 2550 77 98 2519 60 99
6 2557 63 98 2531 52 98
Moore (John Bassett) School 5 2509 53 99 2519 60 99
6 2542 55 > 99 2531 52 98
North Smyrna Elementary School 3 2426 48 > 99 2440 54 99
4 2465 48 > 99 2483 56 99
Smyrna Elementary School 3 2448 58 97 2440 54 99
4 2485 56 98 2483 56 99
Smyrna Middle School 6 2330 < 1 50 2531 52 98
7 2568 60 > 99 2553 53 98
8 2584 59 98 2571 54 97
Sunnyside Elementary School 3 2488 80 97 2440 54 99
4 2518 71 > 99 2483 56 99

Attachment 4 – 2016 Smarter State Summary – School Performance & Participation Office of Assessment
Page | 45
Smyrna School District Performance and Participation By School and By Grade
Smarter Balanced Mathematics
School Statewide
School Name Grade Mean
Scale Score Percent
Proficiency Participation
Rate Mean
Scale Score Percent
Proficient Participation
Rate
Clayton Elementary School 3 2458 58 99 2444 55 99
4 2489 52 > 99 2485 51 99
Clayton Intermediate School 5 2526 50 98 2507 42 99
6 2566 56 98 2517 37 98
Moore (John Bassett) School 5 2486 30 99 2507 42 99
6 2530 49 > 99 2517 37 98
North Smyrna Elementary School 3 2419 42 99 2444 55 99
4 2463 31 > 99 2485 51 99
Smyrna Elementary School 3 2454 61 97 2444 55 99
4 2479 42 98 2485 51 99
Smyrna Middle School 6 2413 < 1 > 99 2517 37 98
7 2545 39 99 2535 40 98
8 2545 35 99 2549 38 97
Sunnyside Elementary School 3 2475 68 97 2444 55 99
4 2514 64 99 2485 51 99

Attachment 4 – 2016 Smarter State Summary – School Performance & Participation Office of Assessment
Page | 46
Woodbridge School District Performance and Participation By School and By Grade
Smarter Balanced ELA
School Statewide
School Name Grade Mean
Scale Score Percent
Proficiency Participation
Rate Mean
Scale Score Percent
Proficient Participation
Rate
Phillis Wheatley Elementary School 3 2434 50 > 99 2440 54 99
4 2486 57 > 99 2483 56 99
5 2501 50 > 99 2519 60 99
Woodbridge Middle School 6 2499 38 > 99 2531 52 98
7 2544 45 > 99 2553 53 98
8 2554 51 98 2571 54 97

Attachment 4 – 2016 Smarter State Summary – School Performance & Participation Office of Assessment
Page | 47
Woodbridge School District Performance and Participation By School and By Grade
Smarter Balanced Mathematics
School Statewide
School Name Grade Mean
Scale Score Percent
Proficiency Participation
Rate Mean
Scale Score Percent
Proficient Participation
Rate
Phillis Wheatley Elementary School 3 2453 59 > 99 2444 55 99
4 2498 57 > 99 2485 51 99
5 2517 47 99 2507 42 99
Woodbridge Middle School 6 2494 26 > 99 2517 37 98
7 2521 33 99 2535 40 98
8 2540 36 98 2549 38 97

Attachment 4 – 2016 Smarter State Summary – School Performance & Participation Office of Assessment
Page | 48
Special Schools Performance and Participation
Smarter ELA
Special Schools Statewide
School Grade Mean
Scale Score Percent
Proficient Participation
Rate Mean
Scale Score Percent
Proficient Participation
Rate
Carver (G.W.) Educational Center 3 2339 < 1 > 99 2440 54 99
4 2338 < 1 > 99 2483 56 99
5 2339 < 1 > 99 2519 60 99
6 2376 < 1 33 2531 52 98
7 2399 < 1 > 99 2553 53 98
8 2404 < 1 88 2571 54 97
Cleveland White School 7 2453 < 1 > 99 2553 53 98
8 2373 < 1 > 99 2571 54 97
Delaware Day Treatment Center (6-14) Dover
3 2368 < 1 > 99 2440 54 99
4 2348 < 1 > 99 2483 56 99
5 2429 < 1 > 99 2519 60 99
6 2381 < 1 > 99 2531 52 98
Delaware School for the Deaf School (DSD)
3 2344 13 > 99 2440 54 99
4 2307 < 1 > 99 2483 56 99
5 2409 33 > 99 2519 60 99
6 2302 < 1 > 99 2531 52 98
7 2398 < 1 > 99 2553 53 98
8 2472 < 1 > 99 2571 54 97
Douglass School 3 2174 < 1 > 99 2440 54 99
4 2290 < 1 > 99 2483 56 99
5 2277 < 1 > 99 2519 60 99
6 2361 < 1 75 2531 52 98
7 2406 < 1 44 2553 53 98
8 2404 < 1 46 2571 54 97
Ferris School for Boys 8 2508 < 1 > 99 2571 54 97
First State School 5 2241 < 1 > 99 2519 60 99
6 2335 < 1 > 99 2531 52 98
7 2508 50 > 99 2553 53 98
8 2446 < 1 50 2571 54 97

Attachment 4 – 2016 Smarter State Summary – School Performance & Participation Office of Assessment
Page | 49
Kent County Community School 3 2325 < 1 > 99 2440 54 99
Kent County Secondary ILC 6 2349 < 1 90 2531 52 98
7 2361 < 1 88 2553 53 98
8 2392 < 1 67 2571 54 97
Kent Elementary Intensive Learning Center
3 2376 25 > 99 2440 54 99
4 2397 9 > 99 2483 56 99
5 2450 22 90 2519 60 99
Lewes Day Treatment Center (6-14) 3 2306 < 1 > 99 2440 54 99
4 2405 < 1 > 99 2483 56 99
5 2427 < 1 > 99 2519 60 99
NCC Detention Center 6 2349 < 1 > 99 2531 52 98
7 2364 < 1 > 99 2553 53 98
8 2392 < 1 > 99 2571 54 97
PSI-Education 6 2387 < 1 > 99 2531 52 98
8 2429 < 1 > 99 2571 54 97
Richardson Park Learning Center 3 2278 < 1 > 99 2440 54 99
4 2379 < 1 > 99 2483 56 99
5 2328 < 1 95 2519 60 99
Seaford House Day Treatment Center
6 2381 < 1 > 99 2531 52 98
7 2356 < 1 > 99 2553 53 98
8 2554 33 > 99 2571 54 97
Silver Lake Treatment Center 5 2383 < 1 > 99 2519 60 99
7 2342 < 1 > 99 2553 53 98
8 2620 > 99 > 99 2571 54 97
Stevenson House Detention Center 6 2341 < 1 > 99 2531 52 98
7 2322 < 1 > 99 2553 53 98
8 2372 < 1 > 99 2571 54 97
Sussex Consortium 4 2315 < 1 > 99 2483 56 99
6 2418 < 1 > 99 2531 52 98
7 2405 < 1 > 99 2553 53 98
Terry Childrens Psychiatric Center 3 2346 < 1 > 99 2440 54 99
4 2376 33 > 99 2483 56 99
5 2401 25 > 99 2519 60 99
6 2405 < 1 > 99 2531 52 98

Attachment 4 – 2016 Smarter State Summary – School Performance & Participation Office of Assessment
Page | 50
The Wallace Wallin School 6 2329 < 1 80 2531 52 98
7 2430 < 1 93 2553 53 98
8 2430 < 1 64 2571 54 97

Attachment 4 – 2016 Smarter State Summary – School Performance & Participation Office of Assessment
Page | 51
Special Schools Performance and Participation
Smarter Mathematics
Special Schools Statewide
School Grade Mean
Scale Score Percent
Proficient Participation
Rate Mean
Scale Score Percent
Proficient Participation
Rate
Carver (G.W.) Educational Center 3 2318 < 1 > 99 2444 55 99
4 2371 < 1 > 99 2485 51 99
5 2349 < 1 > 99 2507 42 99
6 2279 < 1 67 2517 37 98
7 2361 < 1 > 99 2535 40 98
8 2342 < 1 88 2549 38 97
Cleveland White School 6 2340 < 1 > 99 2517 37 98
7 2432 < 1 > 99 2535 40 98
8 2366 < 1 > 99 2549 38 97
Delaware Day Treatment Center (6-14) Dover
3 2350 < 1 > 99 2444 55 99
4 2388 < 1 > 99 2485 51 99
5 2400 < 1 > 99 2507 42 99
6 2300 < 1 > 99 2517 37 98
Delaware School for the Deaf School (DSD)
3 2343 13 > 99 2444 55 99
4 2346 17 > 99 2485 51 99
5 2473 33 > 99 2507 42 99
6 2295 < 1 > 99 2517 37 98
7 2362 < 1 > 99 2535 40 98
8 2273 < 1 > 99 2549 38 97
Douglass School 3 2269 < 1 > 99 2444 55 99
4 2229 < 1 > 99 2485 51 99
5 2259 < 1 > 99 2507 42 99
6 2326 < 1 88 2517 37 98
7 2321 < 1 40 2535 40 98
8 2359 < 1 46 2549 38 97
Ferris School for Boys 8 2297 < 1 > 99 2549 38 97
First State School 5 2288 < 1 > 99 2507 42 99
6 2224 < 1 > 99 2517 37 98
7 2411 < 1 > 99 2535 40 98
8 2428 < 1 50 2549 38 97

Attachment 4 – 2016 Smarter State Summary – School Performance & Participation Office of Assessment
Page | 52
Kent County Community School 3 2301 < 1 > 99 2444 55 99
Kent County Secondary ILC 6 2252 < 1 90 2517 37 98
7 2311 < 1 > 99 2535 40 98
8 2355 < 1 > 99 2549 38 97
Kent Elementary Intensive Learning Center
3 2408 25 > 99 2444 55 99
4 2403 8 > 99 2485 51 99
5 2440 < 1 90 2507 42 99
Lewes Day Treatment Center (6-14) 3 2201 < 1 > 99 2444 55 99
4 2442 < 1 > 99 2485 51 99
5 2352 < 1 > 99 2507 42 99
NCC Detention Center 6 2259 < 1 > 99 2517 37 98
7 2382 < 1 > 99 2535 40 98
8 2368 < 1 > 99 2549 38 97
PSI-Education 6 2330 < 1 > 99 2517 37 98
8 2411 < 1 > 99 2549 38 97
Richardson Park Learning Center 3 2362 < 1 > 99 2444 55 99
4 2376 < 1 > 99 2485 51 99
5 2334 < 1 95 2507 42 99
Seaford House Day Treatment Center
6 2382 < 1 > 99 2517 37 98
7 2412 < 1 > 99 2535 40 98
8 2510 33 > 99 2549 38 97
Silver Lake Treatment Center 5 2382 < 1 > 99 2507 42 99
7 2400 < 1 > 99 2535 40 98
8 2496 < 1 > 99 2549 38 97
Stevenson House Detention Center 6 2290 < 1 > 99 2517 37 98
7 2395 < 1 > 99 2535 40 98
8 2368 < 1 > 99 2549 38 97
Sussex Consortium 4 2385 < 1 > 99 2485 51 99
6 2389 25 > 99 2517 37 98
7 2327 < 1 > 99 2535 40 98
Terry Childrens Psychiatric Center 3 2302 < 1 > 99 2444 55 99
4 2265 < 1 > 99 2485 51 99
5 2385 < 1 > 99 2507 42 99
6 2335 < 1 > 99 2517 37 98

Attachment 4 – 2016 Smarter State Summary – School Performance & Participation Office of Assessment
Page | 53
The Wallace Wallin School 6 2266 < 1 75 2517 37 98
7 2387 < 1 93 2535 40 98
8 2392 < 1 60 2549 38 97