attachment 6 performance measures - water.ca.gov · ocwd will report annually on this performance...
TRANSCRIPT

Attachment 6 Performance Measures
Attachment 6
Performance Measures
Integrated Regional Water Management Implementation Prop 84, Round 1
Santa Ana Watershed Project Authority
Santa Ana One Water One Watershed IRWM Prop 84, Round 1 Implementation Proposal

Attachment 6 Performance Measures
Project (a) Groundwater Replenishment System ‐ Flow Equalization
Project Performance Measures Table
Project goals Desired outcomes Output indicators Outcome indicators Measurement tools
and methods Targets
(a)
To provide 12,000 acre-feet (af) per year of new water supply
Achieve a reliable water supply benefit of 12,000 af per year by recycling and reusing 100% of wastewater
The progress of achieving the increased water supply will be tracked by the efficient water transfer by flow equalization tanks and by measuring the amount of additional water produced by the GWRS
In addition to monitoring water flow, the amount of water injected into the seawater intrusion barrier and recharged into the groundwater basin will also serve as outcome indicators
The desired outcome will be monitored using flow metering equipment, process control system and standard measurement protocol. Flow meters will provide the necessary data to document the actual water supply benefit
The Flow Equalization project will increase the recycled water production of GWRS by an additional 12,000 af per year. OCWD will report annually on this performance measure.
(b)
To provide water quality improvement and salt management benefits
Improve salt balance in Orange County and Santa Ana watershed and achieve a salt/contaminant removal of approximately 15,200 tons per year
The progress of achieving the water quality and salt management benefits will be tracked by measuring the concentration of total dissolved solids (TDS) through the GWRS
TDS concentrations of secondary effluent feed to GWRS and the GWRS product water outlet will serve as outcome indicators. Salt removal shall be calculated as the difference of TDS concentrations in the secondary effluent and the GWRS outlets (expressed as mg/L and tons per year).
The desired outcome will be obtained using chemical analysis. TDS measurements will provide the necessary data to document the water quality improvement and salt management benefits. TDS analyses will be performed according to the Standard Methods for the Examination of Water and Wastewater
The Flow Equalization project will provide a salt/contaminant removal of approximately 15,200 tons per year. OCWD will report annually on this performance measure.

Attachment 6 Performance Measures
Project (b) Sludge Dewatering, Odor Control, and Primary Sludge Thickening
Project Performance Measures Table
Project goals Desired outcomes Output indicators Outcome indicators Measurement tools
and methods Targets
(a)
Provide a new local water supply
Provide reliable water supply by increasing treated wastewater (secondary effluent for water reclamation to offset imported water demands and reduce dependency on imported water and increase reliability
Maximize secondary effluent flow (source water for water reclamation)
Increase in flow rate of secondary effluent for water reclamation measured as the difference between pre-project and post-project
Flow meters to measure additional recycled water production. Flows will be recorded daily and reported quarterly for up to two years. (See Note 1)
30 mgd (31,000 AFY, which is equal to 7,750 AF per quarter)
(b)
Support water reuse by upgrading wastewater treatment facilities
Increase the volume of treated wastewater (secondary effluent) available as source water (feedwater) for water reclamation
Maximize secondary effluent flow (source water for water reclamation)
Increase in flow rate of secondary effluent for water reclamation measured as the difference between pre-project and post-project
Flow meters to measure treated wastewater (secondary effluent). Flows will be recorded daily and reported quarterly for up to two years. (See Note 1)
34 mgd (38,000 AFY, which is equal to 9,500 AF per quarter)

Attachment 6 Performance Measures
Project goals Desired outcomes Output indicators Outcome indicators Measurement tools
and methods Targets
(c)
Improve water quality
Manage salinity by removing salts and decreasing groundwater salinity
Substitute lower salinity recycled water in place of higher salinity imported water
Lower total dissolved solids (TDS) concentration of recycled water as compared to that of imported water
Monitor TDS by daily samples and lab analyses and meter daily flow to calculate tons of salt in recycled water and compare that to salt loading of equivalent volume of imported water with the difference representing the salts removed from the watershed. TDS reduction will be reported quarterly for up to two years. ( See Note 1)
26,000 tons of TDS/yr (based on 30 mgd of
recycled water production)
(Equivalent to 6,500 tons of TDS/quarter)
(d)
Conserve energy Reduce electrical power demands
Reduce overall electricity use by using increased capacity of digester gas production to generate more electricity
Increase the capacity to generate additional electricity using digester gas, measured as the difference between pre-project and post-project at the Plant No. 1 central generation facilities
Use digester gas as fuel to generate electricity and measure power production with quarterly reporting for up to two years. (See Note 1)
44,300 kWh/yr (Equivalent to 11,075 kWh/quarter) (See Note 2)

Attachment 6 Performance Measures
Project goals Desired outcomes Output indicators Outcome indicators Measurement tools
and methods Targets
(e)
Reduce greenhouse gas emissions for water conveyance
Reduce energy used to transport imported water
Maximize secondary effluent flow (source water for water reclamation)
Increase in flow rate of secondary effluent (source water for water reclamation) measured as the difference between pre-project and post-project.
Calculate reduction in carbon dioxide (CO2) emissions attributed to replacement of imported water with recycled water based on metered recycled water production with quarterly reporting for up to two years. (See Note 1)
19,000 metric tons of CO2/yr (Equivalent to 4,750 metric tons of CO2/quarter)
(f)
Reduce greenhouse gas emissions for solids disposal
Reduce trucking of dewatered biosolids
Fewer trucks hauling dewatered biosolids to disposal measured as the difference between pre-project and post-project
Reduction in the number of trucks hauling dewatered biosolids to disposal counted as the difference between pre-project and post-project
Count daily number of dewatered biosolids hauling trucks before and after the project to determine reduction in number of trucks to calculate greenhouse gas emission reduction associated with fewer trucks. Truck counts and associated reduction in greenhouse gas emissions will be reported quarterly for up to two years. (See Note 1)
500 metric tons of CO2/yr (See Note 2)

Attachment 6 Performance Measures
Project goals Desired outcomes Output indicators Outcome indicators Measurement tools
and methods Targets
(g)
Preserve the environment by reducing wastewater discharges to the ocean
Reduce the amount of treated wastewater (secondary effluent) discharge to the ocean and maintain coastal environmental quality by diverting more secondary effluent to water reclamation
Decrease discharge to ocean. Meter treated wastewater discharge to ocean
Decline in the flow rate of secondary effluent discharged to the ocean and corresponding increase in the flow rate of secondary effluent (source water for water reclamation) measured as the difference between pre-project and post-project.
Flow meters to measure volume of treated wastewater (secondary effluent) conveyed to water reclamation. Flows will be recorded daily and reported quarterly for up to two years. (See Note 1)
34 mgd (38,000 AFY, which is equal to 9,500 AF per quarter)
Notes: 1. Project performance will be reported quarterly for up to two years. Quarterly reporting is based on the SAWPA OWOW Plan (Chapter 9, pages 5-6), which says that the project schedule, budget tracking, and deliverables will be done at least once per quarter. Furthermore, the SAWPA OWOW Plan (Chapter 9, page 3) states that the OWOW IRWM Plan performance will be evaluated every two years. Therefore, in conformance with the OWOW Plan, the monitoring and assessment of the P1-101 Project performance measures will be reported quarterly for up to two years. 2. OCSD Plant No. 1 sludge and gas production, prepared by OCSD, November 2010. See Attachment 8 Narrative of this Application. 3. OCSD GHG Analysis for Solids, prepared by OCSD, September 2010. See Attachment 6 Narratives and Attachment 8 Narrative of this Application.
Additional Narrative – Monitoring, Assessment, and Performance Measures Attachment 6 presents the describes Monitoring, Assessment, and Performance Measures for the Orange County Sanitation District (OCSD) Sludge Dewatering, Odor Control, and Primary Sludge Thickening Project at Plant No. 1. This project is also known as the P1-101 Project in the OCSD Capital Improvement Plan. The required Project Performance Measures Table at the end of this Attachment 6 summarizes the following specific items for the P1-101 Project:
• Project goals

Attachment 6 Performance Measures
• Desired outcomes • Output indicators – measures to effectively track output • Outcome indicators – measures to evaluate change that is a direct result of the work • Measurement tools and methods • Targets – measurable targets that are feasible to meet during the life of the Proposal.
Attachment 6 is divided into three parts that support and explain the Project Performance Measures Table: (1) project goals/objectives and desired outcomes; (2) output and outcome indicators; and (3) measurement tools and methods and targets. Part One Project Goals/Objectives and Desired Outcomes The project performance measures will be used to demonstrate how the P1-101 Project achieves the regional goals/objectives established in the Santa Ana Watershed Project Authority (SAWPA) One Water One Watershed (OWOW) Santa Ana Integrated Watershed Plan, an Integrated Regional Water Management Plan (IRWMP). The performance measures have been developed to monitor compliance with the specific desired outcomes for the project. This approach ensures that the P1-101 Project is achieving its own individual goals that contribute towards the OWOW Plan’s success. In order to demonstrate compliance, the performance measures must be easily monitored and quantifiable. Project Goals/Objectives The performance measures are based on the following P1-101 Project goals, which are consistent with and support the OWOW Plan objectives for the Santa Ana River watershed as summarized in Table 6-1 below:
Table 6-1 P1-101 Project Goals Support the OWOW Plan Objectives
P-101 PROJECT GOALS1 SUPPORTED OWOW PLAN OBJECTIVES2
(a) PROVIDE A NEW LOCAL WATER SUPPLY • PROVIDE RELIABLE WATER SUPPLY (b) SUPPORT WATER REUSE BY UPGRADING
WASTEWATER TREATMENT FACILITIES • PROMOTE SUSTAINABLE WATER SOLUTIONS
(c) IMPROVE WATER QUALITY • ENSURE HIGH QUALITY WATER (d) CONSERVE ENERGY • PROMOTE SUSTAINABLE WATER SOLUTIONS
(ENERGY EFFICIENT SOLUTIONS) (e) REDUCE GREENHOUSE GAS EMISSIONS FOR
WATER CONVEYANCE • PROMOTE SUSTAINABLE WATER SOLUTIONS
(REDUCE GREENHOUSE GAS EMISSIONS)

Attachment 6 Performance Measures
P-101 PROJECT GOALS1 SUPPORTED OWOW PLAN OBJECTIVES2
(f) REDUCE GREENHOUSE GAS EMISSIONS FOR SOLIDS DISPOSAL
• PROMOTE SUSTAINABLE WATER SOLUTIONS (REDUCE GREENHOUSE GAS EMISSIONS)
(g) PRESERVE THE ENVIRONMENT BY REDUCING WASTEWATER DISCHARGES TO THE OCEAN
• PRESERVE AND ENHANCE THE ENVIRONMENT
1 Note: P1-101 Project Goals match the Project Performance Measures Table. 2 See OWOW Plan Table 9-1. Desired Outcomes The P1-101 Project goals/objectives are the desired outcomes listed in the accompanying Project Performance Measures Table. The desired outcomes effectively describe the project goals in more detail and the specific results that the P1-101 Project will achieve to help accomplish regional goals. Section 9 of the OWOW Plan discusses an implementation strategy for achieving the Plan’s objectives. Outcomes of the P1-101 Project that will support the above project and OWOW regional goals are described in Table 6-2.
Table 6-2 P1-101 Project Desired Outcomes Support the OWOW Plan Targets
P1-101 PROJECT DESIRED OUTCOMES1 SUPPORTED OWOW PLAN TARGETS2
(a) PROVIDE RELIABLE WATER SUPPLY BY INCREASING TREATED WASTEWATER (SECONDARY EFFLUENT) FOR WATER RECLAMATION TO OFFSET IMPORTED WATER DEMANDS AND REDUCE DEPENDENCY ON IMPORTED WATER AND INCREASE RELIABILITY. AS NOTED ABOVE, OCSD CURRENTLY DISCHARGES TREATED WASTEWATER (SECONDARY EFFLUENT) TO THE PACIFIC OCEAN ALONG THE COASTLINE OF HUNTINGTON BEACH NEAR THE MOUTH OF THE SANTA ANA RIVER. THE P1-101 PROJECT WILL INCREASE THE FLOW OF TREATED WASTEWATER (SECONDARY EFFLUENT) BY UP TO 34 MGD (38,000 AFY) AS FEEDWATER TO THE GROUNDWATER REPLENISHMENT SYSTEM (GWRS), ENABLING OUR PARTNER, OCWD, TO PRODUCE UP TO 30 MGD (31,000 AFY) MORE RECYCLED WATER FOR GROUNDWATER RECHARGE. OCSD PROTECTS PUBLIC HEALTH AND THE ENVIRONMENT BY PROVIDING SAFE WASTEWATER COLLECTION, TREATMENT AND RECYCLING.
• RECYCLE AND REUSE 100% OF WASTEWATER • REUSE ALL OF SANTA ANA RIVER FLOW AT LEAST
ONCE [PROJECT INCREASES WATER RECYCLING AND REDUCES AMOUNT OF WATER DISCHARGED TO THE PACIFIC OCEAN.]
• ASSURE ADEQUATE WATER SUPPLY AND SAFE WASTEWATER TREATMENT AND DISPOSAL [OCSD MAINTAINS A COMPREHENSIVE INDUSTRIAL PRETREATMENT AND SOURCE CONTROL PROGRAM TO PROTECT CONTAMINANTS FROM ENTERING THE TREATMENT FACILITIES, THROUGH A COMPREHENSIVE MONITORING PROGRAM. THIS PROGRAM PROTECTS GWRS PURIFIED WATER QUALITY (2009 GWRS ANNUAL REPORT PP 1-3 AND 1-4). THE PROJECT ALSO INCREASES RECYCLED WATER FOR GROUNDWATER RECHARGE.]

Attachment 6 Performance Measures
P1-101 PROJECT DESIRED OUTCOMES1 SUPPORTED OWOW PLAN TARGETS2
(b) INCREASE THE VOLUME OF TREATED WASTEWATER (SECONDARY EFFLUENT) AVAILABLE AS SOURCE WATER (FEEDWATER) FOR WATER RECLAMATION. CURRENTLY, OCSD DISCHARGES TREATED WASTEWATER (SECONDARY EFFLUENT) TO THE PACIFIC OCEAN ALONG THE COASTLINE OF HUNTINGTON BEACH NEAR THE MOUTH OF THE SANTA ANA RIVER. THIS PROJECT WILL DIVERT UP TO 34 MGD (38,000 AFY) MORE SECONDARY EFFLUENT TO THE GWRS. OCSD PROTECTS PUBLIC HEALTH AND THE ENVIRONMENT BY PROVIDING SAFE WASTEWATER COLLECTION, TREATMENT AND RECYCLING.
• RECYCLE AND REUSE 100% OF WASTEWATER • REUSE ALL OF SANTA ANA RIVER FLOW AT LEAST
ONCE [PROJECT INCREASES WATER RECYCLING AND REDUCES AMOUNT OF WATER DISCHARGED TO THE PACIFIC OCEAN.]
• ASSURE ADEQUATE WATER SUPPLY AND SAFE WASTEWATER TREATMENT AND DISPOSAL [INCREASE RECYCLED WATER GROUNDWATER RECHARGE]
(c) MANAGE SALINITY BY REMOVING SALTS AND DECREASING GROUNDWATER SALINITY. THE P1-101 PROJECT CONTRIBUTES TO SALINITY MANAGEMENT BY PROVIDING TREATED WASTEWATER (SECONDARY EFFLUENT) AS FEEDWATER FOR THE GWRS, WHICH PRODUCES LOW TDS PURIFIED RECYCLED WATER AND COMPLIES WITH DRINKING WATER QUALITY STANDARDS (REFERENCE: GWRS 2009 ANNUAL REPORT, TABLE 2-1, IN APPENDIX 6-A.) THE PURIFIED RECYCLED WATER RECHARGES THE ORANGE COUNTY GROUNDWATER BASIN AND PROTECTS IT FROM SEAWATER INTRUSION. WITHOUT THE P1-101 PROJECT, THE FEEDWATER SUPPLY TO THE GWRS WOULD BE RESTRICTED, NECESSITATING THE USE OF ALTERNATIVE IMPORTED WATER SUPPLIES, WHICH HAVE MUCH HIGHER TDS AND WOULD FURTHER INCREASE GROUNDWATER SALINITY.
• MEET ALL WATER QUALITY STANDARDS • REMOVE SALT FROM WATERSHED TO IMPROVE SALT
BALANCE
(d) REDUCE ELECTRICAL POWER DEMANDS. THE P1-101 PROJECT WILL IMPROVE WASTEWATER SOLIDS HANDLING AND ANAEROBIC DIGESTER OPERATION BY THICKENING PRIMARY SLUDGE. MORE DIGESTER GAS WILL BE PRODUCED, INCREASING THE CAPACITY OF THE FUEL SUPPLY FOR THE EXISTING CENTRAL POWER GENERATION FACILITIES AT PLANT NO. 1. MORE DIGESTER GAS WILL RESULT IN GENERATION OF MORE ELECTRICITY, WHICH WILL REDUCE OCSD’S POWER DEMANDS. OCSD PROTECTS PUBLIC HEALTH AND THE ENVIRONMENT BY PROVIDING EFFECTIVE WASTEWATER COLLECTION, TREATMENT AND RECYCLING.
• PROMOTE SUSTAINABLE WATER SOLUTIONS BY UTILIZING DIGESTER GAS PRODUCED BY TREATMENT OF WASTEWATER SOLIDS TO USE AS A FUEL SOURCE TO GENERATE ELECTRICITY
• ASSURE ADEQUATE WATER SUPPLY AND SAFE WASTEWATER TREATMENT AND DISPOSAL [PROJECT INCREASES RECYCLED WATER FOR GROUNDWATER RECHARGE.]

Attachment 6 Performance Measures
P1-101 PROJECT DESIRED OUTCOMES1 SUPPORTED OWOW PLAN TARGETS2
(e) REDUCE ENERGY USED TO TRANSPORT IMPORTED WATER. BY OFFSETTING IMPORTED WATER DEMANDS WITH RECYCLED WATER AS DESCRIBED ABOVE, THE P1-101 PROJECT WILL SUPPORT ENERGY EFFICIENT WATER RECLAMATION. MORE SECONDARY EFFLUENT WILL DECREASE THE OVERALL EMISSIONS OF GREENHOUSE GASES. OCSD PROTECTS PUBLIC HEALTH AND THE ENVIRONMENT BY PROVIDING EFFECTIVE WASTEWATER COLLECTION, TREATMENT AND RECYCLING.
• REDUCE GREENHOUSE GAS EMISSIONS FROM WATER MANAGEMENT ACTIVITIES
• ASSURE ADEQUATE WATER SUPPLY AND SAFE WASTEWATER TREATMENT AND DISPOSAL [PROJECT INCREASES RECYCLED WATER FOR GROUNDWATER RECHARGE.]
(f) REDUCE TRUCKING OF DEWATERED BIOSOLIDS. THE P1-101 PROJECT WILL INSTALL HIGHLY EFFECTIVE SOLIDS DEWATERING EQUIPMENT THAT WILL PRODUCE DRIER SOLIDS FOR DISPOSAL. DRIER SOLIDS MEANS LESS VOLUME AND FEWER TRUCKS WILL BE NEEDED TO HAUL THE DEWATERED SOLIDS TO DISPOSAL SITES. THE PROJECT WILL REDUCE GREENHOUSE GAS EMISSIONS CAUSED BY SOLIDS HAULING TRUCKS. OCSD PROTECTS PUBLIC HEALTH AND THE ENVIRONMENT BY PROVIDING EFFECTIVE WASTEWATER COLLECTION, TREATMENT AND RECYCLING.
• REDUCE GREENHOUSE GAS EMISSIONS FROM WATER MANAGEMENT ACTIVITIES
• ASSURE ADEQUATE WATER SUPPLY AND SAFE WASTEWATER TREATMENT AND DISPOSAL [PROJECT INCREASES RECYCLED WATER FOR GROUNDWATER RECHARGE.]
(g) REDUCE THE AMOUNT OF TREATED WASTEWATER (SECONDARY EFFLUENT) DISCHARGE TO THE OCEAN AND MAINTAIN COASTAL ENVIRONMENTAL QUALITY BY DIVERTING MORE SECONDARY EFFLUENT TO WATER RECLAMATION. OCSD DISCHARGES TREATED WASTEWATER (SECONDARY EFFLUENT) TO THE OCEAN. THE P1-101 PROJECT WILL RESULT IN LESS TREATED WASTEWATER (SECONDARY EFFLUENT) BEING DISCHARGED TO THE OCEAN. INSTEAD, OCSD WILL BE ABLE TO DIVERT UP TO 34 MGD (38,000 AFY) MORE SECONDARY EFFLUENT TO THE GWRS. WATER RECLAMATION SUPPORTS PRESERVATION OF THE MARINE ENVIRONMENT AND COASTAL BEACHES. OCSD PROTECTS PUBLIC HEALTH AND THE ENVIRONMENT BY PROVIDING SAFE WASTEWATER COLLECTION, TREATMENT AND RECYCLING.
• RECYCLE AND REUSE 100% OF WASTEWATER • REUSE ALL OF SANTA ANA RIVER FLOW AT LEAST
ONCE [INCREASE WATER RECYCLING AND REDUCE RIVER WATER DISCHARGED TO THE PACIFIC OCEAN]
• ASSURE ADEQUATE WATER SUPPLY AND SAFE WASTEWATER TREATMENT AND DISPOSAL [INCREASE RECYCLED WATER GROUNDWATER RECHARGE]
1 Note: P1-101 Project Desired Outcomes match the Project Performance Measures Table. 2 See OWOW Plan Table 9-1. Part Two Output and Outcome Indicators Indicators of outputs associated with the P1-101 Project will be distinct and quantifiable. Outcome indicators will be measureable. Table 6-3 summarizes the indicators and how they will measure project performance and corroborate P1-101’s attainment of regional goals as

Attachment 6 Performance Measures
discussed in Section 9 of the OWOW Plan. Comparison of pre-project and post-project indicators will be used to demonstrate the outputs and outcomes directly applicable to the project.
Table 6-3 P1-101 Project Output and Outcome Indicators
P1-101 PROJECT OUTPUT AND OUTCOME INDICATORS1 SUPPORTED OWOW PLAN PERFORMANCE INDICATORS AND MEASURES2
(a) SUPPORT WATER RECLAMATION BY INCREASING SECONDARY EFFLUENT FLOW DELIVERED TO GWRS TO BE MEASURED AS THE DIFFERENCE BETWEEN PRE-PROJECT AND POST-PROJECT FLOWS
• PERCENTAGE OF EFFLUENT BEING REUSED • PERCENTAGE INCREASE IN RECYCLING • PERCENTAGE OF ANTICIPATED NEW WATER SUPPLY CREATED
(b) MAXIMIZE SECONDARY EFFLUENT FLOW FOR WATER RECLAMATION TO BE MEASURED AS THE DIFFERENCE BETWEEN PRE-PROJECT AND POST-PROJECT FLOWS
• PERCENTAGE OF EFFLUENT BEING REUSED • PERCENTAGE INCREASE IN RECYCLING • PERCENTAGE OF ANTICIPATED NEW WATER SUPPLY CREATED
(c) SUBSTITUTE LOWER SALINITY RECYCLED WATER IN PLACE OF HIGHER SALINITY IMPORTED WATER WITH THE INDICATOR BEING THE DIFFERENCE IN TDS BETWEEN THESE TWO SUPPLIES
• TONS OF SALT REMOVED FROM THE WATERSHED • REMOVE SALT FROM WATERSHED TO IMPROVE SALT BALANCE • COMPLIANCE WITH APPLICABLE WATER QUALITY STANDARDS • PERCENT OF ANTICIPATED SALT REMOVAL
(d) REDUCE OVERALL ELECTRICITY USE BY USING INCREASED CAPACITY OF DIGESTER GAS PRODUCTION TO GENERATE MORE ELECTRICITY
• REDUCE GREENHOUSE GAS EMISSIONS FROM WATER MANAGEMENT ACTIVITIES
• TONS OF CARBON DIOXIDE EQUIVALENTS MITIGATED OR SEQUESTERED • PERCENT OF CARBON DIOXIDE EQUIVALENTS MITIGATED VERSUS
TARGET • PERCENT OF CARBON DIOXIDE SEQUESTERED PER YEAR (TONS) VERSUS
TARGET (e) MAXIMIZE SECONDARY EFFLUENT FLOW FOR
RECYCLED WATER PRODUCTION TO OFFSET IMPORTED WATER DEMANDS TO BE MEASURED AS THE SAVINGS IN ENERGY USE AND GREENHOUSE GAS EMISSIONS BETWEEN RECYCLED WATER PRODUCTION AND IMPORTED WATER PUMPING
• PERCENTAGE OF EFFLUENT IN WATERSHED BEING REUSED • PERCENTAGE INCREASE IN RECYCLING • REDUCE GREENHOUSE GAS EMISSIONS FROM WATER MANAGEMENT
ACTIVITIES • TONS OF CARBON DIOXIDE EQUIVALENTS MITIGATED OR SEQUESTERED • PERCENT OF CARBON DIOXIDE EQUIVALENTS MITIGATED VERSUS
TARGET • PERCENT OF CARBON DIOXIDE SEQUESTERED PER YEAR (TONS) VERSUS
TARGET

Attachment 6 Performance Measures
P1-101 PROJECT OUTPUT AND OUTCOME INDICATORS1 SUPPORTED OWOW PLAN PERFORMANCE INDICATORS AND MEASURES2
(f) REDUCE NUMBER OF TRUCKS HAULING DEWATERED BIOSOLIDS TO DISPOSAL MEASURED AS THE DIFFERENCE BETWEEN PRE-PROJECT AND POST-PROJECT
• REDUCE GREENHOUSE GAS EMISSIONS FROM WATER MANAGEMENT ACTIVITIES
• TONS OF CARBON DIOXIDE EQUIVALENTS MITIGATED OR SEQUESTERED • PERCENT OF CARBON DIOXIDE EQUIVALENTS MITIGATED VERSUS
TARGET • PERCENT OF CARBON DIOXIDE SEQUESTERED PER YEAR (TONS) VERSUS
TARGET (g) DECREASE IN TREATED WASTEWATER (SECONDARY
EFFLUENT) FLOW DISCHARGED TO OCEAN MEASURED AS THE DIFFERENCE BETWEEN PRE-PROJECT AND POST-PROJECT. PROJECT WILL DISCHARGE LESS TREATED WASTEWATER (SECONDARY EFFLUENT) TO THE OCEAN TO PRESERVE, MAINTAIN, AND PROTECT THE ENVIRONMENT AND TO MAINTAIN RECREATIONAL BENEFITS ALONG THE COASTLINE.
• PRESERVE THE ENVIRONMENT • PROVIDE AND/OR MAINTAIN RECREATIONAL BENEFITS
1 Note: P1-101 Project Output and Outcome Indicators match the Project Performance Measures Table. 2 See OWOW Plan Tables 9-1 and 9-2. Part Three Measurement Tools and Methods and Targets Performance measures for the P1-101 Project will be easily quantifiable by measuring pre-project conditions and comparing those with post-project conditions. Table 6-4 summarizes the tools and methods that will be used to measure the performance of the P1-101 Project. The basis for each of the targets is also presented. More information about the basis for the targets and values associated with these project benefits can be found in Attachment 7 entitled “Economic Analysis – Water Supply Costs and Benefits” and Attachment 8 entitled “Water Quality and Other Expected Benefits” of this application. Project performance will be reported quarterly for up to two years. Quarterly reporting is based on the SAWPA OWOW Plan (Chapter 9, pages 5-6), which says that the project schedule, budget tracking, and deliverables will be done at least once per quarter. Furthermore, the SAWPA OWOW Plan (Chapter 9, page 3) states that the OWOW IRWM Plan performance will be evaluated every two years. Therefore, in conformance with the OWOW Plan, the monitoring and assessment of the P1-101 Project performance measures will be reported quarterly for up to two years.

Attachment 6 Performance Measures
Table 6-4 Measurement Tools and Methods and Targets for the P1-101 Project
MEASUREMENT TOOLS AND METHODS1 TARGETS1 BASIS
(a) FLOW METERS WILL MEASURE THE ADDITIONAL RECYCLED WATER PRODUCTION BY THE WATER RECYCLING FACILITY
30 MGD (31,000 AFY)
• ADDITIONAL RECYCLED WATER PRODUCTION SUPPORTED BY THE P1-101 PROJECT
(b) FLOW METERS WILL MEASURE THE TREATED WASTEWATER (SECONDARY EFFLUENT) FLOW DELIVERED TO THE WATER RECYCLING FACILITY
34 MGD (38,000 AFY)
• 34 MGD (38,000 AFY) OF SECONDARY EFFLUENT IS REQUIRED TO PRODUCE 30 MGD (31,000 AFY) OF PURIFIED RECYCLED WATER
(c) LABORATORY SAMPLES OF RECYCLED WATER WILL BE TAKEN AND ANALYZED FOR TDS AND COMPARED TO THAT OF IMPORTED WATER TO CALCULATE THE TONS OF TDS REDUCTION FOR THE ACTUAL QUANTITY OF RECYCLED WATER THAT WILL OFFSET IMPORTED WATER DEMANDS
26,000 TONS OF TDS/YR • TDS OF RECYCLED WATER = 60 MG/L (BASED ON EXISTING GWRS)
• TDS OF IMPORTED WATER = 650 MG/L (BASED ON AVERAGE QUALITY)
• TDS REDUCTION = 650-60 = 590 MG/L • FOR 30 MGD, • DAILY TDS REDUCTION = 30 MGD X 590 MG/L X
8.34 = 147,600 LB/DAY • ANNUAL TDS REDUCTION = 147,600 LB/DAY X
365 DAYS/YR / 2000 LB/TON = 26,900 TONS/YR (ROUND DOWN TO 26,000 TONS OF TDS/YR)
(d) INCREASE CAPACITY TO GENERATE ADDITIONAL ELECTRICITY USING DIGESTER GAS, MEASURED AS THE DIFFERENCE BETWEEN PRE-PROJECT AND POST-PROJECT AT THE PLANT NO. 1 CENTRAL GENERATION FACILITIES
44,300 KWH/YR • ADDITIONAL WASTEWATER TREATED = 34 MGD • ADDITIONAL SLUDGE TREATED = 42,500 CUBIC
FEET/DAY • ADDITIONAL DIGESTER GAS PRODUCED = 781
KCF/DAY • ADDITIONAL POWER GENERATION = 56.72
KWH/KSCF (BASED ON HISTORIC AVERAGE PERFORMANCE AT PLANT 1)

Attachment 6 Performance Measures
MEASUREMENT TOOLS AND METHODS1 TARGETS1 BASIS (e) FLOW METERS WILL MEASURE THE
ADDITIONAL RECYCLED WATER PRODUCTION THAT WILL OFFSET IMPORTED WATER DEMANDS AND RESULT IN LESS IMPORTED WATER PUMPING, THEREBY SAVING ENERGY AND REDUCING GREENHOUSE GAS EMISSIONS. GREENHOUSE GAS EMISSIONS WILL BE CALCULATED AS SHOWN AT RIGHT.
19,000 METRIC TONS OF CO2/YR • 31,000 AFY OF RECYCLED WATER PRODUCTION REPLACES 31,000 AFY OF IMPORTED WATER DEMAND
• 9,727 KWH/MG = 3,170 KWH/AF FACTOR FOR ENERGY USED TO TRANSPORT WATER TO SOUTHERN CALIFORNIA (FROM: CALIFORNIA ENERGY COMMISSION "REFINING ESTIMATES OF WATER-RELATED ENERGY USE IN CALIFORNIA", DECEMBER 2006)
• 0.435 LBS OF CO2/KWH AVERAGE FACTOR FOR THE ENTIRE STATE OF CALIFORNIA TO TRANSPORT WATER (FROM: CARBON DIOXIDE EMISSIONS RATE, DEPARTMENT OF ENERGY, JULY 2000)
• 3,170 KWH/AF X 31,000 AFY = 98,270,000 KWH/YR
• 98,270,000 KWH/YR X 0.435 LBS OF CO2/KWH = 42,747,400 LBS OF CO2/YR
• 42,747,400 LBS OF CO2/YR / 2,204.6 LBS/METRIC TON = 19,000 METRIC TONS OF CO2/YR
(f) NUMBER OF DEWATERED BIOSOLIDS HAULING TRUCKS WILL BE COUNTED
500 TONS OF CO2/YR • ESTIMATED 68 TONS CO2/Y EMISSIONS PER TRUCK • ESTIMATED 8 FEWER TRUCKS2
(g) FLOW METERS WILL MEASURE THE REDUCTION IN TREATED WASTEWATER (SECONDARY EFFLUENT) FLOW DISCHARGED TO THE OCEAN
34 MGD (38,000 AFY)
34 MGD (38,000 AFY) OF SECONDARY EFFLUENT IS REQUIRED TO PRODUCE 30 MGD (31,000 AFY) OF PURIFIED RECYCLED WATER
1 Note: P1-101 Measurement Tools and Methods and Targets match the Project Performance Measures Table. 2 The P1-101 project improvements consists of the installation of centrifuges that will increase the dewatering of solids, it is estimated that
every 10% change in water results in about 25% change in weight, for example by increasing the cake composition from 30% solids/70% water to 40% solids/60%water there will be more solids and therefore the cake will be approximately 25% heavier. The byproduct of the centrifuges will have less water, so the number of trucks needed for disposal is reduced by approximately 8 trucks a day. The round trip to haul the solids to Kern County is approximately 400 miles, with 5 miles per gallon of diesel the consumption of diesel will be reduced by approximately 640 gallons or 91.4 barrels of oil. The centrifuges will consume more energy to reduce the water in the solids, it is estimated that an additional 5,000 kW will be used each day, it is estimated that each barrel of oil produces approximately 1,700 kWh; the additional barrels of oil that will be needed to power the centrifuges is approximately 70.6. From the improvements that P1-101 project will create there will be a savings of approximately 20 barrels of oils per day (91.4 – 70.6 = 20.8). Each barrel of oil is estimated

Attachment 6 Performance Measures
to produce 317 kg of CO2, yielding in a savings of 6,600 kg/d (550 tons/year) savings of emissions. The cost of greenhouse gas reduction by less truck miles is approximately $13,175 (500 tons/yr × $50/ton in 2030 × 0.527 factor to convert from 2030 to 2009 dollars = $13,175). See calculations below.
Calculations for Basis of Target for Greenhouse Gas Analysis for Solids on P1-101
P1-101 Results Parameter Value
Projected change in percent solids from P1-101 10%
Estimated 2012 BFP tons per day 700
Estimated 2012 centrifuge tons per day 500
(every 10% change in water results in about 25% change in weight)
Biosolids tons per truck 25 Less trucks with centrifuges 8 One-way Miles to Kern Site 200 Round trip miles 400 Avoided truck miles per day
with centrifuges 3200 Truck miles to diesel gallon 5 Diesel gallons avoided per day 640 Diesel gallons produced per
barrel of oil 7 Barrels of oil avoided per day 91.4
P1-101 Demands Parameter Value
Power usage for dewatering centrifuges (kW) 5000
Power generated per barrel of oil (kW-hr) 1700
Hours per day 24 Barrels of oil used per hour 2.9 Barrels of oil used per day 70.6
Barrel of oil CO2 eq 317 kg P1-101 CO2 Reductions 28982.86 kg/d P1-101 CO2 Increases 22376.47 kg/d

Attachment 6 Performance Measures
Net P1-101 Savings 6606.387 kg/d
Annual P1-101 Net Savings (metric) 2,411,331 kg/yr Annual P1-101 Net Savings (English) 1,094,567 lbs/yr Annual P1-101 Net Savings (English) 547 tons/yr
Summary In summary, the P1-101 Project monitoring will comply with and contribute towards monitoring the performance of the OWOW Plan as a whole. The OWOW Plan (Chapter 9, p.p. 4-6) describes how SAWPA will provide project implementation tracking of the region’s projects that receive grant funding by providing regional management and administration of projects, including environmental compliance, schedule and budget tracking, site visits, documentation requirements, periodic reviews and evaluations, agreement deliverables, invoice procedures, audits, and closeout. OCSD will work with SAWPA to accomplish these tasks for the P1-101 Project as outlined in the Work Plan (Attachment 3).

Attachment 6 Performance Measures
Project (c) East Garden Grove Wintersburg Channel Urban Runoff Diversion Project Performance Measures Table - EGGWC Urban Runoff and Treatment - City of Huntington Beach
Project goals Desired outcomes Output indicators Outcome indicators Measurement tools
and methods Targets
(a)
Water Reclamation
Diversion of up to 3MGD of urban dry-weather flows that can be recycled and utilized as a nonpotable water source of irrigation of City public landscape in parks which will free up potable
Water flow measurements through pumping volume of water diverted from the EGGWC
Total volume of diverted flows indicates that amount of water reclaimed
Pumping records recorded in telemetry system indicating amount of time and pumping rates or number of pumps operating. Flow rate records from ultrasonic flow meter records on the discharge pumps for diversion system
Flow diversion varies from 1MGD to 3MGD
(b)
Pollutant Load Reduction to
Receiving Waters
Eliminate runoff pollution delivered to the Bolsa Chica Wetlands, Huntington Harbor, and coastal beaches
Water quality measurements in the downstream channel and receiving waters - load reduction monitoring
Pollutant load reduction in the downstream channel and receiving waters, particularly metals and pathogens and pollutants of concern
Water quality sampling and testing
Reduce to pollutants in channel to ambient levels or below receiving water regulatory objective requirements
(c)
Urban Runoff Treatment
Removal pollutants from the diverted urban runoff through natural treatment processes so that it can become a useable water source for non-potable water uses
Water quality measurement of water entering and exiting the natural treatment system to determine the pollutant load reduction
Pollutant load reduction of the flows exiting the natural wetland treatment system as compared to the pollutant concentration measured at the diversion structure
Water quality sampling and testing
Pollutant load reduction for treated water to levels suitable for non-potable water use for irrigation and recharge

Attachment 6 Performance Measures
Project goals Desired outcomes Output indicators Outcome indicators Measurement tools
and methods Targets
(d)
Recharge of Groundwater
Allow infiltration of excess treated runoff to be used for recharge into the existing aquifer through storage in the restored natural lake facility and also facilitate saltwater intrusion
Groundwater levels measured in monitoring wells within the vicinity of the project area and monitoring adjacent lake water levels
Increased level of the upper aquifer measured from the groundwater monitoring wells as well as the groundwater water quality
Installation of monitoring wells and groundwater sampling and testing. Hydraulic conductivity testing for infiltration
Increased groundwater levels above existing baseline conditions and water quality
(e)
Creation and Restoration of
Riparian/Aquatic Habitat
Restoring wetlands treatment trains will provide riparian habitat in areas that are degraded as well as restored functional lake system for aquatic habitat with year round permanent pool
Amount of quality riparian habitat compared to existing conditions and the ability to maintain year round functional lake system
Increased amount of quality riparian habitat compared to the existing baseline conditions as well as the establishment of the year round lake system
Habitat Mitigation and Monitoring Plan that will include Photographic monitoring, Bio-surveys of the restored park system, and annual reporting
Restored habitat of 8 to 14 acres including the resorted permanent lake system
(f)
Reduction of trash and debris to
receiving waters
Eliminate a significant amount of the floatable debris and trash delivered by the urban flows to the downstream sensitive habitat coastal wetland habitat and beaches
Amount of trash collected at the channel diversion structure
Any Volume of trash collected correlates to a reduction of floatable debris pollutants to the downstream receiving waters
Volume of trash removed from diversion structure through maintenance activities using weigh tickets for transport equipment used in those operations
Reduce floatable trash to receiving water regulatory objectives in the Basin Plan
(g)
Public Education on Stormwater Pollution and
Prevention
Interpretative areas within the natural treatment system for public education on stormwater pollution and treatment as well as watershed protection
Increased public awareness through increased public activity at the central park with the installation of the facilities
Increased use and attendance of the central park based on the restoration elements ensures that some of the public will use the interpretative education trails and signage about the watershed
Average daily usage counts by park rangers
Increased public attendance or use in the park above current levels

Attachment 6 Performance Measures
Project (d) Romoland Line A Flood System
Project Performance Measures Table
Project goals Desired outcomes Output indicators Outcome indicators Measurement tools
and methods Targets
(a) Capture up to 1,785 acre-feet of annual rainfall flows (100 year frequency storm)
Decrease downstream flooding
Reduce flooding of drainage basin. Levels of water storage in new detention basins
Reduced flooding of basin. Reduced storm water flows
Storage-Depth table together with depth measurement pole in basins. Detention Basin outflow recorder.
Reduce flows downstream by 80%, Capturing 10 frequency storm.
(b)
Reduce top soil erosion and pollutants
Decreased erosion and pollutants
Reduction of downstream erosion, damage and flooding
Decrease in cleanup activity. Decrease in storm effects to Canyon Lake.
Pollutants are measured for the SARWQCB by RCFC&WQD upstream of Canyon Lake.
Reduce pollutant loads (nitrogen & phosphorous) by 5-10%
(c)
Provide 400 acre-feet of additional storage capacity
Increase in stormwater storage capacity
Calculated increase in capacity of basins
Storage volume records
Calculation of total detention from as-built topographic maps.
Excavate detention basins below design depth to provide 400 acre-feet of additional storage
(d)
Remove up to 500,000 tons of silt and debris
Decreased silt and debris is San Jacinto River and Canyon Lake.
Debris buildup in basins
Measure and Record silt and debris buildup in detention basins and downstream.
Amount of debris removed from basin, visual assessment of local bodies of water
Clean basins of 50,000 tons of silt and debris annually, increase period between dredging of Canyon Lake by 20+ years.

Attachment 6 Performance Measures
Project goals Desired outcomes Output indicators Outcome indicators Measurement tools
and methods Targets
(e) Provide flood control protection for existing public facilities and property
Flood protection for Heritage High School, fire station, Edison substation, homes, businesses
Water levels in basins during large scale storm events, storm water flows
LOMAR for FEMA flood plain mapping for surrounding areas
Measurement pole in basins, flow pipe mounted in stormwater collectors, FEMA flood maps
Noticeable level increase in groundwater near basins.
(f) Recharge local groundwater with up to 1,785 acre-feet annually
Increased water supply
Water levels in area wells
Increase in potable water supply from nearby wells
Supply of local groundwater reported by EVMWD. Provide Vantage Pro2 Weather Station at Heritage HS.
Calculation of ground water supply increase from water level decrease in basins corrected for evapotransportation.
(g) Create 865 acres of parks and open space and trail system
Increased availability of recreational facilities
Availability of recreational facilities
Use by local residents of recreational facilities
Final construction approval and facility dedication, local survey of recreation use
Record new park area and length of new trails along connecting channel.
(h) Facilitate development and provide permanent jobs
Decreased unemployment and poverty rate
Ongoing economic impact study results
Decreased unemployment for Homeland/Romoland subareas of EDA statistics
Monthly EDD jobs report for the Homeland and Romoland CDPs
10% increase in employment in Homeland and Romoland CDPs by Year 2

Attachment 6 Performance Measures
Project (e) Santa Ana Watershed Vireo Monitoring Project Performance Measures Table
Project goals Desired
outcomes Output indicators Outcome indicators
Measurement tools and methods
Targets
(a) Attempt to document all vireo territories in the Santa Ana Watershed and monitor nesting in the major vireo subpopulations.
Develop and compare data on the abundance and distribution of the vireo. Report data to USFWS and CDFG which will assist with planning for development of projects, mitigation, habitat restoration, recreational development, public works projects and commercial and residential development.
Seven full-time biologists and 2 half-time SAWA biologists document vireo locations with GPS at over 50 sites. At times, SAWA biologists are assisted by field assistants and staffs of cooperating agencies. Major monitored sites include the Santa Ana River at Norco, Riverside, and the Santa Ana Canyon, the San Jacinto River, Mockingbird Canyon, Santiago Canyon at Irvine Regional Park. SAWA biologists determine breeding status and monitor nests at each site. SAWA biologists document nest contents, e.g., numbers of eggs and nestlings, and cowbird eggs are removed. Biologists monitor nests once a week until fledging occurs. Peripheral habitat sites are visited 3 times each season to gather data as above.
SAWA biologists report data that include number of territories, number of pairs, number of breeding pairs, number of observed fledglings, number of nests, number of eggs, number of nests tracked, nesting success, reasons for nest failure as percentage of nests failed due to reproductive failure, parasitism, or depredation, cowbird parasitism rate, reproductive success, projected recruitment of young, clutch size, number of cowbird eggs and cowbird nestlings in nests, number of manipulated nests (nests from which cowbird eggs were removed), number of vireo young fledged from manipulated nests, number of repaired nests and number of vireos fledged from repaired nests. SAWA biologists document nesting substrate by plant species.
Changes in abundance year - to year, changes in reproductive success year to year, changes in predation, parasitism, netting success rates. Changes in distribution are followed with GIS mapping.
Monitoring coverage of major population centers of the vireo as the vireos increase or decrease in numbers. Monitoring coverage of new areas of occupancy as population grows in the watershed.

Attachment 6 Performance Measures
Project (f) Mill Creek Wetlands Project Performance Measures Table
Project goals
Desired outcomes Output indicators Outcome indicators Measurement tools
and methods Targets
(a) Ensure High Quality Water
Improve the water quality of Mill Creek during both wet- and dry-weather conditions
1. Increase in wet- and dry-weather flow treated 2. Reduction of wet- and dry-weather priority pollutant concentrations (priority pollutants include fecal indicator bacteria, nutrients and TSS)
1. Compliance with NPDES permit requirements
1. Modeled dry-weather flow capture efficiency (AF/yr) based on as-built design. 2. Modeled wet-weather flow capture efficiency (AF/yr) based on as-built design. 3. Water quality monitoring - Influent and effluent water quality for priority pollutants including fecal indicator bacteria, nutrients and TSS 4. Water quantity monitoring to estimate volumetric losses from the wetland system
1. Treatment of at least 20% of annual dry-weather flow from watershed on average 2. Treatment of at least 10% of annual wet-weather runoff from watershed on average 3. Post-project priority pollutant concentrations and loads that are consistently lower than pre-project conditions.

Attachment 6 Performance Measures
Project goals
Desired outcomes Output indicators Outcome indicators Measurement tools
and methods Targets
(b) Preserve and Enhance the Environment
Enhance and expand habitat for protected and endangered species and utilize sustainable design practices
1. Increased habitat area 2., 3. Gravity-flow design
1. Increase in wildlife and endangered species use 2. Conserved energy 3. Conserved GHG emissions
1. Map total acres of habitat for project once built. 2. Monitor energy usage Compare to Project alternative that would be built in its place. 3. Monitor energy usage to calculate greenhouse gas emissions.
1. Wildlife and endangered species habitat shall comprise 50% of the total project footprint. 2. Energy usage of less than 55,000 kWh/yr 3. Greenhouse gas emissions less than 15 tons CO2-eq/yr
(c) Improve Regional Integration and Coordination
Meet multiple regional goals that span across jurisdictional boundaries
1. Involvement of multiple jurisdictions and agencies in Project planning and funding.
1. Increased regional integration through collaboration of multiple agencies on other regional efforts.
1. Quantify the number of jurisdictions/agencies which participate in the planning and funding process for the Project. 2. Quantify the number of regional planning efforts which claim benefit from the Project.
1. Get involvement from at least five different stakeholders 2. Support five regional efforts

Attachment 6 Performance Measures
Project goals
Desired outcomes Output indicators Outcome indicators Measurement tools
and methods Targets
(d) Provide Recreational Opportunities
Enhance trail access and encourage environmental awareness
1. Increase in trail access 2. Increase in trail mileage
1. Increase in regional recreational use 2. Increase in educational recreational opportunities
1. Quantify the number of additional trail access points. 2. Quantify the additional trail miles 3. Quantify the number of educational recreational opportunities (i.e. interpretive signage, wildlife viewing vistas, interactive educational kiosks).
1. Provide 2 additional trail access points 2. Provide greater than 2 miles of additional trails. 3. Support at least 50 visits per day by providing greater than 2 miles of additional trails. 4. Support education by providing at least 5 additional educational recreational opportunities.
(e) Provide Economically Effective Solutions
Leverage water quality benefits associated with project costs
1. Increase in water treated by regional treatment system over local treatment system
1. Compliance of multiple jurisdictions with NPDES permit requirements 2. Improved TMDL compliance for multiple jurisdictions.
1. Modeled capture efficiency (AF/yr) based on as built design. Verification through flow monitoring into and through system. 2. Downstream TMDL Compliance sampling.
1. Treatment of at least 200% more wet- and dry-weather runoff than a project sited locally.

Attachment 6 Performance Measures
Project goals
Desired outcomes Output indicators Outcome indicators Measurement tools
and methods Targets
(f) Promote Sustainable Water Solutions
Encourage sustainable design
1. Gravity-driven design 2. Solar-powered parking lot lights
1. Conserved GHG emissions
The measurement tools and methods of emitting less than 15 tons of CO2-eq/yr for "Promote Sustainable Water Solutions" is described above under the Preserve and Enhance the Environment goal.
The target of emitting less than 15 tons of CO2-eq/yr for "Promote Sustainable Water Solutions" is described above under the Preserve and Enhance the Environment goal.
(g) Maintain Quality of Life
1. Encourage the cooperative and balanced management of resources. 2. Improve the water quality of Mill Creek during both wet- and dry-weather conditions 3. Enhance and expand habitat for protected and endangered species and utilize sustainable design practices 4. Enhance trail access and encourage environmental awareness
1. Increase the number of individuals that are educated on resource management. 2. Increase in wet- and dry-weather flow treated 3. Reduction of wet- and dry-weather priority pollutant concentrations (priority pollutants include fecal indicator bacteria, nutrients and TSS) 4. Increased habitat area 5. Gravity-driven design 6. Solar-powered parking lot lights 7. Increase in trail access 8. Increase in trail mileage
1. Increase in public sense of environmental stewardship. 2. Improved water quality 3. Compliance with NPDES permits 4. Increase in endangered species habitat usage. 5. Conserved energy 6. Conserved GHG emissions 7. Increase in regional recreational use. 8. Increase in educational recreational opportunities
The multiple measurement tools and methods for "Maintain Quality of Life" are described above under the following goals: - Ensure High Quality Water - Preserve and Enhance the Environment - Provide Recreational Opportunities
The multiple targets for "Maintain Quality of Life" are described above under the following goals: - Ensure High Quality Water - Preserve and Enhance the Environment - Provide Recreational Opportunities

Attachment 6 Performance Measures
Additional Narrative – Monitoring, Assessment, and Performance Measures The goals of the Cucamonga Creek Watershed Regional Water Quality Project (Project) are to ensure the creation of high quality water, preserve and enhance the environment, improve regional integration and coordination, provide recreational opportunities, provide economically effective solutions, promote sustainable water solutions, and together these will help to maintain quality of life. The performance measures to be used to verify Project performance towards meeting these goals are detailed in the performance measures table and summarily described below.
The measurement tools and methods supporting the creation of high quality water include both modeling and monitoring. Hydrologic modeling will be conducted to support design and estimate water quality/quantity benefits (i.e., capture and treatment volumes; monitoring will conducted to verify water quality improvement – both with respect to concentrations and volumetric reductions realized by the system. Flow monitoring will consist of flow estimates and water quality monitoring limited to grab samples of constituents of concern (i.e., impairments and/or indicator constituents).
Ensure High Quality Water
The measurement tools and methods for this Project goal includes Project maps once constructed, and the monitoring of energy usage for daily Project operations. The Project maps will clearly delineate habitat by type for the Project, with areas highlighted as habitat for endangered species.
Preserve and Enhance the Environment
As currently designed, there will be no pumping involved in daily operations so there will be no monitoring of energy use for the Project. Should final designs warrant the use of small pumps, then a meter will be installed to monitor the energy usage and GHG emissions will be calculated by multiplying kWh by 0.542 pounds CO2-eq/kWh (EPA, 2010).
As the Project is developed, participation by multiple stakeholders will be solicited and encouraged. The primary stakeholders include: 1) City of Ontario, 2) City of Chino, 3) County of San Bernardino,4) the Inland Empire Utilities Agencies, 5) the Orange County Water District, and 6) the United States Army Corps of Engineers. As well, during development, construction, and long-term operation the Project team will review the following Regional efforts for consistency: 1) One Water One Watershed Integrated Regional Water Management Plan, 2) the USACE Prado Basin Master Plan, 3) The Chino Preserve Specific Plan, 4) The City of Chino Urban Buffer Plan trail connections, 5) The County of San Bernardino planned future trail connections, 6) Regional Water Quality Control Board water quality objectives, and 7) the intent of the storm water run-off provisions of the Clean Water Act.
Improve Regional Integration and Coordination
The measurement tool for this Project goal includes Project maps once constructed. The Project maps will clearly delineate trail access points and total trail miles. As well, the Project maps will clearly highlight the types and locations of educational recreational opportunities such as interpretive signage, wildlife viewing vistas, and interactive educational kiosks.
Provide Recreational Opportunities
The measurement tools and methods substantiating the economics of the solutions include both modeling and monitoring. Hydrologic modeling will be conducted to support design and estimate water quality/quantity benefits (i.e., capture and treatment
Provide Economically Effective Solutions

Attachment 6 Performance Measures
volumes; this will be compared with Non-Project conditions. Monitoring will conducted to verify water quality improvement – both with respect to concentrations and volumetric reductions realized by the system. Flow monitoring will consist of flow estimates and water quality monitoring limited to grab samples of constituents of concern (i.e., impairments and/or indicator constituents).
The measurement tools and methods of monitoring GHG emissions is described above under the Preserve and Enhance the Environment goal.
Promote Sustainable Water Solutions
The multiple measurement tools and methods for this goal are described above under the following goals: Ensure High Quality Water; Preserve and Enhance the Environment; and Provide Recreational Opportunities.
Maintain Quality of Life
The data produced by the Projects monitoring plan will be used to show how the Project helps to meet the overall goals and objectives of the IRWM Plan. Water quality data will be compiled to clearly quantify how the Project helps to meet the IRWM Plan Objective to Ensure High Quality Water for All Users, specifically to attain water quality standards in fresh and marine environments, to match water quality with intended use, and to protect and improve source water. Project maps will quantify how the Project helps to meet the IRWM Plan Objective to Preserve and Enhance the Environment, specifically to protect and enhance the ecological function of open space and to protect and enhance water-related habitats. Additionally, Project maps will quantify how the Project helps to meet the IRWM Plan Objective to Preserve Open-Space and Recreational Opportunities, specifically to increase opportunities for recreation and open-space and to provide useable open-space for all residents of the watershed. Together, these data, along with the other Project benefits of regional coordination, on-going maintenance to remove invasive species, and the overall project design should help to meet the IRWM Plan Objective to Maintain Quality of Life.

Attachment 6 Performance Measures
Project (g) Cactus Basins
Project Performance Measures Table
Project goals Desired outcomes Output indicators Outcome indicators Measurement tools
and methods Targets
(a)
Reduce peak flows within the Rialto Storm Drain System
100 year storm protection for the residents and businesses within the Rialto Storm Drain System.
Once the Cactus Basin No. 3 project is completed, the facility will have a capacity of 567 AF and will output a 100 years storm peak flow of 1177 CFS.
Under current conditions, Cactus Basin No. 3 has a capacity of 150 AF and a 100 year storm peak output a flow of 8215 CFS; once the proposed improvements are constructed the capacity will increase by 417 AF and the peak flows will be reduced by 7038 CFS.
Determination of system capacity based on engineering principles and facility dimensions and geometry.
100 year storm protection for the residents and businesses within the Rialto Storm Drain System when all project are constructed to ultimate condition.
(b)
Groundwater recharge
Provide an increased and reliable water source.
Water purveyors utilize the District's facilities for groundwater recharge purposes. The purveyors employ their own methods to actual recharge amounts.
In its current interim condition, Cactus Basin No. 3 does not provide groundwater recharge capabilities. Any recharge as a result of the project will be a net increase in the basin's recharge capacity.
Water purveyors utilize the District's facilities for groundwater recharge purposes. The purveyors employ their own methods to actual recharge amounts.
Per the 1988 EIR, the annual recharge capacity for Basins 3-5 is estimated at 35,000 acre feet per year. Given the relative areas of Basins 3 and 3A, the recharge capacity of the project is estimated to be 12,000 acre-feet per year.

Attachment 6 Performance Measures
Project goals Desired outcomes Output indicators Outcome indicators Measurement tools
and methods Targets
(c)
Ecosystem Restoration
Provide on-site ecosystem for various flora and fauna.
Part of the construction scope is to re-vegetate 0.8 acres of on-site land using native plant material.
The last use of the subject site was as a quarry. Any increase in ecosystem restoration will be a net increase in available ecosystem at the project site.
Part of the construction scope is to re-vegetate 0.8 acres of on-site land using native plant material.
Revegetation of 0.8 acres of on-site land.
(d)
Environmental Mitigation
Provide perpetual habitat off-site of the project.
Per the environmental conditions of the project, the District will reserve 40 acres of mitigation land to be utilized in perpetuity as habitat.
Prior to setting aside as mitigation land, the off-site property may have been subject to development. As a result of the project conditions, the land will remain in its natural, undisturbed state.
Per the environmental conditions of the project, the District will reserve 40 acres of mitigation land to be utilized in perpetuity as habitat.
Provide 40 acres of off-site mitigation land to remain in its natural, undisturbed state in perpetuity.
Attachment 6 Performance Measures
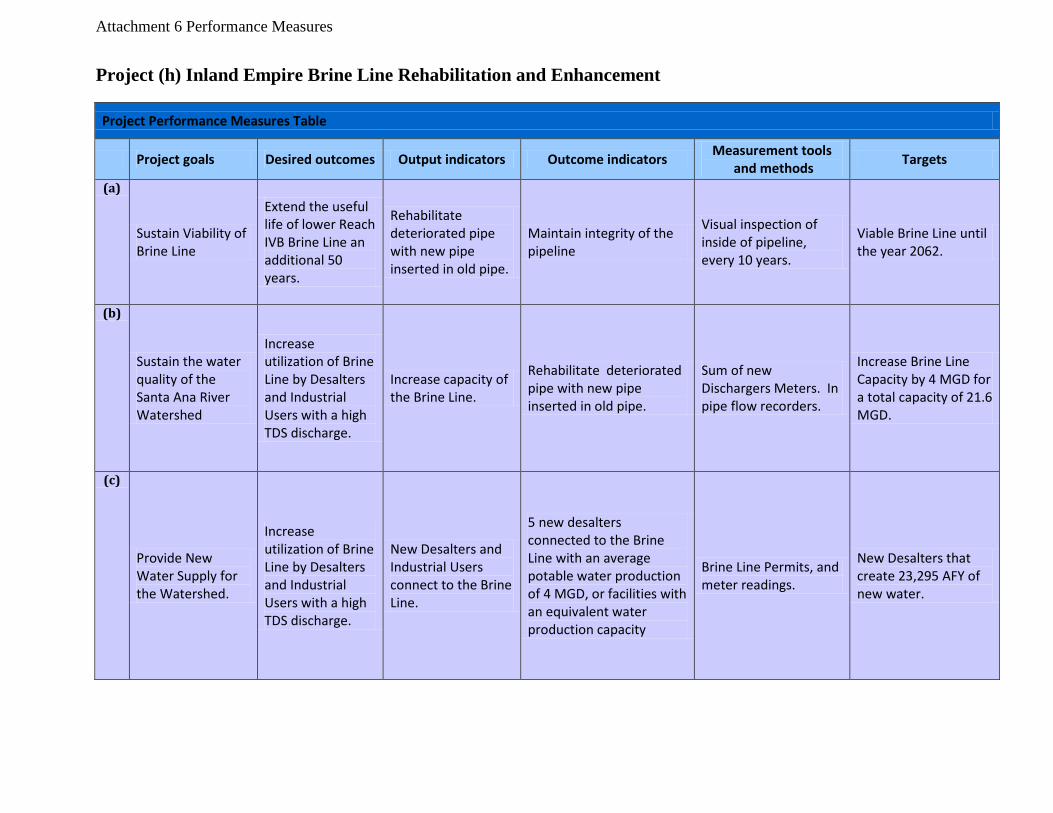
Project (h) Inland Empire Brine Line Rehabilitation and Enhancement
Project Performance Measures Table
Project goals Desired outcomes Output indicators Outcome indicators Measurement tools
and methods Targets
(a)
Sustain Viability of Brine Line
Extend the useful life of lower Reach IVB Brine Line an additional 50 years.
Rehabilitate deteriorated pipe with new pipe inserted in old pipe.
Maintain integrity of the pipeline
Visual inspection of inside of pipeline, every 10 years.
Viable Brine Line until the year 2062.
(b)
Sustain the water quality of the Santa Ana River Watershed
Increase utilization of Brine Line by Desalters and Industrial Users with a high TDS discharge.
Increase capacity of the Brine Line.
Rehabilitate deteriorated pipe with new pipe inserted in old pipe.
Sum of new Dischargers Meters. In pipe flow recorders.
Increase Brine Line Capacity by 4 MGD for a total capacity of 21.6 MGD.
(c)
Provide New Water Supply for the Watershed.
Increase utilization of Brine Line by Desalters and Industrial Users with a high TDS discharge.
New Desalters and Industrial Users connect to the Brine Line.
5 new desalters connected to the Brine Line with an average potable water production of 4 MGD, or facilities with an equivalent water production capacity
Brine Line Permits, and meter readings.
New Desalters that create 23,295 AFY of new water.

Attachment 6 Performance Measures
Project goals Desired outcomes Output indicators Outcome indicators Measurement tools
and methods Targets
(d)
Sustain the water quality of the Santa Ana River Watershed
Remove Salt from the Watershed.
Increase capacity of the Brine Line. New Desalters and Industrial Users connect to the Brine Line.
5 new desalters connected to the Brine Line with an average potable water production of 4 MGD, or facilities with an equivalent water production capacity
Water Quality Sampling of Brine Entering Brine Line.
30,000 tons/year of salt removed from watershed.
(f)
Protection of the environment
Reduce the risk of a catastrophic failure of the SARI line as it comes to the end of its useful life.
Rehabilitate deteriorated pipe with new pipe inserted in old pipe.
No catastrophic failures. Sanitary Sewer Overflow documentation.
Zero catastrophic failures of the Brine Line.

Attachment 6 Performance Measures
Project (i) Arlington Desalter Interconnection Project
Project Performance Measures Table
Project goals Desired outcomes Output indicators Outcome indicators Measurement tools
and methods Targets
(a)
Link existing water sources to improve regional water reliability
A two-way inter-tie that will allow Corona and Western to receive water from one another
10mgd exchange capacity Corona/10 mgd exchange capacity WMWD
Actual mgd exchanged in either direction
SCADA System
Exchange of water at least 10 days annually.
(b)
Decrease reliance on State Water Project Supplies and Colorado River Water
Lower cost of water purchased
Acre Feet
Rate +/- as compared to Metropolitan Water District's Tier 2 Rate
Water Bills
10% less wholesale rate between the two parties as compared to MWD's Tier 2 wholesale rate
(c)
Improve water quality Decreased TDS levels in Corona's water
TDS Levels TDS level increase/decrease
Water Quality testing
Avoided water quality compliance fine fees

Attachment 6 Performance Measures
Project (j) Perris II Desalination Facility Project Performance Measures Table
Project goals Desired outcomes Output indicators Outcome indicators
Measurement tools
and methods Targets
(a) Enhance EMWD’s drought preparedness portfolio by decreasing dependence on imported water
Decrease of imported water quantity by approximately 700 AF/yr
Well production delivered to desalter
Well production of approximately 1000 AF/yr
Wellhead flow meter logs 1000 AF/yr
(b)
Enable continued use of recycled water by providing TIN/TDS offset
ReduceTIN/TDS in the Lakeview/Hemet North Groundwater Management Zone by roughly 2,000 tons/yr of salts and 8.5 tons/yr of Nitrate
Well production delivered to desalter
Well production of approximately 1000 AF/yr
Wellhead water quality measurements, wellhead flow meter logs
2000 tons/yr salts 8.5 tons/yr Nitrate
(c) Conserve State Water Project (SWP) Water from Bay-Delta
Decrease of imported water quantity by approximately 700 AF/yr
Well production delivered to desalter
Well production of approximately 1000 AF/yr
Wellhead flow meter logs 1000 AF/yr
(d) Generate new water supply for disadvantaged communities
Produce approximately 1000 AF/yr of treatable groundwater
Well production delivered to desalter
Well production of approximately 1000 AF/yr
Wellhead flow meter logs 1000 AF/yr
(e) Increase efficient use and reuse of local water resources
Produce approximately 1000 AF/yr of treatable brackish groundwater
Well production delivered to desalter
Well production of approximately 1000 AF/yr
Wellhead flow meter logs 1000 AF/yr
(f) Address exceedances of primary MCLs for Nitrate and Perchlorate
Compliance with Nitrate and Perchlorate standards after desalter treatment
Well production delivered to desalter
Compliance with Primary MCLs
Consumer Confidence Reports (CCRs)
Nitrate-N < 10 mg/L Perchlorate < 6 µg/L after treatment
(g) Reduce TDS in the Lakeview/Hemet North Groundwater Management Zone
Reduce TDS in the Lakeview/Hemet North Groundwater Management Zone by roughly 2,000 tons/yr of salts and 8.5 tons/yr of Nitrate
Well production delivered to desalter
Well production of approximately 1000 AF/yr
Wellhead water quality measurements, Wellhead flow meter logs
2000 tons/yr salts 8.5 tons/yr Nitrate

Attachment 6 Performance Measures
Project goals Desired outcomes Output indicators Outcome indicators
Measurement tools
and methods Targets
(h) Reduce migration of brackish groundwater into areas of potable groundwater production
Extract and treat approximately 1000 AF/yr of brackish groundwater
Well production delivered to desalter
Well production of approximately 1000 AF/yr
Wellhead flow meter logs 1000 AF/yr

Attachment 6 Performance Measures
Project (k) Perchlorate Wellhead Treatment System Pipelines
Project Performance Measures Table
Project goals Desired outcomes Output
indicators Outcome indicators
Measurement tools and methods
Targets
(a) Restore water supply
The Project will restore water
supply lost due to water quality
impairment and decrease reliance
on imported water. The amount of
water supply to be restored is 4,302 AF/yr, or over 30 years (the life of
the project), approximately
129,000 AF.
Additional acre-feet of water
supply
Reclaim operational
flexibility / the ability to
provide a safe and reliable local water
source
The Project is focused on returning two wells to service that have been idled due to groundwater contamination. The two wells are Rialto Well #6 and District Well #11. As estimated in the Rialto's and the
District's UWMPs, respectively; (Attachments 2A (Table 2-2) and 2B (Table 2-3)), these wells combined
(assuming 16 hour per day production), are capable of producing approximately
4 MGD (4,475 af/year). The Project Pipeline has been designed to handle
4,000 gpm (3.8 MGD), or 4,302 AF/year (assuming 16 hours per day operations)
(as described in the CEQA document and Proposition 84 DPH Grant Application
documents, Attachment 2C and Attachment 2D). While the useful life of the Project Pipeline is expected to be 50
years, the Project is expected to be running for at least 30 years. Given a
pipeline capacity of 4,302 AF/yr equates to a total water supply from the project
of 129,060 AF that otherwise would remain un-usable, without the Project
and without the treatment.
The Project will restore water supply lost due to
water quality impairment and decrease reliance on
imported water. The amount of water supply to be restored is 4,302 AF/yr, or over 30 years,
approximately 129,060AF.

Attachment 6 Performance Measures
Project goals Desired outcomes Output
indicators Outcome indicators
Measurement tools and methods
Targets
(b)
Water Quality/Salt Managemen
t Benefits
The Project will provide water
quality benefits related to: The
numerical mass of salt/contaminants removed which is estimated to be approximately 3,300 tons of
perchlorate/nitrate destroyed.
water quality testing of
treated water
A reduction in the
contaminant levels in
groundwater sampling
measurements
The two contaminated wells have different water chemistries, and by
multiplying the contaminant mass by the flowrates/volume to be treated, the result is the estimate of average mass
removal of approximately 110 tons per year of contaminants. The estimate
comes from a conservatively-low pumping rate of 2,000 gpm, and a blend
of 90% and 10% each of the following water quality from the two
contaminated wells - Rialto No. 6 and District No. 11, and rounded down to
110 from 114 tons/year.
It is estimated that the amount of targeted salt-contaminants removed
annually due to this Project will be
approximately 110 tons, while over the 30 year
minimal life of the project, this will equate to approximately 3,300
tons of targeted salt-contaminants that will be
removed from the groundwater and destroyed by the
fluidized-bed bioreactor (FBR) treatment system.
(c)
Water Quality/Salt Managemen
t Benefits
The Project will provide water
quality benefits related to: The
numerical mass of salt/contaminants removed which is estimated a total
salts load of 12,000 tons removed from the groundwater.
water quality testing of
treated water
A reduction in the
contaminant plume mass
For a total-salts removal estimation, the total dissolved solids (salts)
concentrations for the two wells have been averaged, given they are relatively similar. In 2009, the average TDS values
for Rialto Well No. 6 and WVWD Well No. 11 were reported as 230 and 310 mg/L, respectively. Given a combined
average concentration of 270 mg/L, and an estimated flowrate of 2,000 gpm
following the methodology discussed above yields a total salt mass of 1,200 tons per year, or 36,000 tons over 30
years. Assuming a conservative 30 percent of this well water is consumed
indoors as wastewater, then the amount of salt reduction from this Project would
be 30% of 36,000 tons or 12,000 tons.
Given a combined average concentration of
270 mg/L, and an estimated flowrate of
2,000 gpm yields a total salt mass of 1,200 tons
per year, or 18,000 tons over 30 years. Assuming
a conservative 30 percent of this well water
is consumed indoors as wastewater, then the
amount of salt reduction from this Project would
be 30% of 36,000 tons or 12,000 tons of TDS
reduction.

Attachment 6 Performance Measures
Project goals Desired outcomes Output
indicators Outcome indicators
Measurement tools and methods
Targets
(d)
Reduction of greenhouse
gas emissions achieved
A substantial energy savings of 1,812 metric tons of CO2 annually can be seen by
implementing this Project.
power invoices from District
and Rialto
power invoices from District and
Rialto
To estimate the reduction in greenhouse gases (GHGs) created by the Project, the
emissions generated to treat contaminated groundwater (the Project)
were compared with those to deliver SWP imported water for the same end
use. The documentation for the quantifiable climate change benefits is contained in the CEQA documentation
on the emissions. Also, 2008 Water Environment Federation (WEF)
magazine article "Hidden Potential Recycled Water and the Water - Energy -
Carbon Nexus" written by Kennedy/Jenks using Inland Empire
Utilities Agency for an example was used as a reference to estimate GHGs.
A substantial energy savings of 1,812 metric
tons of CO2 annually could be seen by
implementing this Project.

Attachment 6 Performance Measures
Project (l) Chino Creek Wellfield Development
Project Performance Measures Table
Project Goals Desired
Outcomes Output Indicators Outcome Indicators Measurement Tools and
Methods Targets
(a)
Manage groundwater quality in Chino Basin
1. Improve groundwater quality management in Chino Basin
1. Construction of facilities to pump water from the Chino Basin
2. Connection of wells to Chino desalters
1. TDS and nitrate levels in water delivered to the Chino I or Chino II desalter from the Chino Creek Wellfield
1. TDS and nitrate levels in water delivered to desalters from the Chino Creek Wellfield
1. Manage Chino Basin groundwater quality per Chino Desalter Authority agreements (NO3 less than 25 mg/L, TDS less than 350 mg/L).
(b)
Manage groundwater levels in the Chino Basin
1. Protect downstream water quality in Santa Ana River
1. Construction of facilities to produce water from the Chino Basin
1. Quantification in changes in groundwater levels
1. Regular groundwater level monitoring
1. Decrease in groundwater overflow from Chino North Management Zone to Santa Ana River
(c)
Increase flexibility and reliability of supply sources for the Chino I and Chino II desalters
1. Increase local supplies by 2,900 afy
1. Construction of facilities to produce, covey and treat local groundwater
1. Quantification of raw water deliveries to Chino Basin desalters
1. Metered raw water deliveries to Chino Basin desalters
1. Increase Chino Desalter Authority deliveries to City of Ontario, Western and Jurupa Community Services District by 2.6 mgd.
Additional Narrative – Monitoring, Assessment, and Performance Measures Specific goals of the Chino Creek Wellfield, Wells 1, 2, and 3 are to:
• Manage groundwater quality in the Chino Basin
• Manage groundwater levels in the Chino Basin
• Increase flexibility and reliability of supply sources for the Chino I and Chino II desalters The desired outcomes of this project are to:
• Improve groundwater quality management in Chino Basin
• Protect downstream water quality

Attachment 6 Performance Measures
• Increase local supplies
The table below provides specific information on performance measures and measuring systems that will be used to verify project performance. In order to measure the project’s impact on water quality, the quality of raw water from the wells, as well as the quality of water from the Chino I desalter will be monitored and compared. Specific parameters for measurement include total dissolved solids (TDS) and nitrates (in the form NO3). Management of groundwater levels, so as to prevent overflow of contaminated groundwater to the Santa Ana River, will be measured using a system already in place and utilized by the Chino Basin Watermaster. The Chino Basin Watermaster conducts semi-annual data downloads from 60 wells with pressure transducers, the results of which are recorded in a semi-annual report to the Regional Water Quality Control Board. Groundwater levels will be compared both before and after Wells 1, 2, and 3 go into operation. Groundwater produced at the Chino Creek Wellfield Wells 1, 2, and 3 will be conveyed to Chino Desalter I. The capacity of Desalter I will not be increased; rather the volume of groundwater pumped at existing Desalter I wells 13, 14, and 15 and presently conveyed to Desalter I, will be reduced and this water redirected to Chino Desalter II. Construction is underway to increase the treatment capacity of Chino Desalter II from 10,400 acre-ft/yr to about 21,000 acre-ft/yr (expansion of the Chino Desalter is not a part of the proposed Proposition 84 grant project, but is being undertaken using other federal, state, and local funds). The increase in groundwater pumping to serve the expanded Chino Desalter II will come in part from connection to Desalter I wells 13, 14, and 15. Therefore, in order to measure the increase in water supplies from the Chino Creek Wells 1, 2, and 3, it is necessary to measure raw water deliveries to both the Chino I and Chino II desalters.

Attachment 6 Performance Measures
Project (m) Impaired Groundwater Recovery Project Performance Measures Table - Irvine Ranch Water District Wells 21 and 22 Project
Project goals Desired
outcomes Output indicators
Outcome indicators
Measurement tools and methods
Targets
(a) Preliminary Design Report
Design completed
1) Provided input on design; 2) Final design represents the optimal pipeline alignment, wellhead equipping, and treatment processes
1) Refinements to design; 2) operation criteria for project
Project Alternatives Analysis (Preliminary Design Report, March 2010)
Build project in accordance with design by December 2011
(b) Construct Project 1) Project constructed; 2) As-Built drawings completed; 3) QA objectives met in construction
1) Notice to proceed and bid award to contractors; 2) Permits obtained from Dept of Public Health, city of Tustin, County of Orange, Orange County Sanitation District, Railroad Encroachment, Regional Water Quality Control Board; 3) Daily construction inspections completed; 4) Photo-documentation of completion; 5) Progress reports submitted as required
1) Start-up of project; 2) volume of flow treated; 3) Data and experience on operation of treatment plant; 4) Final report as required
1) Construction Project Manual, Design & Specifications; 2) Inspection reports with photo-documentation
Project constructed in accordance with design and specifications to produce water supply that meets water quality objectives

Attachment 6 Performance Measures
Project goals Desired
outcomes Output indicators
Outcome indicators
Measurement tools and methods
Targets
(c) Operation and maintenance to demonstrate the effectiveness of treatment for removal of total dissolved solid (TDS) and nitrate levels
1) TDS and nitrates will be measured via quarterly and monthly samples at designated sample points; 2) decreased TDS and nitrate levels in finished water
1) Operation and Maintenance Manual; 2) Progress reports submitted as required including collected data for the duration; 3) data evaluated during operation
1) Approved Operation and Maintenance Plan; 2) Verified water quality data
1) Log maintained of operations and maintenance activities; 2) Equipment manual; 3) Real-time automated data collection for flow; 4) Performance Monitoring Plan
1) Operation of project for one year; 2) Demonstrate effectiveness of membranes and treatment system; 3) Cost-effective operation of the project; 4)Target Reporting Limits reported per the SWAMP guidelines
(d) Performance Monitoring Plan and water quality analysis
1) Demonstrate implementation of effective treatment technology to achieve removal of TDS and nitrate
1) Development of Performance Monitoring Plan; 2) Meters in place; 3) Collected water samples baseline and post construction; 4) Laboratory analysis of samples; 5) Analysis of TDS and nitrate concentrations in finished water; 6) Progress reports submitted as required
1) Approved Monitoring Plan; 2) collection of data in accordance with Performance Monitoring Plan; 3) Reduction in TDS and nitrate concentration in finished water
1) Samples collected from sampling taps at designated sample collection locations; 2) Product water collected from finished water and waste brine flows; 3) Laboratory methods for TDS and nitrate; 4) Finished product water monitored for Title 22 compliance
1) Complete water quality data collection during project timeline; 2) data collected meets Monitoring Plan objectives; 3) TDS and nitrate levels fall within the acceptable range for the established Maximum Contaminant level in the finished water
(e) Draft and Final Project Report
1) Effectiveness of Wells 21 and 22 treatment plant process in removing TDS and nitrate in finished water
1) TDS and nitrate levels in finished water; 2) volume of flow treated; 3) pounds per day of TDS and nitrate removed per volume of water treated.
1) Volume of flow treated; 2) Reduction in TDS and nitrate concentration in finished water
1) Laboratory methods for total dissolved solids and nitrates; 2) finished product water monitored for Title 22 compliance; 3) Real-time automated data collection for flow
1) TDS and nitrate levels fall within the range for the established Maximum Contaminant Level in the finished water supply