attachment a port of los angeles trapac federal action ... · a pola conformity memo final.doc...
TRANSCRIPT
Final General Conformity Determination
A A-1 Berth 136-147 [TraPac] Container Terminal Project
Attachment A
Port of Los Angeles TraPac Federal Action General Conformity Calculation Methodology and Results

A
POLA Conformity Memo Final.doc
Memorandum To: John Pehrson From: Katie Travis Date: 3/12/09 Subject: Port of Los Angeles TraPac Federal Action General Conformity
Calculation Methodology
The Federal action associated the Port of Los Angeles (POLA) Berths 136-147 (TraPac) Container Terminal Project requires a general conformity determination for submittal to the U.S. Environmental Protection Agency (USEPA) in order to comply with the requirements of the general conformity regulations and to obtain a permit from the U.S. Army Corps of Engineers (USACE). This memo documents the methods and results used to calculate pollutant emissions from the Federal action for use in this general conformity determination. The determination will be published with an Addendum to the Final EIS that clarifies the Federal action and updates the construction emissions associated with the Federal action.
Analysis began with information presented in the Berths 136-137 Container Terminal Draft and Final Environmental Impact Statement/Environmental Impact Report (EIS/EIR).
Information in the Final EIS/EIR was updated by POLA based on updated construction scope and project schedule information.
General Conformity Process The first step in the general conformity process is to determine if emissions of the pollutants of concern are above the de minimis emission rates defined in the general conformity regulations. This step is referred to as the Applicability Analysis. The pollutants of concern in the South Coast Air Basin (SCAB) are ozone (and its precursors), NO2 (and its precursor), CO, PM10 and PM2.5 (and its precursors). The precursors of ozone include NOx and ROG; the precursor of NO2 is NOx; and the precursors of PM2.5 include NOx, SOx, ROG, and ammonia, along with directly emitted PM2.5. Due to the severity of the ozone nonattainment designation, the de minimis emission rates for NOx and ROG as ozone precursors (10 tpy) are much more stringent than the de minimis emission rates for NOx and ROG as PM2.5 precursors (100 tpy) or NO2 precursors (100 tpy NOx). Therefore, the de minimis emission rates for NOx and ROG will be 10 tpy of each as ozone precursors.

To: John Pehrson 3/12/2009 Page 2
POLA Conformity Memo Final.doc
Revisions to Final EIR/EIS Project Scope and Activities Project Scope
The project activity names, durations, and types were updated for this conformity determination by POLA, and these updates are incorporated in the construction schedule in Exhibit A. This table shows the original activity names and the corresponding names in the new schedule. The construction is performed over a period of eight years beginning in 2008, with no activity occurring in 2011 and 2012.
Project Activities
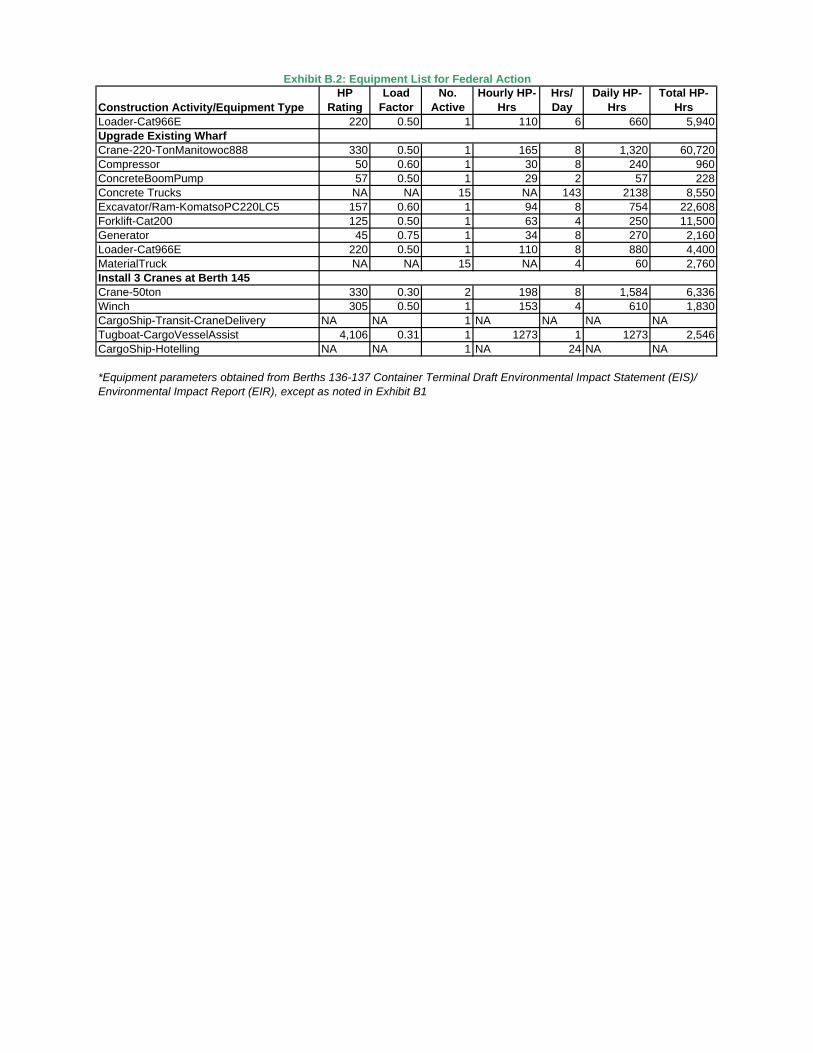
Exhibit B.1 shows the original equipment list from the Final EIS/EIR, with marked revisions and Exhibit B.2 shows these revisions incorporated into a final equipment list. Major revisions were made to Replace Existing Wharf.
Calculation Method The equipment list from the Final EIS/EIR included the following information for each piece of equipment:
• Equipment by activity • HP rating • Load factor (LF) • Number Active (No. Units) * • Hours/Day* • Work Days • Hourly HP-Hours • Daily HP-Hours* • Total HP-Hours*
*For haul trucks, material trucks, and concrete trucks, different information was presented in the table. (Number Active = miles/roundtrip, Hours/Day = daily truck trips, Daily Hp-Hrs = daily miles, and Total Hp-Hrs = total miles) Hourly, daily, and total HP-hours are calculated from HP rating, LF, No. Units, Hours/Day, and Work Days. Therefore, although HP-hours were originally given in the Final EIS/EIR, when the other pieces of information changed, these HP-hours had to be recalculated.
Mitigated emission factors (EF) for off-road equipment in g/hp-hr, on-road equipment in g/mile, and boats in g/hp-hr can be found in the Final EIS/EIR in Table D1.1.73 - Mitigated Air Emission Factors for the Berths 136-147 Terminal Project Alternatives Construction Activities. From this information, the following calculations can be made to reach total emissions for each pollutant caused by the Federal action.
To: John Pehrson 3/12/2009 Page 3
POLA Conformity Memo Final.doc
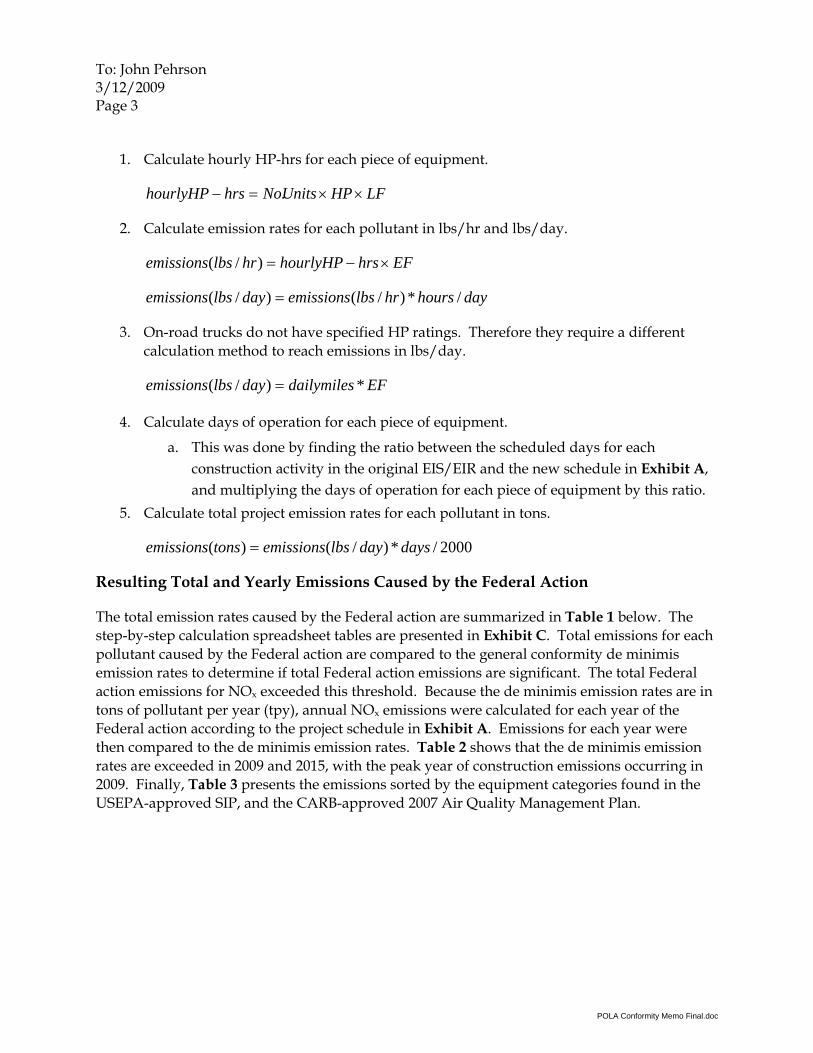
1. Calculate hourly HP-hrs for each piece of equipment.
LFHPUnitsNohrshourlyHP ××=− .
2. Calculate emission rates for each pollutant in lbs/hr and lbs/day.
EFhrshourlyHPhrlbsemissions ×−=)/(
dayhourshrlbsemissionsdaylbsemissions /*)/()/( =
3. On-road trucks do not have specified HP ratings. Therefore they require a different calculation method to reach emissions in lbs/day.
EFdailymilesdaylbsemissions *)/( =
4. Calculate days of operation for each piece of equipment.
a. This was done by finding the ratio between the scheduled days for each construction activity in the original EIS/EIR and the new schedule in Exhibit A, and multiplying the days of operation for each piece of equipment by this ratio.
5. Calculate total project emission rates for each pollutant in tons.
2000/*)/()( daysdaylbsemissionstonsemissions =
Resulting Total and Yearly Emissions Caused by the Federal Action
The total emission rates caused by the Federal action are summarized in Table 1 below. The step-by-step calculation spreadsheet tables are presented in Exhibit C. Total emissions for each pollutant caused by the Federal action are compared to the general conformity de minimis emission rates to determine if total Federal action emissions are significant. The total Federal action emissions for NOx exceeded this threshold. Because the de minimis emission rates are in tons of pollutant per year (tpy), annual NOx emissions were calculated for each year of the Federal action according to the project schedule in Exhibit A. Emissions for each year were then compared to the de minimis emission rates. Table 2 shows that the de minimis emission rates are exceeded in 2009 and 2015, with the peak year of construction emissions occurring in 2009. Finally, Table 3 presents the emissions sorted by the equipment categories found in the USEPA-approved SIP, and the CARB-approved 2007 Air Quality Management Plan.

To: John Pehrson 3/12/2009 Page 4
POLA Conformity Memo Final.doc
Exhibits Exhibit A: Federal Action Construction Schedule Exhibit B.1: Original Equipment List for the Federal Action with Markup Exhibit B.2: Equipment List for the Federal Action Exhibit C.1: Hourly Federal Action Construction Emissions (Based on CEQA Mitigation) Exhibit C.2: Daily Federal Action Construction Emissions (Based on CEQA Mitigation) Exhibit C.3: Total Federal Action Construction Emissions (Based on CEQA Mitigation) Exhibit C.4: Yearly Federal Action NOx Construction Emissions (Based on CEQA Mitigation)

A
POLA Conformity Memo Final.doc
Table 1: Federal Action Construction Total Criteria Pollutant Emissions (tons) Construction Phase & Activity (New Schedule / EIS) b. ROG CO NOx SOx PM10 PM2.5B145-147 Phase 1 Wharf Demolition / Wharf Demolition 0.1 0.5 2.5 0.0 0.1 0.1 Remove 2 Existing Cranes at Berth 145 / Remove 2 Existing Cranes at Berth 144 0.0 0.0 0.0 0.0 0.0 0.0 Pile Driving - Row A/retrofit / Piledriving - Waterside Piles 0.0 0.0 0.3 0.0 0.0 0.0 Sheet Pile Wall / Piledriving - sheet piles 0.0 0.1 0.9 0.0 0.0 0.0 Electric Dredging / Dredge and disposal 0.2 0.7 4.8 0.0 0.2 0.2 Rock / Rip-Rap Placement 0.5 1.7 10.6 0.0 0.5 0.5 Pile Driving - Including Landside / Piledriving - Landside 0.1 0.4 1.9 0.0 0.1 0.1 Wharf Deck / Replace Existing Wharf 0.2 1.1 3.3 0.0 0.1 0.1 B145-147 Phase 2 Wharf Demolition / Wharf Demolition 0.1 0.2 1.0 0.0 0.0 0.0 Waterside Crane Girderc. / Upgrade Existing Wharf 0.0 0.2 0.7 0.0 0.0 0.0 Pile Driving/Landside / Piledriving - Landside 0.0 0.1 0.5 0.0 0.0 0.0 Install 3 Cranes at Berth 145 / Install 3 Cranes at Berth 144 0.0 0.1 1.2 0.7 0.1 0.1 B136-139 Wharf Demolition / Wharf Demolition 0.1 0.5 2.5 0.0 0.1 0.1 Sheet Pile Wall / Piledriving - Sheet piles 0.1 0.2 1.1 0.0 0.0 0.0 Electric Dredging / Dredge and disposal 0.2 0.6 4.5 0.0 0.2 0.2 Rock / Rip-Rap Placement 0.5 1.7 10.6 0.0 0.5 0.5 Pile Driving - Including Landside / Piledriving - Landside 0.1 0.4 1.9 0.0 0.1 0.1 Wharf Deck / Replace Existing Wharf 0.2 1.1 3.3 0.0 0.1 0.1
PROJECT CUMULATIVE POLLUTANT EMISSIONS (tons)a. 2.6 9.8 51.7 0.7 2.2 2.1 General Conformity de minimis Threshold (tpy)d. 10 100 10 100 70 100 (as PM2.5) Were the General Conformity de minimis thresholds exceeded? No No Yese. No No No
a. Emissions shown are for entire construction duration, not peak annual. b. The New Schedule name refers to the construction activity name provided by LAHD for the updated schedule of Federal action activities. The EIS name refers to the construction
activity name used in the Draft and Final EIS/EIR (USACE/LAHD 2007a, b). c. The crane girder is the part of the wharf that supports the crane. d. The de minimis rates are meant to be compared to peak annual emissions. If total project emissions exceed the de minimis emission rates, then annual emissions will be
determined. e. Federal action NOx emissions exceeded the threshold; peak annual NOx emissions will be calculated (see Table 2).
A
POLA Conformity Memo Final.doc
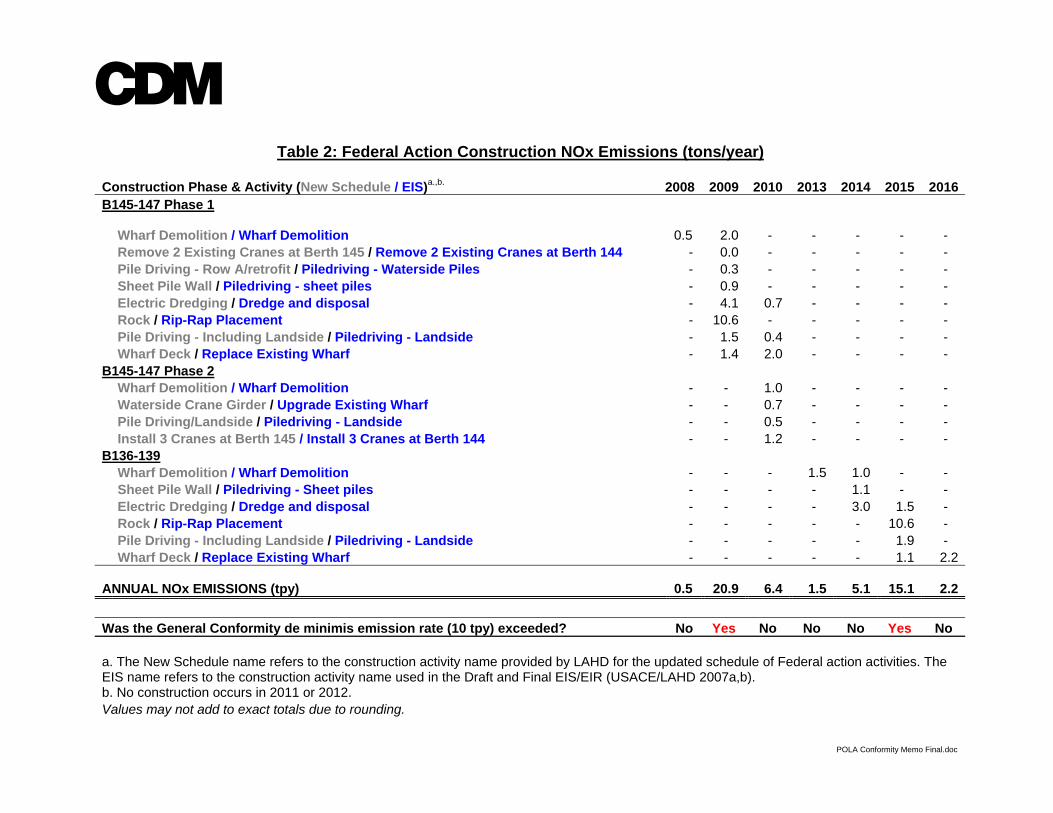
Table 2: Federal Action Construction NOx Emissions (tons/year)
Construction Phase & Activity (New Schedule / EIS)a.,b. 2008 2009 2010 2013 2014 2015 2016B145-147 Phase 1
Wharf Demolition / Wharf Demolition 0.5 2.0 - - - - -
Remove 2 Existing Cranes at Berth 145 / Remove 2 Existing Cranes at Berth 144 - 0.0 - - - - - Pile Driving - Row A/retrofit / Piledriving - Waterside Piles - 0.3 - - - - - Sheet Pile Wall / Piledriving - sheet piles - 0.9 - - - - - Electric Dredging / Dredge and disposal - 4.1 0.7 - - - - Rock / Rip-Rap Placement - 10.6 - - - - - Pile Driving - Including Landside / Piledriving - Landside - 1.5 0.4 - - - - Wharf Deck / Replace Existing Wharf - 1.4 2.0 - - - - B145-147 Phase 2 Wharf Demolition / Wharf Demolition - - 1.0 - - - - Waterside Crane Girder / Upgrade Existing Wharf - - 0.7 - - - - Pile Driving/Landside / Piledriving - Landside - - 0.5 - - - - Install 3 Cranes at Berth 145 / Install 3 Cranes at Berth 144 - - 1.2 - - - - B136-139 Wharf Demolition / Wharf Demolition - - - 1.5 1.0 - - Sheet Pile Wall / Piledriving - Sheet piles - - - - 1.1 - - Electric Dredging / Dredge and disposal - - - - 3.0 1.5 - Rock / Rip-Rap Placement - - - - - 10.6 - Pile Driving - Including Landside / Piledriving - Landside - - - - - 1.9 - Wharf Deck / Replace Existing Wharf - - - - - 1.1 2.2
ANNUAL NOx EMISSIONS (tpy) 0.5 20.9 6.4 1.5 5.1 15.1 2.2
Was the General Conformity de minimis emission rate (10 tpy) exceeded? No Yes No No No Yes No a. The New Schedule name refers to the construction activity name provided by LAHD for the updated schedule of Federal action activities. The EIS name refers to the construction activity name used in the Draft and Final EIS/EIR (USACE/LAHD 2007a,b). b. No construction occurs in 2011 or 2012. Values may not add to exact totals due to rounding.
To: John Pehrson 3/12/2009 Page 7
POLA Conformity Memo Final.doc
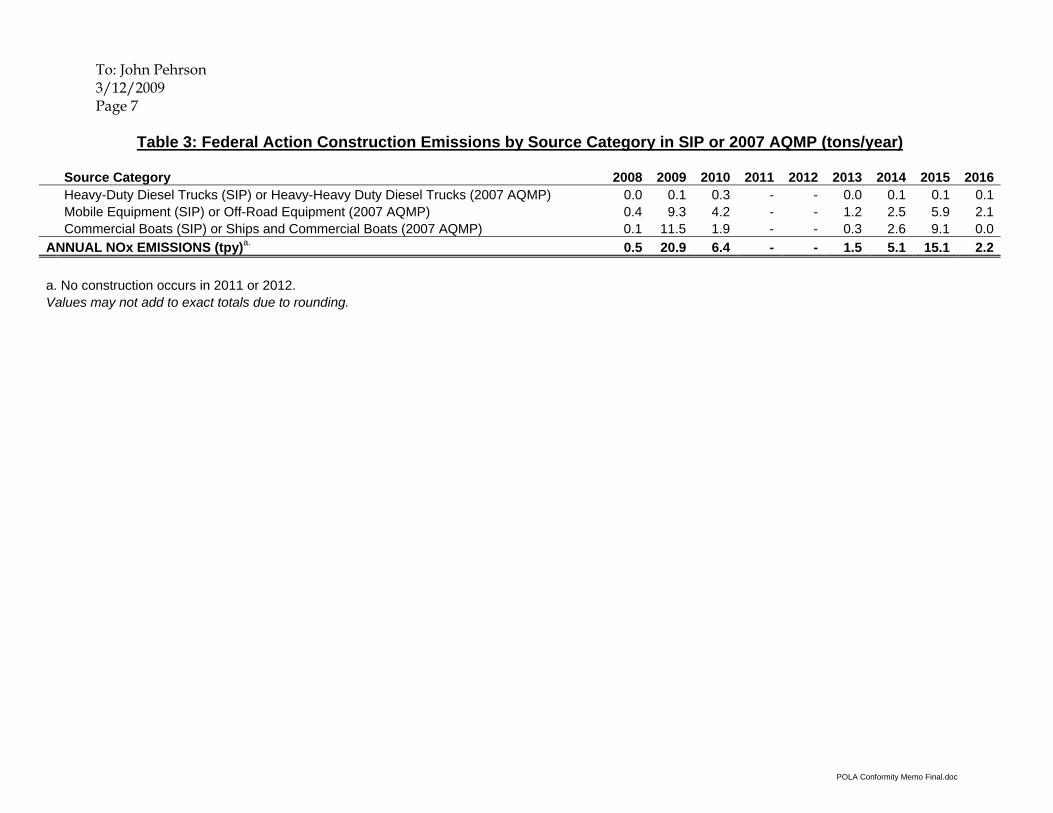
Table 3: Federal Action Construction Emissions by Source Category in SIP or 2007 AQMP (tons/year) Source Category 2008 2009 2010 2011 2012 2013 2014 2015 2016 Heavy-Duty Diesel Trucks (SIP) or Heavy-Heavy Duty Diesel Trucks (2007 AQMP) 0.0 0.1 0.3 - - 0.0 0.1 0.1 0.1 Mobile Equipment (SIP) or Off-Road Equipment (2007 AQMP) 0.4 9.3 4.2 - - 1.2 2.5 5.9 2.1 Commercial Boats (SIP) or Ships and Commercial Boats (2007 AQMP) 0.1 11.5 1.9 - - 0.3 2.6 9.1 0.0 ANNUAL NOx EMISSIONS (tpy)a. 0.5 20.9 6.4 - - 1.5 5.1 15.1 2.2 a. No construction occurs in 2011 or 2012. Values may not add to exact totals due to rounding.
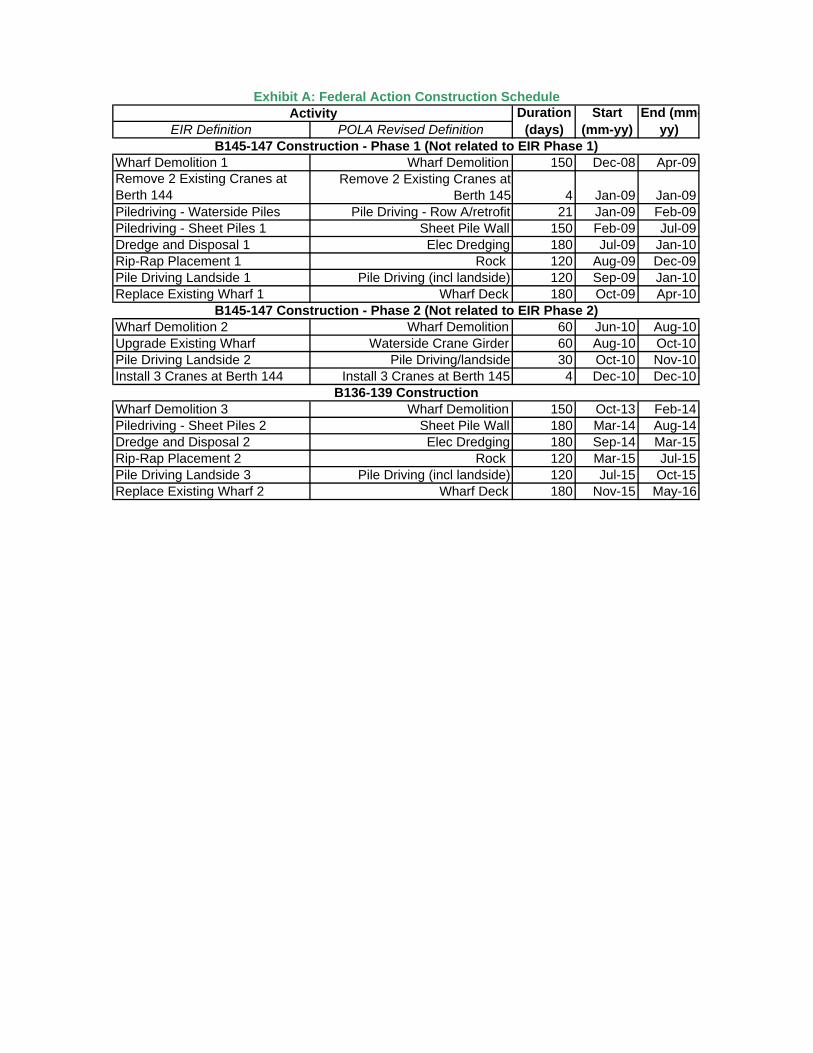
EIR Definition
Wharf Demolition 1 150 Dec-08 Apr-09Remove 2 Existing Cranes at Berth 144 4 Jan-09 Jan-09Piledriving - Waterside Piles 21 Jan-09 Feb-09Piledriving - Sheet Piles 1 150 Feb-09 Jul-09Dredge and Disposal 1 180 Jul-09 Jan-10Rip-Rap Placement 1 120 Aug-09 Dec-09Pile Driving Landside 1 120 Sep-09 Jan-10Replace Existing Wharf 1 180 Oct-09 Apr-10
Wharf Demolition 2 60 Jun-10 Aug-10Upgrade Existing Wharf 60 Aug-10 Oct-10Pile Driving Landside 2 30 Oct-10 Nov-10Install 3 Cranes at Berth 144 4 Dec-10 Dec-10
Wharf Demolition 3 150 Oct-13 Feb-14Piledriving - Sheet Piles 2 180 Mar-14 Aug-14Dredge and Disposal 2 180 Sep-14 Mar-15Rip-Rap Placement 2 120 Mar-15 Jul-15Pile Driving Landside 3 120 Jul-15 Oct-15Replace Existing Wharf 2 180 Nov-15 May-16
Exhibit A: Federal Action Construction ScheduleEnd (mm-
yy)B145-147 Construction - Phase 1 (Not related to EIR Phase 1)
Remove 2 Existing Cranes at Berth 145
Wharf Demolition
Pile Driving - Row A/retrofitSheet Pile WallElec Dredging
Start (mm-yy)
Rock
Wharf DemolitionWaterside Crane Girder
Pile Driving/landside
B145-147 Construction - Phase 2 (Not related to EIR Phase 2)
Wharf DemolitionSheet Pile WallElec Dredging
B136-139 Construction
Pile Driving (incl landside)Wharf Deck
Activity Duration (days)
Rock Pile Driving (incl landside)
Wharf Deck
Install 3 Cranes at Berth 145
POLA Revised Definition
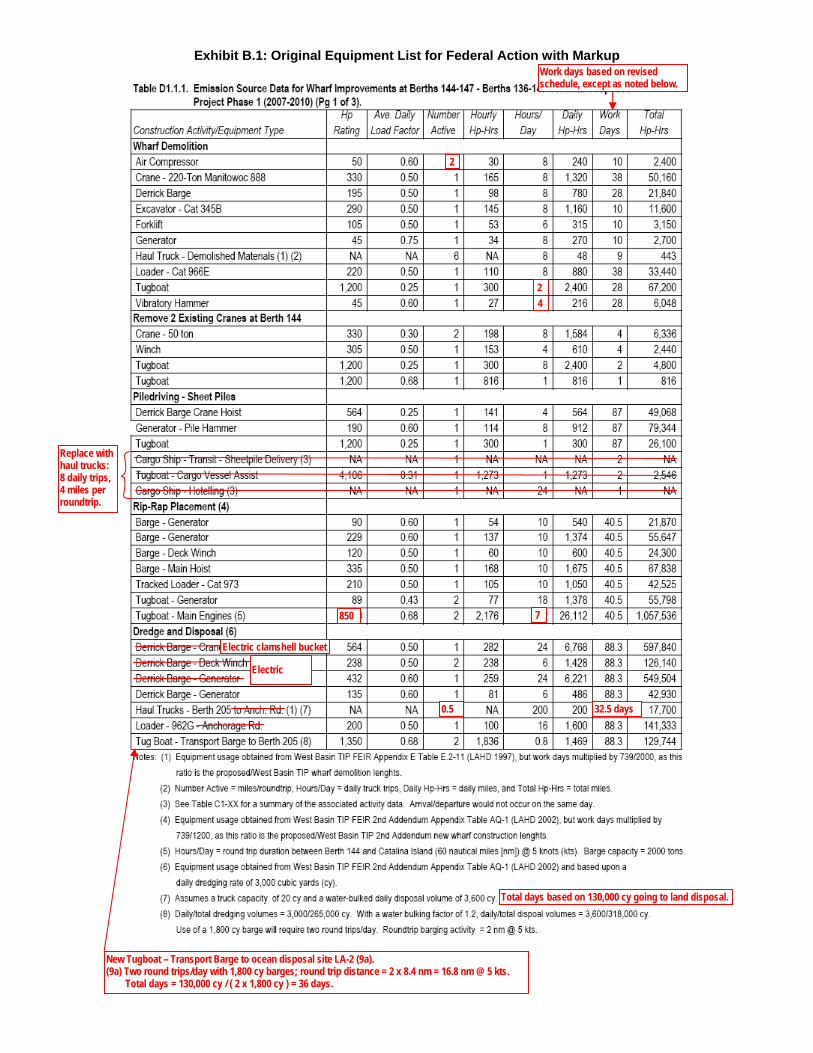
Exhibit B.1: Original Equipment List for Federal Action with Markup
Work days based on revised schedule, except as noted below.
2
2 4
Replace with haul trucks: 8 daily trips, 4 miles per roundtrip.
7 850
32.5 days 0.5
Electric clamshell bucket
Electric
New Tugboat – Transport Barge to ocean disposal site LA-2 (9a). (9a) Two round trips/day with 1,800 cy barges; round trip distance = 2 x 8.4 nm = 16.8 nm @ 5 kts. Total days = 130,000 cy / ( 2 x 1,800 cy ) = 36 days.
Total days based on 130,000 cy going to land disposal.
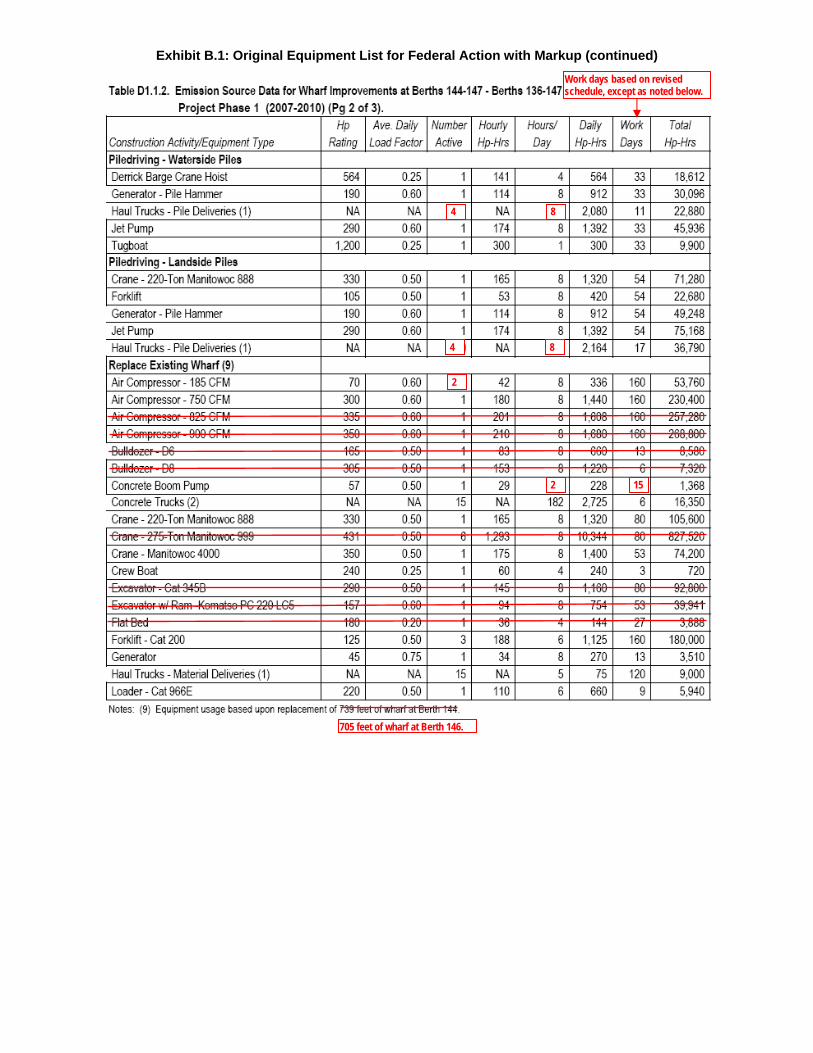
Exhibit B.1: Original Equipment List for Federal Action with Markup (continued)
Work days based on revised schedule, except as noted below.
4 8
4 8
2 15
2
705 feet of wharf at Berth 146.

Exhibit B.1: Original Equipment List for Federal Action with Markup (continued)
Work days based on revised schedule, except as noted below.
2

Construction Activity/Equipment TypeHP
RatingLoad
FactorNo.
ActiveHourly HP-
HrsHrs/ Day
Daily HP-Hrs
Total HP-Hrs
Wharf DemolitionAirCompressor 50 0.60 2 60 8 480 4,800Crane-250-TonManitowoc888 330 0.50 1 165 8 1,320 50,160DerrickBarge 195 0.50 1 98 8 780 21,840Excavator-Cat345B 290 0.50 1 145 8 1,160 11,600Forklift 105 0.50 1 53 6 315 3,150Generator 45 0.75 1 34 8 270 2,700HaulTruck-DemolishedMaterials NA NA 6 NA 8 48 443Loader-Cat966E 220 0.50 1 110 8 880 33,440Tugboat 1,200 0.25 1 300 2 600 16,800VibratoryHammer 45 0.60 1 27 4 108 3,024Remove 2 Existing Cranes at Berth 145Crane-50ton 330 0.30 2 198.00 8 1584.00 6336.00Winch 305 0.50 1 153.00 4 610.00 2440.00Tugboat1 1200 0.25 1 300 8 2400 4800Tugboat2 1200 0.68 1 816.00 1 816.00 816.00Piledriving - Sheet PilesDerrickBargeCraneHoist 564 0.25 1 141 4 564 49,068Generator-PileHammer 190 0.6 1 114 4 456 39,672Tugboat 1,200 0.25 1 300 1 300 26,100HaulTrucks-PileDeliveries NA NA 4 NA 8 32 928Rip-Rap Placement Barge-Generator1 90 0.60 1 54 10 540 21,870Barge-Generator2 229 0.60 1 137 10 1,374 55,647Barge-DeckWinch 120 0.50 1 60 10 600 24,300Barge-MainHoist 335 0.50 1 168 10 1,675 67,838TrackedLoader-Cat973 210 0.50 1 105 10 1,050 42,525Tugboat-Generator 89 0.43 2 77 18 1,378 55,798Tugboat-MainEngines 850 0.68 2 1,156 7 8,092 327,726Dredge and DisposalElectricClamshellBucket 564 0.50 1 282 24 6,768 597,840DerrickBarge-Electric 432 0.60 1 259 24 6,221 549,504DerrickBarge-Generator 2 135 0.60 1 81 6 486 42,930HaulTrucks NA NA 0.5 NA 200 100 3,300Loader-962G 200 0.50 1 100 16 1,600 141,333TugBoat-TransportBargetoBerth205 1,350 0.68 2 1,836 0.8 1,469 52,877TugBoat-TransportBargetoOceanSite 1,350 0.68 2 1,836 3.36 6,169 222,083Piledriving - Waterside PilesDerrickBarge-CraneHoist 564 0.25 1 141 4 564 18,612Generator-PileHammer 190 0.60 1 114 8 912 30,096HaulTrucks-PileDeliveries NA NA 4 NA 8 32 352JetPump 290 0.60 1 174 8 1,392 45,936Tugboat 1,200 0.25 1 300 1 300 9,900Piledriving - LandsidePilesCrane-250-TonManitowoc888 330 0.50 1 165 8 1,320 71,280Forklift 105 0.50 1 53 8 420 22,680Generator-PileHammer 190 0.60 1 114 8 912 49,248JetPump 290 0.60 1 174 8 1,392 75,168HaulTrucks-PileDeliveries NA NA 4 NA 8 32 544Replace Existing Wharf AirCompressor-185CFM 70 0.60 2 84 8 672 107,520AirCompressor-750CFM 300 0.60 1 180 8 1,440 230,400ConcreteBoomPump 57 0.50 1 29 8 228 1,368Concrete Trucks NA NA 15 NA 182 2,730 16,380Crane-250-TonManitowoc888 330 0.50 1 165 8 1,320 105,600Crane-Manitowoc5300 350 0.50 1 175 8 1,400 74,200Crew Boat 240 0.25 1 60 4 240 720Forklift-Cat200 125 0.50 3 188 6 1,125 180,000Generator 45 0.75 1 34 8 270 3,510HaulTrucks-MaterialDeliveries NA NA 15 NA 5 75 9,000
Exhibit B.2: Equipment List for Federal Action
Construction Activity/Equipment TypeHP
RatingLoad
FactorNo.
ActiveHourly HP-
HrsHrs/ Day
Daily HP-Hrs
Total HP-Hrs
Exhibit B.2: Equipment List for Federal Action
Loader-Cat966E 220 0.50 1 110 6 660 5,940Upgrade Existing WharfCrane-220-TonManitowoc888 330 0.50 1 165 8 1,320 60,720Compressor 50 0.60 1 30 8 240 960ConcreteBoomPump 57 0.50 1 29 2 57 228Concrete Trucks NA NA 15 NA 143 2138 8,550Excavator/Ram-KomatsoPC220LC5 157 0.60 1 94 8 754 22,608Forklift-Cat200 125 0.50 1 63 4 250 11,500Generator 45 0.75 1 34 8 270 2,160Loader-Cat966E 220 0.50 1 110 8 880 4,400MaterialTruck NA NA 15 NA 4 60 2,760Install 3 Cranes at Berth 145Crane-50ton 330 0.30 2 198 8 1,584 6,336Winch 305 0.50 1 153 4 610 1,830CargoShip-Transit-CraneDelivery NA NA 1 NA NA NA NATugboat-CargoVesselAssist 4,106 0.31 1 1273 1 1273 2,546CargoShip-Hotelling NA NA 1 NA 24 NA NA
*Equipment parameters obtained from Berths 136-137 Container Terminal Draft Environmental Impact Statement (EIS)/ Environmental Impact Report (EIR), except as noted in Exhibit B1
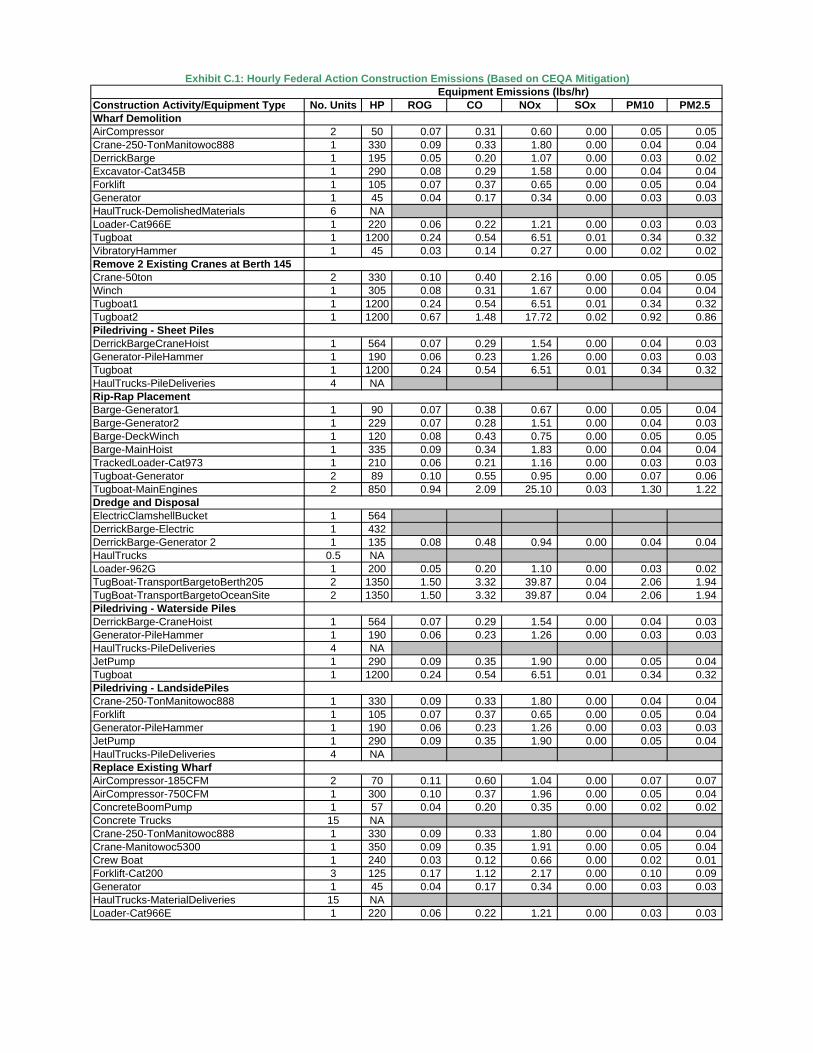
Equipment Emissions (lbs/hr)Construction Activity/Equipment Type No. Units HP ROG CO NOx SOx PM10 PM2.5Wharf DemolitionAirCompressor 2 50 0.07 0.31 0.60 0.00 0.05 0.05 Crane-250-TonManitowoc888 1 330 0.09 0.33 1.80 0.00 0.04 0.04 DerrickBarge 1 195 0.05 0.20 1.07 0.00 0.03 0.02 Excavator-Cat345B 1 290 0.08 0.29 1.58 0.00 0.04 0.04 Forklift 1 105 0.07 0.37 0.65 0.00 0.05 0.04 Generator 1 45 0.04 0.17 0.34 0.00 0.03 0.03 HaulTruck-DemolishedMaterials 6 NALoader-Cat966E 1 220 0.06 0.22 1.21 0.00 0.03 0.03 Tugboat 1 1200 0.24 0.54 6.51 0.01 0.34 0.32 VibratoryHammer 1 45 0.03 0.14 0.27 0.00 0.02 0.02 Remove 2 Existing Cranes at Berth 145Crane-50ton 2 330 0.10 0.40 2.16 0.00 0.05 0.05 Winch 1 305 0.08 0.31 1.67 0.00 0.04 0.04 Tugboat1 1 1200 0.24 0.54 6.51 0.01 0.34 0.32 Tugboat2 1 1200 0.67 1.48 17.72 0.02 0.92 0.86 Piledriving - Sheet PilesDerrickBargeCraneHoist 1 564 0.07 0.29 1.54 0.00 0.04 0.03 Generator-PileHammer 1 190 0.06 0.23 1.26 0.00 0.03 0.03 Tugboat 1 1200 0.24 0.54 6.51 0.01 0.34 0.32 HaulTrucks-PileDeliveries 4 NARip-Rap Placement Barge-Generator1 1 90 0.07 0.38 0.67 0.00 0.05 0.04 Barge-Generator2 1 229 0.07 0.28 1.51 0.00 0.04 0.03 Barge-DeckWinch 1 120 0.08 0.43 0.75 0.00 0.05 0.05 Barge-MainHoist 1 335 0.09 0.34 1.83 0.00 0.04 0.04 TrackedLoader-Cat973 1 210 0.06 0.21 1.16 0.00 0.03 0.03 Tugboat-Generator 2 89 0.10 0.55 0.95 0.00 0.07 0.06 Tugboat-MainEngines 2 850 0.94 2.09 25.10 0.03 1.30 1.22 Dredge and DisposalElectricClamshellBucket 1 564DerrickBarge-Electric 1 432DerrickBarge-Generator 2 1 135 0.08 0.48 0.94 0.00 0.04 0.04 HaulTrucks 0.5 NALoader-962G 1 200 0.05 0.20 1.10 0.00 0.03 0.02 TugBoat-TransportBargetoBerth205 2 1350 1.50 3.32 39.87 0.04 2.06 1.94 TugBoat-TransportBargetoOceanSite 2 1350 1.50 3.32 39.87 0.04 2.06 1.94 Piledriving - Waterside PilesDerrickBarge-CraneHoist 1 564 0.07 0.29 1.54 0.00 0.04 0.03 Generator-PileHammer 1 190 0.06 0.23 1.26 0.00 0.03 0.03 HaulTrucks-PileDeliveries 4 NAJetPump 1 290 0.09 0.35 1.90 0.00 0.05 0.04 Tugboat 1 1200 0.24 0.54 6.51 0.01 0.34 0.32 Piledriving - LandsidePilesCrane-250-TonManitowoc888 1 330 0.09 0.33 1.80 0.00 0.04 0.04 Forklift 1 105 0.07 0.37 0.65 0.00 0.05 0.04 Generator-PileHammer 1 190 0.06 0.23 1.26 0.00 0.03 0.03 JetPump 1 290 0.09 0.35 1.90 0.00 0.05 0.04 HaulTrucks-PileDeliveries 4 NAReplace Existing WharfAirCompressor-185CFM 2 70 0.11 0.60 1.04 0.00 0.07 0.07 AirCompressor-750CFM 1 300 0.10 0.37 1.96 0.00 0.05 0.04 ConcreteBoomPump 1 57 0.04 0.20 0.35 0.00 0.02 0.02 Concrete Trucks 15 NACrane-250-TonManitowoc888 1 330 0.09 0.33 1.80 0.00 0.04 0.04 Crane-Manitowoc5300 1 350 0.09 0.35 1.91 0.00 0.05 0.04 Crew Boat 1 240 0.03 0.12 0.66 0.00 0.02 0.01 Forklift-Cat200 3 125 0.17 1.12 2.17 0.00 0.10 0.09 Generator 1 45 0.04 0.17 0.34 0.00 0.03 0.03 HaulTrucks-MaterialDeliveries 15 NALoader-Cat966E 1 220 0.06 0.22 1.21 0.00 0.03 0.03
Exhibit C.1: Hourly Federal Action Construction Emissions (Based on CEQA Mitigation)
Equipment Emissions (lbs/hr)Construction Activity/Equipment Type No. Units HP ROG CO NOx SOx PM10 PM2.5
Exhibit C.1: Hourly Federal Action Construction Emissions (Based on CEQA Mitigation)
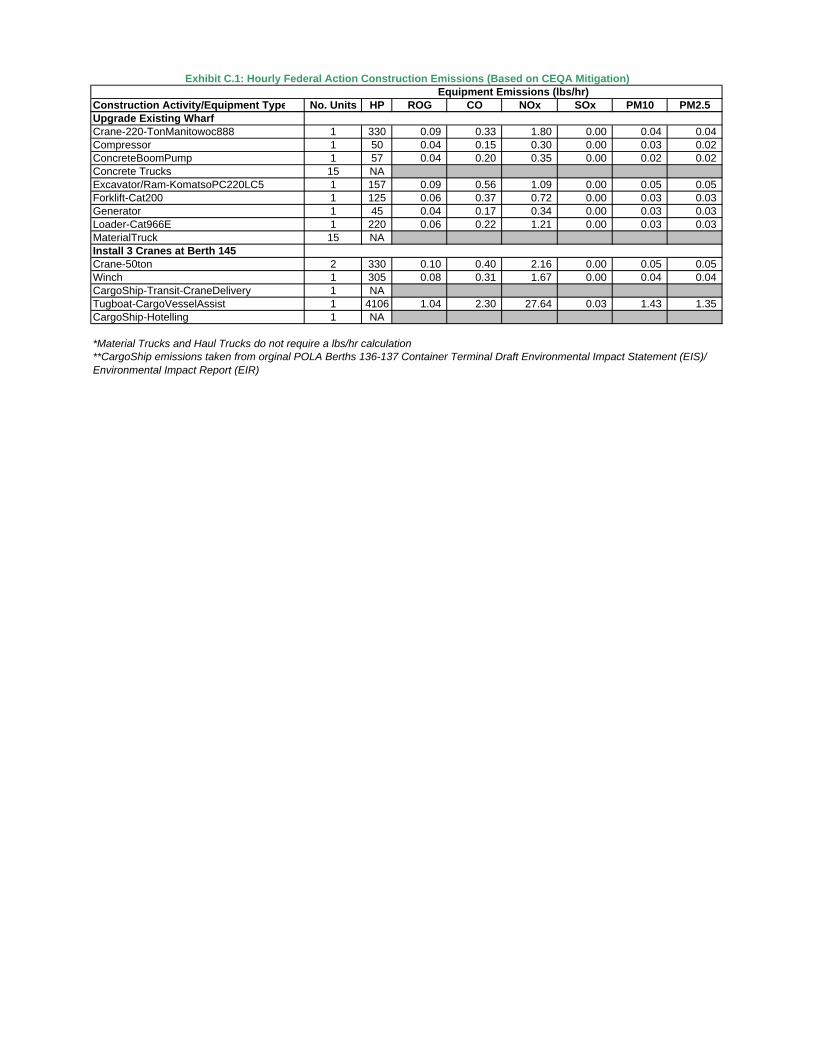
Upgrade Existing WharfCrane-220-TonManitowoc888 1 330 0.09 0.33 1.80 0.00 0.04 0.04 Compressor 1 50 0.04 0.15 0.30 0.00 0.03 0.02 ConcreteBoomPump 1 57 0.04 0.20 0.35 0.00 0.02 0.02 Concrete Trucks 15 NAExcavator/Ram-KomatsoPC220LC5 1 157 0.09 0.56 1.09 0.00 0.05 0.05 Forklift-Cat200 1 125 0.06 0.37 0.72 0.00 0.03 0.03 Generator 1 45 0.04 0.17 0.34 0.00 0.03 0.03 Loader-Cat966E 1 220 0.06 0.22 1.21 0.00 0.03 0.03 MaterialTruck 15 NAInstall 3 Cranes at Berth 145Crane-50ton 2 330 0.10 0.40 2.16 0.00 0.05 0.05 Winch 1 305 0.08 0.31 1.67 0.00 0.04 0.04 CargoShip-Transit-CraneDelivery 1 NATugboat-CargoVesselAssist 1 4106 1.04 2.30 27.64 0.03 1.43 1.35 CargoShip-Hotelling 1 NA
*Material Trucks and Haul Trucks do not require a lbs/hr calculation **CargoShip emissions taken from orginal POLA Berths 136-137 Container Terminal Draft Environmental Impact Statement (EIS)/ Environmental Impact Report (EIR)

Exhibit C.2: Daily Federal Action Construction Emissions (Based on CEQA Mitigation) Daily Emissions (lbs/day)
Construction Activity/Equipment Type ROG CO NOx SOx PM10 PM2.5B145-147Phase 1
Wharf DemolitionAirCompressor 0.6 2.5 4.8 0.0 0.4 0.4 Crane-220-TonManitowoc888 0.7 2.7 14.4 0.0 0.3 0.3 DerrickBarge 0.4 1.6 8.6 0.0 0.2 0.2 Excavator-Cat345B 0.6 2.4 12.7 0.0 0.3 0.3 Forklift 0.4 2.2 3.9 0.0 0.3 0.3 Generator 0.3 1.4 2.7 0.0 0.2 0.2 HaulTruck-DemolishedMaterials 0.1 0.3 1.3 0.0 0.0 0.0 Loader-Cat966E 0.5 1.8 9.7 0.0 0.2 0.2 Tugboat 0.5 1.1 13.0 0.0 0.7 0.6 VibratoryHammer 0.1 0.6 1.1 0.0 0.1 0.1 Remove 2 Existing Cranes at Berth 145Crane-50ton 0.1 0.4 2.2 0.0 0.1 0.0 Winch 0.1 0.3 1.7 0.0 0.0 0.0 Tugboat1 0.2 0.5 6.5 0.0 0.3 0.3 Tugboat2 0.7 1.5 17.7 0.0 0.9 0.9 Pile Driving - Row A/retrofit (101)DerrickBarge-CraneHoist 0.3 1.1 6.2 0.0 0.1 0.1 Generator-PileHammer 0.5 1.8 10.1 0.0 0.2 0.2 HaulTrucks-PileDeliveries 0.1 0.2 0.9 0.0 0.0 0.0 JetPump 0.7 2.8 15.2 0.0 0.4 0.3 Tugboat 0.2 0.5 6.5 0.0 0.3 0.3 Sheet Pile WallDerrickBargeCraneHoist 0.3 1.1 6.2 0.0 0.1 0.1 Generator-PileHammer 0.2 0.9 5.0 0.0 0.1 0.1 Tugboat 0.2 0.5 6.5 0.0 0.3 0.3 HaulTrucks-PileDeliveries 0.1 0.2 0.9 0.0 0.0 0.0 Electric DredgingElectricClamshellBucket - - - - - - DerrickBarge-Electric - - - - - - DerrickBarge-Generator 0.5 2.9 5.6 0.0 0.3 0.2 HaulTrucks 0.2 0.6 2.8 0.0 0.1 0.1 Loader-962G 0.8 3.2 17.6 0.0 0.4 0.4 TugBoat-TransportBargetoBerth205 1.2 2.7 31.9 0.0 1.7 1.6 TugBoat-TransportBargetoOceanSite 5.0 11.2 134.0 0.1 6.9 6.5 RockBarge-Generator1 0.7 3.8 6.7 0.0 0.5 0.4 Barge-Generator2 0.7 2.8 15.1 0.0 0.4 0.3 Barge-DeckWinch 0.8 4.3 7.5 0.0 0.5 0.5 Barge-MainHoist 0.9 3.4 18.3 0.0 0.4 0.4 TrackedLoader-Cat973 0.6 2.1 11.6 0.0 0.3 0.3 Tugboat-Generator 1.8 9.8 17.1 0.0 1.2 1.1 Tugboat-MainEngines 6.6 14.6 175.7 0.2 9.1 8.6 Pile Driving - Including LandsideCrane-220-TonManitowoc888 0.7 2.7 14.4 0.0 0.3 0.3 Forklift 0.5 3.0 5.2 0.0 0.4 0.3 Generator-PileHammer 0.5 1.8 10.1 0.0 0.2 0.2 JetPump 0.7 2.8 15.2 0.0 0.4 0.3 HaulTrucks-PileDeliveries 0.1 0.2 0.9 0.0 0.0 0.0
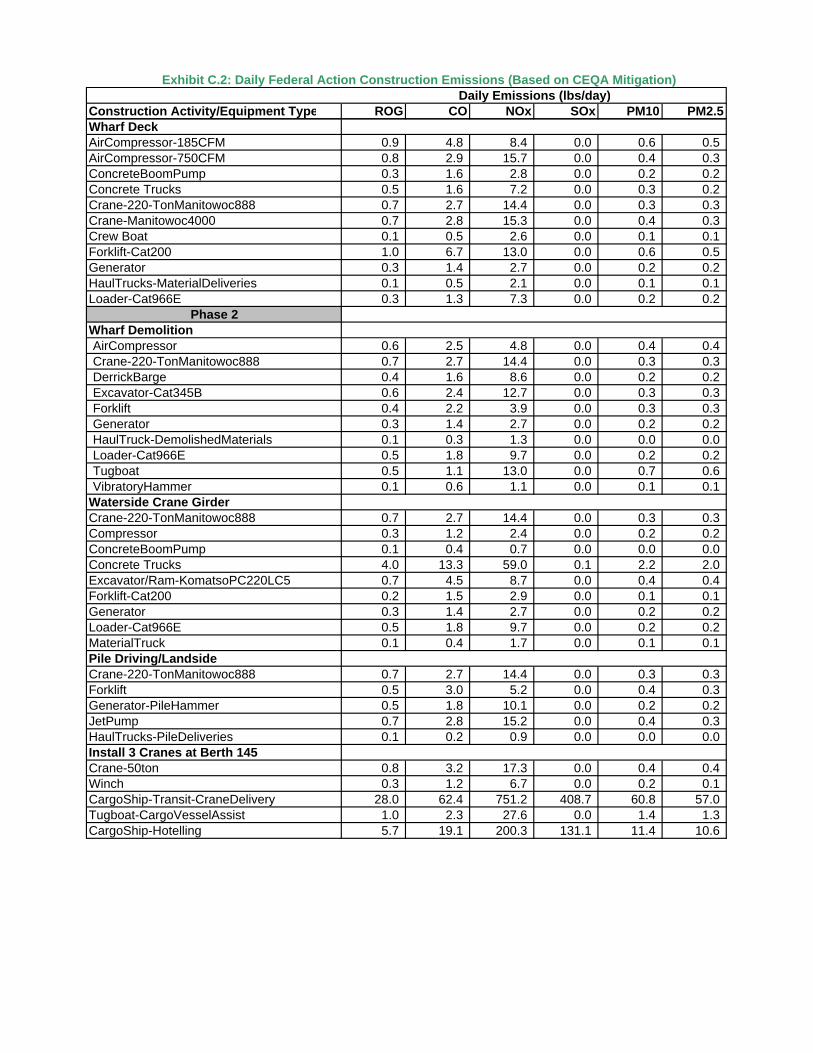
Exhibit C.2: Daily Federal Action Construction Emissions (Based on CEQA Mitigation) Daily Emissions (lbs/day)
Construction Activity/Equipment Type ROG CO NOx SOx PM10 PM2.5Wharf DeckAirCompressor-185CFM 0.9 4.8 8.4 0.0 0.6 0.5 AirCompressor-750CFM 0.8 2.9 15.7 0.0 0.4 0.3 ConcreteBoomPump 0.3 1.6 2.8 0.0 0.2 0.2 Concrete Trucks 0.5 1.6 7.2 0.0 0.3 0.2 Crane-220-TonManitowoc888 0.7 2.7 14.4 0.0 0.3 0.3 Crane-Manitowoc4000 0.7 2.8 15.3 0.0 0.4 0.3 Crew Boat 0.1 0.5 2.6 0.0 0.1 0.1 Forklift-Cat200 1.0 6.7 13.0 0.0 0.6 0.5 Generator 0.3 1.4 2.7 0.0 0.2 0.2 HaulTrucks-MaterialDeliveries 0.1 0.5 2.1 0.0 0.1 0.1 Loader-Cat966E 0.3 1.3 7.3 0.0 0.2 0.2
Phase 2Wharf DemolitionAirCompressor 0.6 2.5 4.8 0.0 0.4 0.4 Crane-220-TonManitowoc888 0.7 2.7 14.4 0.0 0.3 0.3 DerrickBarge 0.4 1.6 8.6 0.0 0.2 0.2 Excavator-Cat345B 0.6 2.4 12.7 0.0 0.3 0.3 Forklift 0.4 2.2 3.9 0.0 0.3 0.3 Generator 0.3 1.4 2.7 0.0 0.2 0.2 HaulTruck-DemolishedMaterials 0.1 0.3 1.3 0.0 0.0 0.0 Loader-Cat966E 0.5 1.8 9.7 0.0 0.2 0.2 Tugboat 0.5 1.1 13.0 0.0 0.7 0.6 VibratoryHammer 0.1 0.6 1.1 0.0 0.1 0.1
Waterside Crane Girder Crane-220-TonManitowoc888 0.7 2.7 14.4 0.0 0.3 0.3 Compressor 0.3 1.2 2.4 0.0 0.2 0.2 ConcreteBoomPump 0.1 0.4 0.7 0.0 0.0 0.0 Concrete Trucks 4.0 13.3 59.0 0.1 2.2 2.0 Excavator/Ram-KomatsoPC220LC5 0.7 4.5 8.7 0.0 0.4 0.4 Forklift-Cat200 0.2 1.5 2.9 0.0 0.1 0.1 Generator 0.3 1.4 2.7 0.0 0.2 0.2 Loader-Cat966E 0.5 1.8 9.7 0.0 0.2 0.2 MaterialTruck 0.1 0.4 1.7 0.0 0.1 0.1 Pile Driving/LandsideCrane-220-TonManitowoc888 0.7 2.7 14.4 0.0 0.3 0.3 Forklift 0.5 3.0 5.2 0.0 0.4 0.3 Generator-PileHammer 0.5 1.8 10.1 0.0 0.2 0.2 JetPump 0.7 2.8 15.2 0.0 0.4 0.3 HaulTrucks-PileDeliveries 0.1 0.2 0.9 0.0 0.0 0.0 Install 3 Cranes at Berth 145Crane-50ton 0.8 3.2 17.3 0.0 0.4 0.4 Winch 0.3 1.2 6.7 0.0 0.2 0.1 CargoShip-Transit-CraneDelivery 28.0 62.4 751.2 408.7 60.8 57.0 Tugboat-CargoVesselAssist 1.0 2.3 27.6 0.0 1.4 1.3 CargoShip-Hotelling 5.7 19.1 200.3 131.1 11.4 10.6
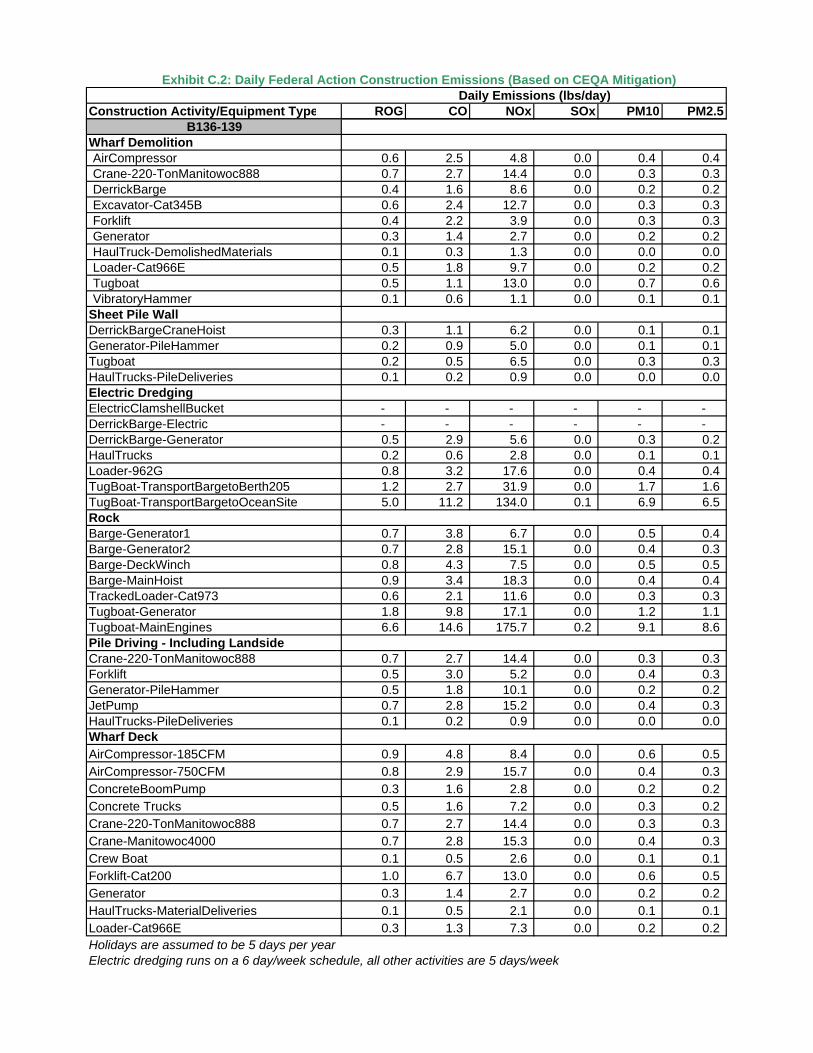
Exhibit C.2: Daily Federal Action Construction Emissions (Based on CEQA Mitigation) Daily Emissions (lbs/day)
Construction Activity/Equipment Type ROG CO NOx SOx PM10 PM2.5B136-139
Wharf DemolitionAirCompressor 0.6 2.5 4.8 0.0 0.4 0.4 Crane-220-TonManitowoc888 0.7 2.7 14.4 0.0 0.3 0.3 DerrickBarge 0.4 1.6 8.6 0.0 0.2 0.2 Excavator-Cat345B 0.6 2.4 12.7 0.0 0.3 0.3 Forklift 0.4 2.2 3.9 0.0 0.3 0.3 Generator 0.3 1.4 2.7 0.0 0.2 0.2 HaulTruck-DemolishedMaterials 0.1 0.3 1.3 0.0 0.0 0.0 Loader-Cat966E 0.5 1.8 9.7 0.0 0.2 0.2 Tugboat 0.5 1.1 13.0 0.0 0.7 0.6 VibratoryHammer 0.1 0.6 1.1 0.0 0.1 0.1
Sheet Pile WallDerrickBargeCraneHoist 0.3 1.1 6.2 0.0 0.1 0.1 Generator-PileHammer 0.2 0.9 5.0 0.0 0.1 0.1 Tugboat 0.2 0.5 6.5 0.0 0.3 0.3 HaulTrucks-PileDeliveries 0.1 0.2 0.9 0.0 0.0 0.0 Electric DredgingElectricClamshellBucket - - - - - - DerrickBarge-Electric - - - - - - DerrickBarge-Generator 0.5 2.9 5.6 0.0 0.3 0.2 HaulTrucks 0.2 0.6 2.8 0.0 0.1 0.1 Loader-962G 0.8 3.2 17.6 0.0 0.4 0.4 TugBoat-TransportBargetoBerth205 1.2 2.7 31.9 0.0 1.7 1.6 TugBoat-TransportBargetoOceanSite 5.0 11.2 134.0 0.1 6.9 6.5 RockBarge-Generator1 0.7 3.8 6.7 0.0 0.5 0.4 Barge-Generator2 0.7 2.8 15.1 0.0 0.4 0.3 Barge-DeckWinch 0.8 4.3 7.5 0.0 0.5 0.5 Barge-MainHoist 0.9 3.4 18.3 0.0 0.4 0.4 TrackedLoader-Cat973 0.6 2.1 11.6 0.0 0.3 0.3 Tugboat-Generator 1.8 9.8 17.1 0.0 1.2 1.1 Tugboat-MainEngines 6.6 14.6 175.7 0.2 9.1 8.6 Pile Driving - Including LandsideCrane-220-TonManitowoc888 0.7 2.7 14.4 0.0 0.3 0.3 Forklift 0.5 3.0 5.2 0.0 0.4 0.3 Generator-PileHammer 0.5 1.8 10.1 0.0 0.2 0.2 JetPump 0.7 2.8 15.2 0.0 0.4 0.3 HaulTrucks-PileDeliveries 0.1 0.2 0.9 0.0 0.0 0.0 Wharf DeckAirCompressor-185CFM 0.9 4.8 8.4 0.0 0.6 0.5 AirCompressor-750CFM 0.8 2.9 15.7 0.0 0.4 0.3 ConcreteBoomPump 0.3 1.6 2.8 0.0 0.2 0.2 Concrete Trucks 0.5 1.6 7.2 0.0 0.3 0.2 Crane-220-TonManitowoc888 0.7 2.7 14.4 0.0 0.3 0.3 Crane-Manitowoc4000 0.7 2.8 15.3 0.0 0.4 0.3 Crew Boat 0.1 0.5 2.6 0.0 0.1 0.1 Forklift-Cat200 1.0 6.7 13.0 0.0 0.6 0.5 Generator 0.3 1.4 2.7 0.0 0.2 0.2 HaulTrucks-MaterialDeliveries 0.1 0.5 2.1 0.0 0.1 0.1 Loader-Cat966E 0.3 1.3 7.3 0.0 0.2 0.2 Holidays are assumed to be 5 days per yearElectric dredging runs on a 6 day/week schedule, all other activities are 5 days/week

Exhibit C.3: Total Federal Action Construction Emissions (Based on CEQA Mitigation) Project Total Emissions (tons)
Construction Activity/Equipment Type Days ROG CO NOx SOx PM10 PM2.5B145-147 RevisedPhase 1
Wharf Demolition 105AirCompressor 28 0.008 0.035 0.068 0.000 0.006 0.005 Crane-220-TonManitowoc888 105 0.037 0.141 0.756 0.001 0.018 0.017 DerrickBarge 77 0.016 0.061 0.331 0.000 0.008 0.007 Excavator-Cat345B 28 0.009 0.033 0.177 0.000 0.004 0.004 Forklift 28 0.006 0.031 0.055 0.000 0.004 0.004 Generator 28 0.005 0.020 0.038 0.000 0.003 0.003 HaulTruck-DemolishedMaterials 26 0.001 0.004 0.017 0.000 0.001 0.001 Loader-Cat966E 105 0.024 0.094 0.509 0.001 0.012 0.011 Tugboat 77 0.019 0.042 0.502 0.001 0.026 0.024 VibratoryHammer 77 0.005 0.021 0.042 0.000 0.003 0.003 Remove 2 Existing Cranes at Berth 145 4Crane-50ton 4 0.000 0.001 0.004 0.000 0.000 0.000 Winch 4 0.000 0.001 0.003 0.000 0.000 0.000 Tugboat1 2 0.000 0.001 0.007 0.000 0.000 0.000 Tugboat2 1 0.000 0.001 0.009 0.000 0.000 0.000 Pile Driving - Row A/retrofit (101) 15DerrickBarge-CraneHoist 15 0.002 0.009 0.046 0.000 0.001 0.001 Generator-PileHammer 15 0.004 0.014 0.075 0.000 0.002 0.002 HaulTrucks-PileDeliveries 5 0.000 0.000 0.002 0.000 0.000 0.000 JetPump 15 0.006 0.021 0.114 0.000 0.003 0.003 Tugboat 15 0.002 0.004 0.049 0.000 0.003 0.002 Sheet Pile Wall 105DerrickBargeCraneHoist 105 0.016 0.060 0.323 0.000 0.008 0.007 Generator-PileHammer 105 0.013 0.049 0.264 0.000 0.006 0.006 Tugboat 105 0.013 0.028 0.342 0.000 0.018 0.017 HaulTrucks-PileDeliveries 35 0.001 0.003 0.015 0.000 0.001 0.001 Electric Dredging 152ElectricClamshellBucket 152 - - - - - - DerrickBarge-Electric 152 - - - - - - DerrickBarge-Generator 152 0.034 0.220 0.428 0.000 0.020 0.018 HaulTrucks 33 0.003 0.010 0.046 0.000 0.002 0.002 Loader-962G 152 0.064 0.247 1.340 0.002 0.032 0.029 TugBoat-TransportBargetoBerth205 36 0.022 0.048 0.574 0.001 0.030 0.028 TugBoat-TransportBargetoOceanSite 36 0.091 0.201 2.411 0.002 0.125 0.118 Rock 84Barge-Generator1 84 0.029 0.162 0.282 0.000 0.020 0.018 Barge-Generator2 84 0.031 0.117 0.636 0.001 0.015 0.014 Barge-DeckWinch 84 0.032 0.179 0.313 0.000 0.022 0.020 Barge-MainHoist 84 0.037 0.143 0.768 0.001 0.019 0.017 TrackedLoader-Cat973 84 0.023 0.089 0.486 0.001 0.012 0.011 Tugboat-Generator 84 0.074 0.412 0.719 0.001 0.050 0.046 Tugboat-MainEngines 84 0.277 0.614 7.380 0.007 0.382 0.360 Pile Driving - Including Landside 84Crane-220-TonManitowoc888 84 0.029 0.112 0.605 0.001 0.015 0.013 Forklift 84 0.023 0.126 0.219 0.000 0.015 0.014 Generator-PileHammer 84 0.020 0.078 0.422 0.001 0.010 0.009 JetPump 84 0.031 0.119 0.638 0.001 0.015 0.014 HaulTrucks-PileDeliveries 26 0.001 0.003 0.011 0.000 0.000 0.000

Exhibit C.3: Total Federal Action Construction Emissions (Based on CEQA Mitigation) Project Total Emissions (tons)
Construction Activity/Equipment Type Days ROG CO NOx SOx PM10 PM2.5Wharf Deck 126AirCompressor-185CFM 126 0.054 0.301 0.526 0.001 0.036 0.034 AirCompressor-750CFM 126 0.048 0.184 0.990 0.001 0.024 0.022 ConcreteBoomPump 15 0.002 0.012 0.021 0.000 0.001 0.001 Concrete Trucks 15 0.004 0.012 0.054 0.000 0.002 0.002 Crane-220-TonManitowoc888 63 0.022 0.084 0.454 0.000 0.011 0.010 Crane-Manitowoc4000 42 0.016 0.060 0.321 0.000 0.008 0.007 Crew Boat 2 0.000 0.000 0.003 0.000 0.000 0.000 Forklift-Cat200 126 0.066 0.422 0.822 0.001 0.038 0.034 Generator 10 0.002 0.007 0.014 0.000 0.001 0.001 HaulTrucks-MaterialDeliveries 95 0.007 0.022 0.098 0.000 0.004 0.003 Loader-Cat966E 7 0.001 0.005 0.025 0.000 0.001 0.001
Phase 2Wharf Demolition 42AirCompressor 11 0.003 0.014 0.027 0.000 0.002 0.002 Crane-220-TonManitowoc888 42 0.015 0.056 0.303 0.000 0.007 0.007 DerrickBarge 31 0.006 0.025 0.133 0.000 0.003 0.003 Excavator-Cat345B 11 0.003 0.013 0.070 0.000 0.002 0.002 Forklift 11 0.002 0.012 0.022 0.000 0.001 0.001 Generator 11 0.002 0.008 0.015 0.000 0.001 0.001 HaulTruck-DemolishedMaterials 10 0.000 0.001 0.007 0.000 0.000 0.000 Loader-Cat966E 42 0.010 0.037 0.204 0.000 0.005 0.004 Tugboat 31 0.008 0.017 0.202 0.000 0.010 0.010 VibratoryHammer 31 0.002 0.009 0.017 0.000 0.001 0.001
Waterside Crane Girder 42Crane-220-TonManitowoc888 42 0.015 0.056 0.303 0.000 0.007 0.007 Compressor 4 0.001 0.002 0.005 0.000 0.000 0.000 ConcreteBoomPump 4 0.000 0.001 0.001 0.000 0.000 0.000 Concrete Trucks 4 0.008 0.027 0.118 0.000 0.004 0.004 Excavator/Ram-KomatsoPC220LC5 27 0.009 0.061 0.118 0.000 0.005 0.005 Forklift-Cat200 42 0.005 0.031 0.061 0.000 0.003 0.003 Generator 7 0.001 0.005 0.010 0.000 0.001 0.001 Loader-Cat966E 5 0.001 0.004 0.024 0.000 0.001 0.001 MaterialTruck 42 0.002 0.008 0.035 0.000 0.001 0.001 Pile Driving/Landside 21Crane-220-TonManitowoc888 21 0.007 0.028 0.151 0.000 0.004 0.003 Forklift 21 0.006 0.031 0.055 0.000 0.004 0.004 Generator-PileHammer 21 0.005 0.019 0.106 0.000 0.003 0.002 JetPump 21 0.008 0.030 0.160 0.000 0.004 0.004 HaulTrucks-PileDeliveries 7 0.000 0.001 0.003 0.000 0.000 0.000 Install 3 Cranes at Berth 145 4Crane-50ton 4 0.002 0.006 0.035 0.000 0.001 0.001 Winch 3 0.000 0.002 0.010 0.000 0.000 0.000 CargoShip-Transit-CraneDelivery 2 0.028 0.062 0.751 0.409 0.061 0.057 Tugboat-CargoVesselAssist 2 0.001 0.002 0.028 0.000 0.001 0.001 CargoShip-Hotelling 4 0.011 0.038 0.401 0.262 0.023 0.021
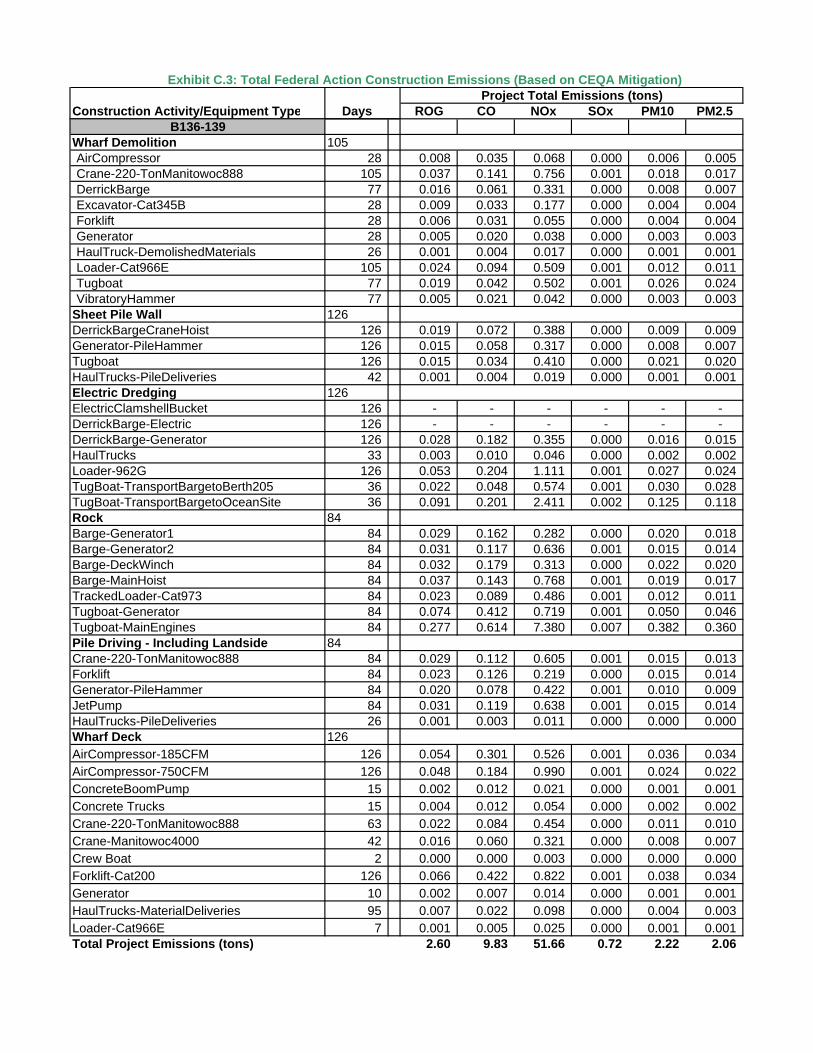
Exhibit C.3: Total Federal Action Construction Emissions (Based on CEQA Mitigation) Project Total Emissions (tons)
Construction Activity/Equipment Type Days ROG CO NOx SOx PM10 PM2.5B136-139
Wharf Demolition 105AirCompressor 28 0.008 0.035 0.068 0.000 0.006 0.005 Crane-220-TonManitowoc888 105 0.037 0.141 0.756 0.001 0.018 0.017 DerrickBarge 77 0.016 0.061 0.331 0.000 0.008 0.007 Excavator-Cat345B 28 0.009 0.033 0.177 0.000 0.004 0.004 Forklift 28 0.006 0.031 0.055 0.000 0.004 0.004 Generator 28 0.005 0.020 0.038 0.000 0.003 0.003 HaulTruck-DemolishedMaterials 26 0.001 0.004 0.017 0.000 0.001 0.001 Loader-Cat966E 105 0.024 0.094 0.509 0.001 0.012 0.011 Tugboat 77 0.019 0.042 0.502 0.001 0.026 0.024 VibratoryHammer 77 0.005 0.021 0.042 0.000 0.003 0.003
Sheet Pile Wall 126DerrickBargeCraneHoist 126 0.019 0.072 0.388 0.000 0.009 0.009 Generator-PileHammer 126 0.015 0.058 0.317 0.000 0.008 0.007 Tugboat 126 0.015 0.034 0.410 0.000 0.021 0.020 HaulTrucks-PileDeliveries 42 0.001 0.004 0.019 0.000 0.001 0.001 Electric Dredging 126ElectricClamshellBucket 126 - - - - - - DerrickBarge-Electric 126 - - - - - - DerrickBarge-Generator 126 0.028 0.182 0.355 0.000 0.016 0.015 HaulTrucks 33 0.003 0.010 0.046 0.000 0.002 0.002 Loader-962G 126 0.053 0.204 1.111 0.001 0.027 0.024 TugBoat-TransportBargetoBerth205 36 0.022 0.048 0.574 0.001 0.030 0.028 TugBoat-TransportBargetoOceanSite 36 0.091 0.201 2.411 0.002 0.125 0.118 Rock 84Barge-Generator1 84 0.029 0.162 0.282 0.000 0.020 0.018 Barge-Generator2 84 0.031 0.117 0.636 0.001 0.015 0.014 Barge-DeckWinch 84 0.032 0.179 0.313 0.000 0.022 0.020 Barge-MainHoist 84 0.037 0.143 0.768 0.001 0.019 0.017 TrackedLoader-Cat973 84 0.023 0.089 0.486 0.001 0.012 0.011 Tugboat-Generator 84 0.074 0.412 0.719 0.001 0.050 0.046 Tugboat-MainEngines 84 0.277 0.614 7.380 0.007 0.382 0.360 Pile Driving - Including Landside 84Crane-220-TonManitowoc888 84 0.029 0.112 0.605 0.001 0.015 0.013 Forklift 84 0.023 0.126 0.219 0.000 0.015 0.014 Generator-PileHammer 84 0.020 0.078 0.422 0.001 0.010 0.009 JetPump 84 0.031 0.119 0.638 0.001 0.015 0.014 HaulTrucks-PileDeliveries 26 0.001 0.003 0.011 0.000 0.000 0.000 Wharf Deck 126AirCompressor-185CFM 126 0.054 0.301 0.526 0.001 0.036 0.034 AirCompressor-750CFM 126 0.048 0.184 0.990 0.001 0.024 0.022 ConcreteBoomPump 15 0.002 0.012 0.021 0.000 0.001 0.001 Concrete Trucks 15 0.004 0.012 0.054 0.000 0.002 0.002 Crane-220-TonManitowoc888 63 0.022 0.084 0.454 0.000 0.011 0.010 Crane-Manitowoc4000 42 0.016 0.060 0.321 0.000 0.008 0.007 Crew Boat 2 0.000 0.000 0.003 0.000 0.000 0.000 Forklift-Cat200 126 0.066 0.422 0.822 0.001 0.038 0.034 Generator 10 0.002 0.007 0.014 0.000 0.001 0.001 HaulTrucks-MaterialDeliveries 95 0.007 0.022 0.098 0.000 0.004 0.003 Loader-Cat966E 7 0.001 0.005 0.025 0.000 0.001 0.001 Total Project Emissions (tons) 2.60 9.83 51.66 0.72 2.22 2.06
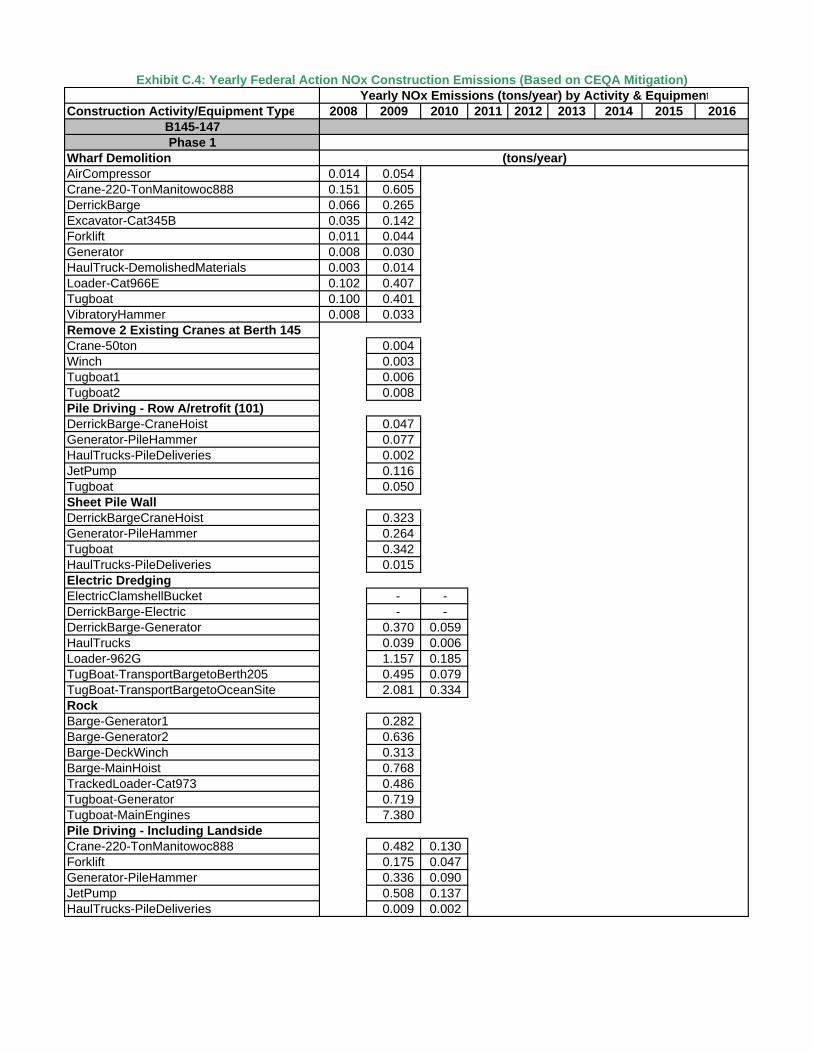
Exhibit C.4: Yearly Federal Action NOx Construction Emissions (Based on CEQA Mitigation) Yearly NOx Emissions (tons/year) by Activity & Equipment
Construction Activity/Equipment Type 2008 2009 2010 2011 2012 2013 2014 2015 2016B145-147Phase 1
Wharf DemolitionAirCompressor 0.014 0.054 Crane-220-TonManitowoc888 0.151 0.605 DerrickBarge 0.066 0.265 Excavator-Cat345B 0.035 0.142 Forklift 0.011 0.044 Generator 0.008 0.030 HaulTruck-DemolishedMaterials 0.003 0.014 Loader-Cat966E 0.102 0.407 Tugboat 0.100 0.401 VibratoryHammer 0.008 0.033 Remove 2 Existing Cranes at Berth 145Crane-50ton 0.004 Winch 0.003 Tugboat1 0.006 Tugboat2 0.008 Pile Driving - Row A/retrofit (101)DerrickBarge-CraneHoist 0.047 Generator-PileHammer 0.077 HaulTrucks-PileDeliveries 0.002 JetPump 0.116 Tugboat 0.050 Sheet Pile WallDerrickBargeCraneHoist 0.323 Generator-PileHammer 0.264 Tugboat 0.342 HaulTrucks-PileDeliveries 0.015 Electric DredgingElectricClamshellBucket - - DerrickBarge-Electric - - DerrickBarge-Generator 0.370 0.059 HaulTrucks 0.039 0.006 Loader-962G 1.157 0.185 TugBoat-TransportBargetoBerth205 0.495 0.079 TugBoat-TransportBargetoOceanSite 2.081 0.334 RockBarge-Generator1 0.282 Barge-Generator2 0.636 Barge-DeckWinch 0.313 Barge-MainHoist 0.768 TrackedLoader-Cat973 0.486 Tugboat-Generator 0.719 Tugboat-MainEngines 7.380 Pile Driving - Including LandsideCrane-220-TonManitowoc888 0.482 0.130 Forklift 0.175 0.047 Generator-PileHammer 0.336 0.090 JetPump 0.508 0.137 HaulTrucks-PileDeliveries 0.009 0.002
(tons/year)

Exhibit C.4: Yearly Federal Action NOx Construction Emissions (Based on CEQA Mitigation) Yearly NOx Emissions (tons/year) by Activity & Equipment
Construction Activity/Equipment Type 2008 2009 2010 2011 2012 2013 2014 2015 2016Wharf DeckAirCompressor-185CFM 0.221 0.309 AirCompressor-750CFM 0.416 0.581 ConcreteBoomPump 0.009 0.012 Concrete Trucks 0.023 0.032 Crane-220-TonManitowoc888 0.191 0.266 Crane-Manitowoc4000 0.135 0.188 Crew Boat 0.001 0.002 Forklift-Cat200 0.345 0.482 Generator 0.006 0.008 HaulTrucks-MaterialDeliveries 0.041 0.058 Loader-Cat966E 0.011 0.015
Phase 2Wharf DemolitionAirCompressor 0.027 Crane-220-TonManitowoc888 0.303 DerrickBarge 0.133 Excavator-Cat345B 0.070 Forklift 0.022 Generator 0.015 HaulTruck-DemolishedMaterials 0.007 Loader-Cat966E 0.204 Tugboat 0.202 VibratoryHammer 0.017
Waterside Crane Girder Crane-220-TonManitowoc888 0.303 Compressor 0.005 ConcreteBoomPump 0.001 Concrete Trucks 0.118 Excavator/Ram-KomatsoPC220LC5 0.118 Forklift-Cat200 0.061 Generator 0.010 Loader-Cat966E 0.024 MaterialTruck 0.035 Pile Driving/LandsideCrane-220-TonManitowoc888 0.151 Forklift 0.055 Generator-PileHammer 0.106 JetPump 0.160 HaulTrucks-PileDeliveries 0.003 Install 3 Cranes at Berth 145Crane-50ton 0.035 Winch 0.010 CargoShip-Transit-CraneDelivery 0.751 Tugboat-CargoVesselAssist 0.028 CargoShip-Hotelling 0.401
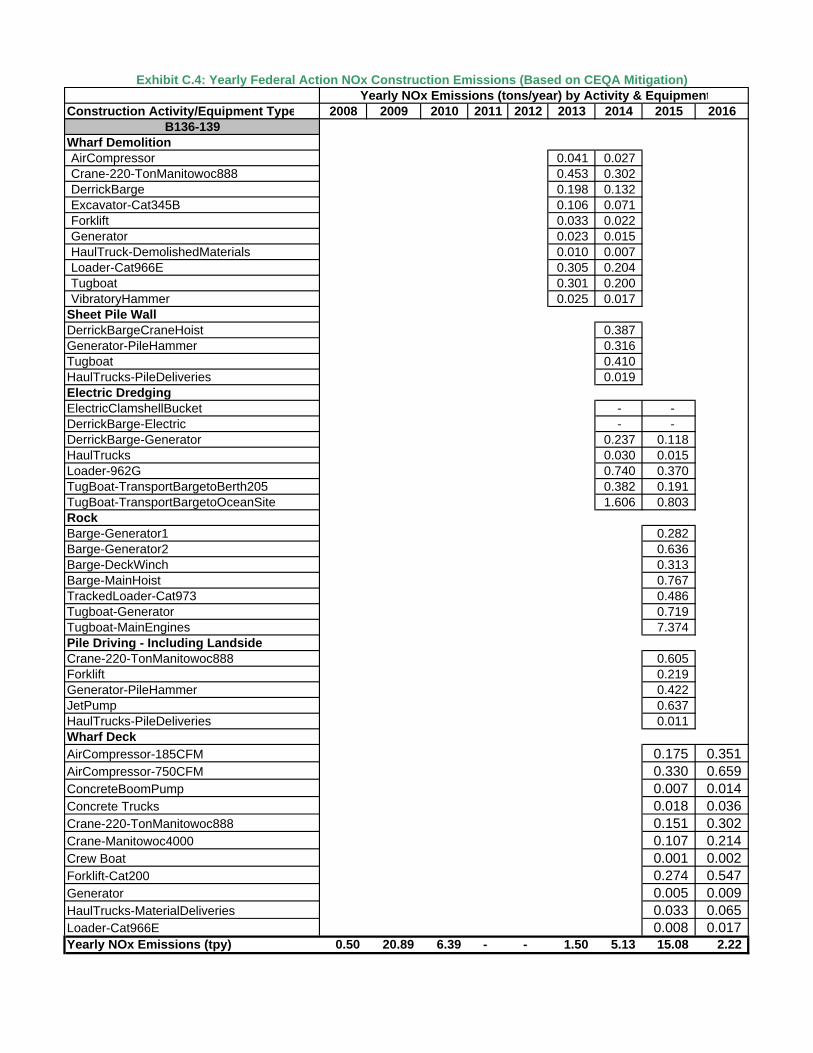
Exhibit C.4: Yearly Federal Action NOx Construction Emissions (Based on CEQA Mitigation) Yearly NOx Emissions (tons/year) by Activity & Equipment
Construction Activity/Equipment Type 2008 2009 2010 2011 2012 2013 2014 2015 2016B136-139
Wharf DemolitionAirCompressor 0.041 0.027 Crane-220-TonManitowoc888 0.453 0.302 DerrickBarge 0.198 0.132 Excavator-Cat345B 0.106 0.071 Forklift 0.033 0.022 Generator 0.023 0.015 HaulTruck-DemolishedMaterials 0.010 0.007 Loader-Cat966E 0.305 0.204 Tugboat 0.301 0.200 VibratoryHammer 0.025 0.017
Sheet Pile WallDerrickBargeCraneHoist 0.387 Generator-PileHammer 0.316 Tugboat 0.410 HaulTrucks-PileDeliveries 0.019 Electric DredgingElectricClamshellBucket - - DerrickBarge-Electric - - DerrickBarge-Generator 0.237 0.118 HaulTrucks 0.030 0.015 Loader-962G 0.740 0.370 TugBoat-TransportBargetoBerth205 0.382 0.191 TugBoat-TransportBargetoOceanSite 1.606 0.803 RockBarge-Generator1 0.282 Barge-Generator2 0.636 Barge-DeckWinch 0.313 Barge-MainHoist 0.767 TrackedLoader-Cat973 0.486 Tugboat-Generator 0.719 Tugboat-MainEngines 7.374 Pile Driving - Including LandsideCrane-220-TonManitowoc888 0.605 Forklift 0.219 Generator-PileHammer 0.422 JetPump 0.637 HaulTrucks-PileDeliveries 0.011 Wharf DeckAirCompressor-185CFM 0.175 0.351 AirCompressor-750CFM 0.330 0.659 ConcreteBoomPump 0.007 0.014 Concrete Trucks 0.018 0.036 Crane-220-TonManitowoc888 0.151 0.302 Crane-Manitowoc4000 0.107 0.214 Crew Boat 0.001 0.002 Forklift-Cat200 0.274 0.547 Generator 0.005 0.009 HaulTrucks-MaterialDeliveries 0.033 0.065 Loader-Cat966E 0.008 0.017 Yearly NOx Emissions (tpy) 0.50 20.89 6.39 - - 1.50 5.13 15.08 2.22

Final General Conformity Determination
A B-1 Berth 136-147 [TraPac] Container Terminal Project
Attachment B
Southern California Association of Governments Correspondence

SCAG-1
SCAG-2

Final General Conformity Determination
A C-1 Berth 136-147 [TraPac] Container Terminal Project
Attachment C
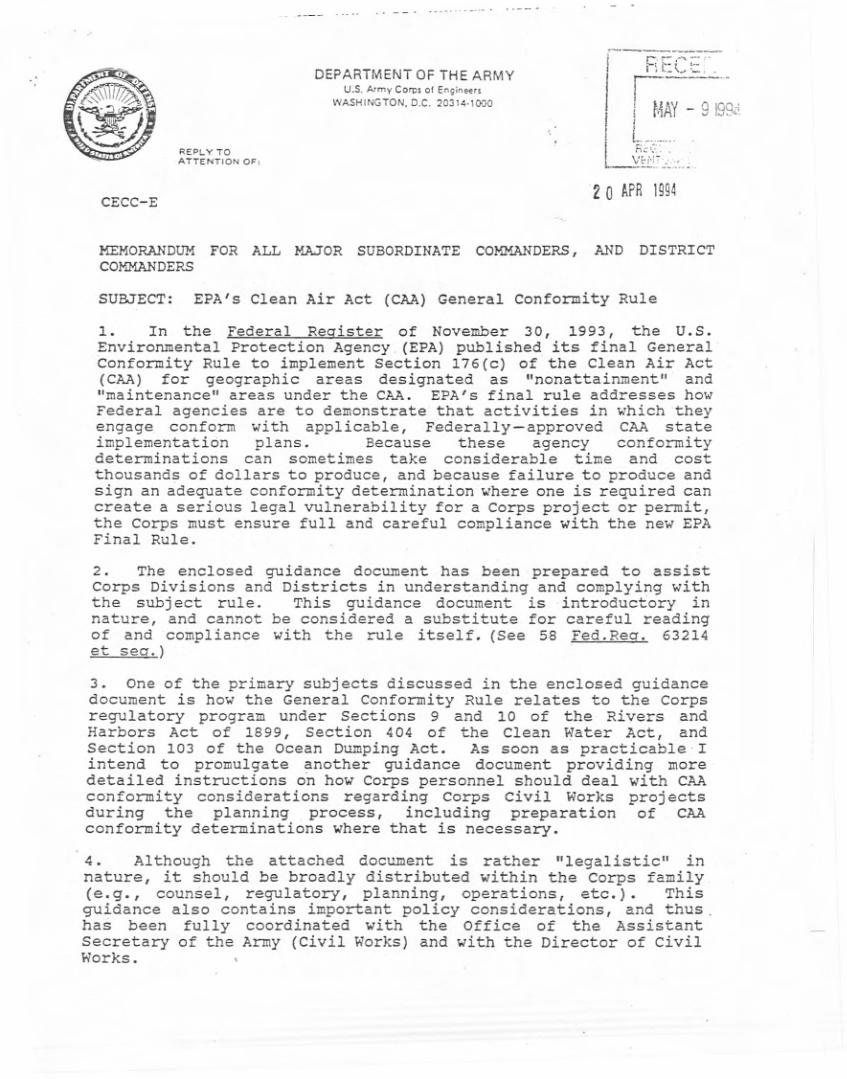
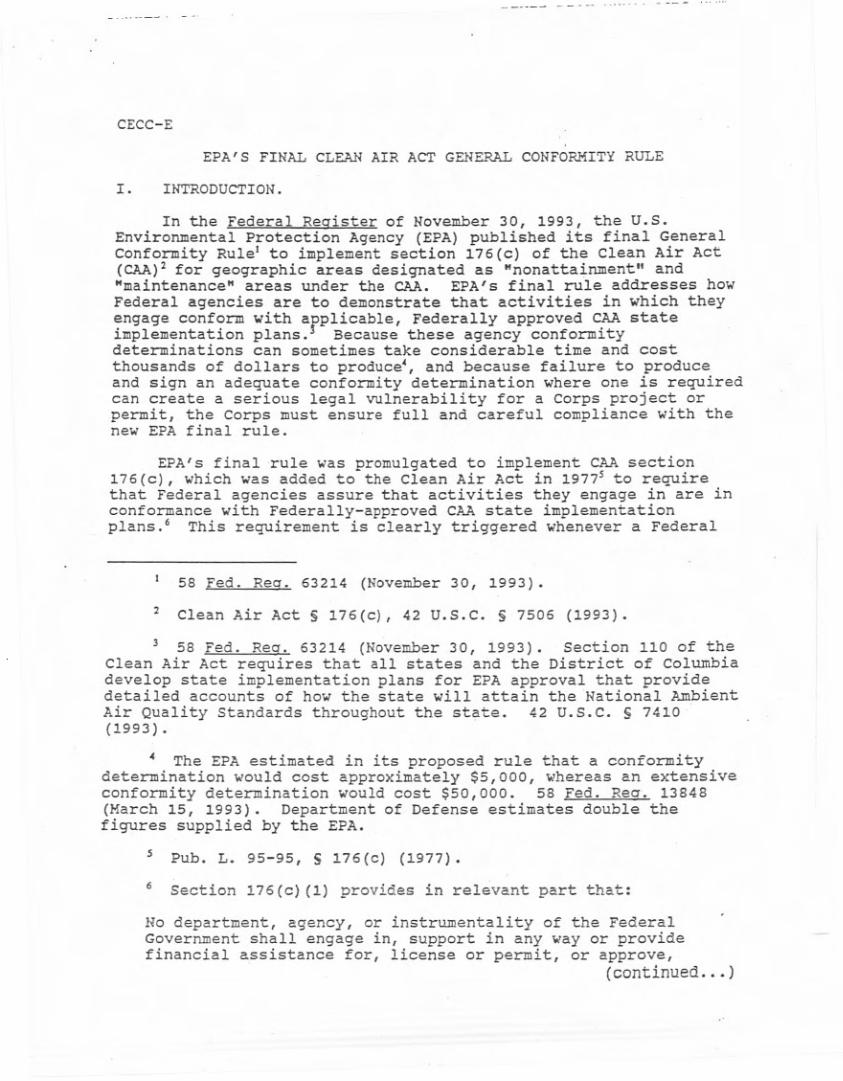
USACE Guidance Concerning Implementation of EPA’s Clean Air Act General Conformity Rule


A D-1 Berth 136-147 [TraPac] Container Terminal Project
Attachment D
Listing of Changes Made to the Draft General Conformity Determination
Final General Conformity Determination
A D-3
Berth 136-147 [TraPac] Container Terminal Project
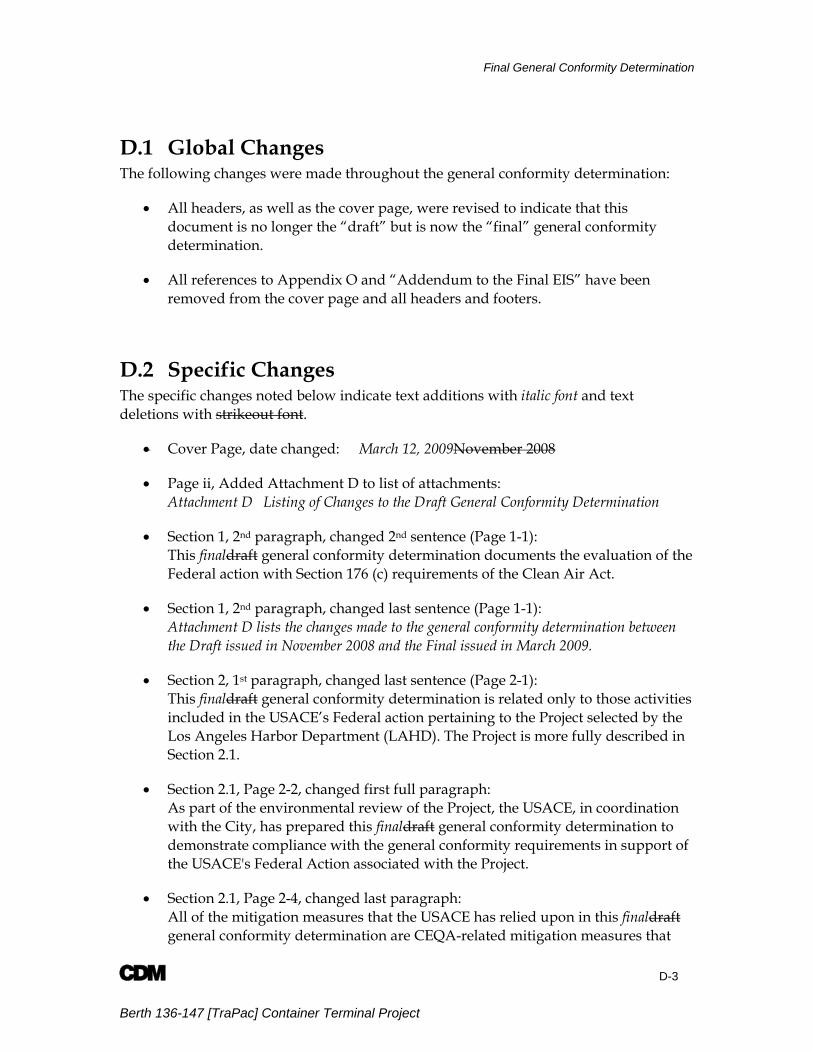
D.1 Global Changes The following changes were made throughout the general conformity determination:
• All headers, as well as the cover page, were revised to indicate that this document is no longer the “draft” but is now the “final” general conformity determination.
• All references to Appendix O and “Addendum to the Final EIS” have been removed from the cover page and all headers and footers.
D.2 Specific Changes The specific changes noted below indicate text additions with italic font and text deletions with strikeout font.
• Cover Page, date changed: March 12, 2009November 2008
• Page ii, Added Attachment D to list of attachments: Attachment D Listing of Changes to the Draft General Conformity Determination
• Section 1, 2nd paragraph, changed 2nd sentence (Page 1-1): This finaldraft general conformity determination documents the evaluation of the Federal action with Section 176 (c) requirements of the Clean Air Act.
• Section 1, 2nd paragraph, changed last sentence (Page 1-1): Attachment D lists the changes made to the general conformity determination between the Draft issued in November 2008 and the Final issued in March 2009.
• Section 2, 1st paragraph, changed last sentence (Page 2-1): This finaldraft general conformity determination is related only to those activities included in the USACE’s Federal action pertaining to the Project selected by the Los Angeles Harbor Department (LAHD). The Project is more fully described in Section 2.1.
• Section 2.1, Page 2-2, changed first full paragraph: As part of the environmental review of the Project, the USACE, in coordination with the City, has prepared this finaldraft general conformity determination to demonstrate compliance with the general conformity requirements in support of the USACE's Federal Action associated with the Project.
• Section 2.1, Page 2-4, changed last paragraph: All of the mitigation measures that the USACE has relied upon in this finaldraft general conformity determination are CEQA-related mitigation measures that
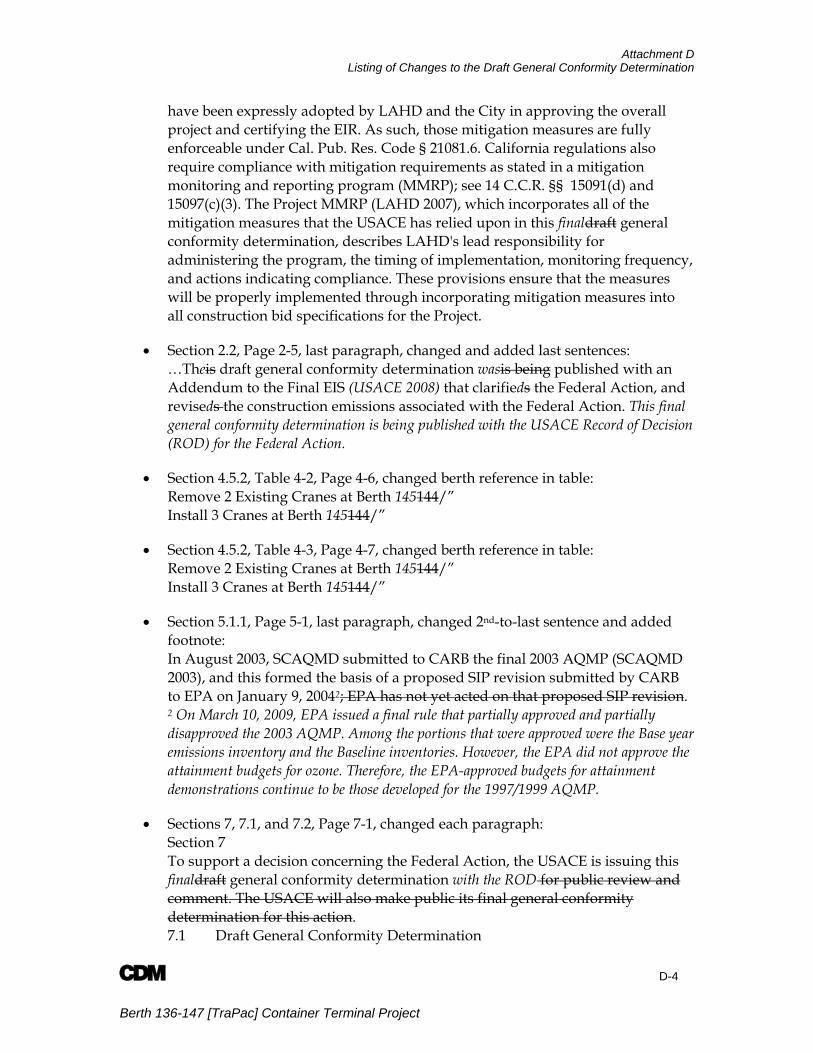
Attachment D Listing of Changes to the Draft General Conformity Determination
A D-4
Berth 136-147 [TraPac] Container Terminal Project
have been expressly adopted by LAHD and the City in approving the overall project and certifying the EIR. As such, those mitigation measures are fully enforceable under Cal. Pub. Res. Code § 21081.6. California regulations also require compliance with mitigation requirements as stated in a mitigation monitoring and reporting program (MMRP); see 14 C.C.R. §§ 15091(d) and 15097(c)(3). The Project MMRP (LAHD 2007), which incorporates all of the mitigation measures that the USACE has relied upon in this finaldraft general conformity determination, describes LAHD's lead responsibility for administering the program, the timing of implementation, monitoring frequency, and actions indicating compliance. These provisions ensure that the measures will be properly implemented through incorporating mitigation measures into all construction bid specifications for the Project.
• Section 2.2, Page 2-5, last paragraph, changed and added last sentences: …Theis draft general conformity determination wasis being published with an Addendum to the Final EIS (USACE 2008) that clarifieds the Federal Action, and reviseds the construction emissions associated with the Federal Action. This final general conformity determination is being published with the USACE Record of Decision (ROD) for the Federal Action.
• Section 4.5.2, Table 4-2, Page 4-6, changed berth reference in table: Remove 2 Existing Cranes at Berth 145144/” Install 3 Cranes at Berth 145144/”
• Section 4.5.2, Table 4-3, Page 4-7, changed berth reference in table: Remove 2 Existing Cranes at Berth 145144/” Install 3 Cranes at Berth 145144/”
• Section 5.1.1, Page 5-1, last paragraph, changed 2nd-to-last sentence and added footnote: In August 2003, SCAQMD submitted to CARB the final 2003 AQMP (SCAQMD 2003), and this formed the basis of a proposed SIP revision submitted by CARB to EPA on January 9, 20042; EPA has not yet acted on that proposed SIP revision. 2 On March 10, 2009, EPA issued a final rule that partially approved and partially disapproved the 2003 AQMP. Among the portions that were approved were the Base year emissions inventory and the Baseline inventories. However, the EPA did not approve the attainment budgets for ozone. Therefore, the EPA-approved budgets for attainment demonstrations continue to be those developed for the 1997/1999 AQMP.
• Sections 7, 7.1, and 7.2, Page 7-1, changed each paragraph: Section 7 To support a decision concerning the Federal Action, the USACE is issuing this finaldraft general conformity determination with the ROD for public review and comment. The USACE will also make public its final general conformity determination for this action. 7.1 Draft General Conformity Determination

Final General Conformity Determination
A D-5
Berth 136-147 [TraPac] Container Terminal Project
At a minimum, tThe USACE providedis providing copies of theis draft general conformity determination to the appropriate regional offices of EPA, any affected Federal land manager, as well as to CARB, SCAQMD, and SCAG, providing opportunity for a 30-day review. The USACE is also placeding a notice in a daily newspaper of general circulation in the SCAB announcing the availability of theis draft general conformity determination and requesting written public comments for a 30-day period. 7.2 Final General Conformity Determination At a minimum, tThe USACE is providingwill provide copies of thise final general conformity determination to the appropriate regional offices of EPA, any affected Federal land manager, as well as to CARB, SCAQMD, and SCAG, within 30 days of its promulgation. The USACE will also place a notice in a daily newspaper of general circulation in the SCAB announcing the availability of its final general conformity determination within 30 days of its promulgation. As part of the general conformity evaluation, the USACE haswill documented its responses to all comments received on the draft general conformity determination and will make both the comments and responses available upon request by any person within 30 days of the promulgation of the final general conformity determination. The responses to comments are also included in Appendix B of the ROD.
• Section 8, Page 8-1, first paragraph, changed 3rd sentence and added text: The USACE conducted the general conformity evaluation following all regulatory criteria and procedures and in coordination with EPA, CARB, SCAQMD, and SCAG. Specifically, SCAQMD and CARB researched the estimated construction equipment emissions developed for the approved SIP and 2007 AQMP for Los Angeles County. Based on this review, they concluded that the Federal Action emissions can be accommodated in the 1997 SIP and 2007 AQMP budgets. EPA reviewed and agreed with the regulatory analysis. A summary of the regulatory review is included in Attachment E.
• Section 9, Page 9-2, added reference to EIS Addendum: U.S. Army Corps of Engineers (USACE). 2008. The Berth 136-147 [TraPac] Container Terminal Project (Port of Los Angeles): Addendum to the Final Environmental Impact Statement (EIS). November. Web site: http://www.portoflosangeles.org/EIR/TraPac/FEIR/FEIR_Addendum.pdf.
• Attachment A, updated memo to change crane removal and replacement from Berth 144 to Berth 145 in Tables 1 and 2, and all Exhibits: Remove 2 Existing Cranes at Berth 145144/… Install 3 Cranes at Berth 145144/…

A E-1 Berth 136-147 [TraPac] Container Terminal Project
Attachment E
Regulatory Evaluation of Construction Emissions for TraPac General Conformity Determination
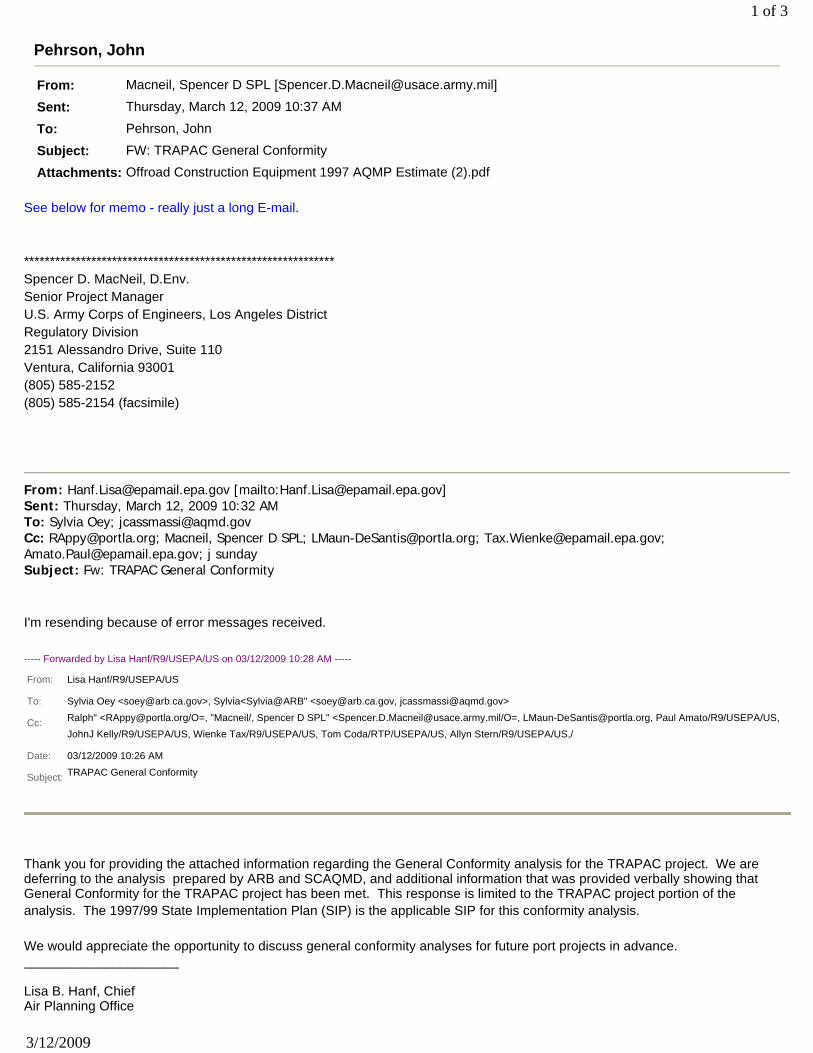
Pehrson, John
From: Macneil, Spencer D SPL [[email protected]]
Sent: Thursday, March 12, 2009 10:37 AM
To: Pehrson, John
Subject: FW: TRAPAC General Conformity
Attachments: Offroad Construction Equipment 1997 AQMP Estimate (2).pdf
1 of 3
3/12/2009
See below for memo - really just a long E-mail.
************************************************************ Spencer D. MacNeil, D.Env. Senior Project Manager U.S. Army Corps of Engineers, Los Angeles District Regulatory Division 2151 Alessandro Drive, Suite 110 Ventura, California 93001 (805) 585-2152 (805) 585-2154 (facsimile)
From: [email protected] [mailto:[email protected]] Sent: Thursday, March 12, 2009 10:32 AM To: Sylvia Oey; [email protected] Cc: [email protected]; Macneil, Spencer D SPL; [email protected]; [email protected]; [email protected]; j sunday Subject: Fw: TRAPAC General Conformity I'm resending because of error messages received. ----- Forwarded by Lisa Hanf/R9/USEPA/US on 03/12/2009 10:28 AM -----
Thank you for providing the attached information regarding the General Conformity analysis for the TRAPAC project. We are deferring to the analysis prepared by ARB and SCAQMD, and additional information that was provided verbally showing that General Conformity for the TRAPAC project has been met. This response is limited to the TRAPAC project portion of the analysis. The 1997/99 State Implementation Plan (SIP) is the applicable SIP for this conformity analysis. We would appreciate the opportunity to discuss general conformity analyses for future port projects in advance. _____________________ Lisa B. Hanf, Chief Air Planning Office
From: Lisa Hanf/R9/USEPA/US To: Sylvia Oey <[email protected]>, Sylvia<Sylvia@ARB" <[email protected], [email protected]> Cc: Ralph" <[email protected]/O=, "Macneil/, Spencer D SPL" <[email protected]/O=, [email protected], Paul Amato/R9/USEPA/US,
JohnJ Kelly/R9/USEPA/US, Wienke Tax/R9/USEPA/US, Tom Coda/RTP/USEPA/US, Allyn Stern/R9/USEPA/US,/ Date: 03/12/2009 10:26 AM Subject: TRAPAC General Conformity
U.S. Environmental Protection Agency - Region 9 75 Hawthorne Street (Air-2) San Francisco, CA 94105 415-972-3854 - phone 415-947-3579 - fax [email protected] ----- Forwarded by Wienke Tax/R9/USEPA/US on 03/12/09 10:16 AM -----
Section 176(c) of the Clean Air Act mandates that all federal actions conform to the applicable SIP. For the South Coast Air Basin, the applicable SIP is the 1997 Air Quality Management Plan adopted by the South Coast Air Quality Management District, as amended in 1999. This State Implementation Plan revision – the “1979/99 SIP” – was approved by U.S. EPA on April 10, 2000. The U.S. Army Corp. of Engineers (Corp) and the Port of Los Angeles (POLA) are seeking a general conformity ruling on the proposed Berth 136-147 (TRAPAC) Container Terminal Project. The project, as proposed will greatly benefit the future air quality in the South Coast Air Basin through enhance emissions reductions at the Port of Los Angeles. The project however, will generate temporary NOx construction emissions that are estimated to exceed the diminimus threshold prescribed by federal conformity regulations. POLA and the Corp based their conformity assessment on the latest 1977/99 and the planning assumptions provided in the 2007 AQMP (submitted to US EPA). The TRAPAC NOx emissions for the total project during the period including 2009 through 2016 are estimated at 51.7 tons and the diminimus threshold of 10 TPY are expected to be exceeded twice: 2009 [20.9 TPY] and 2015 [15.1 TPY]. The U.S. Army Corp. of Engineers (Corp) and the Port of Los Angeles (POLA) are seeking a general conformity ruling on the proposed Berth 136-147 (TRAPAC) Container Terminal Project. The project as proposed will greatly benefit the future air quality in the South Coast Air Basin through enhance emissions reductions at the Port of Los Angeles. The project however, will generate temporary NOx construction emissions that are estimated to exceed the diminimus threshold prescribed by federal conformity regulations. The applicable South Coast SIP contemplated growth activities in the South Coast Basin including growth activities at the Ports of Los Angeles and Long Beach. However, in the applicable SIP, the emission inventories contained for off-road mobile equipment are generalized, making it difficult to determine whether the emissions associated with three new projects at the Port of Los Angeles are included in the projections in the applicable SIP. Although the projects will have the long-term impact of reducing port emissions, the impact of the construction emissions on the conformity budget has been questioned. ARB and SCAQMD staff have determined that the projected construction emission associated with three Port of Los Angeles projects – TRAPAC, Marine Terminal, and China Shipping – will not exceed the conformity budgets in the Applicable SIP for the South Coast. We used three analyses discussed below to reach this conclusion. 1. The Activity Projections Used to Develop the 1997/99 SIP Included Port Growth Projections As provided by law, the Southern California Association of Governments (SCAG) develops the activity factors (growth rates) that are used to develop the emission inventories used in air quality plans for Los Angeles County and the South Coast Air Basin (California Health and Safety Code sections 40464, 40465). SCAG has affirmed that the POLA construction growth was incorporated in each of the plans, and more specifically in the respective growth rates for construction activity. In addition, SCAG’s 2004 Interim Regional Transportation Plan (RTP) growth projections used in the development of the 2007 AQMP and the 2008 RTP directly incorporated the projected transportation related emissions growth from the TRAPAC project in into their regional assessment. While the temporary construction emissions from the project were not included in the 2007 AQMP as a line item, SCAG included the emissions as a component of their county and regional construction growth projections that were used in
"Oey, Sylvia@ARB" <[email protected]>
03/11/09 04:31 PM
To <[email protected]>, Wienke Tax/R9/USEPA/US@EPA, Paul Amato/R9/USEPA/US@EPA, Tom Coda/RTP/USEPA/US@EPA
cc "Karperos, Kurt@ARB" <[email protected]>, "Murchison, Linda@ARB" <[email protected]>, "Benjamin, Michael@ARB" <[email protected]>, "Johnson, Martin@ARB" <[email protected]>, "Sax, Todd@ARB" <[email protected]>, <[email protected]>, "Poppic, George@ARB" <[email protected]>, "Withycombe, Earl@ARB" <[email protected]>
Subject Port Project Conformity Analysis
2 of 3
3/12/2009
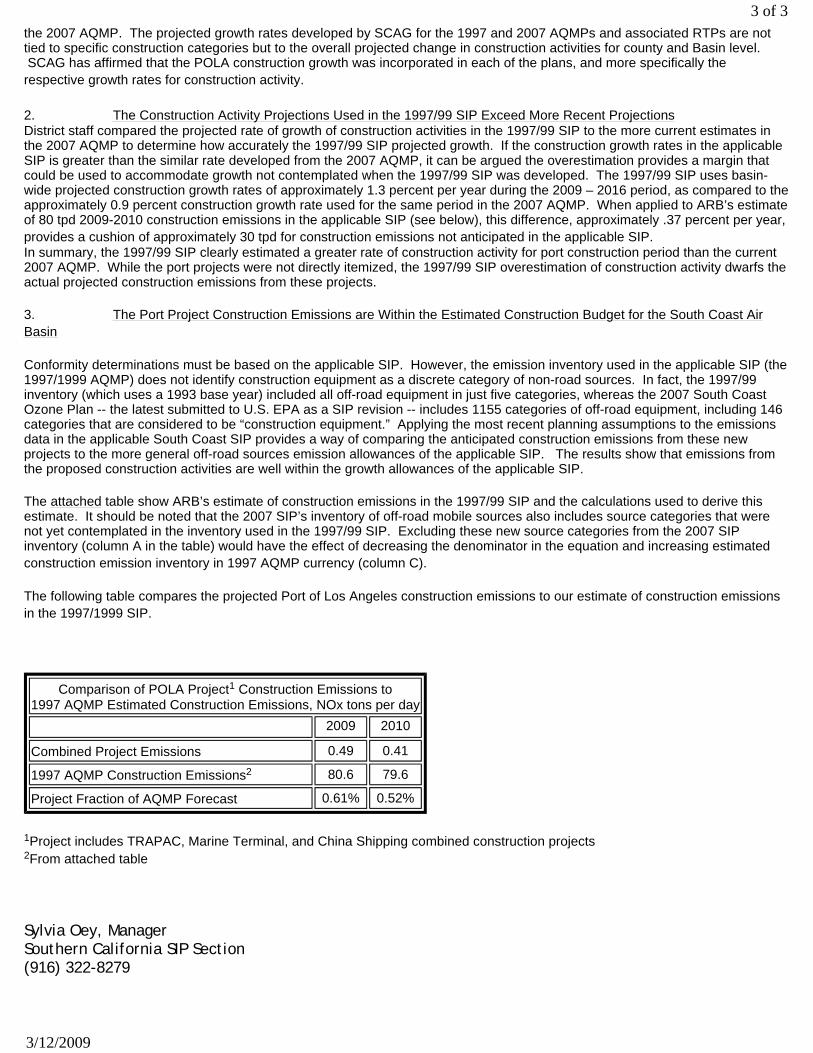
the 2007 AQMP. The projected growth rates developed by SCAG for the 1997 and 2007 AQMPs and associated RTPs are not tied to specific construction categories but to the overall projected change in construction activities for county and Basin level. SCAG has affirmed that the POLA construction growth was incorporated in each of the plans, and more specifically the respective growth rates for construction activity. 2. The Construction Activity Projections Used in the 1997/99 SIP Exceed More Recent Projections District staff compared the projected rate of growth of construction activities in the 1997/99 SIP to the more current estimates in the 2007 AQMP to determine how accurately the 1997/99 SIP projected growth. If the construction growth rates in the applicable SIP is greater than the similar rate developed from the 2007 AQMP, it can be argued the overestimation provides a margin that could be used to accommodate growth not contemplated when the 1997/99 SIP was developed. The 1997/99 SIP uses basin-wide projected construction growth rates of approximately 1.3 percent per year during the 2009 – 2016 period, as compared to the approximately 0.9 percent construction growth rate used for the same period in the 2007 AQMP. When applied to ARB’s estimate of 80 tpd 2009-2010 construction emissions in the applicable SIP (see below), this difference, approximately .37 percent per year, provides a cushion of approximately 30 tpd for construction emissions not anticipated in the applicable SIP. In summary, the 1997/99 SIP clearly estimated a greater rate of construction activity for port construction period than the current 2007 AQMP. While the port projects were not directly itemized, the 1997/99 SIP overestimation of construction activity dwarfs the actual projected construction emissions from these projects. 3. The Port Project Construction Emissions are Within the Estimated Construction Budget for the South Coast Air Basin Conformity determinations must be based on the applicable SIP. However, the emission inventory used in the applicable SIP (the 1997/1999 AQMP) does not identify construction equipment as a discrete category of non-road sources. In fact, the 1997/99 inventory (which uses a 1993 base year) included all off-road equipment in just five categories, whereas the 2007 South Coast Ozone Plan -- the latest submitted to U.S. EPA as a SIP revision -- includes 1155 categories of off-road equipment, including 146 categories that are considered to be “construction equipment.” Applying the most recent planning assumptions to the emissions data in the applicable South Coast SIP provides a way of comparing the anticipated construction emissions from these new projects to the more general off-road sources emission allowances of the applicable SIP. The results show that emissions from the proposed construction activities are well within the growth allowances of the applicable SIP. The attached table show ARB’s estimate of construction emissions in the 1997/99 SIP and the calculations used to derive this estimate. It should be noted that the 2007 SIP’s inventory of off-road mobile sources also includes source categories that were not yet contemplated in the inventory used in the 1997/99 SIP. Excluding these new source categories from the 2007 SIP inventory (column A in the table) would have the effect of decreasing the denominator in the equation and increasing estimated construction emission inventory in 1997 AQMP currency (column C). The following table compares the projected Port of Los Angeles construction emissions to our estimate of construction emissions in the 1997/1999 SIP.
1Project includes TRAPAC, Marine Terminal, and China Shipping combined construction projects 2From attached table Sylvia Oey, Manager Southern California SIP Section (916) 322-8279
Comparison of POLA Project1 Construction Emissions to 1997 AQMP Estimated Construction Emissions, NOx tons per day
2009 2010
Combined Project Emissions 0.49 0.41
1997 AQMP Construction Emissions2 80.6 79.6
Project Fraction of AQMP Forecast 0.61% 0.52%
3 of 3
3/12/2009
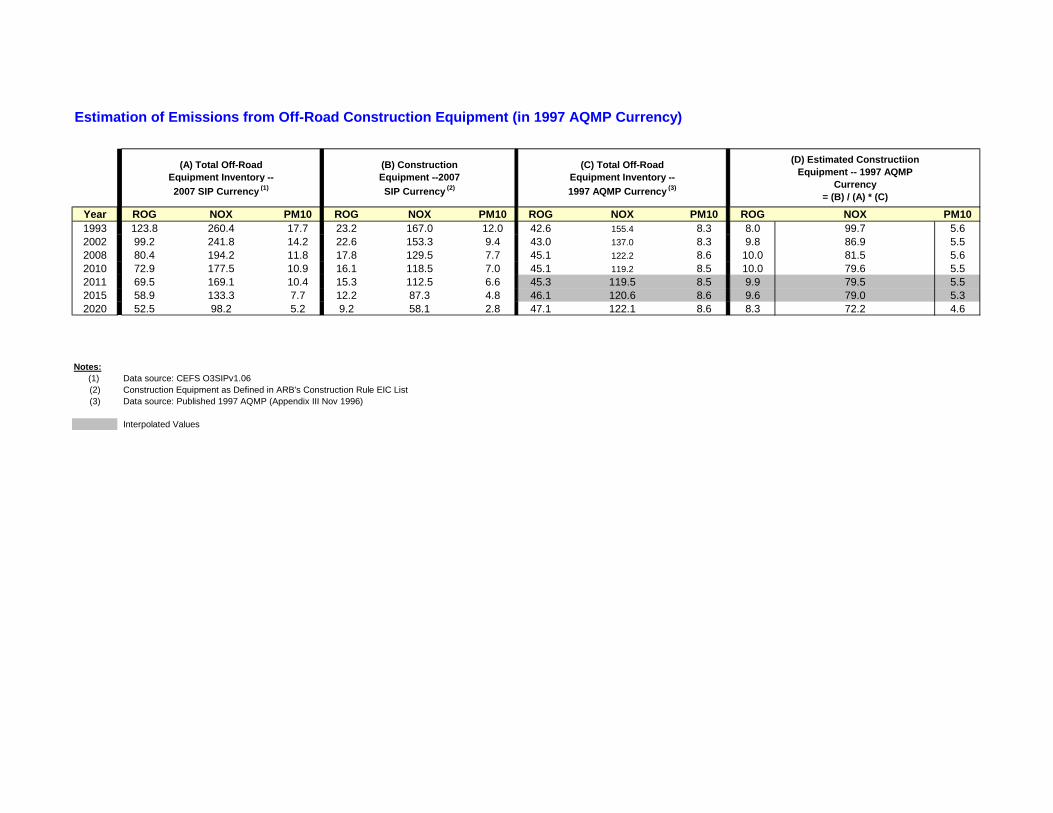
Estimation of Emissions from Off-Road Construction Equipment (in 1997 AQMP Currency)
(A) Total Off-Road Equipment Inventory -- 2007 SIP Currency (1)
(B) Construction Equipment --2007 SIP Currency (2)
(C) Total Off-Road Equipment Inventory -- 1997 AQMP Currency (3)
(D) Estimated Constructiion Equipment -- 1997 AQMP
Currency = (B) / (A) * (C)
Year ROG NOX PM10 ROG NOX PM10 ROG NOX PM10 ROG NOX PM101993 123.8 260.4 17.7 23.2 167.0 12.0 42.6 155.4 8.3 8.0 99.7 5.62002 99.2 241.8 14.2 22.6 153.3 9.4 43.0 137.0 8.3 9.8 86.9 5.52008 80.4 194.2 11.8 17.8 129.5 7.7 45.1 122.2 8.6 10.0 81.5 5.62010 72.9 177.5 10.9 16.1 118.5 7.0 45.1 119.2 8.5 10.0 79.6 5.52011 69.5 169.1 10.4 15.3 112.5 6.6 45.3 119.5 8.5 9.9 79.5 5.52015 58.9 133.3 7.7 12.2 87.3 4.8 46.1 120.6 8.6 9.6 79.0 5.32020 52.5 98.2 5.2 9.2 58.1 2.8 47.1 122.1 8.6 8.3 72.2 4.6
Notes:(1) Data source: CEFS O3SIPv1.06(2) Construction Equipment as Defined in ARB's Construction Rule EIC List(3) Data source: Published 1997 AQMP (Appendix III Nov 1996)
Interpolated Values