attachment a sediment and habitat … flathead mt76l002_060 little bitterroot river, hubbart...
TRANSCRIPT

Thompson Project Area Metals, Nutrients, Sediment, and Temperature TMDLs and Water Quality Improvement Plan– Attachment A
8/26/14 Final Attachment A-1
ATTACHMENT A – SEDIMENT AND HABITAT ASSESSMENT

Thompson Project Area Metals, Nutrients, Sediment, and Temperature TMDLs and Water Quality Improvement Plan– Attachment A
8/26/14 Final Attachment A-2

Thompson TMDL Project Area: Sediment and Habitat Assessment
Prepared by: ATKINS Water Resources Group 820 North Montana Avenue Helena, MT 59601
June 2013

Thompson Project Area Metals, Nutrients, Sediment, and Temperature TMDLs and Water Quality Improvement Plan – Attachment A
6/4/13 i
TABLE OF CONTENTS
Table of Contents ........................................................................................................................................... i
List of Tables ................................................................................................................................................. ii
List of Figures ................................................................................................................................................ ii
Attachments ................................................................................................................................................. iii
1.0 Introduction ............................................................................................................................................ 1
2.0 Aerial Assessment Reach Stratification................................................................................................... 2
2.1 Methods .............................................................................................................................................. 2
2.1.1 Reach Types ................................................................................................................................. 2
2.2 Results ................................................................................................................................................. 3
3.0 Sediment and Habitat Assessment ......................................................................................................... 4
3.1 Methods .............................................................................................................................................. 4
3.1.1 Channel Form and Stability Measurements ................................................................................. 8
3.1.2 Fine Sediment Measurements ..................................................................................................... 9
3.1.3 Instream Habitat Measurements ............................................................................................... 10
3.1.4 Riparian Health Measurements ................................................................................................. 11
3.2 Results ............................................................................................................................................... 12
3.2.1 Reach Type Analysis ................................................................................................................... 12
3.2.2 Monitoring Site Analysis ............................................................................................................ 25
3.2.3 Site Visit Notes ........................................................................................................................... 35
4.0 Streambank Erosion Assessment .......................................................................................................... 41
4.1 Methods ............................................................................................................................................ 41
4.1.1 Monitoring Site Sediment Loads ................................................................................................ 42
4.1.2 Streambank Erosion Sediment Loads for Existing Conditions ................................................... 42
4.1.3 Reducing Streambank Erosion Sediment Loads through Best Management Practices ............. 43
4.1.4 Streambank Erosion Sediment Load Extrapolation for Existing Conditions .............................. 44
4.1.5 Streambank Erosion Sediment Load Extrapolation with Best Management Practices ............. 45
4.2 Results ............................................................................................................................................... 47
4.2.1 Monitoring Site Sediment Loads ................................................................................................ 47
4.2.2 Stream Segment Sediment Loads .............................................................................................. 47
4.2.3 Sub-watershed Streambank Erosion Sediment Loads ............................................................... 49
4.2.4 Sub-watershed Streambank Erosion Sediment Load Reductions .............................................. 49
5.0 Assumptions and Uncertainty ............................................................................................................... 51
6.0 Summary ............................................................................................................................................... 51

Thompson Project Area Metals, Nutrients, Sediment, and Temperature TMDLs and Water Quality Improvement Plan – Attachment A
6/4/13 ii
7.0 References ............................................................................................................................................ 52
LIST OF TABLES
Table 1-1. Waterbody Segments Addressed during the Sediment and Habitat Assessment ....................... 1 Table 2-1. Reach Type Identifiers .................................................................................................................. 3 Table 3-1. Reach Types and Monitoring Sites ............................................................................................... 5 Table 3-2. Width/Depth Ratio ..................................................................................................................... 13 Table 3-3. Entrenchment Ratio ................................................................................................................... 14 Table 3-4. Riffle Pebble Count <2mm ......................................................................................................... 15 Table 3-5. Riffle Pebble Count <6mm ......................................................................................................... 16 Table 3-6. Riffle Grid Toss Fine Sediment <6mm ........................................................................................ 17 Table 3-7. Pool Tail-out Grid Toss <6mm .................................................................................................... 18 Table 3-8. Residual Pool Depth ................................................................................................................... 19 Table 3-9. Pools per 1000 feet .................................................................................................................... 20 Table 3-10. Pools per Mile .......................................................................................................................... 21 Table 3-11. Large Woody Debris per 1000 Feet ......................................................................................... 22 Table 3-12. Large Woody Debris per Mile .................................................................................................. 22 Table 3-13. Greenline Understory Shrub Cover .......................................................................................... 23 Table 3-14. Greenline Bare Ground ............................................................................................................ 24 Table 4-1. Annual Streambank Retreat Rates (Feet/Year), Colorado USDA Forest Service (adapted from Rosgen 2006) .............................................................................................................................................. 41 Table 4-2. Reach Type Data Groupings for Thompson Project Area Monitoring Sites ............................... 42 Table 4-3. Reach Type Data Groupings for Streambank Erosion Sediment Load Extrapolation ................ 43 Table 4-4. Sediment Loads by Reach Type Category for Existing Conditions ............................................. 43 Table 4-5. Sediment Loads by Reach Type Category with BMPs ................................................................ 44 Table 4-6. Reach Type Categories for Extrapolation ................................................................................... 45 Table 4-7. Percent Reduction in Streambank Erosion Sediment Loads ...................................................... 46 Table 4-8. Monitoring Site Estimated Average Annual Sediment Loads due to Streambank Erosion ....... 47 Table 4-9. Stream Segment Streambank Erosion Sediment Loads ............................................................. 48 Table 4-10. Stream Segment Streambank Composition ............................................................................. 49 Table 4-11. Sub-watershed Streambank Erosion Sediment Loads ............................................................. 50 Table 4-12. Sub-watershed Streambank Erosion Sediment Load Reductions with BMPs ......................... 50
LIST OF FIGURES
Figure 3-1. Aerial Assessment Reach Stratification ...................................................................................... 6 Figure 3-2. Aerial Assessment Reach Types .................................................................................................. 7 Figure 3-3. Width/Depth Ratio ................................................................................................................... 13 Figure 3-4. Entrenchment Ratio .................................................................................................................. 14 Figure 3-5. Riffle Pebble Count <2mm ........................................................................................................ 15 Figure 3-6. Riffle Pebble Count <6mm ........................................................................................................ 16 Figure 3-7. Riffle Grid Toss Fine Sediment <6mm ....................................................................................... 17 Figure 3-8. Pool Tail-out Grid Toss <6mm ................................................................................................... 18 Figure 3-9. Residual Pool Depth .................................................................................................................. 19 Figure 3-10. Pools per 1000 Feet ................................................................................................................ 20

Thompson Project Area Metals, Nutrients, Sediment, and Temperature TMDLs and Water Quality Improvement Plan – Attachment A
6/4/13 iii
Figure 3-11. Large Woody Debris per 1000 Feet ........................................................................................ 21 Figure 3-12. Greenline Understory Shrub Cover ........................................................................................ 23 Figure 3-13. Greenline Bare Ground ........................................................................................................... 24 Figure 3-14. Width/Depth Ratio ................................................................................................................. 25 Figure 3-15. Entrenchment Ratio ................................................................................................................ 26 Figure 3-16. Riffle Pebble Count <2mm ...................................................................................................... 27 Figure 3-17. Riffle Pebble Count <6mm ...................................................................................................... 28 Figure 3-18. Riffle Grid Toss <6mm ............................................................................................................. 29 Figure 3-19. Pool Tail-out Grid Toss <6mm ................................................................................................. 30 Figure 3-20. Residual Pool Depth ................................................................................................................ 31 Figure 3-21. Pool and Large Woody Debris Frequency ............................................................................... 32 Figure 3-22. Greenline Understory Shrub Cover ........................................................................................ 33 Figure 3-23. Greenline Bare Ground ........................................................................................................... 34 Figure 4-1. Stream Segment Streambank Erosion Sources ........................................................................ 48
ATTACHMENTS
Attachment A Aerial Assessment Database Attachment B Sediment and Habitat Database Attachment C Streambank Erosion Sediment Loads

Thompson Project Area Metals, Nutrients, Sediment, and Temperature TMDLs and Water Quality Improvement Plan – Attachment A
6/4/13 1
1.0 INTRODUCTION
A detailed sediment and habitat assessment of streams in the Thompson TMDL Project Area (Project Area) was conducted to facilitate development of sediment TMDLs. The Thompson Project Area encompasses an area of approximately 2,511 square miles in Lincoln and Flathead counties in northwestern Montana. The Thompson Project Area includes three TMDL Planning Areas (TPAs): Thompson TPA, a portion of the Lower Flathead TPA, and a portion of the Middle Clark Fork Tributaries TPA. Within the Thompson Project Area, there are nine water body segments listed on the 2012 303(d) List for sediment-related impairments (Table 1-1). McGinnis Creek, Lazier Creek, Little Thompson River, and McGregor Creek are listed as impaired due to sediment in the Thompson TPA, while Henry Creek, Lynch Creek and Swamp Creek are listed as impaired due to sediment in the Middle Clark Fork Tributaries TPA. The Little Bitterroot River and Sullivan Creek are listed as impaired due to sediment in the Lower Flathead TPA. Table 1-1. Waterbody Segments Addressed during the Sediment and Habitat Assessment
TPA List ID Waterbody Description Thompson MT76N005_070 MCGINNIS CREEK, headwaters to mouth (Little Thompson River)
Thompson MT76N005_060 LAZIER CREEK, headwaters to mouth (Thompson River)
Thompson MT76N005_040 LITTLE THOMPSON RIVER, headwaters to mouth (Thompson River), T22N R25W S8
Thompson MT76N005_030 McGREGOR CREEK, McGregor Lake to mouth (Thompson River)
Middle Clark Fork Tributaries
MT76N003_170 HENRY CREEK, headwaters to mouth (Clark Fork River), T19N R26W S1
Middle Clark Fork Tributaries
MT76N003_010 LYNCH CREEK, headwaters to mouth (Clark Fork River)
Middle Clark Fork Tributaries
MT76N003_160 SWAMP CREEK, West Fork Swamp Creek to mouth (Clark Fork River), T20N R27W S3
Lower Flathead MT76L002_060 LITTLE BITTERROOT RIVER, Hubbart Reservoir to Flathead Reservation Boundary
Lower Flathead MT76L002_070 SULLIVAN CREEK, headwaters to Flathead Indian Reservation
The goal of this assessment is to collect data to evaluate the existing condition of sediment impaired streams and to estimate the relative existing sediment load from eroding streambanks and the sediment load reductions that will occur with the application of all appropriate riparian best management practices (BMPs). Sediment from eroding streambanks is commonly a major contributing sediment source to streams throughout western Montana. Estimated sediment loads from eroding streambanks will be used to assist Montana DEQ and EPA with development of sediment TMDLs, which are expressed as a percent reduction in annual loading. Estimated sediment loads should not be considered absolute loads, but instead are used to indicate the relative amount of loading from streambank erosion, as well as the percent reduction in loading that could be achieved via the improvement of riparian management practices. In addition to estimating sediment loads from eroding streambanks, stream channel morphology, in-stream habitat, and riparian vegetation assessments were also performed to further examine sediment dynamics within the streams of interest. The Thompson Project Area sediment and habitat assessment included three main components, which are presented in the following sections: aerial assessment reach stratification, sediment and habitat assessment, and streambank erosion assessment.

Thompson Project Area Metals, Nutrients, Sediment, and Temperature TMDLs and Water Quality Improvement Plan – Attachment A
6/4/13 2
2.0 AERIAL ASSESSMENT REACH STRATIFICATION
Prior to field data collection, an aerial assessment of streams in the Thompson Project Area was conducted in GIS to stratify streams into distinct reaches based on landscape and land-use factors following procedures described in the document Watershed Stratification Methodology for TMDL Sediment and Habitat Investigations (DEQ 2008). The reach stratification process involved dividing each stream segment into distinct reaches based on four landscape factors: ecoregion, valley gradient, Strahler stream order, and valley confinement resulting in a series of “reach types” specific to the streams within the Thompson Project Area.
2.1 METHODS An aerial assessment of streams in the Thompson Project Area was conducted using National Agricultural Imagery Program (NAIP) color imagery from 2009 in GIS along with other relevant data layers, including the National Hydrography Dataset (NHD) 1:100,000 stream layer and United States Geological Survey 1:24,000 Topographic Quadrangle Digital Raster Graphics. GIS data layers were used to stratify streams into distinct reaches based on landscape and land-use factors. The reach stratification methodology involves breaking a water body stream segment into stream reaches and sub-reaches. Each of the stream segments in the Thompson Project Area was initially divided into distinct stream reaches based on four landscape factors: ecoregion, valley gradient, Strahler stream order, and valley confinement. Stream reaches classified by these four criteria were then further divided into sub-reaches based on the surrounding vegetation and land-use characteristics, including predominant vegetation type, riparian health, adjacent land-use, level of development, and potential anthropogenic influences on streambank erosion. This resulted in a series of stream reaches and sub-reaches delineated based on landscape and land-use factors which were compiled into an Aerial Assessment Database for the Thompson Project Area. 2.1.1 Reach Types The aerial assessment reach stratification process involved dividing each stream segment into distinct reaches based on four landscape factors: ecoregion, valley gradient, Strahler stream order, and valley confinement. Each individual combination of the four landscape factors is referred to as a reach type in this report based on the following definition:
Reach Type - Unique combination of ecoregion, gradient, Strahler stream order and confinement
Reach types were described using the following naming convention based on the reach type identifiers presented in Table 2-1:
Level III Ecoregion – Valley Gradient – Strahler Stream Order – Confinement
Thompson Project Area Metals, Nutrients, Sediment, and Temperature TMDLs and Water Quality Improvement Plan – Attachment A
6/4/13 3
Table 2-1. Reach Type Identifiers Landscape Factor Stratification
Category Reach Type Identifier
Level III Ecoregion Northern Rockies NR
Valley Gradient
0-<2% 0 2-<4% 2
4-<10% 4 >10% 10
Strahler Stream Order
first order 1 second order 2
third order 3 fourth order 4 fifth order 5
Confinement unconfined U confined C
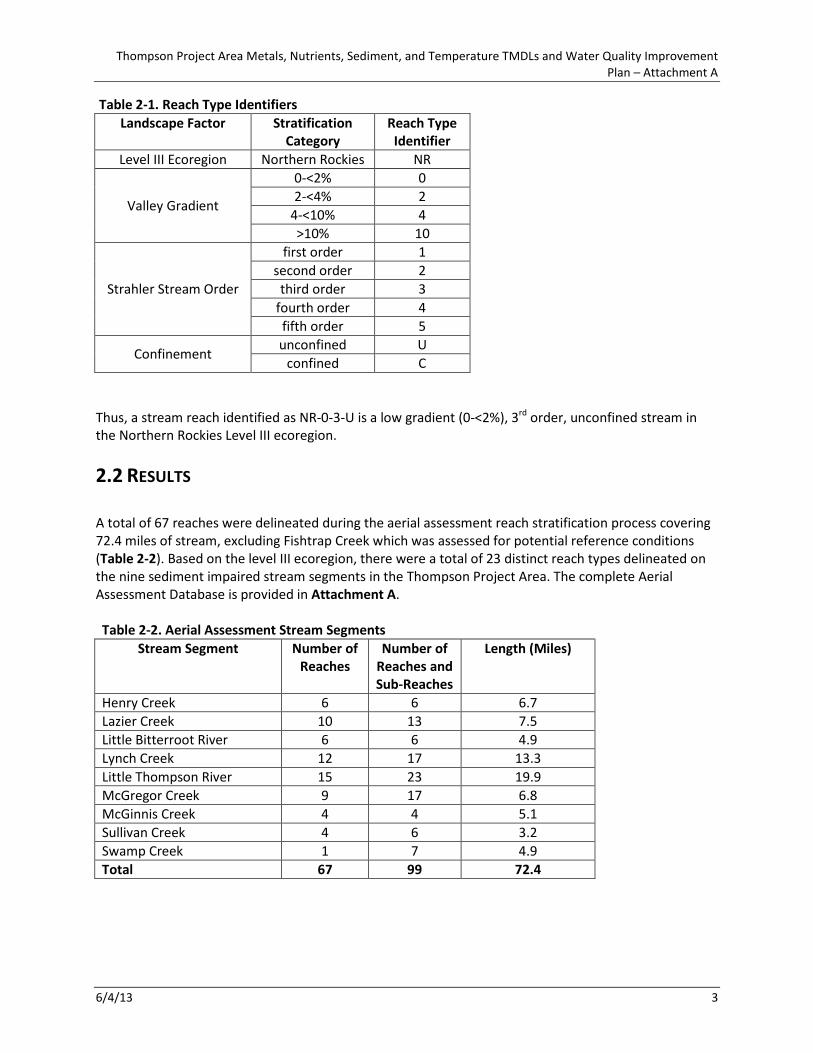
Thus, a stream reach identified as NR-0-3-U is a low gradient (0-<2%), 3rd order, unconfined stream in the Northern Rockies Level III ecoregion.
2.2 RESULTS A total of 67 reaches were delineated during the aerial assessment reach stratification process covering 72.4 miles of stream, excluding Fishtrap Creek which was assessed for potential reference conditions (Table 2-2). Based on the level III ecoregion, there were a total of 23 distinct reach types delineated on the nine sediment impaired stream segments in the Thompson Project Area. The complete Aerial Assessment Database is provided in Attachment A. Table 2-2. Aerial Assessment Stream Segments
Stream Segment Number of Reaches
Number of Reaches and Sub-Reaches
Length (Miles)
Henry Creek 6 6 6.7 Lazier Creek 10 13 7.5 Little Bitterroot River 6 6 4.9 Lynch Creek 12 17 13.3 Little Thompson River 15 23 19.9 McGregor Creek 9 17 6.8 McGinnis Creek 4 4 5.1 Sullivan Creek 4 6 3.2 Swamp Creek 1 7 4.9 Total 67 99 72.4

Thompson Project Area Metals, Nutrients, Sediment, and Temperature TMDLs and Water Quality Improvement Plan – Attachment A
6/4/13 4
3.0 SEDIMENT AND HABITAT ASSESSMENT
Substrate character and stream habitat conditions were evaluated by performing a stream channel assessment in the listed tributaries within the Thompson Project Area. Longitudinal surveys including pebble counts, grid toss, cross sections, pool data collection, riparian greenline surveys, and eroding streambank measurements were performed at each of the selected monitoring sites during September of 2011 following methods presented in Field Methodology for the Assessment of TMDL Sediment and Habitat Impairments (DEQ 2011). Field assessment reaches were selected in relatively low-gradient portions of the listed streams to facilitate the evaluation of sediment loading impacts. At least two monitoring reaches were selected per listed stream. The monitoring locations were chosen to represent various reach characteristics, land-use categories, and human-caused influences, but their representativeness relative to other reaches of the same slope, order, confinement and ecoregion, as well as ease of access, were also considered. There was a preference toward sampling those reaches where human influences would most likely lead to impairment conditions, since it is a primary goal of sediment TMDL development to further characterize sediment impairment conditions. Thus, it is not a random sampling design intended to sample stream reaches representing all potential impairment and non-impairment conditions. Instead, it is a targeted sampling design that aims to assess a representative subset of reach types, while ensuring that reaches within each 303(d) listed waterbody with potential sediment impairment conditions are incorporated into the overall evaluation.
3.1 METHODS Sediment and habitat assessments were performed at 16 field monitoring sites, which were selected based on the aerial assessment in GIS and on-the-ground reconnaissance using the factors discussed above. Sediment and habitat data was collected within eight reach types, with the complete sediment and habitat assessment performed at all monitoring sites (Table 3-1, Figures 3-1 and 3-2). Field monitoring sites were assessed progressing in an upstream direction and the length of the monitoring site was based on the bankfull channel width. A monitoring site length of 500 feet was used at four sites in which the bankfull width was less than 10 feet and a monitoring site length of 1,000 feet was used at twelve sites in which the bankfull width was between 10 feet and 50 feet. Each monitoring site was divided into five equally sized study cells in which a series of sediment and habitat measurements were performed. Study cells were numbered 1 through 5 progressing in an upstream direction. The following sections provide brief descriptions of the various field methodologies employed during the sediment and habitat assessment. A more in-depth description of the methods is available in Longitudinal Field Methods for the Assessment of TMDL Sediment and Habitat Impairments (DEQ 2011).

Thompson Project Area Metals, Nutrients, Sediment, and Temperature TMDLs and Water Quality Improvement Plan – Attachment A
6/4/13 5
Table 3-1. Reach Types and Monitoring Sites Reach Type
Number of Reaches
Number of Monitoring
Sites
Monitoring Sites
NR-0-1-U 6 NR-0-2-C 1 NR-0-2-U 2 NR-0-3-C 2 NR-0-3-U 26 6 FTRP06-02, LAZR10-01, LTMP12-01, MCGR06-02,
SWMP01-05, SWMP01-06 NR-0-4-C 3 1 FTRP 08-01 NR-0-4-U 9 3 LBTR01-01, LNCH12-02, LTMP14-03 NR-10-1-C 2 NR-10-1-U 4 NR-10-3-C 1 NR-2-1-U 10 1 MGNS02-01 NR-2-2-U 4 1 MGNS03-01 NR-2-3-C 2 NR-2-3-U 7 2 LAZR08-01 NR-2-4-C 1 NR-2-4-U 1 NR-2-5-U 1 NR-4-1-C 4 NR-4-1-U 8 1 LNCH09-01 NR-4-2-C 1 NR-4-2-U 2 1 HNRY04-01 NR-4-3-C 1 NR-4-3-U 1

Thompson Project Area Metals, Nutrients, Sediment, and Temperature TMDLs and Water Quality Improvement Plan – Attachment A
6/4/13 6
Figure 3-1. Aerial Assessment Reach Stratification

Thompson Project Area Metals, Nutrients, Sediment, and Temperature TMDLs and Water Quality Improvement Plan – Attachment A
6/4/13 7
Figure 3-2. Aerial Assessment Reach Types

Thompson Project Area Metals, Nutrients, Sediment, and Temperature TMDLs and Water Quality Improvement Plan – Attachment A
6/4/13 8
Field measurements conducted during the sediment and habitat assessment include channel form and stability measurements, fine sediment measurements, in-stream habitat measurements, and riparian health measurements, as summarized below:
Channel Form and Stability Measurements • Field Determination of Bankfull • Channel Cross-sections • Floodprone Width Measurements • Water Surface Slope
Fine Sediment Measurements
• Riffle Pebble Count • Riffle Grid Toss • Pool Tail-out Grid Toss • Riffle Stability Index
In-stream Habitat Measurements
• Channel Bed Morphology • Residual Pool Depth • Pool Habitat Quality • Woody Debris Quantification
Riparian Health Measurements
• Riparian Greenline Assessment 3.1.1 Channel Form and Stability Measurements Channel form and stability measurements include the field determination of bankfull, channel cross-sections, floodprone width, and surface water slope. 3.1.1.1 Field Determination of Bankfull The bankfull elevation was determined for each monitoring site. Bankfull is a concept used by hydrologists to define a regularly occurring channel-forming high flow. One of the first generally accepted definitions of bankfull was provided by Dunne and Leopold (1978):
“The bankfull stage corresponds to the discharge at which channel maintenance is the most effective, that is, the discharge at which moving sediment, forming or removing bars, forming or changing bends and meanders, and generally doing work that results in the average morphologic characteristics of channels.”
Indicators that were used to estimate the bankfull elevation included scour lines, changes in vegetation types, tops of point bars, changes in slope, changes in particle size and distribution, staining of rocks, and inundation features. Multiple locations and bankfull indicators were examined at each site to determine the bankfull elevation, which was then applied during channel cross-section measurements.
Thompson Project Area Metals, Nutrients, Sediment, and Temperature TMDLs and Water Quality Improvement Plan – Attachment A
6/4/13 9
3.1.1.2 Channel Cross-sections Channel cross-section measurements were performed at the first riffle in each cell using a line level and a measuring rod. At each cross-section, depth measurements at bankfull were performed across the channel at regular intervals, which varied depending on channel width. These measurements allowed for the calculation of the cross sectional area, the average bankfull depth, and the [bankfull] width/depth ratio. The thalweg depth (i.e., maximum depth) was recorded at the deepest point of the channel independent of the regularly spaced intervals. 3.1.1.3 Floodprone Width Measurements The floodprone elevation was determined by multiplying the maximum depth value by two (Rosgen 1996). The floodprone width was then measured by stringing a tape from the bankfull channel margin on both the right and left banks until the tape (pulled tight and “flat”) touched the ground at the floodprone elevation. When dense vegetation or other features prevented a direct line of tape from being strung, the floodprone width was estimated by pacing or making a visual estimate. The floodprone width divided by the bankfull width of the channel is the entrenchment ratio, which is typically within a certain range by stream type and is an indicator of a stream’s ability to access it floodplain. 3.1.1.4 Water Surface Slope Water surface slope measurements were performed using a transit level and stadia rod. This measurement was used to evaluate the slope assigned in GIS based on the aerial assessment. The field measured slope was used when evaluating the Rosgen stream type at each monitoring site. 3.1.2 Fine Sediment Measurements Fine sediment measurements include the riffle pebble count, riffle grid toss, pool tail-out grid toss, and the riffle stability index. The pebble count and grid toss measurements were used to identify if excess fine sediment was accumulating in areas important for the reproduction and survival of aquatic life. The riffle stability index measures the dominant size of mobile particles in a riffle and is an indicator of excess sediment supply. 3.1.2.1 Riffle Pebble Count One Wolman pebble count (Wolman 1954) was performed at the first riffle encountered in cells 1, 2, 3 and 5, providing a minimum of 400 particles measured within each assessment reach. Particle sizes were measured along their intermediate length axis (b-axis) and results were grouped into size categories. The pebble count was performed from bankfull to bankfull using the “heel to toe” method. 3.1.2.2 Riffle Grid Toss The riffle grid toss was performed at the same location as the pebble count measurement. The riffle grid toss measures fine sediment accumulation on the surface of the streambed. Riffle grid tosses were performed prior to the pebble count to avoid disturbances to surface fine sediments.

Thompson Project Area Metals, Nutrients, Sediment, and Temperature TMDLs and Water Quality Improvement Plan – Attachment A
6/4/13 10
3.1.2.3 Pool Tail-out Grid Toss A measurement of the percent of fine sediment in pool tail-outs was taken using the grid toss method at each pool in which potential spawning gravels were identified. Three measurements were taken in each pool with appropriate sized spawning gravels using a 49-point grid. The spawning potential was recorded as “Yes” (Y) or “Questionable” (Q). No grid toss measurements were made when the substrate was observed to be too large to support spawning. Pool tail-out grid toss measurements were performed when the substrate was observed to be too fine to support spawning since the goal of this assessment is to quantify fine sediment accumulation in spawning areas. 3.1.2.4 Riffle Stability Index In streams that had well-developed point bars, a Riffle Stability Index (RSI) evaluation was performed. RSI measurements consisted of intermediate axis (b-axis) measurements of 15 particles determined to be among the largest size group of recently deposited particles that occur on over 10% of the point bar (Kappesser 2002). During post-field data processing, the riffle stability index was determined by calculating the geometric mean of the dominant bar particle size measurements and comparing the result to the cumulative particle distribution from the riffle pebble count in an adjacent or nearby riffle. 3.1.3 Instream Habitat Measurements Instream habitat measurements include channel bed morphology, residual pool depth, pool habitat quality and woody debris quantification. 3.1.3.1 Channel Bed Morphology The length of each monitoring site occupied by pools and riffles was recorded progressing in an upstream direction. The upstream and downstream stations of “dominant” riffle and pool features were recorded. Features were considered “dominant” when occupying over 50% of the bankfull channel width. 3.1.3.2 Residual Pool Depth At each pool encountered, the maximum depth and the depth of the pool tail crest at its deepest point was measured. The difference between the maximum depth and the tail crest depth is considered the residual pool depth. It is basically a measure of the water depth that will remain in a pool if the channel is drained. No pool tail crest depth was recorded for dammed pools. 3.1.3.3 Pool Habitat Quality Qualitative assessments of each pool feature were undertaken, including pool type (i.e., scour or dammed), size (i.e., small or large), formative feature (i.e., lateral scour, plunge, boulder, woody debris), and cover type (i.e., overhanging vegetation, depth, undercut, boulder, woody debris, none). The total number of pools was also quantified.

Thompson Project Area Metals, Nutrients, Sediment, and Temperature TMDLs and Water Quality Improvement Plan – Attachment A
6/4/13 11
3.1.3.4 Woody Debris Quantification The amount of large woody debris (LWD) within each monitoring site was recorded. Large pieces of woody debris located within the bankfull channel that were relatively stable so as to influence the channel form were counted as either single, aggregate or “willow bunch”. A single piece of large woody debris was counted when it was greater than 9 feet long or spanned two-thirds of the wetted stream width, and 4 inches in diameter at the small end (Overton et al. 1997). Two or more single pieces that are touching each other and collectively influencing channel morphology were considered an aggregate, and the number of pieces per aggregate was recorded. A “willow bunch” could be a dead or living willow, or other riparian shrub, that was in the channel and influencing channel morphology. 3.1.4 Riparian Health Measurements Riparian health measurements include the riparian greenline assessment. 3.1.4.1 Riparian Greenline Assessment An assessment of riparian vegetation cover was performed along both streambanks at each monitoring site. Vegetation types were recorded at 10 to 20-foot intervals, depending on the bankfull channel width. The riparian greenline assessment described the general vegetation community type of the groundcover, understory and overstory. The vegetation options on the field forms for groundcover were wetland, grasses/rose/snowberry, disturbed/bare ground, rock, and riprap; the options for understory and overstory were coniferous, deciduous, and mixed coniferous/deciduous. At 50-foot intervals, the riparian buffer width was estimated on either side of the channel. The riparian buffer width corresponds to the belt of vegetation buffering the stream from adjacent land uses.

Thompson Project Area Metals, Nutrients, Sediment, and Temperature TMDLs and Water Quality Improvement Plan – Attachment A
6/4/13 12
3.2 RESULTS In the Thompson Project Area, sediment and habitat parameters were assessed at 16 monitoring sites. Out of the 23 reach types delineated on the sediment impaired stream segments in GIS, sediment and habitat assessments were performed in eight reach types, with a focus on low gradient reach types. A statistical analysis of the sediment and habitat data is presented by reach type and for individual monitoring sites in the following sections. The complete sediment and habitat dataset is presented in Attachment B. 3.2.1 Reach Type Analysis This section presents a statistical analysis of sediment and habitat base parameters for each of the reach types assessed in the Thompson Project Area. Reach type discussions are based on median values, while summary statistics for the minimum, 25th percentile, 75th percentile, and maximum values are also provided since these may be more applicable for developing sediment TMDL criteria. Sediment and habitat base parameter analysis is provided by reach type for the following parameters:
• width/depth ratio • entrenchment ratio • riffle pebble count <2mm • riffle pebble count <6mm • riffle grid-toss <6mm • pool tail-out grid toss <6mm • residual pool depth • pool frequency • LWD frequency • greenline understory shrub cover • greenline bare ground

Thompson Project Area Metals, Nutrients, Sediment, and Temperature TMDLs and Water Quality Improvement Plan – Attachment A
6/4/13 13
3.2.1.1 Width/Depth Ratio The channel width/depth ratio is defined as the channel width at bankfull divided by the mean bankfull depth (Rosgen 1996). The channel width/depth ratio is one of several standard measurements used to classify stream channels, making it a useful variable for comparing conditions between reaches with the same stream type (Rosgen 1996). A comparison of observed and expected width/depth ratios is also an indicator of channel over-widening and aggradation, which are often linked to excess streambank erosion and/or sediment inputs from sources upstream of the study reach. Channels that are over-widened are often associated with excess sediment deposition and streambank erosion, contain shallower and warmer water, and provide fewer deepwater refugia for fish. Median width/depth ratios for assessed reach types ranged from 9.9 in NR-4-2-U to 31.1 in NR-0-4-U (Figure 3-3 and Table 3-2).
Blue diamonds denote reach types with one monitoring site; red triangles denote more than one monitoring site. Figure 3-3. Width/Depth Ratio Table 3-2. Width/Depth Ratio
Note: See Table 2-1 for reach type descriptions.
NR-0-3-U NR-0-4-U NR-0-4-C NR-2-1-U NR-2-2-U NR-2-3-U NR-4-1-U NR-4-2-U Entire Dataset
# of Monitoring Sites 6 3 1 1 1 2 1 1 16Sample Size 22 14 4 4 5 10 5 5 69
Minimum 10.4 12.4 22.1 4.8 14.5 7.5 15.3 7.0 4.825th Percentile 16.1 25.5 24.2 9.2 16.0 10.1 17.3 9.4 13.1
Median 18.2 31.1 26.2 11.3 16.8 12.1 19.9 9.9 18.075th Percentile 21.6 35.3 28.9 12.0 18.6 15.3 20.5 12.0 24.8
Maximum 37.1 43.1 32.5 12.2 20.8 19.3 29.6 14.1 43.1Monitoring Sites SWMP01-05,
SWMP01-06, LTMP12-01, MCGR06-02, LAZR10-01, FTRP06-02
LNCH12-02, LTMP14-03, LBRT01-01
FTRP08-01 MGNS02-01 MGNS03-01 MCGR02-03, LAZR08-01
LNCH09-01 HNRY04-01
Statistical Parameter Reach Type
Thompson Project Area Metals, Nutrients, Sediment, and Temperature TMDLs and Water Quality Improvement Plan – Attachment A
6/4/13 14
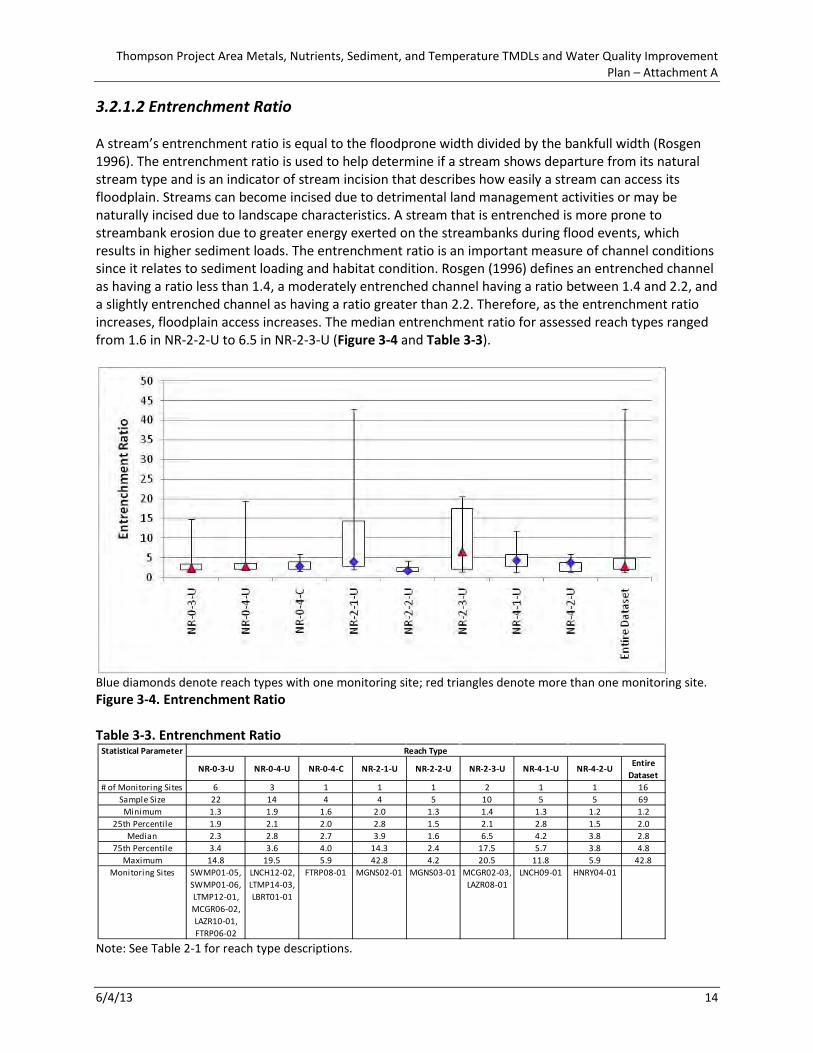
3.2.1.2 Entrenchment Ratio A stream’s entrenchment ratio is equal to the floodprone width divided by the bankfull width (Rosgen 1996). The entrenchment ratio is used to help determine if a stream shows departure from its natural stream type and is an indicator of stream incision that describes how easily a stream can access its floodplain. Streams can become incised due to detrimental land management activities or may be naturally incised due to landscape characteristics. A stream that is entrenched is more prone to streambank erosion due to greater energy exerted on the streambanks during flood events, which results in higher sediment loads. The entrenchment ratio is an important measure of channel conditions since it relates to sediment loading and habitat condition. Rosgen (1996) defines an entrenched channel as having a ratio less than 1.4, a moderately entrenched channel having a ratio between 1.4 and 2.2, and a slightly entrenched channel as having a ratio greater than 2.2. Therefore, as the entrenchment ratio increases, floodplain access increases. The median entrenchment ratio for assessed reach types ranged from 1.6 in NR-2-2-U to 6.5 in NR-2-3-U (Figure 3-4 and Table 3-3).
Blue diamonds denote reach types with one monitoring site; red triangles denote more than one monitoring site. Figure 3-4. Entrenchment Ratio Table 3-3. Entrenchment Ratio
Note: See Table 2-1 for reach type descriptions.
NR-0-3-U NR-0-4-U NR-0-4-C NR-2-1-U NR-2-2-U NR-2-3-U NR-4-1-U NR-4-2-U Entire Dataset
# of Monitoring Sites 6 3 1 1 1 2 1 1 16Sample Size 22 14 4 4 5 10 5 5 69
Minimum 1.3 1.9 1.6 2.0 1.3 1.4 1.3 1.2 1.225th Percentile 1.9 2.1 2.0 2.8 1.5 2.1 2.8 1.5 2.0
Median 2.3 2.8 2.7 3.9 1.6 6.5 4.2 3.8 2.875th Percentile 3.4 3.6 4.0 14.3 2.4 17.5 5.7 3.8 4.8
Maximum 14.8 19.5 5.9 42.8 4.2 20.5 11.8 5.9 42.8Monitoring Sites SWMP01-05,
SWMP01-06, LTMP12-01, MCGR06-02, LAZR10-01, FTRP06-02
LNCH12-02, LTMP14-03, LBRT01-01
FTRP08-01 MGNS02-01 MGNS03-01 MCGR02-03, LAZR08-01
LNCH09-01 HNRY04-01
Statistical Parameter Reach Type

Thompson Project Area Metals, Nutrients, Sediment, and Temperature TMDLs and Water Quality Improvement Plan – Attachment A
6/4/13 15
3.2.1.3 Riffle Pebble Count <2mm Percent surface fine sediment measures the amount of siltation occurring in a river system. Surface fine sediment measured using the Wolman (1954) pebble count method is one indicator of aquatic habitat condition and higher values can signify excessive sediment loading. The Wolman pebble count provides a survey of the particle distribution of the entire channel width, allowing investigators to calculate a percentage of the surface substrate (as frequency of occurrence) composed of fine sediment. Median values for the percent of fine sediment <2mm based on riffle pebble counts ranged from 1% in NR-0-3-U and NR-4-2-U to 14% in NR-0-4-C (Figure 3-5 and Table 3-4).
Blue diamonds denote reach types with one monitoring site; red triangles denote more than one monitoring site. Figure 3-5. Riffle Pebble Count <2mm Table 3-4. Riffle Pebble Count <2mm
Note: See Table 2-1 for reach type descriptions.
NR-0-3-U NR-0-4-U NR-0-4-C NR-2-1-U NR-2-2-U NR-2-3-U NR-4-1-U NR-4-2-U Entire Dataset
# of Monitoring Sites 6 3 1 1 1 2 1 1 16Sample Size 22 12 4 4 4 8 4 4 62
Minimum 0 0 7 4 1 3 1 0 025th Percentile 0 2 11 7 2 5 1 0 1
Median 1 3 14 8 2 13 2 1 375th Percentile 6 13 16 13 3 25 3 1 9
Maximum 18 33 18 25 5 37 6 2 37Monitoring Sites SWMP01-05,
SWMP01-06, LTMP12-01, MCGR06-02, LAZR10-01, FTRP06-02
LNCH12-02, LTMP14-03, LBRT01-01
FTRP08-01 MGNS02-01 MGNS03-01 MCGR02-03, LAZR08-01
LNCH09-01 HNRY04-01
Statistical Parameter Reach Type

Thompson Project Area Metals, Nutrients, Sediment, and Temperature TMDLs and Water Quality Improvement Plan – Attachment A
6/4/13 16
3.2.1.4 Riffle Pebble Count <6mm As with surface fine sediment <2mm, an accumulation of surface fine sediment <6mm may indicate excess sedimentation. Median values for the percent of fine sediment <6mm based on pebble counts conducted in riffles ranged from 1% in NR-4-2-U to 18% in NR-0-4-C (Figure 3-6 and Table 3-5). The percent of fine sediment <6mm followed the same general trend as the percent of fine sediment <2mm.
Blue diamonds denote reach types with one monitoring site; red triangles denote more than one monitoring site. Figure 3-6. Riffle Pebble Count <6mm Table 3-5. Riffle Pebble Count <6mm
Note: See Table 2-1 for reach type descriptions.
NR-0-3-U NR-0-4-U NR-0-4-C NR-2-1-U NR-2-2-U NR-2-3-U NR-4-1-U NR-4-2-U Entire Dataset
# of Monitoring Sites 6 3 1 1 1 2 1 1 16Sample Size 22 12 4 4 4 8 4 4 62
Minimum 0 0 12 7 2 8 1 0 025th Percentile 2 2 16 9 2 13 1 0 2
Median 6 3 18 11 4 17 2 1 675th Percentile 8 19 18 18 5 25 3 3 14
Maximum 28 42 19 33 6 37 6 5 42Monitoring Sites SWMP01-05,
SWMP01-06, LTMP12-01, MCGR06-02, LAZR10-01, FTRP06-02
LNCH12-02, LTMP14-03, LBRT01-01
FTRP08-01 MGNS02-01 MGNS03-01 MCGR02-03, LAZR08-01
LNCH09-01 HNRY04-01
Statistical Parameter Reach Type

Thompson Project Area Metals, Nutrients, Sediment, and Temperature TMDLs and Water Quality Improvement Plan – Attachment A
6/4/13 17
3.2.1.5 Riffle Grid Toss <6mm The riffle grid toss is a standard procedure frequently used in aquatic habitat assessments that provides complimentary information to the Wolman pebble count. Median values for riffle grid toss fine sediment <6mm in the Thompson Project Area range from 0% in NR-2-2-U to 8% in NR-2-1-U (Figure 3-7 and Table 3-6).
Blue diamonds denote reach types with one monitoring site; red triangles denote more than one monitoring site. Figure 3-7. Riffle Grid Toss Fine Sediment <6mm Table 3-6. Riffle Grid Toss Fine Sediment <6mm
Note: See Table 2-1 for reach type descriptions.
NR-0-3-U NR-0-4-U NR-0-4-C NR-2-1-U NR-2-2-U NR-2-3-U NR-4-1-U NR-4-2-U Entire Dataset
# of Monitoring Sites 6 3 1 1 1 2 1 1 16Sample Size 22 12 4 4 4 8 4 4 62
Minimum 0 0 2 6 0 0 1 0 025th Percentile 2 3 3 7 0 0 2 4 1
Median 3 5 3 8 0 4 3 5 475th Percentile 6 7 4 11 1 10 5 6 7
Maximum 31 11 4 14 3 16 6 7 31Monitoring Sites SWMP01-05,
SWMP01-06, LTMP12-01, MCGR06-02, LAZR10-01, FTRP06-02
LNCH12-02, LTMP14-03, LBRT01-01
FTRP08-01 MGNS02-01 MGNS03-01 MCGR02-03, LAZR08-01
LNCH09-01 HNRY04-01
Statistical Parameter Reach Type

Thompson Project Area Metals, Nutrients, Sediment, and Temperature TMDLs and Water Quality Improvement Plan – Attachment A
6/4/13 18
3.2.1.6 Pool Tail-out Grid Toss <6mm Grid toss measurements in pool tail-outs provide a measure of fine sediment accumulation in potential fish spawning sites, which may have detrimental impacts on aquatic habitat by cementing spawning gravels, preventing flushing of toxins in egg beds, reducing oxygen and nutrient delivery to eggs and embryos, and impairing emergence of fry (Meehan 1991). Weaver and Fraley (1991) observed a significant inverse relationship between the percentage of material less than 6.35mm and the emergence success of westslope cutthroat trout and bull trout, both of which are present in the Thompson Project Area. Median values for pool tail-out grid toss fine sediment <6mm range from 3% in NR-0-4-C to 22% in NR-2-1-U (Figure 3-8 and Table 3-7).
Blue diamonds denote reach types with one monitoring site; red triangles denote more than one monitoring site. Figure 3-8. Pool Tail-out Grid Toss <6mm Table 3-7. Pool Tail-out Grid Toss <6mm
Note: See Table 2-1 for reach type descriptions. No data was collected at the following monitoring sites since no potential spawning gravels were identified: LTMP12-01, LNCH12-02, MGNS03-01, MCGR02-03, and HNRY04-01.
NR-0-3-U NR-0-4-U NR-0-4-C NR-2-1-U NR-2-2-U NR-2-3-U NR-4-1-U NR-4-2-U Entire Dataset
# of Monitoring Sites 6 3 1 1 1 2 1 1 16Sample Size 30 7 4 4 0 9 9 0 63
Minimum 0 2 1 10 5 2 025th Percentile 4 4 2 19 9 4 4
Median 7 5 3 22 11 6 775th Percentile 10 7 3 27 12 10 12
Maximum 31 22 5 40 19 18 40Monitoring Sites SWMP01-05,
SWMP01-06, LTMP12-01, MCGR06-02, LAZR10-01, FTRP06-02
LNCH12-02, LTMP14-03, LBRT01-01
FTRP08-01 MGNS02-01 MGNS03-01 MCGR02-03, LAZR08-01
LNCH09-01 HNRY04-01
Statistical Parameter Reach Type

Thompson Project Area Metals, Nutrients, Sediment, and Temperature TMDLs and Water Quality Improvement Plan – Attachment A
6/4/13 19
3.2.1.7 Residual Pool Depth Residual pool depth, defined as the difference between the maximum depth and the tail crest depth, is a discharge-independent measure of pool depth and an indicator of the quality of pool habitat. Deep pools are important resting and hiding habitat for fish, and provide refugia during temperature extremes. Residual pool depth is also an indirect measurement of sediment inputs to streams since an increase in sediment loading can cause pools to fill, thus decreasing residual pool depth over time. Median residual pool depths ranged from 0.5 feet in NR-4-2-U to 1.4 feet in NR-0-4-C (Figure 3-9 and Table 3-8). This analysis indicates that the deepest pools are found in low gradient 3rd and 4th order streams in the Thompson Project Area.
Blue diamonds denote reach types with one monitoring site; red triangles denote more than one monitoring site. Figure 3-9. Residual Pool Depth Table 3-8. Residual Pool Depth
Note: See Table 2-1 for reach type descriptions.
NR-0-3-U NR-0-4-U NR-0-4-C NR-2-1-U NR-2-2-U NR-2-3-U NR-4-1-U NR-4-2-U Entire Dataset
# of Monitoring Sites 6 3 1 1 1 2 1 1 16Sample Size 57 28 5 17 7 20 18 11 163
Minimum 0.5 0.5 1.0 0.3 0.6 0.3 0.4 0.3 0.325th Percentile 0.8 1.0 1.3 0.6 0.8 0.5 0.5 0.5 0.6
Median 1.3 1.2 1.4 0.7 1.1 0.7 0.8 0.5 0.975th Percentile 2.0 1.9 1.9 0.9 1.2 0.8 1.2 0.6 1.4
Maximum 4.0 3.2 3.0 1.1 1.4 0.9 1.5 0.8 4.0Monitoring Sites SWMP01-05,
SWMP01-06, LTMP12-01, MCGR06-02, LAZR10-01, FTRP06-02
LNCH12-02, LTMP14-03, LBRT01-01
FTRP08-01 MGNS02-01 MGNS03-01 MCGR02-03, LAZR08-01
LNCH09-01 HNRY04-01
Statistical Parameter Reach Type

Thompson Project Area Metals, Nutrients, Sediment, and Temperature TMDLs and Water Quality Improvement Plan – Attachment A
6/4/13 20
3.2.1.8 Pool Frequency Pool frequency is a measure of the availability of pools to provide rearing habitat, cover, and refugia for salmonids. Pool frequency is related to channel complexity, availability of stable obstacles, and sediment supply. Excessive erosion and sediment deposition can reduce pool frequency by filling in smaller pools. Pool frequency can also be adversely affected by riparian habitat degradation resulting in a reduced supply of large woody debris or scouring from stable root masses in streambanks. Excluding reach types with only one monitoring site, the median value for the number of pools per 1,000 feet ranged from eight (NR-0-4-U) to 20 (NR-2-3-U) (Figure 3-10 and Table 3-9).
Blue diamonds denote reach types with one monitoring site; red triangles denote more than one monitoring site. Figure 3-10. Pools per 1000 Feet Table 3-9. Pools per 1000 feet
Note: See Table 2-1 for reach type descriptions. Reach types with only one monitoring site denoted in blue italics.
NR-0-3-U NR-0-4-U NR-0-4-C NR-2-1-U NR-2-2-U NR-2-3-U NR-4-1-U NR-4-2-U Entire Dataset
# of Monitoring Sites 6 3 1 1 1 2 1 1 16Sample Size 6 3 1 1 1 2 1 1 16
Minimum 6 5 5 34 7 14 18 22 525th Percentile 9 7 5 34 7 17 18 22 8
Median 11 8 5 34 7 20 18 22 1375th Percentile 13 12 5 34 7 23 18 22 16
Maximum 14 15 5 34 7 26 18 22 34Monitoring Sites SWMP01-05,
SWMP01-06, LTMP12-01, MCGR06-02, LAZR10-01, FTRP06-02
LNCH12-02, LTMP14-03, LBRT01-01
FTRP08-01 MGNS02-01 MGNS03-01 MCGR02-03, LAZR08-01
LNCH09-01 HNRY04-01
Statistical Parameter Reach Type

Thompson Project Area Metals, Nutrients, Sediment, and Temperature TMDLs and Water Quality Improvement Plan – Attachment A
6/4/13 21
Pool frequency data is also provided as pools per mile in Table 3-10 for future TMDL applications. Table 3-10. Pools per Mile
Note: See Table 2-1 for reach type descriptions. Reach types with only one monitoring site denoted in blue italics. 3.2.1.9 Large Woody Debris Frequency Large woody debris (LWD) is a critical component of high-quality salmonid habitat, providing habitat complexity, quality pool habitat, cover, and long-term nutrient inputs. LWD also constitutes a primary influence on stream function, including sediment and organic material transport, channel form, bar formation and stabilization, and flow dynamics (Bilby and Ward 1989). LWD frequency can be measured and compared to reference reaches or literature values to determine if more or less LWD is present than would be expected under optimal conditions. Excluding reach types with only one monitoring site, the median value for the amount of large woody debris per 1,000 feet ranged from 36 in NR-0-3-U to 91 in NR-2-3-U (Figure 3-11 and Table 3-11). Note that “willow bunches” assigned in the field were tallied as large woody debris. Thus, this analysis makes no distinction as to the size of the woody material.
Blue diamonds denote reach types with one monitoring site; red triangles denote more than one monitoring site. Figure 3-11. Large Woody Debris per 1000 Feet
NR-0-3-U NR-0-4-U NR-0-4-C NR-2-1-U NR-2-2-U NR-2-3-U NR-4-1-U NR-4-2-U Entire Dataset
Minimum 32 26 26 180 37 74 95 116 2625th Percentile 49 34 26 180 37 90 95 116 41
Median 58 42 26 180 37 106 95 116 6675th Percentile 67 61 26 180 37 121 95 116 83
Maximum 74 79 26 180 37 137 95 116 180
Statistical Parameter Reach Type

Thompson Project Area Metals, Nutrients, Sediment, and Temperature TMDLs and Water Quality Improvement Plan – Attachment A
6/4/13 22
Table 3-11. Large Woody Debris per 1000 Feet
Note: See Table 1-1 for reach type descriptions. Reach types with only one monitoring site denoted in blue italics. Data is also provided as large woody debris per mile in Table 3-12 for future TMDL applications. Table 3-12. Large Woody Debris per Mile
Note: See Table 2-1 for reach type descriptions. Reach types with only one monitoring site denoted in blue italics.
NR-0-3-U NR-0-4-U NR-0-4-C NR-2-1-U NR-2-2-U NR-2-3-U NR-4-1-U NR-4-2-U Entire Dataset
# of Monitoring Sites 6 3 1 1 1 2 1 1 16Sample Size 6 3 1 1 1 2 1 1 16
Minimum 0 23 21 118 129 32 49 30 025th Percentile 22 33 21 118 129 62 49 30 28
Median 36 43 21 118 129 91 49 30 4275th Percentile 46 47 21 118 129 121 49 30 53
Maximum 60 50 21 118 129 150 49 30 150Monitoring Sites SWMP01-05,
SWMP01-06, LTMP12-01, MCGR06-02, LAZR10-01, FTRP06-02
LNCH12-02, LTMP14-03, LBRT01-01
FTRP08-01 MGNS02-01 MGNS03-01 MCGR02-03, LAZR08-01
LNCH09-01 HNRY04-01
Statistical Parameter Reach Type
NR-0-3-U NR-0-4-U NR-0-4-C NR-2-1-U NR-2-2-U NR-2-3-U NR-4-1-U NR-4-2-U Entire Dataset
Minimum 0 121 111 623 681 169 259 158 025th Percentile 116 174 111 623 681 325 259 158 149
Median 191 227 111 623 681 480 259 158 22275th Percentile 245 246 111 623 681 636 259 158 277
Maximum 317 264 111 623 681 792 259 158 792
Statistical Parameter Reach Type

Thompson Project Area Metals, Nutrients, Sediment, and Temperature TMDLs and Water Quality Improvement Plan – Attachment A
6/4/13 23
3.3.1.10 Greenline Understory Shrub Cover Riparian shrub cover is an important influence on streambank stability. Removal of riparian shrub cover can dramatically increase streambank erosion and increase channel width/depth ratios. Shrubs stabilize streambanks by holding soil and armoring lower banks with their roots, and reduce scouring energy of water by slowing flows with their branches. Good riparian shrub cover is also important for fish habitat. Riparian shrubs provide shade, reducing solar inputs and increases in water temperature. The dense network of fibrous roots of riparian shrubs allows streambanks to remain intact while water scours the lowest portion of streambanks, creating important fish habitat in the form of overhanging banks and lateral scour pools. Excluding reach types with only one monitoring site, the median value for greenline understory shrub cover ranged from 64% in NR-0-4-U to 77% in NR-2-3-U (Figure 3-12 and Table 3-13).
Blue diamonds denote reach types with one monitoring site; red triangles denote more than one monitoring site. Figure 3-12. Greenline Understory Shrub Cover Table 3-13. Greenline Understory Shrub Cover
Note: See Table 2-1 for reach type descriptions. Reach types with only one monitoring site denoted in blue italics.
NR-0-3-U NR-0-4-U NR-0-4-C NR-2-1-U NR-2-2-U NR-2-3-U NR-4-1-U NR-4-2-U Entire Dataset
# of Monitoring Sites 6 3 1 1 1 2 1 1 16Sample Size 6 3 1 1 1 2 1 1 16
Minimum 31 35 99 48 53 75 9 76 925th Percentile 44 50 99 48 53 76 9 76 46
Median 70 64 99 48 53 77 9 76 7075th Percentile 86 71 99 48 53 77 9 76 78
Maximum 90 78 99 48 53 78 9 76 99Monitoring Sites SWMP01-05,
SWMP01-06, LTMP12-01, MCGR06-02, LAZR10-01, FTRP06-02
LNCH12-02, LTMP14-03, LBRT01-01
FTRP08-01 MGNS02-01 MGNS03-01 MCGR02-03, LAZR08-01
LNCH09-01 HNRY04-01
Statistical Parameter Reach Type

Thompson Project Area Metals, Nutrients, Sediment, and Temperature TMDLs and Water Quality Improvement Plan – Attachment A
6/4/13 24
3.2.1.11 Greenline Bare Ground Percent bare ground is an important indicator of erosion potential, as well as an indicator of land management influences on riparian habitat. Bare ground was noted in the greenline inventory where recent disturbance has resulted in exposed bare soil. Bare ground is often caused by trampling from livestock or wildlife, fallen trees, recent bank failure, new sediment deposits from overland or overbank flow, or severe disturbance in the riparian area, such as from past mining, road-building, or fire. Ground cover on streambanks is important to prevent sediment recruitment to stream channels since sediment can wash in from unprotected areas during snowmelt, storm runoff and flooding. Bare areas are also more susceptible to erosion from hoof shear. Excluding reach types with only one monitoring site, the median value for greenline bare ground ranged from 0% in NR-0-3-U to 6% in NR-0-4-U (Figure 3-13 and Table 3-14).
Blue diamonds denote reach types with one monitoring site; red triangles denote more than one monitoring site. Figure 3-13. Greenline Bare Ground Table 3-14. Greenline Bare Ground
Note: See Table 2-1 for reach type descriptions. Reach types with only one monitoring site denoted in blue italics.
NR-0-3-U NR-0-4-U NR-0-4-C NR-2-1-U NR-2-2-U NR-2-3-U NR-4-1-U NR-4-2-U Entire Dataset
# of Monitoring Sites 6 3 1 1 1 2 1 1 16Sample Size 6 3 1 1 1 2 1 1 16
Minimum 0 2 0 0 0 0 1 0 025th Percentile 0 4 0 0 0 0 1 0 0
Median 0 6 0 0 0 0 1 0 075th Percentile 1 7 0 0 0 0 1 0 1
Maximum 8 8 0 0 0 0 1 0 8Monitoring Sites SWMP01-05,
SWMP01-06, LTMP12-01, MCGR06-02, LAZR10-01, FTRP06-02
LNCH12-02, LTMP14-03, LBRT01-01
FTRP08-01 MGNS02-01 MGNS03-01 MCGR02-03, LAZR08-01
LNCH09-01 HNRY04-01
Statistical Parameter Reach Type
Thompson Project Area Metals, Nutrients, Sediment, and Temperature TMDLs and Water Quality Improvement Plan – Attachment A
6/4/13 25
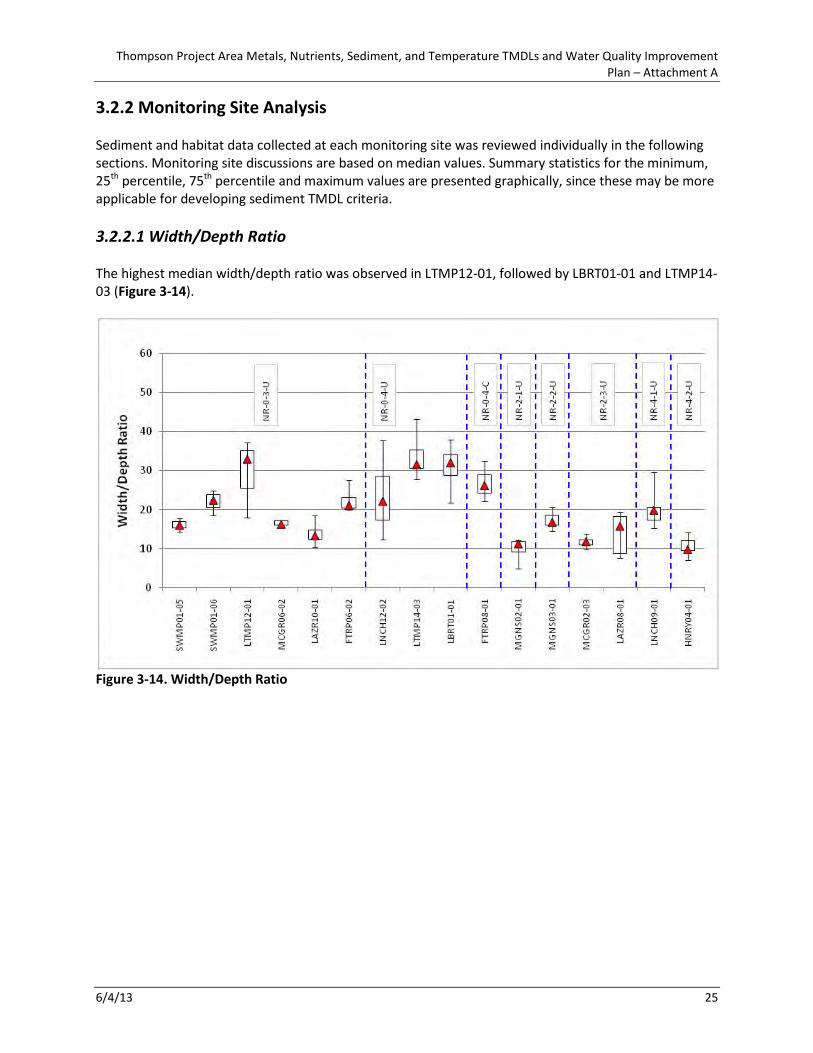
3.2.2 Monitoring Site Analysis Sediment and habitat data collected at each monitoring site was reviewed individually in the following sections. Monitoring site discussions are based on median values. Summary statistics for the minimum, 25th percentile, 75th percentile and maximum values are presented graphically, since these may be more applicable for developing sediment TMDL criteria. 3.2.2.1 Width/Depth Ratio The highest median width/depth ratio was observed in LTMP12-01, followed by LBRT01-01 and LTMP14-03 (Figure 3-14).
Figure 3-14. Width/Depth Ratio

Thompson Project Area Metals, Nutrients, Sediment, and Temperature TMDLs and Water Quality Improvement Plan – Attachment A
6/4/13 26
3.2.2.2 Entrenchment Ratio Median entrenchment ratio values measured within the Thompson Project Area indicates the following (Figure 3-15):
1. MCGR02-03 on McGregor Creek has the greatest amount of floodplain access out of the sites assessed.
2. Moderately entrenched conditions (entrenchment ratio 1.4-2.2) were documented in SWMP01-05, MGNS03-01, LTMP12-01, LTMP14-03, MCGR06-02, LAZR08-01, and FTRP06-02.
Figure 3-15. Entrenchment Ratio

Thompson Project Area Metals, Nutrients, Sediment, and Temperature TMDLs and Water Quality Improvement Plan – Attachment A
6/4/13 27
3.2.2.3 Riffle Pebble Count <2mm The median percent of fine sediment in riffles <2mm as measured by a pebble count was highest in LBRT01-01, followed by MCGR02-03 (Figure 3-16).
Figure 3-16. Riffle Pebble Count <2mm

Thompson Project Area Metals, Nutrients, Sediment, and Temperature TMDLs and Water Quality Improvement Plan – Attachment A
6/4/13 28
3.2.2.4 Riffle Pebble Count <6mm The percent of fine sediment in riffles <6mm as measured by a pebble count followed a similar trend as the percent of fine sediment <2mm, with the highest median values in LBRT01-01, followed by MCGR02-03 (Figure 3-17).
Figure 3-17. Riffle Pebble Count <6mm

Thompson Project Area Metals, Nutrients, Sediment, and Temperature TMDLs and Water Quality Improvement Plan – Attachment A
6/4/13 29
3.2.2.5 Riffle Grid Toss <6mm The median percent of fine sediment in riffles <6mm as measured by a grid toss was highest in SWMP01-05, followed by LAZR08-01 (Figure 3-18).
Figure 3-18. Riffle Grid Toss <6mm 3.2.2.6 Riffle Stability Index The mobile percentile of particles on the riffle is termed "Riffle Stability Index" (RSI) and provides a useful estimate of the degree of increased sediment supply to riffles. The RSI addresses situations in which increases in gravel bedload from headwater activities is depositing material on riffles and filling pools, and it reflects qualitative differences between reference and managed watersheds. Although the expected range varies some by stream type, increasing RSI values above 40-70 generally indicate increased sediment supply to riffles (Kappesser 2002). In the Thompson Project Area, RSI evaluations were performed in SWMP01-06, LNCH09-01, LTMP14-03, and LTMP12-01 (Table 3-15). Table 3-15. Riffle Stability Index Summary
Mobile Particle Analysis Pebble Count Analysis RSI Site Cell Geometric Mean (mm) Cell D50 (mm)
SWMP01-06 1 83 1 37 86 SWMP01-06 2 92 2 37 98 LNCH09-01 1 81 1 43 85 LNCH09-01 3 79 3 38 89 LNCH09-01 5 86 5 42 90 LTMP14-03 5 94 5 60 73 LTMP12-01 2 123 2 62 85

Thompson Project Area Metals, Nutrients, Sediment, and Temperature TMDLs and Water Quality Improvement Plan – Attachment A
6/4/13 30
3.2.2.7 Pool Tail-out Grid Toss <6mm Fine sediment in pool tail-outs as measured by the grid toss followed a similar pattern as the riffle grid toss. The median percent of fine sediment in pool tail-outs as measured with the grid toss was highest in MGNS02-01, followed by SWMP01-05 and LAZR08-01 (Figure 3-19).
Blue diamonds denote sites in which no potential spawning gravels were identified and the pool tail-out grid toss was not performed. Figure 3-19. Pool Tail-out Grid Toss <6mm

Thompson Project Area Metals, Nutrients, Sediment, and Temperature TMDLs and Water Quality Improvement Plan – Attachment A
6/4/13 31
3.2.2.8 Residual Pool Depth The greatest median residual pool depth was measured in SWMP01-05, followed by SWMP01-06 and LBRT01-01 (Figure 3-20). The lowest residual pool depth was found in HNRY04-01 and MCGR02-03.
Figure 3-20. Residual Pool Depth

Thompson Project Area Metals, Nutrients, Sediment, and Temperature TMDLs and Water Quality Improvement Plan – Attachment A
6/4/13 32
3.2.2.9 Pool and Large Woody Debris Frequency MGNS02-01 had the greatest number of pools per 1000 feet, followed by LAZR08-01 and HNRY04-01 (Figure 3-21). MCGR02-03 had the greatest amount of large woody debris per 1000 feet, followed by MGNS03-01 and MGNS02-01, (Figure 3-21).
Figure 3-21. Pool and Large Woody Debris Frequency

Thompson Project Area Metals, Nutrients, Sediment, and Temperature TMDLs and Water Quality Improvement Plan – Attachment A
6/4/13 33
3.2.2.10 Greenline Understory Shrub Cover Understory shrub cover exceeded 50% at all except monitoring sites, except LNCH09-01, LNCH12-02, SWMP01-05, SWMP01-06, and MGNS02-01 (Figure 3-22).
Figure 3-22. Greenline Understory Shrub Cover

Thompson Project Area Metals, Nutrients, Sediment, and Temperature TMDLs and Water Quality Improvement Plan – Attachment A
6/4/13 34
3.2.2.11 Greenline Bare Ground Mean bare ground values equaled or exceeded 5% in SWMP01-05, LNCH12-02, and LBRT01-01, with all other monitoring sites remaining below 5% (Figure 3-23).
Figure 3-23. Greenline Bare Ground

Thompson Project Area Metals, Nutrients, Sediment, and Temperature TMDLs and Water Quality Improvement Plan – Attachment A
6/4/13 35
3.2.3 Site Visit Notes Following field data collection, field notes were recorded describing conditions observed in the field. Field notes were recorded for four categories and are summarized in the following sections:
• Description of human impacts and there severity • Description of stream channel conditions • Description of streambank erosion conditions • Description of riparian vegetation conditions
3.2.3.1 Fishtrap Creek – FTRP06-02 The FTRP06-02 monitoring site was assessed for potential reference conditions. Historic timber harvest was observed along this reach and has occurred in the Fishtrap Creek watershed. The monitoring site was located in a meadow area approximately 1.5 miles upstream of the confluence with the West Fork Fishtrap Creek. The meandering stream channel contained a well developed riffle-pool sequence, with deep pools formed at the outsides of meander bends. Pool tail-outs contained appropriate sized spawning gravels. Streambank erosion was occurring at the outsides of meander bends. Failed beaver dams were noted in the reach and eroding sediment deposits behind beaver dams may be a source of fine sediment to this system. Streambanks are comprised of relatively fine grained material, which is perhaps a remnant of historic beaver complexes. Riparian vegetation included small willows, grasses and wetland vegetation. The potential for this reach is a C4 stream type, while the existing condition ranges from C4 to B4c. 3.2.3.2 Fishtrap Creek – FTRP08-01 The FTRP08-01 monitoring site was assessed for potential reference conditions. The monitoring site was located approximately 2.2 miles downstream of the confluence with the West Fork Fishtrap Creek. Historic timber harvest has occurred in the Fishtrap Creek watershed and tree stumps were observed in the riparian corridor along this reach. The Fishtrap McGinnis road parallels the reach, encroaching on the channel at the downstream end of the monitoring site. This reach contained long glides with well-vegetated undercut banks downstream of relatively deep pools at meander bends. Larger gravel in these glides may provide spawning habitat for sufficiently large fish. The streambed was comprised of gravels and small cobbles, with a well defined riffle-pool sequence. Riparian vegetation consisted of alder and red osier dogwood with conifers extending up the hillslope on river right. The potential for this reach is a C4 stream type, while the existing condition ranges from B4c to C4. 3.2.3.3 Henry Creek – HNRY04-01 HNRY04-01 was located adjacent to the road that parallels the stream along the narrow valley bottom. Timber harvest has occurred in the watershed, but not adjacent to the reach. The channel was a relatively straight riffle-dominated cascade with small pocket pools and coarse substrate. Pools were relatively shallow and the substrate was too large to support spawning. The channel was lined with alders and the streambanks contained relatively coarse material, which limits overall sediment loads from streambank erosion, though many of the streambanks were exposed. The potential for this reach is a B3a stream type, while the existing condition ranges from F3a to E3a to C3/4a to B4a. The restoration

Thompson Project Area Metals, Nutrients, Sediment, and Temperature TMDLs and Water Quality Improvement Plan – Attachment A
6/4/13 36
potential for this reach is low due to the narrow valley bottom, steep channel gradient, large substrate size, and close proximity of the road. 3.2.3.4 Lazier Creek – LAZR08-01 LAZR08-01 was located downstream of the confluence with Whitney Creek. Timber harvest and riparian grazing are the primary land-use activities along this reach, while extensive timber harvest has occurred throughout the Lazier Creek watershed. Portions of this reach were completely overgrown with Hawthorn, rendering them inaccessible, with the remainder of the reach lined with grasses and wetland vegetation. The meandering channel contained a well defined riffle-pool sequence with a fine gravel substrate that created spawning conditions well suited for the small fish that likely inhabit this stream. Streambank erosion was occurring at the outsides of meander bends. The potential for this reach is an E4 stream type, while the existing condition ranges from E4b to B4. The restoration potential for this reach is moderate. 3.2.3.5 Lazier Creek – LAZR10-01 LAZR10-01 is located approximately 0.1 miles upstream of the mouth, where Lazier Creek joins the Thompson River. Historic timber harvest is the primary land-use activity along this reach, while extensive timber harvest has occurred throughout the Lazier Creek watershed. The channel was predominately comprised of long riffles with a cobble substrate and few pools. Streambank erosion was observed at channel bends, though streambanks were generally stabilized by deep rooting vegetation and armored by cobbles and large woody debris. Alder, hawthorn and red osier dogwood comprised the riparian shrub community, with larger conifers on the hillslopes above the stream. The potential for this reach is a B4 stream type, while the existing condition ranges from C4b to E4b to B4. The restoration potential for this reach is moderate and could include increasing riparian shrub density and diversity. 3.2.3.6 Little Bitterroot River – LBRT01-01 LBRT01-01 is located approximately 0.5 miles downstream of Hubbart Reservoir. Grazing is the primary land-use adjacent to this reach, along with timber harvest in the upper watershed. Pugging and hummocking were noted and the wetland vegetation was heavily browsed. Streamflows were relatively high and appeared to be near bankfull during the site visit on September 13, 2011. The cold water was tannic colored and there was an organic smell emanating from the stream. A local rancher indicated that this reservoir is operated for irrigation purposes and the water is shut off in mid-September, leaving only tributary stream inputs to sustain the streamflow. The streambed was composed of fine gravel and sand that easily formed depressions and pools behind large woody debris and overhanging streamside vegetation. The majority of the channel was a deep run, with a few short riffles. There was a layer of fine material coating the streambed and extensive aquatic vegetation. Extensive hoof shear was observed along the grass covered streambanks, though streambank erosion appeared limited due to stable streamflows resulting from reservoir operations that created conditions resembling a spring creek. The potential for this reach given the upstream reservoir is a C4 stream type, while the existing condition ranges from B4c to C4. The restoration potential for this reach is moderate and could involve improved grazing management to encourage the development of a riparian shrub community. A site visit was also conducted to LBRT01-05 near the lower end of the sediment impaired stream segment of the Little Bitterroot River. This site visit was accompanied by the landowner who provided
Thompson Project Area Metals, Nutrients, Sediment, and Temperature TMDLs and Water Quality Improvement Plan – Attachment A
6/4/13 37
valuable insight into how the dam was operated. This site was similar to LBRT01-01, though the channel was more sinuous and streambank erosion appeared more severe. This site is actively used for livestock grazing. Woody vegetation was essentially absent along the stream channel and the wetland vegetation was heavily browsed. The channel was a deep run with a streambed comprised of fine gravel and sand, with deep pools at the outsides of meander bends. 3.2.3.7 Little Thompson River – LTMP12-01 LTMP12-01 is located approximately 1.0 miles upstream from the confluence with the North Fork Little Thompson River. A dense band of alders line the stream channel along this reach, covering the narrow valley bottom, while conifers reside on the hillslopes. Historic logging and on-going grazing are the primary land-uses along this reach, with the Little Thompson River Road situated on the river right hillslope. Selective browse of the wetland vegetation along the channel margin was observed and hoof shear was noted along the streambanks. The streambed was comprised of coarse gravel and cobble substrate, with a good distribution of riffles and pools. Multiple depositional features suggest aggradation is occurring and the upper two study cells are braided. In places, the depositional features constrict the channel, leading to the formation of deep pools, though the large substrate size limits spawning potential. Flow constrictions due to depositional features also lead to localized streambank erosion, though the streambanks were comprised of coarse gravel and cobbles, which likely limits the overall retreat rate. A layer of fine silt was noted in slow water areas, potentially from aerial deposition from the adjacent roadbed. Imbricated cobbles on point bars suggest active bedload transport. The potential for this reach is a B3 stream type, while the existing condition ranges from F3 to C3 to B3c. The restoration potential for this reach is low. The addition of large woody debris aggregates to improve pool habitat and enhance channel complexity would likely be beneficial. 3.2.3.8 Little Thompson River – LTMP14-03 LTMP14-03 is located approximately 0.6 miles upstream from the mouth where the Little Thompson River joins the Thompson River. Historic logging and ongoing grazing are the primary land-use activities along this reach, along with extensive logging throughout the Little Thompson River watershed. The Plum Creek Forest Hydrologist noted that a cooperative grazing management plan is in place along the Little Thompson River. The stream channel was primarily comprised of riffle habitat with a cobble substrate and a few deep pools formed by large woody debris, which is generally limited throughout the reach. Spawning potential was limited to a few discrete non-typical locations. Streambanks were generally armored with larger cobbles, which likely limit overall bank retreat, though some channel over-widening was observed. The riparian corridor included alder and conifers, with alder re-appearing following the implementation of the grazing management plan according to the Plum Creek Forest Hydrologist. The potential for this reach is a C3 stream type, while the existing condition ranges from B3c to B4c to C4. The restoration potential for this reach is moderate, with improving conditions noted. The addition of large woody debris aggregates to improve pool habitat and enhance channel complexity would likely be beneficial. In addition, Marten Creek, which is a tributary to the Little Thompson River entering at the downstream end of the LTMP14-03 monitoring site, was slightly turbid during the site visit on September 12, 2011.

Thompson Project Area Metals, Nutrients, Sediment, and Temperature TMDLs and Water Quality Improvement Plan – Attachment A
6/4/13 38
3.2.3.9 Lynch Creek – LNCH09-01 LNCH09-01 is located in a forested area that was likely logged at one time. Timber harvest has occurred throughout the Lynch Creek watershed and signs of grazing were observed at the monitoring site. Extensive gravel deposits suggest this reach is aggrading. Historic logging along the channel margin may have destabilized the streambanks, leading to channel over-widening and aggradation as streambank sediment deposited in the channel exceeds the stream’s transport capacity. A large deposit of coarse sediment was observed at the boundary between cell 4 and cell 5. Channel aggradation and over-widening, coupled with a lack of deep pools, limits the amount of quality fish habitat within this reach. Streambank erosion was frequent; often occurring where gravel bars direct the flow toward the bank, with the stream commonly eroding into the surrounding forest floor. Understory shrub cover was lacking due to the dense coniferous overstory. The potential for this reach is a B4 stream type, while the existing condition ranges from C4b to F4b. The restoration potential for this reach is low, though watershed wide management practices may influence the level of aggradation observed along this reach. 3.2.3.10 Lynch Creek – LNCH12-02 LNCH12-02 is located downstream of the Lower Lynch Creek Road crossing in an area used for livestock grazing and irrigation water diversion. Hummocking and hoof trampling was noted, resulting in stream channel over-widening and streambank erosion. Streambanks were generally comprised of loose cobble and relatively unconsolidated soil. The stream channel fluctuates between single and multiple channels with coarse gravel and small cobble comprising the substrate. Several deep pools with undercut streambanks provide good fish habitat. Streambank erosion was common and streamside vegetation was comprised primarily of hawthorn and alder, with a few cottonwood trees. The potential for this reach is a C4 stream type, while the existing condition ranges from E4 to C4 to C3. The restoration potential for this reach is high, and could include grazing management and willow plantings, along with timber harvest best management practices in the upper watershed. 3.2.3.11 McGinnis Creek – MGNS02-01 MGNS02-01 was located upstream of the uppermost road crossing in an area that has re-grown following historic timber harvest. Signs of livestock grazing were also observed. Frequent large woody debris led to the formation of small pools. Streambed substrate was comprised of cobbles and small boulders and spawning potential was limited, though some small pockets of spawning sized gravels were observed. Streambank erosion was limited, primarily occurring in areas where large woody debris directed flow towards the streambank. A dense coniferous overstory limits the development of riparian shrubs, though some alders occur along the channel margin. The potential for this reach is a B3 stream type, while the existing condition ranges from C4b to E4b to E3b to B4. The restoration potential for this reach is low. 3.2.3.12 McGinnis Creek – MGNS03-01 MGNS03-01 was located upstream of the Corona Road crossing. Numerous fallen trees spanned the channel, though most remained elevated above the streambed and had relatively little influence on channel morphology. Pools were generally shallow and formed by large woody debris across the channel. Timber harvest is the primary land use within this watershed and likely occurred along this site
Thompson Project Area Metals, Nutrients, Sediment, and Temperature TMDLs and Water Quality Improvement Plan – Attachment A
6/4/13 39
at one time, though the reach is now forested, with alders along the channel margin and conifers in the overstory. Streambank erosion was limited by the large angular cobble material that comprised the streambanks. The potential for this reach is a B3 stream type, while the existing condition ranges from F3b to C3b to B3. The restoration potential for this reach is low. 3.2.3.13 McGregor Creek – MCGR02-03 The MCGR02-03 monitoring site was located approximately 1.2 miles downstream of McGregor Lake and streamflow is regulated for irrigation purposes. Highway 2 crosses the stream on a large fill slope approximately 500 from upstream from the top of the monitoring site. Timber harvest has occurred along this monitoring site and throughout the McGregor Creek watershed. This small stream channel appeared extremely stable and wetland vegetation was growing into the flowing portion of the channel. The channel contained a cobble substrate and was often spanned by fallen trees, though pool formation was limited. Streambank erosion was limited by the lack of exposed streambanks. Wetland vegetation lines the entire reach, along with sparse young alders. The potential for this reach given the upstream reservoir is an E3 stream type, while the existing condition ranges from C3 to E3. The restoration potential for this reach is low due to the large channel substrate and relative lack of stream power. 3.2.3.14 McGregor Creek – MCGR06-02 MCGR06-02 is located along Highway 2, which has confined the valley bottom reducing the stream’s access to the floodplain. Alders and red osier dogwood line the stream channel, with a forested hillslope on river left and Highway 2 on river right. Historic logging, channelization by Highway 2, and flow regulation from McGregor Lake are the primary anthropogenic disturbances along this reach. The stream channel contained a stable riffle-pool sequence with a streambed comprised of gravel, cobble and small boulders. The boulder formed pools tended to lack spawning sized substrate. Streambank erosion was limited by the extensive shrub cover and large streambank material, while relatively stable streamflows from McGregor Lake may also play a role. The potential for this reach given the constraints placed by Highway 2 is a B4 stream type, while the existing condition ranges from B4c to C4. The restoration potential for this reach is low due to confinement by Highway 2. During the field assessment in September of 2011, MCGR09-03/04 was also assessed on McGregor Creek upstream of the confluence with the Thompson River. A local ranch caretaker indicated that McGregor Creek “ends” upstream of this reach and they considered this reach to be a ditch. In this reach, McGregor Creek has been channelized to flow through a field used for irrigated agriculture. The stream channel is narrow, deep and somewhat entrenched, with a fine sediment substrate and reed canary grass lining the streambanks. Streambank erosion, a lack of riparian shrub cover, and a fine sediment dominated streambed was also observed along the Thompson River downstream of the confluence with McGregor Creek. 3.2.3.15 Swamp Creek – SWMP01-05 SWMP01-05 was located in a meadow area that may have been logged and was likely grazed historically, though no signs of recent grazing were observed. Historic logging in the upper watershed may have increased water yields, sediment loads, and affected stream morphology. The stream channel was primarily comprised of slow moving runs with deep pools at meander bends and infrequent short riffles. Channel substrate was primarily fine gravel and clay, which limited spawning potential. The

Thompson Project Area Metals, Nutrients, Sediment, and Temperature TMDLs and Water Quality Improvement Plan – Attachment A
6/4/13 40
stream channel appeared slightly entrenched, with tall eroding streambanks comprised primarily of clay located at meander bends. The channel margin was lined with reed canarygrass, sparse alders, and wetland vegetation at the lower end of point bars. The potential for this reach is a C4 stream type, with an existing condition of B4c that is slightly entrenched. The restoration potential for this reach is moderate and could include an increase in riparian shrub density, along with a decrease in streambank erosion. 3.2.3.16 Swamp Creek – SWMP01-06 SWMP01-06 was located in an area historically used for crop production and grazing that has been allowed to recover over the past 25 years by the current landowner. Historic logging in the upper watershed may have increased water yields, sediment loads, and affected stream morphology along Swamp Creek. The stream channel contained a well developed riffle-pool sequence, with gravel and small cobble substrate creating good potential spawning habitat. Transverse and mid-channel bar depositional features suggest elevated sediment loads from higher in the watershed. The adjacent landowner reported recent beaver activity, though high flows in 2011 removed the beaver dams. Streambank erosion was limited to meadow areas that lacked stabilizing woody streamside vegetation, while areas lined with alders were relatively stable. The potential for this reach is a C4 stream type, which is the existing condition. The restoration potential for this reach is moderate and could include riparian plantings along streambanks that currently lack woody vegetation.

Thompson Project Area Metals, Nutrients, Sediment, and Temperature TMDLs and Water Quality Improvement Plan – Attachment A
6/4/13 41
4.0 STREAMBANK EROSION ASSESSMENT
4.1 METHODS Streambank erosion data was collected at 16 monitoring sites in the Thompson Project Area. At each of the 16 monitoring sites, eroding streambanks were assessed for erosion severity and categorized as either “actively/visually eroding” or “slowly eroding/vegetated/undercut”. At each eroding streambank, Bank Erosion Hazard Index (BEHI) measurements were performed and the Near Bank Stress (NBS) was evaluated (Rosgen 1996, 2006). Bank erosion severity was rated from “very low” to “extreme” based on the BEHI score, which was determined based on the following six parameters: bank height, bankfull height, root depth, root density, bank angle, and surface protection. Near Bank Stress was also rated from “very low” to “extreme” depending on the shape of the channel at the toe of the bank and the force of the water (i.e. “stream power”) along the bank. In addition, the source, or underlying cause, of streambank erosion was evaluated at each eroding streambank based on observed anthropogenic disturbances within the riparian corridor, as well as current and historic land-use practices observed within the surrounding landscape. The source of streambank instability was identified based on the following near-stream source categories: transportation, riparian grazing, cropland, mining, silviculture, irrigation, natural, and “historic or other”. Naturally eroding streambanks were considered the result of “natural sources” while “historic or other” sources in the Thompson Project Area include historic timber harvest in Fishtrap Creek, McGregor Creek, and McGinnis Creek, along with historic agricultural practices along Swamp Creek. If multiple sources were observed, then a percent was noted for each source. For each eroding streambank, the average annual sediment load was estimated based on the streambank length, mean height, and annual retreat rate. The length and mean height were measured in the field, while the annual retreat rate was determined based on the relationship between the BEHI and NBS ratings. Annual retreat rates were estimated based on retreat rates developed using Colorado USDA Forest Service (1989) data for sedimentary and metamorphic geologies (Rosgen 2006) (Table 4-1). The annual sediment load in cubic feet was then calculated from the field data (annual retreat rate x mean bank height x bank length), converted into cubic yards, and finally converted into tons per year based on the bulk density of streambank material, which was assumed to average 1.3 tons/yard³ as identified in Watershed Assessment of River Stability and Sediment Supply (WARSSS) (EPA 2006, Rosgen 2006). This process resulted in a sediment load for each eroding streambank expressed in tons per year. Table 4-1. Annual Streambank Retreat Rates (Feet/Year), Colorado USDA Forest Service (adapted from Rosgen 2006)
BEHI Near Bank Stress very low low moderate high very high extreme
very Low NA NA NA NA NA NA low 0.02 0.04 0.07 0.16 0.32 0.67
moderate 0.09 0.15 0.25 0.42 0.70 1.16 high - very high 0.17 0.25 0.38 0.58 0.87 1.32
extreme 0.16 0.42 1.07 2.75 7.03 17.97

Thompson Project Area Metals, Nutrients, Sediment, and Temperature TMDLs and Water Quality Improvement Plan – Attachment A
6/4/13 42
4.1.1 Monitoring Site Sediment Loads During field data collection, streambank erosion was assessed at a total of 16 monitoring sites in eight different reach types. For each monitoring site, the streambank erosion sediment load was normalized to 1000 feet. Streambank erosion data was then grouped into five categories for the purpose of analysis and extrapolation, as follows: 1) low gradient (<2% slope) 3rd order reach types (NR-0-3-U), 2) low gradient (<2% slope) 4rd order reach types (NR-0-4-C, NR-0-4-U), 3) moderate gradient (2-4% slope) 1st and 2nd order reach types (NR-2-1-U, NR-2-2-U), 4) moderate gradient (2-4% slope) 3rd order reach types (NR-2-3-U), and 5) high gradient (4-10% slope) 1st and 2nd order reach types (NR-4-1-U, NR04-2-U) (Table 4-2). Table 4-2. Reach Type Data Groupings for Thompson Project Area Monitoring Sites
4.1.2 Streambank Erosion Sediment Loads for Existing Conditions Streambank erosion sediment loads were developed using field data collected at 16 monitoring sites in the Thompson Project Area in 2011 along with data from 12 monitoring sites in the Kootenai-Fisher Project Area that was also collected in 2011. Field data was divided into the five categories discussed in Section 4.1.1 and expanded to include field data from the Kootenai-Fisher Project Area as presented in Table 4-3. Streambank erosion sediment loads per 1,000 feet of stream for existing conditions averaged 9.75 tons/year for low gradient (<2% slope) 3rd order reach types, 8.82 tons/year for low gradient (<2% slope) 4th order reach types, 2.18 tons/year for moderate gradient (2-4% slope) 1st and 2nd order reach types, 5.60 tons/year for moderate gradient (2-4% slope) 3rd order reach types, and 5.99 tons/year for high gradient (4-10% slope) 1st and 2nd order reach types (Table 3-4).
Reach Type Number of Monitoring
Sites
Monitoring Sites
NR-0-3-U 6 FTRP06-02, LAZR10-01, LTMP12-01, MCGR06-02, SWMP01-05, SWMP01-06
NR-0-4-C 1 FTRP08-01NR-0-4-U 3 LBTR01-01, LNCH12-02, LTMP14-03
NR-2-1-U 1 MGNS02-01NR-2-2-U 1 MGNS03-01
NR-2-3-U 2 LAZR08-01, MCGR02-03
NR-4-1-U 1 LNCH09-01NR-4-2-U 1 HNRY04-01

Thompson Project Area Metals, Nutrients, Sediment, and Temperature TMDLs and Water Quality Improvement Plan – Attachment A
6/4/13 43
Table 4-3. Reach Type Data Groupings for Streambank Erosion Sediment Load Extrapolation
Table 4-4. Sediment Loads by Reach Type Category for Existing Conditions
Field Assessed Reach Type Category
Number of Monitoring
Sites
Average Sediment Load per 1000 Feet (Tons/Year)
Standard Error
(Tons/Year)
Minimum (Tons)
Maximum (Tons)
NR-0-3-U 8 9.75 2.14 2.17 21.84 NR-0-4-U, NR-0-4-C 8 8.82 2.27 2.40 19.21 NR-2-1-U, NR-2-2-C, NR-2-2-U 4 2.18 1.22 0.12 5.64 NR-2-3-U 4 5.60 3.03 0.21 14.01 NR-4-1-U, NR-4-2-U 4 5.99 2.92 0.14 13.90
4.1.3 Reducing Streambank Erosion Sediment Loads through Best Management Practices Sediment loads from streambank erosion through the implementation of all best management practices were estimated by reducing the anthropogenic contribution of bank erosion to 30% from all sites where the anthropogenic portion was greater than 30%. The reduction to 30% is simply an estimate to represent conditions that account for human activity and human influenced bank erosion, but at a percentage that may appropriately reflect all reasonable land, soil, and water conservation practices. This reduction in the anthropogenic sediment load was then summed with the existing natural sediment load to achieve the BMP sediment load. Streambank erosion sediment loads per 1,000 feet of stream for BMP conditions averaged 6.57 tons/year for low gradient (<2% slope) 3rd order reach types, 4.99 tons/year for low gradient (<2% slope) 4th order reach types, 2.05 tons/year for moderate gradient (2-4% slope) 1st and 2nd order reach types, 3.11 tons/year for moderate gradient (2-4% slope) 3rd order reach types, and 4.10 tons/year for high gradient (4-10% slope) 1st and 2nd order reach types (Table 3-5).
Reach Type Number of Monitoring
Sites
Monitoring Sites
NR-0-3-U 8 FTRP06-02, LAZR10-01, LTMP12-01, MCGR06-02, SWMP01-05, SWMP01-06, GRNT13-01, QRTZ10-01
NR-0-4-C 1 FTRP08-01NR-0-4-U 7 LBTR01-01, LNCH12-02, LTMP14-03, LAKE02-01, WOLF08-03, WOLF09-02, WOLF11-03
NR-2-1-U 1 MGNS02-01NR-2-2-C 1 QRTZ03-01NR-2-2-U 2 MGNS03-01, RAVN07-01
NR-2-3-U 4 LAZR08-01, MCGR02-03, BRST04-02, BRST04-04
NR-4-1-U 2 LNCH09-01, RAVN04-01NR-4-2-U 2 HNRY04-01, RAVN06-01

Thompson Project Area Metals, Nutrients, Sediment, and Temperature TMDLs and Water Quality Improvement Plan – Attachment A
6/4/13 44
Table 4-5. Sediment Loads by Reach Type Category with BMPs Field Assessed Reach Type
Category Number of Monitoring
Sites
Average Sediment Load per 1000 Feet (Tons/Year)
Standard Error
(Tons/Year)
Minimum (Tons)
Maximum (Tons)
NR-0-3-U 8 6.57 1.49 1.15 15.29 NR-0-4-U, NR-0-4-C 8 4.99 0.95 0.72 8.47 NR-2-1-U, NR-2-2-C, NR-2-2-U 4 2.05 1.24 0.12 5.64 NR-2-3-U 4 3.11 1.23 0.09 5.82 NR-4-1-U, NR-4-2-U 4 4.10 1.83 0.14 8.34
4.1.4 Streambank Erosion Sediment Load Extrapolation for Existing Conditions Streambank erosion data collected at monitoring sites were extrapolated to the stream reach, stream segment, and sub-watershed scales based on similar reach type characteristics as identified in the Aerial Assessment Database. Sediment load calculations were performed for monitoring sites, stream reaches, stream segments, and sub-watersheds, which are distinguished as follows:
Monitoring Site - A 500, 1000, or 2000 foot section of a stream reach where field monitoring was conducted
Stream Reach -Subdivision of the stream segment based on ecoregion, stream order,
gradient and confinement as evaluated in GIS Stream Segment -303(d) listed segment Sub-watershed -303(d) listed segment and tributary streams based on 1:100,000 NHD
data layer Streambank erosion sediment loads for the 303(d) listed stream segments were estimated based on the following criteria:
1. Monitoring site sediment loads were extrapolated directly to the stream reach in which the monitoring site was located and the percent contribution from different source categories was based on field observations.
2. Existing conditions data from low gradient (<2% slope) 3rd order reach type NR-0-3-U was applied to all low gradient 2nd and 3rd order reaches in the Thompson Project Area (Table 4-6).
3. Existing conditions data from low gradient (<2% slope) 4th order reach types (NR-0-4-C, NR-0-4-U) was applied to all low gradient 4th order reaches in the Thompson Project Area (Table 4-6).
4. Existing conditions data from moderate gradient (2-4% slope) 1st and 2nd order reach types (NR-2-1-U, NR-2-2-C, NR-2-2-U) was applied to all moderate gradient 1st and 2nd order reaches in the Thompson Project Area (Table 4-6).

Thompson Project Area Metals, Nutrients, Sediment, and Temperature TMDLs and Water Quality Improvement Plan – Attachment A
6/4/13 45
5. Existing conditions data from moderate gradient (2-4% slope) 3rd order reach NR-2-3-U was applied to all moderate gradient 3rd, 4th, and 5th order reaches in the Thompson Project Area (Table 4-6).
6. Existing conditions data from high gradient (4-10% slope) 1st and 2nd order reach types (NR-4-1-U, NR-4-2-U) was applied to all high gradient 1st, 2nd, and 3rd order reaches, as well as extreme gradient (>10% slope) 3rd order reaches (Table 4-6).
7. BMP condition sediment loads were assigned to reaches with predominately natural sediment loads (>70%, based on the aerial assessment) based on the reach type category.
8. No streambank erosion sediment load was applied to 1st order low gradient (<2% slope) reach
types and 1st order extreme gradient (>10% slope) reach types as these channels tend to be small and well armored and have a very low streambank erosion rate.
Table 4-6. Reach Type Categories for Extrapolation
Field Assessed Reach Type Category Un-Assessed Reach Types
NR-0-3-U NR-0-2-C, NR-0-2-U, NR-0-3-C NR-0-4-U, NR-0-4-C NR-2-1-U, NR-2-2-C, NR-2-2-U NR-2-3-U NR-2-3-C, NR-2-4-C, NR-2-4-U, NR-2-5-U, NR-10-3-C NR-4-1-U, NR-4-2-U NR-4-1-C, NR-4-2-C, NR-4-3-C, NR-4-3-U
For small streams that did not undergo the stratification process and field analysis, but are tributaries to TMDL streams, a simple sediment loading rate was developed to account for the additional streambank erosion sediment load that likely enters the TMDL stream. A value of 3.65 tons/year/1000 feet was applied to these un-assessed streams based on the streambank erosion sediment load for moderate to high gradient (2-10% slope) 2nd and 3rd order streams. Because these un-assessed streams did not undergo stratification but undoubtedly contain a wide variety of conditions, the simplest approach of deriving the average for the population of reach types most likely to exist on those streams was used. These smaller, un-assessed streams also primarily occur in steeper gradient conditions which is why the 0-2% slope reaches were not included in the gross average. Un-assessed 1st order streams were presumed to contribute a load negligible enough to warrant exclusion from the estimate. The streambank erosion sediment load for un-assessed streams was then reduced to include only the fine sediment portion of the sediment load based on the percent of sand/silt for each individual stream segment’s subwatershed under the assumption that only the fine sediment load is delivered to the TMDL stream. 4.1.5 Streambank Erosion Sediment Load Extrapolation with Best Management Practices Montana’s narrative water quality standards that apply to sediment relate to the naturally occurring condition, which is typically associated with either reference conditions or those that occur if all reasonable land, soil, and water conservation practices are applied. Anthropogenic activities that remove streamside vegetation tend to de-stabilize streambanks and increase the amount streambank erosion. Through the implementation of riparian and streambank Best Management Practices (BMPs), streambanks can be stabilized and sediment loads can be reduced. The BMP streambank erosion

Thompson Project Area Metals, Nutrients, Sediment, and Temperature TMDLs and Water Quality Improvement Plan – Attachment A
6/4/13 46
sediment load for the Thompson Project Area was determined based on reducing the existing anthropogenic sediment load contribution to 30%, which is presumed to represent a reasonable contribution of human caused bank erosion sediment under reasonable land, soil, and water conservation practices. This reduction in the anthropogenic sediment load was then summed with the existing natural sediment load to achieve the BMP sediment load, which was extrapolated to the stream segment scale using the following criteria:
1. Because they are assumed to be achieving the naturally occurring condition, no sediment load reductions were applied to reaches with predominately natural sources of erosion (>70%). In addition, no load reduction was applied to the natural sediment load in reaches with <70% natural sources.
2. Percent reductions for monitoring sites with predominately anthropogenic sources of erosion (>30%) were based on the difference between the existing conditions streambank erosion sediment load and the BMP sediment load as depicted in Table 4-7.
3. BMP sediment loads presented discussed in Section 4.1.3 were applied to un-assessed reaches on the 303(d) listed stream segments based on the reach type category (Table 4-7).
Table 4-7. Percent Reduction in Streambank Erosion Sediment Loads
Field Assessed Reach Type Category
Number of Monitoring
Sites
Average Sediment Load per 1000 Feet (Tons/Year)
Average Sediment Load per 1000 Feet
with BMPs (Tons/Year)
Percent Reduction
NR-0-3-U 8 9.75 6.57 33% NR-0-4-U, NR-0-4-C 8 8.82 4.99 43% NR-2-1-U, NR-2-2-C, NR-2-2-U 4 2.18 2.05 6% NR-2-3-U 4 5.60 3.11 44% NR-4-1-U, NR-4-2-U 4 5.99 4.10 32%
For small streams that did not undergo the stratification process and field analysis, but are tributaries to TMDL streams, a BMP sediment load of 2.36 tons/year/1000 feet (12.25 tons/year/mile) was applied to these un-assessed streams based on the BMP streambank erosion sediment load for moderate to high gradient (2-10% slope) 2nd and 3rd order streams. The BMP sediment load for un-assessed streams was then reduced to include only the fine sediment portion of the sediment load based on the percent of sand/silt for each individual stream segment’s subwatershed under the assumption that only the fine sediment load is delivered to the TMDL stream.

Thompson Project Area Metals, Nutrients, Sediment, and Temperature TMDLs and Water Quality Improvement Plan – Attachment A
6/4/13 47
4.2 RESULTS 4.2.1 Monitoring Site Sediment Loads An average annual streambank erosion sediment load of 106 tons/year was attributed to the 132 assessed eroding streambanks within the 16 monitoring sites. Average annual sediment loads for each monitoring site were normalized to a length of 1,000 feet for the purpose of comparison and extrapolation. Monitoring site sediment loads per 1,000 feet ranged from 0.2 tons/year in MCGR02-03 on McGregor Creek to 21.8 tons/year in FTRP06-02 on Fishtrap Creek (Table 4-8). Table 4-8. Monitoring Site Estimated Average Annual Sediment Loads due to Streambank Erosion
4.2.2 Stream Segment Sediment Loads Monitoring site sediment loads were extrapolated to each 303(d) listed stream segment based on the reach type groups discussed in Section 4.1.4. Stream segment sediment loads were estimated for all 72.4 miles of stream included in the Aerial Assessment Database (Attachment C). An average annual sediment load of 2,230 tons/year was attributed to eroding streambanks at the stream segment scale (Table 4-9). In the Thompson Project Area, streambank erosion sediment loads ranged from 41.4 tons/year in Sullivan Creek to 676.5 tons/year in the Little Thompson River (Attachment C). Swamp Creek had highest sediment load due to streambank erosion per mile of stream, followed by Lazier Creek, while Sullivan Creek had the lowest streambank erosion sediment load per mile of stream. At the stream segment scale, this assessment indicates that transportation, timber harvest, and grazing are the greatest anthropogenic contributors of sediment loads due to streambank erosion in the Thompson Project Area (Figure 4-1).
Stream Segment Reach ID Reach Type
Length of Eroding Bank
(Feet)
Monitoring Site Length
(Feet)
Percent of Reach with
Eroding Streambank
Reach Sediment
Load (Tons/Year)
Total Sediment Load per 1000
Feet (Tons/Year)
FTRP06-02 NR-0-3-U 398 1000 20% 21.8 21.8FTRP08-01 NR-0-4-C 213 1000 11% 4.8 4.8
Henry Creek HNRY04-01 NR-4-2-U 110 500 11% 1.8 3.6LAZR08-01 NR-2-3-U 164 500 16% 7.0 14.0LAZR10-01 NR-0-3-U 179 800 11% 7.9 9.8
Little Bitterroot River LBRT01-01 NR-0-4-U 65 1000 3% 2.4 2.4LNCH09-01 NR-4-1-U 138 1000 7% 13.9 13.9LNCH12-02 NR-0-4-U 187 1000 9% 4.9 4.9LTMP12-01 NR-0-3-U 154 1000 8% 7.8 7.8LTMP14-03 NR-0-4-U 263 1000 13% 9.0 9.0MCGR02-03 NR-2-3-U 19 500 2% 0.1 0.2MCGR06-02 NR-0-3-U 93 1000 5% 2.2 2.2MGNS02-01 NR-2-1-U 63 500 6% 1.0 2.0MGNS03-01 NR-2-2-U 61 1000 3% 0.9 0.9SWMP01-05 NR-0-3-U 242 1000 12% 11.2 11.2SWMP01-06 NR-0-3-U 206 1000 10% 8.8 8.8
Fishtrap Creek
Lazier Creek
Lynch Creek
Little Thompson River
McGregor Creek
McGinnis Creek
Swamp Creek

Thompson Project Area Metals, Nutrients, Sediment, and Temperature TMDLs and Water Quality Improvement Plan – Attachment A
6/4/13 48
Table 4-9. Stream Segment Streambank Erosion Sediment Loads Stream Segment Stream Length
(Miles) Sediment Load
(Tons/Year) Load per Mile (Tons/Year)
Henry Creek 6.7 148.7 22.0 Lazier Creek 7.5 291.0 38.7 Little Bitterroot River 4.9 132.9 26.9 Lynch Creek 13.3 384.4 29.0 Little Thompson River (excluding McGinnis Creek)
19.9 676.5 34.0
McGregor Creek 6.8 234.5 34.4 McGinnis Creek 5.1 69.5 13.6 Sullivan Creek 3.2 41.4 13.0 Swamp Creek 4.9 251.3 51.1 Total 72.4 2,230 30.8
Figure 4-1. Stream Segment Streambank Erosion Sources 4.2.2.1 Streambank Composition The percent of eroding streambank within each particle size category was evaluated for each monitoring site based on the sediment load from each eroding streambank relative to the total sediment load for the monitoring site. Then, the loads per particle size category from the monitoring sites within each impaired stream segment were summed to provide the streambank particle size breakdown for each stream segment (Table 4-10). Thus, it is assumed that streambank composition assessed at the field monitoring sites is representative of the overall stream segment. This analysis will help guide implementation activities geared toward reducing sediment loads for specific particle size categories. In the Thompson Project Area, sand/silt generally comprised the greatest portion of the streambank
0%
10%
20%
30%
40%
50%
60%
70%
80%
90%
100%
Henr
y Cr
eek
Lazie
r Cre
ek
Litt
leBi
tter
root
Rive
r
Lync
h Cr
eek
Litt
leTh
omps
onRi
ver
McG
rego
rCr
eek
McG
inni
sCr
eek
Sulli
van
Cree
k
Swam
pCr
eek
Sour
ce
Other
Natural
Irrigation
Forestry
Mining
Cropland
Grazing
Transportation

Thompson Project Area Metals, Nutrients, Sediment, and Temperature TMDLs and Water Quality Improvement Plan – Attachment A
6/4/13 49
sediment load, comprising greater than 50% of the sediment load in all of the assessed streams except for Henry Creek, Little Thompson River, and Lynch Creek. Table 4-10. Stream Segment Streambank Composition
Stream Segment Coarse Gravel >6mm (Percent)
Fine Gravel <6mm & >2mm (Percent)
Sand/Silt <2mm (Percent)
Fishtrap Creek 5% 12% 82% Henry Creek 40% 30% 30% Lazier Creek 18% 17% 64% Little Bitterroot River 0% 10% 90% Little Thompson River 43% 19% 38% Lynch Creek 31% 26% 43% McGinnis Creek 26% 10% 64% McGregor Creek 18% 23% 59% Swamp Creek 17% 10% 74%
4.2.3 Sub-watershed Streambank Erosion Sediment Loads Average annual streambank erosion sediment loads at the sub-watershed scale were estimated for the assessed stream segments in the Thompson Project Area based on the total length of stream within each sub-watershed. These sub-watershed sediment loads were estimated from the sum of the average annual streambank erosion sediment loads at the stream segment scale combined with an estimate of streambank erosion sediment loads from un-assessed streams. A total of 72.4 miles of stream were included in the Aerial Assessment Database and there are a total of 142.6 miles of stream in the assessed sub-watersheds based on a modified version of the 1:100,000 NHD stream layer in which ditches and 1st order streams were removed (Table 4-9). For the purposes of estimating an annual average sub-watershed streambank erosion sediment load, streambank erosion sediment inputs from un-assessed streams were assumed to be 3.65 tons/year/1000 feet (19.25 tons/year/mile) based on the average value of 2nd and 3rd order streams. The streambank erosion sediment load for un-assessed streams was then reduced to include only the fine sediment portion of the sediment load based on the percent of sand/silt for each individual stream segment’s sub-watershed. Based on this analysis, a total streambank erosion sediment load of 3,060 tons per year is estimated at the sub-watershed scale for the Thompson Project Area (Table 4-10). 4.2.4 Sub-watershed Streambank Erosion Sediment Load Reductions Streambank erosion sediment load reductions for each sediment 303(d) listed sub-watershed in the Thompson Project Area are provided in Table 4-11. Potential reductions in anthropogenic loading as a result of the application of BMPs range from 16% in McGinnis Creek to 36% in the Little Bitteroot River. The loading reductions listed in Table 4-11 were calculated based on the achievable reductions in loading to the 303(d) listed water body segments.

Thompson Project Area Metals, Nutrients, Sediment, and Temperature TMDLs and Water Quality Improvement Plan – Attachment A
6/4/13 50
Table 4-11. Sub-watershed Streambank Erosion Sediment Loads
Table 4-12. Sub-watershed Streambank Erosion Sediment Load Reductions with BMPs
Stream Segment Stream Length (Miles)
Stream Segment Sediment Load
(Tons/Year)
Sub-watershed Stream Length
(Miles) (excluding 1st order streams)
Un-assessed Stream Length
(Miles)
Total Sediment Load Applied to Un-
assessed Stream Length (19.25
Tons/Year/Mile)
Subwatershed % Fine
Sediment
Fine Sediment Load Applied to Un-
assessed Stream Length (Tons/Year)
Sub-watershed Sediment Load
(Tons/Year)
Total Load per Mile
(Tons/Year)
Henry Creek 6.7 148.7 6.8 0.1 1.1 30% 0.3 149.0 21.9Lazier Creek 7.5 291.0 11.5 3.9 76.0 64% 48.7 339.6 29.6Li ttle Bi tterroot River 4.9 132.9 23.4 18.5 355.4 90% 319.9 452.8 19.3Lynch Creek 13.3 384.4 21.4 8.1 155.5 43% 66.9 451.2 21.1Li ttle Thompson River (excluding McGinnis Creek)
19.9 676.5 43.0 23.1 443.8 38% 168.7 845.1 19.7
McGregor Creek 6.8 234.5 10.7 3.9 75.6 59% 44.6 279.1 26.0McGinnis Creek 5.1 69.5 5.3 0.2 3.0 64% 1.9 71.4 13.5Sul l ivan Creek 3.2 41.4 3.2 0.0 0.0 n/a 41.4 13.1Swamp Creek 4.9 251.3 17.4 12.5 241.2 74% 178.5 429.8 24.6Total 72.4 2,230 142.6 70.2 1,352 829 3,060 21.5
Stream Segment
Sediment Load (Tons/Year)
Anthropogenic Stream
Segment Load (Tons/Year)
Natural Stream Segment
Sediment Load (Tons/Year)
Fine Sediment Load Applied to
Un-assessed Stream Length
(Tons/Year)
Sub-watershed Sediment Load
(Tons/Year)
BMP Stream Segment
Sediment Load (Tons/Year)
BMP Anthropogenic Stream Segment Sediment Load
(Tons/Year)
Natural Stream Segment
Sediment Load (Tons/Year)
BMP Fine Sediment Load Applied to Un-
assessed Stream Length
(Tons/Year)
BMP Sub-watershed
Sediment Load (Tons/Year)
Henry Creek 148.7 116.6 32.1 0.3 149.0 111.9 79.8 32.1 0.2 112.1 36.9 25%Lazier Creek 291.0 247.1 43.9 48.7 339.6 197.2 153.3 43.9 31.5 228.7 110.9 33%Little Bi tterroot River 132.9 116.0 16.9 319.9 452.8 82.1 65.2 16.9 206.9 289.0 163.8 36%Lynch Creek 384.4 340.2 44.2 66.9 451.2 256.9 212.7 44.2 43.2 300.2 151.0 33%Little Thompson River (excluding McGinnis Creek)
676.5 552.9 123.5 168.7 845.1 470.3
346.8 123.5
109.1 579.4 265.7 31%
McGregor Creek 234.5 231.4 3.1 44.6 279.1 158.1 155.0 3.1 28.9 187.0 92.1 33%McGinnis Creek 69.5 44.3 25.2 1.9 71.4 58.5 33.3 25.2 1.2 59.8 11.7 16%Sul l ivan Creek 41.4 41.4 0.0 41.4 33.5 33.5 0.0 0.0 33.5 7.9 19%Swamp Creek 251.3 192.4 59.0 178.5 429.8 188.6 129.6 59.0 115.4 304.0 125.8 29%Total 2,230 1,882 348 829 3,060 1,557 1,209 348 536 2,094 966 32%
Existing Sediment Load (Tons/Year) Reduced Sediment Load through BMPs (Tons/Year) Potential Reduction in
Total Sediment Load
(Tons/Year)
Percent Reduction in
Total Sediment
Load
Stream Segment

Thompson Project Area Metals, Nutrients, Sediment, and Temperature TMDLs and Water Quality Improvement Plan – Attachment A
6/4/13 51
5.0 ASSUMPTIONS AND UNCERTAINTY
The Thomson Project Area sediment and habitat assessment assumes reaches with similar reach type characteristics will have similar physical attributes and sediment loads due to streambank erosion. Since only a portion of the streams within the Thompson Project Area were assessed in the field, a degree of uncertainty is unavoidable when extrapolating data from assessed reaches to un-assessed reaches. Although the accuracy of the GIS data may influence the length of each reach type, the largest potential sources of inaccuracy within the project are the small sample size per reach type, the near-stream land uses identified based on aerial images, and the retreat rates used for the extrapolation process. These are minimized by careful selection of representative monitoring sites and only using the near-stream land uses for informational purposes within the TMDL document. Since sediment source modeling may under-estimate or over-estimate sediment inputs due to selection of sediment monitoring sites and the extrapolation methods used, model results should not be taken as an absolutely accurate account of sediment production within each sub-watershed. Instead, the streambank erosion assessment model results should be considered an instrument for estimating existing streambank erosion sediment loads and making general comparisons of streambank erosion sediment loads from various sources.
6.0 SUMMARY
The 2011 sediment and habitat assessment in the Thompson Project Area provides a comprehensive analysis of existing sediment conditions within impaired stream segments and estimated streambank erosion sediment loads for use in TMDL development. A total of 67 reaches were delineated during the aerial assessment reach stratification process covering 72.4 miles of stream. Based on the level III ecoregion, there were a total of 23 distinct reach types and sediment and habitat parameters were assessed at 16 monitoring sites. Statistical analysis of the sediment and habitat data from the 16 monitoring sites will aid in developing sediment TMDL targets that are specific for the Thompson Project Area, while streambank erosion data will be utilized in the sediment TMDL. Within the 16 monitoring sites, an average annual sediment load of 106 tons/year was attributed to the 132 assessed eroding streambanks and average annual sediment load of 2,230 tons/year was estimated for the listed stream segments. Out of the 142.6 miles of stream within the assessed sub-watersheds, a total sediment load of 3,060 tons per year was estimated at the sub-watershed scale. It is estimated that this sediment load can be reduced to 2,094 tons/year, which is a 32% reduction in sediment load from streambank erosion.

Thompson Project Area Metals, Nutrients, Sediment, and Temperature TMDLs and Water Quality Improvement Plan – Attachment A
6/4/13 52
7.0 REFERENCES
Bilby, R. and J.W. Ward. 1989. Changes in characteristics and function of woody debris with increasing size of streams in western Washington. Transactions of the American Fisheries Society 118:368-378.
Dunne, T. and L.B. Leopold. 1978. Water in Environmental Planning. W.H. Freeman and Company, New York.
Kappesser, G.B. 2002. A riffle stability index to evaluate sediment loading to streams. Journal of the American Water Resources Association 38(4): 1069-1081.
Meehan, W.R., ed. 1991. Influences of forest and rangeland management on salmonid fishes and their habitats. Special Publication 19. American Fisheries Society, Bethesda, MD. 751 p.
Montana Department of Environmental Quality (DEQ 2008). Watershed Stratification Methodology for TMDL Sediment and Habitat Investigations. Montana Department of Environmental Quality.
Montana Department of Environmental Quality (DEQ 2011). Field Methodology for the Assessment of TMDL Sediment and Habitat Impairments. Montana Department of Environmental Quality.
Overton, C. K., S. P. Wollrab, B. C Roberts, and M. A. Radko. 1997. R1/R4 (Northern/ Intermountain Regions) Fish and Fish Habitat Standard Inventory Procedures Handbook. General Technical Report INT-GTR-346. Ogden, UT: USDA Forest Service, Intermountain Research Station. 73 p.
Rosgen, D. 1996 Applied River Morphology. Wildland Hydrology, Pagosa Springs, Colorado.
Rosgen, D. 2006. Watershed Assessment of River Stability and Sediment Supply (WARSSS). Wildland Hydrology, Fort Collins, Colorado.
U.S. Environmental Protection Agency (EPA). 2006. Watershed Assessment of River Stability and Sediment Supply (WARSSS). Version 1.0. Available at: http://www.epa.gov/warsss/index.htm. Site accessed March 2008.
Weaver, T. and Fraley, J., 1991. Fisheries Habitat and Fish Populations, Flathead Basin Forest Practices Water Quality and Fisheries Cooperative Program - Final Report. Flathead Basin Commission,Kalispell, MT. pp. 53- 68.
Wolman, M.G., 1954. A method of sampling coarse river-bed material: Trans. Am. Geophys. Union, v. 35, p. 951-956

Attachment A
Aerial Assessment Database

STR
EAM
REA
CH
_ID
REA
CH
SUBR
EAC
H
REA
CH
_TYP
E
LEN
GTH
_FT
PRI_
ECO
REG
SEC
_EC
OR
EG
STR
EAM
_OR
D
CO
NFI
NE
GR
ADIE
NT
HB_
TRIG
GER
SB_T
RIG
GER
LB_L
AND
USE
LB_A
NTH
RO
LB_R
P_VE
G
LB_R
P_H
LTH
RB_
LAN
DU
SE
RB_
ANTH
RO
RB_
RP_
VEG
RB_
RP_
HLT
H
ANTH
RO
_TR
A
ANTH
RO
_GR
A
ANTH
RO
_CR
O
ANTH
RO
_MIN
ANTH
RO
_FO
R
ANTH
RO
_IR
R
ANTH
RO
_NAT
ANTH
RO
_OTH
ANTH
RO
_TO
T
Henry Creek HNRY 01-01 01 01 NR-10-1-U 483 15e 1 U >10 Start Forest No Mature Coniferous Good Forest No Mature Coniferous Good 0 0 0 0 0 0 100 0 100Henry Creek HNRY 02-01 02 01 NR-10-1-U 1958 15a 15e 1 U >10 Ecoregion Forest No Mature Coniferous Good Forest Yes Grass Fair 0 0 0 0 100 0 0 0 100Henry Creek HNRY 03-01 03 01 NR-4-1-U 7107 15a 1 U 4-10 Gradient Forest No Mature Coniferous Good Forest Yes Mature Coniferous Fair 70 0 0 0 30 0 0 0 100Henry Creek HNRY 04-01 04 01 NR-4-2-U 20834 15a 2 U 4-10 Stream Order Forest Yes Mature Coniferous Fair Forest Yes Mature Coniferous Fair 70 0 0 0 30 0 0 0 100Henry Creek HNRY 05-01 05 01 NR-4-2-C 1617 15a 2 C 4-10 Confinement Forest Yes Brush Fair Forest No Brush Fair 70 0 0 0 0 0 30 0 100Henry Creek HNRY 06-01 06 01 NR-4-2-U 3616 15a 2 U 4-10 Confinement Rural Res./Hobby Farm Yes Brush Fair Rural Res./Hobby Farm Yes Mature Coniferous Fair 30 0 0 0 0 0 0 70 100
Lazier Creek LAZR 01-01 01 01 NR-10-1-U 2597 15l 15l 1 U >10 Start Forest Yes Mature Coniferous Fair Forest Yes Mature Coniferous Fair 10 0 0 0 90 0 0 0 100Lazier Creek LAZR 02-01 02 01 NR-4-1-U 5570 15l 15l 1 U 4-10 Gradient Forest Yes Mature Coniferous Fair Forest Yes Mature Coniferous Fair 30 0 0 0 70 0 0 0 100Lazier Creek LAZR 03-01 03 01 NR-2-1-U 1677 15l 15l 1 U 2-<4 Gradient Forest Yes Brush Fair Forest Yes Brush Fair 40 0 0 0 60 0 0 0 100Lazier Creek LAZR 03-02 03 02 NR-2-1-U 2571 15l 15l 1 U 2-<4 Gradient Landuse Forest No Brush Good Forest No Brush Good 10 0 0 0 0 0 90 0 100Lazier Creek LAZR 04-01 04 01 NR-0-1-U 1260 15l 15l 1 U <2 Gradient Forest No Brush Good Forest No Brush Good 0 0 0 0 0 0 100 0 100Lazier Creek LAZR 05-01 05 01 NR-0-2-U 4401 15l 15l 2 U <2 Stream Order Forest Yes Brush Fair Forest Yes Brush Fair 10 0 0 0 10 0 80 0 100Lazier Creek LAZR 05-02 05 02 NR-0-2-U 4809 15l 15l 2 U <2 Stream Order Landuse Forest Yes Brush Fair Forest Yes Brush Fair 50 0 0 0 20 0 30 0 100Lazier Creek LAZR 06-01 06 01 NR-0-3-U 2548 15l 15l 3 U <2 Stream Order Forest Yes Brush Fair Forest Yes Brush Fair 0 0 0 0 70 0 30 0 100Lazier Creek LAZR 07-01 07 01 NR-2-3-U 1423 15l 15l 3 U 2-<4 Gradient Forest No Brush Fair Forest Yes Brush Fair 0 0 0 0 50 0 50 0 100Lazier Creek LAZR 08-01 08 01 NR-2-3-U 8530 15l 15 3 U 2-<4 Tributary Forest Yes Brush Fair Forest Yes Brush Fair 0 0 0 0 100 0 0 0 100Lazier Creek LAZR 09-01 09 01 NR-10-3-C 1451 15l 15 3 C >10 Gradient, Confinement Forest Yes Brush Poor Forest Yes Brush Fair 0 0 0 0 100 0 0 0 100Lazier Creek LAZR 10-01 10 01 NR-0-3-U 550 15l 15 3 U <2 Gradient, Confinement Forest Yes Mature Coniferous Fair Forest Yes Mature Coniferous Fair 0 0 0 0 100 0 0 0 100Lazier Creek LAZR 10-02 10 02 NR-0-3-U 2263 15l 15 3 U <2 Gradient, Confinement Hay/Pasture Yes Grass Poor Hay/Pasture Yes Grass Poor 10 90 0 0 0 0 0 0 100
Little Bitterroot River LBRT 01-01 01 01 NR-0-4-U 10884 15l 4 U <2 Start Forest Yes Grass Fair Forest No Grass Fair 30 0 0 0 70 0 0 0 100Little Bitterroot River LBRT 02-01 02 01 NR-0-4-C 1942 15l 4 C <2 Confinement Forest Yes Mature Coniferous Fair Forest No Mature Coniferous Fair 0 0 0 0 50 0 50 0 100Little Bitterroot River LBRT 03-01 03 01 NR-0-4-C 4788 15l 4 C <2 Waterfall Forest Yes Brush Fair Forest Yes Brush Fair 30 0 0 0 60 0 0 10 100Little Bitterroot River LBRT 04-01 04 01 NR-2-4-C 2120 15l 4 C 2-<4 Gradient Forest No Brush Fair Forest No Brush Fair 10 0 0 0 20 0 70 0 100Little Bitterroot River LBRT 05-01 05 01 NR-2-4-U 3976 15l 4 U 2-<4 Confinement Forest Yes Grass Poor Forest Yes Grass Poor 20 80 0 0 0 0 0 0 100Little Bitterroot River LBRT 06-01 06 01 NR-2-5-U 2369 15l 5 U 2-<4 Stream Order Forest Yes Grass Poor Forest Yes Grass Poor 20 80 0 0 0 0 0 0 100
Lynch Creek LNCH 01-01 01 01 NR-10-1-C 1139 15l 1 C >10 Start Forest No Mature Coniferous Good Forest No Mature Coniferous Good 0 0 0 0 0 0 100 0 100Lynch Creek LNCH 02-01 02 01 NR-10-1-U 764 15l 1 U >10 Confinement Forest Yes Mature Coniferous Fair Forest Yes Mature Coniferous Fair 30 0 0 0 70 0 0 0 100Lynch Creek LNCH 03-01 03 01 NR-4-1-C 2951 15l 1 C 4-10 Gradient, Confinement Forest Yes Brush Fair Forest Yes Brush Fair 30 0 0 0 70 0 0 0 100Lynch Creek LNCH 04-01 04 01 NR-10-1-C 2911 15l 1 C >10 Gradient Forest Yes Brush Fair Forest Yes Brush Fair 0 0 0 0 100 0 0 0 100Lynch Creek LNCH 05-01 05 01 NR-4-1-C 6014 15a 15l 1 C 4-10 Gradient Forest No Mature Coniferous Good Forest No Mature Coniferous Good 0 0 0 0 0 0 100 0 100Lynch Creek LNCH 06-01 06 01 NR-4-1-U 2708 15a 15l 1 U 4-10 Confinement Forest Yes Mature Coniferous Fair Forest Yes Mature Coniferous Fair 50 0 0 0 50 0 0 0 100Lynch Creek LNCH 07-01 07 01 NR-2-1-U 11434 15a 1 U 2-<4 Gradient Forest Yes Mature Coniferous Fair Forest Yes Mature Coniferous Fair 30 0 0 0 70 0 0 0 100Lynch Creek LNCH 07-02 07 02 NR-2-1-U 1060 15a 1 U 2-<4 Gradient road Road Yes Mature Coniferous Fair Road Yes Mature Coniferous Fair 80 0 0 0 20 0 0 0 100Lynch Creek LNCH 08-01 08 01 NR-4-1-C 3117 15a 1 C 4-10 Gradient, Confinement Road Yes Mature Coniferous Fair Forest Yes Mature Coniferous Fair 100 0 0 0 0 0 0 0 100Lynch Creek LNCH 09-01 09 01 NR-4-1-U 3625 15a 1 U 4-10 Confinement Forest No Mature Coniferous Good Forest No Mature Coniferous Good 0 0 0 0 0 0 100 0 100Lynch Creek LNCH 10-01 10 01 NR-2-2-U 4240 15a 2 U 2-<4 Stream Order Forest No Brush Good Forest No Brush Good 0 0 0 0 0 0 100 0 100Lynch Creek LNCH 11-01 11 01 NR-2-3-U 5835 15a 3 U 2-<4 Stream Order Rural Res./Hobby Farm Yes Brush Fair Rural Res./Hobby Farm Yes Brush Fair 20 30 0 0 30 10 0 10 100Lynch Creek LNCH 12-01 12 01 NR-0-4-U 8183 15a 4 U <2 Stream Order Hay/Pasture Yes Mature Decidious Fair Rural Res./Hobby Farm Yes Grass Poor 10 30 0 0 20 0 10 30 100Lynch Creek LNCH 12-02 12 02 NR-0-4-U 3053 15a 4 U <2 Stream Order Landuse, Landcover Hay/Pasture Yes Grass Fair Hay/Pasture Yes Mature Decidious Fair 0 50 50 0 0 0 0 0 100Lynch Creek LNCH 12-03 12 03 NR-0-4-U 5541 15a 4 U <2 Stream Order Landuse, Landcover Rural Res./Hobby Farm Yes Grass Poor Rural Res./Hobby Farm Yes Grass Poor 40 0 0 0 0 0 0 60 100Lynch Creek LNCH 12-04 12 04 NR-0-4-U 2577 15a 4 U <2 Stream Order Landuse, Landcover Hay/Pasture Yes Grass Poor Hay/Pasture Yes Bare Poor 0 40 60 0 0 0 0 0 100Lynch Creek LNCH 12-05 12 05 NR-0-4-U 4945 15a 4 U <2 Stream Order Diversion to impoundment Hay/Pasture Yes Grass Poor Hay/Pasture Yes Grass Poor 0 40 0 0 0 20 0 40 100
Little Thompson River LTMP 01-01 01 01 NR-4-1-U 769 15e 1 U 4-10 Start Forest Yes Mature Coniferous Fair Forest Yes Mature Coniferous Fair 0 0 0 0 100 0 0 0 100Little Thompson River LTMP 02-01 02 01 NR-4-1-U 2009 15l 15e 1 U 4-10 Ecoregion Forest Yes Mature Coniferous Fair Forest Yes Mature Coniferous Fair 0 0 0 0 100 0 0 0 100Little Thompson River LTMP 03-01 03 01 NR-2-1-U 2131 15l 15e 1 U 2-<4 Gradient Forest Yes Grass Fair Forest Yes Grass Fair 0 0 0 0 100 0 0 0 100Little Thompson River LTMP 03-02 03 02 NR-2-1-U 2504 15l 15l 1 U 2-<4 Lake Gradient Forest Yes Grass Fair Forest Yes Grass Fair 0 50 0 0 50 0 0 0 100Little Thompson River LTMP 04-01 04 01 NR-0-1-U 4365 15l 15l 1 U <2 Gradient Forest Yes Grass Fair Forest Yes Grass Fair 10 0 0 0 90 0 0 0 100Little Thompson River LTMP 04-02 04 02 NR-0-1-U 2178 15l 15l 1 U <2 Gradient Landcover Range Yes Grass Fair Range Yes Grass Fair 0 100 0 0 0 0 0 0 100Little Thompson River LTMP 04-03 04 03 NR-0-1-U 1402 15l 15l 1 U <2 Gradient Landcover Forest Yes Grass Fair Forest Yes Brush Fair 0 0 0 0 100 0 0 0 100Little Thompson River LTMP 04-04 04 04 NR-0-1-U 1702 15l 15l 1 U <2 Gradient Landcover Forest No Grass Fair Forest No Grass Fair 0 0 0 0 20 0 80 0 100Little Thompson River LTMP 05-01 05 01 NR-0-3-U 2350 15l 15l 3 U <2 Stream Order Forest Yes Brush Fair Forest No Brush Fair 0 0 0 0 90 0 10 0 100Little Thompson River LTMP 05-02 05 02 NR-0-3-U 1596 15l 15l 3 U <2 Stream Order Landuse Forest Yes Brush Fair Forest Yes Brush Fair 30 0 0 0 0 0 0 70 100Little Thompson River LTMP 06-01 06 01 NR-0-3-U 4477 15l 15l 3 U <2 Tributary Forest No Brush Good Forest No Brush Good 0 0 0 0 50 0 50 0 100Little Thompson River LTMP 06-02 06 02 NR-0-3-U 2880 15l 15l 3 U <2 Tributary Beaver Forest Yes Brush Fair Forest Yes Brush Fair 0 0 0 0 100 0 0 0 100Little Thompson River LTMP 07-01 07 01 NR-0-3-U 5048 15l 15l 3 U <2 Tributary Forest Yes Brush Fair Forest Yes Brush Fair 0 0 0 0 100 0 0 0 100Little Thompson River LTMP 08-01 08 01 NR-2-3-C 2942 15l 15l 3 C 2-<4 Gradient, Confinement Forest Yes Brush Fair Forest Yes Brush Fair 30 0 0 0 50 0 20 0 100Little Thompson River LTMP 09-01 09 01 NR-0-3-C 2679 15l 15l 3 C <2 Gradient Forest Yes Brush Fair Forest Yes Brush Fair 30 0 0 0 70 0 0 0 100Little Thompson River LTMP 10-01 10 01 NR-0-3-C 5022 15l 15l 3 C <2 Tributary Forest No Brush Good Forest Yes Brush Fair 0 0 0 0 70 0 30 0 100Little Thompson River LTMP 11-01 11 01 NR-2-3-C 19455 15l 15l 3 C 2-<4 Gradient Forest Yes Brush Fair Forest Yes Brush Fair 0 0 0 0 70 0 30 0 100Little Thompson River LTMP 12-01 12 01 NR-0-3-U 6287 15l 15l 3 U <2 Gradient, Confinement Forest No Brush Good Forest No Brush Good 0 0 0 0 20 0 80 0 100Little Thompson River LTMP 13-01 13 01 NR-0-3-U 12911 15l 15l 3 U <2 Tributary Forest No Brush Good Forest No Brush Good 10 0 0 0 10 0 80 0 100Little Thompson River LTMP 14-01 14 01 NR-0-4-U 14455 15l 15l 4 U <2 Tributary Forest Yes Bare Poor Forest Yes Grass Poor 10 0 0 0 60 0 0 30 100Little Thompson River LTMP 14-02 14 02 NR-0-4-U 3381 15l 15l 4 U <2 Tributary Landuse Hay/Pasture Yes Grass Poor Road Yes Mature Deciduous Poor 70 30 0 0 0 0 0 0 100Little Thompson River LTMP 14-03 14 03 NR-0-4-U 1294 15l 15l 4 U <2 Tributary Landuse Forest yes Mature Deciduous Poor Forest Yes Mature Deciduous Fair 0 20 0 0 70 0 0 10 100Little Thompson River LTMP 15-01 15 01 NR-0-4-C 3289 15l 15l 4 C <2 Confinement Forest Yes Mature Coniferous Fair Forest Yes Brush Fair 50 0 0 0 50 0 0 0 100

STR
EAM
REA
CH
_ID
REA
CH
SUBR
EAC
H
REA
CH
_TYP
E
LEN
GTH
_FT
PRI_
ECO
REG
SEC
_EC
OR
EG
STR
EAM
_OR
D
CO
NFI
NE
GR
ADIE
NT
HB_
TRIG
GER
SB_T
RIG
GER
LB_L
AND
USE
LB_A
NTH
RO
LB_R
P_VE
G
LB_R
P_H
LTH
RB_
LAN
DU
SE
RB_
ANTH
RO
RB_
RP_
VEG
RB_
RP_
HLT
H
ANTH
RO
_TR
A
ANTH
RO
_GR
A
ANTH
RO
_CR
O
ANTH
RO
_MIN
ANTH
RO
_FO
R
ANTH
RO
_IR
R
ANTH
RO
_NAT
ANTH
RO
_OTH
ANTH
RO
_TO
T
McGregor Creek MCGR 01-01 01 01 NR-2-2-U 1014 15l 15l 2 U 2-<4 Start Rural Res./Hobby Farm Yes Brush Fair Road Yes Brush Fair 80 0 0 0 0 0 0 20 100McGregor Creek MCGR 01-02 01 02 NR-2-2-U 1303 15l 15l 2 U 2-<4 Start Landcover Forest Yes Grass Fair Road Yes Grass 80 0 0 0 20 0 0 0 100McGregor Creek MCGR 02-01 02 01 NR-2-3-U 538 15l 15l 3 U 2-<4 Stream Order Forest Yes Brush Fair Road Yes Brush Fair 80 0 0 0 20 0 0 0 100McGregor Creek MCGR 02-02 02 02 NR-2-3-U 2131 15l 15l 3 U 2-<4 Stream Order Landcover Forest Yes Brush Fair Forest No Brush Good 90 0 0 0 0 0 0 10 100McGregor Creek MCGR 02-03 02 03 NR-2-3-U 2339 15l 15l 3 U 2-<4 Stream Order Landcover Forest Yes Brush Fair Forest Yes Brush Fair 70 0 0 0 30 0 0 0 100McGregor Creek MCGR 02-04 02 04 NR-2-3-U 1232 15l 15l 3 U 2-<4 Stream Order Landcover Forest Yes Grass Fair Forest No Grass Fair 70 0 0 0 0 0 0 30 100McGregor Creek MCGR 03-01 03 01 NR-0-3-U 1900 3 U <2 Gradient Forest No Brush Fair Hay/Pasture Yes Brush Fair 10 80 0 0 0 0 0 10 100McGregor Creek MCGR 04-01 04 01 NR-0-3-U 1811 15l 15l 3 U <2 Gradient Landcover Forest Yes Brush Fair Road Yes Brush 80 0 0 0 20 0 0 0 100McGregor Creek MCGR 05-01 05 01 NR-0-3-U 1461 3 U <2 Gradient Landcover Forest Yes Grass Fair Road Yes Brass Fair 50 0 0 0 50 0 0 0 100McGregor Creek MCGR 06-01 06 01 NR-0-3-U 1778 15l 15l 3 U <2 Lake Road, Landuse Forest Yes Mature Coniferous Fair Road Yes Brush Fair 50 0 0 0 50 0 0 0 100McGregor Creek MCGR 06-02 06 02 NR-0-3-U 5487 15l 15l 3 U <2 Lake Forest Yes Mature Coniferous Fair Road Yes Grass Poor 50 0 0 0 50 0 0 0 100McGregor Creek MCGR 07-01 07 01 NR-4-3-C 2787 15l 15l 3 C 4-10 Gradient, Confinement Forest Yes Mature Coniferous Fair Road Yes Grass Poor 70 0 0 0 30 0 0 0 100McGregor Creek MCGR 08-01 08 01 NR-4-3-U 2112 15l 15l 3 U 4-10 Confinement Forest Yes Mature Coniferous Fair Forest No Mature Coniferous Good 30 0 0 0 70 0 0 0 100McGregor Creek MCGR 09-01 09 01 NR-0-3-U 2747 15l 15l 3 U <2 Gradient Hay/Pasture Yes Mature Deciduous Fair Forest Yes Mature Deciduous Fair 10 80 0 0 0 10 0 0 100McGregor Creek MCGR 09-02 09 02 NR-0-3-U 2527 15l 15l 3 U <2 Gradient Landcover Hay/Pasture Yes Grass Poor Hay/Pasture Yes Grass Poor 0 90 0 0 0 10 0 0 100McGregor Creek MCGR 09-03 09 03 NR-0-3-U 4035 15l 15l 3 U <2 Gradient Landuse Hay/Pasture Yes Brush Poor Hay/Pasture Yes Brush Poor 10 0 90 0 0 0 0 0 100McGregor Creek MCGR 09-04 09 04 NR-0-3-U 751 15l 15l 3 U <2 Gradient Landuse Hay/Pasture Yes Brush Fair Hay/Pasture Yes Brush Fair 0 100 0 0 0 0 0 0 100
McGinnis Creek MGNS 01-01 01 01 NR-4-1-U 2667 15l 15l 1 U 4-10 Start Forest Yes Mature Coniferous Fair Forest Yes Mature Coniferous Fair 0 0 0 0 40 0 60 0 100McGinnis Creek MGNS 02-01 02 01 NR-2-1-U 7203 15l 15l 1 U 2-<4 Gradient Forest Yes Mature Coniferous Fair Forest Yes Mature Coniferous Fair 10 0 0 0 50 0 40 0 100McGinnis Creek MGNS 03-01 03 01 NR-2-2-U 14584 15l 15l 2 U 2-<4 Stream Order Forest Yes Mature Coniferous Fair Forest Yes Mature Coniferous Fair 50 0 0 0 50 0 0 0 100McGinnis Creek MGNS 04-01 04 01 NR-0-2-C 2585 15l 15l 2 C <2 Gradient, Confinement Forest Yes Grass Poor Forest Yes Grass Poor 70 0 0 0 30 0 0 0 100
Sullivan Creek SLVN 01-01 01 01 NR-4-1-C 1686 15l 1 C 4-10 Start Forest Yes Mature Coniferous Fair Forest Yes Mature Coniferous Fair 60 0 0 40 0 0 0 0 100Sullivan Creek SLVN 02-01 02 01 NR-4-1-U 1875 15l 1 U 4-10 Confinement Forest Yes Mature Coniferous Fair Forest Yes Mature Coniferous Fair 50 0 0 20 30 0 0 0 100Sullivan Creek SLVN 03-01 03 01 NR-2-1-U 1589 15l 1 U 2-<4 Gradient Forest Yes Brush Fair Forest Yes Brush Fair 0 0 0 0 0 0 0 100 100Sullivan Creek SLVN 03-02 03 02 NR-2-1-U 5983 15l 1 U 2-<4 Gradient Landcover Forest Yes Mature Coniferous Fair Forest Yes Mature Coniferous Fair 20 0 0 30 0 0 0 50 100Sullivan Creek SLVN 03-03 03 03 NR-2-1-U 1653 15l 1 U 2-<4 Gradient Landcover Road Yes Bare Poor Range Yes Grass Poor 80 0 0 0 0 0 0 20 100Sullivan Creek SLVN 04-01 04 01 NR-0-1-U 3993 15l 1 U <2 Gradient Road Yes Grass Poor Range Yes Grass Poor 50 50 0 0 0 0 0 0 100
Swamp Creek SWMP 01-01 01 01 NR-0-3-U 6743 15a 3 U <2 Start Forest Yes Mature Coniferous Fair Rural Res./Hobby Farm Yes Mature Coniferous Fair 40 0 0 0 30 0 0 30 100Swamp Creek SWMP 01-02 01 02 NR-0-3-U 1556 15a 3 U <2 Start Land use Road Yes Bare Poor Forest Yes Bare Poor 50 30 0 0 0 0 0 20 100Swamp Creek SWMP 01-03 01 03 NR-0-3-U 382 15a 3 U <2 Start Land use Hay/Pasture Yes Grass Poor Rural Res./Hobby Farm Yes Grass Poor 0 60 40 0 0 0 0 0 100Swamp Creek SWMP 01-04 01 04 NR-0-3-U 2060 15a 3 U <2 Start Landcover Forest No Mature Deciduous Fair Range Yes Grass Fair 0 60 0 0 0 0 10 30 100Swamp Creek SWMP 01-05 01 05 NR-0-3-U 4198 15a 3 U <2 Start Land use Hay/Pasture Yes Grass Fair Hay/Pasture Yes Grass Fair 10 90 0 0 0 0 0 0 100Swamp Creek SWMP 01-06 01 06 NR-0-3-U 8191 15a 3 U <2 Start Landcover Forest Yes Mature Coniferous Fair Road Yes Mature Coniferous Fair 30 30 0 0 0 0 20 20 100Swamp Creek SWMP 01-07 01 07 NR-0-3-U 2816 15a 3 U <2 Start Landcover, stream mouth Forest Yes Brush Fair Road Yes Brush Fair 90 0 0 0 0 0 0 10 100

Attachment B
Sediment and Habitat Database

Rea
ch ID
Dat
e
Cel
l
Rea
ch T
ype
Exis
ting
Ros
gen
Stre
am T
ype
Pote
ntia
l Ros
gen
Stre
am T
ype
GIS
Cal
cula
ted
Sinu
osity
Fiel
d Sl
ope
(Per
cent
)
Aer
ial A
sses
smen
t Va
lley
Gra
dien
t
Ban
kful
l Cha
nnel
Wid
th
Cro
ss-S
ectio
nal A
rea
Ban
kful
l Mea
n D
epth
Wid
th /
Dep
th R
atio
Max
imum
Dep
th
Floo
dpro
ne W
idth
Entr
ench
men
t Rat
io
Riff
le P
ebbl
e C
ount
D50
Riff
le P
ebbl
e C
ount
Pe
rcen
t <2m
m
Riff
le P
ebbl
e C
ount
Pe
rcen
t <6m
m
Riff
le G
rid T
oss
Perc
ent <
6mm
Riff
le S
tabi
lity
Inde
x
Num
ber o
f Poo
ls p
er
1000
Fee
t
Mea
n R
esid
ual P
ool
Dep
th
Num
ber o
f Ind
ivid
ual
Piec
es o
f LW
D p
er 1
000
Feet
Num
ber o
f LW
D
Agg
rega
tes
per 1
000
Feet
Tota
l Num
ber o
f LW
D
per 1
000
Feet
Perc
ent U
nder
stor
y Sh
rub
Cov
er
Perc
ent B
are/
Dis
turb
ed
Gro
und
Perc
ent R
ipra
p
Perc
ent O
vers
tory
C
anop
y C
over
Rig
ht B
ank
Mea
n R
ipar
ian
Zone
Wid
th
Left
Ban
k M
ean
Rip
aria
n Zo
ne W
idth
SWMP01-05 9/7/11 1 NR-0-3-U B4c C4 2.10 0.1 <2% 17.3 20.8 1.20 14.4 1.8 28.3 1.6 21 15 18 13 6 2.1 19 0 19 31 8 1 0 1 6SWMP01-05 9/7/11 2 NR-0-3-U <2%SWMP01-05 9/7/11 3 NR-0-3-U <2%SWMP01-05 9/7/11 4 NR-0-3-U <2%SWMP01-05 9/7/11 5 NR-0-3-U B4c C4 2.10 0.1 <2% 24.0 32.4 1.35 17.8 2.0 44.0 1.8 15 18 28 31
HNRY04-01 9/7/11 1 NR-4-2-U F3a B3a 1.20 5.1 4-<10% 10.0 10.6 1.06 9.4 2.0 12.0 1.2 88 0 0 7 22 0.5 8 2 30 76 0 0 31 116 17HNRY04-01 9/7/11 2 NR-4-2-U E3a B3a 1.20 5.1 4-<10% 10.0 10.1 1.01 9.9 1.5 37.5 3.8 104 0 0 5HNRY04-01 9/7/11 3 NR-4-2-U E3a B3a 1.20 5.1 4-<10% 8.5 10.3 1.21 7.0 1.6 50.5 5.9 49 2 3 0HNRY04-01 9/7/11 4 NR-4-2-U C3/4a B3a 1.20 5.1 4-<10% 12.0 12.0 1.00 12.0 1.4 45.0 3.8HNRY04-01 9/7/11 5 NR-4-2-U B4a B3a 1.20 5.1 4-<10% 11.0 8.6 0.78 14.1 1.2 16.5 1.5 40 1 5 6
SWMP01-06 9/8/11 1 NR-0-3-U C4 C4 1.98 0.6 <2% 24.0 27.0 1.13 21.3 1.8 354.0 >14.8 37 7 8 14 86 14 2.0 38 4 60 38 0 0 20 48 31SWMP01-06 9/8/11 2 NR-0-3-U C4 C4 1.98 0.6 <2% 25.5 26.3 1.03 24.8 1.6 335.5 >13.2 37 0 3 5 98SWMP01-06 9/8/11 3 NR-0-3-U C4 C4 1.98 0.6 <2% 26.8 30.4 1.13 23.6 1.6 246.8 >9.2 43 3 7 7SWMP01-06 9/8/11 4 NR-0-3-U <2%SWMP01-06 9/8/11 5 NR-0-3-U C4 C4 1.98 0.6 <2% 27.0 39.3 1.46 18.6 1.8 229.0 >8.5 31 9 11 3
MGNS02-01 9/8/11 1 NR-2-1-U C4b B3 1.14 2.4 2-<4% 10.0 8.2 0.82 12.2 1.2 30.0 3.0 58 8 9 7 34 0.7 42 14 118 48 0 0 14 200 36MGNS02-01 9/8/11 2 NR-2-1-U E4b B3 1.14 2.4 2-<4% 5.5 6.3 1.14 4.8 1.5 235.5 >42.8 42 25 33 14MGNS02-01 9/8/11 3 NR-2-1-U 2-<4%MGNS02-01 9/8/11 4 NR-2-1-U E3b B3 1.14 2.4 2-<4% 9.5 7.6 0.80 11.9 1.5 45.5 4.8 68 9 13 6MGNS02-01 9/8/11 5 NR-2-1-U B4 B3 1.14 2.4 2-<4% 9.0 7.6 0.84 10.7 1.2 18.0 2.0 35 4 7 10
MGNS03-01 9/8/11 1 NR-2-2-U F3b B3 1.14 2.5 2-<4% 21.5 22.3 1.04 20.8 1.5 27.5 1.3 92 2 3 0 7 1.0 35 13 129 53 0 0 3 34 63MGNS03-01 9/8/11 2 NR-2-2-U B3 B3 1.14 2.5 2-<4% 16.0 15.2 0.95 16.8 1.5 26.0 1.6 97 1 2 0MGNS03-01 9/8/11 3 NR-2-2-U B3 B3 1.14 2.5 2-<4% 19.0 19.4 1.02 18.6 1.7 28.0 1.5 104 5 5 1MGNS03-01 9/8/11 4 NR-2-2-U C3b B3 1.14 2.5 2-<4% 20.2 28.1 1.39 14.5 1.8 85.2 4.2MGNS03-01 9/8/11 5 NR-2-2-U C3b B3 1.14 2.5 2-<4% 17.0 18.1 1.07 16.0 1.5 40.0 2.4 73 2 6 3
LNCH09-01 9/9/11 1 NR-4-1-U C4b B4 1.37 3.2 4-<10% 10.2 5.1 0.50 20.5 0.8 120.2 11.8 43 2 2 4 85 18 0.8 33 3 49 9 1 0 29 104 200LNCH09-01 9/9/11 2 NR-4-1-U F4b B4 1.37 3.2 4-<10% 11.0 7.9 0.72 15.3 1.1 14.0 1.3 40 2 2 6LNCH09-01 9/9/11 3 NR-4-1-U C4b B4 1.37 3.2 4-<10% 10.6 6.5 0.61 17.3 1.0 60.6 5.7 38 6 6 3 89LNCH09-01 9/9/11 4 NR-4-1-U C4b B4 1.37 3.2 4-<10% 13.7 6.4 0.46 29.6 0.7 37.7 2.8LNCH09-01 9/9/11 5 NR-4-1-U C4b B4 1.37 3.2 4-<10% 10.8 5.9 0.54 19.9 0.9 45.8 4.2 42 1 1 1 90
LNCH12-02 9/9/11 1 NR-0-4-U E4/C4 C4 1.14 1.5 <2% 10.8 11.4 1.06 10.2 1.4 30.8 2.9 55 0 0 4 15 1.3 17 5 50 35 6 0 16 20 15LNCH12-02 9/9/11 2 NR-0-4-U C4 C4 1.14 1.5 <2% 15.6 12.9 0.83 18.9 1.2 97.6 6.3 60 3 4 4LNCH12-02 9/9/11 3 NR-0-4-U C4 C4 1.14 1.5 <2% 13.0 13.7 1.05 12.4 1.2 253.0 19.5 51 2 2 3LNCH12-02 9/9/11 4 NR-0-4-U C4 C4 1.14 1.5 <2% 25.3 25.1 0.99 25.5 1.5 245.3 9.7LNCH12-02 9/9/11 5 NR-0-4-U C3 C4 1.14 1.5 <2% 29.0 22.3 0.77 37.7 1.3 79.0 2.7 81 2 2 5
LTMP14-03 9/12/11 1 NR-0-4-U B3c C3 1.20 0.9 <2% 34.4 42.7 1.24 27.7 1.7 76.4 2.2 71 3 3 6 5 1.3 10 3 23 64 2 0 13 119 60LTMP14-03 9/12/11 2 NR-0-4-U B4c C3 1.20 0.9 <2% 55.2 70.7 1.28 43.1 2.3 115.2 2.1 60 3 4 1LTMP14-03 9/12/11 3 NR-0-4-U B4c C3 1.20 0.9 <2% 42.0 50.0 1.19 35.3 2.1 86.0 2.0 51 1 3 0LTMP14-03 9/12/11 4 NR-0-4-U C4 C3 1.20 0.9 <2% 38.5 48.6 1.26 30.5 2.1 108.5 2.8LTMP14-03 9/12/11 5 NR-0-4-U C4 C3 1.20 0.9 <2% 35.6 40.1 1.13 31.6 2.2 129.6 3.6 60 1 1 1 73

Rea
ch ID
Dat
e
Cel
l
Rea
ch T
ype
Exis
ting
Ros
gen
Stre
am T
ype
Pote
ntia
l Ros
gen
Stre
am T
ype
GIS
Cal
cula
ted
Sinu
osity
Fiel
d Sl
ope
(Per
cent
)
Aer
ial A
sses
smen
t Va
lley
Gra
dien
t
Ban
kful
l Cha
nnel
Wid
th
Cro
ss-S
ectio
nal A
rea
Ban
kful
l Mea
n D
epth
Wid
th /
Dep
th R
atio
Max
imum
Dep
th
Floo
dpro
ne W
idth
Entr
ench
men
t Rat
io
Riff
le P
ebbl
e C
ount
D50
Riff
le P
ebbl
e C
ount
Pe
rcen
t <2m
m
Riff
le P
ebbl
e C
ount
Pe
rcen
t <6m
m
Riff
le G
rid T
oss
Perc
ent <
6mm
Riff
le S
tabi
lity
Inde
x
Num
ber o
f Poo
ls p
er
1000
Fee
t
Mea
n R
esid
ual P
ool
Dep
th
Num
ber o
f Ind
ivid
ual
Piec
es o
f LW
D p
er 1
000
Feet
Num
ber o
f LW
D
Agg
rega
tes
per 1
000
Feet
Tota
l Num
ber o
f LW
D
per 1
000
Feet
Perc
ent U
nder
stor
y Sh
rub
Cov
er
Perc
ent B
are/
Dis
turb
ed
Gro
und
Perc
ent R
ipra
p
Perc
ent O
vers
tory
C
anop
y C
over
Rig
ht B
ank
Mea
n R
ipar
ian
Zone
Wid
th
Left
Ban
k M
ean
Rip
aria
n Zo
ne W
idth
LTMP12-01 9/12/11 1 NR-0-3-U F3 B3 1.23 1.7 <2% 30.0 27.3 0.91 33.0 1.4 39.0 1.3 73 0 2 1 9 1.4 13 5 48 90 1 0 7 91 93LTMP12-01 9/12/11 2 NR-0-3-U C3 B3 1.23 1.7 <2% 19.6 21.3 1.09 18.0 1.9 60.6 3.1 62 0 0 0 85LTMP12-01 9/12/11 3 NR-0-3-U B3c B3 1.23 1.7 <2% 35.5 33.9 0.96 37.1 1.6 65.5 1.8 59 0 0 6LTMP12-01 9/12/11 4 NR-0-3-U B3 <2% 66 2 2 2LTMP12-01 9/12/11 5 NR-0-3-U <2%
LBRT01-01 9/13/11 1 NR-0-4-U B4c C4 1.23 0.3 <2% 54.7 96.3 1.76 31.1 2.8 109.7 2.0 11 31 42 8 8 2.0 27 4 43 78 8 0 25 55 62LBRT01-01 9/13/11 2 NR-0-4-U C4 C4 1.23 0.3 <2% 54.5 89.8 1.65 33.1 2.7 179.5 3.3 13 33 37 11LBRT01-01 9/13/11 3 NR-0-4-U B4c C4 1.23 0.3 <2% 50.0 66.0 1.32 37.9 2.1 95.0 1.9 24 9 15 7LBRT01-01 9/13/11 4 NR-0-4-U <2%LBRT01-01 9/13/11 5 NR-0-4-U C4 C4 1.23 0.3 <2% 34.2 53.6 1.57 21.8 2.5 94.2 2.8 15 26 32 7
MCGR02-03 9/13/11 1 NR-2-3-U C3 E3 1.02 0.7 2-<4% 13.5 14.9 1.10 12.3 1.6 233.5 17.3 126 23 23 0 14 0.6 42 20 150 78 0 0 15 200 134MCGR02-03 9/13/11 2 NR-2-3-U C3 E3 1.02 0.7 2-<4% 13.3 12.7 0.96 13.8 1.8 233.3 >17.6 218 18 19 0MCGR02-03 9/13/11 3 NR-2-3-U E3 E3 1.02 0.7 2-<4% 11.2 10.6 0.94 11.9 1.4 219.2 >19.6 128 37 37 0MCGR02-03 9/13/11 4 NR-2-3-U E3 E3 1.02 0.7 2-<4% 11.2 12.7 1.14 9.9 1.8 229.2 >20.5MCGR02-03 9/13/11 5 NR-2-3-U E3 E3 1.02 0.7 2-<4% 10.5 10.1 0.96 10.9 1.4 110.5 10.5 126 31 31 0
MCGR06-02 9/14/11 1 NR-0-3-U B4c B4 1.10 1.9 <2% 19.4 24.1 1.24 15.6 1.8 31.4 1.6 42 0 2 3 13 0.8 26 1 31 89 0 0 24 13 23MCGR06-02 9/14/11 2 NR-0-3-U C4 B4 1.10 1.9 <2% 20.4 24.1 1.18 17.3 1.7 48.4 2.4 38 0 2 1MCGR06-02 9/14/11 3 NR-0-3-U B4c B4 1.10 1.9 <2% 19.9 24.3 1.22 16.3 1.7 33.9 1.7 50 1 6 3MCGR06-02 9/14/11 4 NR-0-3-U B4c B4 1.10 1.9 <2% 17.2 18.4 1.07 16.0 1.6 37.2 2.2MCGR06-02 9/14/11 5 NR-0-3-U C4 B4 1.10 1.9 <2% 19.8 22.8 1.15 17.2 1.8 69.8 3.5 55 1 3 1
LAZR08-01 9/14/11 1 NR-2-3-U 1.66 2-<4% 2-<4% 5.6 4.2 0.74 7.5 1.1 7.6 1.4 26 0.7 20 2 32 75 0 0 7 200 48LAZR08-01 9/14/11 2 NR-2-3-U E4b E4 1.66 2-<4% 2-<4% 5.5 3.4 0.62 8.9 1.0 13.5 2.5 19 4 8 9LAZR08-01 9/14/11 3 NR-2-3-U B4 E4 1.66 2-<4% 2-<4% 9.8 5.0 0.51 19.3 0.8 13.8 1.4 14 5 14 16LAZR08-01 9/14/11 4 NR-2-3-U B4 E4 1.66 2-<4% 2-<4% 10.2 5.7 0.56 18.2 1.0 21.2 2.1 15 8 12 11LAZR08-01 9/14/11 5 NR-2-3-U E4b E4 1.66 2-<4% 2-<4% 7.4 3.5 0.47 15.8 0.8 17.4 2.4 15 3 15 10
LAZR10-01 9/14/11 1 NR-0-3-U C4b B4 1.18 2.6 <2% 11.9 10.4 0.87 13.7 1.6 52.9 4.4 41 0 0 1 10 0.7 28 4 41 78 0 0 48 160 59LAZR10-01 9/14/11 2 NR-0-3-U E4b B4 1.18 2.6 <2% 10.5 10.6 1.01 10.4 1.4 30.5 2.9 39 0 6 4LAZR10-01 9/14/11 3 NR-0-3-U C4b B4 1.18 2.6 <2% 13.2 9.4 0.72 18.5 1.4 36.2 2.7 31 1 2 3LAZR10-01 9/14/11 4 NR-0-3-U B4 B4 1.18 2.6 <2% 11.9 10.8 0.91 13.1 1.6 24.9 2.1 33 1 8 3LAZR10-01 9/14/11 5 NR-0-3-U <2%
FTRP08-01 9/15/11 1 NR-0-4-C B4c C4 1.24 0.5 <2% 47.0 67.9 1.45 32.5 2.0 76.8 1.6 22 18 19 4 5 1.7 16 1 21 99 0 0 11 200 53FTRP08-01 9/15/11 2 NR-0-4-C B4c C4 1.24 0.5 <2% 46.0 76.6 1.67 27.6 2.4 96.3 2.1 31 12 18 4FTRP08-01 9/15/11 3 NR-0-4-C <2%FTRP08-01 9/15/11 4 NR-0-4-C C4 C4 1.24 0.5 <2% 40.0 64.4 1.61 24.8 2.1 135.2 3.4 27 16 18 3FTRP08-01 9/15/11 5 NR-0-4-C C4 C4 1.24 0.5 <2% 37.0 62.0 1.68 22.1 2.1 217.0 5.9 32 7 12 2
FTRP06-02 9/15/11 1 NR-0-3-U C4 C4 1.20 0.5 <2% 23.0 25.8 1.12 20.5 1.5 68.0 3.0 25 1 6 2 12 1.6 0 0 0 62 0 0 0 112 69FTRP06-02 9/15/11 2 NR-0-3-U <2%FTRP06-02 9/15/11 3 NR-0-3-U B4c C4 1.20 0.5 <2% 25.0 31.4 1.26 19.9 1.8 55.0 2.2 24 11 11 5FTRP06-02 9/15/11 4 NR-0-3-U B4c C4 1.20 0.5 <2% 28.0 28.4 1.02 27.6 1.5 61.2 2.2 30 3 7 7FTRP06-02 9/15/11 5 NR-0-3-U B4c C4 1.20 0.5 <2% 26.5 32.4 1.22 21.7 1.8 56.8 2.1 21 11 13 6

Reach ID Reach Type Pool Residual Depth (Feet)
Spawning Gravels
Identified
Pool Tail-out Fines (%)
HNRY04-01 NR-4-2-U 1 0.6HNRY04-01 NR-4-2-U 2 0.5HNRY04-01 NR-4-2-U 3 0.3HNRY04-01 NR-4-2-U 4 0.4HNRY04-01 NR-4-2-U 5 0.5HNRY04-01 NR-4-2-U 6 0.6HNRY04-01 NR-4-2-U 7 0.8HNRY04-01 NR-4-2-U 8 0.5HNRY04-01 NR-4-2-U 9 0.4HNRY04-01 NR-4-2-U 10 0.6HNRY04-01 NR-4-2-U 11 0.8
LNCH09-01 NR-4-1-U 1 0.4 Y 4LNCH09-01 NR-4-1-U 2 0.9LNCH09-01 NR-4-1-U 3 0.9 Y 10LNCH09-01 NR-4-1-U 4 0.8LNCH09-01 NR-4-1-U 5 0.5LNCH09-01 NR-4-1-U 6 0.5 Y 18LNCH09-01 NR-4-1-U 7 1.2 Y 7LNCH09-01 NR-4-1-U 8 1.2 Y 6LNCH09-01 NR-4-1-U 9 0.8LNCH09-01 NR-4-1-U 10 0.4 Y 12LNCH09-01 NR-4-1-U 11 0.4LNCH09-01 NR-4-1-U 12 1.1 Y 6LNCH09-01 NR-4-1-U 13 0.5 Y 2LNCH09-01 NR-4-1-U 14 1.3 Y 4LNCH09-01 NR-4-1-U 15 0.8LNCH09-01 NR-4-1-U 16 1.5LNCH09-01 NR-4-1-U 17 1.2LNCH09-01 NR-4-1-U 18 0.5
LNCH12-02 NR-0-4-U 1 2.0LNCH12-02 NR-0-4-U 2 3.0LNCH12-02 NR-0-4-U 3 0.5LNCH12-02 NR-0-4-U 4 1.2LNCH12-02 NR-0-4-U 5 1.0LNCH12-02 NR-0-4-U 6 0.6LNCH12-02 NR-0-4-U 7 1.0LNCH12-02 NR-0-4-U 8 0.8LNCH12-02 NR-0-4-U 9 0.8LNCH12-02 NR-0-4-U 10 1.5LNCH12-02 NR-0-4-U 11 1.1LNCH12-02 NR-0-4-U 12 1.1LNCH12-02 NR-0-4-U 13 1.0LNCH12-02 NR-0-4-U 14 1.4LNCH12-02 NR-0-4-U 15 2.3
SWMP01-05 NR-0-3-U 1 1.4 Y 26SWMP01-05 NR-0-3-U 2 2.4 Y 12SWMP01-05 NR-0-3-U 3 2.4 Y 15SWMP01-05 NR-0-3-U 4 2.4SWMP01-05 NR-0-3-U 5 1.8 Y 31SWMP01-05 NR-0-3-U 6 2.0 Y 17

Reach ID Reach Type Pool Residual Depth (Feet)
Spawning Gravels
Identified
Pool Tail-out Fines (%)
SWMP01-06 NR-0-3-U 1 2.3 Y 5SWMP01-06 NR-0-3-U 2 1.9 Y 5SWMP01-06 NR-0-3-U 3 0.8 Y 0SWMP01-06 NR-0-3-U 4 1.3 Y 10SWMP01-06 NR-0-3-U 5 2.1SWMP01-06 NR-0-3-U 6 4.0 Y 0SWMP01-06 NR-0-3-U 7 3.2 Y 3SWMP01-06 NR-0-3-U 8 1.1 Y 1SWMP01-06 NR-0-3-U 9 1.5 Y 7SWMP01-06 NR-0-3-U 10 0.7SWMP01-06 NR-0-3-U 11 1.6SWMP01-06 NR-0-3-U 12 2.7 Y 8SWMP01-06 NR-0-3-U 13SWMP01-06 NR-0-3-U 14 2.9 Y 1
MGNS02-01 NR-2-1-U 1 0.8MGNS02-01 NR-2-1-U 2 0.9MGNS02-01 NR-2-1-U 3 0.7MGNS02-01 NR-2-1-U 4 0.8MGNS02-01 NR-2-1-U 5 0.4MGNS02-01 NR-2-1-U 6 0.3MGNS02-01 NR-2-1-U 7 1.1MGNS02-01 NR-2-1-U 8 1.0 Y 22MGNS02-01 NR-2-1-U 9 0.5MGNS02-01 NR-2-1-U 10 0.5MGNS02-01 NR-2-1-U 11 0.6 Y 40MGNS02-01 NR-2-1-U 12 0.9MGNS02-01 NR-2-1-U 13 0.6MGNS02-01 NR-2-1-U 14 0.6MGNS02-01 NR-2-1-U 15 0.6MGNS02-01 NR-2-1-U 16 1.1 Y 22MGNS02-01 NR-2-1-U 17 1.1 Y 10
MGNS03-01 NR-2-2-U 1 0.7MGNS03-01 NR-2-2-U 2 1.1MGNS03-01 NR-2-2-U 3 1.1MGNS03-01 NR-2-2-U 4 1.2MGNS03-01 NR-2-2-U 5 1.4MGNS03-01 NR-2-2-U 6 0.6MGNS03-01 NR-2-2-U 7 0.8
LTMP12-01 NR-0-3-U 1 1.7LTMP12-01 NR-0-3-U 2 1.1LTMP12-01 NR-0-3-U 3 1.6LTMP12-01 NR-0-3-U 4 2.0LTMP12-01 NR-0-3-U 5 1.3LTMP12-01 NR-0-3-U 6 0.8LTMP12-01 NR-0-3-U 7 1.1LTMP12-01 NR-0-3-U 8 1.3LTMP12-01 NR-0-3-U 9 2.0

Reach ID Reach Type Pool Residual Depth (Feet)
Spawning Gravels
Identified
Pool Tail-out Fines (%)
LTMP14-03 NR-0-4-U 1 0.7 Y 8LTMP14-03 NR-0-4-U 2 0.7LTMP14-03 NR-0-4-U 3 1.9LTMP14-03 NR-0-4-U 4 1.9LTMP14-03 NR-0-4-U 5 1.1 Y 2
LBRT01-01 NR-0-4-U 1 2.1 Y 5LBRT01-01 NR-0-4-U 2 2.7 Y 3LBRT01-01 NR-0-4-U 3 1.2LBRT01-01 NR-0-4-U 4 3.2 N 22LBRT01-01 NR-0-4-U 5 2.5 Y 4LBRT01-01 NR-0-4-U 6 1.2LBRT01-01 NR-0-4-U 7 1.4 Y 6LBRT01-01 NR-0-4-U 8 1.4
MCGR02-03 NR-2-3-U 1 0.9MCGR02-03 NR-2-3-U 2 0.6MCGR02-03 NR-2-3-U 3 0.5MCGR02-03 NR-2-3-U 4 0.5MCGR02-03 NR-2-3-U 5 0.6MCGR02-03 NR-2-3-U 6 0.4MCGR02-03 NR-2-3-U 7 0.5
MCGR06-02 NR-0-3-U 1 0.9MCGR06-02 NR-0-3-U 2 1.4MCGR06-02 NR-0-3-U 3 0.7 Y 1MCGR06-02 NR-0-3-U 4 0.6MCGR06-02 NR-0-3-U 5 0.8MCGR06-02 NR-0-3-U 6 0.7MCGR06-02 NR-0-3-U 7 0.9 Y 9MCGR06-02 NR-0-3-U 8 0.6MCGR06-02 NR-0-3-U 9 0.6MCGR06-02 NR-0-3-U 10 1.1MCGR06-02 NR-0-3-U 11 0.7MCGR06-02 NR-0-3-U 12 0.5 Y 14MCGR06-02 NR-0-3-U 13 1.0
LAZR08-01 NR-2-3-U 1 0.4 Y 12LAZR08-01 NR-2-3-U 2 0.6 Y 5LAZR08-01 NR-2-3-U 3 0.9 Y 9LAZR08-01 NR-2-3-U 4 0.7 Y 9LAZR08-01 NR-2-3-U 5 0.9 Y 12LAZR08-01 NR-2-3-U 6 0.8LAZR08-01 NR-2-3-U 7 0.7 Y 19LAZR08-01 NR-2-3-U 8 0.9LAZR08-01 NR-2-3-U 9 0.3 Y 7LAZR08-01 NR-2-3-U 10 0.7 Y 18LAZR08-01 NR-2-3-U 11 0.5LAZR08-01 NR-2-3-U 12 0.8LAZR08-01 NR-2-3-U 13 0.7 Y 11

Reach ID Reach Type Pool Residual Depth (Feet)
Spawning Gravels
Identified
Pool Tail-out Fines (%)
LAZR10-01 NR-0-3-U 1 0.7 Y 7LAZR10-01 NR-0-3-U 2 0.7 Y 4LAZR10-01 NR-0-3-U 3 0.8LAZR10-01 NR-0-3-U 4 0.6
FTRP06-02 NR-0-3-U 1 1.5 Y 13FTRP06-02 NR-0-3-U 2 2.3 Y 8FTRP06-02 NR-0-3-U 3 1.8 Y 6FTRP06-02 NR-0-3-U 4 2.5 Y 2FTRP06-02 NR-0-3-U 5 2.1 Y 7FTRP06-02 NR-0-3-U 6 1.7 Y 7FTRP06-02 NR-0-3-U 7 1.0 Y 6FTRP06-02 NR-0-3-U 8 1.5FTRP06-02 NR-0-3-U 9 1.9 Y 4FTRP06-02 NR-0-3-U 10 1.0 Y 9FTRP06-02 NR-0-3-U 11 1.3 Y 8FTRP06-02 NR-0-3-U 12 0.9
FTRP08-01 NR-0-4-C 1 3.0 Y 5FTRP08-01 NR-0-4-C 2 1.9 Y 3FTRP08-01 NR-0-4-C 3 1.3 Y 3FTRP08-01 NR-0-4-C 4 1.0FTRP08-01 NR-0-4-C 5 1.4 Y 1

Attachment C
Streambank Erosion Sediment Loads

Stream Segm
ent
Reach ID
Reach Type
Sediment Load per 1000
Feet (Tons/Year)
Length (Feet)
Reach Sediment Load
(Tons/Year)
Transportation (Percent)
Grazing (Percent)
Cropland (Percent)
Mining (Percent)
Silviculture (Percent)
Irrigation (Percent)
Natural (Percent)
Other (Percent)
Transportation (Tons/Year)
Grazing (Tons/Year)
Cropland (Tons/Year)
Mining (Tons/Year)
Silviculture (Tons/Year)
Irrigation (Tons/Year)
Natural (Tons/Year)
Other (Tons/Year)
Henry Creek HNRY 01-01 NR-10-1-U 0.00 483 0.0 0 0 0 0 0 0 100 0 0.0 0.0 0.0 0.0 0.0 0.0 0.0 0.0Henry Creek HNRY 02-01 NR-10-1-U 0.00 1958 0.0 0 0 0 0 100 0 0 0 0.0 0.0 0.0 0.0 0.0 0.0 0.0 0.0Henry Creek HNRY 03-01 NR-4-1-U 5.99 7107 42.6 70 0 0 0 30 0 0 0 29.8 0.0 0.0 0.0 12.8 0.0 0.0 0.0Henry Creek HNRY 04-01 NR-4-2-U 3.59 20834 74.8 40.9 0.0 0.0 0.0 20.0 0.0 39.1 0.0 30.6 0.0 0.0 0.0 15.0 0.0 29.2 0.0Henry Creek HNRY 05-01 NR-4-2-C 5.99 1617 9.7 70 0 0 0 0 0 30 0 6.8 0.0 0.0 0.0 0.0 0.0 2.9 0.0Henry Creek HNRY 06-01 NR-4-2-U 5.99 3616 21.7 30 0 0 0 0 0 0 70 6.5 0.0 0.0 0.0 0.0 0.0 0.0 15.2Henry Creek TOTAL 35615 148.7 TOTAL 73.7 0.0 0.0 0.0 27.7 0.0 32.1 15.2Henry Creek PERCENT 0.50 0.00 0.00 0.00 0.19 0.00 0.22 0.10
Lazier Creek LAZR 01-01 NR-10-1-U 0.00 2597 0.0 10 0 0 0 90 0 0 0 0.0 0.0 0.0 0.0 0.0 0.0 0.0 0.0Lazier Creek LAZR 02-01 NR-4-1-U 5.99 5570 33.4 30 0 0 0 70 0 0 0 10.0 0.0 0.0 0.0 23.4 0.0 0.0 0.0Lazier Creek LAZR 03-01 NR-2-1-U 2.18 1677 3.7 40 0 0 0 60 0 0 0 1.5 0.0 0.0 0.0 2.2 0.0 0.0 0.0Lazier Creek LAZR 03-02 NR-2-1-U 1.78 2571 4.6 10 0 0 0 0 0 90 0 0.5 0.0 0.0 0.0 0.0 0.0 4.1 0.0Lazier Creek LAZR 04-01 NR-0-1-U 0.00 1260 0.0 0 0 0 0 0 0 100 0 0.0 0.0 0.0 0.0 0.0 0.0 0.0 0.0Lazier Creek LAZR 05-01 NR-0-2-U 3.31 4401 14.6 10 0 0 0 10 0 80 0 1.5 0.0 0.0 0.0 1.5 0.0 11.7 0.0Lazier Creek LAZR 05-02 NR-0-2-U 9.75 4809 46.9 50 0 0 0 20 0 30 0 23.4 0.0 0.0 0.0 9.4 0.0 14.1 0.0Lazier Creek LAZR 06-01 NR-0-3-U 9.75 2548 24.8 0 0 0 0 70 0 30 0 0.0 0.0 0.0 0.0 17.4 0.0 7.5 0.0Lazier Creek LAZR 07-01 NR-2-3-U 5.60 1423 8.0 0 0 0 0 50 0 50 0 0.0 0.0 0.0 0.0 4.0 0.0 4.0 0.0Lazier Creek LAZR 08-01 NR-2-3-U 14.01 8530 119.5 0.0 40.0 0.0 0.0 60.0 0.0 0.0 0.0 0.0 47.8 0.0 0.0 71.7 0.0 0.0 0.0Lazier Creek LAZR 09-01 NR-10-3-C 5.60 1451 8.1 0 0 0 0 100 0 0 0 0.0 0.0 0.0 0.0 8.1 0.0 0.0 0.0Lazier Creek LAZR 10-01 NR-0-3-U 9.83 550 5.4 0.0 2.1 0.0 0.0 0.0 0.0 48.4 49.6 0.0 0.1 0.0 0.0 0.0 0.0 2.6 2.7Lazier Creek LAZR 10-02 NR-0-3-U 9.75 2263 22.1 10 90 0 0 0 0 0 0 2.2 19.9 0.0 0.0 0.0 0.0 0.0 0.0Lazier Creek TOTAL 39651 291.0 TOTAL 39.0 67.8 0.0 0.0 137.6 0.0 43.9 2.7Lazier Creek PERCENT 0.13 0.23 0.00 0.00 0.47 0.00 0.15 0.01
Little Bitterroot River LBRT 01-01 NR-0-4-U 2.40 10884 26.1 0.0 62.3 0.0 0.0 7.1 0.0 0.0 30.6 0.0 16.3 0.0 0.0 1.9 0.0 0.0 8.0Little Bitterroot River LBRT 02-01 NR-0-4-C 8.82 1942 17.1 0 0 0 0 50 0 50 0 0.0 0.0 0.0 0.0 8.6 0.0 8.6 0.0Little Bitterroot River LBRT 03-01 NR-0-4-C 8.82 4788 42.2 30 0 0 0 60 0 0 10 12.7 0.0 0.0 0.0 25.3 0.0 0.0 4.2Little Bitterroot River LBRT 04-01 NR-2-4-C 5.60 2120 11.9 10 0 0 0 20 0 70 0 1.2 0.0 0.0 0.0 2.4 0.0 8.3 0.0Little Bitterroot River LBRT 05-01 NR-2-4-U 5.60 3976 22.3 20 80 0 0 0 0 0 0 4.5 17.8 0.0 0.0 0.0 0.0 0.0 0.0Little Bitterroot River LBRT 06-01 NR-2-5-U 5.60 2369 13.3 20 80 0 0 0 0 0 0 2.7 10.6 0.0 0.0 0.0 0.0 0.0 0.0Little Bitterroot River TOTAL 26079 132.9 TOTAL 21.0 44.7 0.0 0.0 38.1 0.0 16.9 12.2Little Bitterroot River PERCENT 0.16 0.34 0.00 0.00 0.29 0.00 0.13 0.09
Lynch Creek LNCH 01-01 NR-10-1-C 0.00 1139 0.0 0 0 0 0 0 0 100 0 0.0 0.0 0.0 0.0 0.0 0.0 0.0 0.0Lynch Creek LNCH 02-01 NR-10-1-U 0.00 764 0.0 30 0 0 0 70 0 0 0 0.0 0.0 0.0 0.0 0.0 0.0 0.0 0.0Lynch Creek LNCH 03-01 NR-4-1-C 5.99 2951 17.7 30 0 0 0 70 0 0 0 5.3 0.0 0.0 0.0 12.4 0.0 0.0 0.0Lynch Creek LNCH 04-01 NR-10-1-C 0.00 2911 0.0 0 0 0 0 100 0 0 0 0.0 0.0 0.0 0.0 0.0 0.0 0.0 0.0Lynch Creek LNCH 05-01 NR-4-1-C 1.91 6014 11.5 0 0 0 0 0 0 100 0 0.0 0.0 0.0 0.0 0.0 0.0 11.5 0.0Lynch Creek LNCH 06-01 NR-4-1-U 5.99 2708 16.2 50 0 0 0 50 0 0 0 8.1 0.0 0.0 0.0 8.1 0.0 0.0 0.0Lynch Creek LNCH 07-01 NR-2-1-U 2.18 11434 24.9 30 0 0 0 70 0 0 0 7.5 0.0 0.0 0.0 17.4 0.0 0.0 0.0Lynch Creek LNCH 07-02 NR-2-1-U 2.18 1060 2.3 80 0 0 0 20 0 0 0 1.8 0.0 0.0 0.0 0.5 0.0 0.0 0.0Lynch Creek LNCH 08-01 NR-4-1-C 5.99 3117 18.7 100 0 0 0 0 0 0 0 18.7 0.0 0.0 0.0 0.0 0.0 0.0 0.0Lynch Creek LNCH 09-01 NR-4-1-U 13.90 3625 50.4 0.0 0.0 0.0 0.0 40.0 0.0 30.0 30.0 0.0 0.0 0.0 0.0 20.2 0.0 15.1 15.1Lynch Creek LNCH 10-01 NR-2-2-U 1.78 4240 7.5 0 0 0 0 0 0 100 0 0.0 0.0 0.0 0.0 0.0 0.0 7.5 0.0Lynch Creek LNCH 11-01 NR-2-3-U 5.60 5835 32.7 20 30 0 0 30 10 0 10 6.5 9.8 0.0 0.0 9.8 3.3 0.0 3.3Lynch Creek LNCH 12-01 NR-0-4-U 8.82 8183 72.2 10 30 0 0 20 0 10 30 7.2 21.7 0.0 0.0 14.4 0.0 7.2 21.7Lynch Creek LNCH 12-02 NR-0-4-U 4.94 3053 15.1 0.0 62.5 0.0 0.0 0.0 18.8 18.8 0.0 0.0 9.4 0.0 0.0 0.0 2.8 2.8 0.0Lynch Creek LNCH 12-03 NR-0-4-U 8.82 5541 48.9 40 0 0 0 0 0 0 60 19.5 0.0 0.0 0.0 0.0 0.0 0.0 29.3Lynch Creek LNCH 12-04 NR-0-4-U 8.82 2577 22.7 0 40 60 0 0 0 0 0 0.0 9.1 13.6 0.0 0.0 0.0 0.0 0.0Lynch Creek LNCH 12-05 NR-0-4-U 8.82 4945 43.6 0 40 0 0 0 20 0 40 0.0 17.4 0.0 0.0 0.0 8.7 0.0 17.4Lynch Creek TOTAL 70096 384.4 TOTAL 74.7 67.4 13.6 0.0 82.8 14.8 44.2 86.8Lynch Creek PERCENT 0.19 0.18 0.04 0.00 0.22 0.04 0.11 0.23
Little Thompson River LTMP 01-01 NR-4-1-U 5.99 769 4.6 0 0 0 0 100 0 0 0 0.0 0.0 0.0 0.0 4.6 0.0 0.0 0.0Little Thompson River LTMP 02-01 NR-4-1-U 5.99 2009 12.0 0 0 0 0 100 0 0 0 0.0 0.0 0.0 0.0 12.0 0.0 0.0 0.0Little Thompson River LTMP 03-01 NR-2-1-U 2.18 2131 4.6 0 0 0 0 100 0 0 0 0.0 0.0 0.0 0.0 4.6 0.0 0.0 0.0Little Thompson River LTMP 03-02 NR-2-1-U 2.18 2504 5.5 0 50 0 0 50 0 0 0 0.0 2.7 0.0 0.0 2.7 0.0 0.0 0.0Little Thompson River LTMP 04-01 NR-0-1-U 0.00 4365 0.0 10 0 0 0 90 0 0 0 0.0 0.0 0.0 0.0 0.0 0.0 0.0 0.0Little Thompson River LTMP 04-02 NR-0-1-U 0.00 2178 0.0 0 100 0 0 0 0 0 0 0.0 0.0 0.0 0.0 0.0 0.0 0.0 0.0Little Thompson River LTMP 04-03 NR-0-1-U 0.00 1402 0.0 0 0 0 0 100 0 0 0 0.0 0.0 0.0 0.0 0.0 0.0 0.0 0.0Little Thompson River LTMP 04-04 NR-0-1-U 0.00 1702 0.0 0 0 0 0 20 0 80 0 0.0 0.0 0.0 0.0 0.0 0.0 0.0 0.0Little Thompson River LTMP 05-01 NR-0-3-U 9.75 2350 22.9 0 0 0 0 90 0 10 0 0.0 0.0 0.0 0.0 20.6 0.0 2.3 0.0Little Thompson River LTMP 05-02 NR-0-3-U 9.75 1596 15.6 30 0 0 0 0 0 0 70 4.7 0.0 0.0 0.0 0.0 0.0 0.0 10.9Little Thompson River LTMP 06-01 NR-0-3-U 9.75 4477 43.6 0 0 0 0 50 0 50 0 0.0 0.0 0.0 0.0 21.8 0.0 21.8 0.0Little Thompson River LTMP 06-02 NR-0-3-U 9.75 2880 28.1 0 0 0 0 100 0 0 0 0.0 0.0 0.0 0.0 28.1 0.0 0.0 0.0Little Thompson River LTMP 07-01 NR-0-3-U 9.75 5048 49.2 0 0 0 0 100 0 0 0 0.0 0.0 0.0 0.0 49.2 0.0 0.0 0.0Little Thompson River LTMP 08-01 NR-2-3-C 5.60 2942 16.5 30 0 0 0 50 0 20 0 4.9 0.0 0.0 0.0 8.2 0.0 3.3 0.0Little Thompson River LTMP 09-01 NR-0-3-C 9.75 2679 26.1 30 0 0 0 70 0 0 0 7.8 0.0 0.0 0.0 18.3 0.0 0.0 0.0Little Thompson River LTMP 10-01 NR-0-3-C 9.75 5022 49.0 0 0 0 0 70 0 30 0 0.0 0.0 0.0 0.0 34.3 0.0 14.7 0.0Little Thompson River LTMP 11-01 NR-2-3-C 5.60 19455 108.9 0 0 0 0 70 0 30 0 0.0 0.0 0.0 0.0 76.3 0.0 32.7 0.0Little Thompson River LTMP 12-01 NR-0-3-U 7.81 6287 49.1 0.0 40.0 0.0 0.0 0.0 0.0 20.0 40.0 0.0 19.6 0.0 0.0 0.0 0.0 9.8 19.6Little Thompson River LTMP 13-01 NR-0-3-U 3.31 12911 42.7 10 0 0 0 10 0 80 0 4.3 0.0 0.0 0.0 4.3 0.0 34.2 0.0Little Thompson River LTMP 14-01 NR-0-4-U 8.82 14455 127.5 10 0 0 0 60 0 0 30 12.7 0.0 0.0 0.0 76.5 0.0 0.0 38.2Little Thompson River LTMP 14-02 NR-0-4-U 8.82 3381 29.8 70 30 0 0 0 0 0 0 20.9 8.9 0.0 0.0 0.0 0.0 0.0 0.0Little Thompson River LTMP 14-03 NR-0-4-U 8.98 1294 11.6 0.0 20.0 0.0 0.0 0.0 0.0 40.8 39.2 0.0 2.3 0.0 0.0 0.0 0.0 4.7 4.6Little Thompson River LTMP 15-01 NR-0-4-C 8.82 3289 29.0 50 0 0 0 50 0 0 0 14.5 0.0 0.0 0.0 14.5 0.0 0.0 0.0Little Thompson River TOTAL 105126 676.5 TOTAL 69.8 33.6 0.0 0.0 376.1 0.0 123.5 73.3Little Thompson River PERCENT 0.10 0.05 0.00 0.00 0.56 0.00 0.18 0.11
McGregor Creek MCGR 01-01 NR-2-2-U 2.18 1014 2.2 80 0 0 0 0 0 0 20 1.8 0.0 0.0 0.0 0.0 0.0 0.0 0.4McGregor Creek MCGR 01-02 NR-2-2-U 2.18 1303 2.8 80 0 0 0 20 0 0 0 2.3 0.0 0.0 0.0 0.6 0.0 0.0 0.0McGregor Creek MCGR 02-01 NR-2-3-U 5.60 538 3.0 80 0 0 0 20 0 0 0 2.4 0.0 0.0 0.0 0.6 0.0 0.0 0.0McGregor Creek MCGR 02-02 NR-2-3-U 5.60 2131 11.9 90 0 0 0 0 0 0 10 10.7 0.0 0.0 0.0 0.0 0.0 0.0 1.2McGregor Creek MCGR 02-03 NR-2-3-U 0.21 2339 0.5 0.0 0.0 0.0 0.0 0.0 0.0 80.0 20.0 0.0 0.0 0.0 0.0 0.0 0.0 0.4 0.1McGregor Creek MCGR 02-04 NR-2-3-U 5.60 1232 6.9 70 0 0 0 0 0 0 30 4.8 0.0 0.0 0.0 0.0 0.0 0.0 2.1McGregor Creek MCGR 03-01 NR-0-3-U 9.75 1900 18.5 10 80 0 0 0 0 0 10 1.9 14.8 0.0 0.0 0.0 0.0 0.0 1.9McGregor Creek MCGR 04-01 NR-0-3-U 9.75 1811 17.7 80 0 0 0 20 0 0 0 14.1 0.0 0.0 0.0 3.5 0.0 0.0 0.0McGregor Creek MCGR 05-01 NR-0-3-U 9.75 1461 14.2 50 0 0 0 50 0 0 0 7.1 0.0 0.0 0.0 7.1 0.0 0.0 0.0McGregor Creek MCGR 06-01 NR-0-3-U 9.75 1778 17.3 50 0 0 0 50 0 0 0 8.7 0.0 0.0 0.0 8.7 0.0 0.0 0.0McGregor Creek MCGR 06-02 NR-0-3-U 2.17 5487 11.9 43.4 0.0 0.0 0.0 16.8 16.8 23.1 0.0 5.2 0.0 0.0 0.0 2.0 2.0 2.8 0.0McGregor Creek MCGR 07-01 NR-4-3-C 5.99 2787 16.7 70 0 0 0 30 0 0 0 11.7 0.0 0.0 0.0 5.0 0.0 0.0 0.0McGregor Creek MCGR 08-01 NR-4-3-U 5.99 2112 12.6 30 0 0 0 70 0 0 0 3.8 0.0 0.0 0.0 8.9 0.0 0.0 0.0McGregor Creek MCGR 09-01 NR-0-3-U 9.75 2747 26.8 10 80 0 0 0 10 0 0 2.7 21.4 0.0 0.0 0.0 2.7 0.0 0.0McGregor Creek MCGR 09-02 NR-0-3-U 9.75 2527 24.6 0 90 0 0 0 10 0 0 0.0 22.2 0.0 0.0 0.0 2.5 0.0 0.0McGregor Creek MCGR 09-03 NR-0-3-U 9.75 4035 39.3 10 0 90 0 0 0 0 0 3.9 0.0 35.4 0.0 0.0 0.0 0.0 0.0McGregor Creek MCGR 09-04 NR-0-3-U 9.75 751 7.3 0 100 0 0 0 0 0 0 0.0 7.3 0.0 0.0 0.0 0.0 0.0 0.0McGregor Creek TOTAL 35954 234.5 TOTAL 81.1 65.7 35.4 0.0 36.4 7.1 3.1 5.7McGregor Creek PERCENT 0.35 0.28 0.15 0.00 0.16 0.03 0.01 0.02

Stream Segm
ent
Reach ID
Reach Type
Sediment Load per 1000
Feet (Tons/Year)
Length (Feet)
Reach Sediment Load
(Tons/Year)
Transportation (Percent)
Grazing (Percent)
Cropland (Percent)
Mining (Percent)
Silviculture (Percent)
Irrigation (Percent)
Natural (Percent)
Other (Percent)
Transportation (Tons/Year)
Grazing (Tons/Year)
Cropland (Tons/Year)
Mining (Tons/Year)
Silviculture (Tons/Year)
Irrigation (Tons/Year)
Natural (Tons/Year)
Other (Tons/Year)
McGinnis Creek MGNS 01-01 NR-4-1-U 5.99 2667 16.0 0 0 0 0 40 0 60 0 0.0 0.0 0.0 0.0 6.4 0.0 9.6 0.0McGinnis Creek MGNS 02-01 NR-2-1-U 2.05 7203 14.8 0.0 0.0 0.0 0.0 0.0 0.0 60.0 40.0 0.0 0.0 0.0 0.0 0.0 0.0 8.9 5.9McGinnis Creek MGNS 03-01 NR-2-2-U 0.93 14584 13.6 0.0 0.0 0.0 0.0 0.0 0.0 50.0 50.0 0.0 0.0 0.0 0.0 0.0 0.0 6.8 6.8McGinnis Creek MGNS 04-01 NR-0-2-C 9.75 2585 25.2 70 0 0 0 30 0 0 0 17.6 0.0 0.0 0.0 7.6 0.0 0.0 0.0McGinnis Creek TOTAL 27039 69.5 TOTAL 17.6 0.0 0.0 0.0 14.0 0.0 25.2 12.7McGinnis Creek PERCENT 0.25 0.00 0.00 0.00 0.20 0.00 0.36 0.18
Sullivan Creek SLVN 01-01 NR-4-1-C 5.99 1686 10.1 60 0 0 40 0 0 0 0 6.1 0.0 0.0 4.0 0.0 0.0 0.0 0.0Sullivan Creek SLVN 02-01 NR-4-1-U 5.99 1875 11.2 50 0 0 20 30 0 0 0 5.6 0.0 0.0 2.2 3.4 0.0 0.0 0.0Sullivan Creek SLVN 03-01 NR-2-1-U 2.18 1589 3.5 0 0 0 0 0 0 0 100 0.0 0.0 0.0 0.0 0.0 0.0 0.0 3.5Sullivan Creek SLVN 03-02 NR-2-1-U 2.18 5983 13.0 20 0 0 30 0 0 0 50 2.6 0.0 0.0 3.9 0.0 0.0 0.0 6.5Sullivan Creek SLVN 03-03 NR-2-1-U 2.18 1653 3.6 80 0 0 0 0 0 0 20 2.9 0.0 0.0 0.0 0.0 0.0 0.0 0.7Sullivan Creek SLVN 04-01 NR-0-1-U 0.00 3993 0.0 50 50 0 0 0 0 0 0 0.0 0.0 0.0 0.0 0.0 0.0 0.0 0.0Sullivan Creek TOTAL 16778 41.4 TOTAL 17.2 0.0 0.0 10.2 3.4 0.0 0.0 10.7Sullivan Creek PERCENT 0.41 0.00 0.00 0.25 0.08 0.00 0.00 0.26
Swamp Creek SWMP 01-01 NR-0-3-U 9.75 6743 65.7 40 0 0 0 30 0 0 30 26.3 0.0 0.0 0.0 19.7 0.0 0.0 19.7Swamp Creek SWMP 01-02 NR-0-3-U 9.75 1556 15.2 50 30 0 0 0 0 0 20 7.6 4.6 0.0 0.0 0.0 0.0 0.0 3.0Swamp Creek SWMP 01-03 NR-0-3-U 9.75 382 3.7 0 60 40 0 0 0 0 0 0.0 2.2 1.5 0.0 0.0 0.0 0.0 0.0Swamp Creek SWMP 01-04 NR-0-3-U 9.75 2060 20.1 0 60 0 0 0 0 10 30 0.0 12.0 0.0 0.0 0.0 0.0 2.0 6.0Swamp Creek SWMP 01-05 NR-0-3-U 11.23 4198 47.1 0.0 20.0 0.0 0.0 1.0 0.0 40.0 39.0 0.0 9.4 0.0 0.0 0.5 0.0 18.9 18.4Swamp Creek SWMP 01-06 NR-0-3-U 8.79 8191 72.0 0.0 47.1 0.0 0.0 0.0 0.0 52.9 0.0 0.0 33.9 0.0 0.0 0.0 0.0 38.1 0.0Swamp Creek SWMP 01-07 NR-0-3-U 9.75 2816 27.5 90 0 0 0 0 0 0 10 24.7 0.0 0.0 0.0 0.0 0.0 0.0 2.7Swamp Creek TOTAL 25946 251.3 TOTAL 58.6 62.2 1.5 0.0 20.2 0.0 59.0 49.9Swamp Creek PERCENT 0.23 0.25 0.01 0.00 0.08 0.00 0.23 0.20