attachment and detachment of living microorganisms using … · original article attachment and...
TRANSCRIPT
ORIGINAL ARTICLE
Attachment and Detachment of Living MicroorganismsUsing a Potential-Controlled Electrode
Sumihiro Koyama & Masa-aki Konishi & Yukari Ohta &
Tetsuya Miwa & Yuji Hatada & Takashi Toyofuku &
Tadashi Maruyama & Yuichi Nogi & Chiaki Kato &
Taishi Tsubouchi
Received: 2 May 2012 /Accepted: 3 February 2013 /Published online: 19 February 2013# The Author(s) 2013. This article is published with open access at Springerlink.com
Abstract We developed an electrical modulation methodfor attachment and detachment of microorganisms. Livingmicroorganisms suspended in non-nutritive media such asPBS(−) and artificial seawater were attracted by and selec-tively attached to indium tin oxide (ITO)/glass electroderegions to which a negative potential was applied. Themicroorganisms suspended in LB medium and glucose so-lution were not attracted to the ITO electrode. Dead micro-organisms were not attracted to the ITO electrode. Theliving microorganisms were retrieved after detachment fromthe ITO electrode by application of a high-frequency trian-gular wave potential. When we applied this method toseparate microorganisms from deep-sea sediment, bacteriabelonging to 19 phyla and 23 classes were collected withoutundesirable high molecular weight contaminants such ashumic acids. At the phylum and class level, respectively,95 and 87 % of the phylotypes among electrically retrievedbacteria were common to the gene clones from the directsediment DNA extraction. This technique is a novel usefulmethod to prepare bacterial cells in a single population or acommunity for metagenomic analyses.
Keywords Electrical modulation . Electrical attachment .
Electrical detachment . Soil microorganisms . Deep-seamicroorganisms . Escherichia coli
Introduction
Microorganisms in soil and sediments are rich sources ofnovel therapeutic compounds such as antibiotics (Raaijmakerset al. 1997), anticancer agents (Shen et al. 2001), and immu-nosuppressants (Skoko et al. 2005), as well as a wide range ofbiotechnologically valuable products (Hatada et al. 2011;Ohta and Hatada 2006). However, the majority of micro-organisms present in sediment and soil cannot be culturedunder conventional laboratory conditions (Rajendhran andGunasekaran 2008).
Metagenomics has been developed over the past decadeto clarify a previously unknown diversity of microorgan-isms on the one hand; on the other hand, it has been drivenby the increasing biotechnological demand for novelenzymes and biomolecules (Rajendhran and Gunasekaran2008; Simon and Daniel 2011). Analysis of DNA directlyextracted from sediment and soil samples has paved the wayto studying natural microbial communities without the needfor cultivation. However, high DNA yields and purity aredifficult to achieve due to the co-extraction of humic sub-stances that inhibit downstream applications, such as poly-merase chain reaction (PCR), restriction enzyme digestion,and DNA ligation (Roh et al. 2006). In indirect DNA ex-traction methods, microorganisms are separated from thesediment and soil samples prior to cell lysis. Higher molec-ular weight and purer environmental DNA is obtained fromindirect cell lysis compared with direct protocols (Courtoiset al. 2001; Gabor et al. 2003; Roh et al. 2006). However, it
S. Koyama (*) :M.-a. Konishi :Y. Ohta :Y. Hatada :T. Toyofuku : T. Maruyama :Y. Nogi : C. Kato : T. TsubouchiInstitute of Biogeosciences,Japan Agency for Marine-Earth Science and Technology,2-15 Natsushima-cho,Yokosuka, Kanagawa 237-0061, Japane-mail: [email protected]
T. MiwaMarine Technology and Engineering Center,Japan Agency for Marine-Earth Science and Technology,2-15 Natsushima-cho,Yokosuka, Kanagawa 237-0061, Japan
Mar Biotechnol (2013) 15:461–475DOI 10.1007/s10126-013-9495-2

was reported that the DNA obtained is usually derived fromonly about 25 to 35 % of the total number of microorgan-isms present in the soil and sediment samples (Rajendhranand Gunasekaran 2008). Various bacterial groups stronglyattach to soil aggregates, which might bias the picture of theorganization of the microbial community in the sample(Rajendhran and Gunasekaran 2008; Steffan et al. 1988).
Microbial single-cell isolation techniques have also beendeveloped during the past decade for three major purposes:(1) to cultivate previously uncultured microbes, (2) to assessand monitor cell physiology and function, and (3) to screenfor novel microbiological products such as enzymes andantibiotics (Brehm-Stecher and Johnson 2004; Broude2011; Ishii et al. 2010). Microbial single-cell isolation tech-niques fall into five major categories (Ishii et al. 2010). Thefirst is the dilution-to-extinction method, which is probablythe simplest method to obtain single cells from heteroge-neous populations and involves serial dilutions of a samplesolution until only single cells remain (Button et al. 1993;Schut et al. 1993). The second is micromanipulation, whichobtains single cells using a mechanical micromanipulator oran optical tweezer (Fröhlich and König 2000; Huber et al.2000; Ishii et al. 2010). The trapped cells are subsequentlyused for cultivation or other analyses. The third is flowcytometry, which enables the rapid analysis of entire cellpopulations on the basis of single cell characteristics(Brehm-Stecher and Johnson 2004). Multiple characteristicsincluding cell count, cell size or content, and responses tofluorescent probes diagnostic of cell function may be col-lected simultaneously in this method (Brehm-Stecher andJohnson 2004). The fourth is microfluidics, which isolatesand incubates single cells of interest using a number ofmicroflow channels (Fu et al. 1999; Hu et al. 2005). Thefifth is compartmentalization of single cells, which arescreened for potentially novel enzymes and for cultivationof yet-uncultured microbes (Bergquist et al. 2009; Bershteinand Tawfik 2008; Ishii et al. 2010; Link et al. 2007). How-ever, it is extremely difficult to use these five techniques fordirect assay of various living microorganisms in soil and/orsediment samples. Because the microorganisms adherestrongly to soil aggregates, it is difficult to separate themalive from the aggregates (Rajendhran and Gunasekaran2008; Steffan et al. 1988).
In the present study, we demonstrated that a weak nega-tive electric potential attracted living microorganisms to theelectrode surface and that they were separated from sedi-ment and soil particles. Furthermore, the electrically at-tached living microorganisms could be detached from theelectrode by application of a high-frequency triangular wavepotential. Using the electrical modulation technique, attach-ment and detachment of specifically positioned microorgan-isms can be modulated iteratively at the same positions onthe electrode surface.
Materials and Methods
Soil and Deep-Sea Sediment Samples The surface layer ofthe deep-sea sediment sample was collected by the un-manned submersible Hyperdolphin (dive 1237; January 20,2011; 1,176 m; 35°00.13′ N, 139°13.51′ E) from the seeparea of Sagami Bay, Japan (Koyama and Aizawa 2000;Koyama et al. 2005). The garden soil sample was collectedfrom the grapery of the Japan Agency for Marine-EarthScience and Technology.
Bacterial Strains and Media Bacillus halodurans, Shewa-nella violacea, Escherichia coli, Bacillus subtilis, Shewa-nella oneidensis, and Kocuria rosea were used as testmicroorganisms. B. halodurans C-125, formerly known asBacillus sp. strain C-125 (Takami and Horikoshi 1999), wasthawed and recovered using Horikoshi I medium (Horikoshiand Akiba 1982) and then grown aerobically at 37 °C inHorikoshi I medium. S. violacea DSS12T, isolated from theRyukyu trench, was thawed and regenerated using an auto-claved and 0.22-μm filtered Marine broth 2216 medium(Difco Laboratories, Detroit, MI, USA) (Kato et al. 1995).The S. violacea cells were grown aerobically at 8 °C in thefiltered Marine broth 2216 medium. E. coli (JCM1649T) andB. subtilis (JCM1465T) were grown aerobically at 37 °C inLuria–Bertani (LB) medium (Difco Laboratories). S. oneiden-sis (ATCC770550T) was grown aerobically at 30 °C in LBwithout NaCl (LB△N) medium containing tryptone 10.0 gl−1
and yeast extract 5.0 gl−1.K. rosea (NBRC 3768T) was grownaerobically at 30 °C in LBNG medium containing (gl−1):glucose, 30.0; tryptone, 10.0; yeast extract, 5.0; and NaCl,30.0. The glucose was sterilized separately and then added tothe medium.
Electrode Preparation Patterned working electrodes wereconstructed by vacuum evaporation of indium tin oxide(ITO; In2O3; 10 Ω/cm2) and an insulator of silicon dioxide(SiO2) onto 76×26-mm2 silica glass plates (1 mm in thick-ness) (Geomatec Co., Ltd., Yokohama, Japan). The reticulatedITO electrode with arrayed square glass regions (Fig. 1) wasdescribed elsewhere (Koyama 2011). The microelectrode wasformed by the plane ITO electrode fabricated with a coating ofSiO2 (Fig. 1). The 76×26-mm2- and 5-mm-thick silicon rub-ber plate with a hollow interior measuring 66×16 mm2 wasglued to the 76×26-mm2 slide glass by silicon bonding(Fig. 1). The patterned ITO/glass electrode was attached tothe top of the silicon rubber box (Fig. 1). The fabricated siliconrubber box was housed in a sterile square plastic dish. A 12-mm-diameter section of both the Pt ring counter electrode andAg/AgCl reference electrode was placed on the plastic lid ofthe square plastic dish (Fig. 1).
For viability analyses of the electrically detached micro-organisms, we used a previously described three-electrode
462 Mar Biotechnol (2013) 15:461–475

chamber system (Koyama 2011). The plastic chamber sec-tion of a Lab-tek chamber slide system (Cat. 177410,NalgeNunc International, Naperville, IL, USA) was gluedto the patterned ITO/glass electrode with silicon bonding.The Pt counter electrode and Ag/AgCl reference electrodewere placed on the plastic lid of the chamber slide system.
Large electrode chamber devices were constructed forphylogenetic analyses of the microorganisms in sediment.A 110×85-mm2- and 5-mm-thick silicon rubber plate with ahollow interior measuring 90×65 mm2 was glued to a 125×85-mm2 plane ITO/glass electrode with silicon bonding.The large plane ITO/glass electrode was placed on thebottom of the large electrode chamber device and housedin a sterile square plastic dish. Thirty-millimeter-diametersections of the Pt ring counter electrode and Ag/AgCl ref-erence electrode were placed on the plastic lid of the squareplastic dish.
Both the patterned and the large ITO/glass electrodeswere sonicated in ultrapure water for 5 min and immersedin 1 M NaOH for 5 min to remove any unwanted deposits.After the procedure, the electrodes were washed with ultra-pure water and dried. Then, the three electrode chamberswere irradiated with UV light for 5 min for sterilization.
Potential Application Constant and triangular potentialswere applied to the working ITO/glass electrode using theAg/AgCl reference and the Pt counter electrode (Fig. 1). Theconstant potential application was done using a potentiostat(PS-14, Toho Technical Research, Tokyo, Japan). For 9-MHz triangular wave potential application (Koyama 2011),a coaxial cable was rolled up three times and made to a 10-cm-diameter coil. The coaxial cable coil connected between afunction generator (AD-8624A, A&D Company, Tokyo,Japan) and the potentiostat (Toho Technical Research). Theoutput potentials were checked by a digital oscilloscope (MT-770, Xiamen Lilliput technology Co., Ltd., Fujian, China).The function generator generated 0~±1.0 V 3-MHz rectangu-lar wave signals linearly changed to 0~±10-mV vs. Ag/AgCl9-MHz triangular wave potentials by impedance of both thecoiled coaxial cable and the potentiostat. The function gener-ator generated ±4.0 V 3-MHz rectangular wave signal whichwas necessary to obtain ±20-mV vs. Ag/AgCl 9-MHz trian-gular wave potential. The 9-MHz triangular wave potentialwas used for microbial detachment experiments.
For attachment of the microorganisms to the patternedITO/glass electrode regions (Fig. 1), a constant potentialwas applied to the electrode for 24 h. The cultured
Fig. 1 Schematic illustration of a patterned indium tin oxide (ITO)/glass electrode culture system. The electrode potential is controlled with an Ag/AgClreference electrode through a potentiostat and a function generator
Mar Biotechnol (2013) 15:461–475 463

microorganisms and soil or sediment samples were sus-pended in either Dulbecco’s PBS(−) (Wako, Osaka, Japan), MOPS buffer (10 g/L; pH7.0, Dojindo, Kumamoto, Japan), tricine buffer (10 g/L; pH7.0, Dojindo), 280 mM glucosesolution (10 g/L), LB medium, or artificial seawater (30 g ofNaCl, 0.7 g of KCl, 5.3 g of MgSO4·7H2O, 10.8 g ofMgCl2·6H2O, 1 g of CaCl2·2H2O per liter). Each of thetest microorganisms was allowed to grow overnight, thencentrifuged for 2 min at 2,150×g and 4 °C, and replaced inthe selected solution at each cultivation temperature. In theelectrical attachment experiments with dead E. coli, thepellet was resuspended in 70 % EtOH with vortexing andincubated for 1 h at 60 °C. After 70 % EtOH fixation, the E.coli cells were centrifuged for 2 min at 2,150×g and 4 °Cand then replaced in PBS(−). The microorganism suspen-sions were diluted to a concentration of 1×10⁶ cells/5 mland poured into the three-electrode chamber system (Fig. 1).In the experiments with sediment and soil samples, 0.1 g/mlof the garden soil in the selected solution at room tempera-ture (RT) or 0.1 g/ml of the deep-sea sediment in artificialseawater at 4 °C was suspended with 5-min vortexing. Thesuspended soil or sediment samples were diluted to a con-centration of 50 μg/5 ml in the selected solution and thenpoured into the chamber system. To detach the microorgan-isms from the electrode surface, ±10-mV vs. Ag/AgCl 9-MHz triangular wave potential was applied to the electrodein either PBS(−) at RT or artificial seawater at 4 °C for60 min. Under anaerobic experimental conditions, the elec-trical attachment of microorganisms was performed using ananaerobic cultivation system (Anaero pack A-07 with an-aerobic jar, Mitsubishi Gas Chemical Company, Inc.,Tokyo, Japan). A hole was drilled through the lid of theanaerobic jar to allow three conductive wires to penetrate,and the hole was then blocked with epoxy resin bonding.The three-electrode chamber system connected to the con-ductive wires through the lid was housed in the anaerobiccultivation system.
For phylogenetic analyses of microorganisms in soil orsediment samples, microorganisms were collected from thesample using the large electrode chamber device. The micro-organisms collected were purified twice using an electricalretrieval method. One gram per milliliter of the soil or thesediment in either PBS(−) at RT or artificial seawater at 4 °Cwas treated with 5-min vortexing. To attach themicroorganismsin the soil or sediment sample to the large ITO/glass electrode,12.5 ml of the suspended sample in either PBS(−) at RT orartificial seawater at 4 °C was poured into the large chamber. Inthe deep-sea sediment sample, a −0.3 V vs. Ag/AgCl constantpotential was applied to the large electrode for 2 h at 4 °C inartificial seawater. In the garden soil sample, −0.4 V vs.Ag/AgCl constant potential was applied to the large electrodefor 2 h at RT in PBS(−). After 2 h of application, the electrodewas washed three times with either artificial seawater at 4 °C or
PBS(−) at RT, and the microorganisms attached to the electrodewere detached by applying ±10-mV vs. Ag/AgCl 9-MHz tri-angular wave potential for 30 min in 12.5 ml of either freshartificial seawater at 4 °C or fresh PBS(−) at RT. After thetriangular wave potential application, the detached microorgan-isms were collected with a cell scraper and transferred to a newlarge electrode chamber device, and −0.3 V or −0.4 V vs.Ag/AgCl constant potential was applied for a further 2 h at4 °C in seawater or at RT in PBS(−). After application, theelectrode was washed three times, and the microorganisms onthe electrode were detached by application of ±10-mV vs.Ag/AgCl 9-MHz triangular wave potential for a further30 min in 12.5 ml of either fresh artificial seawater at 4 °C orfresh PBS(−) at RT. After these procedures, the electricallycollected microorganisms were used in phylogenic analyses.
We observed a weak electrical current of −0.19 to−0.27 μA/cm2 when a negative constant potential between−0.3- and −0.4 V vs. Ag/AgCl was applied to the samplesexcept when using 0.1 g/ml of sediment or soil suspension.We measured −0.79 to −0.88 μA/cm2 of the weak currentusing 0.1 g/ml of the sediment or soil suspension.
Optical Microscopic Observation of Dehydrogenase-ActiveMicroorganisms To analyze the respiratory activity of themicroorganisms attached to the electrode, we used a BacstainCTC rapid staining kit for microscopy (Dojindo, Kumamoto,Japan). The respiratory activity staining solution was com-prised of 20 μl of 50 mM CTC solution and 5 μl of enhancingreagent B added to 1 ml of either PBS(−) or artificial seawater.After vortexing the staining solution, the microorganisms onthe electrode were incubated with the staining solution atcultivation temperature for 30 min and observed using theconfocal laser scanning microscope system (FV500, Olympus,Tokyo, Japan).
Analyses of Detachment, Survival, and Viable BacteriaCollection Rates For measurement of detachment rates, cellnumbers were counted at randomly selected 50×50-μm2
regions on the ITO electrode before and after triangular wavepotential application. The detachment rate was calculated fromthe cell number after the triangular wave potential applicationdivided by the cell number before the electrical application.
For measurement of survival rates, more than 300 of totalmicroorganisms on the electrodes were distinguished usinga live/dead backlight bacterial viability kit for microscopyand quantitative assays (L7012, Molecular Probes, Eugene,OR, USA) using the confocal laser scanning microscopesystem (FV500, Olympus) according to the manufacturer’srecommendations. The survival rates were calculated fromthe sum of three independent experiments.
In cell counts of microorganisms in soil, the suspendedsoil samples diluted to a concentration of 50 μg/5 ml in theselected solution were treated with the live/dead backlight
464 Mar Biotechnol (2013) 15:461–475

bacterial viability kit for microscopy and quantitativeassays. Then, the microorganisms in soil were counted witha hemacytometer under confocal laser scanning microscopicobservation before and after high-frequency triangular wavepotential application.
In the viable bacteria collection rate analyses of B. subtilisand E. coli, we collected the supernatants after the −0.4 V vs.Ag/AgCl potential and after the triangular wave potentialapplications. Colonies were formed on LB agar plates at37 °C. The viable bacteria collection rate was calculated fromthe colony number after the triangular wave potential appli-cation divided by the total colony number. Data were obtainedfrom the sum of two or three independent experiments.
Atomic Force Microscopic Observation E. coli attached tothe microelectrode (Fig. 1) was fixed with 2.5 % glutaralde-hyde (Sigma, St. Louis, MO, USA) in PBS(−) for 1 h at RT,rinsed with milliQ water (Millipore, Billerica, MA, USA),dried in a desiccator, and observed with an atomic forcemicroscope (MFP-3D-Bio, Asylum Research, Santa Barbara,CA, USA) using the acoustic ACmodewith a microcantilever(OMCL-AC240TS-C2, Olympus). All images were obtainedwith 256 scan points, 256 scan lines, and a scan rate of0.36 Hz under atmospheric pressure at RT. Images wereanalyzed using MFP3D software (Asylum Research) andargyle light software (Asylum Research).
Scanning Electron Microscopic Observation Microorgan-isms attached to the patterned ITO/glass electrode were pre-fixed with 2.5 % glutaraldehyde in PBS(−) for 1 h at eachcultivation temperature. For observations of S. violacea, con-ductive staining procedures were performed with artificialseawater instead of PBS(−). After washing with PBS(−) threetimes for 10 min each, the microorganisms were postfixedwith 2 % osmium tetraoxide in PBS(−) for 2 h at 4 °C. Afterwashing with distilled water at 4 °C six times for 10 min each,conductive staining was performed by incubating with 0.2 %aqueous tannic acid (pH6.8) at 4 °C for 30 min. The micro-organisms were washed with distilled water at 4 °C six timesfor 10 min each and then treated with 1 % aqueous tannic acidat 4 °C for 30 min. After washing with distilled water at 4 °Csix times for 10 min each, the microorganisms were dehy-drated in a graded ethanol series and critical point-dried(JCPD-5 critical point drier, Japan Electron Optics Laborato-ries Ltd., Tokyo, Japan). The microorganisms on the electrodewere coated with osmium using an osmium plasma coater(POC-3, Meiwa Shoji Co., Osaka, Japan) and observed with afield emission scanning electron microscope (JSM-6700 F,Japan Electron Optics Laboratories Ltd.) at an accelerationvoltage of 5 kV.
DNA Extraction, Small Subunit rRNA Gene PCR Amplification,and Phylogenetic Analyses Environmental genomic DNA
from the deep-sea sediments was extracted using Isoil Largefor Beads ver. 2 (Nippon Gene Corp., Toyama, Japan) withslight modifications (100 μg/ml lysozyme was added to thelysis solution and incubated for 60 min). DNA marker used anall purpose Hi–Lo DNAmarker (Bionexus, Inc., Oakland, CA,USA). Genomic DNA of the electrically isolated microorgan-isms in the deep-sea sediment was extracted using the CTABmethod. The nearly whole-length bacterial small subunit SSUrRNA gene fragments were amplified from the environmentalgenomic DNA with general primers 27 F (5′-AGAGTTT-GATCMTGGCTCAG-3′) and 1492R (5′-GGCTACCTTGT-TACGACTT-3′) (Lane et al. 1985). Each 25-μl aliquot of thereaction mixture contained 2.5 μl of 10 × PCR buffer (TakaraBio Inc., Otsu, Japan), 4 μl of dNTPmix (2.5 nM each), 1 μl of27 F primer (10 μM), 1 μl of 1492R primer (10 μM), 2.5 μl ofMgCl2 solution (25mM), 0.25μl of LATaq polymerase, 1μl oftemplate DNA, and RNase/DNase-free water to a final volumeof 25 μl. The following PCR program was used: 96 °C for5 min, followed by 25 cycles of 96 °C for 20 s; 55 °C for 15 s;and 72 °C for 90 s, followed by 72 °C for 7 min. The productswere checked by electrophoresis, purified using QIAquickGelExtraction Kit (Qiagen, Valencia, CA, USA), and subsequentlycloned into a pT7Blue-2 (Merck Chemicals, Darmstadt,Germany) vector using Competent High DH5α (Toyobo,Osaka, Japan) as the host. Approximately 130 clones of eachlibrary containing the fragments of expected length wereselected randomly and sequenced using a BigDye Terminatorv3.1 Cycle Sequencing Kit (Life Technologies Corp., Carlsbad,CA, USA) in a 3730xl DNA analyzer following the manufac-turer’s recommendations. Sequences representing differentphylotypes were deposited in the GenBank database withaccession numbers AB687722–AB687989.
Sequences were checked with both Mallard software(Ashelford et al. 2006) and the CHECK_CHIMERA toolsfrom the Ribosomal Database Project II (http://rdp8.cme.msu.edu/cgis/chimera.cgi?su=SSU), and chimeric sequenceswere excluded from further analyses. The closest relatives ofthe remaining sequences were obtained from the SILVA data-base (http://www.arb-silva.de/) using the BLAST program.
Statistical Analysis Statistical analysis was performed usingStudent’s t-test. The calculations were performed usingMicrosoft Excel.
Results
Electrical Attachment of Escherichia coli to a Patterned ITOElectrode
To examine whether the microorganisms were attracted byand attached to a reticulated ITO/glass electrode region withan applied potential (Fig. 1), the gram-negative bacterium E.
Mar Biotechnol (2013) 15:461–475 465
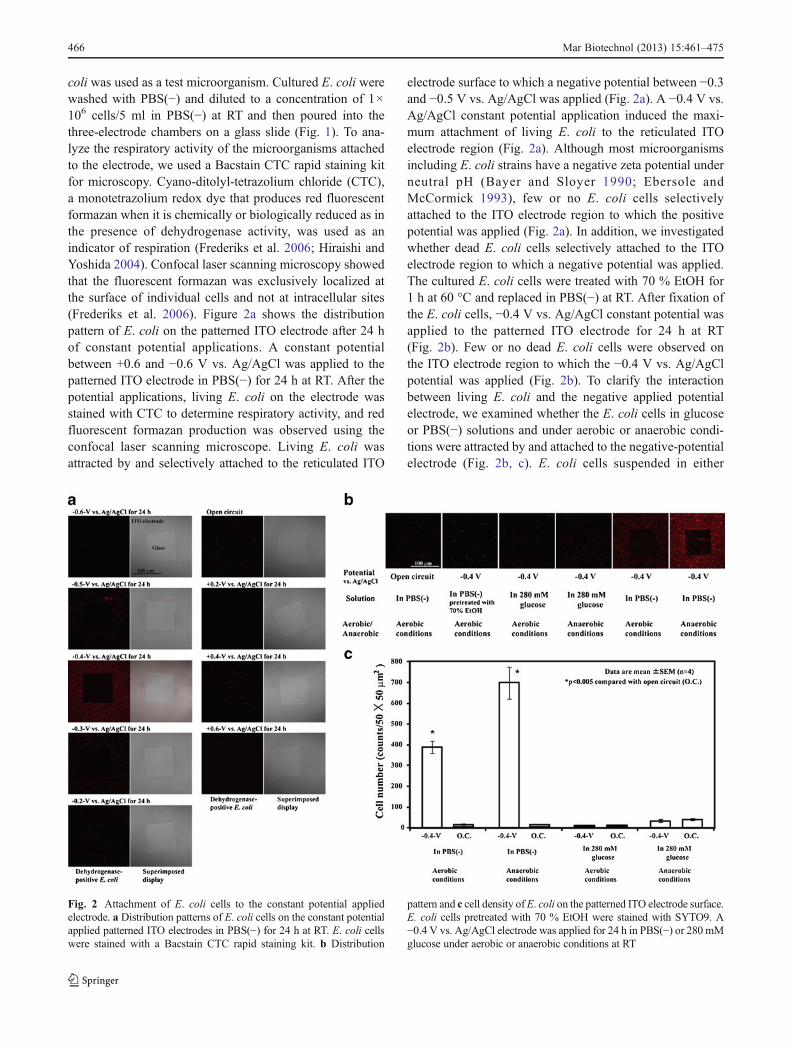
coli was used as a test microorganism. Cultured E. coli werewashed with PBS(−) and diluted to a concentration of 1×10⁶ cells/5 ml in PBS(−) at RT and then poured into thethree-electrode chambers on a glass slide (Fig. 1). To ana-lyze the respiratory activity of the microorganisms attachedto the electrode, we used a Bacstain CTC rapid staining kitfor microscopy. Cyano-ditolyl-tetrazolium chloride (CTC),a monotetrazolium redox dye that produces red fluorescentformazan when it is chemically or biologically reduced as inthe presence of dehydrogenase activity, was used as anindicator of respiration (Frederiks et al. 2006; Hiraishi andYoshida 2004). Confocal laser scanning microscopy showedthat the fluorescent formazan was exclusively localized atthe surface of individual cells and not at intracellular sites(Frederiks et al. 2006). Figure 2a shows the distributionpattern of E. coli on the patterned ITO electrode after 24 hof constant potential applications. A constant potentialbetween +0.6 and −0.6 V vs. Ag/AgCl was applied to thepatterned ITO electrode in PBS(−) for 24 h at RT. After thepotential applications, living E. coli on the electrode wasstained with CTC to determine respiratory activity, and redfluorescent formazan production was observed using theconfocal laser scanning microscope. Living E. coli wasattracted by and selectively attached to the reticulated ITO
electrode surface to which a negative potential between −0.3and −0.5 V vs. Ag/AgCl was applied (Fig. 2a). A −0.4 V vs.Ag/AgCl constant potential application induced the maxi-mum attachment of living E. coli to the reticulated ITOelectrode region (Fig. 2a). Although most microorganismsincluding E. coli strains have a negative zeta potential underneutral pH (Bayer and Sloyer 1990; Ebersole andMcCormick 1993), few or no E. coli cells selectivelyattached to the ITO electrode region to which the positivepotential was applied (Fig. 2a). In addition, we investigatedwhether dead E. coli cells selectively attached to the ITOelectrode region to which a negative potential was applied.The cultured E. coli cells were treated with 70 % EtOH for1 h at 60 °C and replaced in PBS(−) at RT. After fixation ofthe E. coli cells, −0.4 V vs. Ag/AgCl constant potential wasapplied to the patterned ITO electrode for 24 h at RT(Fig. 2b). Few or no dead E. coli cells were observed onthe ITO electrode region to which the −0.4 V vs. Ag/AgClpotential was applied (Fig. 2b). To clarify the interactionbetween living E. coli and the negative applied potentialelectrode, we examined whether the E. coli cells in glucoseor PBS(−) solutions and under aerobic or anaerobic condi-tions were attracted by and attached to the negative-potentialelectrode (Fig. 2b, c). E. coli cells suspended in either
Fig. 2 Attachment of E. coli cells to the constant potential appliedelectrode. a Distribution patterns of E. coli cells on the constant potentialapplied patterned ITO electrodes in PBS(−) for 24 h at RT. E. coli cellswere stained with a Bacstain CTC rapid staining kit. b Distribution
pattern and c cell density ofE. coli on the patterned ITO electrode surface.E. coli cells pretreated with 70 % EtOH were stained with SYTO9. A−0.4 V vs. Ag/AgCl electrode was applied for 24 h in PBS(−) or 280 mMglucose under aerobic or anaerobic conditions at RT
466 Mar Biotechnol (2013) 15:461–475
280 mM glucose solution or PBS(−) were poured into thethree-electrode chamber system. A −0.4 V vs. Ag/AgClpotential was applied to the E. coli cells under either aerobicor anaerobic conditions for 24 h at RT. Figure 2b, c showsthe density of the E. coli cells attached to the electrodesurface. In PBS(−) conditions, −0.4 V vs. Ag/AgCl potentialapplication enhanced the E. coli cell density on the
reticulated ITO electrode region compared with the opencircuit (Fig. 2b, c). The attached E. coli cell density wasincreased by 46- and 68-fold compared with the open circuitunder aerobic and anaerobic conditions, respectively(Fig. 2b, c). In contrast to the enhanced E. coli cell densityin PBS(−), no statistically significant differences betweenthe −0.4 V vs. Ag/AgCl potential application and the open
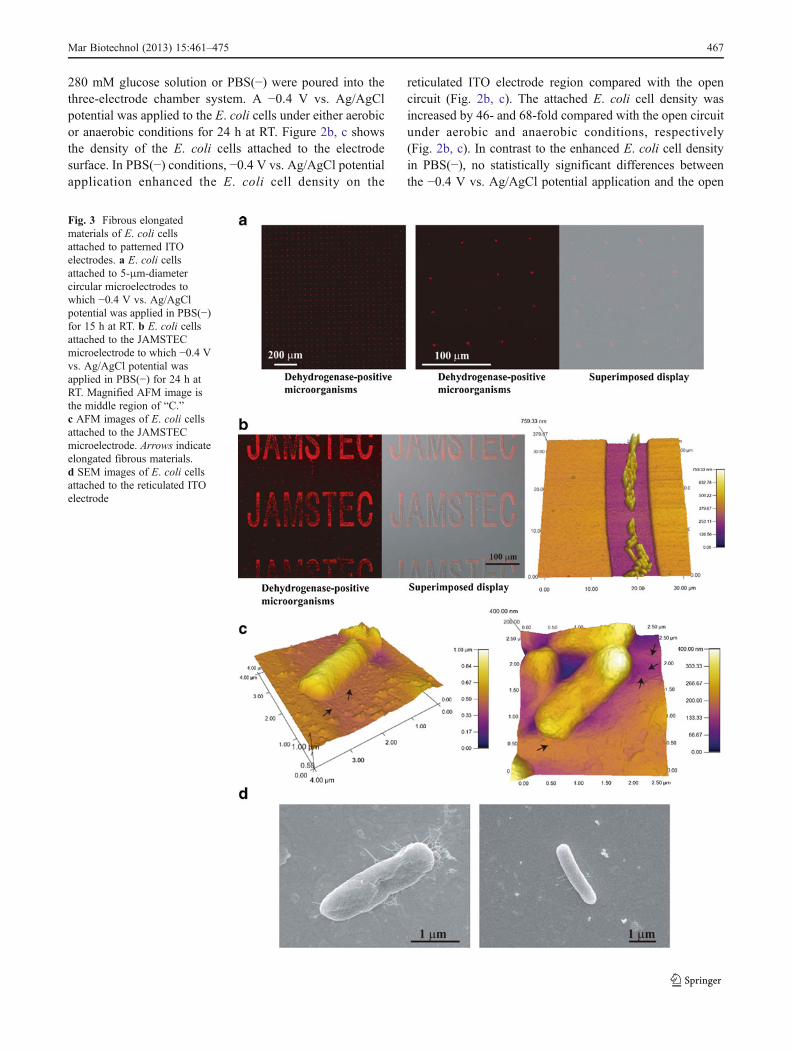
Fig. 3 Fibrous elongatedmaterials of E. coli cellsattached to patterned ITOelectrodes. a E. coli cellsattached to 5-μm-diametercircular microelectrodes towhich −0.4 V vs. Ag/AgClpotential was applied in PBS(−)for 15 h at RT. b E. coli cellsattached to the JAMSTECmicroelectrode to which −0.4 Vvs. Ag/AgCl potential wasapplied in PBS(−) for 24 h atRT. Magnified AFM image isthe middle region of “C.”c AFM images of E. coli cellsattached to the JAMSTECmicroelectrode. Arrows indicateelongated fibrous materials.d SEM images of E. coli cellsattached to the reticulated ITOelectrode
Mar Biotechnol (2013) 15:461–475 467
circuit were observed in 280 mM glucose under aerobic oranaerobic conditions (Fig. 2b, c). Figure 2 indicates that theprinciple of electrophoresis does not explain the phenomenaof the negative potential-induced selective attachment ofliving E. coli to the reticulated ITO electrode region.
To perform accurate cell arrangement on the electrodesurface, we examined whether E. coli cells recognized smallregions of the negative applied potential microelectrode(Figs. 1 and 3a, b). Figure 3a, b shows living E. coli cellsattached to small regions of the patterned ITO electrode towhich −0.4 V vs. Ag/AgCl potential was applied at RT inPBS(−). We confirmed that a small number of E. coli cellsselectively attached to the negative-potential 5-μm-diametercircular microelectrode array even if the electrode surfacearea was small compared with the reticulated electrode(Figs. 1 and 3a). Few or no E. coli cells were attached tothe SiO2 coating region of the microelectrode array (Figs. 1
and 3a). The results in Fig. 3a clearly show that electricalmodulation of the spatial configuration of E. coli cells wassuccessful using the patterned ITO electrode culture system.To investigate how E. coli cells attached to the negativeapplied potential ITO electrode region, we observed thecells on the patterned electrode using a confocal laser scan-ning microscope, an atomic force microscope (AFM), and ascanning electron microscope (SEM) (Figs. 1 and 3).Figure 3b, c shows optical microscopic and AFM imagesof the E. coli cells attached to the electrode regions. The E.coli cells that attached to the electrode surface (Fig. 3c) hadan elongated, short fibrous shape. We further examined theE. coli cells attached to the electrode surface using SEM(Fig. 3d). Figure 3d shows SEM images of E. coli cells on thenegative applied potential electrode surface. E. coli cellsappeared to adhere to the negative potential electrode surfacewith some elongated, short fibrous materials (Fig. 3c, d).
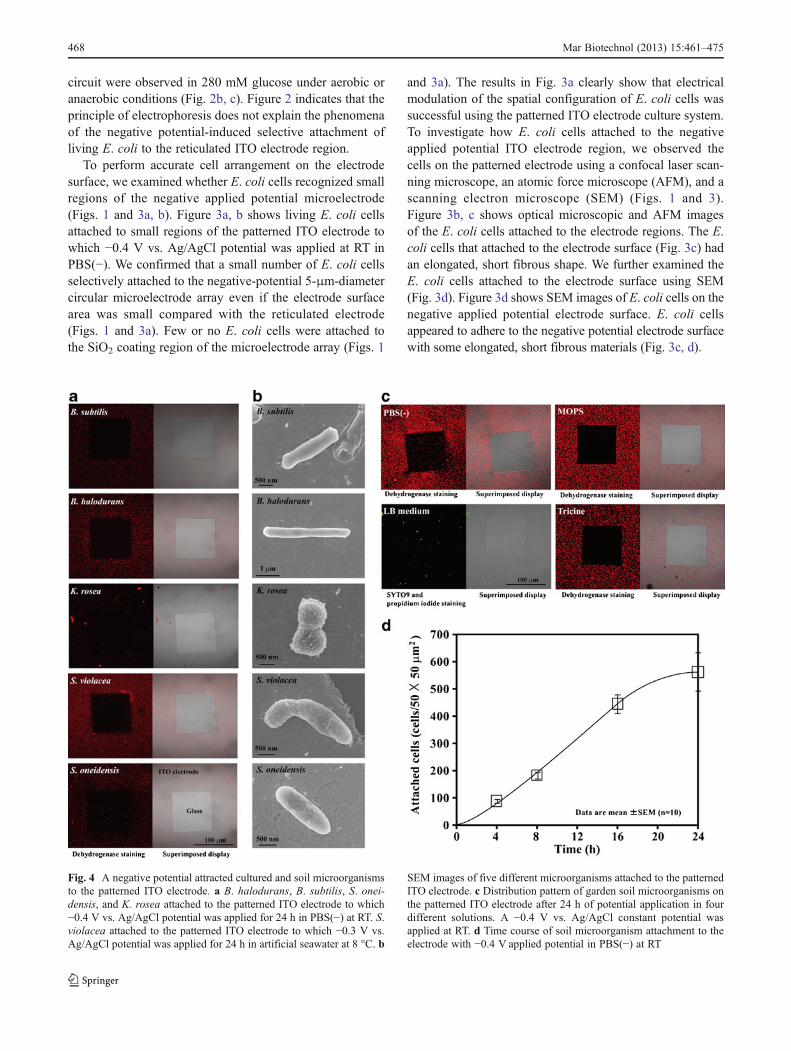
Fig. 4 A negative potential attracted cultured and soil microorganismsto the patterned ITO electrode. a B. halodurans, B. subtilis, S. onei-densis, and K. rosea attached to the patterned ITO electrode to which−0.4 V vs. Ag/AgCl potential was applied for 24 h in PBS(−) at RT. S.violacea attached to the patterned ITO electrode to which −0.3 V vs.Ag/AgCl potential was applied for 24 h in artificial seawater at 8 °C. b
SEM images of five different microorganisms attached to the patternedITO electrode. c Distribution pattern of garden soil microorganisms onthe patterned ITO electrode after 24 h of potential application in fourdifferent solutions. A −0.4 V vs. Ag/AgCl constant potential wasapplied at RT. d Time course of soil microorganism attachment to theelectrode with −0.4 V applied potential in PBS(−) at RT
468 Mar Biotechnol (2013) 15:461–475
Electrical Attachment of B. subtilis, B. halodurans, K.rosea, S. violacea, S. oneidensis, and Soil Microorganismsto the Patterned ITO Electrode
We investigated whether a negative applied potential in-duced not only E. coli but also other microorganisms toattach to the reticulated ITO electrode. As test cells, we usedone typical gram-positive bacterium, B. subtilis; two envi-ronmental bacteria, B. halodurans and S. oneidensis; oneactinomycete, K. rosea; and one deep-sea bacterium, S.violacea. Figure 4a shows the distribution pattern of B.subtilis, B. halodurans, K. rosea, S. violacea, and S. onei-densis on the patterned ITO electrode after 24 h of constantpotential application. They were attracted by and selectivelyattached to the reticulated ITO electrode surface to which anegative potential was applied (Fig. 4a). Except for S.
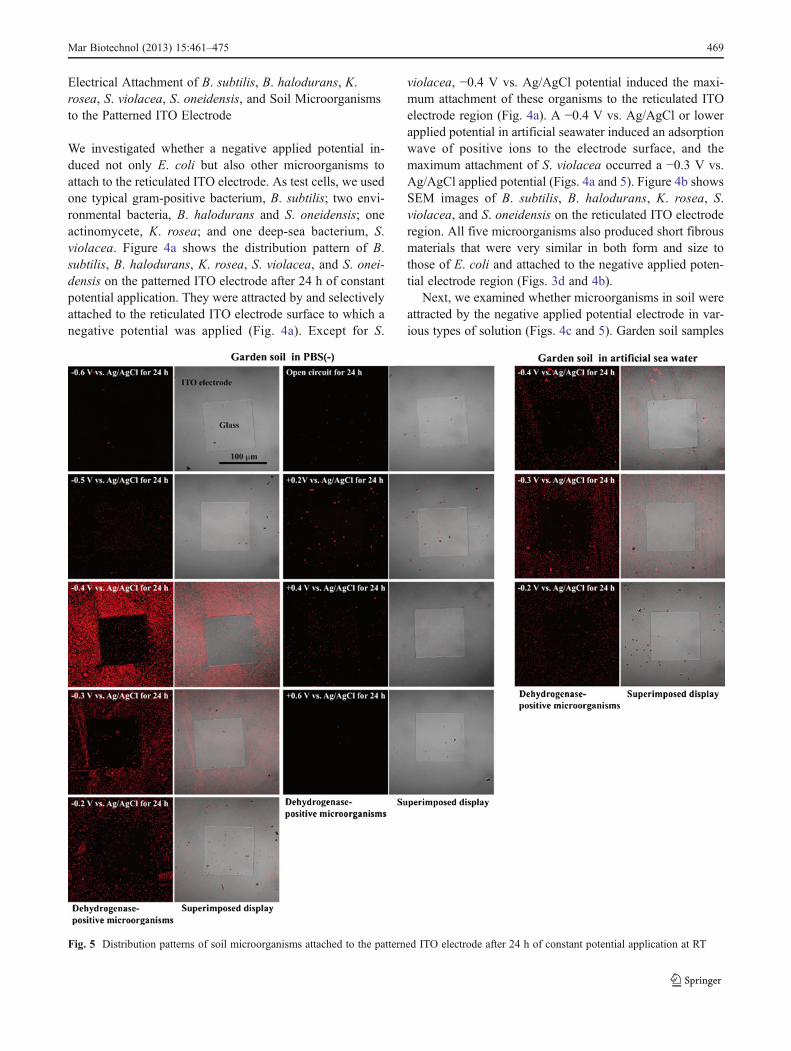
violacea, −0.4 V vs. Ag/AgCl potential induced the maxi-mum attachment of these organisms to the reticulated ITOelectrode region (Fig. 4a). A −0.4 V vs. Ag/AgCl or lowerapplied potential in artificial seawater induced an adsorptionwave of positive ions to the electrode surface, and themaximum attachment of S. violacea occurred a −0.3 V vs.Ag/AgCl applied potential (Figs. 4a and 5). Figure 4b showsSEM images of B. subtilis, B. halodurans, K. rosea, S.violacea, and S. oneidensis on the reticulated ITO electroderegion. All five microorganisms also produced short fibrousmaterials that were very similar in both form and size tothose of E. coli and attached to the negative applied poten-tial electrode region (Figs. 3d and 4b).
Next, we examined whether microorganisms in soil wereattracted by the negative applied potential electrode in var-ious types of solution (Figs. 4c and 5). Garden soil samples
Fig. 5 Distribution patterns of soil microorganisms attached to the patterned ITO electrode after 24 h of constant potential application at RT
Mar Biotechnol (2013) 15:461–475 469

were suspended in either PBS(−), MOPS buffer, tricinebuffer, or LB medium and placed in the three-electrodechamber system. A −0.4 V vs. Ag/AgCl potential was thenapplied to the soil samples in the various solutions for 24 hat RT. Figure 4c shows the distribution pattern of the soilmicroorganisms on the negative applied potential electrodesurface. The soil microorganisms in each of the non-nutritive buffers such as PBS(−), MOPS buffer, and tricinebuffer selectively attached to the reticulated ITO electroderegion to which the −0.4 V vs. Ag/AgCl potential wasapplied (Fig. 4c). The characteristic features of constantpotential application that induced soil microorganism at-tachment were nearly identical to those that induced E. coliattachment (Figs. 2a and 5). The soil microorganisms inPBS(−) were attracted by and selectively attached to thereticulated ITO electrode surface to which a negative poten-tial of between −0.2 and −0.4 V vs. Ag/AgCl was applied(Fig. 5). The maximum attachment of soil microorganismswas observed at −0.4 V vs. Ag/AgCl applied potential(Fig. 5). In artificial seawater, the maximum attachment ofsoil microorganisms was shifted to −0.3 V vs. Ag/AgClbecause the adsorption wave of positive ions occurred at−0.4 V vs. Ag/AgCl on the electrode surface (Fig. 5).Meanwhile, few soil microorganisms in LB medium at-tached to the ITO electrode region to which −0.4 V vs.Ag/AgCl potential was applied (Fig. 4c). When the micro-organisms in LB medium were examined in the cell viabilitytest, it was confirmed that −0.4 V vs. Ag/AgCl appliedpotential was nearly non-cytotoxic, and 92 % (118 of 128cells) of the soil bacteria remained alive on the electrodesurface 24 h after the potential application (Fig. 4c).Figure 4d shows the time course of garden soil microorgan-ism attachment in PBS(−) to the reticulated ITO electroderegion. The −0.4 V vs. Ag/AgCl applied potential inducedmicroorganism attachment that increased in a linear fashionuntil 16 h, after which the cell attachment rate becamesluggish (Fig. 4d). The results in Figs. 2, 4, and 5 indicatethat the microorganisms can attach to the electrode with anegative applied potential when the cells are suspended innon-nutritive media such as PBS(−), MOPS buffer, tricinebuffer, and artificial seawater.
Electrical Detachment of Microorganisms from the ITOElectrode
After negative potential application in non-nutritive solu-tions for 24 h, almost none of the soil microorganismsattached to the electrode surface could be detached byscraping several times with a rubber cell scraper. Therefore,we examined the electrical detachment and retrieval meth-ods. In our previous study, we succeeded in detachinganimal cells from an ITO electrode surface treated withextracellular matrix proteins after application of ±10 mV
vs. Ag/AgCl 9-MHz triangular wave potential in PBS(−) for30–60 min (Koyama 2011). Triangular wave potential-induced animal cell detachment is almost completely non-cytotoxic, and no statistically significant differences inHeLa cell growth were observed after they were subjectedto trypsinization and high-frequency wave potential appli-cation (Koyama 2011). Therefore, we investigated whetherhigh-frequency triangular wave potential application alsoinduced the detachment of microorganisms from the ITOelectrode surface. Figure 6a shows the electrical detachmentof soil microorganisms, E. coli, and B. subtilis from the
Fig. 6 Electrical detachment of microorganisms. a Photographs ofelectrically detached soil microorganisms, E. coli, and B. subtilis. bTime course of soil microorganism detachment from the ITO electrode.A ±10-mV vs. Ag/AgCl 9-MHz triangular wave potential was appliedto the electrode for 60 min in PBS(−) at RT
470 Mar Biotechnol (2013) 15:461–475

patterned ITO electrode. After the negative potential in-duced microorganism attachment and the electrode surfacewas washed with PBS(−), ±10-mV vs. Ag/AgCl 9-MHztriangular wave potential was applied to the microorganismson the ITO electrode in fresh PBS(−) for 60 min at RT.High-frequency triangular wave potential induced detach-ment of soil microorganisms, E. coli, and B. subtilis fromthe ITO electrode after 60 min of application (Fig. 6a).Figure 6b shows the time course of soil microorganismdetachment from the reticulated ITO electrode region. OnlyPBS(−) treatment for 60 min did not detach the microorgan-isms from the electrode surface (Fig. 6b). A ±10-mV vs.Ag/AgCl 9-MHz triangular wave potential detached 66 % ofthe soil microorganisms after 30 min of application, andalmost all of the microorganisms were detached after60 min of application (Fig. 6b). Under the experimentalconditions shown in Fig. 6, we collected 3.0×10⁹ cells/g(1.5×105 cells/50 μg) of living microorganisms from thetotal 4.2×10⁹ cells/g in the garden soil sample. Table 1shows the viability of the microorganisms after high-frequency triangular wave potential application. The appli-cation of ±10, ±6, and ±4 mV vs. Ag/AgCl 9-MHz triangu-lar wave potential detached more than 98 % of themicroorganisms on the electrode surface after 60 min inPBS(−) at RT (Table 1). To examine the cytotoxicity ofelectrical detachment using the high-frequency triangularwave potential, we measured the survival rates of the resid-ual microorganisms on the electrode surface after 60 min ofapplication. High and low survival rates were 91 % (517 of566 cells) and 17 % (120 of 726 cells) of soil microorgan-isms after ±10 and ±8 mV 9-MHz triangular wave potentialapplication, respectively (Table 1). After ±8 mV triangularwave potential application for 60 min, a large portion of the
remaining microorganisms on the electrode surface wascomprised of dead cells, and the detachment rate was lowerthan under the other experimental conditions (Table 1). Inthe cultured microorganisms, 83 % (283 of 342 cells) of theE. coli and 47 % (243 of 522 cells) of the B. subtilis cellsremained alive after 60 min of application (Table 1). We alsoexamined the viable bacteria collection rates of E. coli andB. subtilis by colony counting in the supernatants in thethree-electrode chamber system (Table 1). We collected thesupernatants of both after 24 h of application of the −0.4 Vvs. Ag/AgCl potential and after 1 h of application of thehigh-frequency triangular wave potential. The viable bacte-ria collection rate was calculated from the colony numberafter high-frequency triangular wave potential applicationdivided by the total colony number. The viable bacteria col-lection rates indicated similar survival rates (Table 1). Wesuccessfully recovered 88% (238 of 272 colony-forming units(CFU)) of E. coli and 48 % (157 of 328 CFU) of B. subtilisfrom the cell suspensions using the electrical attachment anddetachment techniques (Table 1).
Electrical Collection of Microorganisms from Deep-SeaSediment
To determine which types of microorganism would attach tothe electrode surface with a negative potential applied, weused a deep-sea sediment sample collected at a depth of1,176 m in the seep area of Sagami Bay, Japan (Koyama andAizawa 2000; Koyama et al. 2005). The microbial floracomposition of the microorganisms electrically retrievedfrom the sediment samples was compared with that of theoriginal sample by phylotype analysis of PCR-amplified16S rRNA genes (Figs. 7 and 8). In the garden soil sample,
Table 1 Viability analyses of electrically detached microorganisms
Samplea Triangular wave potential, 1 h at RT Detachment rate (%)b Survival rate (%)c Viable bacteria collection rate (%)d
Garden soil ±10 mV, 9 MHz 99.8 91 N. D.
Garden soil ±8 mV, 9 MHz 65.5 17 N. D.
Garden soil ±6 mV, 9 MHz 99.8 58 N. D.
Garden soil ±4 mV, 9 MHz 98 38 N. D.
E. coli ±10 mV, 9 MHz 99.6 83 88
B. subtilis ±10 mV, 9 MHz 99.7 47 48
N. D. not determineda Each microorganism in PBS(−) selectively attached to the reticulated ITO electrode region to which −0.4 V vs. Ag/AgCl potential was applied for24 h at RT. Then, ±10 mV vs. Ag/AgCl 9-MHz triangular wave potential was applied for 1 h at RTb Cell numbers were counted in randomly selected 50×50-μm2 regions of the reticulated ITO electrode region before and after triangular wavepotential applicationcMore than 300 residual microorganisms on the electrodes were distinguished using a live/dead backlight bacterial viability kit after electricaldetachment. Survival rates were determined by the sum of three independent experimentsd The viable bacteria collection rate was calculated from colony numbers after triangular wave potential application divided by the total colonynumber. Collection rates were determined by the sum of three independent experiments
Mar Biotechnol (2013) 15:461–475 471
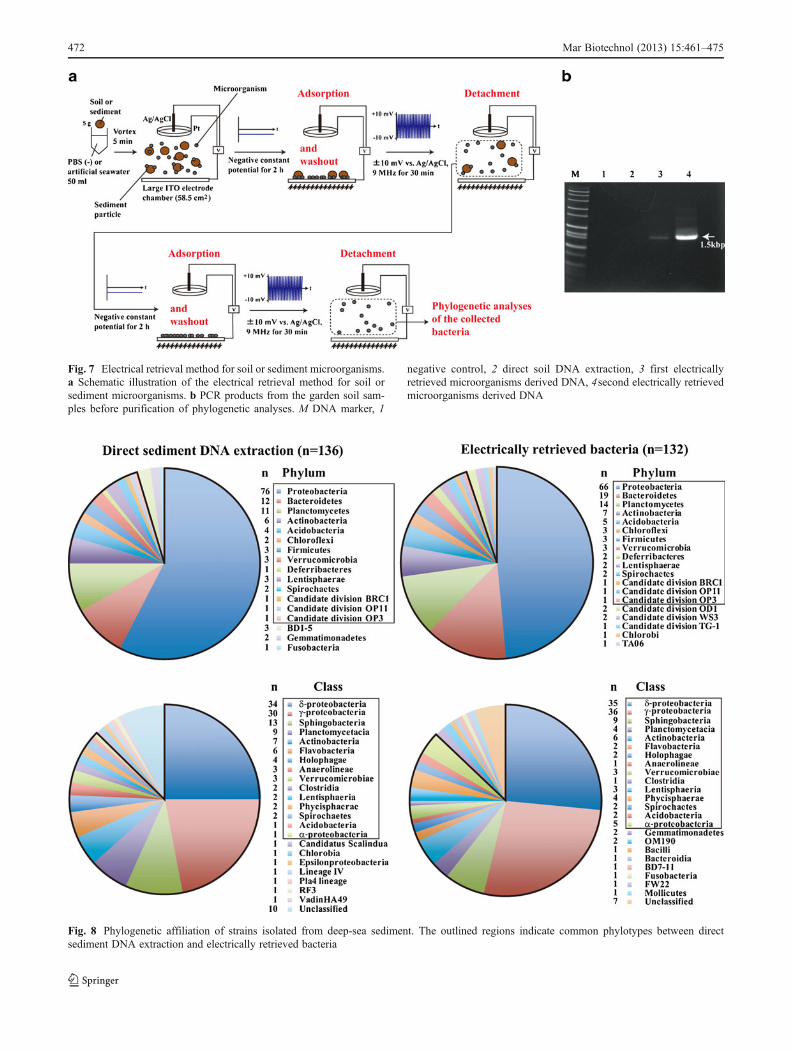
Fig. 7 Electrical retrieval method for soil or sediment microorganisms.a Schematic illustration of the electrical retrieval method for soil orsediment microorganisms. b PCR products from the garden soil sam-ples before purification of phylogenetic analyses. M DNA marker, 1
negative control, 2 direct soil DNA extraction, 3 first electricallyretrieved microorganisms derived DNA, 4second electrically retrievedmicroorganisms derived DNA
Fig. 8 Phylogenetic affiliation of strains isolated from deep-sea sediment. The outlined regions indicate common phylotypes between directsediment DNA extraction and electrically retrieved bacteria
472 Mar Biotechnol (2013) 15:461–475
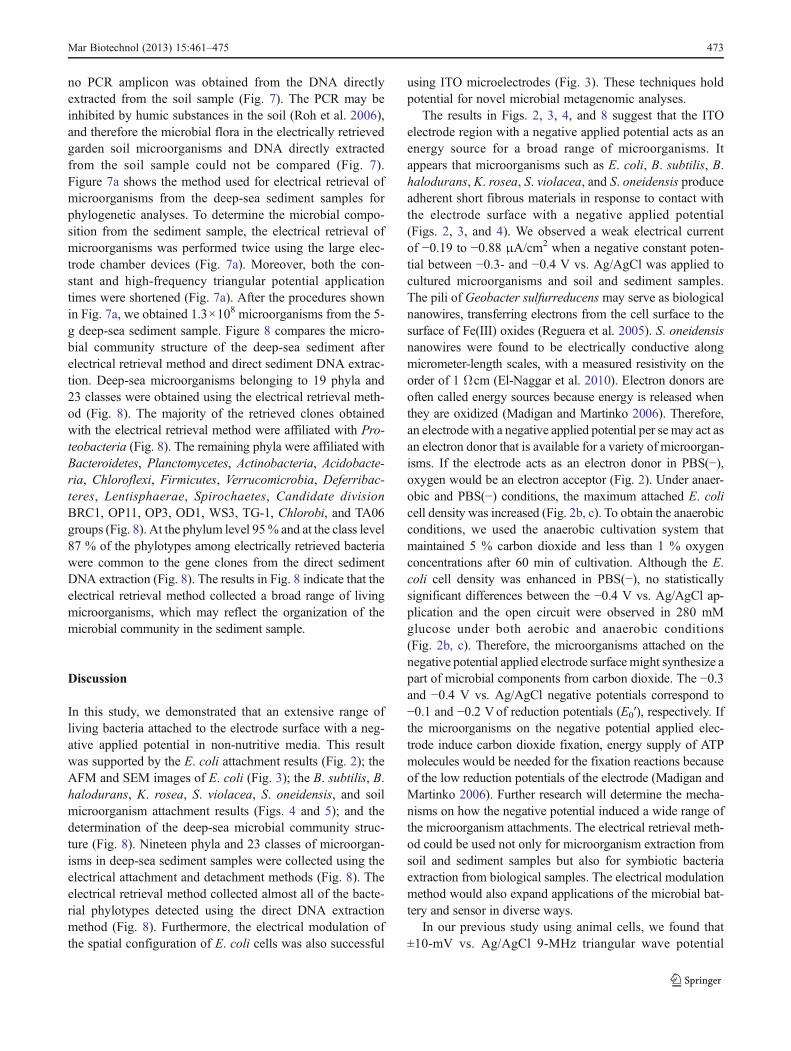
no PCR amplicon was obtained from the DNA directlyextracted from the soil sample (Fig. 7). The PCR may beinhibited by humic substances in the soil (Roh et al. 2006),and therefore the microbial flora in the electrically retrievedgarden soil microorganisms and DNA directly extractedfrom the soil sample could not be compared (Fig. 7).Figure 7a shows the method used for electrical retrieval ofmicroorganisms from the deep-sea sediment samples forphylogenetic analyses. To determine the microbial compo-sition from the sediment sample, the electrical retrieval ofmicroorganisms was performed twice using the large elec-trode chamber devices (Fig. 7a). Moreover, both the con-stant and high-frequency triangular potential applicationtimes were shortened (Fig. 7a). After the procedures shownin Fig. 7a, we obtained 1.3×10⁸ microorganisms from the 5-g deep-sea sediment sample. Figure 8 compares the micro-bial community structure of the deep-sea sediment afterelectrical retrieval method and direct sediment DNA extrac-tion. Deep-sea microorganisms belonging to 19 phyla and23 classes were obtained using the electrical retrieval meth-od (Fig. 8). The majority of the retrieved clones obtainedwith the electrical retrieval method were affiliated with Pro-teobacteria (Fig. 8). The remaining phyla were affiliated withBacteroidetes, Planctomycetes, Actinobacteria, Acidobacte-ria, Chloroflexi, Firmicutes, Verrucomicrobia, Deferribac-teres, Lentisphaerae, Spirochaetes, Candidate divisionBRC1, OP11, OP3, OD1, WS3, TG-1, Chlorobi, and TA06groups (Fig. 8). At the phylum level 95% and at the class level87 % of the phylotypes among electrically retrieved bacteriawere common to the gene clones from the direct sedimentDNA extraction (Fig. 8). The results in Fig. 8 indicate that theelectrical retrieval method collected a broad range of livingmicroorganisms, which may reflect the organization of themicrobial community in the sediment sample.
Discussion
In this study, we demonstrated that an extensive range ofliving bacteria attached to the electrode surface with a neg-ative applied potential in non-nutritive media. This resultwas supported by the E. coli attachment results (Fig. 2); theAFM and SEM images of E. coli (Fig. 3); the B. subtilis, B.halodurans, K. rosea, S. violacea, S. oneidensis, and soilmicroorganism attachment results (Figs. 4 and 5); and thedetermination of the deep-sea microbial community struc-ture (Fig. 8). Nineteen phyla and 23 classes of microorgan-isms in deep-sea sediment samples were collected using theelectrical attachment and detachment methods (Fig. 8). Theelectrical retrieval method collected almost all of the bacte-rial phylotypes detected using the direct DNA extractionmethod (Fig. 8). Furthermore, the electrical modulation ofthe spatial configuration of E. coli cells was also successful
using ITO microelectrodes (Fig. 3). These techniques holdpotential for novel microbial metagenomic analyses.
The results in Figs. 2, 3, 4, and 8 suggest that the ITOelectrode region with a negative applied potential acts as anenergy source for a broad range of microorganisms. Itappears that microorganisms such as E. coli, B. subtilis, B.halodurans, K. rosea, S. violacea, and S. oneidensis produceadherent short fibrous materials in response to contact withthe electrode surface with a negative applied potential(Figs. 2, 3, and 4). We observed a weak electrical currentof −0.19 to −0.88 μA/cm2 when a negative constant poten-tial between −0.3- and −0.4 V vs. Ag/AgCl was applied tocultured microorganisms and soil and sediment samples.The pili of Geobacter sulfurreducens may serve as biologicalnanowires, transferring electrons from the cell surface to thesurface of Fe(III) oxides (Reguera et al. 2005). S. oneidensisnanowires were found to be electrically conductive alongmicrometer-length scales, with a measured resistivity on theorder of 1 Ωcm (El-Naggar et al. 2010). Electron donors areoften called energy sources because energy is released whenthey are oxidized (Madigan and Martinko 2006). Therefore,an electrode with a negative applied potential per se may act asan electron donor that is available for a variety of microorgan-isms. If the electrode acts as an electron donor in PBS(−),oxygen would be an electron acceptor (Fig. 2). Under anaer-obic and PBS(−) conditions, the maximum attached E. colicell density was increased (Fig. 2b, c). To obtain the anaerobicconditions, we used the anaerobic cultivation system thatmaintained 5 % carbon dioxide and less than 1 % oxygenconcentrations after 60 min of cultivation. Although the E.coli cell density was enhanced in PBS(−), no statisticallysignificant differences between the −0.4 V vs. Ag/AgCl ap-plication and the open circuit were observed in 280 mMglucose under both aerobic and anaerobic conditions(Fig. 2b, c). Therefore, the microorganisms attached on thenegative potential applied electrode surface might synthesize apart of microbial components from carbon dioxide. The −0.3and −0.4 V vs. Ag/AgCl negative potentials correspond to−0.1 and −0.2 Vof reduction potentials (E0′), respectively. Ifthe microorganisms on the negative potential applied elec-trode induce carbon dioxide fixation, energy supply of ATPmolecules would be needed for the fixation reactions becauseof the low reduction potentials of the electrode (Madigan andMartinko 2006). Further research will determine the mecha-nisms on how the negative potential induced a wide range ofthe microorganism attachments. The electrical retrieval meth-od could be used not only for microorganism extraction fromsoil and sediment samples but also for symbiotic bacteriaextraction from biological samples. The electrical modulationmethod would also expand applications of the microbial bat-tery and sensor in diverse ways.
In our previous study using animal cells, we found that±10-mV vs. Ag/AgCl 9-MHz triangular wave potential
Mar Biotechnol (2013) 15:461–475 473
induced detachment of both animal cells and extracellularmatrix proteins (Koyama 2011). The mechanism of detach-ment involved both oscillation of the negative zeta potential-charged animal cells and the insertion of water moleculesbetween the electrode surface and extracellular matrix pro-teins resulting from increments in hydrophilicity on theelectrode surface (Koyama 2011). Because the triangularwave potential oscillated and detached the negative zetapotential-charged cells, potential application of optimalwave shape, optimal resonance frequency, and optimal am-plitude in each phylotype of microorganism would shortenthe time to detachment and retrieval of living microorgan-isms from the electrode (Fig. 6; Table 1).
Acknowledgments This study was partly supported by a Grant-in-Aid for Exploratory Research (No. 23658085) from the Ministry ofEducation, Culture, Sports, Science and Technology of Japan.
Open Access This article is distributed under the terms of the Crea-tive Commons Attribution License which permits any use, distribution,and reproduction in any medium, provided the original author(s) andthe source are credited.
References
Ashelford KE, Chuzhanova NA, Fry JC, Jones AJ, Weightman AJ(2006) New screening software shows that most recent large 16SrRNA gene clone libraries contain chimeras. Appl EnvironMicrobiol72:5734–5741
Bayer ME, Sloyer JL Jr (1990) The electrophoretic mobility of gram-negative and gram-positive bacteria: an electrokinetic analysis. JGen Microbiol 136:867–874
Bergquist PL, Hardiman EM, Ferrari BC, Winsley T (2009) Applica-tions of flow cytometry in environmental microbiology and bio-technology. Extremophiles 13:389–401
Bershtein S, Tawfik DS (2008) Advances in laboratory evolution ofenzymes. Curr Opin Chem Biol 12:151–158
Brehm-Stecher BF, Johnson EA (2004) Single-cell microbiology:tools, technologies, and applications. Microbiol Mol Biol Rev68:538–559
Broude NE (2011) Analysis of RNA localization and metabolism insingle live bacterial cells: achievements and challenges. MolMicrobiol 80:1137–1147
Button DK, Schut F, Quang P, Martin R, Robertson BR (1993) Viabilityand isolation of marine bacteria by dilution culture: theory, proce-dures, and initial results. Appl Environ Microbiol 59:881–891
Courtois S, Frostegård A, Göransson P, Depret G, Jeannin P, Simonet P(2001) Quantification of bacterial subgroups in soil: comparison ofDNA extracted directly from soil or from cells previously releasedby density gradient centrifugation. Environ Microbiol 3:431–439
Ebersole RC, McCormick RM (1993) Separation and isolation ofviable bacteria by capillary zone electrophoresis. Biotechnology11:1278–1282
El-Naggar MY, Wanger G, Leung KM, Yuzvinsky TD, Southam G,Yang J, Lau WM, Nealson KH, Gorby YA (2010) Electricaltransport along bacterial nanowires from Shewanella oneidensisMR-1. Proc Natl Acad Sci USA 107:18127–18131
Frederiks WM, van Marle J, van Oven C, Comin-Anduix B, Cascante M(2006) Improved localization of glucose-6-phosphate dehydrogenase
activity in cells with 5-cyano-2,3-ditolyl-tetrazolium chloride as fluo-rescent redox dye reveals its cell cycle-dependent regulation. J His-tochem Cytochem 54:47–52
Fröhlich J, König H (2000) New techniques for isolation of singleprokaryotic cells. FEMS Microbiol Rev 24:567–572
Fu AY, Spence C, Scherer A, Arnold FH, Quake SR (1999) A micro-fabricated fluorescence-activated cell sorter. Nat Biotechnol17:1109–1111
Gabor EM, de Vries EJ, Janssen DB (2003) Efficient recovery ofenvironmental DNA for expression cloning by indirect extractionmethods. FEMS Microbiol Ecol 44:153–163
Hatada Y, Mizuno M, Li Z, Ohta Y (2011) Hyper-production andcharacterization of the ι-carrageenase useful for ι-carrageenanoligosaccharide production from a deep-sea bacterium, Microbul-bifer thermotolerans JAMB-A94T, and insight into the unusualcatalytic mechanism. Mar Biotechnol 13:411–422
Hiraishi A, Yoshida N (2004) An improved redox dye-staining methodusing 5-cyano-2,3-ditoryl tetrazolium chloride for detection ofmetabolically active bacteria in activated sludge. Microbes Environ19:61–70
Horikoshi K, Akiba T (1982) Alkalophilic microorganisms: a newmicrobial world. Springer, New York
Hu X, Bessette PH, Qian J, Meinhart CD, Daugherty PS, Soh HT(2005) Marker-specific sorting of rare cells using dielectrophore-sis. Proc Natl Acad Sci USA 102:15757–15761
Huber R, Huber H, Stetter KO (2000) Towards the ecology of hyper-thermophiles: biotopes, new isolation strategies and novel meta-bolic properties. FEMS Microbiol Rev 24:615–623
Ishii S, Tago K, Senoo K (2010) Single-cell analysis and isolation formicrobiology and biotechnology: methods and applications. ApplMicrobiol Biotechnol 86:1281–1292
Kato C, Sato T, Horikoshi K (1995) Isolation and properties of bar-ophilic and barotolerant bacteria from deep-sea mud samples.Biodiv Conserv 4:1–9
Koyama S, Aizawa M (2000) Tissue culture of the deep-sea bivalveCalyptogena soyoae. Extremophiles 4:385–389
Koyama S, Nagahama T, Ootsu N, Takayama T, Horii M, Konishi S,Miwa T, Ishikawa Y, Aizawa M (2005) Survival of deep-seashrimp (Alvinocaris sp.) during decompression and larval hatch-ing at atmospheric pressure. Mar Biotech 7:272–278
Koyama S (2011) Electrically modulated attachment and detachment ofanimal cells cultured on an optically transparent patterning elec-trode. J Biosci Bioeng 111:574–583, erratum in J Biosci Bioeng114:240–241 (2012)
Lane DJ, Pace B, Olsen GJ, Stahl DA, Sogin ML, Pace NR (1985)Rapid determination of 16S ribosomal RNA sequences for phy-logenetic analyses. Proc Natl Acad Sci USA 82:6955–6959
Link AJ, Jeong KJ, Georgiou G (2007) Beyond toothpicks: new methodsfor isolating mutant bacteria. Nat Rev Microbiol 5:680–688
Madigan MT, Martinko JM (2006) Brock biology of microorganisms,11th edn. Pearson Education, New Jersey
Ohta Y, Hatada Y (2006) A novel enzyme, lambda-carrageenase,isolated from a deep-sea bacterium. J Biochem 140:475–481
Raaijmakers JM, Weller DM, Thomashow LS (1997) Frequency ofantibiotic-producing Pseudomonas spp. in natural environments.Appl Environ Microbiol 63:881–887
Rajendhran J, Gunasekaran P (2008) Strategies for accessing soil meta-genome for desired applications. Biotechnol Adv 26:576–590
Reguera G, McCarthy KD, Mehta T, Nicoll JS, Tuominen MT, LovleyDR (2005) Extracellular electron transfer via microbial nanowires.Nature 435:1098–1101
Roh C, Villatte F, Kim BG, Schmid RD (2006) Comparative study ofmethods for extraction and purification of environmental DNA fromsoil and sludge samples. Appl Biochem Biotechnol 134:97–112
Schut F, de Vries EJ, Gottschal JC, Robertson BR, Harder W, PrinsRA, Button DK (1993) Isolation of typical marine bacteria by
474 Mar Biotechnol (2013) 15:461–475

dilution culture: growth, maintenance, and characteristics of iso-lates under laboratory conditions. Appl Environ Microbiol59:2150–2160
Shen B, Du L, Sanchez C, Edwards DJ, Chen M, Murrell JM (2001)The biosynthetic gene cluster for the anticancer drug bleomycinfrom Streptomyces verticillus ATCC15003 as a model for hybridpeptide–polyketide natural product biosynthesis. J Ind MicrobiolBiotechnol 27:378–385
Skoko N, Vujovic J, Savic M, Papic N, Vasiljevic B, Ljubijankic G(2005) Construction of Saccharomyces cerevisiae strain FAV20
useful in detection of immunosuppressants produced by soil acti-nomycetes. J Microbiol Methods 61:137–140
Simon C, Daniel R (2011) Metagenomic analyses: past and futuretrends. Appl Environ Microbiol 77:1153–1161
Steffan RJ, Goksøyr J, Bej AK, Atlas RM (1988) Recovery ofDNA from soils and sediments. Appl Environ Microbiol54:2908–2915
Takami H, Horikoshi K (1999) Identification of facultatively alkali-philic Bacillus sp. C-125 to Bacillus halodurans. Biosci Biotech-nol Biochem 63:943–945
Mar Biotechnol (2013) 15:461–475 475