attachment c - environmental protection agency, … · · 2013-07-25typical detail of this plant...
TRANSCRIPT

ATTACHMENT C
For
insp
ectio
n pur
pose
s only
.
Conse
nt of
copy
right
owne
r req
uired
for a
ny ot
her u
se.
EPA Export 25-07-2013:18:28:17

= Michael Punch & Partners - C O N S U L T I N G L N C I N E L R S
I I
DevcIoprnent at The Leap, Roscrea, for T & J Standish Job no. 021360
I Planning Stage - Rev B l lh October 2004
1 Introduction
Subsequent to the earlier report dated 1 2Ih December 2003 there have been some changes to the proposed development. This report addresses these issues and updates the earlier report
The main amendments are the increase in paved area to approximately 1.8ha and the provision of an outfall pipe to take roof run-off and run-off from the treated water from the reed bed system.
T & J Standish operate a sawmill at The Leap, Roscrea. The total impermeable area (paved and roof) is of the order of 2.35ha. It is proposed that this area be positively drained with roof run-off discharging directly to an existing drain, via an outfall pipe, and paved area discharging to a reed bedwetland area, before discharging to the outfall pipe. Existing foul drainage is disposed of via a septic tank and percolation area, which is to be abandoned as part of these works with a new treatment facility to be provided.
2 Storm run-off
It is proposed that paved and roof run-off be drained by separate systems and that paved run-off be disposed of via a reed bed settlement and storage lagoon. The design is based on guidelines set down in Ciria report C521 'Sustainable Urban Drainage Systems' (SUDS) - design manual for Scotland and Northern Ireland and attempts to balance the impact of the hard standing area on the environment. It does this by protecting the water sources from potential pollution from accidental spillage and other, more diffuse pollutants typically left behind on trafficked areas.
The pipe runs have been designed using Microdrainage suite of programs and the calculations are attached in Appendix A with associated long sections. The relevant Pipe references are shown on the site drainage drawing.
I
a> Roof Run-off
An impermeable area of 0.455ha for roof run-off has been calculated. It is proposed that this run-off be discharged directly to an existing drain approximately 1 1 Om from the development, in land owned by the developer
For
insp
ectio
n pur
pose
s only
.
Conse
nt of
copy
right
owne
r req
uired
for a
ny ot
her u
se.
EPA Export 25-07-2013:18:28:17

h
For
insp
ectio
n pur
pose
s only
.
Conse
nt of
copy
right
owne
r req
uired
for a
ny ot
her u
se.
EPA Export 25-07-2013:18:28:17

0
3
- No. of staff Flow (lit redd ay/p ers on) BOD (grams/d ay/p ers on)
60 60 30
= Michael Punch & Partners - - C O N S U L T I N G E N G I N E E R S
Based on the EPA wastewater treatment manual for commercial premises the loading to the treatment plant is
Therefore loading:-
* Flow = 3600 litredday Organic = 1800 grams/day
Assuming 1 PE (population equivalent) = 180 litreslday and 60 grams/day then
Load for treatment is 20PE flow and 30PE organic. Therefore take loading to treatment plant as equivalent to 30PE.
An Enviropak LRDSO sewage treatment unit, or similar approved, would be adequate to serve this loading. Typical detail of this plant is attached in Appendix C. This plant would discharge to a polishing filter designed in accordance with the EPA manuals.
For a soil polishing filter with a P value of 16.5 would give a loading rate of 20 1/m2.day7 or for a sand polishing filter a loading rate not greater than 60 Vm2.d. Typical areas required are, therefore:
a b
soil polishing filter = 3600/20 = 180m2 sand polishing filter =3600/60 = 60m2
Foul flow calculations and long sections are included in Appendix D.
4 Effluent Quality Monitoring
It is proposed that the quality of effluent discharged from the reed bed by subject to 24 hour composite sampling. A suitable system, subject to the approval of the local authority, shall be installed as part of these proposals
Approved by:- e3hL . . . . . . . . . . . . . . . . . . . . . . . . . Date:-. . . . . . . . . . . . . . . . . . . . . . Chris Wason
3 1 l* October 2004 02 1360 cw PLANNING REPORT revb.doc
For
insp
ectio
n pur
pose
s only
.
Conse
nt of
copy
right
owne
r req
uired
for a
ny ot
her u
se.
EPA Export 25-07-2013:18:28:17

= Michael Punch & Partners
0 - - C O N S U L T I N G E N G I N E E R S
b) Paved Run-off
Run-off from the paved area (1.892 ha) is collected in pipes and directed to a reed bed storage pond, which will attenuate flows and treat the first foul flush. The size of the pond is based on the treatment volume, Vt. The method adopted here for establishing the treatment volume is based on a 15mm run-off distributed over the impermeable area.
Therefore the treatment volume, Vt = 18920m2 x 0.015 = 284m3. The Ciria C521 SUDS design manual recommends that the permanent pool volume should be three times the design treatment volume Vt. The required pond volume is therefore = 3 x 284 = 852m3. The previous sizing of the pond identified an area of 1030m2 for a depth of 600mm. Assuming the area remains the same then the depth will increase to 830mm.
To further improve the quality of run-off it is proposed that a bypass interceptor is to be located upstream of the pond to retain any oil or other pollutant accidental spillages. For instance, the largest single container of tanalith arriving on site is 1200 litres and this can easily be contained within the interceptor, which can then be pumped out and disposed off site. A KB030 Class 1 by-pass interceptor by Klargester, or similar approved, is recommended.
After treatment in the reed bed the storm run-off will be connected to the outfall pipe discussed above.
3 Foul Effluent
The existing septic tank and percolation area to the north of the site are to be abandoned. It is proposed to provide a new administration block for the 60 employees, 10 of whom will be housed in the administration block. Foul effluent will be collected from toilets in the existing northerly building and the administration block, which will also house a canteen and showers, and be discharged to a proprietary treatment system and sand polishing filter. The treated effluent will then be discharged through the reed bed serving the paved area, which will further improve its quality, before discharge to the outfall pipe discussed above.
The disposal of the effluent will be subject to the site IPC license.
For
insp
ectio
n pur
pose
s only
.
Conse
nt of
copy
right
owne
r req
uired
for a
ny ot
her u
se.
EPA Export 25-07-2013:18:28:18

A
STORM SEWER DESIGN by the Modified Rational Method
Global Variables
Pipe Size File d:\apps\WinDes\STANDARD.PIP Manhole Size File d:\apps\WinDes\STANDARD.MHS
Location - Scotland & Ireland
Return Period (years) 2 M5-60 (IIUII) 1 8 , 0 0 0 Ratio R 0 . 3 0 0 Maximum Rainfall (mm/hr) 50 Foul Sewage (l/s/ha) 0.00 O'flow Setting (*Foul only) 0
Infiltration % 0 Minimum Backdrop Height (m) 1 . 0 0 0 Depth from Soffit to G.L. (m) 1 . 2 0 0
Volumetric Runoff Coeff. 0 . 7 5
Min Vel. (m/s - Auto Design Only) 0 . 7 5 Min Slope ( 1 : X - Optimisation) 500 Minimum Outfall Invert (m) 1 2 7 . 0 0 0 Ground Level at Outfall (m) 1 3 0 . 2 0 0 Outfall Manhole Name 1 0 Outfall Manhole Dia/Length (mm) 0 Outfall Manhole Width (mm) 0
Designed with Level Soffits
Network Design Table
Length F a l l Slope Area T . E . DWF k HYD DIA (m) (m) (1:X) (ha) (mins) ( l / s ) (mm) SECT (mm) PN
10.000 3 5 . 0 0 0 . 2 0 0 1 7 4 . 8 0 . 0 9 0 4 .00 0 0 . 6 0 0 o 1 5 0 1 0 . 0 0 1 5 0 . 0 0 0 .117 4 2 5 . 9 0 .280 0 . 0 0 0 0 .600 o 300
11 .000 27.00 0 . 0 9 1 2 9 6 . 5 0.192 4 .00 0 0 . 6 0 0 0 2 2 5 1 1 . 0 0 1 43 .00 0 . 1 0 1 426 .5 0 .088 0 . 0 0 0 0 .600 o 300
1 0 , 0 0 2 60 .00 0.120 5 0 0 . 0 0 .240 0 .00 0 0 . 6 0 0 o 450
Network Results Table
Rain T . C . US/IL E.Area E.DWF Foul I n f i l . V e l CAP Flow PN (mm/hr) (mins) (m) (ha) ( l / s ) ( l/s) ( l / s ) b / s ) ( l / s ) ( l / s )
1 0 . 0 0 0 5 0 . 0 4 . 8 136.000 0 .090 0 0 0 0 . 7 6 13 1 2 1 0 . 0 0 1 5 0 . 0 5 . 9 137 .650 0 . 3 7 0 0 0 0 0 . 7 6 53 50
1 1 . 0 0 0 5 0 . 0 4 .6 136 .575 0 .192 0 0 0 0 . 7 5 30 26 11.001 50.0 5.5 1 3 6 . 4 0 9 0 . 2 8 0 0 0 0 0 . 7 6 53 38
1 0 . 0 0 2 49.4 7 . 0 136 .158 0 .890 0 0 0 0 . 9 0 1 4 4 1 1 9
( ~ 1 1 9 8 2 - 2 0 0 3 Micro Drainage
For
insp
ectio
n pur
pose
s only
.
Conse
nt of
copy
right
owne
r req
uired
for a
ny ot
her u
se.
EPA Export 25-07-2013:18:28:18

Appendix A
Roof and Paved calculations and long sections
n
For
insp
ectio
n pur
pose
s only
.
Conse
nt of
copy
right
owne
r req
uired
for a
ny ot
her u
se.
EPA Export 25-07-2013:18:28:18

c
il
MH Name
Hoc S c a l e 1500
Ver S c a l e 200
Datum (ml 131.000
Oia (mm) Slope (1 :X)
PN
Cover Level (m)
I n v e r t Level (ml
Length (m)
M H Name
Hoc S c a l e 1500
Ver S c a l e 200
Datum (m) 127.000 PN ..
D i d Imml Slope (1:Xl
Cover Level (m)
I n v e r t Level (m)
Length (ral
6 5 4 2 1
,I_ ,
-------- . - -..-.-----.----'-]l, _._----
10.003 10.002 10.001 10.000
4 50 450 300 150 500.0 500.0 425 .9 174.8
0 0 VI 0 m
0 0 m
0
VI 0 0 c)
m m m .-I r(
m m
m 0
0 m
m ... ... 0 ... w r m
0 0
m
00 U 1 0 wpm
m N
3 V I m + V I
W D r
....-I
. . o m 0 0
V I W m m .-I- rr m n
. . m .-I m ... 111
. . 4 4
m n
32.00 60.00 50.00 35.00
10 9 6
10.005 10.004 450 450
10.0 16.0
0 0 In I-
N m m - ...
0
m
pm m ... w
?
0 0 0 0 0 .-I-
-.-I m m m .-I...
r m 0
In m 4
. . ,-I N
21.00 70.00
ic)1982-2003 Micro Drainage
For
insp
ectio
n pur
pose
s only
.
Conse
nt of
copy
right
owne
r req
uired
for a
ny ot
her u
se.
EPA Export 25-07-2013:18:28:18

Lime r i c Fc I T & J Standish
PN
1 2 . 0 0 0
1 0 . 0 0 3
13 .000
10 .004
14 .000
15 .000
1 6 . 0 0 0
1 0 . 0 0 5
Network Design Table
L e n g t h Fall Slope Area T.E. DWF k (m) (m) (1:X) (ha) (mins) (l/s) (mm)
30.00 0 .312 96 .2 0.028 4 . 0 0
3 2 . 0 0 0.064 500 .0 0 . 0 0 0 0 . 0 0
32 .00 1 . 7 7 6 1 8 . 0 0.030 4 .00
78 .00 4.874 1 6 . 0 0 .391 0 . 0 0
32 .00 5 .050 6 . 3 0.210 4 . 0 0
76 .50 2 .650 28 .9 0 .250 4 .00
51 .00 1 .750 2 9 . 1 0.093 4 .00
21 .00 2 .100 1 0 . 0 0 . 0 0 0 0 . 0 0
Network R e s u l t s Table
T.C. US/IL Rain (mm/hr) (mins) (m) PN
1 2 . 0 0 0
1 0 . 0 0 3
1 3 . 0 0 0
10 .004
1 4 . 0 0 0
1 5 . 0 0 0
1 6 . 0 0 0
1 0 . 0 0 5
5 0 . 0
47 .6
50 .0
46 .9
50 .0
50 .0
50 .0
46 .8
4 . 6 136 .700
7 . 6 136 .038
4 . 3 138 .100
7 .8 135 .974
4 . 1 136 .450
4.5 133 .975
4 .5 133 .150
7 .9 131 .100
E .Area (ha)
0.028
0.918
0.030
1 .339
0.210
0.250
0 .093
1 .892
E . D W (l/s)
0
0
0
0
0
0
0
0
Foul ( U s )
0
0
0
0
0
0
0
0
0 0 .60
HYD D I A SECT (mm)
0 100
0 0 .600 o 450
0 0 .600 0 100
0 0.600 o 450
0 0.600 o 150
0 0.600 o 225
0 0 .600 o 1 5 0
0 0 . 6 0 0 o 450
0 0 .78
0 0 .90
0 1 . 8 3
0 5 . 1 0
0 4 . 0 3
0 2.44
0 1 .87
0 6 . 4 6
6 4
1 4 4 1 1 9
1 4 4
8 1 1 17 0
7 1 28
97 34
33 1 3
1027 240
( c )1982-2003 Micro Drainage
For
insp
ectio
n pur
pose
s only
.
Conse
nt of
copy
right
owne
r req
uired
for a
ny ot
her u
se.
EPA Export 25-07-2013:18:28:18

4 . I
HH Name I 6 5
HOT S c a l e 1500
Ver S c a l e 200
Datum (m) 131 .000 PN 13.000 I Dla (nun) 100 Slope ( 1 : X ) 1 8 . 0 I
0 0 0 0 T
m (n 0 0 - A
Cover Level (rn)
- w 0 0 N I? ... 10 m II 0 4
Inver t Level (m)
Length (ml 3 2 . 0 0
HH Name
nor s c a l e 1500
Ver S c a l e 200
Datum in) 128 .000 PN Dia (mm) Slope ( 1 : X )
Cover Level (m)
I n v e r t Level (m)
Length (m)
9 7
14 .000 150 6 . 3
0 0
r. m
N r I? 4 ...
0 In 0 0 - ... -n I? I? d -4
32 .00
l c)1982-2003 Micro Drainage
For
insp
ectio
n pur
pose
s only
.
Conse
nt of
copy
right
owne
r req
uired
for a
ny ot
her u
se.
EPA Export 25-07-2013:18:28:18

T b J Standish
MH Name
Hor Scale 1500
Ver Scale 200
Datum Im) 131.000
Dia (nun) Slope (1:X)
Cover Level lml
PN
Invert Level (ml
Length (m)
MH Name
Hor Scale 1500
Ver Scale 200
Datum (rn) 131.000 PN Dia (nun) Slope ( l :X )
Cover Level (rn)
Invert Level (ml
Length (ml
4 4 3
11.001 11.000 300 225
4 2 6 . 5 296 .5
0 0 .n
m m m CI 0 4
0 0 0 0 0
m I? 4
m m - In 0 o m P (1 V V Y) . .
W I? 8-
4 4 - 4
( D w m m
43 .00 2 7 . 0 0
5 5
12.000 100
96.2 0 0
9 m
m m 4 4
m 0 m 0
(0 m 4 4
?
? F.
30.00
(c)1982-2003 Micro Drainage
For
insp
ectio
n pur
pose
s only
.
Conse
nt of
copy
right
owne
r req
uired
for a
ny ot
her u
se.
EPA Export 25-07-2013:18:28:18

CADS Storm W.9.3 net
STORM SEWER DESIGN by the Modified Rational Method
Global Variables
Pipe Size File d:\apps\WinDes\STANDARD.PIP Manhole Size File d:\apps\WinDes\STANDARD.MHS
Location - Scotland & Ireland
Return Period (years) 2 M5-60 (m) 18.000 Ratio R 0.300 Maximum Rainfall (mm/hr) 50 Foul Sewage (l/s/ha) 0.00 O'flow Setting (*Foul only) 0 Volumetric Runoff Coeff. 0.75 Infiltration % 0 Minimum Backdrop Height (m) 1.000 Depth from Soffit t o G.L. (m) 0.400 Min Vel. (m/s - Auto Design Only) 0.75 Min Slope (1:X - Optimisation) 500 Minimum Outfall Invert (m) 113.200 Ground Level at Outfall (m) 114.000 Outfall Manhole Name Outfall Manhole Dia/Length (m) 0 Outfall Manhole Width (mm) 0
Designed with Level Soffits
Network Design Table
Length Fall Slope Area T.E. DWF k HYD D I A (m) (1:X) (ha) (mins) (l/s) (mm) SECT (mm) PN
(m)
1.000 38.00 0.994 38.2 0.048 4.00 0 0.600 0 100
2.000 31.00 0.361 85.9 0 . 0 4 8 4 . 0 0 0 0.600 0 100 2.001 32.00 0.373 85.9 0.000 0.00 0 0,600 0 100
1.001 28.00 0.160 174.6 0.000 0.00 0 0.600 o 150
Network Results Table
Rain T.C. US/IL E.Area E.DWF Foul Infil. Vel CAP Flow (mm/hr) (mins) (m) (ha) (l/s) (l/s) (l/s) (m/s) ( l / s ) (l/s)
PN
1.000 50.0 4 . 5 139.300 0.048 0 0 0 1.25 10 6
2.000 50.0 4.6 139.040 0.048 0 0 0 0.83 7 6 2.001 50.0 5.3 138.679 0.048 0 0 0 0.83 7 6
1.001 50.0 5.9 138.256 0.096 0 0 0 0.76 13 13
(c)1982-2003 Micro Drainage
For
insp
ectio
n pur
pose
s only
.
Conse
nt of
copy
right
owne
r req
uired
for a
ny ot
her u
se.
EPA Export 25-07-2013:18:28:18

T C J Standish
HH Name
Hor Scale 1500
Ver Scale 200
Datum (m) 127.000 PN Dia (nun) Slope ( 1 : X I
Cover Level (m)
Invert Level (m) 1
9 8
15.000 225 28.9
0 0 YI 0 P v
N U) 0 I? d d
2
d
ol
I? 0 .-I
Length (m)
HH Name
HOT Scale 1500
Ver Scale 200
Datum lm) 126.000 DII . .. Dia (nun) Slope ( 1 : X )
Cover Level (m)
Invert Level (ml
Length Im)
9 9
16.000
150
29 .1
0 0 0 - y1 In
N 9. CI m r( 4
0 0 U)
w r(
r( m *I m 4 d
5 1 . 0 0
(c)1982-2003 nlcro Drainage
For
insp
ectio
n pur
pose
s only
.
Conse
nt of
copy
right
owne
r req
uired
for a
ny ot
her u
se.
EPA Export 25-07-2013:18:28:18

- . . . .. . - - - -. . . - - - - - - - - - -. . . . . . . . . . .. . . . . . . . . . . . . . . . .. . . . .. . . . -.
CADS Storm W.9.3 net
Network Design Table
Fall (m)
0.058
0.558
0.125
1.452
1.229
0.483
0.233 0.250
0.882
0.127 2.000
0.243 0.610
T.E. DWF (mins) (l/s)
4.00 0
4.00 0
0 .00 0
0 . 0 0 0
0.00 0
4.00 0
4.00 0 0.00 0
0 . 0 0 0
0 .00 0 0.00 0
4.00 0 0.00 0
k (mm1
0.600
0.600
0.600
0.600
0.600
0.600
0.600 0.600
0.600
0.600 5.000
0.600 0.600
Length (m)
6.00
12.00
22.00
21.00
35.00
14 .OO
14 .OO 10.00
35.00
15.00 10.00
25.00 25.00
Slope (1:X)
103.0
21.5
175.3
14.5
28.5
29.0
60.1 40.0
39.7
118.1 5.0
103.0 41.0
Area (ha)
0.030
0.020
0.000
0.000
0.001
0.006
0.006 0.000
0.000
0.000 0.000
0.023 0.000
HYD SECT PN
100 8.000
9 0 000
8.001
0
100 0
150 0
150 7.003 0
225 1.005
10.000
11.000 11.001
0
100 0
100 100
0 0
100 10.001 0
1.006 1.007
300 300
0
0
100 100
12.000 12.001
0 0
Network Results Table
T.C. US/IL E.Area E.DWF Foul Infil. PN
8.000
9.000
8.001
7.003
1.005
10.000
11.000 11.001
10.001
1.006 1.007
12.000 12.001
Rain (=/hr)
50.0
50.0
50.0
50.0
49.3
50.0
50.0 50.0
50.0
48.7 48.7
50.0 50.0
Vel (m/s)
0.76
1.67
0.76
2.66
2.46
1.44
1.00 1.22
1.23
1.45 5.09
0.76 1.21
(mins)
4.1
4.1
4.6
6.4
7.0
4.2
4.2 4.4
4.8
7.2 7.2
4.6 4.9
(m)
139.000
139.500
138.892
138.766
137.240
137.500
137.500 137.267
137.017
135.935 134.500
137.100 136.857
(ha)
0.030
0.020
0.050
0.146
0.396
0.006
0.006 0.006
0.012
0.408 0.408
0.023 0.023
(l/s) ( U s ) ( U s )
0 0 0
0 0 0
0 0 0
0 0 0
0 0 0
0 0 0
0 0 0 0 0 0
0 0 0
0 0 0 0 0 0
0 0 0 0 0 0
6 4
13 3
13 7
47 2 0
98 53
11 1
8 1 10 1
10 2
102 54 360 54
6 3 9 3
(c)1982-2003 Micro Drainage
For
insp
ectio
n pur
pose
s only
.
Conse
nt of
copy
right
owne
r req
uired
for a
ny ot
her u
se.
EPA Export 25-07-2013:18:28:18

1
CADS Storm W.9.3 net
Network Design Table
PN
3 . 0 0 0
4 . 0 0 0
3 . 0 0 1 3 . 0 0 2 3 . 0 0 3
5 . 0 0 0
6 . 0 0 0
5 . 0 0 1
1 . 0 0 2 1 . 0 0 3 1 . 0 0 4
7 . 0 0 0 7 . 0 0 1 7 . 0 0 2
Lenqth Fall Slope Area PN
3 . 0 0 0
4 . 0 0 0
3 . 0 0 1 3 . 0 0 2 3 . 0 0 3
5 . 0 0 0
6 . 0 0 0
5 . 0 0 1
1 . 0 0 2 1 . 0 0 3 1 . 0 0 4
7 . 0 0 0 7 . 0 0 1 7 . 0 0 2
Rain (mm/hr)
5 0 . 0
5 0 . 0
50 .0 50.0 5 0 . 0
5 0 . 0
5 0 . 0
5 0 . 0
5 0 . 0 50.0 50 .0
50.0 50.0 50.0
( m-1 (m)
8 . 0 0 0 . 0 7 8
6 . 0 0 0 . 0 7 8
1 8 . 0 0 0 . 3 9 2 1 4 . 0 0 0 . 2 5 0 2 3 . 0 0 1 . 2 4 4
2 2 . 0 0 0 . 2 1 4
4.00 0 . 3 2 4
2 5 . 0 0 1 . 4 3 1
1 9 . 0 0 0 . 0 6 4 5 . 0 0 0 . 0 1 7
3 9 . 0 0 0 . 7 0 0
5 0 . 0 0 0 . 2 0 6 5 0 . 0 0 0 . 2 8 6 1 9 . 0 0 2 . 1 1 3
(1:X) (ha)
1 0 3 . 0 0 . 0 1 8
7 7 . 2 0 . 0 1 8
4 5 . 9 0 . 0 0 0 5 6 . 0 0 . 0 1 5 1 8 . 5 0 . 0 0 0
1 0 3 . 0 0 . 0 0 0
1 2 . 4 0 . 0 5 0
1 7 . 5 0 .017
2 9 5 . 6 0 . 0 0 0 2 9 5 . 6 0 . 0 0 0
5 5 . 7 0 . 0 3 5
1 7 5 . 1 0 . 0 6 0 1 7 5 . 1 0 . 0 3 6
9 . 0 0 . 0 0 0
T.E. (mins)
4 . 0 0
4 . 0 0
0 . 0 0 0.00 0 . 0 0
4 . 0 0
4 . 0 0
0 . 0 0
0 . 0 0 0.00 0 . 0 0
4 . 0 0 0 .00 0.00
Network Results Table
T.C. US/IL (mins) (m)
4 . 2 1 4 0 . 1 1 0
4 . 1 1 4 0 . 1 1 0
4 . 4 1 4 0 . 0 3 2 4.7 1 3 9 . 6 4 0 4 . 9 1 3 9 . 3 9 0
4 . 5 1 3 9 . 7 9 0
4 . 0 1 3 9 . 9 0 0
4 .7 1 3 9 . 5 7 6
6 . 3 1 3 8 . 0 2 1 6 . 4 137 .957 6 . 8 1 3 7 . 9 4 0
5 . 1 1 4 1 . 4 5 0 6 .2 141.164 6 . 3 1 4 0 . 8 7 9
E .Area (ha)
0 . 0 1 8
0 . 0 1 8
0 . 0 3 6 0 , 0 5 1 0 .051
0 . 0 0 0
0 . 0 5 0
0 . 0 6 7
0 . 2 1 4 0 . 2 1 4 0 . 2 4 9
0 . 0 6 0 0 . 0 9 6 0 . 0 9 6
E .DWF (l/s)
0
0
0 0 0
0
0
0
0 0 0
0 0
-0
DWF (l/s)
0
0
0 0 0
0
0
0
0 0 0
0 0 0
k (mm)
0 . 600
0 . 6 0 0
0 . 6 0 0 0 . 6 0 0 0 . 6 0 0
0 . 6 0 0
0 . 6 0 0
0 . 6 0 0
0 . 6 0 0 0 . 6 0 0 0 . 6 0 0
0 . 6 0 0 0 . 6 0 0 0 . 6 0 0
Foul Infil. ( U s ) (l/s)
0 0
0 0
0 0 0 0 0 0
0 0
0 0
0 0
0 0 0 0 0 0
0 0 0 0 0 0
HYD SECT
0
0
0 0 0
0
0
0
0 0
0
0
0 0
Vel
D I A (mm)
100
100
100 100 100
100
100
100
225 225 2 2 5
150 1 5 0 1 5 0
CAP (m/s) (l/s)
0 . 7 6 6
0 . 8 8 7
1 .14 9 1 . 0 3 8 1 . 8 0 1 4
0 . 7 6 6
2 . 2 1 17
1 . 8 6 1 5
0 . 7 6 3 0 0 . 7 6 3 0 1 . 7 6 7 0
0 . 7 6 1 3 0 . 7 6 1 3 3 . 3 8 60
Flow (l/s)
2
2
5 7 7
0
7
9
29 29 34
8 13 13
( c ) 1 9 8 2 - 2 0 0 3 Micro Drainage
For
insp
ectio
n pur
pose
s only
.
Conse
nt of
copy
right
owne
r req
uired
for a
ny ot
her u
se.
EPA Export 25-07-2013:18:28:18

43
a
MH Name
Hor Scale 1500
Ver Scale 200
Datum Im) 131.000 DU
Cover Level (m)
Invert Level (m)
Length (in)
HH Name
HOK Scale 1500
Ver Scale 200
Datum (m) 126.000 DM . .. Dia (nun) Slope Il:Xl
Cover Level (rn)
Invert Level (rn)
Length (in)
29 28 23 15 13 4 1
1.005 1.004 1.002 1.001 1.000 1.006
118.1 300 225 225 225 150 100
28.5 55.7 295.6 114.6 38.2 0 0
q
P m
N CI
4 rl
0 0 0 0 0
W m
m n n m m
0 0 0
4 n 0
m n m m m n m
0 0 C - q
0 m m P 0
n 4 4
u w 0 0 n In0
N m m m 4 4
. . 4 4 4
0 P P 7 -In
n
4 w 0 0
m m m m d r l
N O I
m n . . . . m m m
n o m
m In0 o or(
In . o w n nn
rl n o
. * . P P P
4 d r l
m m o ? ? rr n n
. . 4 4 .-I 4 4
35.00 39.00 19.00 28.00 38.00 15.00
/ 1.008 300 16.7
0 C
In r
N 4
m
10 C $0 r C
C c 15 c
30.00
4
(c) 1982-2003 Hicro Drainage
For
insp
ectio
n pur
pose
s only
.
Conse
nt of
copy
right
owne
r req
uired
for a
ny ot
her u
se.
EPA Export 25-07-2013:18:28:18

Limerick
PN
13.000
12.002 12.003
1.008
14.000
1.009 1.010 1.011 1.012
PN
13.000
12.002 12.003
1.008
14.000
1.009 1.010 1.011 1.012
Rain (=/hr)
50.0
50.0 50.0
48.3
48.7
47.6 47.0 46.4 45.9
Network Design Table
Length F a l l Slope Area T . E . DWF k (m) (m) (1:X) (ha) (mins) ( l / s ) (mm)
26.00 0.252 103.0 0.023 4.00 0 0.600
14.00 0.150 93.1 0.000 0.00 0 0.600 45.00 3.397 13.2 0.001 0.00 0 0.600
30.00 1.800 16.7 0.000 0.00 0 0.600
30.00 0.500 60.0 1.892 7.00 0 0.600
40.00 40.00 40.00 40 .00
T.C. (mins
0.889 45.0 0.000 0.00 0 0.600 0.889 45.0 0.000 0.00 0 0.600 0..889 45.0 0.000 0.00 0 0.600 0.889 45.0 0.000 . 0.00 0 0.600
Network Results Table
US/IL (m)
4.6 136.500
5.2 136.247 5.5 136.097
7.4 130.000
7.2 129.000
7.6 124.750 7.8 121.800 8.0 11.7.800 8.2 114.089
E.Area E.DWF Foul Infil. (ha) ( l / s ) ( l / s ) ( l / s )
0.023
0.046 0.047
0.455
1.892
2.347 2.347 2.347 2.347
0 0
0 0 0 0
0 0
0 0
0 0 0 0 0 0 0 0
HYD DIA SECT (mm)
Vel m/s)
0.76
0.80 2.13
3.87
2.63
3.04 3.04 3.04 3.04
0 100
0 100 0 100
o 300
o 450
o 450 o 450 o 450 o 450
CAP
(l/s)
6
6 17
274
418
483 483 483 483
Flow ( l / s )
3
6 6
59
250
303 303 303 303
(c)1982-2003 Micro Drainage
For
insp
ectio
n pur
pose
s only
.
Conse
nt of
copy
right
owne
r req
uired
for a
ny ot
her u
se.
EPA Export 25-07-2013:18:28:18

Hor Scale 1500
Ver Scale 200
Dattm Iml 132.000 PN 2 .001 2.000 D I a (rml 100 100 Slope Il:xi 85 .9 8 5 . 9
0 0 0
P P In m m
m .i
- m m
I? I? d d
W m m 0 0 w m 0 P P w w
m m I? 0
m m
r( I ? m
d % - I d
Cover Level (mi m
. . Invert Level (ml
Length (rnl 32 .00 31.00
MH Nane
Hor Scale 1500
Ver Scale 200
Datum (ml 133.C PN - .. D i a (mml Slope (1:Xl
Cover Level (ml
Invert Level Iml
Length (mi
13 9 8 7
3.003 3.002 3 . 0 0 1 100 100 100 I
18 .5 5 6 . 0 4 5 . 9 ' 0 0' 0
I? m -3 w m m 0 0
W N'N 0
- m r ( 4
0
0 0
. . 0
I? w - 7 4 4 4 4 4
I?
w l l m 4 0 0 0 0
4 00.4 I?I?
m 0 0 0 W P W 4 4 4 " r(
m m w v . . . . , '4v: 2% 2 2 r(d 4 4
23.00 14 .00 18.00
(c)1982-2003 Micro Drainage
For
insp
ectio
n pur
pose
s only
.
Conse
nt of
copy
right
owne
r req
uired
for a
ny ot
her u
se.
EPA Export 25-07-2013:18:28:18

CADS
XH Name
HOK Scale 1500
Ver Scale 200
MH Name
Hor Scale 1500
Ver Scale 200
Datum (ml 109.000 DU
4 0 39 38 37
D i a (mu) Slope ( l : X t
Cover Level (m)
Invert Level (mt
Length (m)
4 0
1 . 0 1 2 450
4 5 . 0 0
0 0 0
w aD rl rl rl .-I
01 0
N
m .-I 4 .-I
3. w .-I
40.00
(c)1982-2003 Micro Drainage
For
insp
ectio
n pur
pose
s only
.
Conse
nt of
copy
right
owne
r req
uired
for a
ny ot
her u
se.
EPA Export 25-07-2013:18:28:18
\
For
insp
ectio
n pur
pose
s only
.
Conse
nt of
copy
right
owne
r req
uired
for a
ny ot
her u
se.
EPA Export 25-07-2013:18:28:18

. P
HH Name
Hor Scale 1500
Ver Scale 200
Datum Im) 134.000 PN - .. Dia (mm) Slope ( 1 : X )
Cover Level ( m )
Invert Levei (m)
Length (rn)
HH Name
HOT Scale 1500
Ver Scale 200
Datum (in) 133.000 PN Dia (nun) Slope (1:X)
Cover Level Im)
Invert Level (m)
Length ( m )
7
0 0
l o - m - . .
12 10
5.001 5 .000 100 100
17.5 1 0 3 . 0 0 0 0 0 n
0
N
0 w m 0 0 0 v w r( 4 3
w w 0
Y)v) !4 t- rr W 0
m 0 0 v r( 4 3
w w 0
Y)v) !4 t- rr W 0 . . a m m 11)o rt.4
!d 0 ,n
>-I
25.00 22.00
(c) 1982-2003 Micro Dralnaqe
0
For
insp
ectio
n pur
pose
s only
.
Conse
nt of
copy
right
owne
r req
uired
for a
ny ot
her u
se.
EPA Export 25-07-2013:18:28:18

J
= Michael Punch & Partners - - C O N S U L T I N G E N G I N E E P S
Appendix B
Percolation test results
02 136 0 cw PLANNING REPORT revb.doc 5 1 1 * October 2004
For
insp
ectio
n pur
pose
s only
.
Conse
nt of
copy
right
owne
r req
uired
for a
ny ot
her u
se.
EPA Export 25-07-2013:18:28:18
Limerick I
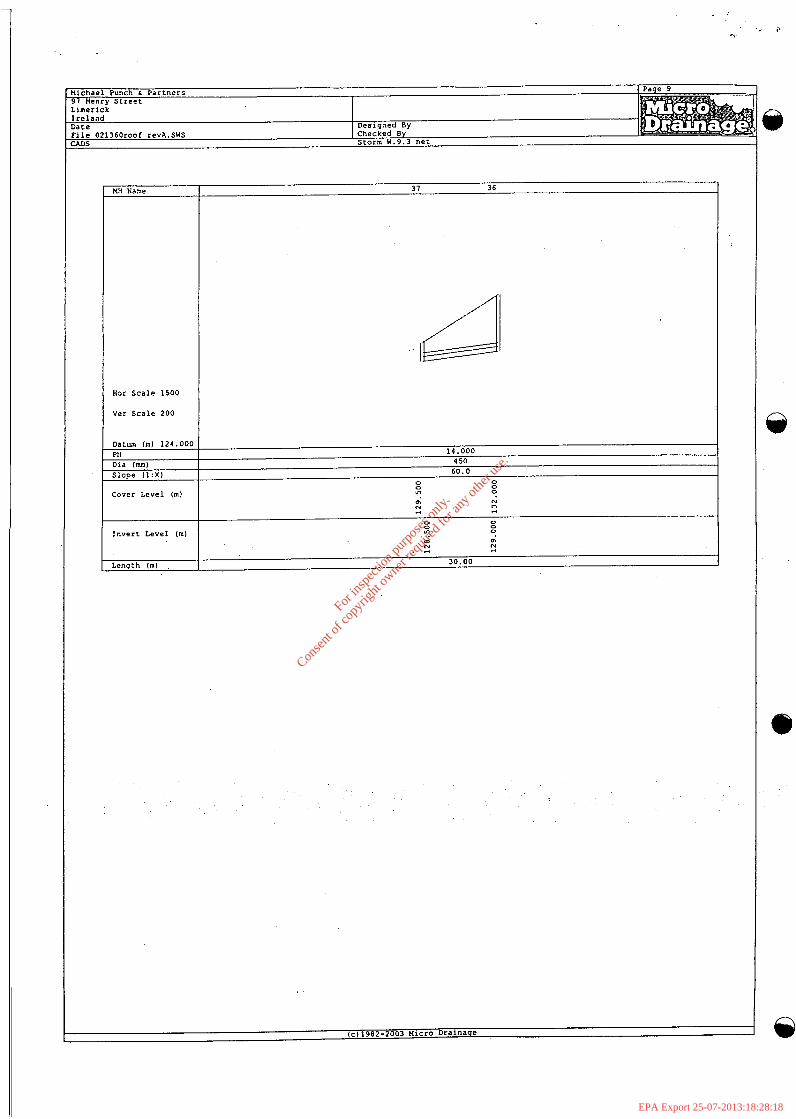
MH Nase
Hor Scale 1500
Ver Scale 200
Datum lm) 124.00( DN
Dia (mm) Slope Il:Xl
Cover Level lm)
Invert Level lm)
tengih (m)
37 36
14.000 4 50
6 0 . 0
0 0 tn
0
0
N N m
0
4
0 0 0 tn
m m N N 4
m d
9
4
30.00
(c)1982-2003 Micro Drainage
For
insp
ectio
n pur
pose
s only
.
Conse
nt of
copy
right
owne
r req
uired
for a
ny ot
her u
se.
EPA Export 25-07-2013:18:28:18

Appendix C
= Michael Punch & Partners - C O N S U L T I N G E N G I N E E R S
Typical detail of treatment unit Enviropak LRD50 and By-Pass Interceptor
I 02 1360 cw PLANNING REPORT revb.doc 6 1 1 " October 2004
For
insp
ectio
n pur
pose
s only
.
Conse
nt of
copy
right
owne
r req
uired
for a
ny ot
her u
se.
EPA Export 25-07-2013:18:28:18

P Mr Derek Coulter Architect Rosses Row Birr CO Offaly
Date 22- 10-03
Our reference 02 1360DC/CG/Ei
= Michael Punch & Partners @
- C O N S U L T I N G E N G I N E E R S
LIMERICK 97 Henry Street, limerick. Tel: 061 313 877 Fax: 061 319 071 DUBLIN MPP House, Glenageaty Business Park, CO Dublin. Tel: 01 235 2980 Fax: 01 235 2985
NIB Building, Stephen Street, Sligo. Tel: 071 915 0551 Fax: 071 915 0788 Cork Kiemar House, Shanakiel Road, Sundays Well, Cork Tel: 021 430 0700 Fax: 021 430 0720
SLIGO
Your reference Reply to Limerick
Re: Percolation and Watertable Test Results carried out a t Standish Sawmills, Roscrea, CO Offaly
Dear Mr Coulter
@
The following are the results of a water table and percolation test camed out on the above mentioned site on 21" October 2003.
Water Table
A trial hole was dug to 2.1 metres below ground level and left open for a period of 24 hours. N o water table ingress of water was noted. (See attached sketch pictures for locations of trial holes).
Percolation Test
Both a T-Test and P Percolation Test was completed.
T-Test - T Value is equal to 50.
P-Test - T Value is equal to 16.5.
Both tests were carried out in accordance with S.R.6.1 of the N.S.A.1 and the EPA guidelines.
In conclusion the results of the water table are positive. The percolation tests have also past their tests. The percolation area should be constructed in accordance with the percolation results.
I hope the above information is to your approval. Please do not hesitate to contact the under signed if you have any queries.
I Yours sincerely
C ia rh Gallagher Michael Punch & Partners
For
insp
ectio
n pur
pose
s only
.
Conse
nt of
copy
right
owne
r req
uired
for a
ny ot
her u
se.
EPA Export 25-07-2013:18:28:18

@
,
d I
Tclcpllonc: 021-J771000 0 Far: 021-4771015 0 hlobilc: 057-2739017 0 cniail: irlfo~~vastc\vatcrtrcatmcnt.ic
LEISURE RANG E AI’I’LI CAT1 ONS
Domestic Residential I-Iotels Schools Office / Factory Res tau rants Bars Residcn tial Caravans Camp Sites Leisure Centres Golf Clubs
Plant Design - Basic Concept
The Enviropak Leisure range is a new design, based on a conventional Septic Tank and activated sludge principles, which were first defined around 1914. The basic concept involves the use of natural bacteria, to assimilate potentially polluting materials in sewage and thus produce treated water for discharge. The Enviropak Unit is flexible and our team at Cork Waste iVater Treatment Units are available to discuss individual applications. You deal directly with the manufacturer and have the continuous security of our experience and attention.
The Enviropak Leisure Range comes as a ready-made unit, pre-assembled for ease of site work. The Unit is to be installed buried beneath the ground. The main tanks are pre-cast concrete with all other parts stainless steel or u.P.V.C. for long maintenance free life. Cork Waste Water Treatment Units provides a complete package deal, in which we design, supply, install, commission and provide annual Maintenance Contract for each individual Enviropak Unit.
Features
Easy to install 20/30 Standard Discharge Low running costs Conventional Technology Maintenance Contract Available Low Maintenance Infrequent de-sludging Low capital costs Pumping Stations when required
For
insp
ectio
n pur
pose
s only
.
Conse
nt of
copy
right
owne
r req
uired
for a
ny ot
her u
se.
EPA Export 25-07-2013:18:28:18

Tclcplionc: 021-4771000 0 Fax: 021-4771015 0 RIobilc: 057-2739017 0 email: inlo~\vastc\\.atcrrca(nicnt.ic
Enviropak S y s terns
Leisure Range
L m 50
The LRD 50 will cater for up to 8 houses or a population equivalent of 50
For
insp
ectio
n pur
pose
s only
.
Conse
nt of
copy
right
owne
r req
uired
for a
ny ot
her u
se.
EPA Export 25-07-2013:18:28:19

xlured from x e d plastic.
yredited to BS
ste base slab
icked area, a ,ensure that ' top or side
ce with .and Safety tect to LOG x h unit.
> within the ensure that
i maintained d cleaned at n layers can p separator :nts Service Jirements. the oil level ied from the
:rms of The
@plication sill storage
15 separator -3 upstream lzximum silt
j/ produce .zd into the m e of silt 3 the whole
le oil/water ', I e size, i t If the silt ' fe blocked . I, frequency nd quantity ?el for Full
/ Technical :linton. 53
'sentatives @vice on
I ( I 1
i
For
insp
ectio
n pur
pose
s only
.
Conse
nt of
copy
right
owne
r req
uired
for a
ny ot
her u
se.
EPA Export 25-07-2013:18:28:19

T * ? . V ,.&,; a, :. r" CORK WASTE WATER TREATMENT UNITS
Telcplionc: 021-4771000 0 Fax: 021-4771015 0 hlobilc: 087-2739017 0 crnail: info@\\.astcwatcrtrca~mc"t.ic
OI'ERA'I'ION OF LEISURE TREAThlENT PLANT
The Enbriropak Treatment Plant will require very little maintenance due to the simple design, which is further aided by the fact, that moving parts below ground level are kept to a minimum. The unit is divided into three sections
Section One: Primary Settling which acts as a conventional septic tank where solid particles wilj.be digested under anaerobic conditions, i.e. solid particles will slo\vly be digested by microbes which live without oxygen. The Primary Settling Zone (or Septic Tank) will reduce the effluent loading by a minimum of 33% of from a B.O.D. (Biochemical Oxygen Demand) loading of 350 down to at Ieast 233mg/Lt B.O.D.
Section Two is a conventional aerobic biological treatment plant where microbes requiring osygen will hrther digest the effluent passing from the Primary Settling Zone. Oxygen is supplied to the bioniass by pumping air through a fine bubble defuser. which will allow the transfer of oxygen from the fine air bubbles to the biomass as they pass upwards through the liquid. The air being pumped through the effluent will also keep the microbes in the biomass well mixed and avoid any unpleasant odours.
After the effluent, most of which will be in the solution at this stage has been digested by aerobic microbes, will be converted to solid form, \vhich can be separated from the clear water, in the Clarifier. IO% of the mixed liquor is wasted to the Primary Settling by a submersible pump, which removes the need to desludge the aeration chamber. It is important that the air blower runs continuously as the aerobic microbes need a constant supply of oxygen to stay healthy and to enable them to digest the effluent fully.
In the unlikely event of a problem arising, warning lights are provided to indicate that attention is needed. One light will indicate that the niotor is running (Green), a second light (Red) will indicate that the motor has tripped and requires attention, a third light (Orange) will indicate that the liquid level in the Unit has risen and would suggest a blockage, which may be caused for the need for desludging or that some large foreign object is blocking the Unit. In either event the Primary Settling should be desludged with the use of a slurry tanker.
It is necessary for continued for good operation of the plant, Cork Waste Water Treatment Units will inspect the unit on an annual basis and check proper operation of the pump, sludge levels in the Primary Settling and the aeration zone and the quality of the final effluent. A Maintenance Contract is Available for an annuaI inspection of the Enviropak Unit, and should be completed.
For
insp
ectio
n pur
pose
s only
.
Conse
nt of
copy
right
owne
r req
uired
for a
ny ot
her u
se.
EPA Export 25-07-2013:18:28:19

= Michael Punch & Partners - - C O N S U L T I N G E N G I N E E R S
Appendix D
Foul flow calculation and long sections
3
02 1360 cw PLANNING REPORT revb.doc 7 1 l* October 2004
For
insp
ectio
n pur
pose
s only
.
Conse
nt of
copy
right
owne
r req
uired
for a
ny ot
her u
se.
EPA Export 25-07-2013:18:28:19

CLASS 1 & CLASS 2 BYPASS SEPARATORS
1 A J
E fl E 63
All dimensions are in millimetres. ‘Some units have mcre than one access shaf: - diameter of largest given
To specify a Klarcjester Bypass Separator. the following information is needed.
This determines the size of unit. The drainage area and peak flow rate in the chart above assume 50mm/hr rainfall intensity. Our designs are based on the assumption that any interconnecting .pipework fitted elsewhere on site dces not impede flow in or out of th e separator. Run-off from low risk areas, such as roofs, should not be connected lo a separator. When this cannot be avoided, the separator must be sized accordingly.
The required discharge standard. This will decide whether a Class 1 or Class 2 unit is required. Class 1 separators produce an improved effluent quality. The drain invert inlet depth.
The drainage area served or the calculated flow rate.
The difference between the drain invert depth and the
minimum invert (F). above, rounded up to the nearest halfmetre. is the length of extension shafl(s) needed. Extension shafts. for site fitting, are available in 0.5 metre increments.
Oil Alarm System. See separate data sheet for full details and options. *
Unless specifi otherwise, units are supplied with the
orientatiori shown i n h e above table. They will be supplied without the alternate oil probe position. Please contact our Technical Sales Department if you require details of available options. but please note we do not alter internal pipework dimensions.
With or without alternate Oil Probe position
Pipework type, size and orientation.
slandard (minim % ) invert depth and pipework size and
Klargester Environmental Ltd. College Road, Aston Clinton, Aylesbury, Bucks. HP22 5EW
S 01296 633014 Fax 01296 633001
http://w. klargesler.co.uk [email protected]
Manufaclurino and distribuLion units also at:
@) \1”
’ ~ 0 0 0 0 ~ #largest er East Kilbride. P 013552 48484 6elfasl: P 01232 36566.1 Eire. s 1-800 6261 12
In keeping with the Coinpdny yollcy ti continuing research and Cavt?lopment, Klargesler reserves Ird r i p 1 :o alter speclriwllons and drawlngs wilhoul nolice
TOSO01 715 March 2000
For
insp
ectio
n pur
pose
s only
.
Conse
nt of
copy
right
owne
r req
uired
for a
ny ot
her u
se.
EPA Export 25-07-2013:18:28:19

. . -. . MII Name . - . - - . . - . , . . _ _
Hor S c a l e 1500
Ver S c a l e 200
Datum ( m ) 135 .000 ..... ......... .- . . PN
Cover Level ( m )
... -. ...... . -. .. __.
Inver t Level (m)
............ - .........
..... - - __ ......
MH Name
Hor S c a l e 1500
Ver S c a l e 200
n n WI
d =! L e n g t h (rn) I 3 1 . 0 0 I 1 6 . 0 0 I 7 4 .oo I
. . . . nn *nu, o n o n .-Id 4, .
For
insp
ectio
n pur
pose
s only
.
Conse
nt of
copy
right
owne
r req
uired
for a
ny ot
her u
se.
EPA Export 25-07-2013:18:28:19

. . -- -- .. ........ Michael ... .. .... Punch ...... & 97 Henry Street Lirneri c k Ireland Date 12-Dec-03'- File 021360. ... FWS CADS .. .
._ __ - - __ -
.__ . -. . __ ._ - .. . . .
_. ...
... .- ..... ..... .... Partners ........... ...... - .- ..... --
T&J Standish Sawmills Roscrea
Designed By cjw . . . . . . .... -. . _. .. . . .
....... ... _ __ - .. . Micro Drainage . . . - - ___ . FOUL SEWERAGE DESIGN
Global Variables
Industrial Flow (l/s/ha) Industrial Peak Flow Factor Calculation Method Frequency Factor Domestic (l/s/ha) Domestic Peak Flow Factor O'flow Setting (*Foul only) Infiltration % Minimum Backdrop Height (m) Depth from Soffit to G.L. (m) Min Vel. (m/s - Auto Design Only) Minimum Outfall Invert (m) Min Slope (1:X - Optimisation)
Designed with Level Soffits
0.00 0.00
BS 8301 0.00 0.00 6.00
0 0
1.000 0.600 0.75 0.000 500
Network Design Table
HYD D I A Length Fall Slope Area Units DWF k (m) (m) (1:X) (ha) ( l / s ) (mm) SECT (mm). PN
1.000 26.00 0.335 77.6 0.000 14.0 0 1.500 0 100 1.001 90.00 1.500 60.0 0.000 0.0 0 1.500 0 100 1.002 74.00 0.948 78.0 0.000 0.0 0 1.500 0 100 1.003 16.00 2.500 6.4 0.000 30.0 0 1.500 0 100 1,004 31.00 0.397 78.1 0.000 0.0 0 1.500 0 100
Network Results Table
US/IL E.+rea E.DWF E.Units Infil. P.Dep P.Vel Vel CAP Flow (ha) (l/s) (Us) (mm) b / s ) (m/s) ( U s ) ( U s ) PN
(m)
1.000 138.7011 0.000 0 14.0 0 46 0.73 0.76 6
1.002 136.865 0.000 0 14.0 0 46 0.72 0.75 6
1.004 133.417 0.000 0 44 . O 0 53 0.77 0.75 6
1.001 138.365 0.000 0 14.0 0 43 0 . 80 0.86 7
1.003 135.917 0.000 0 44.0 0 27 1.92 2.64 21
For
insp
ectio
n pur
pose
s only
.
Conse
nt of
copy
right
owne
r req
uired
for a
ny ot
her u
se.
EPA Export 25-07-2013:18:28:19