attachment f - ct.gov · electric and magnetic fields (emf) ... expected to change as a result of...
TRANSCRIPT

ATTACHMENT F
Exponent EMF Study

Appendix
Electric and Magnetic Fields
Attachment F

1700614.000 - 0110 i
Executive Summary
The United Illuminating Company (UI) seeks to rebuild approximately 2.1-miles of overhead
115-kilovolt transmission lines between the Baird Substation and the Housatonic River Crossing
(HRX) in Stratford, Connecticut. This report evaluates the Project effect on existing levels of
electric and magnetic fields (EMF) from the existing configurations of these transmission lines.
The loadings on the transmission lines are anticipated to remain nearly constant before and after
the rebuild and the line voltage will not change. Therefore, the difference between the
calculated EMF levels before and after the rebuild will depend entirely on the elevation,
separation, and centerlines of the repositioned conductors. In the proposed configuration, the
existing circuits are relocated outward onto new steel monopoles on either side of the Metro
North Railroad (MNR) New Haven Line.
The shift in the centerline of the proposed circuits tends to increase the calculated magnetic
fields at locations to the north and south of the Project route while the higher conductor
elevations of the rebuilt lines tends to decrease calculated field levels. Because the effects of the
conductor repositions tend to cancel one another, the calculated magnetic fields at the right of
way (ROW) edges can increase, decrease, or remain approximately the same, depending on the
proximity of the repositioned circuits to the ROW edge.
In the majority of spans along the Project route, the calculated magnetic field at the north ROW
edge remains approximately constant for pre- and post-Project conditions, varying by less than
2.5 mG in the rebuilt configuration. West of the Stratford MNR Train Station, the calculated
magnetic field is approximately 37 mG for average-load conditions and 32-33 mG for peak-load
conditions. East of the Stratford Station, the calculated magnetic field is approximately 41-49
mG for average-load conditions and 37-44 mG for peak-load conditions.
On the south ROW edge, west of the Stratford Station, the calculated magnetic field decreases.
Here, the calculated magnetic fields are approximately 49-50 mG for average load conditions
(pre-construction) and decrease to 40-43 mG (post-construction). In the majority of spans east
of the Stratford Station, the south ROW edge is 80 feet or more from the repositioned circuits.
Attachment F

1700614.000 - 0110 ii
Here, the increase in calculated magnetic-field levels (due to the lateral shift of the 115 kV
circuits) is more pronounced than the decrease in magnetic-field levels (due to greater conductor
elevation). The calculated magnetic field at the southern ROW edge in these spans is
approximately 6 mG (pre-construction), and increases to 16-17 mG (post-construction) for
average-load conditions. For peak-load conditions, the increase in calculated magnetic fields at
the south ROW edge is comparable, between 9-10 mG.
The calculated electric fields associated with the Project are low, below 0.9 kV/m at all modeled
locations. At the ROW edges in the majority of spans, the calculated electric fields are relatively
unchanged or increase from approximately 0.4-0.5 kV/m (pre-construction) to 0.6-0.7 kV/m
(post-construction). The increase in the electric field occurs because the rebuilt 115-kV circuits
are relocated further away from the railroad tracks and closer to the ROW edges, which
decreases mutual field cancellation from the two lines.
The calculated EMF levels associated with the Project are far below international safety- and
health-based standards for EMF. The distribution and catenary conductors of the MNR were
not included in the magnetic field modeling, because the contributions of those sources are not
expected to change as a result of this Project and because of the intermittent exposure associated
with the passage of trains on the New Haven Line.
The engineering design and other activities initiated by UI demonstrate compliance with the
Connecticut Siting Council’s EMF Best Management Practices.
Attachment F

1700614.000 - 0110 1
Background
Any source that generates, transmits, or uses electricity produces electric and magnetic fields
(EMF). Electricity travels as current from distant generating sources on high-voltage
transmission lines, to substations, then on to local distribution lines, and finally to our homes
and workplaces for consumption. All things connected to our electrical system—power lines;
wiring in our homes, businesses, and schools; and all electric appliances and machines—are a
source of EMF. In North America, the vast majority of electricity is transmitted as alternating
current (AC) at a frequency of 60 cycles per second measured in Hertz (Hz), i.e., 60 Hz. The
EMF from these AC sources is commonly referred to as power-frequency or extremely low
frequency (ELF) EMF.
Both electric fields and magnetic fields are properties of the space near all electrical sources.
Electric fields exert a force on electrical charges, while magnetic fields exert a force on moving
electrical charges. Although commonly referred to together as EMF, they each have different
properties.
Electric fields are produced by voltage applied to electrical conductors and equipment. The
electric field is expressed in measurement units of volts per meter (V/m) or kilovolts per meter
(kV/m), where 1 kV/m is equal to 1,000 V/m. The electric-field level increases as the voltage
increases. Electric fields are present even when an appliance is turned off if it is still connected
to the power source.
Since conducting objects such as buildings, fences, and trees easily block electric fields, the
major sources of exposure to electric fields indoors are appliances, equipment, and machines
within homes, office, and factories. Transmission lines, distribution lines, and other power-
related infrastructure are the major source of electric fields outdoors.
Transmission line electric fields emanate radially outward from the charged conductor and
terminate at any other conducting object such as trees, fences, vehicles, people, or transmission
line towers. Electric fields are vector quantities meaning that they have both a magnitude and
direction.
Attachment F

1700614.000 - 0110 2
Magnetic fields are the result of the flow of electric currents through wires and electrical
devices. The strength of a magnetic field is expressed as magnetic flux density in units called
gauss (G) or mG, where 1 G = 1,000 mG.1 In general, the strength of a magnetic field increases
as the current increases, but the strength also depends on characteristics of the source, including
the arrangement and separation of the conductors. Unlike electric fields, magnetic fields are not
easily blocked by conducting objects. In addition, a time-varying magnetic field (such as that
used in power transmission systems) induces an electric field and currents in nearby conducting
objects. Like electric fields, magnetic fields are vector quantities described by both their
magnitude and direction.
The intensity of both electric fields and magnetic fields diminishes with increasing distance
from the source. In the case of transmission lines, electric and magnetic fields generally
decrease with distance from the conductors in proportion to the square of the distance. Since
line voltage is quite stable and does not change very much over time, electric-field levels are
also stable. Magnetic-field levels, however, can vary depending on load conditions (i.e., the
currents flowing in a conductor).
1 Scientists also refer to magnetic flux density at these levels in units of microtesla (µT). Magnetic flux density in
mG units can be converted to µT by dividing by 10 (i.e., 1 mG = 0.1 µT).
Attachment F

1700614.000 - 0110 3
EMF Guidance
After more than 30 years of research that includes hundreds of studies, none of the national and
international health and scientific organizations that have reviewed the scientific and medical
research literature has concluded that exposure to EMF in the ELF frequency range is a
demonstrated cause of any long-term adverse effect on health. At high levels of exposure nerve
stimulation may occur and so the World Health Organization (WHO) recommends compliance
with exposure guidelines to protect public health.
The evidence in support of a causal relationship between exposure to EMF at the low levels in
community and occupational environments is weak because it is founded largely, if not entirely,
on epidemiology studies that have reported statistical associations between magnetic field
exposure (or some proxy of exposure) and a disease. Most attention has been given to some
studies that have reported an association between childhood leukemia and estimates of long-
term exposure to high, average magnetic field levels (IARC, 2002). Scientists have placed less
weight on this and other associations because they are weak, often inconsistent between studies,
and possibly due to errors in the way the study was designed or conducted. Overall, animal
studies have not reported an increase in cancer among animals exposed to high levels of EMF,
and no mechanism has been discovered in laboratory studies that would explain how electric or
magnetic fields could produce disease. Thus, the WHO and other agencies have concluded that
the overall body of research does not indicate that this association, or any other, is causal in
nature.
More relevant EMF assessment criteria are the exposure limits recommended by scientific
organizations. These exposure limits were developed to protect health and safety and are based
on reviews and evaluations of relevant health research. These guidelines include exposure
limits for the general public recommended by the International Committee on Electromagnetic
Safety (ICES) and the International Commission on Non-Ionizing Radiation Protection
(ICNIRP) to address health and safety issues (ICES 2002/2007; ICNIRP 2010).
Attachment F
1700614.000 - 0110 4
The only confirmed relationship between EMF and an adverse biological effect is when electric
currents, at very high levels of exposure, are induced in the body and experienced as stimulation
of nerves. The level at which such short-term effects occur is much higher than levels found
under transmission lines, and still higher than levels found in most homes or commercial
establishments. As mentioned, ICES and ICNIRP have recommended exposure guidelines
(Reference Levels) to protect against the occurrence of these acute adverse effects from short-
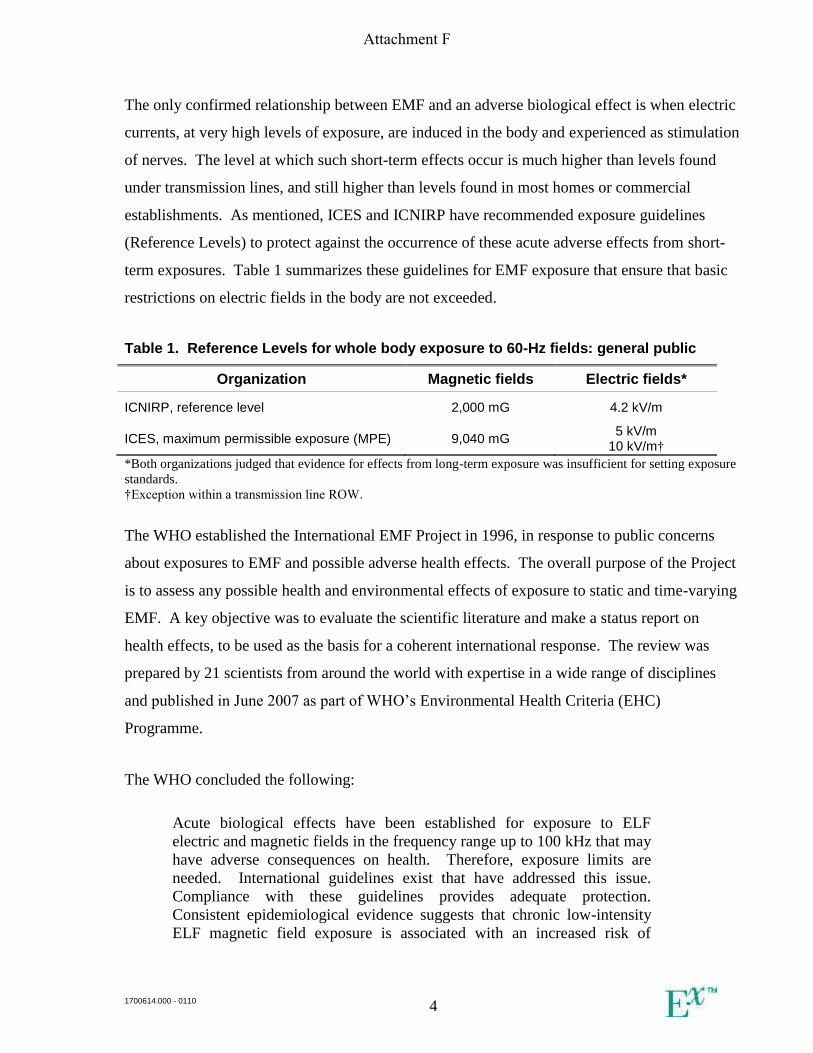
term exposures. Table 1 summarizes these guidelines for EMF exposure that ensure that basic
restrictions on electric fields in the body are not exceeded.
Table 1. Reference Levels for whole body exposure to 60-Hz fields: general public
Organization Magnetic fields Electric fields*
ICNIRP, reference level 2,000 mG 4.2 kV/m
ICES, maximum permissible exposure (MPE) 9,040 mG 5 kV/m
10 kV/m†
*Both organizations judged that evidence for effects from long-term exposure was insufficient for setting exposure
standards.
†Exception within a transmission line ROW.
The WHO established the International EMF Project in 1996, in response to public concerns
about exposures to EMF and possible adverse health effects. The overall purpose of the Project
is to assess any possible health and environmental effects of exposure to static and time-varying
EMF. A key objective was to evaluate the scientific literature and make a status report on
health effects, to be used as the basis for a coherent international response. The review was
prepared by 21 scientists from around the world with expertise in a wide range of disciplines
and published in June 2007 as part of WHO’s Environmental Health Criteria (EHC)
Programme.
The WHO concluded the following:
Acute biological effects have been established for exposure to ELF
electric and magnetic fields in the frequency range up to 100 kHz that may
have adverse consequences on health. Therefore, exposure limits are
needed. International guidelines exist that have addressed this issue.
Compliance with these guidelines provides adequate protection.
Consistent epidemiological evidence suggests that chronic low-intensity
ELF magnetic field exposure is associated with an increased risk of
Attachment F
1700614.000 - 0110 5
childhood leukaemia. However, the evidence for a causal relationship is
limited, therefore exposure limits based upon epidemiological evidence
are not recommended, but some precautionary measures are warranted.
(WHO, 2007, p. 355)
The absence of clear evidence for adverse effects after continued research and testing increases
the certainty that there is not an adverse effect, or that any risk associated with exposure is
small. Because of the inherent limitations of scientific investigation it is very difficult for a
review panel to ever completely rule out the possibility that EMF in our communities and
workplaces might have some adverse effect. Science cannot prove the absence of any effect but
can effectively address uncertainty about effects by continued research. Given the amount and
quality of research that has been conducted thus far, the opinions from the WHO and other
agencies is consistent that ELF EMF is not a cause of long-term, adverse health effects.
The Connecticut Siting Council (CSC) has adopted “EMF Best Management Practices for the
Construction of Electric Transmission Lines in Connecticut” (BMP) based upon a consensus of
health and scientific agencies that the scientific evidence “reflects the lack of credible scientific
evidence for a causal relationship between MF [magnetic field] exposure and adverse health
effects” (CSC, 2014, p. 3). Nevertheless, the CSC concluded that precautionary measures for
the siting of new transmission lines in the state of Connecticut are appropriate and advocates
“the use of effective no-cost and low-cost technologies and management techniques on a
project-specific basis to reduce MF exposure to the public while allowing for the development
of efficient and cost-effective electrical transmission projects” (CSC, 2014, p.4).
The CSC’s EMF BMP guidance (CSC, 2014) expresses the CSC’s interest in “evidence of any
new developments in scientific research addressing MF and public health effects or changes in
scientific consensus group positions regarding MF” (p. 5). For this project, the CSC’s 2014
BMPs serve as the primary reference to new developments in EMF scientific research.
However, Exponent notes that in 2015, the Scientific Committee on Emerging and Newly
Identified Health Risks (SCENIHR) of the European Union issued its opinion report in which
the Committee concluded that research published up to 2014 did not confirm any adverse health
effects of EMF exposure. The SCENIHR review was the most comprehensive of the reviews
completed since the WHO review in 2007. The conclusions of the 2015 SCENIHR review are
Attachment F

1700614.000 - 0110 6
consistent with the conclusions expressed in the WHO report and the BMPs published in 2014.
In accordance with the CSC’s BMPs, the Project has been designed with consideration to the
following engineering controls:
Distance ― In the majority of spans, the proposed structures are now to be constructed
further away from the railroad line in an area with less frequent public access and
exposure;
Height of Support Structures ― The proposed structures are higher than the existing
structures shared with Metro North; and
Conductor Configuration ― The line will be rebuilt on monopoles in a vertical
configuration that serves in some configurations to increase the height of the conductors
above ground.
The closest area where children congregate adjacent to the proposed rebuilt transmission lines in
Stratford High School, which is located 900 feet or more from the Project. At this distance, the
calculated magnetic-field level after rebuild of the lines diminishes to background levels. See
Measurements section, below.
Attachment F

1700614.000 - 0110 7
EMF Modeling
The Baird to Housatonic River Crossing (HRX) Line Upgrade Project (the Project) includes the
reconductoring and modification of two existing transmission lines between the Baird
Substation and the Housatonic River in Stratford, Connecticut. The Project includes two
segments:
1) a first segment between HRX to the Barnum Substation; and
2) a second segment between the Barnum Substation and the Baird Substation.
Each segment includes a transmission line on the north side of the Metro North Railroad (MNR)
New Haven Line (the north circuit) and a transmission line on the south side of the MNR New
Haven Line (the south circuit). The conductors of existing circuits are mounted on metal
support “bonnets” that are attached to MNR structures. The structures also support the
distribution conductors and catenaries of the New Haven Line. The proposed upgrade would
reposition the north circuit to new steel monopoles to the north of the existing structures, and
reposition the south circuit to new steel monopoles to the south of the existing structures.
Attachment F

1700614.000 - 0110 8
Figure 1. Existing “bonnet” supports for the existing 115-kV circuits between the Baird Substation and HRX.
Exponent modeled the EMF levels associated with the rebuild of the north and south
transmission lines. The modeling of EMF included both existing and proposed configurations
in five sections of the route:
Section HRXB-1 represents the existing and proposed configurations of the 115-kV
lines between Structures 826 and 828, north of the Two Roads Brewery on Stratford
Avenue (CT Route 130) and east of the Baird Substation in Stratford, Connecticut. The
north line will be rebuilt on a steel monopole approximately 21 feet north of the existing
centerline with 12-foot vertical conductor spacing. In Section HRXB-1, the south line
has previously been rebuilt on a delta monopole south of MNR catenary support
structure (to remain). The width of the right of way (ROW) in section HRXB-1 is 120
feet.
Section HRXB-2 includes the spans of the 115-kV lines between Structures 828 to 840,
where the ROW is 118 feet wide. The north line will be rebuilt approximately 30 feet
north of its existing centerline, and the south circuit will be moved approximately 6.5
Attachment F

1700614.000 - 0110 9
feet south of its existing centerline. The rebuilt circuits are each supported by single-
circuit monopoles with 12-foot vertical conductor spacing.
Section HRXB-3 includes the span around the Stratford MNR Station, between
Structures 840 and 841. In the existing configuration, the north and south circuits are
supported in a delta configuration on separate “bonnet” structures having 12-foot
conductor separation. This same delta configuration will persist in the proposed
configuration, with the conductors of the south circuit repositioned to the south by
approximately 14 feet and raised by approximately 7 feet. The ROW width in section
HRXB-3 is 274 feet.
In Section HRXB-4 includes one ROW configuration with two distinct loadings:
1) a first set of loadings between Structure 841 and 846 (in spans southwest of the
Barnum Substation interconnection); and
2) a second set of loadings between Structure 847 and 853 (northeast of the Barnum
Substation interconnection).
In Section HRXB-4, the north circuit will be rebuilt on a vertical steel monopole
approximately 16.5 feet north of its existing centerline, and the south circuit will be
rebuilt on a vertical steel monopole within approximately 14 feet south of its existing
centerline. In the rebuilt configuration, both circuits have 12-foot vertical spacing. The
ROW width in section HRXB-4 is 191 feet.
Section HRXB-5 includes the remaining spans east of structure 853 to HRX, where the
existing ROW has width of 127 feet. The north circuit will be rebuilt outside of the
existing ROW on a vertical steel monopole approximately 38 feet north of its existing
centerline. The south circuit will also be rebuilt outside of the existing ROW, on a
vertical steel monopole approximately 10 feet south of its existing centerline. In the
rebuilt configuration, both circuits will have 12-foot vertical conductor spacing.
Methods
Existing and proposed levels of EMF were calculated using computer algorithms developed by
the Bonneville Power Administration, an agency of the U.S. Department of Energy (BPA,
1991). These algorithms have been shown to accurately predict EMF levels measured near
Attachment F

1700614.000 - 0110 10
transmission lines. The electric fields and magnetic fields were calculated as the resultant of x,
y, and z field vectors. Exponent calculated electric- and magnetic-field levels at 1 meter
(3.28 feet) above ground, in accordance with IEEE Std. C95.3.1-2010 and IEEE Std. 0644-
1994a, as the root-mean-square value of the field ellipse at each location along a transect
perpendicular to the transmission centerlines.
The inputs to the program are data regarding voltage, current flow, phasing, and conductor
configurations. UI Transmission & Substation Engineering provided Exponent with data
regarding the conductor position, size, voltage, and phasing of the existing and proposed
circuits. The values of EMF associated with the transmission lines were calculated along
profiles perpendicular to the transmission lines at the point of lowest conductor sag (mid-span),
i.e., closest to the ground. The transmission line conductors were assumed to be positioned at
maximum sag for the entire distance between structures and over flat terrain. An overvoltage
condition of 5% was used for calculating electric fields from the transmission lines. These
modeling assumptions are made to ensure that the calculated values represent the maximum
expected EMF values for the cases analyzed. Distribution and catenary conductors operated by
the MNR were not included in the model in order to limit the assessment to Project-related
sources, rather than the intermittent exposure associated with the passage of trains on the New
Haven Line. A further discussion of the EMF from the MNR conductors is included in the Pre-
construction Measurements section, below.
Loading
UI Transmission Planning provided the pre- and post-Project loadings for the Baird to HRX
Line Upgrades Project. UI selected dispatches in such a way as to bias power flows through the
project area to maximize current flows on the north and south transmission lines associated with
the Project. The current flows used for modeling are summarized in a table available from
Exponent upon a request consistent with CEII restrictions.
UI is required by the CSC BMP to provide line loadings for “pre-project and post-project
conditions under:1) peak load level at the time of the application filing; and 2) at the projected
seasonal maximum 24-hour average load level anticipated within five years” of operational in
Attachment F

1700614.000 - 0110 11
service date. For peak load analysis, UI modeled the system to reflect the topology of New
England’s transmission system in the year 2017 (including projects with in-service date of Q2
2017 or earlier). In addition, the study year 2025 was selected to calculate 24-hour average load
level anticipated within five-years horizon from the in-service date of the Project.2 For either
load level, the loading of both the north and south circuits is anticipated to remain nearly
constant before and after operation of the Project.
Results and Discussion
Calculated electric-field profiles are depicted in Figures 2-6 for Sections HRXB-1 through
HRXB-5, respectively. Table 2 summarizes the calculated electric-field levels on the ROW,
ROW edges, and at locations 100 feet beyond the ROW edges. Calculated magnetic-field
profiles for average-loading conditions are depicted in Figures 7-12 for Sections HRXB-1
through HRXB-5, respectively.3 Table 3 summarizes the calculated magnetic-field levels for
the average-load case on the ROW, ROW edges, and 100 feet beyond the ROW edges. Table 4
includes the calculated magnetic-field levels at the same reporting locations for peak-load
conditions.
The loading of the north and south circuits is anticipated to remain nearly constant before and
after operation of the Project. Changes in the calculated electric and magnetic field levels
(Tables 2-4) therefore depend almost entirely on the elevation, separation, and centerline of the
repositioned conductors. With the exception of a few spans in Section HRXB-1 (south side)
and HRXB-3, existing circuits are relocated further away from the railroad tracks to new steel
monopoles. Two principal field changes are evident when considering the changes in calculated
magnetic field levels associated with operation of the Project:
2 As provided by UI transmission planning, the term “seasonal maximum 24-hour average” load level was
replaced by the term “peak daily average.” In this report, “average load” refers to this case. Given the increase
of projected loads throughout the region with time, the peak loads provided by UI Transmission Planning (for the
filing year 2017) are less than the average loads calculated for the year 2025 (5 years from the in-service date). 3 Two figures with calculated profiles for HRX-4 are provided. Figure 10 shows the calculated magnetic field
levels in Section HRXB-4 at locations southwest of the existing Barnum Substation. Figure 11 shows the
calculated profile for the same conductor positions in Section HRXB-4, using the transmission-line loading
northeast of the existing Barnum Substation.
Attachment F

1700614.000 - 0110 12
1) beneath the conductors of the repositioned circuits, the highest calculated
magnetic field is lower (compared to the existing configuration) because of the
higher conductor elevation of the repositioned conductors; and
2) at points further away from the north and south circuits, the calculated magnetic
field is higher (compared to the existing configuration), since the proposed
circuits are shifted laterally, away from the railroad.4
Because of these effects can offset one another, the calculated magnetic fields increase,
decrease, or remain approximately the same, depending on the configuration of the repositioned
circuits and their proximity to the ROW edge.
In Section HRXB-1, the north circuit is rebuilt on the existing ROW on new vertical monopoles.
At the north ROW edge, the operation of the Project increases the calculated magnetic field
level from approximately 40 mG (pre-construction) to 46 mG (post-construction) under
average-load conditions. At the south ROW edge at average load, the calculated magnetic field
decreases somewhat, from approximately 50 mG (pre-construction) to 40 mG (post-
construction). This decrease is due to the higher conductor elevation in the proposed
configuration of Section HRXB-1. The anticipated increase in calculated magnetic fields is
approximately the same under peak loading conditions, a 5 mG increase at the north ROW edge
and a 9 mG decrease on the south ROW edge.5 The calculated electric fields follow a similar
trend, increasing from 0.5 kV/m (pre-construction) to 0.7 kV/m (post-construction) at the north
ROW edge, and remaining approximately the same (0.6 kV/m) at the south ROW edge.
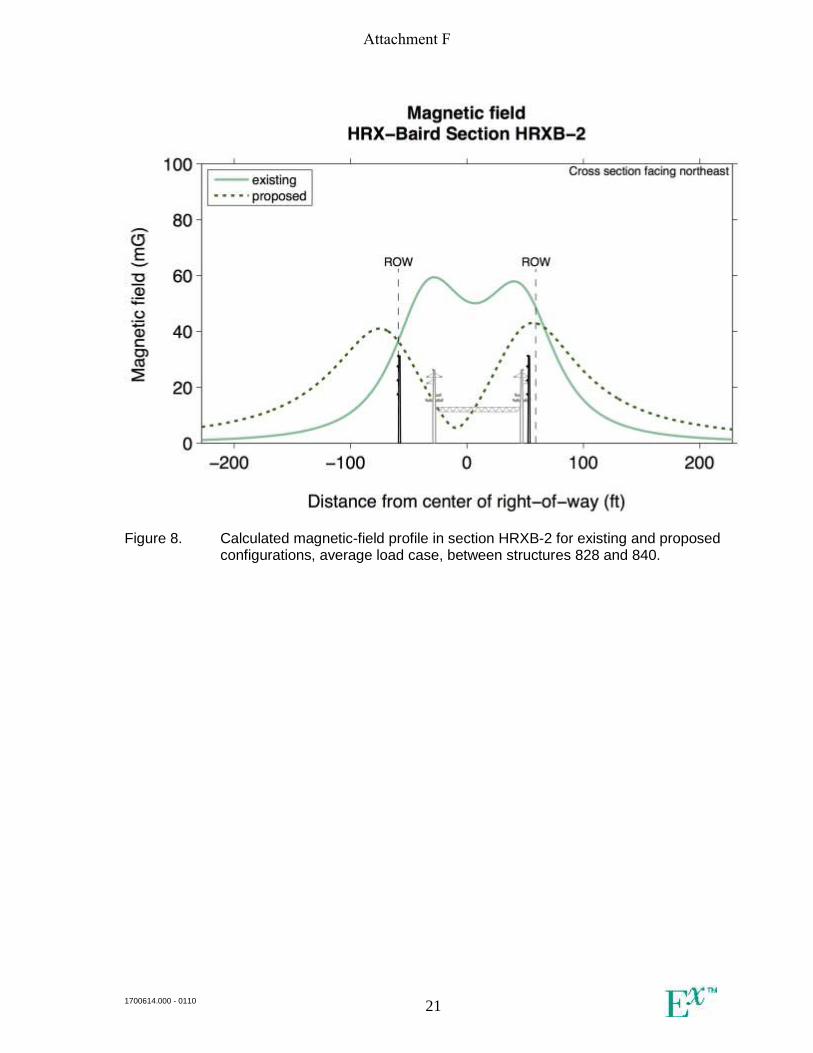
In Section HRXB-2, both the north and south circuits are rebuilt in a vertical configuration on
new monopoles within the existing ROW. At the ROW edges, the increase in calculated
4 Because of the shifted centerline, the extremities of the magnetic-field profiles shown in Figures 7-12 increase in
the proposed configuration compared to the existing configuration. For average load conditions at the 100 feet
north of the ROW, calculated magnetic fields are between 3-5 mG (pre-Project), and increase to levels between
10-16 mG. The calculated magnetic-field levels show a comparable increase (between 3-7 mG) at locations 100
feet south of the ROW at average load. 5 Compared to the results for average load, calculated magnetic-field levels for peak-load conditions are lower at
the ROW edges for both the existing and proposed configuration. This result is expected since the peak loads
provided by UI Transmission Planning (for the filing year 2017) are less than the average loads calculated for the
year 2025 (5 years from the in-service date).
Attachment F
1700614.000 - 0110 13
magnetic-field levels (due to the lateral shift of their centerlines) is offset by an increase in
conductor elevation (which tends to lower the calculated magnetic field). At the north ROW
edge, the calculated magnetic field remains nearly constant, approximately 37 mG for average-
load conditions and 32-33 mG for peak-load conditions. For both average- and peak-load
condition, the calculated magnetic field at the south ROW edge decreases somewhat (by 5-6
mG) with operation of the Project. Operation of the Project is anticipated to increase the ROW-
edge electric field, from approximately 0.4 kV/m (pre-construction) to 0.6 kV/m (post-
construction).
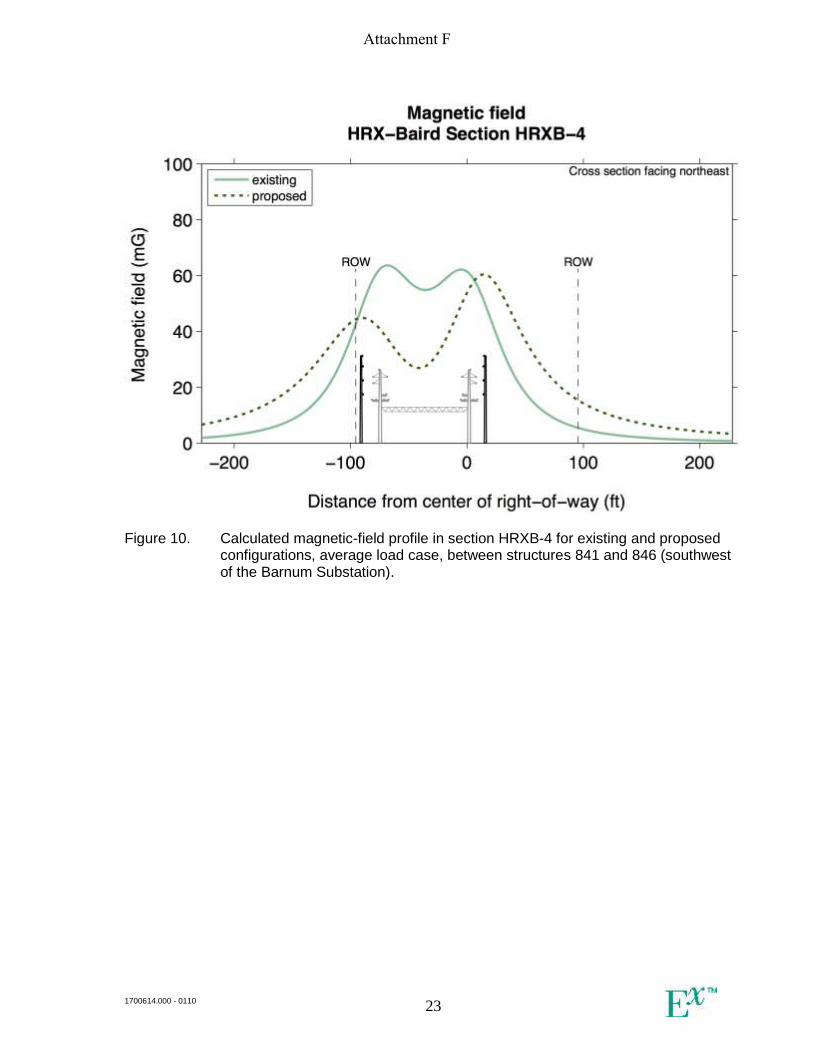
Section HRXB-4 has a configuration similar to Section HRXB-2, but the centerlines of existing
and proposed circuits are aligned closer to the north side of the existing ROW. As a result, the
increase in calculated magnetic-field levels (due to the lateral shift of the circuits) is more
pronounced at the south ROW edge. At the north ROW edge, the calculated magnetic field
remains nearly constant, approximately 42-44 mG for average-load conditions and 37-39 mG
for peak-load conditions. For average-load conditions, the calculated magnetic field at the south
ROW edge increases from approximately 5-6 mG (pre-construction) to 16-17 mG (post-
construction). The anticipated increase in calculated magnetic fields (10 mG) is approximately
the same at the south ROW edge under peak-loading conditions. Operation of the Project is
anticipated to increase the electric field at the north ROW edge, from approximately 0.4 kV/m
(pre-construction) to 0.6 kV/m (post-construction). At the south ROW edge—more the 80 feet
from the centerlines of existing and proposed circuits—the calculated electric field is quite low,
falling below 0.1 kV/m for the existing and proposed cases.
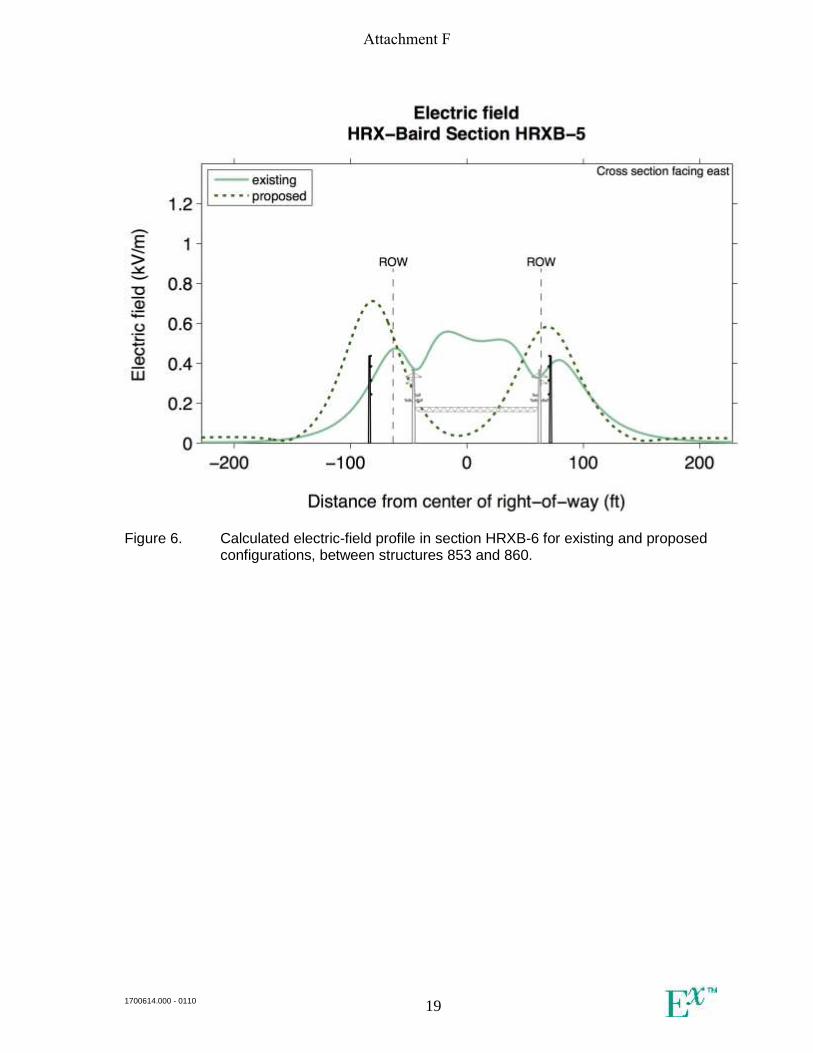
In Section HRXB-5, the existing circuits are rebuilt off of the raised railroad bed on proposed
structures north and south of the existing ROW and so evaluation of the magnetic-field level at
the ROW edge does elucidate the project-related changes far from the structures where people
are more likely to be present. The following discussion therefore focusses on field levels at 100
feet from the ROW edge. At locations 100 feet north of the existing ROW, the proposed Project
is anticipated to increase the calculated magnetic field from approximately 4.6 mG (pre-
construction) to 16 mG (post-construction) under average-load conditions. 100 feet south of the
existing ROW under average load, the calculated magnetic field increases from 6.4 mG (pre-
Attachment F

1700614.000 - 0110 14
construction) to 13 mG (post-construction). The anticipated increase in calculated magnetic
fields is approximately the same under peak loading conditions, a 6 mG increase 100 feet north
of the existing ROW and 20 mG increase 100 feet south of the existing ROW. The maximum
calculated electric field in the proposed position of the circuits is 0.7 kV/m, compared to
0.5 kV/m in the existing configuration.
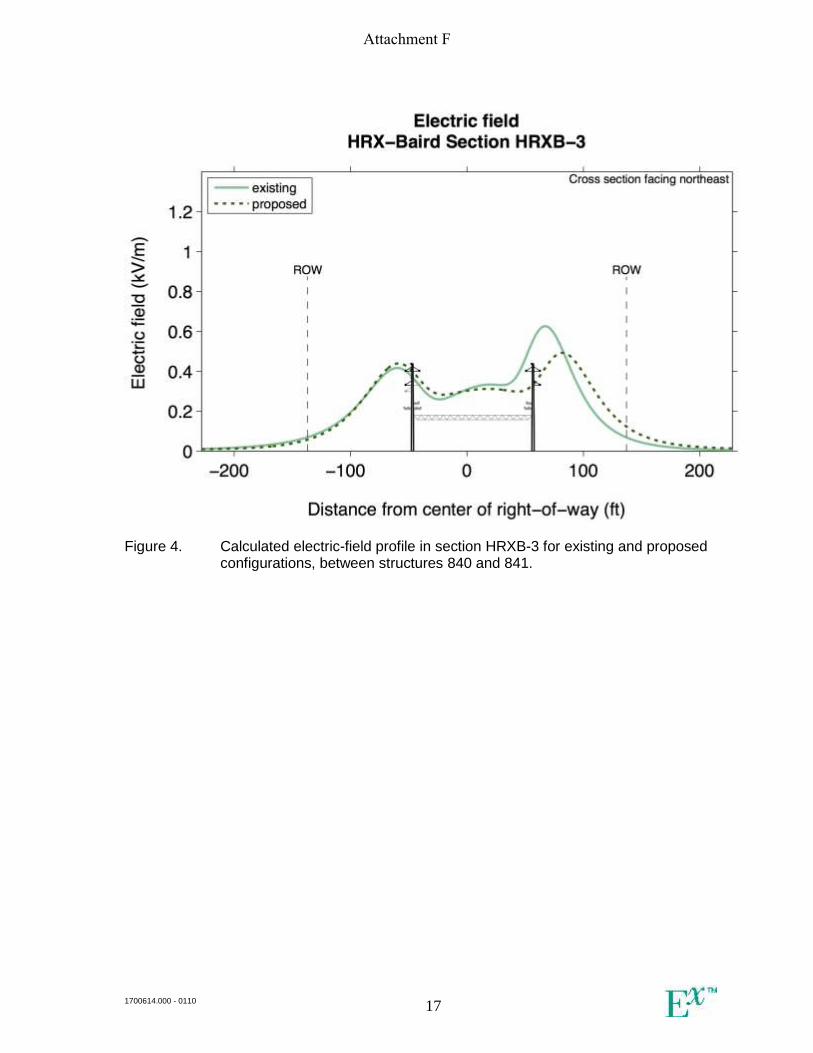
In Section HRXB-3 (encompassing the Stratford MNR Train Station), the centerline of the
repositioned circuits is more closely aligned with their existing centerlines. At the ROW edges,
the calculated electric fields remain approximately the same and are below 0.2 kV/m at the
ROW edges. The calculated magnetic fields also vary by smaller amounts in this span, increase
by 2-4 mG at the ROW edges for average- and peak-load conditions.
Attachment F

1700614.000 - 0110 15
Figure 2. Calculated electric-field profile in section HRXB-1 for existing and proposed configurations, between structures 826 and 828.
Attachment F

1700614.000 - 0110 16
Figure 3. Calculated electric-field profile in section HRXB-2 for existing and proposed configurations, between structures 828 and 840.
Attachment F
1700614.000 - 0110 17
Figure 4. Calculated electric-field profile in section HRXB-3 for existing and proposed configurations, between structures 840 and 841.
Attachment F

1700614.000 - 0110 18
Figure 5. Calculated electric-field profile in section HRXB-4 for existing and proposed configurations, between structures 841 and 853.
Attachment F
1700614.000 - 0110 19
Figure 6. Calculated electric-field profile in section HRXB-6 for existing and proposed configurations, between structures 853 and 860.
Attachment F

1700614.000 - 0110 20
Figure 7. Calculated magnetic-field profile in section HRXB-1 for existing and proposed configurations, average load case, between structures 826 and 828.
Attachment F
1700614.000 - 0110 21
Figure 8. Calculated magnetic-field profile in section HRXB-2 for existing and proposed configurations, average load case, between structures 828 and 840.
Attachment F

1700614.000 - 0110 22
Figure 9. Calculated magnetic-field profile in section HRXB-3 for existing and proposed configurations, average load case, between structures 840 and 841.
Attachment F
1700614.000 - 0110 23
Figure 10. Calculated magnetic-field profile in section HRXB-4 for existing and proposed configurations, average load case, between structures 841 and 846 (southwest of the Barnum Substation).
Attachment F

1700614.000 - 0110 24
Figure 11. Calculated magnetic-field profile in section HRXB-4 for existing and proposed configurations, average load case, between structures 847 and 853 (northeast of the Barnum Substation).
Attachment F

1700614.000 - 0110 25
Figure 12. Calculated magnetic-field profile in section HRXB-5 for existing and proposed configurations, average load case, between structures 853 and 860.
Attachment F
1700614.000 - 0110 26
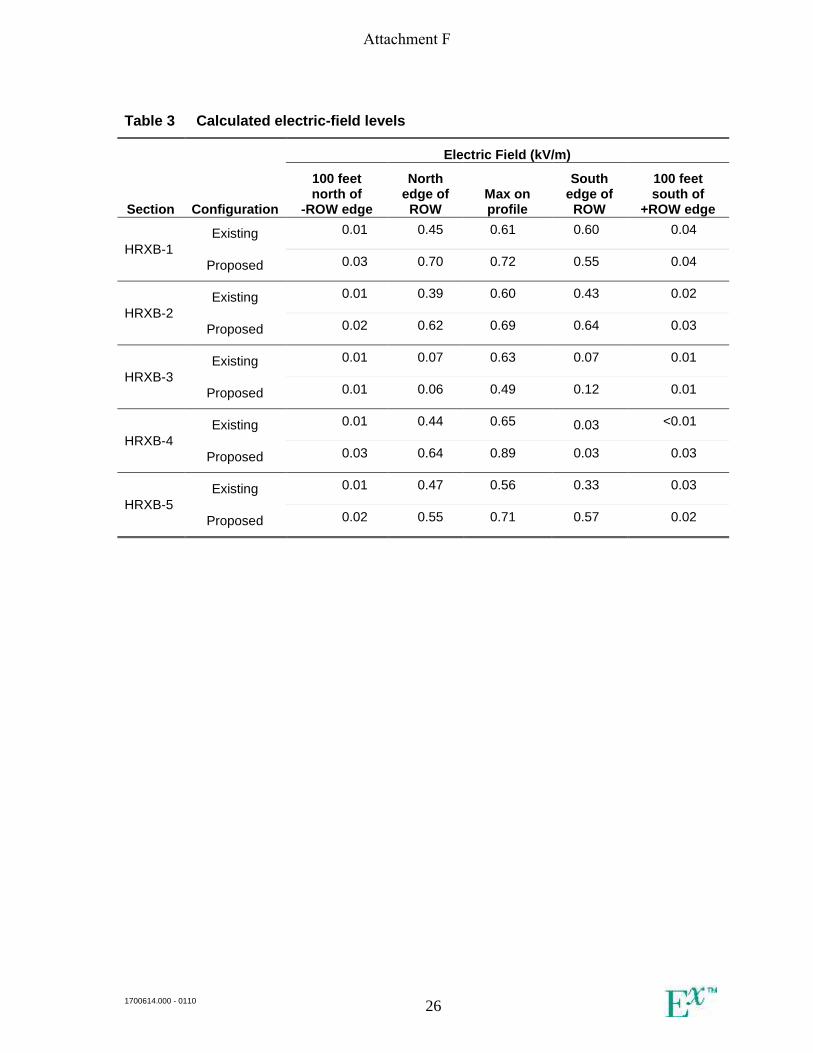
Table 3 Calculated electric-field levels
Section Configuration
Electric Field (kV/m)
100 feet north of
-ROW edge
North edge of ROW
Max on profile
South edge of ROW
100 feet south of
+ROW edge
HRXB-1
Existing 0.01 0.45 0.61 0.60 0.04
Proposed 0.03 0.70 0.72 0.55 0.04
HRXB-2
Existing 0.01 0.39 0.60 0.43 0.02
Proposed 0.02 0.62 0.69 0.64 0.03
HRXB-3
Existing 0.01 0.07 0.63 0.07 0.01
Proposed 0.01 0.06 0.49 0.12 0.01
HRXB-4
Existing 0.01 0.44 0.65 0.03 <0.01
Proposed 0.03 0.64 0.89 0.03 0.03
HRXB-5
Existing 0.01 0.47 0.56 0.33 0.03
Proposed 0.02 0.55 0.71 0.57 0.02
Attachment F

1700614.000 - 0110 27
Table 4 Calculated magnetic-field levels, average-load case
Section Configuration
Magnetic Field (mG)
100 feet north of
-ROW edge
North edge of ROW
Max on profile
South edge of ROW
100 feet south of
+ROW edge
HRXB-1
Existing 3.1 40.1 72.5 49.6 5.7
Proposed 10.3 46.0 46.1 39.7 9.1
HRXB-2
Existing 3.1 36.7 59.4 48.7 3.8
Proposed 13.3 36.5 43.1 43.0 10.5
HRXB-3
Existing 1.9 7.8 53.5 10.4 2.2
Proposed 2.7 9.2 36.7 14.6 3.5
HRXB-4
Existing 3.2 42.1 63.6 5.5 1.1
Proposed 9.9 44.2 60.4 15.5 4.4
HRXB-4 (north of Barnum)
Existing 3.5 46.2 69.8 6.1 1.2
Proposed 10.8 48.6 66.3 17.0 4.8
HRXB-5
Existing 4.7 54.7 70.1 62.3 6.4
Proposed 16.0 41.1 49.7 37.4 12.9
Table 5 Calculated magnetic-field levels, peak-load case
Section Configuration
Magnetic Field (mG)
100 feet north of
-ROW edge
North edge of ROW
Max on profile
South edge of ROW
100 feet south of
+ROW edge
HRXB-1
Existing 2.7 35.6 64.5 44.1 5.1
Proposed 9.1 40.8 40.9 35.3 8.0
HRXB-2
Existing 2.7 32.6 52.8 43.3 3.4
Proposed 11.8 32.3 38.3 38.2 9.3
HRXB-3
Existing 1.7 6.9 47.5 9.2 1.9
Proposed 2.4 8.2 32.6 12.9 3.1
Attachment F

1700614.000 - 0110 28
Section Configuration
Magnetic Field (mG)
100 feet north of
-ROW edge
North edge of ROW
Max on profile
South edge of ROW
100 feet south of
+ROW edge
HRXB-4
Existing 2.8 37.4 56.6 4.9 1.0
Proposed 8.8 39.3 53.7 13.8 3.9
HRXB-4 (north of Barnum)
Existing 3.2 41.7 63.1 5.5 1.1
Proposed 9.8 43.8 59.7 15.3 4.4
HRXB-5
Existing 4.2 49.4 63.3 56.3 5.8
Proposed 14.4 37.1 44.9 33.7 11.6
Pre-construction measurements
In order to characterize the EMF prior to operation of the Project, existing conditions were
measured on March 9, 2017. The measurements were taken at a height of 1 meter (3.28 feet)
above ground in accordance with the standard methods for measuring near power lines (IEEE
Std. 644-1994a). Both electric and magnetic fields were expressed as the total field computed
as the resultant of field vectors measured along vertical, transverse, and longitudinal axes.6 The
electric field was measured in units of kV/m with a single-axis field sensor and meter
manufactured by Enertech Consultants. The magnetic field was measured in units of mG by
orthogonally-mounted sensing coils whose output was logged by a digital recording meter
(EMDEX II) manufactured by Enertech Consultants. These instruments meet the Institute of
Electrical and Electronics Engineers (IEEE) instrumentation standard for obtaining accurate
field measurements at power line frequencies (IEEE Std.1308-1994b). The meters were
calibrated by the manufacturer by methods like those described in IEEE Std. 644-1994a.
The locations of point measurements recorded in the vicinity of the project are depicted in
Figure 13, overlaid on the project route. EMF readings at these locations are summarized in
Table 6. The MNR New Haven Line includes a 12.6-kV, 60-Hz catenary system that powers
6 Measurements along the vertical, transverse, and longitudinal axes were recorded as root-mean-square
magnitudes. Root mean square refers to the common mathematical method of defining the effective voltage,
current, or field of an AC system.
Attachment F

1700614.000 - 0110 29
some rolling stock, and magnetic fields in the vicinity of the tracks would be expected to exhibit
variation with traction load during periods of train acceleration. The readings in Table 6
represent steady-state EMF readings, which were observed to fluctuate with the passage of east-
and west-bound trains.
Figure 13. Map of the proposed route between HRX and the Baird Substation, showing measurement locations A-L
Attachment F

1700614.000 - 0110 30
Table 6. Measured magnetic fields at measurement locations A-L
Location Section Address
Distance from ROW edge (ft)
Measured magnetic field (mG)
Min Mean Max
A HRXB-2 Miranda Ln. condominiums 60 0.74 1.10 1.54
B HRXB-2 Gas Station/Offices 1290 W Broad St
30 1.23 1.52 1.86
C HRXB-2 Sterling House Comm. Ctr. 2283 Main St
700 0.18 0.44 0.49
D HRXB-2 1
st Congregational Church
2301 Main St 470 0.11 0.17 0.26
E HRXB-3 Stratford Board of Ed. 1000 E Broadway
480 0.66 0.75 0.83
F HRXB-2 Stationhouse Sq. Shops 2505 Main St
120 0.49 0.57 0.72
G HRXB-3 Stratford High School 920 0.31 0.40 0.43
H HRXB-4 Union Cemetery 150 0.14 0.33 0.64
I HRXB-3 Stratford MNR Station 0 2.62 2.84 3.13
J HRXB-4* 99 Restaurant 411 Barnum Ave. Cutoff
170 0.26 0.51 0.82
K HRXB-4* Home Depot 350 Barnum Ave. Cutoff
220 0.11 0.21 0.34
L HRXB-5 Boardwalk Marina Barnum Ave. Cutoff
120 0.96 1.18 1.42
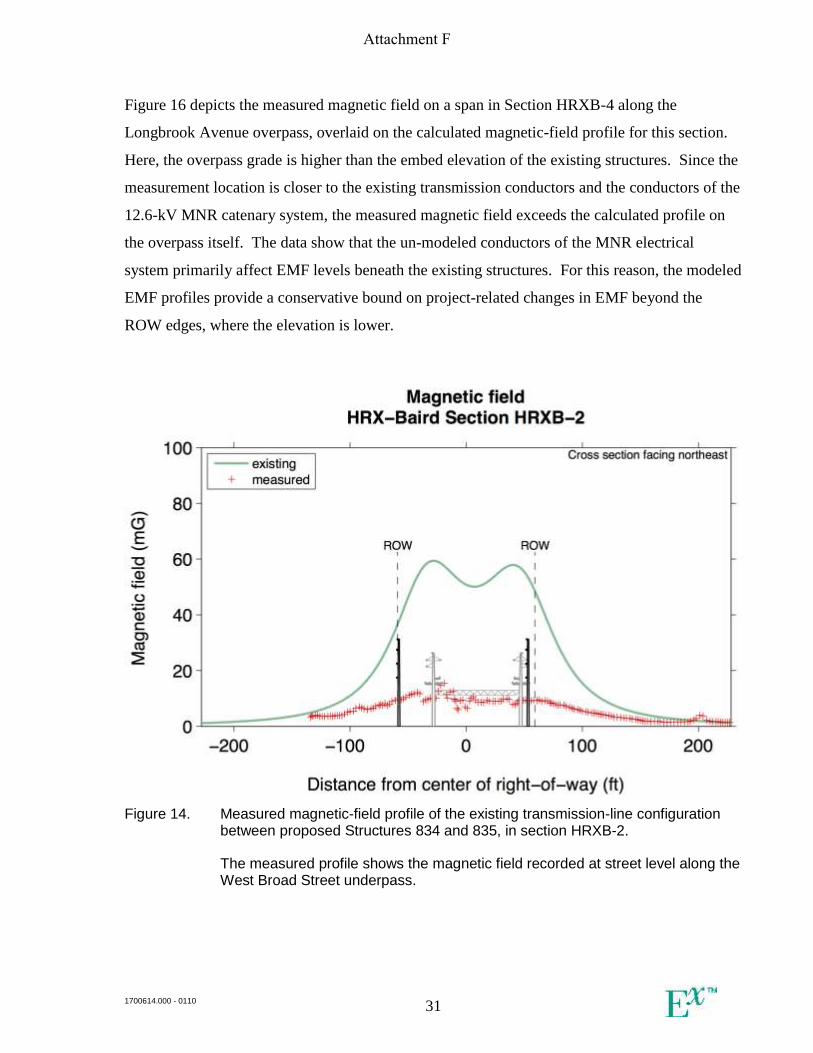
Figure 14 depicts the measured magnetic field on a span in Section HRXB-2 along the West
Broad Street underpass, overlaid on the calculated magnetic-field profile for this section. Figure
15 shows a similar comparison, recorded in the Main Street underpass adjacent to the Stratford
MNR Train Station. Figure 17 likewise show an overlay of measured and calculated profiles,
with readings recorded along the East Main Street/Route 110 underpass in Section HRXB-5.
Along the sidewalks and street passing beneath the Project, the measured magnetic fields are
lower than the calculated profile, since the sidewalk and street level is below the Project grade.
Attachment F
1700614.000 - 0110 31
Figure 16 depicts the measured magnetic field on a span in Section HRXB-4 along the
Longbrook Avenue overpass, overlaid on the calculated magnetic-field profile for this section.
Here, the overpass grade is higher than the embed elevation of the existing structures. Since the
measurement location is closer to the existing transmission conductors and the conductors of the
12.6-kV MNR catenary system, the measured magnetic field exceeds the calculated profile on
the overpass itself. The data show that the un-modeled conductors of the MNR electrical
system primarily affect EMF levels beneath the existing structures. For this reason, the modeled
EMF profiles provide a conservative bound on project-related changes in EMF beyond the
ROW edges, where the elevation is lower.
Figure 14. Measured magnetic-field profile of the existing transmission-line configuration between proposed Structures 834 and 835, in section HRXB-2.
The measured profile shows the magnetic field recorded at street level along the West Broad Street underpass.
Attachment F

1700614.000 - 0110 32
Figure 15. Measured magnetic-field profile of the existing transmission-line configuration in the vicinity of the Stratford MNR Train Station.
The existing profile shows the calculated magnetic field between Structures 840 and 841 in section HRXB-3. The measured magnetic field was recorded at street level along the Main Street underpass between Structures 839 and 840.
Attachment F

1700614.000 - 0110 33
Figure 16. Measured magnetic-field profile of the existing transmission-line configuration between proposed Structures 848 and 849, northeast of the Barnum Substation.
The measured profile shows the magnetic field recorded at street level along the Longbrook Avenue overpass.
Attachment F

1700614.000 - 0110 34
Figure 17. Measured magnetic-field profile of the existing transmission-line configuration between proposed Structures 856 and 857, in section HRXB-5.
The measured profile shows the magnetic field recorded at street level along the East Main Street/Route 110 underpass.
Attachment F
1700614.000 - 0110 35
References
Bonneville Power Administration (BPA). Corona and Field Effects Computer Program.
Portland, OR: Bonneville Power Administration, 1991.
Connecticut Siting Council (CSC). Electric and Magnetic Field Best Management Practices for
the Construction of Electric Transmission Lines in Connecticut. December 14, 2007 (2007).
Connecticut Siting Council (CSC). Petition 754 - Best Management Practices for Electric and
Magnetic Fields. February 14, 2014.
International Agency for Research on Cancer (IARC). IARC Monographs on the evaluation of
carcinogenic risks to humans. Volume 80: Static and Extremely Low-Frequency (ELF) Electric
and Magnetic Fields. IARC Press. Lyon, France, 2002.
Institute of Electrical and Electronics Engineers (IEEE). IEEE standard procedures for
measurement of power frequency electric and magnetic fields from AC power lines. IEEE
Standard 644-1994 (Revision of IEEE Standard 644-1987), 1994a.
Institute of Electrical and Electronics Engineers (IEEE). IEEE recommended practice for
instrumentation: specifications for magnetic flux density and electric field strength meters-10
Hz to 3 kHz. IEEE Standard 1308-1994, 1994b.
Institute of Electrical and Electronics Engineers (IEEE). IEEE recommended practice for
measurements and computations of electric, magnetic, and electromagnetic fields with respect to
human exposure to such fields, 0 Hz to 100 kHz. IEEE Standard C95.3.1-2010, 2010.
International Committee on Electromagnetic Safety (ICES). IEEE Standard for Safety Levels
with Respect to Human Exposure to Electromagnetic Fields 0 to 3 kHz. Piscataway, NJ: IEEE,
2002.
International Commission on Non-ionizing Radiation Protection (ICNIRP). ICNIRP
Statement—Guidelines for limiting exposure to time-varying electric and magnetic fields (1 Hz
to 100 kHz). Health Physics 99:818-836, 2010.
World Health Organization (WHO). Environmental Health Criteria 238: Extremely Low
Frequency (ELF) Fields. WHO, Geneva, Switzerland, ISBN 978-92-4-157238-5, 2007.
Scientific Committee on Emerging and Newly Identified Health Risks (SCENIHR). Opinion on
Potential Health Effects of Exposure to Electromagnetic Fields (EMF). Brussels, Belgium:
European Commission, 2015.
Attachment F