attachment l isolation pilot... · web viewmeasured versus modeled scatter plot diagram frequency...
TRANSCRIPT

ATTACHMENT L
WIPP GROUNDWATER DETECTION MONITORING PROGRAM PLAN
1
23

Waste Isolation Pilot PlantHazardous Waste PermitDecember 2017
(This page intentionally blank)
1234
1

Waste Isolation Pilot PlantHazardous Waste Permit
December 2017
ATTACHMENT L
WIPP GROUNDWATER DETECTION MONITORING PROGRAM PLAN
TABLE OF CONTENTS
L-1 Introduction........................................................................................................................1L-1a Geologic and Hydrologic Characteristics...............................................................2
L-1a(1) Geology................................................................................................2L-1a(2) Ground-water Hydrology......................................................................3
L-1a(2)(i) The Castile.....................................................................3L-1a(2)(ii) The Salado.....................................................................3L-1a(2)(iii) The Rustler.....................................................................4
L-2 General Regulatory Requirements....................................................................................7
L-3 WIPP Groundwater Detection Monitoring Program (DMP)—Overview.............................8L-3a Scope.....................................................................................................................8L-3b Current WIPP DMP................................................................................................8
L-3b(1) Detection Monitoring Well Construction Specification..........................9
L-4 Monitoring Program Description........................................................................................9L-4a Monitoring Frequency............................................................................................9L-4b Analytical Parameters and Hazardous Constituents..............................................9L-4c Groundwater Surface Elevation Measurement, Sample Collection and
Laboratory Analysis..............................................................................................10L-4c(1) Groundwater Surface Elevation Monitoring Methodology..................10
L-4c(1)(i) Field Methods and Data Collection Requirements...............................................................11
L-4c(1)(ii) Groundwater Surface Elevation Records and Document Control........................................................11
L-4c(2) Groundwater Sampling.......................................................................12L-4c(2)(i) Groundwater Pumping and Sampling Systems............12L-4c(2)(ii) Serial Samples.............................................................12L-4c(2)(iii) Final Samples...............................................................13L-4c(2)(iv) Sample Preservation, Tracking, Packaging, and
Transportation..............................................................14L-4c(2)(v) Sample Documentation and Custody...........................15
L-4c(3) Laboratory Analysis............................................................................16L-4d Calibration............................................................................................................17
L-4d(1) Sampling and Groundwater Elevation Monitoring Equipment Calibration..........................................................................................17
L-4d(2) Groundwater Surface Elevation Monitoring Equipment Calibration Requirements...................................................................17
L-4e Statistical Analysis of Laboratory Analytical Data................................................17L-4e(1) Temporal and Spatial Analysis...........................................................17L-4e(2) Distributions and Descriptive Statistics..............................................18L-4e(3) Action Levels......................................................................................18L-4e(4) Comparisons and Reporting...............................................................18
PERMIT ATTACHMENT LPage L-i
1234
1
23
4
56789
1011
12
13141516
17181920212223242526272829303132333435363738394041424344

Waste Isolation Pilot PlantHazardous Waste PermitDecember 2017
L-5 Reporting.........................................................................................................................18L-5a Laboratory Data Reports......................................................................................18L-5b Statistical Analysis and Reporting of Results.......................................................19L-5c Annual Cuelbra Groundwater Report...................................................................19
L-6 Records Management......................................................................................................21
L-7 Quality Assurance Requirements....................................................................................21L-7a Data Quality Objectives and Quality Assurance Objectives.................................21
L-7a(1) Data Quality Objectives......................................................................31L-7a(1)(i) Detection Monitoring Program......................................31L-7a(1)(ii) Water Level Monitoring Program..................................31
L-7a(2)Quality Assurance Objectives..............................................................................31L-7a(2)(i) Accuracy.............................................................................................22L-7a(2)(ii) Precision.............................................................................................23L-7a(2)(iii) Contamination....................................................................................23L-7a(2)(iv) Completeness.....................................................................................23L-7a(2)(v) Representativeness............................................................................24L-7a(2)(vi) Comparability......................................................................................24
L-7b Design Control.....................................................................................................24L-7c Instructions, Procedures, and Drawings..............................................................24L-7d Document Control................................................................................................24L-7e Inspection and Surveillance.................................................................................25L-7f Control of Monitoring and Data Collection Equipment.........................................25L-7g Control of Nonconforming Conditions..................................................................25L-7h Corrective Action..................................................................................................25L-7i Quality Assurance Records..................................................................................25
L-8 References.......................................................................................................................26
PERMIT ATTACHMENT LPage L-ii
1234
1234
5
6789
10111213141516171819202122232425
26

Waste Isolation Pilot PlantHazardous Waste Permit
December 2017
LIST OF TABLES
Table Title
Table L-1 Hydrological Parameters for Rock Units above the Salado at WIPPTable L-2 WIPP Groundwater Detection Monitoring Program Sample Collection and
Groundwater Surface Elevation Measurement FrequencyTable L-3 Standard Operating Procedures Applicable to the DMPTable L-4 List of Culebra Wells in the WLMP, Current as of February 2014Table L-5 Details of Construction for the Six Culebra Detection Monitoring WellsTable L-6 Analytical Parameter and Sample Requirements
LIST OF FIGURES
Figure Title
Figure L-1 General Location of the WIPP FacilityFigure L-2 WIPP Facility Boundaries Showing 16-Square-Mile Land Withdrawal BoundaryFigure L-3 Site Geologic ColumnFigure L-4 Generalized Stratigraphic Cross Section above Bell Canyon Formation at WIPP
SiteFigure L-5 Culebra Freshwater-Head Potentiometric SurfaceFigure L-6 Detection Monitoring Well LocationsFigure L-7 As-Built Configuration of Well WQSP-1Figure L-8 As-Built Configuration of Well WQSP-2Figure L-9 As-Built Configuration of Well WQSP-3Figure L-10 As-Built Configuration of Well WQSP-4Figure L-11 As-Built Configuration of Well WQSP-5Figure L-12 As-Built Configuration of Well WQSP-6Figure L-13 Example Chain-of-Custody RecordFigure L-14 Groundwater Level Surveillance Wells (insert represents the groundwater
surveillance wells in WIPP Land Withdrawal Area)
PERMIT ATTACHMENT LPage L-iii
1234
1
2
3456789
10
11
12
13141516171819202122232425262728

Waste Isolation Pilot PlantHazardous Waste PermitDecember 2017
LIST OF ABBREVIATIONS/ACRONYMS/UNITS
Bell Canyon Bell Canyon Formationbgs below ground surface
Castile Castile Formationcm centimeter(s)Culebra Culebra Member of the Rustler FormationCofC/RFA chain of custody/request for analysis°C degree(s) Celsius%C percent completeness
Dewey Lake Dewey Lake Redbeds FormationDI deionizedDMP Detection Monitoring ProgramDMW Detection Monitoring WellDOE U.S. Department of EnergyDQO data quality objectives
EPA U.S. Environmental Protection Agencyft foot (feet)ft2 square foot (square feet)
g/cm3 gram(s) per cubic centimeterHWDU hazardous waste disposal unit(s)
km kilometer(s)km2 square kilometer(s)
lb/in.2 pound(s) per square inchLCS laboratory control samplesLCSD lab control sample duplicateLos Medaños Los Medaños Member of the Rustler FormationLWA Land Withdrawal Act
m meter(s)M&DC monitoring and data collectionm2 square meter(s)Magenta Magenta Member of the Rustler Formationmg/L milligram(s) per litermi mile(s)mi2 square mile(s)molal moles per kilogramMOC Management and Operating ContractorMPa megapascal(s)mV millivolt(s)
NIST National Institute for Standards and TechnologyNMAC New Mexico Administrative CodeNMED New Mexico Environment Department
PERMIT ATTACHMENT LPage L-iv
1234
1
23
456789
101112131415
161718
1920
2122
2324252627
2829303132333435363738
394041
Waste Isolation Pilot PlantHazardous Waste Permit
December 2017
QA Quality AssuranceQA/QC quality assurance/quality controlQAO Quality Assurance ObjectiveQC quality control
PABC Performance Assessment Baseline Calculation
RCRA Resource Conservation and Recovery ActRPD relative percent differenceRustler Rustler Formation%R percent recovery
Salado Salado FormationSAP Sampling and Analysis PlansSC specific conductanceSOP Standard Operating ProcedureTDS total dissolved solidsTOC total organic carbonTRU transuranicTSDF treatment, storage, and disposal facilitiesUTLV upper tolerance limit value
VOC volatile organic compound
WIPP Waste Isolation Pilot PlantWLMP WIPP Groundwater Level Monitoring Programμg/L microgram(s) per literμm micrometers
PERMIT ATTACHMENT LPage L-v
1234
1234
5
6789
101112131415161718
19
20212223
Waste Isolation Pilot PlantHazardous Waste PermitDecember 2017
(This page intentionally blank)
PERMIT ATTACHMENT LPage L-vi
1234
12

Waste Isolation Pilot PlantHazardous Waste Permit
December 2017
ATTACHMENT L
WIPP GROUNDWATER DETECTION MONITORING PROGRAM PLAN
L-1 Introduction
The Waste Isolation Pilot Plant (WIPP) facility is subject to regulation under Title 20 of the New Mexico Administrative Code (NMAC), Chapter 4, Part 1, Subpart V (20.4.1.500 NMAC). As required by 20.4.500 NMAC (incorporating 40 CFR §264.601), the Permittees shall demonstrate that the environmental performance standards for a miscellaneous unit, which are applied to the hazardous waste disposal units (HWDUs) in the underground, will be met.
The WIPP facility is located in Eddy County in southeastern New Mexico (Figure L-1), within the Pecos Valley section of the southern Great Plains physiographic province. The facility is 26 miles (mi) (42 kilometers [km]) east of Carlsbad, New Mexico, in an area known as Los Medaños (the dunes). Los Medaños is a relatively flat, sparsely inhabited plateau with little water and limited land uses.
The WIPP facility (Figure L-2) consists of 16 sections of Federal land in Township 22 South, Range 31 East. The 16 sections of Federal land were withdrawn from the application of public land laws by the WIPP Land Withdrawal Act (LWA), Public Law 102-579. The WIPP LWA transferred the responsibility for the administration of the 16 sections from the Department of Interior, Bureau of Land Management, to the U.S. Department of Energy (DOE). This law specified that mining and drilling for purposes other than support of the WIPP project are prohibited within this 16 section area with the exception of Section 31. Oil and gas drilling activities are restricted in Section 31 from the surface down to 6,000 feet.
The WIPP facility includes a mined geologic repository for the disposal of transuranic (TRU) waste. The disposal horizon is located 2,150 feet (ft) (655 meters [m]) below the land surface in the bedded salt of the Salado Formation (Salado). At the WIPP facility, water-bearing units occur both above and below the disposal horizon. Groundwater monitoring of the uppermost aquifer below the facility is not required because the water-bearing unit (the Bell Canyon Formation (Bell Canyon)) is not considered a credible pathway for a release from the repository. This is because the repository horizon and water-bearing sandstones of the Bell Canyon are separated by over 2,000 ft (610 m) of very low-permeability evaporite sediments (Amended Renewal Application Addendum L1 (DOE, 2009)). No natural credible pathway has been established for contaminant transport to water-bearing zones below the repository horizon, as there is no hydrologic communication between the repository and underlying water-bearing zones. The U.S. Environmental Protection Agency (EPA) concluded in 1990 that natural vertical communication does not exist based on review of numerous studies (EPA, 1990). Furthermore, drilling boreholes for groundwater monitoring through the Salado and the Castile Formation (Castile) into the Bell Canyon would compromise the isolation properties of the repository medium.
Groundwater monitoring at the WIPP facility focuses on the Culebra Member (Culebra) of the Rustler Formation (Rustler) because it represents the most significant hydrologic contaminant migration pathway to the accessible environment. The Culebra is the most significant water-bearing unit lying above the repository. Groundwater movement in the Culebra, using results
PERMIT ATTACHMENT LPage L-1 of 53
1234
1
23
4
56789
1011121314
1516171819202122
23242526272829303132333435363738
39404142
Waste Isolation Pilot PlantHazardous Waste PermitDecember 2017
from the basin-scale groundwater model is discussed in detail in Amended Renewal Application Addendum L1, Section L1-2a, (DOE, 2009).
This monitoring plan addresses requirements for sample collection, Culebra groundwater surface elevation monitoring, Culebra groundwater flow direction and rate determination, data management, and reporting of Culebra groundwater monitoring data. It also identifies indicator parameters and hazardous constituents selected to assess Culebra groundwater quality for the WIPP groundwater detection monitoring program (DMP). Because quality assurance is an integral component of the groundwater sampling, analysis, and reporting process, quality assurance/quality control (QA/QC) elements and associated data acceptance criteria are included in this plan.
Instructions for performing field activities that will be conducted in conjunction with this DMP are provided in the WIPP Standard Operating Procedures (SOPs) (see Table L-3), which are maintained in facility files and which comply with the applicable requirements of 20.4.1.500 NMAC (incorporating 40 CFR § 264.97 (d)). Procedures are required for each aspect of the Culebra groundwater sampling process, including Culebra groundwater surface elevation measurement, Culebra groundwater flow direction and rate determination, sampling equipment installation and operation, field water-quality measurements, and sample collection. Data required by this plan will be collected by qualified personnel in accordance with SOPs (Table L-3).
L-1a Geologic and Hydrologic Characteristics
L-1a(1) Geology
The WIPP facility is situated within the Delaware Basin bounded to the north and east by the Capitan Reef, which is part of the larger Permian Basin, located in the south-central region of North America. Three major evaporite-bearing formations were deposited in the Delaware Basin (see Figures L-3 and L-4 and Amended Renewal Application Addendum L1, Section L1-1 (DOE, 2009) for more detail):
The Castile consists of interbedded anhydrites and halite. Its upper boundary is at a depth of about 2,825 ft (861 m) below ground surface (bgs), and its thickness at the WIPP facility is 1,250 ft (381 m).
The repository is located in the Salado, which overlies the Castile and resulted from prolonged desiccation that produced predominantly halite, with some carbonates, anhydrites, and clay seams. Its upper boundary is at a depth of about 850 ft (259 m) bgs, and it is about 2,000 ft (610 m) thick in the repository area.
The Rustler Formation was deposited in a lagoonal environment during a major freshening of the basin and consists of carbonates, anhydrites, and halites. Its beds consist of clay and anhydrite and contain small amounts of brine. The Rustler’s upper boundary is about 500 ft (152 m) bgs, and it ranges up to 350 ft (107 m) in thickness in the repository area.
These evaporite-bearing formations lie between two other formations significant to the geology and hydrology of the WIPP facility. The Dewey Lake Redbeds Formation (Dewey Lake) overlying the Rustler is dominated by nonmarine sediments and consists almost entirely of
PERMIT ATTACHMENT LPage L-2 of 53
1234
12
3456789
10
111213141516171819
20
21
2223242526
272829
30313233
3435363738
394041

Waste Isolation Pilot PlantHazardous Waste Permit
December 2017
mudstone, claystone, siltstone, and interbedded sandstone (see Amended Renewal Application Addendum L1, Section L1-1c(6) (DOE, 2009)). This formation forms a 500-ft- (152-m) thick barrier of fine-grained sediments that retard the downward percolation of water into the evaporite units below. The Bell Canyon is the first water-bearing unit below the repository (see Amended Renewal Application Addendum L1, Section L1-1c(2) (DOE, 2009)) and is confined above by the thick evaporite deposits of the Castile. It consists of 1,200 ft (366 m) of interbedded sandstone, shale, and siltstone.
The Salado was selected to host the WIPP repository for several reasons. First, it is regionally extensive, underlying an area of more than 36,000 square mi (mi2) (93,240 square kilometers [km2]). Second, its permeability is extremely low. Third, salt behaves mechanically in a plastic manner under pressure (the lithostatic pressure at the disposal horizon is approximately 2,200 pounds per square inch [lb/in.2] or 14.9 megapascals [MPa]) and eventually deforms to fill any opening (referred to as creep). Fourth, any fluid remaining in small fractures or openings is saturated with salt, is incapable of further salt dissolution, and has probably remained in place since deposition. Finally, the Salado lies between the Rustler and the Castile (Figure L-4), which contain very low permeability layers that help confine and isolate waste within and keep water outside of the WIPP repository (see Amended Renewal Application Addendum L1, Section L1-1c(5) and L1-1c(3) (DOE, 2009)).
L-1a(2) Groundwater Hydrology
The general hydrogeology of the area surrounding the WIPP facility is described in this section starting with the first geologic unit below the Salado. Addendum L1, Section L1-2a of the Amended Renewal Application (DOE, 2009) provides more detailed discussions of the local and regional hydrogeology. Relevant hydrological parameters for the various rock units above the Salado at WIPP are summarized in Table L-1.
L-1a(2)(i) The Castile
The Castile is a basin-filling evaporite sequence of sediments surrounded by the Capitan Reef. The Castile represents a major regional groundwater aquitard that effectively prevents upward migration of water from the underlying Bell Canyon. Fluid present in the Castile is very restricted because evaporites do not readily maintain pore space, solution channels, or open fractures at depth. Drill-stem tests conducted in the Castile during construction of the WIPP facility determined its permeability to be lower than detection limits; however, the hydraulic conductivity has been conservatively estimated to be less than 10-8 ft (3 10-9 m) per day. A description of the Castile brine reservoirs outside the WIPP facility area is provided in Addendum L1, Section L1-2a(2)(b) of the Amended Renewal Application (DOE, 2009).
L-1a(2)(ii) The Salado
The Salado is an evaporite sequence that filled the remainder of the Delaware Basin and lapped extensively over the Capitan Reef and the back-reef sediments beyond. The Salado consists of approximately 2,000 ft (610 m) of bedded halite, with interbeds or seams of anhydrite, clay, and polyhalite. It acts hydrologically as a regional confining bed. The porosity of the Salado is very low and naturally interconnected pores are probably nonexistent in halite at the depth of the disposal horizon. Fluids associated with the Salado occur mainly as very small fluid inclusions in the halite crystals and also occur between crystal boundaries (interstitial fluid) of the massive crystalline salt formation; fluids also occur in clay seams and anhydrite beds. Permeabilities
PERMIT ATTACHMENT LPage L-3 of 53
1234
1234567
89
101112131415161718
19
2021222324
25
262728293031323334
35
3637383940414243
Waste Isolation Pilot PlantHazardous Waste PermitDecember 2017
measured from the surface in the area of the WIPP facility range from 0.01 to 25 microdarcies. The most reliable value, 0.3 microdarcy, was obtained from well DOE-2. The results of permeability testing at the disposal horizon are within the range of 0.001 to 0.01 microdarcy.
L-1a(2)(iii) The Rustler
The Rustler has been the subject of extensive characterization activities because it contains the most transmissive hydrologic units overlying the Salado. Within the Rustler, five members have been identified. Of these, the Culebra is the most transmissive and has been the focus of most of the Rustler hydrologic studies.
The Culebra is the first continuous water-bearing zone above the Salado and is up to approximately 30 ft (9 m) thick. Water in the Culebra is usually present in fractures and is confined by overlying gypsum or anhydrite and underlying clay and anhydrite beds. The hydraulic gradient within the Culebra in the area of the WIPP facility is approximately 20 ft per mi (3.8 m per km) and becomes much flatter south and southwest of the site (Figure L-5). Culebra transmissivities in the Nash Draw range up to 1,250 square ft (ft2) (116 square m [m2]) per day; closer to the WIPP facility, they are as low as 0.007 to 74 ft2 (0.00065 to 7.0 m2) per day.
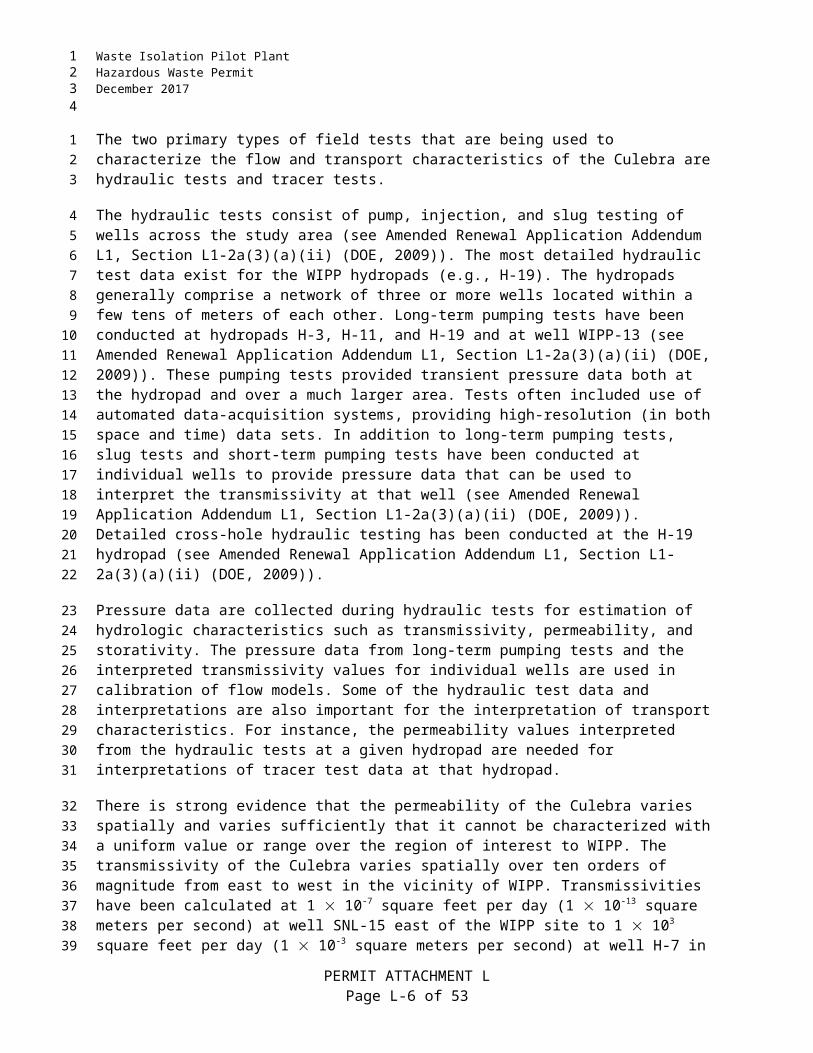
The two primary types of field tests that are being used to characterize the flow and transport characteristics of the Culebra are hydraulic tests and tracer tests.
The hydraulic tests consist of pump, injection, and slug testing of wells across the study area (see Amended Renewal Application Addendum L1, Section L1-2a(3)(a)(ii) (DOE, 2009)). The most detailed hydraulic test data exist for the WIPP hydropads (e.g., H-19). The hydropads generally comprise a network of three or more wells located within a few tens of meters of each other. Long-term pumping tests have been conducted at hydropads H-3, H-11, and H-19 and at well WIPP-13 (see Amended Renewal Application Addendum L1, Section L1-2a(3)(a)(ii) (DOE, 2009)). These pumping tests provided transient pressure data both at the hydropad and over a much larger area. Tests often included use of automated data-acquisition systems, providing high-resolution (in both space and time) data sets. In addition to long-term pumping tests, slug tests and short-term pumping tests have been conducted at individual wells to provide pressure data that can be used to interpret the transmissivity at that well (see Amended Renewal Application Addendum L1, Section L1-2a(3)(a)(ii) (DOE, 2009)). Detailed cross-hole hydraulic testing has been conducted at the H-19 hydropad (see Amended Renewal Application Addendum L1, Section L1-2a(3)(a)(ii) (DOE, 2009)).
Pressure data are collected during hydraulic tests for estimation of hydrologic characteristics such as transmissivity, permeability, and storativity. The pressure data from long-term pumping tests and the interpreted transmissivity values for individual wells are used in calibration of flow models. Some of the hydraulic test data and interpretations are also important for the interpretation of transport characteristics. For instance, the permeability values interpreted from the hydraulic tests at a given hydropad are needed for interpretations of tracer test data at that hydropad.
There is strong evidence that the permeability of the Culebra varies spatially and varies sufficiently that it cannot be characterized with a uniform value or range over the region of interest to WIPP. The transmissivity of the Culebra varies spatially over ten orders of magnitude from east to west in the vicinity of WIPP. Transmissivities have been calculated at 1 10-7
PERMIT ATTACHMENT LPage L-4 of 53
1234
123
4
5678
910111213141516
1718
1920212223242526272829303132
33343536373839
40414243

Waste Isolation Pilot PlantHazardous Waste Permit
December 2017
square feet per day (1 10-13 square meters per second) at well SNL-15 east of the WIPP site to 1 103 square feet per day (1 10-3 square meters per second) at well H-7 in Nash Draw (see Amended Renewal Application Addendum L1, Section L1-2a(3)(a)(ii) (DOE, 2009)).
Transmissivity variations in the Culebra are believed to be controlled by the relative abundance of open fractures rather than by primary (that is, depositional) features of the unit (Roberts 2007). Lateral variations in depositional environments were small within the mapped region, and primary features of the Culebra show little map-scale spatial variability, according to Holt and Powers, 1988. Direct measurements of the density of open fractures are not available from core samples because of incomplete recovery and fracturing during drilling, but observation of the relatively unfractured exposures in the WIPP shafts suggests that the density of open fractures in the Culebra decreases to the east.
Geochemical and radioisotope characteristics of the Culebra have been studied. There is considerable variation in groundwater geochemistry in the Culebra. The variation has been described in terms of different hydrogeochemical facies that can be mapped in the Culebra. A halite-rich hydrogeochemical facies exists in the region of the WIPP site and to the east, approximately corresponding to the regions in which halite exists in units above and below the Culebra, and in which a large portion of the Culebra fractures are gypsum filled. An anhydrite-rich hydrogeochemical facies exists west and south of the WIPP site, where there is relatively less halite in adjacent strata and where there are fewer gypsum-filled fractures. Radiogenic isotopic signatures suggest that the age of the groundwater in the Culebra is on the order of 10,000 years or more (see Amended Renewal Application Addendum L1 (DOE, 2009)).
The radiogenic ages of the Culebra groundwater and the geochemical differences provide information potentially relevant to the groundwater flow directions and groundwater interaction with other units and are important constraints on conceptual models of groundwater flow.
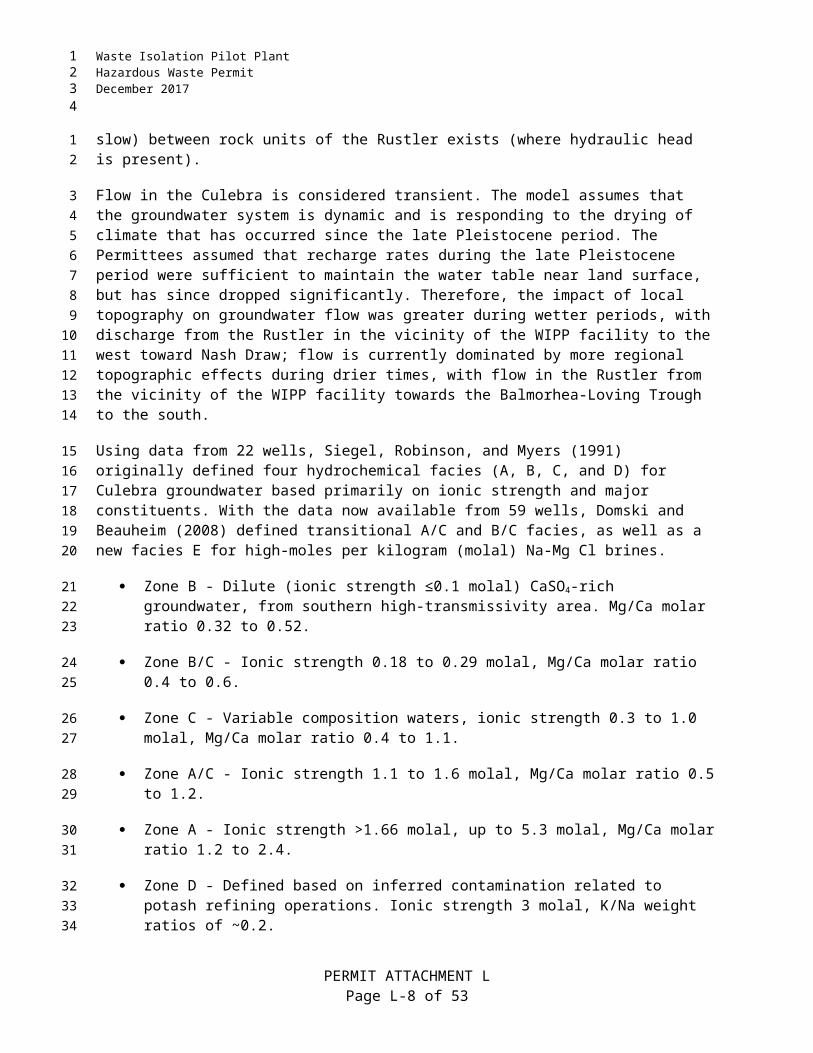
The Permittees have proposed a conceptualization of groundwater flow that explains observed geochemical facies and groundwater flow patterns. The conceptualization, referred to as the basin-scale groundwater model, offers a three dimensional approach to treatment of Supra-Salado rock units, and assumes vertical leakage (albeit very slow) between rock units of the Rustler exists (where hydraulic head is present).
Flow in the Culebra is considered transient. The model assumes that the groundwater system is dynamic and is responding to the drying of climate that has occurred since the late Pleistocene period. The Permittees assumed that recharge rates during the late Pleistocene period were sufficient to maintain the water table near land surface, but has since dropped significantly. Therefore, the impact of local topography on groundwater flow was greater during wetter periods, with discharge from the Rustler in the vicinity of the WIPP facility to the west toward Nash Draw; flow is currently dominated by more regional topographic effects during drier times, with flow in the Rustler from the vicinity of the WIPP facility towards the Balmorhea-Loving Trough to the south.
Using data from 22 wells, Siegel, Robinson, and Myers (1991) originally defined four hydrochemical facies (A, B, C, and D) for Culebra groundwater based primarily on ionic strength and major constituents. With the data now available from 59 wells, Domski and Beauheim (2008) defined transitional A/C and B/C facies, as well as a new facies E for high-moles per kilogram (molal) Na-Mg Cl brines.
PERMIT ATTACHMENT LPage L-5 of 53
1234
123
456789
1011
12131415161718192021
222324
2526272829
303132333435363738
3940414243

Waste Isolation Pilot PlantHazardous Waste PermitDecember 2017
Zone B - Dilute (ionic strength ≤0.1 molal) CaSO4-rich groundwater, from southern high-transmissivity area. Mg/Ca molar ratio 0.32 to 0.52.
Zone B/C - Ionic strength 0.18 to 0.29 molal, Mg/Ca molar ratio 0.4 to 0.6.
Zone C - Variable composition waters, ionic strength 0.3 to 1.0 molal, Mg/Ca molar ratio 0.4 to 1.1.
Zone A/C - Ionic strength 1.1 to 1.6 molal, Mg/Ca molar ratio 0.5 to 1.2.
Zone A - Ionic strength >1.66 molal, up to 5.3 molal, Mg/Ca molar ratio 1.2 to 2.4.
Zone D - Defined based on inferred contamination related to potash refining operations. Ionic strength 3 molal, K/Na weight ratios of ~0.2.
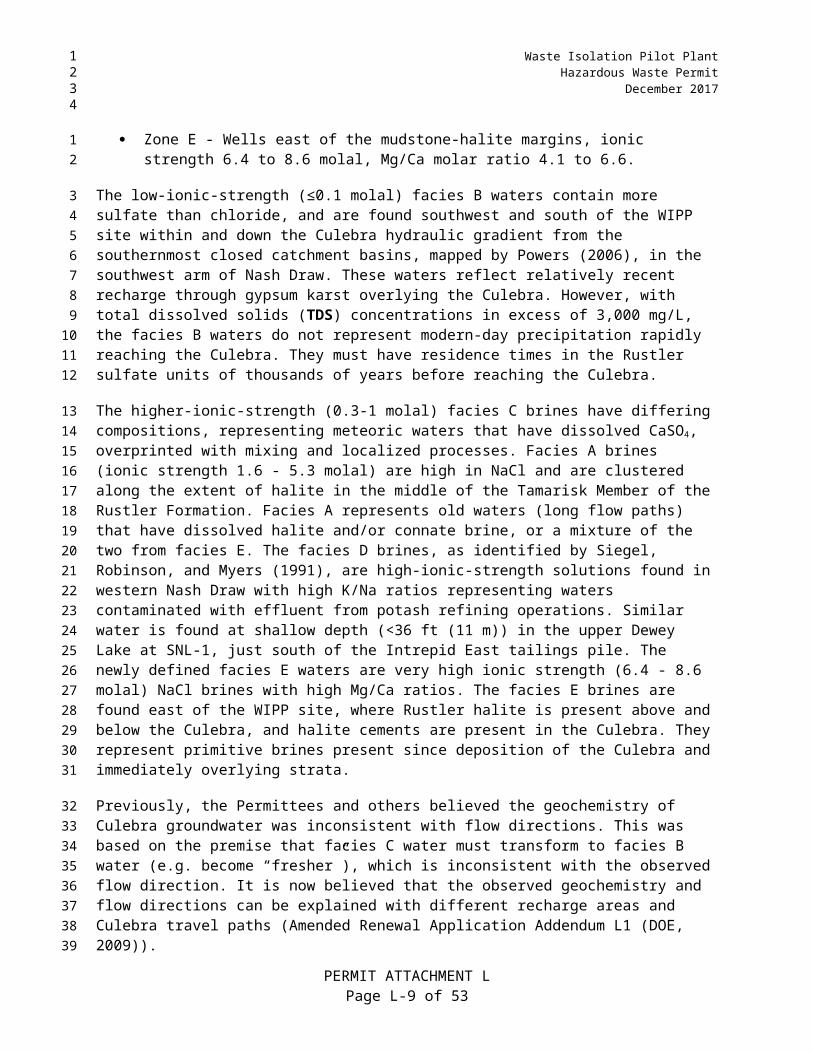
Zone E - Wells east of the mudstone-halite margins, ionic strength 6.4 to 8.6 molal, Mg/Ca molar ratio 4.1 to 6.6.
The low-ionic-strength (≤0.1 molal) facies B waters contain more sulfate than chloride, and are found southwest and south of the WIPP site within and down the Culebra hydraulic gradient from the southernmost closed catchment basins, mapped by Powers (2006), in the southwest arm of Nash Draw. These waters reflect relatively recent recharge through gypsum karst overlying the Culebra. However, with total dissolved solids (TDS) concentrations in excess of 3,000 mg/L, the facies B waters do not represent modern-day precipitation rapidly reaching the Culebra. They must have residence times in the Rustler sulfate units of thousands of years before reaching the Culebra.
The higher-ionic-strength (0.3-1 molal) facies C brines have differing compositions, representing meteoric waters that have dissolved CaSO4, overprinted with mixing and localized processes. Facies A brines (ionic strength 1.6 - 5.3 molal) are high in NaCl and are clustered along the extent of halite in the middle of the Tamarisk Member of the Rustler Formation. Facies A represents old waters (long flow paths) that have dissolved halite and/or connate brine, or a mixture of the two from facies E. The facies D brines, as identified by Siegel, Robinson, and Myers (1991), are high-ionic-strength solutions found in western Nash Draw with high K/Na ratios representing waters contaminated with effluent from potash refining operations. Similar water is found at shallow depth (<36 ft (11 m)) in the upper Dewey Lake at SNL-1, just south of the Intrepid East tailings pile. The newly defined facies E waters are very high ionic strength (6.4 - 8.6 molal) NaCl brines with high Mg/Ca ratios. The facies E brines are found east of the WIPP site, where Rustler halite is present above and below the Culebra, and halite cements are present in the Culebra. They represent primitive brines present since deposition of the Culebra and immediately overlying strata.
Previously, the Permittees and others believed the geochemistry of Culebra groundwater was inconsistent with flow directions. This was based on the premise that facies C water must transform to facies B water (e.g. become “fresher”), which is inconsistent with the observed flow direction. It is now believed that the observed geochemistry and flow directions can be explained with different recharge areas and Culebra travel paths (Amended Renewal Application Addendum L1 (DOE, 2009)).
PERMIT ATTACHMENT LPage L-6 of 53
1234
12
3
45
6
7
89
1011
1213141516171819
2021222324252627282930313233
343536373839
Waste Isolation Pilot PlantHazardous Waste Permit
December 2017
Head distribution in the Culebra (see Amended Renewal Application Addendum L1 (DOE, 2009)) is consistent with basin-scale groundwater basin modeling results indicating that the generalized groundwater flow direction in the Culebra is currently north to south. However, the fractured nature of the Culebra, coupled with variable fluid densities, can cause localized flow patterns to differ from general flow patterns.
Groundwater levels in the Culebra in the region around the WIPP facility have been measured in numerous wells. Water-level rises have been observed and are attributed to causes discussed in the Renewal Application Addendum L1, Section L1-2a(3)(a)(ii) (DOE, 2009). The extent of water-level rise observed at a particular well depends on several factors, but the proximity of the observation point to the cause of the water-level change appears to be a primary factor.
Hydrological investigations conducted from 2003 through 2007 provided new information, some of it confirming long-held assumptions and some offering new insight into the hydrological system around the WIPP site. A Culebra monitoring network optimization study was completed by McKenna (2004) and updated by Kuhlman (2010) to identify locations where new Culebra monitoring wells would be of greatest value and to identify wells that could be removed from the network with little loss of information.
As discussed in Amended Renewal Application Addendum L1, Section L1-2a(3)(a)(ii) (DOE, 2009), extensive hydrological testing has been performed in the new wells. This testing has involved both single well tests, which provide information on local transmissivity and heterogeneity, and long-term (19 to 32 days) pumping tests that have created observable responses in wells up to 5.9 mi (9.5 km) away.
Inferences about vertical flow directions in the Culebra have been made from well data collected by the Permittees. Beauheim (1987) reported flow directions towards the Culebra from both the underlying Los Medaños Member (Los Medaños) of the Rustler and the overlying Magenta Member (Magenta) of the Rustler across the WIPP site, indicating that the Culebra acts as a drain for the units around it. This is consistent with results of basin-scale groundwater modeling.
Use of water from the Culebra in the WIPP facility area is quite limited because of its varying yields and high salinity. The Culebra is not used for water supply in the immediate WIPP facility vicinity. Its nearest use is approximately 7 mi (11 km) southwest of the WIPP facility, where salinity is low enough to allow its use for livestock watering.
L-2 General Regulatory Requirements
Because geologic repositories such as the WIPP facility are defined under the Resource Conservation and Recovery Act (RCRA) as land disposal facilities and as miscellaneous units, the groundwater monitoring requirements of 20.4.1.500 NMAC (incorporating 40 CFR §§264.600 through 264.603) shall be addressed. The requirements of 20.4.1.500 NMAC (incorporating 40 CFR §§264.90 through 264.101) apply to miscellaneous unit treatment, storage, and disposal facilities (TSDF) only if groundwater monitoring is needed to satisfy 20.4.1.500 NMAC (incorporating 40 CFR §§264.601 through 264.603) environmental performance standards.
The New Mexico Environment Department (NMED) has concluded that groundwater monitoring in accordance with 20.4.1.500 NMAC (incorporating 40 CFR §264 Subpart F) at the WIPP
PERMIT ATTACHMENT LPage L-7 of 53
1234
12345
6789
1011
121314151617
1819202122
2324252627
28293031
32
3334353637383940
4142

Waste Isolation Pilot PlantHazardous Waste PermitDecember 2017
facility is necessary to meet the requirements of 20.4.1.500 NMAC (incorporating 40 CFR §§264.601 through 264.603).
L-3 WIPP Detection Monitoring Program (DMP)—Overview
L-3a Scope
This DMP plan governs groundwater sampling events conducted to meet the applicable requirements of 20.4.1.500 NMAC (incorporating 40 CFR 264 Subpart F), and ensures that such data are gathered in accordance with these and other applicable requirements. Analytical results collected during the DMP are compared to the baseline established in this Permit to determine whether or not a release has occurred.
There are two separate components of the Groundwater Monitoring Program, the Detection Monitoring Program (DMP) and the Water Level Monitoring Program (WLMP). The first component consists of a network of six Detection Monitoring Wells (DMWs). The DMWs (WQSP 1-6) were constructed to be consistent with the specifications provided in the Groundwater Monitoring Technical Enforcement Guidance Document and constitute the RCRA groundwater monitoring network specified in the DMP. The DMWs were used to establish background groundwater quality in accordance with 20.4.1.500 NMAC (incorporating 40 CFR § 264.97 and 264.98 (f)). The second component of the Groundwater Monitoring Program is the WLMP, which is used to determine the groundwater surface elevation and flow direction. Table L-4 is a list of the wells used in the WLMP as of January 1, 2011. The list of wells is subject to change due to plugging and abandonment and drilling of new wells.
L-3b Current WIPP DMP
Wells WQSP-1, WQSP-2, and WQSP-3 are located directly upgradient (north) of the WIPP shaft area.
WQSP-4, WQSP-5, and WQSP-6 are located downgradient (south) of the WIPP shaft area. All three Culebra downgradient wells (WQSP-4, 5, and 6) were sited to be located generally in the path of contaminants that might be released from the shaft area in the Culebra. Well WQSP-4 was also specifically located to monitor the zone of higher transmissivity which may represent faster flow path away from the WIPP shaft area to the LWA boundary (Amended Renewal Application Addendum L1, Section L1-2a(3)(a)(ii) (DOE, 2009)).
The compliance point is defined in 20.4.1.500 NMAC (incorporating 40 CFR §264.95) as the vertical plane immediately downgradient of the hazardous waste management unit area (i.e., at the downgradient footprint of the WIPP repository). Permit Part 5 specifies the point of compliance as “the vertical surface located at the hydraulically downgradient limit of the Underground HWDUs that extends to the Culebra Member of the Rustler Formation.” Wells WQSP-4, 5, and 6 are situated to demonstrate that during the operating life of the facility (including closure), release of contaminants to the general public will not occur.
Transport modeling suggests that travel times from the Waste Handling Shaft to the LWA boundary could be on the order of thousands of years. This assumes conditions where hazardous constituents migrate from the sealed repository (post closure) to the Culebra via the sealed shafts.
PERMIT ATTACHMENT LPage L-8 of 53
1234
12
3
4
56789
1011121314151617181920
21
2223
242526272829
30313233343536
37383940
Waste Isolation Pilot PlantHazardous Waste Permit
December 2017
Potentiometric surfaces and groundwater flow directions defined for the Culebra prior to large-scale pumping in the WIPP facility area and the excavation of WIPP facility shafts suggests that flow was generally to the south-southeast from the waste disposal and shaft areas (Mercer, 1983; Davies, 1989). Potentiometric surface maps of the Culebra adjusted for density differences show very similar characteristics. The wells used for measuring the potentiometric surface of the Culebra are measured monthly and listed in Table L-4.
L-3b(1) Detection Monitoring Well Construction Specification
Diagrams of the six DMP wells are shown in Figures L-7 through L-12. Detailed descriptions of geology and construction methods may be found in DOE 1995.
The six DMP Culebra wells were drilled between September 13 and October 16, 1994. The total depth of each well is shown in Table L-5. The wells were drilled through the Culebra into the Los Medaños as shown in Table L-5. The wells were drilled to the top of the Culebra using compressed air as the drilling fluid and a 9⅞-in. drill bit. The wells were then cored using a 5¼-in. core bit to cut 4-in. (0.1-m) diameter core to total depth. See Table L-5 for the drilling and coring intervals for each well. After coring, DMP wells were reamed to 9⅞ -in. (0.3 m) in diameter to total depth. After reaming, wells were cased from the surface to total depth with 5-in. (0.1-m) (0.28-in. [0.7-centimeter (cm)] wall) blank fiberglass casing with in-line 5-in.- (0.1-m) diameter fiberglass 0.02-in. (0.1-cm) slotted screen across the Culebra interval as shown in Table L-5 . The annulus between the borehole wall and the casing/screen is packed with sand and with 8/16 Brady gravel as indicated in Table L-5.
L-4 Monitoring Program Description
The WIPP DMP has been designed to meet the groundwater monitoring requirements of 20.4.1.500 NMAC (incorporating 40 CFR §§264.90 through 264.101). The following sections of the monitoring plan specify the components of the DMP.
L-4a Monitoring Frequency
Groundwater surface elevations will be monitored in each of the six DMWs on a monthly basis. The groundwater surface elevation in each DMW will also be measured prior to each annual sampling event. The groundwater surface elevation measurements in the WLMP wells will also be monitored on a monthly basis when accessible. The characteristics of the DMW (sampling frequency, location) will be evaluated if significant changes are observed in the groundwater flow direction or gradient.
L-4b Analytical Parameters and Hazardous Constituents
The parameters listed in Part 5, Table 5.4.a and hazardous constituents listed in Part 5, Table 5.4.b are measured as part of the DMP.
Additional hazardous constituents may be identified through changes to the list of hazardous waste numbers authorized for disposal at the WIPP facility. If hazardous constituents are identified, these will be added to Part 5, Table 5.4.b, unless the Permittees provide justification for their omission (e.g. hazardous constituent not in 40 CFR §264 Appendix IX), and this omission is approved by NMED.
PERMIT ATTACHMENT LPage L-9 of 53
1234
123456
7
89
1011121314151617181920
21
222324
25
262728293031
32
3334
3536373839
Waste Isolation Pilot PlantHazardous Waste PermitDecember 2017
L-4c Groundwater Surface Elevation Measurement, Sample Collection and Laboratory Analysis
Groundwater surface elevations will be measured in each DMW prior to groundwater sample collection. Groundwater will be extracted using serial and final sampling methods. Serial samples will be collected until groundwater field indicator parameters stabilize or three well bore volumes, whichever occurs first, after which the final sample for complete analysis will be collected. Final samples will then be analyzed for the parameters and constituents in Part 5, Tables 5.4.a and 5.4.b.
L-4c(1) Groundwater Surface Elevation Monitoring Methodology
The WIPP groundwater level monitoring program (WLMP) activities are conducted in accordance with the WIPP facility SOPs listed in Table L-3.
Groundwater surface elevation measurements will be taken monthly at each of the six DMWs and prior to the annual sampling event. Additionally, groundwater surface elevation measurements will be taken monthly in the other Culebra wells as listed in Table L-4, when accessible. Well locations are shown in Figure L-14. If a cumulative groundwater surface elevation change of more than 2 feet is detected in any DMP well over the course of one year which is not attributable to site tests or natural stabilization of the site hydrologic system, the Permittees will notify NMED in writing and discuss the origin of the changes in the Annual Culebra Groundwater Report specified in Permit Part 5. Abnormal, unexplained changes in groundwater surface elevation will be evaluated to determine if they indicate changes in site recharge/discharge which could affect the assumptions regarding DMW placement and constitute new information as specified in 20.4.1.900 NMAC (incorporating 40 CFR §270.41(a)(2)).
Groundwater surface elevation monitoring will continue through the post-closure care period specified in Permit Part 7. The Permittees may temporarily increase the frequency of monitoring to effectively document naturally occurring or artificial perturbations that may be imposed on the hydrologic systems at any point in time. This will be conducted in selected key wells by increasing the frequency of the manual groundwater surface elevation measurements or by monitoring water pressures with the aid of electronic pressure transducers and remote data-logging systems. The Permittees will include such additional data in the reports specified in Section L-5c.
Interpretation of groundwater surface elevation measurements and corresponding fluctuations over time is complicated at the WIPP facility by spatial variation in fluid density. To monitor the hydraulic gradients of the hydrologic flow systems accurately, actual groundwater surface elevation measurements will be monitored at the frequencies specified in Table L-2, and the Culebra groundwater densities of the fluids in the wells listed in Table L-4 will be measured annually. The fluid density measured at well H-19b0 will be used to correct for freshwater head for the other wells on H-19 pad (H-19b2, H-19b3, H-19b4, H-19b5, H-19b6, and H-19b7).
Measured Culebra water surface elevation data can be converted to equivalent freshwater head from knowledge of the density of the borehole fluid, using the following formula.
PERMIT ATTACHMENT LPage L-10 of 53
1234
12
345678
9
1011
121314151617181920212223
2425262728293031
32333435363738
3940

Waste Isolation Pilot PlantHazardous Waste Permit
December 2017
p = ρyh
where
p = freshwater head (length of freshwater head)y = average specific gravity of the borehole fluid (unitless ratio of borehole fluid density to density of fresh water)p = freshwater density (mass/volume)h = fluid column height above the datum (length)
If the freshwater density is assumed to be 1.000 gram per cubic centimeter (g/cm3), then the equivalent freshwater head is equal to the fluid column height times the average borehole fluid specific gravity.
Density measurements are made annually. Density for the DMWs will be expressed as specific gravity as measured in the field during sampling events using a hydrometer. Freshwater head for other Culebra wells will be calculated as described above from fluid density measurements obtained using pressure transducers.
L-4c(1)(i) Field Methods and Data Collection Requirements
To obtain an accurate groundwater surface elevation measurement, a calibrated water-level measuring device will be lowered into a test well and the depth to water recorded from a known reference point. An SOP will be used when making water-level measurements for this program. The SOP will specify the methods to be used in obtaining groundwater-level measurements, and provide general instructions including prerequisites, safety precautions, performance frequency, quality assurance, data management, and records.
L-4c(1)(ii) Groundwater Surface Elevation Records and Document Control
Incoming data will be processed in a manner that ensures data integrity. The data management process for groundwater surface elevation measurements will begin with completion of the field data sheets. Date, time, tape measurement, equipment identification number, calibration due date, initial of the field personnel, and equipment/comments will be recorded on the field data sheets. If, for some unexpected reason, a measurement is not possible (e.g., a test is under way that blocks entry to the well bore), then a notation as to why the measurement was not taken will be recorded in the comment column. Personnel will also use the comment column to report any security observations (i.e., well lock missing).
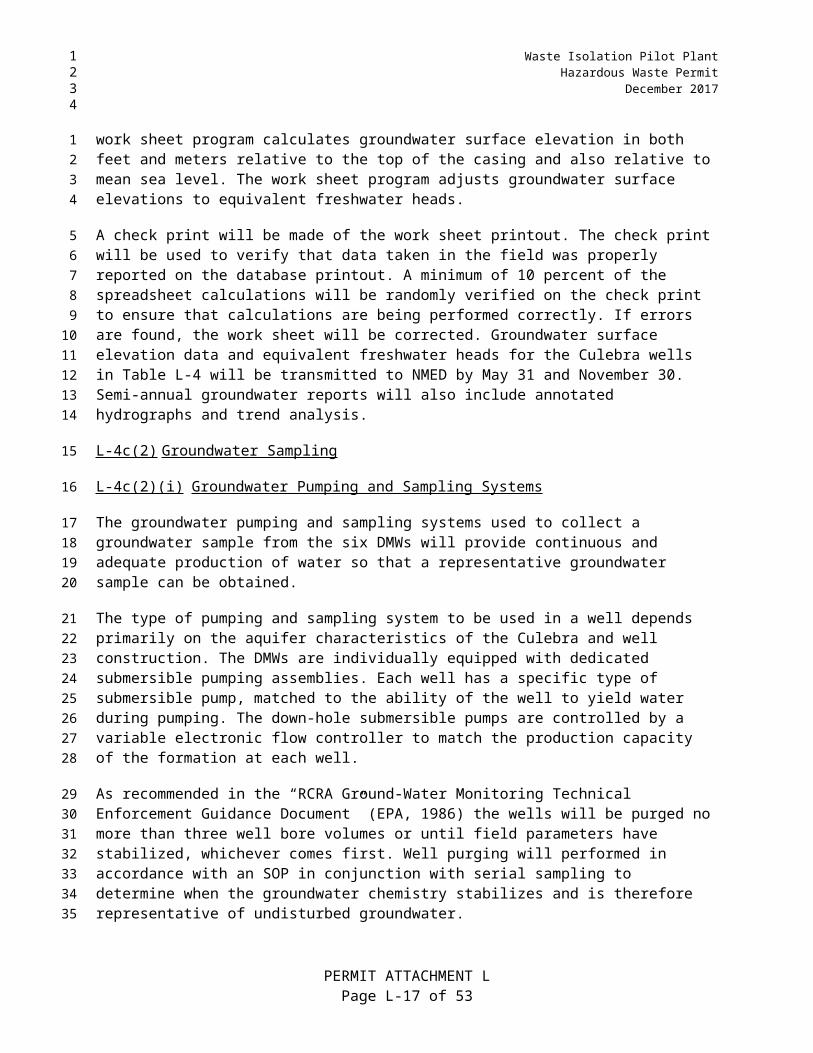
Data recorded on the field data sheets and submitted by field personnel will be subject to applicable SOPs (see Table L-3). These procedures specify the processes for administering and managing such data. The data will be entered onto a computerized work sheet. The work sheet program calculates groundwater surface elevation in both feet and meters relative to the top of the casing and also relative to mean sea level. The work sheet program adjusts groundwater surface elevations to equivalent freshwater heads.
A check print will be made of the work sheet printout. The check print will be used to verify that data taken in the field was properly reported on the database printout. A minimum of 10 percent
PERMIT ATTACHMENT LPage L-11 of 53
1234
1
2
34567
89
10
11121314
15
16
171819202122
23
2425262728293031
323334353637
3839

Waste Isolation Pilot PlantHazardous Waste PermitDecember 2017
of the spreadsheet calculations will be randomly verified on the check print to ensure that calculations are being performed correctly. If errors are found, the work sheet will be corrected. Groundwater surface elevation data and equivalent freshwater heads for the Culebra wells in Table L-4 will be transmitted to NMED by May 31 and November 30. Semi-annual groundwater reports will also include annotated hydrographs and trend analysis.
L-4c(2) Groundwater Sampling
L-4c(2)(i) Groundwater Pumping and Sampling Systems
The groundwater pumping and sampling systems used to collect a groundwater sample from the six DMWs will provide continuous and adequate production of water so that a representative groundwater sample can be obtained.
The type of pumping and sampling system to be used in a well depends primarily on the aquifer characteristics of the Culebra and well construction. The DMWs are individually equipped with dedicated submersible pumping assemblies. Each well has a specific type of submersible pump, matched to the ability of the well to yield water during pumping. The down-hole submersible pumps are controlled by a variable electronic flow controller to match the production capacity of the formation at each well.
As recommended in the “RCRA Ground-Water Monitoring Technical Enforcement Guidance Document” (EPA, 1986) the wells will be purged no more than three well bore volumes or until field parameters have stabilized, whichever comes first. Well purging will performed in accordance with an SOP in conjunction with serial sampling to determine when the groundwater chemistry stabilizes and is therefore representative of undisturbed groundwater.
The DMWs are cased and screened through the production interval with materials that do not yield contamination to the aquifer or allow the production interval to collapse under stress (high epoxy fiberglass). An electric, submersible pump installation without the use of a packer is used in this instance. The largest amount of discharge from the submersible pump takes place from a discharge pipe. In addition to this main discharge pipe, a dedicated sample line running parallel to the discharge pipe is used. The sampling line is manufactured from a chemically inert material. Cumulative flow is measured using a totalizing flow meter. Flow from the discharge pipe is routed to a discharge tank for disposal.
The dedicated sampling line is used to collect the water sample that will undergo analysis. By using a dedicated sample line, the water will not be contaminated by the metal discharge pipe. The sample line will branch from the main discharge pipe a few inches above the pump. Flow from the sample line will be routed into the sample collection area. Flow through the sample collection line is regulated by a flow-control valve. The sample line is insulated at the surface to minimize temperature fluctuations.
L-4c(2)(ii) Serial Samples
Serial sampling is the collection of sequential samples for the purpose of determining when the groundwater chemistry stabilizes and is therefore representative of undisturbed groundwater. The Permittees’ SOP for serial sampling will provide criteria for determining when a final sample should be taken. Each DMW will be purged to no than more three well bore volumes, or until field parameters stabilize, whichever occurs first. Well stabilization occurs when the field-
PERMIT ATTACHMENT LPage L-12 of 53
1234
12345
6
7
89
10
111213141516
1718192021
2223242526272829
303132333435
36
3738394041

Waste Isolation Pilot PlantHazardous Waste Permit
December 2017
analyzed parameters are within ± 5% of three consecutive measurements. A well bore volume is defined as the volume of water from static water level to the bottom of the well sump. Serial samples will be analyzed in the mobile filed laboratory for field indicator parameters. The Permittees will provide an explanation of why the sample was collected when field indicator parameters were not stabilized and place that explanation in the WIPP facility Operating Record.
Serial samples will be collected and analyzed to detect and monitor the chemical variation of the groundwater as a function of the volume of water pumped. Once serial sampling begins, the frequency at which serial samples are collected and analyzed will be left to the discretion of the Permittees, but will be performed a minimum of three times during a sampling round.
The Permittees will use appropriate field methods to identify stabilization of the following field indicator parameters: pH, temperature, specific conductance, and specific gravity.
The three field indicator parameters of temperature, specific conductance, and pH will be determined by either an “in-line” technique, using a self-contained flow cell, or an “off-line” technique, in which the samples will be collected from a sample line at atmospheric pressure. Specific conductance and specific gravity samples will be collected from the sample line at atmospheric pressure. Because of the lack of sophisticated weights and measures equipment available for field density assessments, field density evaluations will be expressed in terms of specific gravity, which is a unitless measure. Density is expressed as unit weight per unit volume.
New polyethylene containers, that are certified clean by the laboratory, will be used to collect the serial samples from the sample line.
Serial samples collected in laboratory-certified clean containers do not require rinsing prior to sample collection. Unfiltered groundwater will be used when determining temperature, pH, specific conductance, and specific gravity. Sample bottles will be properly identified and labeled.
Samples collected will immediately be analyzed for pH and specific conductance (SC) as these parameters are most sensitive to changes in ambient temperature. Temperature, pH, and specific conductance, when not measured in a flow cell, will be measured at the approximate time of serial sample collection. These samples will be collected from the unfiltered sample line.
Upon completion of the collection of the last serial sample suite, the serial sample bottles accrued throughout the duration of the pumping of the well will be discarded. No serial sample bottles will be reused for sampling purposes of any sort. However, serial samples may be stored for a period of time depending upon the need. Standard Operating Procedures (see Table L-3) defines the protocols for the collection of final and serial samples and analysis.
L-4c(2)(iii) Final Samples
The final sample will be collected once the measured field indicator parameters have stabilized (refer to Section L-4(c)(2)(ii)). A serial sample will also be collected and analyzed for each day of final sampling to ensure that samples collected for laboratory analysis are still representative of stable conditions. Sample preservation, handling, and transportation methods will maintain the integrity and representativeness of the final samples.
PERMIT ATTACHMENT LPage L-13 of 53
1234
123456
789
10
1112
1314151617181920
2122
232425
26272829
3031323334
35
3637383940

Waste Isolation Pilot PlantHazardous Waste PermitDecember 2017
Prior to collecting the final samples, the collection team shall consider the analyses to be performed so that proper shipping or storage containers can be assembled. Table L-6 presents the sample containers, volumes, and holding times for laboratory samples collected as part of the DMP.
The monitoring system will use dedicated pumping systems and sample collection lines from the sampled formation to the well head.
Sample integrity will be ensured through appropriate decontamination procedures. Laboratory glassware will be washed after each use with a solution of nonphosphorus detergent and deionized (DI) water and rinsed in DI water. Sample containers will be new, certified clean containers that will be discarded after one use. Groundwater surface elevation measurement devices will be rinsed with fresh water after each use. Non-dedicated sample collection manifold assemblies will be rinsed in accordance with SOPs after each use. The exposed ends will be capped off during storage. Prior to the next use of the sampling manifold, it will be rinsed a second time with DI water and a rinsate blank sample will be collected to verify cleanliness.
Water samples will be collected at atmospheric pressure using either the filtered or unfiltered sampling lines. Detailed protocols, in the form of SOPs (see Table L-3) define how final samples will be collected in a consistent and repeatable fashion for analyses.
Final samples will be collected in the appropriate type of container for the specific analysis to be performed. The samples will be collected in new and unused glass and plastic containers (refer to Table L-6). For each parameter analyzed, a sufficient volume of sample will be collected to satisfy the volume requirements of the analytical laboratory (as specified by laboratory SOPs). This includes an additional volume of sample water necessary for maintaining quality control standards. All final samples will be treated, handled, and preserved as required for the specific type of analysis to be performed. Details about sample containers, preservation, and volumes required for individual types of analyses are found in the applicable SOPs generated, approved, and maintained by the contract analytical laboratory.
Final samples will be sent to the analytical laboratories and analyzed for parameters and hazardous constituents specified in Part 5, Tables 5.4a and 5.4b.
Duplicates of the final sample will be provided to WIPP Project oversight agencies when requested.
Wastes resulting from the sampling and field analysis of groundwater are disposed of in accordance with the WIPP SOPs (see Table L-3).
L-4c(2)(iv) Sample Preservation, Tracking, Packaging, and Transportation
Many of the chemical constituents measured by the DMP are not chemically stable and require preservation and special handling techniques. Samples requiring acidification will be treated as requested by the analytical laboratory.
The analytical laboratory receiving the samples will prescribe the type and amount of preservative, the container material type, the required sample volumes that shall be collected, and the shipping requirements. This information will be recorded on the Final Sample Checklist for use by field personnel when final samples are being collected. The Permittees will follow the
PERMIT ATTACHMENT LPage L-14 of 53
1234
1234
56
789
1011121314
151617
181920212223242526
2728
2930
3132
33
343536
37383940

Waste Isolation Pilot PlantHazardous Waste Permit
December 2017
EPA “RCRA Ground-Water Monitoring Technical Enforcement Guidance Document,” Table 4-1 (EPA, 1986), when laboratory SOPs do not specify sample container, volume, or preservation requirements. WIPP SOPs (see Table L-3) provide instructions to ensure proper sample preservation and shipping.
The sample tracking system at the WIPP facility uses uniquely numbered chain of custody/ request for analysis (CofC/RFA) forms. The primary consideration for storage or transportation is that samples shall be analyzed within the prescribed holding times for the analytes of interest. WIPP SOPs (see Table L-3) provide instructions to ensure proper sample tracking protocol.
L-4c(2)(v) Sample Documentation and Custody
To ensure the integrity of samples from the time of collection through reporting date, sample collection, handling, and custody shall be documented. Sample custody and documentation procedures for sampling and analysis activities are detailed in WIPP facility SOPs (see Table L-3).
Standardized forms used to document samples will include sample identification numbers, sample labels, custody tape, the sample tracking data, and CofC/RFA form. An example form is shown in Figure L-13.
Sample Numbers and Labels
A unique sample identification number will be assigned to each sample sent to the laboratory for analysis. The sample identification numbers will be used to track the sample from the time of collection through data reporting. Every sample container sent to the laboratory for analysis will be identified with a label affixed to it. Sample label information will be completed in indelible ink and will contain the following information: sample identification number with sample matrix type; sample location; analysis requested; time and date of collection; preservative(s), if any; and the sampler’s name or initials.
Custody Seals
Custody seals will be used to detect unauthorized sample tampering from collection through analysis. For example, custody seals that are adhesive-backed strips are destroyed when removed or when the container is opened. The seal will be dated, initialed, and affixed to the sample container in such a manner that it is necessary to break the seal to open the container. Seals will be affixed to sample containers in the field immediately after collection. Upon receipt at the laboratory, the laboratory custodian will inspect the seal for integrity; a broken seal will invalidate the sample.
Sample Identification and Tracking
Sample tracking information will be completed for each sample collected. The sample tracking information includes the following information: CofC/RFA form number; date sample(s) were sent to the lab; laboratory name; acknowledgment of receipt or comments; well name and round number. Sample codes will indicate the well location; the geologic formation where the water was collected from, the sampling round number; and the sample number. The code is broken down as follows:
PERMIT ATTACHMENT LPage L-15 of 53
1234
1234
5678
9
10111213
141516
17
18192021222324
25
26272829303132
33
343536373839

Waste Isolation Pilot PlantHazardous Waste PermitDecember 2017
WQ61C2R23N14
1 Well identification (e.g., WQSP-6 in this case)2 Geologic formation (e.g., the Culebra in this case)3 Sample round no. (Round 2)4 Sample no. (N1)
To distinguish duplicate samples from other samples, a “D” is added as the last digit to signify a duplicate. Sample tracking information will be completed in the field by the sampling team.
Sample tracking is monitored and documented with the CofC/RFA form and the shipping airbill. Both of these documents are included in the data packets. Receipt at the analytical laboratory may be monitored, if necessary, via the shipper’s website tracking application. Samples are considered complete when a copy of the original CofC/RFA form is merged with the Field Lab copy of the same document.
Chain of Custody and Request for Analysis
A CofC/RFA form will be completed during or immediately following sample collection and will accompany the sample through analysis and disposal. The CofC/RFA form will be signed and dated each time the sample custody is transferred. A sample will be considered to be in a person’s custody if: the sample is in his/her physical possession; the sample is in his/her unobstructed view; and/or the sample is placed, by the last person in possession of it, in a secured area with restricted access. During shipment, the carrier’s air bill number serves as custody verification. Upon receipt of the samples at the analytical laboratory, the laboratory sample custodian acknowledges possession of the samples by signing and dating the CofC/RFA form. The completed original (top page) of the CofC/RFA will be returned to the Permittees with the laboratory analytical report and becomes part of the permanent record of the sampling event. The CofC/RFA form also contains specific instructions to the analytical laboratory for sample analysis, potential hazards, and disposal instructions.
L-4c(3) Laboratory Analysis
Analysis of samples will be performed using methods selected to be consistent with EPA recommended procedures in SW 846 (EPA, 1996). Additional detail on analytical techniques and methods will be given in laboratory SOPs. In Part 5, Tables 5.4.a and 5.4.b presents the analytical parameters and hazardous constituents for the WIPP DMP.
The Permittees will establish the criteria for laboratory selection, including the stipulation that the laboratory follow the procedures specified in SW 846 and that the laboratory follow EPA protocols unless alternate methods or protocols are approved by the NMED. The analytical laboratory shall demonstrate, through laboratory SOPs that it will follow appropriate EPA SW 846 requirements and the requirements specified by the EPA protocols unless alternate methods or protocols are approved by the NMED. The analytical laboratory shall also provide documentation to the Permittees describing the sensitivity of laboratory instrumentation. This documentation will be retained in the WIPP facility Operating Record. Instrumentation sensitivity needs to be considered because of regulatory requirements governing constituent concentrations in groundwater and the complexity of brines associated with the Culebra groundwater.
PERMIT ATTACHMENT LPage L-16 of 53
1234
1
2345
67
89
101112
13
141516171819202122232425
26
27282930
3132333435363738394041

Waste Isolation Pilot PlantHazardous Waste Permit
December 2017
The laboratory will maintain documentation of sample handling and custody, analytical results, and internal quality control (QC) data. Additionally, the laboratory will analyze QC samples in accordance with this plan and its own internal QC program for indicators of analytical accuracy and precision. Data generated outside of laboratory acceptance limits will trigger an evaluation and, if appropriate, corrective action as directed by the Permittees. The laboratory will report the results of the environmental sample and QC sample analyses and any necessary corrective actions that were performed. In the event that more than one analytical laboratory is used (e.g., for different analyses), each one will have the responsibilities specified above. A copy of the laboratory SOPs will be maintained in WIPP facility files. The Permittees will provide NMED with an initial set of applicable laboratory SOPs for information purposes, and provide NMED with any updated SOPs on an annual basis by January 31.
Data validation will be performed and reported in the Annual Culebra Groundwater Report and will be maintained in the WIPP facility Operating Record.
L-4d Calibration
L-4d(1) Sampling and Groundwater Elevation Monitoring Equipment Calibration
The equipment used to collect data for this DMP will be calibrated in accordance with SOPs. The Permittees will be responsible for calibrating needed equipment on schedule and for maintaining current calibration records for each piece of equipment.
L-4d(2) Groundwater Surface Elevation Monitoring Equipment Calibration Requirements
The equipment used in taking groundwater surface elevation measurements will be maintained in accordance with WIPP facility SOPs (see Table L-3). The Permittees will be responsible for ensuring equipment is calibrated on schedule in accordance with SOPs. The Permittees will also be responsible for maintaining copies of records of the most recent calibration for each piece of equipment.
L-4e Statistical Analysis of Laboratory Analytical Data
Analytical data collected as part of the DMP will be evaluated using appropriate statistical techniques. The following specifies the statistical analysis to be performed by the Permittees.
L-4e(1) Temporal and Spatial Analysis
Temporal and spatial analyses of the data were completed as part of establishing the water quality baseline (Crawley and Nagy, 1998; IT, 2000). As a result, the Permittees determined to evaluate changes relative to baseline on an individual location basis and to report the concentrations of constituents as a time series, either in tabular form or as time plots. No particular seasonal variations have been noted in the concentrations of groundwater samples collected during the spring and autumn; therefore, continuing temporal analysis is not required.
The analytical results for constituents will be reported as time series, either in tabular form or as time plots or both, and compared to the 95th percentile values or reporting limits identified in Part 5, Table 5.6.
PERMIT ATTACHMENT LPage L-17 of 53
1234
123456789
1011
1213
14
15
161718
19
2021222324
25
2627
28
293031323334
353637
Waste Isolation Pilot PlantHazardous Waste PermitDecember 2017
L-4e(2) Distributions and Descriptive Statistics
Techniques were established to compare detection monitoring data generated during the baseline studies. A 95th upper tolerance limit value (UTLV) or 95th percentile was determined from those data sets where target analytes were measured at concentrations above the method detection limits. The UTLV is provided for normal or lognormal distributions and a 95th percentile confidence interval is provided for data sets that are nonparametric or have greater than 15 percent non-detects. For analytes with only a few detects (greater than 95 percent non-detects), an accurate 95th percentile cannot be calculated. For these analytes, the maximum detected concentration is used as the baseline value. For the analytes that are non-detect in all the samples, the method reporting limit was used as the baseline value.
L-4e(3) Action Levels
Using baseline distributions, actions levels were identified in accordance with methodologies described in the baseline documents. Action levels are based on the 95th percentile or reporting limits identified in the baseline. If the groundwater concentration of a constituent identified in Part 5, Table 5.6 is found to exceed an action level, a test for outliers is performed in accordance with the methodologies specified in “Statistical Analysis of Groundwater Monitoring Data at RCRA Facilities” (EPA, 2009).
L-4e(4) Comparisons and Reporting
Prior to TRU mixed waste receipt, measurements were made of each background groundwater quality hazardous constituent specified in Part 5, Table L-5.4b at every detection monitoring well during each of the ten background sampling events (with the exception of trans-1,2-dichloroethylene and vanadium that were added after TRU mixed disposal began). These measurements serve as a statistical baseline (Part 5, Table 5.6) that is used for evaluating the significance of the results of subsequent sampling events during detection monitoring. Time-trend control charts with associated screening values for each hazardous constituent are used for this evaluation. The Permittees will compare the results from groundwater hazardous constituents of ongoing annual groundwater sample analysis to these baseline values in accordance with 20.4.1.500 NMAC (incorporating 40 CFR §264.97(h)(4)). If the comparisons show that a constituent statistically exceeds the baseline of the DMWs (as defined in 20.4.1.500 NMAC (incorporating 40 CFR §264.98(f)), the well shall be resampled and an analysis performed as soon as possible, in accordance with 20.4.1.500 NMAC (incorporating 40 CFR §264.98(g)(3)). The results of the statistical comparison will be reported annually to the NMED in the Annual Culebra Groundwater Report by November 30, as required under 20.4.1.500 NMAC (incorporating 40 CFR §264.98(g)).
L-5 Reporting
L-5a Laboratory Data Reports
Laboratory data will be provided in electronic and hard copy reports to the Permittees and will contain the following information for each analytical report:
A brief narrative summarizing laboratory analyses performed, date of issue, deviations from the analytical method, technical problems affecting data quality, laboratory quality
PERMIT ATTACHMENT LPage L-18 of 53
1234
1
23456789
10
11
121314151617
18
19202122232425262728293031323334
35
36
3738
3940

Waste Isolation Pilot PlantHazardous Waste Permit
December 2017
checks, corrective actions (if any), and the project manager’s signature approving issuance of the data report.
Header information for each analytical data summary sheet including: sample number and corresponding laboratory identification number; sample matrix; date of collection, receipt, preparation and analysis; and analyst’s name.
Parameter and hazardous constituents, analytical results, reporting units, reporting limit, analytical method used.
Results of QC sample analyses for all concurrently analyzed QC samples.
All analytical results will be provided to NMED as specified in the Permit Part 5.
L-5b Statistical Analysis and Reporting of Results
Analytical results for hazardous constituents from annual groundwater sampling activities will be compared and interpreted by the Permittees through generation of statistical analyses as specified in Section L-4e. The Permittees will perform statistical analyses; the results will be included in the Annual Culebra Groundwater Report in summary form, and will also be provided to NMED as specified in Permit Part 5.
L-5c Semi-Annual Groundwater Surface Elevation Report and Annual Culebra Groundwater Report
Data collected from this DMP will be reported to NMED as specified in Permit Part 5 in the Annual Culebra Groundwater Report. The report will include all applicable information that may affect the comparison of background groundwater quality and groundwater surface elevation data through time. This information will include but is not limited to:
DMW and WLMP well configuration changes that may have occurred from the time of the last measurement (i.e., plug installation and removal, packer removal and reinstallation, or both; and the type and quantity of fluids that may have been introduced into the test wells).
Pumping activities that may have taken place since publication of the last annual report (i.e., related to groundwater quality sampling, hydraulic testing, and shaft installation or grouting) that may have taken place since the last annual groundwater report.
A discussion of the origins of abnormal unexpected changes in the groundwater surface elevation, which is not attributable to site tests or natural stabilization of the site hydrologic system that exceeds 2 ft in a DMP well over the course of the period covered by the Annual Culebra Groundwater Report (this may indicate changes in recharge/discharge which would affect the assumptions regarding DMP well placement and constitute new information as specified in 20.4.1.900 NMAC (incorporating 40 CFR §270.41(a)(2)).
The results of the annual measurements of densities.
Annotated hydrographs.
PERMIT ATTACHMENT LPage L-19 of 53
1234
12
345
67
8
9
10
1112131415
1617
18192021
22232425
262728
29303132333435
36
37

Waste Isolation Pilot PlantHazardous Waste PermitDecember 2017
Groundwater flow rate and direction.
Potentiometric surface map generated using the following steps:
- Examine hydrographs to identify month having the largest number of Culebra water levels available with the fewest wells affected by pumping or other anthropogenic events.
- Convert water levels from subject month to equivalent freshwater heads using fluid densities appropriate to the date.
- Fit trend surface through freshwater heads.
- Extrapolate the trend surface to the boundaries of the model domain used for the current Performance Assessment Baseline Calculations (PABCs) and define initial fixed-head boundary conditions based on the trend surface.
- Using the ensemble-average Culebra transmissivity field used for the current PABC, optimize the model boundary heads to improve the fit of the model to the freshwater heads at the wells using optimization software interactively with MODFLOW.
- Run MODFLOW with optimal boundary conditions fit.
- Contour MODFLOW head results on WIPP site.
- Compute particle path and travel time from the Waste Handling Shaft to the LWA Boundary.
- Data analysis that will accompany the potentiometric surface map will include:
Measured versus modeled scatter plot diagram
Frequency of modeled head residuals
Modeled residual freshwater head at each well
Explanations for modeled misfit residuals greater than 16.4 feet (5 meters).
Semi-annual groundwater surface elevation results will be reported as specified in Permit Part 5, Condition 5.10.2.2.
The DMP data used in generating the Annual Culebra Groundwater Report will be maintained as part of the WIPP facility Operating Record and will be provided to NMED for review as specified in the permit.
L-6 Records Management
Records generated during groundwater sampling and water level monitoring will be maintained in either project files at the Permittees facility or the Operating Record. Project files will include, but are not limited to:
PERMIT ATTACHMENT LPage L-20 of 53
1234
1
2
345
67
8
91011
121314
15
16
1718
19
20
21
22
23
2425
262728
29
303132

Waste Isolation Pilot PlantHazardous Waste Permit
December 2017
Sampling and Analysis Plans (SAPs) SOPs Field Data Entry Sheets CofC/RFA forms Analytical Laboratory Data Reports Variance Logs and Nonconformance Reports Corrective Action Reports.
Detection Monitoring Program monitoring, testing, and analytical data and WLMP data will be maintained in the WIPP facility Operating Record.
L-7 Quality Assurance Requirements
Quality Assurance (QA) requirements specific to the DMP are presented in this section.
L-7a Data Quality Objectives and Quality Assurance Objectives
L-7a(1) Data Quality Objectives
Data Quality Objectives (DQOs) are qualitative and quantitative statements that specify the quality of data required to support project decisions. DQOs have been established to ensure that the data collected will be of a sufficient and known quality for their intended uses. The overall DQOs for this DMP are shown in the following sections.
L-7a(1)(i) Detection Monitoring Program
Collect accurate and defensible data of known quality that will be sufficient to assess the concentrations of constituents in the groundwater underlying the WIPP facility.
L-7a(1)(ii) Water Level Monitoring Program
Collect accurate and defensible data of known quality that will be sufficient to assess the groundwater flow direction and rate at the WIPP facility.
L-7a(2) Quality Assurance Objectives
Quality Assurance Objectives (QAOs) for measurement data have been specified in terms of accuracy, precision, completeness, representativeness, and comparability.
L-7a(2)(i) Accuracy
Accuracy is the closeness of agreement between a measurement and an accepted reference value. When applied to a set of observed values, accuracy is a combination of a random component and a common systematic error (bias) component. Measurements for accuracy will include analysis of calibration standards, laboratory control samples, matrix spike samples, and surrogate spike recoveries. The bias component of accuracy is expressed as percent recovery (%R). Percent recovery is expressed as follows:
PERMIT ATTACHMENT LPage L-21 of 53
1234
1234567
89
10
11
12
13
14151617
18
1920
21
2223
24
2526
27
28
293031323334

Waste Isolation Pilot PlantHazardous Waste PermitDecember 2017
%R=(measured sample concentration )
true concentration× 100
L-7a(2)(i)(A) Accuracy Objectives for Field Measurements
Field measurements will include pH, Specific Conductance (SC), temperature, specific gravity and static groundwater surface elevation. Field measurement accuracy will be determined using calibration standards. Thermometers used for field measurements will be calibrated to the National Institute for Standards and Technology (NIST) traceable standard on an annual basis to ensure accuracy. Accuracy of groundwater surface elevation measurements will be checked before each measurement period by verifying calibration of the device within the specified schedule. WIPP document WP 13-1 outlines the basic requirements for field equipment use and calibration. WIPP facility SOPs contains instructions that outline protocols for maintaining current calibration of groundwater surface elevation measurement instrumentation.
L-7a(2)(i)(B) Accuracy Objectives for Laboratory Measurements
Analytical system accuracy will be quantified using the following laboratory accuracy QC checks: calibration standards, laboratory control samples (LCS), laboratory blanks, matrix and surrogate spike recoveries. Single LCSs and matrix spike and surrogate spike sample analyses will be expressed as %R. Laboratory analytical accuracy is parameter dependent and will be prescribed in the laboratory SOP.
L-7a(2)(ii) Precision
Precision is the agreement among a set of replicate measurements without assumption or knowledge of the true value. Precision data will be derived from duplicate field and laboratory measurements. Precision will be expressed as relative percent difference (RPD), which is calculated as follows:
RPD=|(measured value sample 1 −measured value sample 2 )|
average of measured samples 1 + 2× 100
L-7a(2)(ii)(A) Precision Objectives for Field Measurements
Specific conductance, pH, and temperature will be measured during well purging and after sampling. SC measurements will be precise to ±10% pH to 0.10 standard unit, specific gravity to 0.01 by hydrometer and temperature to 0.10 degrees Celsius (°C). Water-level measurements will be precise to ± 0.01 ft. The precision of water density measurements, when measured in the field using down hole instrumentation, will be determined on a well-by-well basis and will result in no more than a ± 2 ft of error in the derived fresh-water head.
L-7a(2)(ii)(B) Precision Objectives for Laboratory Measurements
Precision of laboratory analyses will be determined by analyzing a LCS and a lab control sample duplicate (LCSD) or by analyzing one of the field samples in duplicate depending on the requirements of the particular standard method. The precision is measured as the RPD of the recoveries for the spiked LCS/LCSD pair or the RPD of the duplicate sample analysis results.
PERMIT ATTACHMENT LPage L-22 of 53
1234
1
2
3456789
1011
12
1314151617
18
19202122
23
24
252627282930
31
32333435

Waste Isolation Pilot PlantHazardous Waste Permit
December 2017
Laboratory analytical precision is also parameter dependent and will be prescribed in laboratory SOPs.
L-7a(2)(iii) Contamination
In addition to measurements of precision and bias, QC checks for contamination will be performed. QC samples including trip blanks, field blanks, and method blanks will be analyzed to assess and document contamination attributable to sample collection equipment, sample handling and shipping, and laboratory reagents and glassware. Trip blanks will be used to assess volatile organic compound (VOC) sample contamination during shipment and handling and will be collected and analyzed at a frequency of 1 sample per sample shipment. Field blanks will be used to assess field sample collection methods and will be collected and analyzed at a minimum frequency of one sample per 20 samples (five percent of the samples collected). Method blanks will be used to assess contamination resulting from the analytical process and will be analyzed at a minimum frequency of one sample per 20 samples, or five percent of the samples collected. Evaluation of sample blanks will be performed following U.S. EPA “National Functional Guidelines for Organic Data Review” (EPA, 1999) and “National Functional Guidelines for Evaluating Inorganics Analyses” (EPA, 2004). Only method blanks will be analyzed via wet chemistry methods. The criteria for evaluating method blanks will be established as follows: If method blank results exceed method reporting limits, then that value will become the detection limit for the sample batch. Detection of analytes of interest in method blank samples may be used to disqualify some samples, requiring resampling and additional analyses on a case-by-case basis.
L-7a(2)(iv) Completeness
Completeness is a measure of the amount of usable valid data resulting from a data collection activity, given the sample design and analysis. Completeness may be affected by unexpected conditions that may occur during the data collection process.
Occurrences that reduce the amount of data collected include sample container breakage during sample shipment or in the laboratory and data generated while the laboratory was operating outside prescribed QC limits. All attempts will be made to minimize data loss and to recover lost data whenever possible. The completeness objective for analysis of Part 5, Table 5.4a parameters will be 90 percent and 100 percent analysis of Part 5, Table 5.4.b hazardous constituents. If the completeness objective for Part 5 Table 5.4.b hazardous constituents is not met, the Permittees will determine the need for resampling on a case-by-case basis. Numerical expression of the completeness (%C) of data is as follows:
%C= number of accepted samplestotal number of samples collected
× 100
L-7a(2)(v) Representativeness
Representativeness is the degree to which sample analyses accurately and precisely represent the media they are intended to represent. Data representativeness for this DMP will be accomplished through implementing approved sampling procedures and the use of validated analytical methods. Sampling procedures will be designed to minimize factors affecting the integrity of the samples. Groundwater samples will only be collected after well purging criteria
PERMIT ATTACHMENT LPage L-23 of 53
1234
12
3
456789
101112131415161718192021
22
232425
2627282930313233
34
35
3637383940

Waste Isolation Pilot PlantHazardous Waste PermitDecember 2017
have been met. The analytical methods selected will be those that will most accurately and precisely represent the true concentration of analytes of interest.
For water levels and density, representativeness is a qualitative term that describes the extent to which a sampling design adequately reflects the environmental conditions of a site. The SOPs for measurement ensure that samples are representative of site conditions.
L-7a(2)(vi) Comparability
Comparability is the extent to which one data set can be compared to another. Comparability will be achieved through reporting data in consistent units and collection and analysis of samples using consistent methodology. Aqueous samples will consistently be reported in units of measures dictated by the analytical method. Units of measure include:
Milligrams per liter (mg/L) for alkalinity, inorganic compounds and metals Micrograms per liter (μg/L) for VOCs and semivolatile organic compounds (SVOCs).
Culebra groundwater surface elevation measurements will be expressed as equivalent freshwater elevation in feet above mean sea level.
L-7b Design Control
The approved design for the DMP is specified in this Permit. Modifications to the DMP will be processed in accordance with 20.4.1.900 NMAC (incorporating 40 CFR §§ 270.42).
L-7c Instructions, Procedures, and Drawings
The preparation and use of instructions and procedures at the WIPP facility are outlined in the WIPP facility document WP 13-1(see Table L-3). Activities performed for the DMP that may affect groundwater data quality will be performed in accordance with approved procedures which comply with the Permit.
L-7d Document Control
Permittees will ensure that the latest approved versions of WIPP facility SOPs will be used in performing groundwater monitoring functions and that obsolete materials will be adequately identified or removed from work areas.
L-7e Inspection and Surveillance
Inspection and surveillance activities will be conducted as outlined in WIPP document WP 13-1 (see Table L-3). The Permittees will be responsible for performing the applicable WIPP facility SOPs.
L-7f Control of Monitoring and Data Collection Equipment
WIPP document WP 13-1 (see Table L-3) outlines the basic requirements for control and calibrating monitoring and data collection (M&DC) equipment. M&DC equipment shall be properly controlled, calibrated, and maintained according to WIPP facility SOPs (see Table L-3) to ensure continued accuracy of groundwater monitoring data. Results of calibrations,
PERMIT ATTACHMENT LPage L-24 of 53
1234
12
345
6
789
10
1112
1314
15
1617
18
19202122
23
242526
27
282930
31
32333435

Waste Isolation Pilot PlantHazardous Waste Permit
December 2017
maintenance, and repair will be documented. Calibration records will identify the reference standard and the relationship to national standards or nationally accepted measurement systems. Records will be maintained to track uses of M&DC equipment. If M&DC equipment is found to be out of tolerance, the equipment will be tagged and it will not be used until corrections are made.
L-7g Control of Nonconforming Conditions
In accordance with WP 13-1 (see Table L-3), equipment that does not conform to specified requirements will be controlled to prevent use. The disposition of defective items will be documented on records traceable to the affected items. Prior to final disposition, faulty items will be tagged and segregated. Repaired equipment will be subject to the original acceptance inspections and tests prior to use.
L-7h Corrective Action
Requirements for the development and implementation of a system to determine, document, and initiate appropriate corrective actions after encountering conditions adverse to quality at the WIPP facility are outlined in WIPP document WP 13-1 (see Table L-3). Conditions adverse to acceptable quality will be documented and reported in accordance with corrective action procedures and corrected as soon as practical. Immediate action will be taken to control work performed under conditions adverse to acceptable quality and its results to prevent quality degradation.
L-7i Quality Assurance Records
WIPP document WP 13-1(see Table L-3) outlines the policy that will be used at the WIPP facility regarding identification, preparation, collection, storage, maintenance, disposition, and permanent storage of QA records.
Records to be generated in the DMP will be specified by procedure. QA and RCRA operating records will be identified. This will be the basis for the labeling of records as “QA” or “RCRA operating record” on the Environmental Monitoring Records Inventory and Disposition Schedule.
PERMIT ATTACHMENT LPage L-25 of 53
1234
12345
6
789
1011
12
13141516171819
20
212223
242526
27

Waste Isolation Pilot PlantHazardous Waste PermitDecember 2017
L-8 References
Beauheim, R.L., 1986. “Hydraulic-Test Interpretations for Well DOE-2 at the Waste Isolation Pilot Plant (WIPP) Site,” SAND86-1364, Sandia National Laboratories/New Mexico, Albuquerque, New Mexico.
Beauheim, R.L., 1987. “Analysis of Pumping Tests at the Culebra Dolomite Conducted at the H-3 Hydropad at the Waste Isolation Pilot Plant (WIPP) Site,” SAND86-2311, Sandia National Laboratories/New Mexico, Albuquerque, New Mexico.
Corbet, T.F., and P.M. Knupp, 1996. “The Role of Regional Groundwater Flow in the Hydrogeology of the Culebra Member of the Rustler Formation at the Waste Isolation Pilot Plant (WIPP), Southeastern New Mexico,” SAND96-2133, Sandia National Laboratories/New Mexico, Albuquerque, New Mexico.
Crawley, M. and M. Nagy, 1998. “WIPP RCRA Background Groundwater Quality Baseline Report,” DOE/WIPP-98-2285.
Davies, P.B., 1989. “Variable-Density Ground-Water Flow and Paleohydrology in the Waste Isolation Pilot Plant (WIPP) Region, Southeastern New Mexico,” U.S. Geological Survey Open-File Report 88-490, Albuquerque, New Mexico.
DOE, see U.S. Department of Energy.
Domenico, P.A., and F.W. Schwartz, 1990. “Physical and Chemical Hydrogeology,” New York: John Wiley & Sons, Textbook.
Domski, P.S., and R.L. Beauheim. 2008. Evaluation of Culebra Brine Chemistry. AP-125. ERMS 549336. Carlsbad, NM: Sandia National Laboratories. (In development)
Domski, P.S., D.T. Upton, and R.L. Beauheim, 1996. “Hydraulic Testing Around Room Q: Evaluation of the Effects of Mining on the Hydraulic Properties of Salado Evaporites,” SAND96-0435, Sandia National Laboratories/New Mexico, Albuquerque, New Mexico.
Earlough, E.C., Jr., 1977. “Advances in Well Test Analysis,”: Society of Petroleum Engineers of AIME, Textbook, Dallas, Texas.
EPA, see U.S. Environmental Protection Agency.
Holt, R.M., and D.W. Powers, 1988. “Facies Variability and Post-Deposition Alteration Within the Rustler Formation in the Vicinity of the Waste Isolation Pilot Plant, Southeastern New Mexico,” DOE-WIPP-88-04, U.S. Department of Energy, Carlsbad, New Mexico.
IT Corporation, “2000 Addendum 1 Waste Isolation Pilot Plant RCRA Background Groundwater Quality Baseline Update Report.” Albuquerque, New Mexico.
Kuhlman, K.L. 2010. Analysis Report, AP-111 Revision 1, Culebra Water Level Monitoring Network Design. ERMS 554054. Carlsbad, NM: Sandia National Laboratories.
PERMIT ATTACHMENT LPage L-26 of 53
1234
1
234
567
89
1011
1213
141516
17
1819
2021
222324
2526
27
282930
3132
3334

Waste Isolation Pilot PlantHazardous Waste Permit
December 2017
McKenna, S. A. 2004. Analysis Report: Culebra Water Level Monitoring Network Design. AP-111. ERMS 540477. Carlsbad, NM: Sandia National Laboratories.
Mercer, J.W., 1983. “Geohydrology of the Proposed Waste Isolation Pilot Plant Site, Los Medaños Area, Southeastern New Mexico,” U.S. Geological Survey, Water Resources Investigations 83-4016, 113 pp.
Powers, D. W. 2006. Analysis Report: Task 1B of AP-114; Identify Possible Area of Recharge to the Culebra West and South of WIPP (April 1). ERMS 543094. Carlsbad, NM: Sandia National Laboratories.
Roberts, R. M. 2007. Analysis of Culebra Hydraulic Tests Performed Between June 2006 and September 2007. ERMS 547418. Carlsbad, NM: Sandia National Laboratories.
Siegel, M.D., K. L. Robinson, and J. Myers. 1991. “Solute Relationships in Groundwaters from the Culebra Dolomite and Related Rocks in the Waste Isolation Pilot Plant Area, Southeastern New Mexico,” SAND88-0196.
U.S. Department of Energy (DOE), 1995. “Basic Data Report for WQSP-1 through WQSP-6A,” DOE/WIPP-95-2154.
U.S. Department of Energy (DOE), 2009, WIPP Hazardous Waste Facility Permit Amended Renewal Application, Carlsbad, New Mexico.
U.S. Environmental Protection Agency (EPA), 2009. “Statistical Analysis of Ground-Water Monitoring Data at RCRA Facilities, Unified Guidance,” U.S. Environmental Protection Agency, Washington, D.C.
U.S. Environmental Protection Agency (EPA), 1999. “National Functional Guidelines for Organic Data Review,” U.S. Environmental Protection Agency, Washington, D.C.
U.S. Environmental Protection Agency (EPA), 1990. “Background Documentation for the U.S. Environmental Protection Agency’s Proposed Decision on the No-Migration Variance for U.S. Department of Energy’s Waste Isolation Pilot Plant,” U.S. Environmental Protection Agency, Washington, D.C.
U.S. Environmental Protection Agency (EPA), 2004. “Functional Guidelines for Evaluating Inorganics Analyses,” U.S. Environmental Protection Agency, Washington, D.C.
U.S. Environmental Protection Agency (EPA), 1986. “RCRA Ground-Water Monitoring Technical Enforcement Guidance Document,” U.S. Environmental Protection Agency, Washington, D.C.
U.S. Environmental Protection Agency (EPA), 1996. “Test Methods for Evaluating Solid Waste,” SW-846, third ed., Office of Solid Waste and Emergency Response, Washington, D.C.
PERMIT ATTACHMENT LPage L-27 of 53
1234
12
345
678
910
111213
1415
1617
181920
2122
23242526
2728
293031
3233

Waste Isolation Pilot PlantHazardous Waste PermitDecember 2017
TABLES
PERMIT ATTACHMENT LPage L-28 of 53
1234
1
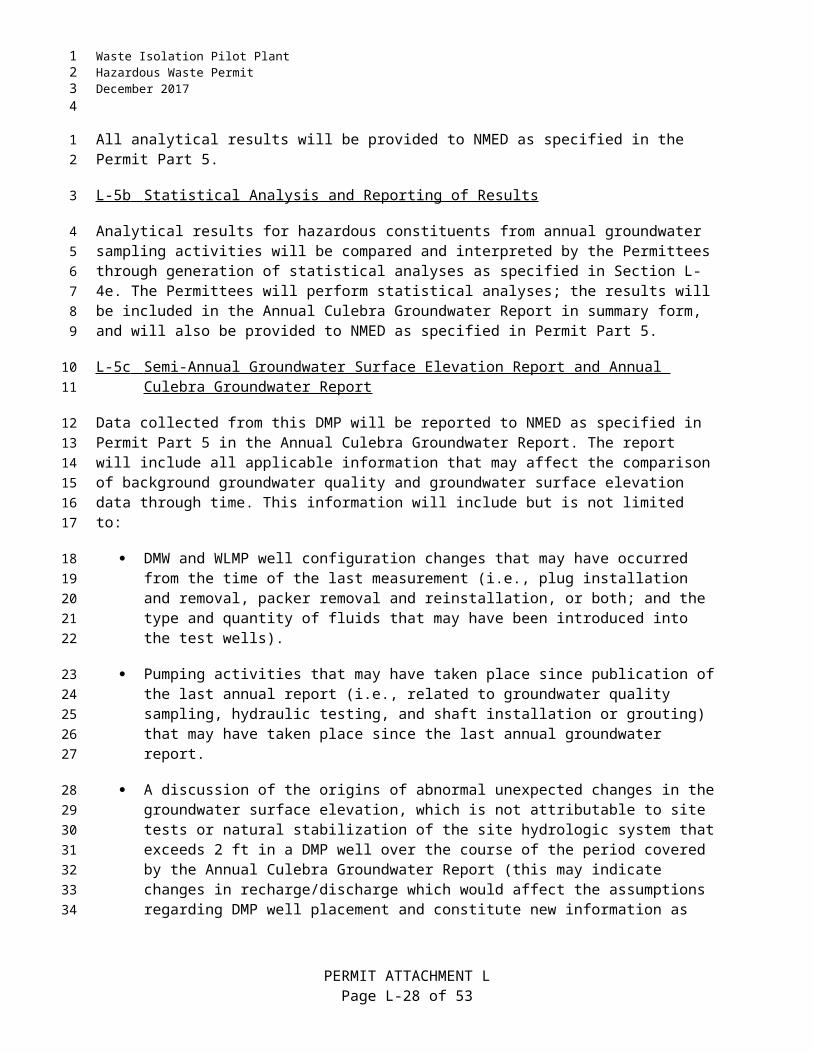
Waste Isolation Pilot PlantHazardous Waste Permit
December 2017
(This page intentionally blank)
PERMIT ATTACHMENT LPage L-29 of 53
1234
1

Waste Isolation Pilot PlantHazardous Waste PermitDecember 2017
Table L-1Hydrological Parameters for Rock Units above the Salado at WIPP
UnitHydraulic
Conductivity Storage Thickness Hydraulic GradientSanta Rosa 2 × 10⁻⁸ to 2 × 10⁻⁶
m/s (1) (2)0 to 91 m 0.001 (5)
Dewey Lake 10−8 m/s Specific storage 1 × 10⁻⁵ (1/m) (2)
152 m 0.001 (5)
Rustler
Forty-niner 1 × 10⁻¹³ to 1 × 10⁻¹¹ m/s (anhydrite) 1 × 10⁻⁹ m/s (mudstone) (2)
Specific storage 1 × 10⁻⁵ (1/m) (2)
13 to 23 m NA (6)
Magenta 1 × 10−8.5 to 1 × 10−6.5 m/s (2)
Specific storage 1 × 10⁻⁵ (1/m) (2)
7 to 8.5 m 3 to 6
Tamarisk 1 × 10⁻¹³ to 1 × 10⁻¹¹ m/s (anhydrite) 1 × 10⁻⁹ m/s (mudstone) (2)
Specific storage 1 × 10⁻⁵ (1/m) (2)
26 to 56 m NA (6)
Culebra 1 × 10−7.5 to 1 × 10−5.5 m/s (2)
Specific storage 1 × 10⁻⁵ (1/m) (2)
4 to 11.6 m 0.003 to 0.007 (5)
Los Medaños
6 × 10⁻¹⁵ to 1 × 10⁻¹³ m/s 1.5 × 10⁻¹¹ to 1.2 × 10⁻¹¹ m/s (basal interval)
Specific storage 1 × 10⁻⁵ (1/m) (2)
29 to 38 m NA (6)
Matrix characteristics relevant to fluid flow include values used in this table such as permeability, hydraulic conductivity, gradient, etc.)Table Notes:(1) The Santa Rosa Formation is not present in the western portion of the WIPP site. It was combined with the
Dewey Lake Red Beds in three-dimensional regional groundwater flow modeling (Corbet and Knupp, 1996), and the range of values entered here are those used in that study for the Dewey Lake/Triassic hydrostratigraphic unit.
(2) Values or ranges of values given for these entries are the values used in three-dimensional regional groundwater flow modeling (Corbet and Knupp, 1996). Values are estimated based on literature values for similar rock types, adjusted to be consistent with site-specific data where available. Ranges of values include spatial variation over the WIPP site and differences in values used in different simulations to test model sensitivity to the parameter.
PERMIT ATTACHMENT LPage L-30 of 53
1234
12

Waste Isolation Pilot PlantHazardous Waste Permit
December 2017
(3) Hydraulic gradient is a dimensionless term describing change in the elevation of hydraulic head divided by change in horizontal distance. Values given in these entries are determined from potentiometric surfaces. The range of values given for the Culebra reflects the highest and lowest gradients observed within the WIPP site boundary. Values for the Dewey Lake and Santa Rosa are assumed to be the same as the gradient determined from the water table. Note that the Santa Rosa Formation is absent or above the water table in most of the controlled area, and that the concept of a horizontal hydraulic gradient is not meaningful for these regions.
(4) Flow in units of very low hydraulic conductivity is slow, and primarily vertical. The concept of a horizontal hydraulic gradient is not applicable.
Sources: Beauheim, 1986; Domenico and Schwartz, 1990; Domski, Upton, and Beauheim, 1996; Earlough, 1977.
PERMIT ATTACHMENT LPage L-31 of 53
1234

Waste Isolation Pilot PlantHazardous Waste PermitDecember 2017
Table L-2WIPP Groundwater Detection Monitoring Program Sample Collection and
Groundwater Surface Elevation Measurement Frequency
Installation FrequencyGroundwater Quality Sampling
DMWs Annually
Groundwater Surface Elevation Monitoring
DMWs Monthly and prior to sampling events
WLMP Wells (see Table L-4) Monthly
PERMIT ATTACHMENT LPage L-32 of 53
1234
123

Waste Isolation Pilot PlantHazardous Waste Permit
December 2017
Table L-3Standard Operating Procedures Applicable to the DMP
Number Title/DescriptionWP 02-EM1010 Field Parameter Measurements and Final Sample Collection: This procedure provides general
instructions necessary to perform field analyses of serial samples in support of the DMP. Serial samples are collected and analyzed at the field laboratory for field indicators. Serial sample results help determine if pumped groundwater is representative of undisturbed groundwater within the formation. This procedure also describes the steps for collecting groundwater samples from the DMWs near the WIPP facility. Samples are collected and analyzed at the Field Laboratory until stabilization of the field parameters occurs. Final samples for Resource Conservation and Recovery Act (RCRA) analyses are collected and analyzed by a contract laboratory.
WP 02-EM1014 Groundwater Level Measurement: This document describes the method used for groundwater level measurements in support of groundwater monitoring at the WIPP facility using a portable electronic water-level probe.
WP 02-EM1026 Water Level Data Handling and Reporting: This procedure provides instructions on handling water level data. Data are collected and recorded on field forms in accordance with WP 02-EM1014. This procedure is initiated when wells in the water surveillance program have been measured for a given month.
WP 02-EM3001 Administrative Processes for Environmental Monitoring and Hydrology Programs: This procedure provides the administrative guidance environmental monitoring personnel use to maintain quality control associated with environmental monitoring sampling and reporting activities. This administrative procedure does not pertain to volatile organic compound (VOC) monitoring, with the exception of Section 5.0 which pertains to the regulatory reporting review process.
WP 02-EM3003 Data Validation and Verification of RCRA Constituents: This procedure provides instructions on performing verification and validation of laboratory data containing the analytical results of groundwater monitoring samples. This procedure is applied only to the non-radiological analyses results for compliance data associated with the detection monitoring samples. The data reviewed for this procedure includes general chemistry parameters and RCRA constituents.
WP-02-RC.01 Hazardous and Universal Waste Management Plan: This plan describes the responsibilities and handling requirements for hazardous and universal wastes generated at the WIPP facility. It is meant to ensure that these wastes are properly handled, accumulated, and transported to an approved Treatment, Storage, Disposal Facility (TSDF) in accordance with applicable state and federal regulations, U.S. Department of Energy (DOE) Orders, and Management and Operating Contractor (MOC) policies and procedures. This plan implements applicable sections of 20.4.1.100-1102 New Mexico Administrative Code (NMAC), Hazardous Waste Management (incorporating 40 Code of Federal Regulations [CFR] Parts 260-268 and 273).
WP 10-AD3029 Calibration and Control of Monitoring and Data Collection Equipment: This procedure provides direction for the control and calibration of Monitoring and Data Collection (M&DC) equipment at the WIPP facility, and ensures traceability to NIST (National Institute of Standards and Technology) standards, international standards, or intrinsic standards. This procedure also establishes requirements and responsibilities for identifying recall equipment, and for obtaining calibration services for WIPP facility M&DC equipment.
WP 13-1 Management and Operating Contractor Quality Assurance Program Description: This document establishes the minimum quality requirements for MOC personnel and guidance for the development and implementation of QA programs by MOC organizations.
PERMIT ATTACHMENT LPage L-33 of 53
1234
12
3

Waste Isolation Pilot PlantHazardous Waste PermitDecember 2017
Table L-4List of Culebra Wells in the WLMP, Current as of October 2017
WELL ID WELL ID WELL IDAEC-7R H-17 SNL-15
C-2737 H-19 pad* SNL-16
ERDA-9 I-461 SNL-17
H-02b2 SNL-01 SNL-18
H-03b2 SNL-02 SNL-19
H-04bR SNL-03 WQSP-1
H-05b SNL-05 WQSP-2
H-06bR SNL-06 WQSP-3
H-07b1 SNL-08 WQSP-4
H-9bR SNL-09 WQSP-5
H-10cR SNL-10 WQSP-6
H-11b4R SNL-12 WIPP-11
H-12R SNL-13 WIPP-13
H-15R SNL-14 WIPP-19
H-16
*The water level for the H-19b0 well on the H-19 pad is measured monthly; the fluid density measured annually at well H-19b0 will be
used to correct for freshwater head for the other wells on the H-19 pad (H-19b2, H-19b3, H-19b4, H-19b5, H-19b6, and H-19b7)
PERMIT ATTACHMENT LPage L-34 of 53
1234
12

Waste Isolation Pilot PlantHazardous Waste Permit
December 2017
Table L-5Details of Construction for the Six Culebra Detection Monitoring Wells
NAME(Figure)
DATE DRILLED
TOTAL DEPTH
feet (meters) bgs
DEPTH INTO LOS MEDAÑOS
feet (meters)
DRILLING DEPTHSfeet (meters) bgs
CASING feet (meters) bgs
PACKINGfeet (meters) bgs CULEBRA
INTERVALfeet (meters)
bgsWITH AIR CORINGDEPTH FOR
5 in. CASING
INTERVAL FOR
SLOTTED SCREEN
SAND PACK INTERVAL
BRADY GRAVEL
PACK INTERVAL
WQSP-1 Figure L-7
September 13 through 16, 1994
737 (225) 15 (5) 696 (212) 696 to 737 (212 to 225) 737 (225 ) 702 to 727
(214 to 222 )640 to 651
(195 to 198)651 to 737
(198 to 225)699 to 722
(213 to 220)
WQSP-2 Figure L-8
September 6 through 12, 1994
846 (258) 12 (4) 800 (244) 800 to 846 (244 to 258) 846 (258) 811 to 836
(247 to 255)790 to 793
(241 to 242)793 to 846
(242 to 258)810.1 to 833.7 (247 to 254)
WQSP-3 Figure L-9
October 20 through 26, 1994
880 (268) 10 (3) 833 (254) 833 to 880 (254 to 268) 880 (268) 844 to 869
(257 to 265)827 to 830
(252 to 253)830 to 880
(253 to 268)844 to 870
(257 to 265)
WQSP-4 Figure L-10
October 5 through 10, 1994,
800 (244) 9 (3) 740 (226) 740 to 798 (226 to 243) 800 (244) 764 to 789
(233 to 240)752 to 755
(229 to 230)755 to 800
(230 to 244)766 to 790.8 (233 to 241)
WQSP-5 Figure L-11
October 12 through 18, 1994,
681 (208) 7 (2) 648 (198) 648 to 676 (198 to 206) 681 (208) 646 to 671
(197 to 205)623 to 626
(190 to 191)626 to 681
(191 to 208)648 to 674.4 (198 to 205)
WQSP-6 Figure L-12
September 26 through October 3, 1994
616.6 (188) 10 (3) 568 (173) 568 to 617 (173 to 188) 617 (188) 581 to 606
(177 to 185)567 to 570
(173 to 174)570 to 616.6 (174 to 188)
582 to 606.9 (177 to 185)
PERMIT ATTACHMENT LPage L-35 of 53
1234
12
3
4
5
6

Waste Isolation Pilot PlantHazardous Waste PermitDecember 2017
Table L-6Analytical Parameter and Sample Requirements
(10)PARAMETERS
(12)NO. OF
BOTTLES
(13)VOLUME
(14)TYPE
(15)ACID WASH
(16)SAMPLE FILTER
(17)PRESERVATIVE
(18)HOLDING TIME
Indicator1 Parameters: pH SC TOC
--4
25 ml2100 ml215 ml2
GlassGlassGlass
Field determinedField determinedyes
No?NoNo
Field determinedField determinedHCl
NoneNone28 days2
General Chemistry 1 1 Liter Plastic Yes No HNO3,4pH<2 not specified in DMP
Phenolics 1 1 Liter Amber Glass Yes No H2SO4, pH<2 not specified in DMP
Metals/Cations 2 1 Liter Plastic Yes No HNO3, pH<2 6 months2,3
VOC 4 40 ml Glass No No HCL, ph<2 14 days2
VOC (Purgable) 2 40 ml Glass No No HCL, ph<2 14 days2
VOC (Non-Purgable) 2 40 ml Glass No No HCL, ph<2 14 days2
BN/As 1 ½ Gallon Amber Glass Yes No None
TCLP 1 1 Liter Plastic Yes No HNO3, pH<2 7 days2
Cyanide (Total) 1 1 Liter Plastic Yes No NaOH, pH>12 14 days2
Sulfide 1 250 ml Amber Glass Yes No NaOH + Zn Acetate
28 days2
Radionuclides 1 1 Gallon Plastic Cube Yes Yes HNO3, pH<2 6 months2
1 = RCRA Detection Monitoring Analytes2 = As specified in Table 4-1 of the RCRA TEGD3 = Reduced holding time of 1 week for WIPP-specific Divalent cation 2 samples noted in the GMDNote: Unless otherwise indicated, data are from DOE Procedure WP 02-EM1006 methods and are provided as information only.Note: Deviations from this table are allowed with prior approval by the NMED.
PERMIT ATTACHMENT LPage L-36 of 53
1234
1
23

Waste Isolation Pilot PlantHazardous Waste Permit
December 2017
(This page intentionally blank)
PERMIT ATTACHMENT LPage L-37 of 53
1234
1
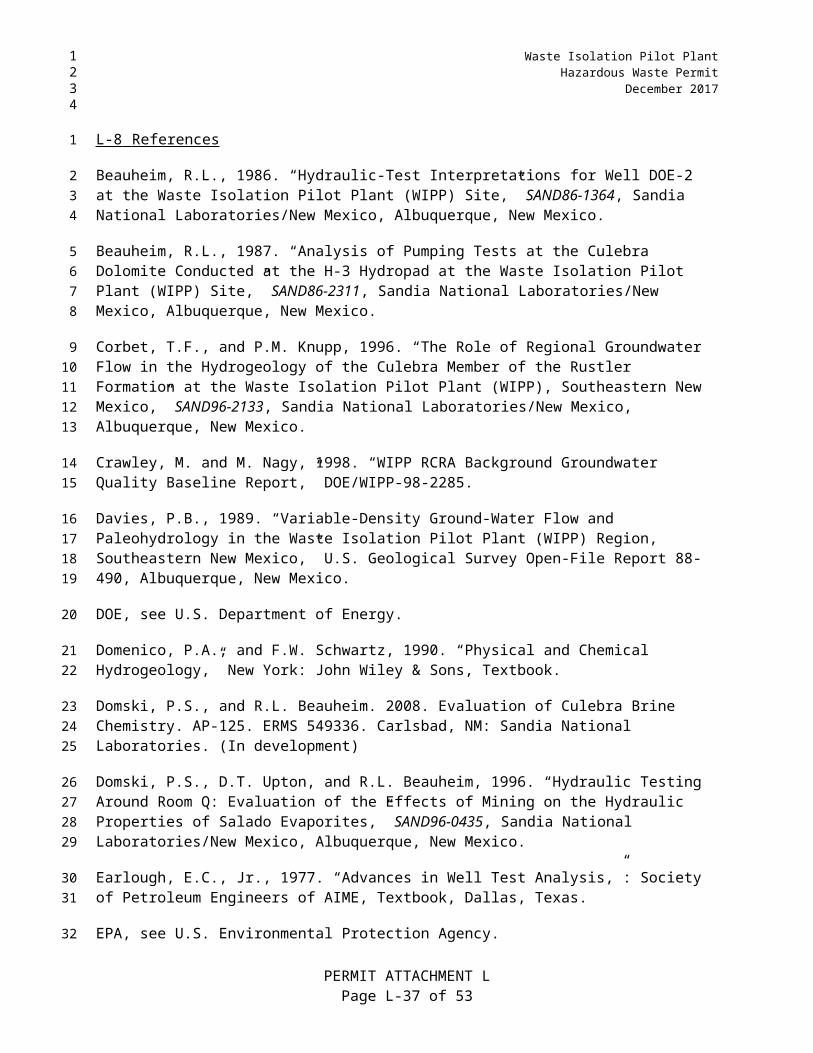
Waste Isolation Pilot PlantHazardous Waste PermitDecember 2017
FIGURES
PERMIT ATTACHMENT LPage L-38 of 53
1234
1

Waste Isolation Pilot PlantHazardous Waste Permit
December 2017
(This page intentionally blank)
PERMIT ATTACHMENT LPage L-39 of 53
1234
1

Waste Isolation Pilot PlantHazardous Waste PermitDecember 2017
Figure L-1General Location of the WIPP Facility
PERMIT ATTACHMENT LPage L-40 of 53
1234

Waste Isolation Pilot PlantHazardous Waste Permit
December 2017
Figure L-2WIPP Facility Boundaries Showing 16-square-Mile Land Withdrawal Boundary
PERMIT ATTACHMENT LPage L-41 of 53
1234

Waste Isolation Pilot PlantHazardous Waste PermitDecember 2017
Figure L-3Site Geologic Column
PERMIT ATTACHMENT LPage L-42 of 53
1234

Waste Isolation Pilot PlantHazardous Waste Permit
December 2017
Figure L-4Generalized Stratigraphic Cross Section above Bell Canyon Formation at WIPP Site
PERMIT ATTACHMENT LPage L-43 of 53
1234

Waste Isolation Pilot PlantHazardous Waste PermitDecember 2017
Figure L-5Culebra Freshwater-Head Potentiometric Surface
PERMIT ATTACHMENT LPage L-44 of 53
1234
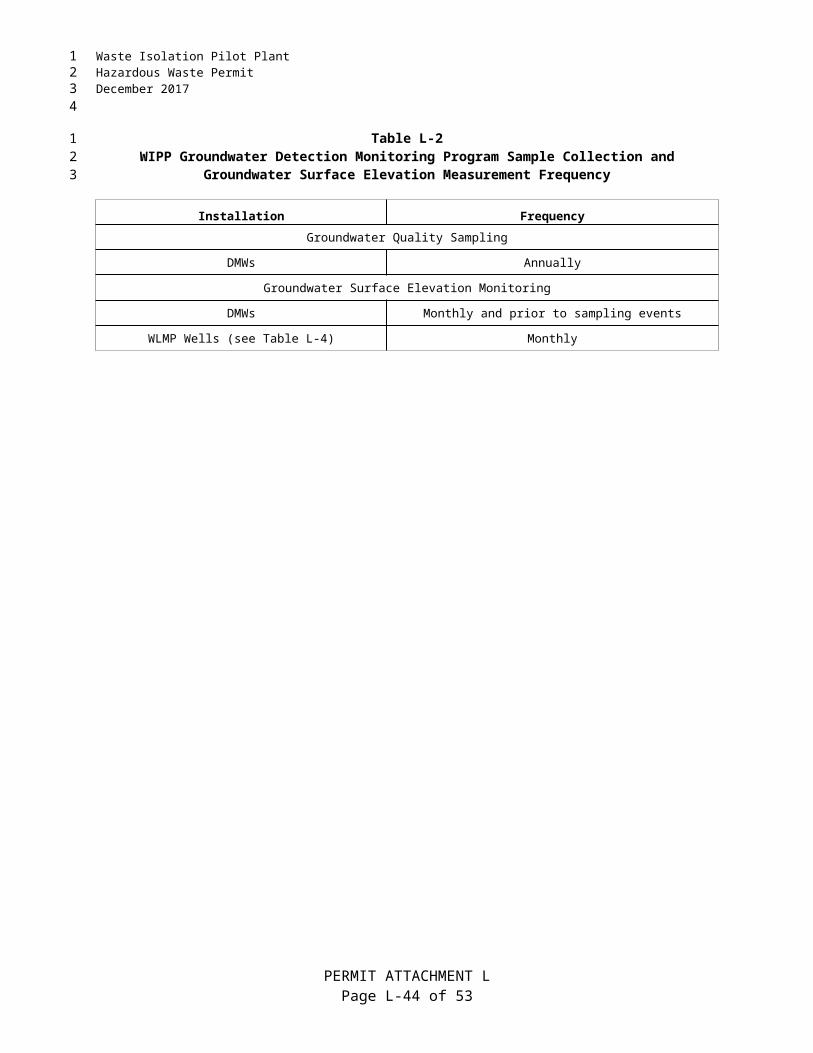
Waste Isolation Pilot PlantHazardous Waste Permit
December 2017
Figure L-6Detection Monitoring Well Locations
PERMIT ATTACHMENT LPage L-45 of 53
1234

Waste Isolation Pilot PlantHazardous Waste PermitDecember 2017
Figure L-7As-Built Configuration of Well WQSP-1
PERMIT ATTACHMENT LPage L-46 of 53
1234
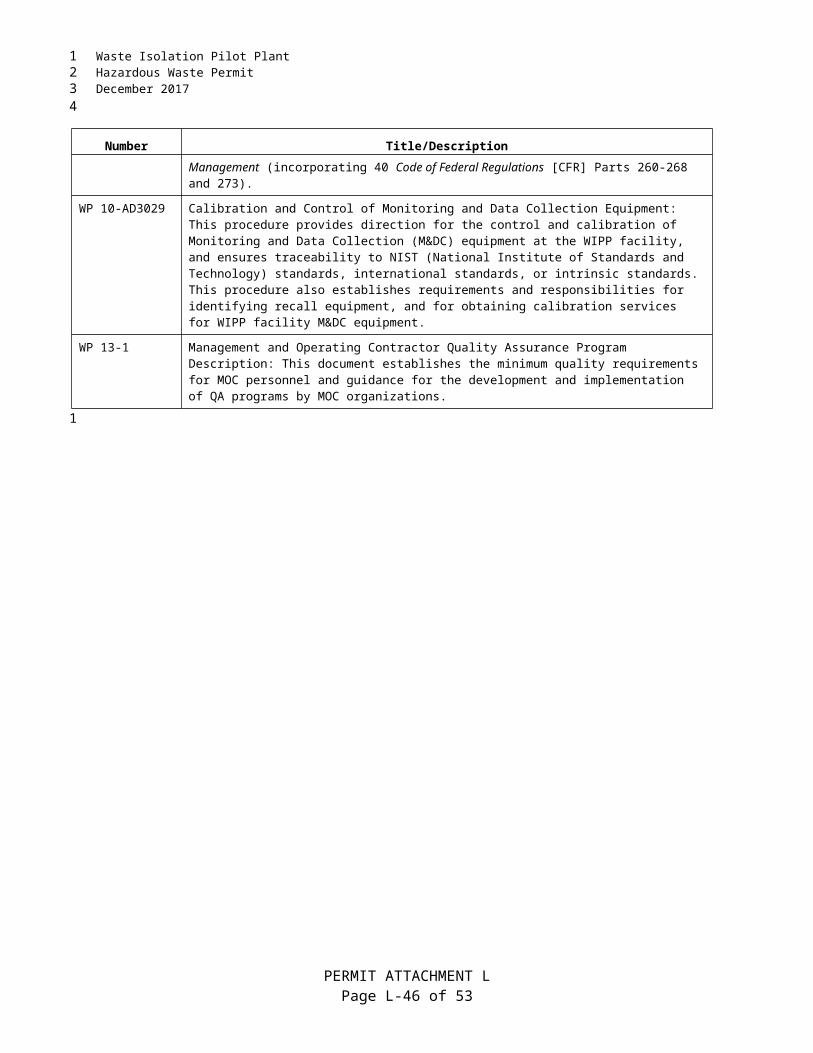
Waste Isolation Pilot PlantHazardous Waste Permit
December 2017
Figure L-8As-Built Configuration of Well WQSP-2
PERMIT ATTACHMENT LPage L-47 of 53
1234

Waste Isolation Pilot PlantHazardous Waste PermitDecember 2017
Figure L-9As-Built Configuration of Well WQSP-3
PERMIT ATTACHMENT LPage L-48 of 53
1234

Waste Isolation Pilot PlantHazardous Waste Permit
December 2017
Figure L-10As-Built Configuration of Well WQSP-4
PERMIT ATTACHMENT LPage L-49 of 53
1234

Waste Isolation Pilot PlantHazardous Waste PermitDecember 2017
Figure L-11As-Built Configuration of Well WQSP-5
PERMIT ATTACHMENT LPage L-50 of 53
1234

Waste Isolation Pilot PlantHazardous Waste Permit
December 2017
Figure L-12As-Built Configuration of Well WQSP-6
PERMIT ATTACHMENT LPage L-51 of 53
1234

Waste Isolation Pilot PlantHazardous Waste PermitDecember 2017
Figure L-13Example Chain-of-Custody/Request for Analysis Form
PERMIT ATTACHMENT LPage L-52 of 53
1234

Waste Isolation Pilot PlantHazardous Waste Permit
December 2017
Figure L-14Groundwater Level Surveillance Wells
(inset represents the groundwater surveillance wells in WIPP Land Withdrawal Area)
PERMIT ATTACHMENT LPage L-53 of 53
1234
1