attention deficit/hyperactivity disorder (adhd) … · josé jesús gázquez, university of...
TRANSCRIPT

fpsyg-07-01406 September 21, 2016 Time: 12:54 # 1
ORIGINAL RESEARCHpublished: 21 September 2016
doi: 10.3389/fpsyg.2016.01406
Edited by:José Jesús Gázquez,
University of Almería, Spain
Reviewed by:Ana Miranda,
University of Valencia, SpainRaquel Fidalgo,
University of León, Spain
*Correspondence:Celestino Rodríguez
Specialty section:This article was submitted to
Educational Psychology,a section of the journalFrontiers in Psychology
Received: 09 July 2016Accepted: 02 September 2016Published: 21 September 2016
Citation:Rodríguez C, González-Castro P,
Cueli M, Areces D andGonzález-Pienda JA (2016) AttentionDeficit/Hyperactivity Disorder (ADHD)
Diagnosis: An Activation-ExecutiveModel. Front. Psychol. 7:1406.
doi: 10.3389/fpsyg.2016.01406
Attention Deficit/HyperactivityDisorder (ADHD) Diagnosis: AnActivation-Executive ModelCelestino Rodríguez*, Paloma González-Castro, Marisol Cueli, Debora Areces andJulio A. González-Pienda
Department of Psychology, Faculty of Psychology, University of Oviedo, Oviedo, Spain
Attention deficit with, or without, hyperactivity and impulsivity (ADHD) is categorized asneuro-developmental disorder. ADHD is a common disorder in childhood and one ofthe most frequent conditions affecting school ages. This disorder is characterized by apersistent behavioral pattern associated with inattention, over-activity (or hyperactivity),and difficulty in controlling impulses. Current research suggests the existence of certainpatterns of cortical activation and executive control, which could more objectivelyidentify ADHD. Through the use of a risk and resilience model, this research aimedto analyze the interaction between brain activation variables (nirHEG and Q-EEG) andexecutive variables (Continuous performance test -CPT-) in subjects with ADHD. Thestudy involved 499 children, 175 females (35.1%) and 324 males (64.91%); aged from 6to 16 years (M = 11.22, SD = 1.43). Two hundred and fifty six of the children had beendiagnosed with Attention Deficit Hyperactivity Disorder (ADHD) and 243 were withoutADHD. For the analysis of this objective, a causal model was designed to include thefollowing different measures of task-execution: CPT TOVA (omissions, commissions,response time, variability, D prime and the ADHD Index); electrical activity (using Q-EEG);and blood-flow oxygenation activity (using nirHEG). The causal model was tested bymeans of structural equation modeling (SEM). The model that had been constructedwas based upon three general assumptions: (1) There are different causal models forchildren with ADHD and those without ADHD; (2) The activation measures influencestudents’ executive performance; and (3) There are measurable structural differencesbetween the ADHD and control group models (executive and activation). In general,the results showed that: (a) activation measures influence executive patterns differently,(b) the relationship between activation variables (nirHEG and Q-EEG) depends on thebrain zone being studied, (c) both groups showed important differences in variablescorrelation, with a good fit in each model (with and without ADHD). Lastly, the resultswere analyzed with a view to the diagnosis procedure. Therefore, we discuss theimplications for future research.
Keywords: activation, execution, ADHD, diagnosis, blood-flow oxygenation, structural equation modeling
INTRODUCTION
Attention deficit with, or without, hyperactivity and impulsivity (ADHD) is one of the disordersthat most affects academic performance. Current research suggests the existence of certain patternsof cortical activation and executive control, which could more objectively identify ADHD. Todetect these patterns, brain activation variables are recorded in the areas of central and prefrontal
Frontiers in Psychology | www.frontiersin.org 1 September 2016 | Volume 7 | Article 1406

fpsyg-07-01406 September 21, 2016 Time: 12:54 # 2
Rodríguez et al. ADHD Diagnosis Model
cortex through electro-encephalographic techniques such asquantified EEG (Q-EEG) to measure beta-theta electrical activityratios (González-Castro et al., 2013), as well as oxygenated blood-flow in the brain (hemo-encephalography: nirHEG) (Toomimet al., 2005; Toomim and Carmen, 2009). In addition, executivecontrol is evaluated with tests to verify levels of cortical activationby measuring performance during a lengthy repetitive taskknown as the Continuous Performance Test (CPT).
On the other hand, with the publication of the new DSM-5 classification manual (American Psychiatric and Association[APA], 2013), ADHD is now categorized as neuro-developmentaldisorder. While there were no significant changes in terms ofthe main symptoms of the disorder, with respect to classificationthere are now three types of presentations (instead of subtypes)of ADHD: predominantly hyperactive/impulsive; predominantlyinattentive; and combined presentation. However, regardless ofthe names used for classification, much research has investigatedif ADHD subtypes (or types of presentation) differ in theirdevelopment or in their epidemiology (Willcutt et al., 2012), andalso whether different comorbidities generally associated with thedisorders are dependent upon the subtype (Sciberras et al., 2014).
ADHD, Cortical Activation and ExecutionAlthough there is a substantial body of symptom-based evidencehighlighting the neurologic nature the disorder, the primarycausal factors underlying this problem remain unclear to date(Rubia et al., 2011; Tsujimoto et al., 2013; Congdon et al., 2014).
Within this context, some investigations point to a delay inmyelination formation during brain development (Sowell et al.,2003), or insufficient white matter in the frontal lobe (Mostofskyet al., 2002). A further potential factor may be early dysfunctionsin executive functions associated with fronto-thalamic circuits(Brown, 2006), which have a direct impact on cortical activationlevels (Lubar et al., 1995; Álvarez et al., 2008; Cortese et al., 2012;Orinstein and Stevens, 2014).
From a general perspective, ADHD has been associated witha dysfunction in the central nervous system, characterized bya developmental delay and cortical hypo-activation related to adeficit in the dopaminergic and noradrenergic systems (Bledsoeet al., 2011). The noradrenergic system is primarily responsiblefor the modulation of selective attention and the levels of generalactivation that an individual needs to perform a task (Brown,2006). The dopaminergic system, in turn, is associated withthe ability to control one’s behavior, both at an executive andmotivational level. Thus, this low cortical activation associatedwith dopaminergic and noradrenergic systems would at leastpartially explain the inhibitory and attentional deficits thatcharacterize ADHD (Cubillo et al., 2012). Furthermore, theinvestigation of González-Castro et al. (2013) showed that the lowactivation in prefrontal areas was reflected in different patterns ofexecutive control measured in a CPT.
The above hypothesis is supported by neo-connectionistlearning models, which have also linked cortical activation(measured by means of frequency fields) with the cortical areasinvolved in ADHD (Congedo and Lubar, 2003; Orlando andRivera, 2004; Mazaheri et al., 2014; Orinstein and Stevens, 2014).When the subject is distracted, frequency fields are characterized
by delta or theta waves, with a frequency of 0.5–4 Hz and 4–8 Hz,respectively. When the subject is relaxed with scattered attention,brain theta waves have values between 8 and 12 Hz. Finally, whenthe subject is in an alert state, beta waves with frequency rangesfrom 15 to 35 Hz are dominant. These waves are produced bybrain metabolism and blood flow, as shown by Lubar et al. (1995).In this sense, an increase in theta activity would be accompaniedby decreases in blood flow and brain metabolism. Hence, highfrequencies of theta activity are commonly observed in brainareas with low activation (Álvarez et al., 2008).
Concerning ADHD, a differential pattern of electro-corticalactivity has been observed in a state of rest, and it is characterizedby increased theta -and decreased beta- activity (Lansbergenet al., 2011). This profile has been reflected in different studieswith a low cortical activity associated with decreased beta activityin central and prefrontal brain regions in students with ADHD(Ernst et al., 2003). The detection of this pattern of corticalhypo-activation has been made using different neuro-imagingtechniques, such as functional magnetic resonance imaging(fMRI) (Logothetis and Wandell, 2004; Solanto et al., 2009),electro-encephalography (EEG) (Mazaheri et al., 2014), or hemo-encephalography (HEG) (Schecklmann et al., 2009).
On the other hand, increasing cortical activation has beenobserved in students with ADHD who have had positiveresponses to intervention, and this has led to a decrease ininattention, impulsivity and hyperactivity according to previousresearch (Monastra et al., 2005; Kropotov et al., 2007; Arnset al., 2009). For example, a study conducted by Thompsonand Thompson (1998) involving 111 subjects (children andadults) with ADHD observed significant improvements incortical activation (measured by Q-EEG) and symptomatology(measured by CPT), following an intervention involvingneurofeedback techniques.
Other studies have also found that, by increasing corticalactivation with neurofeedback techniques or pharmacologicalsupport, individuals with ADHD significantly improved theirperformance in attention tasks, apparently as a consequenceof a decrease in the core symptoms of the disorder (Othmeret al., 2000; Fuchs et al., 2003; Rossiter, 2004). Also, Monastraet al. (2005), in a review, analyzed the empirical evidenceof the intervention with neurofeedback, according to theAssociation of Applied Psychophysiology and Biofeedbackand the International Society for Neuronal Regulation. Theyconcluded that neurofeedback is “probably an efficaciousinstrument” for treatment of ADHD, as clinically significantimprovement is observed in approximately 75% of the casesanalyzed.
In sum, previous research supports the relationshipbetween ADHD symptoms and decreased cortical activation.Nevertheless, although it has been argued that low activationoccurs in prefrontal and frontal areas, the specific areas involvedin these processes have not been adequately defined (Orinsteinand Stevens, 2014). The most frequently reported areas in thiscase have been in the pre-frontal (e.g., Fp1, Fp2, Fp3) and central(e.g., Cz) regions (Hale et al., 2007; González-Castro et al., 2013).
The difficulties in the detection of specific brain areashave been associated with the presence of differential profiles
Frontiers in Psychology | www.frontiersin.org 2 September 2016 | Volume 7 | Article 1406

fpsyg-07-01406 September 21, 2016 Time: 12:54 # 3
Rodríguez et al. ADHD Diagnosis Model
or presentations in the disorder (Nikolas and Burt, 2010;Willcutt et al., 2012). Thus, the relevance of these areaswould be dependent on the presence of inattentive orhyperactive/impulsive symptomatology (Depue et al., 2010;Mazaheri et al., 2014). Considering the different presentationsof ADHD, previous studies have shown that while thehyperactive/impulsive presentation is related to poor activationin left prefrontal areas, the inattentive presentation is commonlyaccompanied by less activation in central and central-prefrontalareas (González-Castro et al., 2013). Similarly, it has beenobserved that students with low levels of activation in leftprefrontal areas show more commission errors and highervariability in CPTs, while students with low central activationshow more omissions and slower response time than the othergroup.
The empirical evidence concerning the different categoriesof symptomatology in ADHD, and their new conceptualizationin DSM-5 (American Psychiatric and Association [APA], 2013),makes it necessary to define the relationship among the levelsof activation in specific brain areas, executive functions, anddiagnosis-related variables (i.e., distinction between ADHD andcontrols, and among different ADHD presentations).
It is important to consider that this disorder not only leadsto impairments in the academic context (Frazier et al., 2007;Barnard-Brak et al., 2011), but also in the social and familiarcontexts (Anastopoulos et al., 2009; Schroeder and Kelley, 2009).It is therefore crucial to have appropriate evaluation strategiesthat are able to minimize error in the diagnosis process (Skountiet al., 2007). This particular aspect was the key stimulus for thepresent study. Although the exact cause of the disease has notyet been identified, it is thought to be caused by a complexinteraction between the neuro-anatomical system and neuro-biochemistry rather than a single cause. Overall, an increasednumber of findings suggest that ADHD is a disease of thebrain (Swanson and Castellanos, 2002). Thus, genetic factors,neuro-developmental factors, psychosocial factors, and neuro-physiological factors all have an influence on behavior, activityand task-execution.
By using a risk and resilience model, this research aims toanalyze the interaction between brain activation variables andexecutive function in students with ADHD. For the analysisof this objective, a causal model (relationship between pre-frontal cortex activation and task-execution) was formulated inwhich different measures were included (CPT-TOVA, Q-EEGand nirHEG; Toomim et al., 2005).
Purposes of This StudyBy means of a structured equation model (SEM) we expect todeepen our knowledge of the relationship between activationmeasures and executive function measures. The SEM designedwas fit using two samples of data (control group without ADHDand ADHD group). The first sample (without ADHD) wasutilized to fit the model, and the second sample (with ADHD)to analyze the consistency of the data with predictive differences.We also performed multi-group analysis to verify the consistencyof the results from both samples, to know which variablesdifferentiate subjects with and without ADHD.
Considering the data provided by literature findings, thecausal model was tested using structural equation modeling(SEM). This model was built based on three general assumptions(see Figure 1):
(1) There are different causal models for children with ADHDand those without ADHD.
(2) The activation measures influence a student’s executiveperformance. Specifically, certain task-execution variables will berelated to activation in the left pre-frontal cortex, and others withcentral zone pre-frontal cortex activation.
(3) There are important structural differences between themodels for the ADHD and control groups.
When estimating the dependent variables of the model (latentvariables), we also assume that the measured errors are notinter-correlated in the model, and that there is no relationshipbetween the types of errors committed. Lastly, although previousresearch indicates reciprocal relationships among the dependentvariables measured in this model (omissions, commission, andresponse time -RT-, variability and D prime), in the currentinvestigation it is theoretically unacceptable to expect thatreciprocal relationships between causal measures have beenobserved at a single temporal moment.
Our model has two parts: one of measurement, whichcorresponds to the relationship between the latent variables andtheir respective observed variables (activation), and a structuralpart, which involves the relationship between the independentand the dependent variables of the model (execution). The effectsof the independent on the dependent variables are indicatedwith gamma (γ), whereas the relationships among the dependentvariables are represented as beta (β).
MATERIALS AND METHODS
ParticipantsThe participants included in the study comprised 499 studentsaged between 8 and 16 years (M = 11.22, SD = 1.43). Therewere 324 males (64.9%) and 175 females (35.1%). As one ofthe goals of this research was the cross-validation of the study-model developed, the final calibration sample was split intotwo subgroups [243 (48.7%) in the Control Group, and 256(51.3%) in the ADHD group]. All participants had an IQ higherthan 80 (WISC-IV; Wechsler, 2005), were attending public andsubsidized schools in northern Spain. Statistical analysis revealedno significant between-group differences concerning IQ, thoughthere were slight differences in mean ages and gender ratios(Table 1).
Inclusion CriteriaFor ADHD the diagnosis involved: (a) clinical diagnosis ofAttention Deficit Disorder with Hyperactivity according tothe Diagnostic and Statistical Manual of Mental Disorders-IV-R (American Psychiatric and Association [APA], 2002); (b)symptom duration of more than 1 year; (c) the problembegan before the age of 7 years; and, (d) the children had noassociated disorders. Subjects who presented with a cognitivedeficit, Asperger’s syndrome, Guilles de la Tourette syndrome or
Frontiers in Psychology | www.frontiersin.org 3 September 2016 | Volume 7 | Article 1406

fpsyg-07-01406 September 21, 2016 Time: 12:54 # 4
Rodríguez et al. ADHD Diagnosis Model
FIGURE 1 | Hypothetical model of activation and executive function. Variables in the model: HEG-Fp1 (nirHEG ratio: left pre-frontal cortex); HEG-FpZ (nirHEGratio: central zone pre-frontal cortex); Q-EEG-Fp1 (beta-theta ratio: left pre-frontal cortex ); Q-EEG-CZ (beta-theta ratio: central cortex); TOVA-OMIS (CPT: omissions);TOVA-COMIS (CPT commissions ); TOVA-VAR (CPT: variability); TOVA-TR (CPT: response time); TOVA-DPR (CPT: D prime); ADHD-INDEX (CPT: ADHD index).
extensive anxious depressive disorders were excluded from thestudy, (e) to confirm the diagnosis and rule out other associateddisorders, all students underwent a semi-structured interviewfor parents Diagnostic Interview Schedule for Children DISC-IV (Shaffer et al., 2000), and (f) were administered the WISC-IV(Wechsler Intelligence Scale for Children-IV; Wechsler, 2005) toevaluate the presence of specific (or other) cognitive deficits.
All healthy controls underwent the same diagnosticassessment to rule out any psychiatric disorders. To ensurethe correct assignment of the students to their respective groups,
Farré and Narbona’s (1997) Spanish Scale or the adaptation bySánchez et al. (2010) for ADHD (EDAH) was administered tothe participants’ parents.
Instruments and MeasuresThe variables included in the hypothesized model were groupedinto two categories: activation measures (nirHEG Fp1, nirHEGFpZ, Q-EEG Fp1 and Q-EEG Cz), and executive measures(omissions, commissions, variability, RT, D prime and ADHDIndex).
TABLE 1 | Means (M) and standard deviations (SD) of IQ scores, age in months, and EDAH percentile scores of the two groups in the sample (Controland ADHD group).
Control group ADHD group Total sample
N 243 256 499
IQ M (SD) 98.30 (10.28) 98.95 (10.15) 98.64 (10.21) F (1,497) = 0.496, p = 0.481, η2= 0.001
Age (months) M (SD) 136.67 (17.51) 132.88 (16.77) 134.72 (17.22) F (1,497) = 6.102, p = 0.014, η2= 0.012
Sex (male/female) 146/97 178/78 324/175 χ2 (1) = 4.888, p = 0.027
EDAH scores ADHD-I 73.84 (10.71) 90.96 (5.44) 82.62 (12.01) F (1,497) = 514.33, p = 0.000, η2= 0.509
ADHD-HI 74.49 (10.59) 92.05 (5.20) 83.50 (12.06) F (1,497) = 561.34, p = 0.000, η2= 0.530
ADHD-C 75.77 (9.90) 91.46 (6.17) 83.82 (11.34) F (1,497) = 456.27, p = 0.000, η2= 0.479
(ADHD-I) subtype with predominance of attention deficit; (ADHD-HI) subtype with predominance of hyperactivity–impulsivity; and (ADHD-C) combined subtype, withpredominance both of inattention and hyperactivity-impulsivity.
Frontiers in Psychology | www.frontiersin.org 4 September 2016 | Volume 7 | Article 1406

fpsyg-07-01406 September 21, 2016 Time: 12:54 # 5
Rodríguez et al. ADHD Diagnosis Model
Activation MeasuresThe nirHEG (Toomim et al., 2005) is a tool used to measure bloodoxygenation in expressly selected areas. The nirHEG employsthe translucent properties of biological tissue, and low-frequencyred and infrared light from light emitting diodes (LEDs). Thesource of light and the light receptor (optode) are mounted ona headband 3 cm apart. The band should be carefully placed sothat no external light enters. It is important to highlight that, incontrast with the EEG method, low muscular tension or smallsubject movements do not affect nirHEG measurements. Otherpossible sources of error were researched and were found to beminimal (Toomim et al., 2005). Only around 5–10% of nirHEGreadings come from the skull skin or tissue because these regionsof the body have little blood flow in comparison with brain tissue.The depth of effective penetration in the highly vascular corticaltissue is approximately 1.5 cm below the midpoint between thelight source and the receptor optode. The entrance and exit lightareas are 0.052 cm2 at the skin surface. The light entrance andexit points and the refractive and scattering qualities of the tissueform a banana-shaped light field.
The lights are emitted alternately onto the surface of theskin. The emitted light penetrates these tissues and is scattered,refracted, and reflected. A small amount of light modifiedby absorption of the tissue returns to the surface and ismeasured. The ratio is calculated by comparing the red light(at 660 nm wavelength), which is not absorbed as muchby oxygenated hemoglobin, with infrared light (at 850 nmwavelength), which is less affected by oxygenation (Toomimet al., 2005). Capillary oxygenation is barely affected by peripheralblood pressure and is mainly controlled by tissue demandfor energy. The concentration of oxygenated hemoglobin istherefore a useful measurement of local blood flow. Thus,mathematically, the formula for the nirHEG ratio is as follows:nirHEG Ratio = Red light (variable)/infrared light (less affectedby oxygenation).
The nirHEG Ratio or proportion between red and infraredlight has a useful property. The numerator and denominator inthe relationship are influenced in the same way by attenuationof the skin, the skull, and the length of the path. Inthis relationship, these variables are therefore discarded. Thestandardized reference value was established at 100 (SD = 20)and used to calibrate all new spectrophotometers (Toomim et al.,2005).
In addition to this measure, nirHEG provides an AttentionIndex (AI), indicating malfunctioning of the ability to increasethe nirHEG ratio; that is, the participant is incapable of increasingthe ratio and, thereby, brain activation. This apparently indicatesa lapse in the attentional process, which, according to Toomimet al. (2005), is equivalent to a measure of sustained attention orconcentration capacity.
Q-EEG (quantified electroencephalogram), Biocomp 2010(Developed by The Biofeedback Institute of Los Angeles1)was used to record electrical activity. Q-EEG (quantifiedelectroencephalogram) is a computerized EEG system, adaptedby Toomim et al. (2005), which provides levels of cortical
1http://www.biocompresearch.org/
activation through the beta/theta ratio. It measures attention ingeneral, independently of the task to be performed. For thispurpose, an electrode is placed on the subject’s correspondingcortical area (Cz, Fp1) to record the beta/theta ratio, and twomore control electrodes are placed on the subject’s left and rightearlobe. The Q-EEG is administered to each participant, withopen eyes, for a maximum duration of 10 min and after receivinginstructions of smooth and steady abdominal breathing, inorder to carry out the test under the best possible performanceconditions. Lastly, an EMG system is placed on the right forearmto identify the degree of movement. Once the electrodes arein place, participants are asked to remain relaxed, withoutmoving, breathing slowly and evenly, concentrating exclusivelyon the computer screen on which the theta and beta wavesemitted by them are displayed successively. After assessment,the results obtained are interpreted. When the beta/theta ratiois lower than 50% at Cz, there is an associated deficit ofsustained attention and if the ratio is also lower at Fp1, thenthe attentional deficit is associated with a lack of executivecontrol, attributable to hyperactivity (González-Castro et al.,2013).
Latent Variables (Pre-frontal Cortex Activation)Activation left cortex was estimated as a latent variable in the SEMfrom two indicators of activation measures. One of the indicatorswas nirHEG in Fp1 and the other was Q-EEG in Fp1. Thus,our latent variable takes into account the commonalities betweenthese two ratio-index measures of the of the student’s corticalactivation.
Activation central cortex was estimated as a latent variable.One of the indicators was nirHEG in FpZ and the other wasQ-EEG in Cz. So, our latent variable subsumes the communalitiesbetween this two ratio measures indexes of the students’activation.
Executive Functioning VariablesTest of Variables of Attention (TOVA; Greenberg and Waldman,1993) is a CPT that presents two simple images. The first onepresents the stimulus at the top of the screen and the second oneat the bottom of the screen. The subject is given a push-buttonthat should only be pressed when the first image appears. Subjectsare trained for 3 min before testing, and the test lasts between20 and 24 min. The following profile is obtained: omissions,RT, commissions, variability, D prime (performance and/orconcentration quality during the test, based on the number oferrors) and ADHD Index. In the current study, the Cronbach’salpha for this executive factor was 0.877.
ProcedureThe identification of the participants was carried out accordingto the DSM-IV-TR criteria in the Hospital Pediatric Serviceby a neurologist with experience in ADHD diagnosis. It wasconfirmed by the EDAH with parent–teacher agreement equalto or higher than 90% following previous studies (González-Castro et al., 2015). Once the ADHD group was established,we proceeded to select the students who made up the groupwithout ADHD, so that the groups would be as equivalent as
Frontiers in Psychology | www.frontiersin.org 5 September 2016 | Volume 7 | Article 1406
fpsyg-07-01406 September 21, 2016 Time: 12:54 # 6
Rodríguez et al. ADHD Diagnosis Model
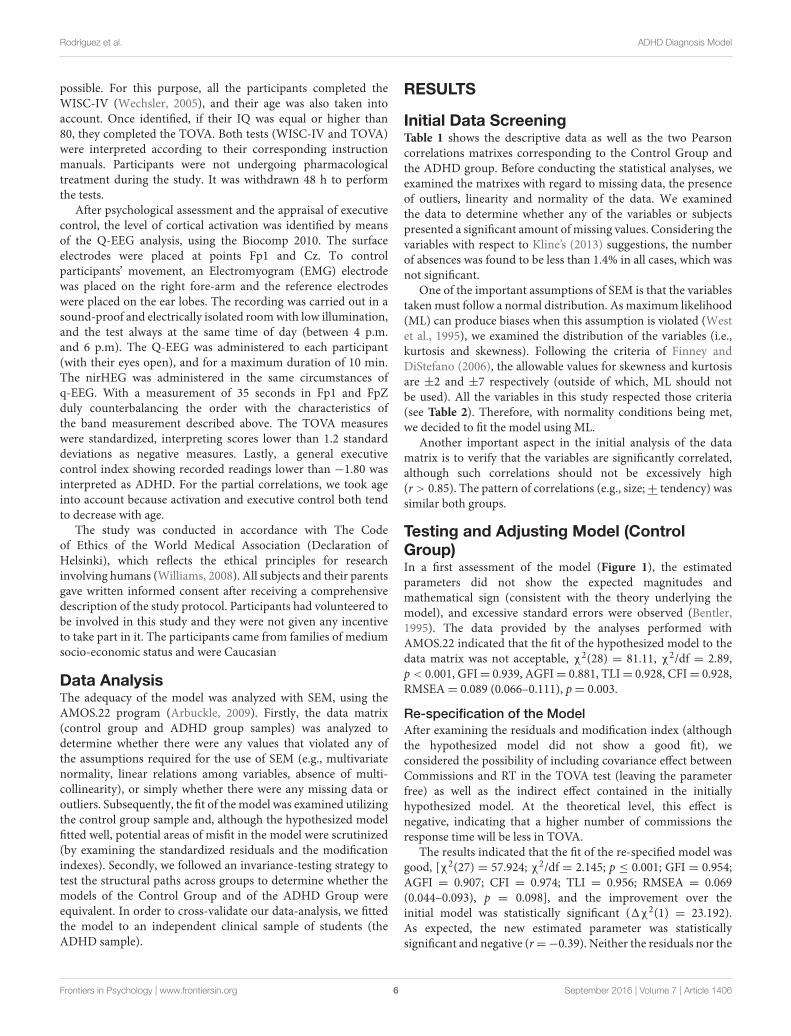
possible. For this purpose, all the participants completed theWISC-IV (Wechsler, 2005), and their age was also taken intoaccount. Once identified, if their IQ was equal or higher than80, they completed the TOVA. Both tests (WISC-IV and TOVA)were interpreted according to their corresponding instructionmanuals. Participants were not undergoing pharmacologicaltreatment during the study. It was withdrawn 48 h to performthe tests.
After psychological assessment and the appraisal of executivecontrol, the level of cortical activation was identified by meansof the Q-EEG analysis, using the Biocomp 2010. The surfaceelectrodes were placed at points Fp1 and Cz. To controlparticipants’ movement, an Electromyogram (EMG) electrodewas placed on the right fore-arm and the reference electrodeswere placed on the ear lobes. The recording was carried out in asound-proof and electrically isolated room with low illumination,and the test always at the same time of day (between 4 p.m.and 6 p.m). The Q-EEG was administered to each participant(with their eyes open), and for a maximum duration of 10 min.The nirHEG was administered in the same circumstances ofq-EEG. With a measurement of 35 seconds in Fp1 and FpZduly counterbalancing the order with the characteristics ofthe band measurement described above. The TOVA measureswere standardized, interpreting scores lower than 1.2 standarddeviations as negative measures. Lastly, a general executivecontrol index showing recorded readings lower than −1.80 wasinterpreted as ADHD. For the partial correlations, we took ageinto account because activation and executive control both tendto decrease with age.
The study was conducted in accordance with The Codeof Ethics of the World Medical Association (Declaration ofHelsinki), which reflects the ethical principles for researchinvolving humans (Williams, 2008). All subjects and their parentsgave written informed consent after receiving a comprehensivedescription of the study protocol. Participants had volunteered tobe involved in this study and they were not given any incentiveto take part in it. The participants came from families of mediumsocio-economic status and were Caucasian
Data AnalysisThe adequacy of the model was analyzed with SEM, using theAMOS.22 program (Arbuckle, 2009). Firstly, the data matrix(control group and ADHD group samples) was analyzed todetermine whether there were any values that violated any ofthe assumptions required for the use of SEM (e.g., multivariatenormality, linear relations among variables, absence of multi-collinearity), or simply whether there were any missing data oroutliers. Subsequently, the fit of the model was examined utilizingthe control group sample and, although the hypothesized modelfitted well, potential areas of misfit in the model were scrutinized(by examining the standardized residuals and the modificationindexes). Secondly, we followed an invariance-testing strategy totest the structural paths across groups to determine whether themodels of the Control Group and of the ADHD Group wereequivalent. In order to cross-validate our data-analysis, we fittedthe model to an independent clinical sample of students (theADHD sample).
RESULTS
Initial Data ScreeningTable 1 shows the descriptive data as well as the two Pearsoncorrelations matrixes corresponding to the Control Group andthe ADHD group. Before conducting the statistical analyses, weexamined the matrixes with regard to missing data, the presenceof outliers, linearity and normality of the data. We examinedthe data to determine whether any of the variables or subjectspresented a significant amount of missing values. Considering thevariables with respect to Kline’s (2013) suggestions, the numberof absences was found to be less than 1.4% in all cases, which wasnot significant.
One of the important assumptions of SEM is that the variablestaken must follow a normal distribution. As maximum likelihood(ML) can produce biases when this assumption is violated (Westet al., 1995), we examined the distribution of the variables (i.e.,kurtosis and skewness). Following the criteria of Finney andDiStefano (2006), the allowable values for skewness and kurtosisare ±2 and ±7 respectively (outside of which, ML should notbe used). All the variables in this study respected those criteria(see Table 2). Therefore, with normality conditions being met,we decided to fit the model using ML.
Another important aspect in the initial analysis of the datamatrix is to verify that the variables are significantly correlated,although such correlations should not be excessively high(r > 0.85). The pattern of correlations (e.g., size;+ tendency) wassimilar both groups.
Testing and Adjusting Model (ControlGroup)In a first assessment of the model (Figure 1), the estimatedparameters did not show the expected magnitudes andmathematical sign (consistent with the theory underlying themodel), and excessive standard errors were observed (Bentler,1995). The data provided by the analyses performed withAMOS.22 indicated that the fit of the hypothesized model to thedata matrix was not acceptable, χ2(28) = 81.11, χ2/df = 2.89,p < 0.001, GFI= 0.939, AGFI= 0.881, TLI= 0.928, CFI= 0.928,RMSEA= 0.089 (0.066–0.111), p= 0.003.
Re-specification of the ModelAfter examining the residuals and modification index (althoughthe hypothesized model did not show a good fit), weconsidered the possibility of including covariance effect betweenCommissions and RT in the TOVA test (leaving the parameterfree) as well as the indirect effect contained in the initiallyhypothesized model. At the theoretical level, this effect isnegative, indicating that a higher number of commissions theresponse time will be less in TOVA.
The results indicated that the fit of the re-specified model wasgood, [χ2(27) = 57.924; χ2/df = 2.145; p ≤ 0.001; GFI = 0.954;AGFI = 0.907; CFI = 0.974; TLI = 0.956; RMSEA = 0.069(0.044–0.093), p = 0.098], and the improvement over theinitial model was statistically significant (1χ2(1) = 23.192).As expected, the new estimated parameter was statisticallysignificant and negative (r=−0.39). Neither the residuals nor the
Frontiers in Psychology | www.frontiersin.org 6 September 2016 | Volume 7 | Article 1406
fpsyg-07-01406 September 21, 2016 Time: 12:54 # 7
Rodríguez et al. ADHD Diagnosis Model
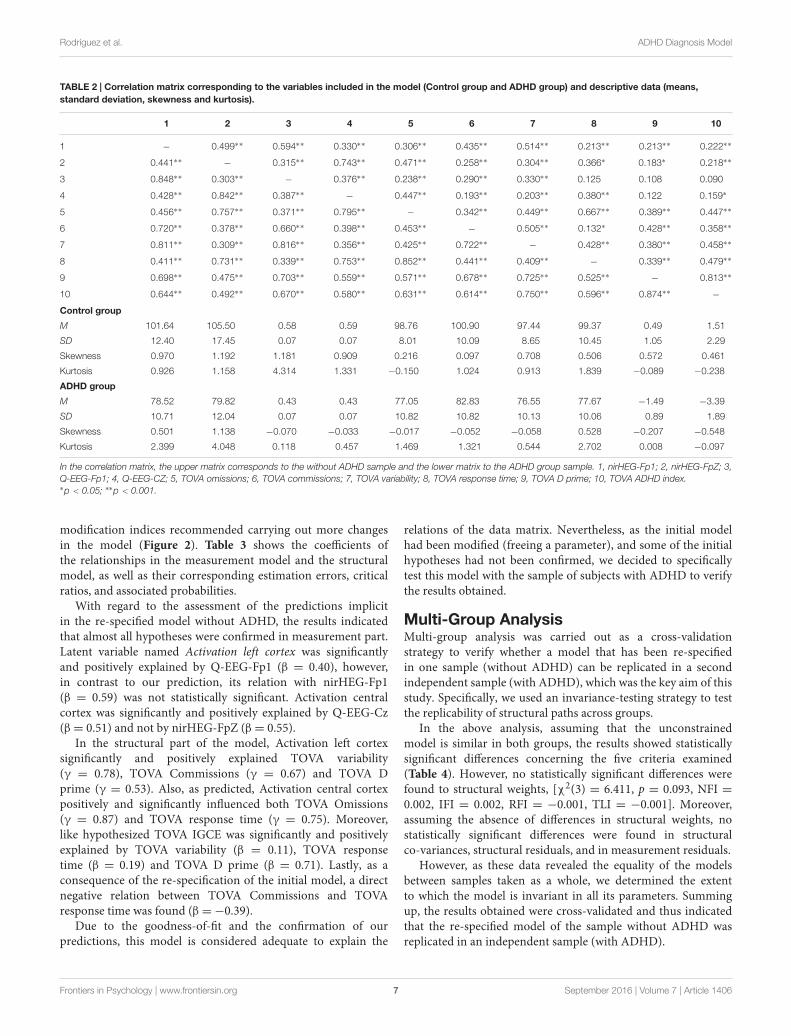
TABLE 2 | Correlation matrix corresponding to the variables included in the model (Control group and ADHD group) and descriptive data (means,standard deviation, skewness and kurtosis).
1 2 3 4 5 6 7 8 9 10
1 − 0.499∗∗ 0.594∗∗ 0.330∗∗ 0.306∗∗ 0.435∗∗ 0.514∗∗ 0.213∗∗ 0.213∗∗ 0.222∗∗
2 0.441∗∗ − 0.315∗∗ 0.743∗∗ 0.471∗∗ 0.258∗∗ 0.304∗∗ 0.366∗ 0.183∗ 0.218∗∗
3 0.848∗∗ 0.303∗∗ − 0.376∗∗ 0.238∗∗ 0.290∗∗ 0.330∗∗ 0.125 0.108 0.090
4 0.428∗∗ 0.842∗∗ 0.387∗∗ − 0.447∗∗ 0.193∗∗ 0.203∗∗ 0.380∗∗ 0.122 0.159∗
5 0.456∗∗ 0.757∗∗ 0.371∗∗ 0.795∗∗ − 0.342∗∗ 0.449∗∗ 0.667∗∗ 0.389∗∗ 0.447∗∗
6 0.720∗∗ 0.378∗∗ 0.660∗∗ 0.398∗∗ 0.453∗∗ − 0.505∗∗ 0.132∗ 0.428∗∗ 0.358∗∗
7 0.811∗∗ 0.309∗∗ 0.816∗∗ 0.356∗∗ 0.425∗∗ 0.722∗∗ − 0.428∗∗ 0.380∗∗ 0.458∗∗
8 0.411∗∗ 0.731∗∗ 0.339∗∗ 0.753∗∗ 0.852∗∗ 0.441∗∗ 0.409∗∗ − 0.339∗∗ 0.479∗∗
9 0.698∗∗ 0.475∗∗ 0.703∗∗ 0.559∗∗ 0.571∗∗ 0.678∗∗ 0.725∗∗ 0.525∗∗ − 0.813∗∗
10 0.644∗∗ 0.492∗∗ 0.670∗∗ 0.580∗∗ 0.631∗∗ 0.614∗∗ 0.750∗∗ 0.596∗∗ 0.874∗∗ −
Control group
M 101.64 105.50 0.58 0.59 98.76 100.90 97.44 99.37 0.49 1.51
SD 12.40 17.45 0.07 0.07 8.01 10.09 8.65 10.45 1.05 2.29
Skewness 0.970 1.192 1.181 0.909 0.216 0.097 0.708 0.506 0.572 0.461
Kurtosis 0.926 1.158 4.314 1.331 −0.150 1.024 0.913 1.839 −0.089 −0.238
ADHD group
M 78.52 79.82 0.43 0.43 77.05 82.83 76.55 77.67 −1.49 −3.39
SD 10.71 12.04 0.07 0.07 10.82 10.82 10.13 10.06 0.89 1.89
Skewness 0.501 1.138 −0.070 −0.033 −0.017 −0.052 −0.058 0.528 −0.207 −0.548
Kurtosis 2.399 4.048 0.118 0.457 1.469 1.321 0.544 2.702 0.008 −0.097
In the correlation matrix, the upper matrix corresponds to the without ADHD sample and the lower matrix to the ADHD group sample. 1, nirHEG-Fp1; 2, nirHEG-FpZ; 3,Q-EEG-Fp1; 4, Q-EEG-CZ; 5, TOVA omissions; 6, TOVA commissions; 7, TOVA variability; 8, TOVA response time; 9, TOVA D prime; 10, TOVA ADHD index.∗p < 0.05; ∗∗p < 0.001.
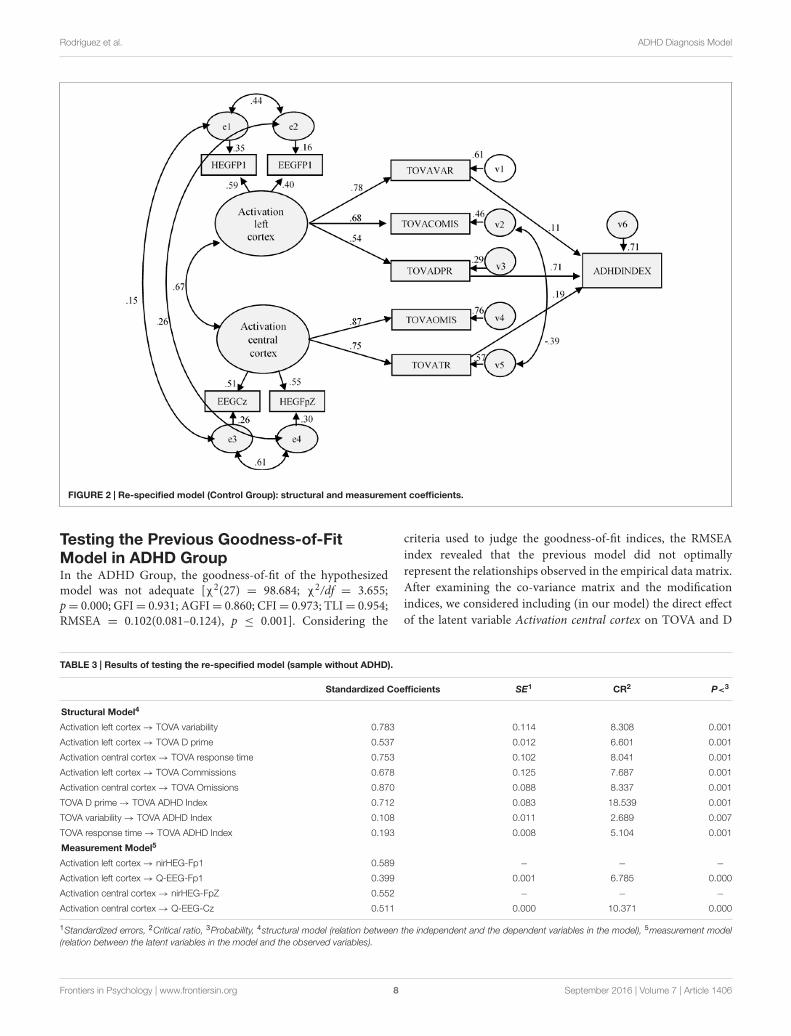
modification indices recommended carrying out more changesin the model (Figure 2). Table 3 shows the coefficients ofthe relationships in the measurement model and the structuralmodel, as well as their corresponding estimation errors, criticalratios, and associated probabilities.
With regard to the assessment of the predictions implicitin the re-specified model without ADHD, the results indicatedthat almost all hypotheses were confirmed in measurement part.Latent variable named Activation left cortex was significantlyand positively explained by Q-EEG-Fp1 (β = 0.40), however,in contrast to our prediction, its relation with nirHEG-Fp1(β = 0.59) was not statistically significant. Activation centralcortex was significantly and positively explained by Q-EEG-Cz(β= 0.51) and not by nirHEG-FpZ (β= 0.55).
In the structural part of the model, Activation left cortexsignificantly and positively explained TOVA variability(γ = 0.78), TOVA Commissions (γ = 0.67) and TOVA Dprime (γ = 0.53). Also, as predicted, Activation central cortexpositively and significantly influenced both TOVA Omissions(γ = 0.87) and TOVA response time (γ = 0.75). Moreover,like hypothesized TOVA IGCE was significantly and positivelyexplained by TOVA variability (β = 0.11), TOVA responsetime (β = 0.19) and TOVA D prime (β = 0.71). Lastly, as aconsequence of the re-specification of the initial model, a directnegative relation between TOVA Commissions and TOVAresponse time was found (β=−0.39).
Due to the goodness-of-fit and the confirmation of ourpredictions, this model is considered adequate to explain the
relations of the data matrix. Nevertheless, as the initial modelhad been modified (freeing a parameter), and some of the initialhypotheses had not been confirmed, we decided to specificallytest this model with the sample of subjects with ADHD to verifythe results obtained.
Multi-Group AnalysisMulti-group analysis was carried out as a cross-validationstrategy to verify whether a model that has been re-specifiedin one sample (without ADHD) can be replicated in a secondindependent sample (with ADHD), which was the key aim of thisstudy. Specifically, we used an invariance-testing strategy to testthe replicability of structural paths across groups.
In the above analysis, assuming that the unconstrainedmodel is similar in both groups, the results showed statisticallysignificant differences concerning the five criteria examined(Table 4). However, no statistically significant differences werefound to structural weights, [χ2(3) = 6.411, p = 0.093, NFI =0.002, IFI = 0.002, RFI = −0.001, TLI = −0.001]. Moreover,assuming the absence of differences in structural weights, nostatistically significant differences were found in structuralco-variances, structural residuals, and in measurement residuals.
However, as these data revealed the equality of the modelsbetween samples taken as a whole, we determined the extentto which the model is invariant in all its parameters. Summingup, the results obtained were cross-validated and thus indicatedthat the re-specified model of the sample without ADHD wasreplicated in an independent sample (with ADHD).
Frontiers in Psychology | www.frontiersin.org 7 September 2016 | Volume 7 | Article 1406
fpsyg-07-01406 September 21, 2016 Time: 12:54 # 8
Rodríguez et al. ADHD Diagnosis Model
FIGURE 2 | Re-specified model (Control Group): structural and measurement coefficients.
Testing the Previous Goodness-of-FitModel in ADHD GroupIn the ADHD Group, the goodness-of-fit of the hypothesizedmodel was not adequate [χ2(27) = 98.684; χ2/df = 3.655;p= 0.000; GFI= 0.931; AGFI= 0.860; CFI= 0.973; TLI= 0.954;RMSEA = 0.102(0.081–0.124), p ≤ 0.001]. Considering the
criteria used to judge the goodness-of-fit indices, the RMSEAindex revealed that the previous model did not optimallyrepresent the relationships observed in the empirical data matrix.After examining the co-variance matrix and the modificationindices, we considered including (in our model) the direct effectof the latent variable Activation central cortex on TOVA and D
TABLE 3 | Results of testing the re-specified model (sample without ADHD).
Standardized Coefficients SE1 CR2 P<3
Structural Model4
Activation left cortex→ TOVA variability 0.783 0.114 8.308 0.001
Activation left cortex→ TOVA D prime 0.537 0.012 6.601 0.001
Activation central cortex→ TOVA response time 0.753 0.102 8.041 0.001
Activation left cortex→ TOVA Commissions 0.678 0.125 7.687 0.001
Activation central cortex→ TOVA Omissions 0.870 0.088 8.337 0.001
TOVA D prime→ TOVA ADHD Index 0.712 0.083 18.539 0.001
TOVA variability→ TOVA ADHD Index 0.108 0.011 2.689 0.007
TOVA response time→ TOVA ADHD Index 0.193 0.008 5.104 0.001
Measurement Model5
Activation left cortex→ nirHEG-Fp1 0.589 − − −
Activation left cortex→ Q-EEG-Fp1 0.399 0.001 6.785 0.000
Activation central cortex→ nirHEG-FpZ 0.552 − − −
Activation central cortex→ Q-EEG-Cz 0.511 0.000 10.371 0.000
1Standardized errors, 2Critical ratio, 3Probability, 4structural model (relation between the independent and the dependent variables in the model), 5measurement model(relation between the latent variables in the model and the observed variables).
Frontiers in Psychology | www.frontiersin.org 8 September 2016 | Volume 7 | Article 1406
fpsyg-07-01406 September 21, 2016 Time: 12:54 # 9
Rodríguez et al. ADHD Diagnosis Model
TABLE 4 | Nested model comparison (assuming model unconstrainedcorrect).
1MW 2SW 3SC 4SR 5MR
χ2 45.104 51.515 93.428 133.575 510.189
Df 7 10 13 14 28
P 0.000 0.000 0.000 0.000 0.000
NFI 0.012 0.013 0.024 0.034 0.131
IFI 0.012 0.013 0.024 0.035 0.133
RFI 0.009 0.008 0.019 0.032 0.121
TLI 0.010 0.008 0.020 0.032 0.124
1Measurement Weights, 2Structural Weights, 3Structural Covariance, 4StructuralResiduals, 5Measurement Residuals.
Prime. From a theoretical perspective, the inclusion of this effectseemed to be logical, because D prime is a measure of the qualityof concentration obtained from the total number of omission andcommission errors. Also, the central cortex area allows which isaffected in students with ADHD reflected in a lower quality ofthe concentration given the higher number of errors. As well aseliminate indirect effect between TOVA commissions and TOVAresponse time (with a not significant effect p = 0.251). Thisrelationship can be found in students without ADHD, but notin students with ADHD. It is because commissions are relatedto impulsivity, and RT is related to inattention. Thus, when both
variables (impulsivity and RT) are affected, these variables can beclearly distinguished.
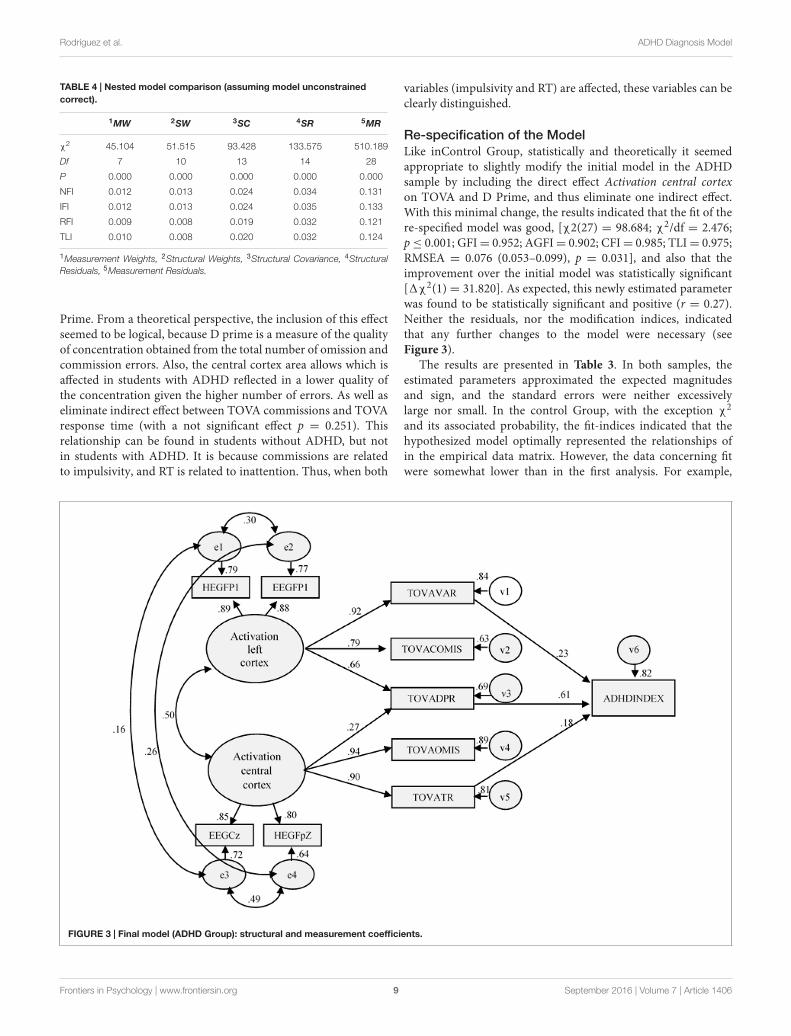
Re-specification of the ModelLike inControl Group, statistically and theoretically it seemedappropriate to slightly modify the initial model in the ADHDsample by including the direct effect Activation central cortexon TOVA and D Prime, and thus eliminate one indirect effect.With this minimal change, the results indicated that the fit of there-specified model was good, [χ2(27) = 98.684; χ2/df = 2.476;p≤ 0.001; GFI= 0.952; AGFI= 0.902; CFI= 0.985; TLI= 0.975;RMSEA = 0.076 (0.053–0.099), p = 0.031], and also that theimprovement over the initial model was statistically significant[1χ2(1) = 31.820]. As expected, this newly estimated parameterwas found to be statistically significant and positive (r = 0.27).Neither the residuals, nor the modification indices, indicatedthat any further changes to the model were necessary (seeFigure 3).
The results are presented in Table 3. In both samples, theestimated parameters approximated the expected magnitudesand sign, and the standard errors were neither excessivelylarge nor small. In the control Group, with the exception χ2
and its associated probability, the fit-indices indicated that thehypothesized model optimally represented the relationships ofin the empirical data matrix. However, the data concerning fitwere somewhat lower than in the first analysis. For example,
FIGURE 3 | Final model (ADHD Group): structural and measurement coefficients.
Frontiers in Psychology | www.frontiersin.org 9 September 2016 | Volume 7 | Article 1406
fpsyg-07-01406 September 21, 2016 Time: 12:54 # 10
Rodríguez et al. ADHD Diagnosis Model
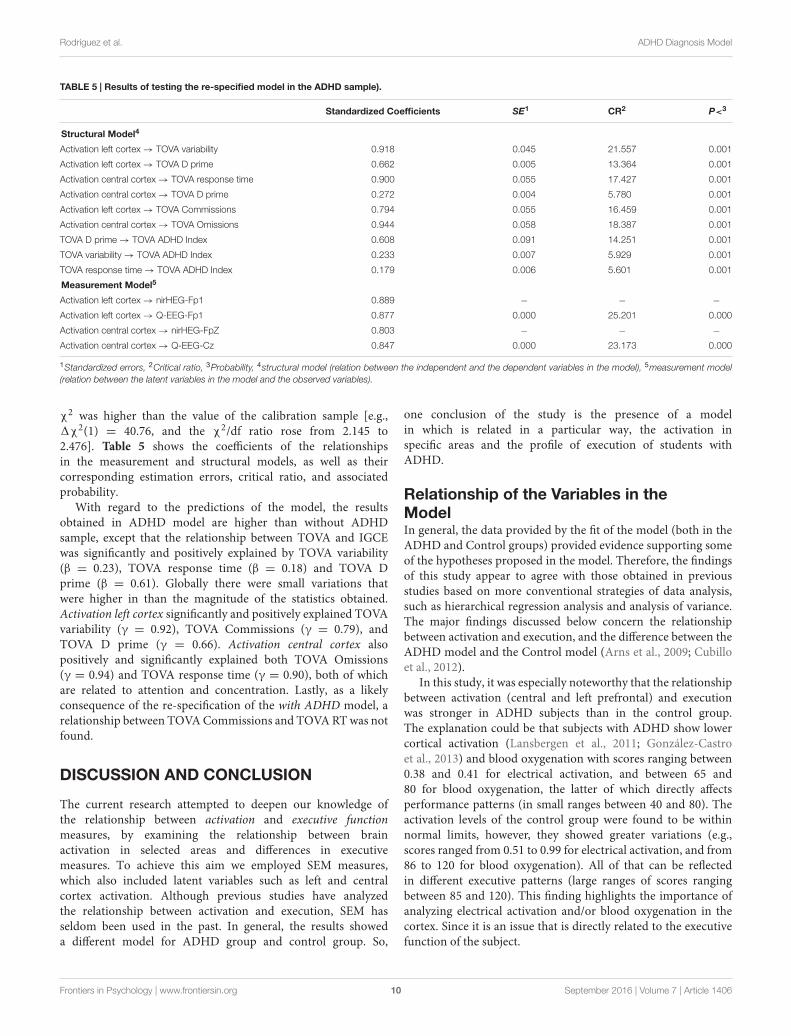
TABLE 5 | Results of testing the re-specified model in the ADHD sample).
Standardized Coefficients SE1 CR2 P<3
Structural Model4
Activation left cortex→ TOVA variability 0.918 0.045 21.557 0.001
Activation left cortex→ TOVA D prime 0.662 0.005 13.364 0.001
Activation central cortex→ TOVA response time 0.900 0.055 17.427 0.001
Activation central cortex→ TOVA D prime 0.272 0.004 5.780 0.001
Activation left cortex→ TOVA Commissions 0.794 0.055 16.459 0.001
Activation central cortex→ TOVA Omissions 0.944 0.058 18.387 0.001
TOVA D prime→ TOVA ADHD Index 0.608 0.091 14.251 0.001
TOVA variability→ TOVA ADHD Index 0.233 0.007 5.929 0.001
TOVA response time→ TOVA ADHD Index 0.179 0.006 5.601 0.001
Measurement Model5
Activation left cortex→ nirHEG-Fp1 0.889 − − −
Activation left cortex→ Q-EEG-Fp1 0.877 0.000 25.201 0.000
Activation central cortex→ nirHEG-FpZ 0.803 − − −
Activation central cortex→ Q-EEG-Cz 0.847 0.000 23.173 0.000
1Standardized errors, 2Critical ratio, 3Probability, 4structural model (relation between the independent and the dependent variables in the model), 5measurement model(relation between the latent variables in the model and the observed variables).
χ2 was higher than the value of the calibration sample [e.g.,1χ2(1) = 40.76, and the χ2/df ratio rose from 2.145 to2.476]. Table 5 shows the coefficients of the relationshipsin the measurement and structural models, as well as theircorresponding estimation errors, critical ratio, and associatedprobability.
With regard to the predictions of the model, the resultsobtained in ADHD model are higher than without ADHDsample, except that the relationship between TOVA and IGCEwas significantly and positively explained by TOVA variability(β = 0.23), TOVA response time (β = 0.18) and TOVA Dprime (β = 0.61). Globally there were small variations thatwere higher in than the magnitude of the statistics obtained.Activation left cortex significantly and positively explained TOVAvariability (γ = 0.92), TOVA Commissions (γ = 0.79), andTOVA D prime (γ = 0.66). Activation central cortex alsopositively and significantly explained both TOVA Omissions(γ = 0.94) and TOVA response time (γ = 0.90), both of whichare related to attention and concentration. Lastly, as a likelyconsequence of the re-specification of the with ADHD model, arelationship between TOVA Commissions and TOVA RT was notfound.
DISCUSSION AND CONCLUSION
The current research attempted to deepen our knowledge ofthe relationship between activation and executive functionmeasures, by examining the relationship between brainactivation in selected areas and differences in executivemeasures. To achieve this aim we employed SEM measures,which also included latent variables such as left and centralcortex activation. Although previous studies have analyzedthe relationship between activation and execution, SEM hasseldom been used in the past. In general, the results showeda different model for ADHD group and control group. So,
one conclusion of the study is the presence of a modelin which is related in a particular way, the activation inspecific areas and the profile of execution of students withADHD.
Relationship of the Variables in theModelIn general, the data provided by the fit of the model (both in theADHD and Control groups) provided evidence supporting someof the hypotheses proposed in the model. Therefore, the findingsof this study appear to agree with those obtained in previousstudies based on more conventional strategies of data analysis,such as hierarchical regression analysis and analysis of variance.The major findings discussed below concern the relationshipbetween activation and execution, and the difference between theADHD model and the Control model (Arns et al., 2009; Cubilloet al., 2012).
In this study, it was especially noteworthy that the relationshipbetween activation (central and left prefrontal) and executionwas stronger in ADHD subjects than in the control group.The explanation could be that subjects with ADHD show lowercortical activation (Lansbergen et al., 2011; González-Castroet al., 2013) and blood oxygenation with scores ranging between0.38 and 0.41 for electrical activation, and between 65 and80 for blood oxygenation, the latter of which directly affectsperformance patterns (in small ranges between 40 and 80). Theactivation levels of the control group were found to be withinnormal limits, however, they showed greater variations (e.g.,scores ranged from 0.51 to 0.99 for electrical activation, and from86 to 120 for blood oxygenation). All of that can be reflectedin different executive patterns (large ranges of scores rangingbetween 85 and 120). This finding highlights the importance ofanalyzing electrical activation and/or blood oxygenation in thecortex. Since it is an issue that is directly related to the executivefunction of the subject.
Frontiers in Psychology | www.frontiersin.org 10 September 2016 | Volume 7 | Article 1406
fpsyg-07-01406 September 21, 2016 Time: 12:54 # 11
Rodríguez et al. ADHD Diagnosis Model
Moreover, the relationship between cortical activation andexecutive function shows differential results depending on thebrain area assessed (i.e., a low activation in a specific areacan be related to a particular pattern of execution). Regardingleft cortical activation, is highlighted the results indicated thatdiffering beta-theta ratios and low blood oxygenation in area Fp1can be related to hyperactivity and impulsivity symptomatology.
Furthermore, when the electric activation shows low levelsin Fp1, these data are also supported by nirHEG results and alow performance in TOVA tests. Similarly, when the electricalactivation is within normal ranges blood oxygenation and TOVAtest results are also normal. While these results have beenobserved in previous studies analyzing the relationship betweenQ-EEG and TOVA, and between nirHEG and TOVA (González-Castro et al., 2013), the present research was focused on therelationships of all electrical-activation variables through a latentvariable.
On the other hand, in the case of central activation, thisrelationship shows lower rates, and although it is observed thatthose who present low activation levels measured by the beta-theta ratio in Cz, also present a low oxygenation measuredby nirHEG in FpZ, as well as a greater number of omissionerrors and worst response time; the findings do not reach sohigh interaction as the previous case. In any case, it has tobe emphasized that being different points (Cz/FpZ), is logicalthat correlations decrease slightly in spite of still showing asignificant relationship. Furthermore, it is possible that FpZis also influenced by other variables besides inattention, suchas emotion or anxiety control, that many studies have locatedin Fp2.
Firstly, given these results, the relationship between activationand execution seems to be a reliable measure for ADHDsymptoms. Secondly, with regard to the differences betweenmodels from ADHD group and the control group, could benecessary its incorporation into assessment protocols in orderto achieve more reliable and accurate diagnosis. Control groupmodel shows a relationship between commissions and RT. Inthis sense, it is expected that an increasing of the number ofcommissions leads, in turn, to a low response time. By contrast,in the case of ADHD, the presence of a high commissionsdo not lead to a lower RT levels, since this student groupalso present a deficit in this variable (Leth-Steensen et al.,2000).
In the ADHD Group model, it can be observed a relationshipbetween central activation of the cortex and D prime variableoffered by TOVA. This fact makes sense, because D prime variableis obtained from the number of omissions and commissionerrors. Both are produced by a low level of activation incentral cortical and left prefrontal brain areas. In this way,ADHD Group showed a greater number of errors both byomission and commission. Nevertheless, subjects from controlgroup do not make omission errors, at least not significantly(González-Castro et al., 2013). Finally, comparation of bothmodels showed differences between central and prefrontalactivation relationship. While in the Control Group thisrelationship is 0.67, in the ADHD group decreases to 0.50. Inthis sense, in children without ADHD there is a relationship
between different brain areas. But in the case of ADHD, thealteration in the cortical activation might present only in aspecific area (Hart et al., 2013). This aspect has relevance forADHD assessment, supported the idea about the alterationin the cortical activation and its measured through bothelectrical activity and blood oxygenation (Toomim and Carmen,2009). Likewise, it is also relevant for intervention, sincean improvement in the symptomatology would pass by anincrease in the activation levels in the area which specifically isfound more altered (Duric et al., 2014; Holtmann et al., 2014;González-Castro et al., 2016). This would imply a significantimprovement because as has been reflected in this study, lowactivation levels in a specific area (central or left prefrontal)is particularly related to an executive profile (inattentive orimpulsive/hyperactive).
Implications for PracticeOur results have important implications in ADHD diagnosis.An Activation-Executive diagnosis model was tested to improvethe assessment process in ADHD, also explained variablesinteractions. Moreover, this study lends support to priorstudies stating that the prefrontal area is essential in ADHDassessment (Rubia et al., 2011). This leads to a model ofactivation in which the central prefrontal and left prefrontal areaspresent lower activation in children with ADHD compared tocontrols (González-Castro et al., 2013). These results suggest theimportance of including different measures for the symptomsanalysis with the aim to stablish a specific intervention anddifferentiate those cases that may need pharmacological support,or other interventions such as behavior therapy, neurofeedbackor combine treatment. In this sense, the analysis of the activationallows professionals to determine the severity of the disorder andthe intervention required.
Limitations of the StudyAlthough the present study has produced interesting results,the implications derived from them should be taken cautiouslyas some theoretical and methodological limitations can bepointed out.
Firstly, it would have been convenient to compare theresults obtained by these tests with those provided by otherempirically validated tests as SPECT or fMRI, in order to comparethe levels of cortical activation through blood flow and theircorrelations with the values provided by the HEG. Secondly,in future research, it would be appropriate to consider notonly the differences between controls and ADHD subjects, butalso between the subtypes of the disorder (which could revealthat different activation and execution models are needed).It would be desirable control variables and problems relatedto ADHD (such as anxiety or depression) which could affectthe obtained results (Rodríguez et al., 2014) and specially,taking into account that the presence of a pure ADHDgroup is an infrequent situation. Finally, we have to notethe broad age range of the sample as another limitation andhighlight the interest of analyzing these measures as functionof age.
Frontiers in Psychology | www.frontiersin.org 11 September 2016 | Volume 7 | Article 1406

fpsyg-07-01406 September 21, 2016 Time: 12:54 # 12
Rodríguez et al. ADHD Diagnosis Model
AUTHOR CONTRIBUTIONS
CR, PG-C, MC, DA, and JG-P: Substantial contributions tothe conception or design of the work; or the acquisition,analysis, or interpretation of data for the work. Draftingthe work or revising it critically for important intellectualcontent. Final approval of the version to be published.Agreement to be accountable for all aspects of the work inensuring that questions related to the accuracy or integrityof any part of the work are appropriately investigated andresolved.
FUNDING
Grants awarded to the authors from the Council of Economy andEmployment of the Princedom of Asturias (Spain) (Ref. GRUPIN14-053).
ACKNOWLEDGMENTS
The authors thank Stephen Loew for his review of text and advicepertaining to this article.
REFERENCESÁlvarez, L., González-Castro, P., Núñez, J. C., González-Pienda, J. A., and
Bernardo, A. (2008). Evaluación y control de la activación cortical en el déficitde atención sostenida. Int. J. Clin. Health Psychol. 8, 509–524.
American Psychiatric and Association [APA] (2002). Diagnostic and StatisticalManual of Mental Disorders, 4h Edn. Washigton, DC: American Psychiatric andAssociation.
American Psychiatric and Association [APA] (2013). Diagnostic and StatisticalManual of Mental Disorders, 5th Edn. Washington, DC: American Psychiatricand Association.
Anastopoulos, A. D., Sommer, J. L., and Schatz, N. K. (2009). ADHD and familyfunctioning. Curr. Atten. Disord. Rep. 1, 167–170. doi: 10.1007/s12618-009-0023-2
Arbuckle, J. L. (2009). SPSS (Version 22.0) [Computer Program]. Chicago, IL: SPSS.Arns, M., De Ridder, S., Strehl, U., Breteler, M., and Coenen, A. (2009). Efficacy
of neurofeedback treatment in ADHD: the effects on inattention, impulsivityand hyperactivity: a meta-analysis. Clin. EEG Neurosci. 40, 180–189. doi:10.1177/155005940904000311
Barnard-Brak, L., Sulak, T. N., and Fearon, D. D. (2011). Coexisting disordersand academic achievement among children with ADHD. J. Atten. Disord. 15,506–515. doi: 10.1177/1087054710369667
Bentler, P. M. (1995). EQS Structural Equations Program Manual. Encino, CA:Multivariate Software.
Bledsoe, J. C., Semrud-Clikeman, M., and Pliszka, S. R. (2011). Neuroanatomicaland neuropsychological correlates of the cerebellum in children with attention-deficit/hyperactivity disorder–combined type. J. Am. Acad. Child Adolesc.Psychiatry 50, 593–601. doi: 10.1016/j.jaac.2011.02.014
Brown, E. T. (2006). ADHD Handbook for Children and Adults. Barcelona: Masson.Congdon, E., Altshuler, L. L., Mumford, J. A., Karlsgodt, K. H., Sabb, F. W.,
Ventura, J., et al. (2014). Neural activation during response inhibition inadult attention-deficit/hyperactivity disorder: preliminary findings on theeffects of medication and symptom severity. Psychiatry Res. 222, 17–28. doi:10.1016/j.pscychresns.2014.02.002
Congedo, M., and Lubar, J. F. (2003). Parametric and non-parametric analysisof QEEG: normative database comparisons in electroencephalography,a simulation study on accuracy. J. Neurother. 7, 1–29. doi:10.1300/J184v07n03_01
Cortese, S., Kelly, C., Chabernaud, C., Proal, E., DiMartino, A., Milham, M. P., et al.(2012). Toward systems neuroscience of ADHD: a meta-analysis of 55 fMRIstudies. Am. J. Psychiatry 169, 1038–1055. doi: 10.1176/appi.ajp.2012.11101521
Cubillo, A., Halari, R., Smith, A., Taylor, E., and Rubia, K. (2012). Are view offronto-striatal and fronto-cortical brain abnormalities in children and adultswith attention deficit hyperactivity disorder (ADHD) and new evidence fordysfunction in adults with ADHD during motivation and attention. Cortex 48,194–215. doi: 10.1016/j.cortex.2011.04.007
Depue, B. E., Burgess, G. C., Willcutt, E. G., Bidwell, L. C., Ruzic, L., andBanich, M. T. (2010). 12:38 19/11/2014 Symptom-correlated brain regionsin young adults with combined-type ADHD: their organization, variability,and relation to behavioral performance. Psychiatry Res. 182, 96–102. doi:10.1016/j.pscychresns.2009.11.011
Duric, N. S., Abmus, J., and Elgen, I. B. (2014). Self-reported efficacy ofneurofeedback treatment in a clinical randomized controlled study of ADHD
children and adolescents. Neuropsychiatr. Dis. Treat. 10, 1645–1654. doi:10.2147/NDT.S66466
Ernst, M., Kimes, A. S., London, E. D., Matochik, J. A., Eldreth, D.,Tata, S., et al. (2003). Neural substrates of decision making in adults withattention deficit hyperactivity disorder. Am. J. Psychiatry 160, 1061–1070. doi:10.1176/appi.ajp.160.6.1061
Farré, A., and Narbona, J. (1997). Attention Deficit/Hyperactivity Disorder Scales(E.D.A.H). Madrid: TEA Ediciones.
Finney, S. J., and DiStefano, C. (2006). “Non-normal and categorical data instructural equation modeling,” in Structural Equation Modeling: A SecondCourse, eds G. R. Hancock and R. O. Muller (Greenwich, CT: Information Age),269–314.
Frazier, T. W., Youngstrom, E. A., Glutting, J. J., and Watkins, M. W. (2007).ADHD and achievement: meta-analysis of the child, adolescent, and adultliteratures and a concomitant study with college students. J. Learn. Disabil. 40,49–65. doi: 10.1177/00222194070400010401
Fuchs, T., Birbaumer, N., Lutzenberger, W., Gruzelier, J. H., and Kaiser, J.(2003). Neurofeedback treatment for attention-deficit/hyperactivity disorder inchildren: a comparison with methylphenidate. Appl. Psychophysiol. Biofeedback28, 1–12. doi: 10.1023/A:1022353731579
González-Castro, P., Cueli, M., Rodríguez, C., García, T., and Alvarez, L. (2016).Efficacy of neurofeedback versus pharmacological support in subjects withADHD. Appl. Psychophysiol. Biofeedback 41, 17–25. doi: 10.1007/s10484-015-9299-4
González-Castro, P., Rodríguez, C., Cueli, M., García, T., and Alvarez-García, D.(2015). Anxiety and selective attention differences in ADHD subtypes. Int. J.Clin. Health Psychol. 15, 105–112. doi: 10.1016/j.ijchp.2014.10.003
González-Castro, P., Rodríguez, C., López, A., Cueli, M., and Álvarez, L. (2013).Attention deficit hyperactivity disorder, differential diagnosis with bloodoxygenation, beta/theta ratio, and attention measures. Int. J. Clin. HealthPsychol. 13, 101–109. doi: 10.1016/S1697-2600(13)70013-9
Greenberg, L. M., and Waldman, I. D. (1993). Developmental normative data onthe Test of Variables of Attention (T.O.V.A.). J. Child Psychol. Psychiatry 34,1019–1030. doi: 10.1111/j.1469-7610.1993.tb01105.x
Hale, T. S., Bookheimer, S., McGough, J. J., Phillips, J. M., and McCracken,J. T. (2007). Atypical brain activation during simple & complex levels ofprocessing in adult ADHD: an fMRI study. J. Atten. Disord. 11, 125–140. doi:10.1177/1087054706294101
Hart, H., Radua, J., Nakao, T., Mataix-Cols, D., and Rubia, K. (2013). Meta-analysis of functional magnetic resonance imaging studies of inhibition andattention in attention-deficit/hyperactivity disorder exploring task-specific,Stimulant medication, and age effects. JAMA Psychiatry 70, 185–198. doi:10.1001/jamapsychiatry.2013.277
Holtmann, M., Sonuga-Barke, E., Cortese, S., and Brandeis, D. (2014).Neurofeedback for ADHD: a review of current evidence. Child Adolesc.Psychiatr. Clin. N. Am. 23, 789–806. doi: 10.1016/j.chc.2014.05.006
Kline, R. B. (2013). Assessing statistical aspects of test fairness in structuralequation modeling. Educ. Res. Eval. 19, 204–222. doi: 10.1080/13803611.2013.767624
Kropotov, D., Grin-Yatsenko, A., Ponomarev, A., Chutko, S., Yakovenko, A., andNikishena, S. (2007). Changes in EEG spectrograms, event-related potentialsand event-related desynchronization induced by relative beta training inADHD children. J. Neurother. 11, 3–11.
Frontiers in Psychology | www.frontiersin.org 12 September 2016 | Volume 7 | Article 1406

fpsyg-07-01406 September 21, 2016 Time: 12:54 # 13
Rodríguez et al. ADHD Diagnosis Model
Lansbergen, M. M., Arns, M., Van Dongen-Boomsma, M., Spronk, D., andBuitelaar, J. K. (2011). The increase in theta/beta ratio on resting-state EEGin boys with attention-deficit/hyperactivity disorder is mediated by slow alphapeak frequency. Prog. Neuropsychopharmacol. Biol. Psychiatry 35, 47–52. doi:10.1016/j.pnpbp.2010.08.004
Leth-Steensen, C., Elbaz, Z. K., and Douglas, V. I. (2000). Mean responsetimes, variability, and skew in the responding of ADHD children: a responsetime distributional approach. Acta Psychol. 104, 167–190. doi: 10.1016/S0001-6918(00)00019-6
Logothetis, N. K., and Wandell, B. A. (2004). Interpreting the BOLD signal.Annu. Rev. Physiol. 66, 735–769. doi: 10.1146/annurev.physiol.66.082602.092845
Lubar, J. F., Swartwod, M. O., Swartwood, J. N., and O’Donell, P. (1995). Evaluationof the effectiveness of EEG neurofeedback training for ADHD in a clinicalsettings as measured by changes in TOVA scores, behavioral ratings, andWISK-R performance. Biofeedback Self Regul. 20, 83–99. doi: 10.1007/BF01712768
Mazaheri, A., Fassbender, C., Coffey-Corina, S., Hartanto, T. A., Schweitzer,J. B., and Mangun, G. R. (2014). Differential oscillatory electroencephalo-gram between attention-deficit/hyperactivity disorder subtypes and typicallydeveloping adolescents. Biol. Psychiatry 76, 422–429. doi: 10.1016/j.biopsych.2013.08.023
Monastra, V. J., Lynn, S., Linden, M., Lubar, J. F., Gruzelier, J., and LaVaque,T. J. (2005). Electroencephalographic biofeedback in the treatment of attention-deficit/hyperactivity disorder. Appl. Psychophysiol. Biofeedback 30, 95–114. doi:10.1007/s10484-005-4305-x
Mostofsky, S. H., Cooper, K. L., Kates, W. R., Denckla, M. B., and Kaufman,W. E. (2002). Smaller prefrontral and premotor volumes in boys with attention-deficit/hyperactivity disorder. Biol. Psychiatry 52, 785–794. doi: 10.1016/S0006-3223(02)01412-9
Nikolas, M. A., and Burt, S. A. (2010). Genetic and environmental influences onADHD symptom dimensions of inattention and hyperactivity: a meta-analysis.J. Abnorm. Psychol. 119, 1–17. doi: 10.1037/a0018010
Orinstein, A. J., and Stevens, M. C. (2014). Brain activity in predominantly-inattentive subtype attention-deficit/hyperactivity disorder during anauditory oddball attention task. Psychiatry Res. 223, 121–128. doi:10.1016/j.pscychresns.2014.05.012
Orlando, P. C., and Rivera, R. O. (2004). Neurofeedback for elementarystudents with identified learning problems’. J. Neurother. 8, 5–19. doi:10.1300/J184v08n02_02
Othmer, S., Othmer, S. F., and Kaiser, D. A. (2000). “EEG biofeedback: anemerging model for its global efficacy,” in Introduction to Quantitative EEG andNeurofeedback, eds J. R. Evans and A. Abarbanel (San Diego, CA: AcademicPress), 244–310.
Rodríguez, C., González-Castro, P., García, T., Núñez, J. C., and Álvarez, L.(2014). Trait anxiety effects in the attentional functions of children withADHD compared with peers. Learn. Individ. Differ. 36, 147–152. doi:10.1016/j.lindif.2014.07.010
Rossiter, T. (2004). The effectiveness of neurofeedback and stimulant drugs intreating AD/HD: part II. Replication. Appl. Psychophysiol. Biofeedback 29,233–243. doi: 10.1007/s10484-004-0383-4
Rubia, K., Halari, R., Cubillo, A., Smith, A. B., Mohamed, A., Brammer, M.,et al. (2011). Methylphenidate normalizes fronto-striatal underactivationduring interference inhibition in medication-naïve boys with attention-deficit hyperactivity disorder. Neuropsychopharmacology 36, 1575–1586. doi:10.1038/npp.2011.30
Sánchez, C. R., Díaz, F., and Ramos, C. (2010). Attention deficit hyperactivitydisorder in teenagers: appraisal of the EDAH (a) scale. Rev. Neurol. 51,337–346.
Schecklmann, M., Ehilis, A., Plichta, M. M., Romanos, J., Heine, M., Boreatti-Hümmer, A., et al. (2009). Diminished prefrontal oxygenation with normal andabove-average verbal fluency performance in adult ADHD. J. Psychiatr. Res. 43,98–106. doi: 10.1016/j.jpsychires.2008.02.005
Schroeder, V. M., and Kelley, M. L. (2009). Associations between familyenvironment, parenting practices, and executive functioning of children with
and without ADHD. J. Child Fam. Stud. 18, 227–235. doi: 10.1007/s10826-008-9223-0
Sciberras, E., Lycett, K., Efron, D., Mensah, F., Gerner, B., and Hiscock, H. (2014).Anxiety in children with attention-deficit/hyperactivity disorder. Pediatrics 133,801–808. doi: 10.1542/peds.2013-3686
Shaffer, D., Fisher, P., Lucas, C. P., Dulcan, M. K., and Schwab-Stone, M. E.(2000). Diagnostic interview schedule for children version IV (NIMH DISC-IV): description, differences from previous versions and reliability of somecommon diagnoses. J. Am. Acad. Child Adolesc. Psychiatry 39, 28–38. doi:10.1097/00004583-200001000-00014
Skounti, M., Philatithis, A., and Galanakis, E. (2007). Variations in prevalenceof Attention Deficit Hyperactivity Disorder world wide. Eur. J. Pediatr. 166,117–123. doi: 10.1007/s00431-006-0299-5
Solanto, M. V., Schulz, K. P., Fan, J., Tang, C. Y., and Newcorn, J. H. (2009).Event-related fMRI of inhibitory control in the predominantly inattentiveand combined subtypes of ADHD. J. Neuroimaging 19, 205–212. doi:10.1111/j.1552-6569.2008.00289.x
Sowell, E. R., Thompson, P. M., Welcome, S. E., Henkenius, A. L., Toga, A. W.,and Peterson, B. S. (2003). Cortical abnormalities in children and adolescentswith Attention-Deficit Hyperactivity Disorder. Lancet 362, 1699–1707. doi:10.1016/S0140-6736(03)14842-8
Swanson, J. M., and Castellanos, F. X. (2002). “Biological bases of ADHD—Neuroanatomy, genetics, and pathophysiology,” in ADHD State of the Science,Best Practices, eds P. S. Jensen and J. R. Cooper (Kingston, NJ: Civic ResearchInstitute), 7–20.
Thompson, L., and Thompson, M. (1998). Neurofeedback combined withtraining in metacognitive strategies: effectiveness in students with ADD. Appl.Psychophysiol. Biofeedback 23, 243–263. doi: 10.1023/A:1022213731956
Toomim, H., and Carmen, J. (2009). “Hemoencephalography: photon-based bloodflow neurofeedback,” in Introduction to Quantitative EEG and Neurofeedback:Advanced Theory and Applications, 2nd Edn, eds T. Budzynski, H. Budzynski, J.Evans, and A. Abarbanel (New York, NY: Academic Press), 169–194.
Toomim, H., Mize, W., Yeekwong, P., Toomim, M., Marsh, H., Kozlowski,G. P., et al. (2005). Intentional increase of cerebral blood oxygenation usinghemoencephalography: an efficient brain exercise therapy. J. Neurother. 8, 5–21.doi: 10.1300/J184v08n03_02
Tsujimoto, S., Yasumura, A., Yamashita, Y., Torii, M., Kaga, M., and Inagaki, M.(2013). Increased prefrontal oxygenation realated to distractor-resistantworking memory in children with attention-deficity/hyperactivity disorder(ADHD). Child Psychiatry Hum. Dev. 44, 678–688. doi: 10.1007/s10578-013-0361-2
Wechsler, D. (2005). Intelligence Scales Wechsler (WISC-IV), 4th Edn. Madrid:TEA.
West, S. G., Finch, J. F., and Curran, P. J. (1995). “Structural equation modelswith non-normal variables: Problems and remedies,” in Structural EquationModeling: Concepts, Issues, and Applications, ed. R. Hoyle (Thousand Oaks, CA:Sage), 56–75.
Willcutt, E. G., Nigg, J. T., Pennington, B. F., Solanto, M. V., Rohde, L. A.,Tannock, R., et al. (2012). Validity of DSM-IV attention déficit/hyperactivitydisorder symptom dimensions and subtypes. J. Abnorm. Psychol. 121, 991–1010.doi: 10.1037/a0027347
Williams, J. R. (2008). Revising the declaration of Helsinki. World Med. J. 54,120–125.
Conflict of Interest Statement: The authors declare that the research wasconducted in the absence of any commercial or financial relationships that couldbe construed as a potential conflict of interest.
Copyright © 2016 Rodríguez, González-Castro, Cueli, Areces and González-Pienda.This is an open-access article distributed under the terms of the Creative CommonsAttribution License (CC BY). The use, distribution or reproduction in other forumsis permitted, provided the original author(s) or licensor are credited and that theoriginal publication in this journal is cited, in accordance with accepted academicpractice. No use, distribution or reproduction is permitted which does not complywith these terms.
Frontiers in Psychology | www.frontiersin.org 13 September 2016 | Volume 7 | Article 1406