attitudes towards refugees: do numbers matter?1087362/...attitudes towards refugees: do numbers...
TRANSCRIPT

Department of Sociology
Master’s thesis in sociology, 30 credits.
Fall semester 2016
Supervisor: Ryszard Szulkin
Attitudes towards
refugees: Do numbers
matter?
The effect of minority size population on the
acceptance of refugees in Swedish
municipalities
Paolo Velásquez
Abstract
With the ongoing conflict in the Middle East and other regions of the world, the eminent influx
of refugees to European nations has become a topic of great concern and discussion. An increase
in research has occurred concerning attitudes towards refugees and immigration in general,
which has put forth the question of whether larger numbers of foreign born correlates positively
or negatively to attitudes towards immigrants. Much of the previous research has focused
largely on cross-national comparisons but has overlooked the importance of contextual factors
at lower levels of analysis. Using cross-sectional data, the focus of this thesis is on the
proportion of foreign born in Swedish municipalities and its correlation to attitudes towards
refugees. The results confirm intergroup contact theory, which stipulates interaction among
different groups results in greater tolerance, which is facilitated by a larger proportion of foreign
born. In addition, the results also support the negative impact of poor economic conditions.
When looking at the effect of unemployment on attitudes towards refugees; less tolerant
attitudes arise as a consequence of higher unemployment. More research is needed in order to
understand the importance of the proportion of foreigners and socioeconomic factors in the
formation of attitudes towards refugees.
Keywords
Refugees, attitudes, intergroup contact, group threat, immigration, immigrants, Sweden

Table of contents
1. Introduction ......................................................................... 1
2. Previous research .................................................................. 2
2.1 Development of attitudes towards refugees in Sweden ................. 2
2.2 Increasing numbers of refugees .................................................... 4
2.3 Intergroup contact ......................................................................... 5
2.4 Group threat .................................................................................. 7
2.5 Research on Sweden .................................................................... 10
3. Hypotheses ........................................................................ 11
4. Data and method ................................................................ 13
4.1 Data and sample .......................................................................... 13
4.2 Method ......................................................................................... 14
4.3 Variables ...................................................................................... 16
5. Results .............................................................................. 19
5.1 Descriptive statistics .................................................................... 19
5.2 Results from regression analysis ................................................. 22
6. Summary and discussion ...................................................... 24
References ............................................................................... 28
Appendix ................................................................................. 32

1
1. Introduction
Recent years have seen an increased awareness and attention to the immigration flow into
wealthy European countries from underdeveloped and war torn nations. Many Western
European nations have seen a rise in right wing xenophobic parties, which promise to limit the
number of immigrants and refugees into their countries, often accompanied by ethno-
nationalist rhetoric. Sweden has had the highest proportion of asylum seekers in Europe1, and
in 2013 began granting permanent residence permits to all individuals fleeing the war in Syria.
Other countries torn by war and conflict which have the highest amount of individuals seeking
protection in Sweden include: Iraq, Somalia, Afghanistan, and Eritrea.
This essay particularly focuses on the attitudes towards refugees in the Swedish county of
Västra Götaland in the year 2013. This county was chosen due to its relatively recent data and
accessibility. Surveys on a national level were discarded due to small sample size with too
many underrepresented municipalities. Other counties considered were Skåne and Värmlands,
however, data for these counties were from years 2011 and 2010 respectively. A short
background section will follow providing the development of attitudes in Sweden. The
theoretical point of departure will be intergroup contact theory and group threat theory, as the
two main approaches for understanding the connection between attitudes and out-group size.
The main hypothesis to be tested deals with how the number of immigrants in municipalities
(kommuner) affects attitudes towards refugees.
In order to test the main hypothesis of this study, I argue that a larger proportion of immigrants
in a given municipality will affect positively attitudes towards refugees as proposed by
intergroup contact theory. Attitudes towards refugees have become more tolerant in Sweden
on a national level (figure 1), which could also explain differences at the municipal level.
Higher numbers of individuals of foreign background means higher visibility and an increase
1 Migrationsverket – mitt i världen 2015. http://www.migrationsverket.se/Om-Migrationsverket/Fakta-om-migration/Migrationsverket---mitt-i-varlden-2015.html

2
in the probability of contact with native Swedes, then this would translate into more tolerant
attitudes towards the acceptance of refugees into the country. Increased contact gives the
opportunity for friendships to form as well as the opportunity for learning more about the
foreign/out-group. Secondary to the main hypothesis, I will explore how economic conditions
have an effect on attitudes towards refugees. I expect less tolerant attitudes towards refugees
when economic conditions are poor, i.e. creating an environment less receptive to refugees.
2. Previous research
2.1 Development of attitudes towards refugees in Sweden
Attitudes toward refugees have been documented for more than 20 years in Sweden and have
generally become more positive throughout the years. As shown in Figure 1, in 1990, 61
percent of the population in Sweden thought it was a good proposal to receive fewer refugees,
with the highest percentage of 65 in the year 1992. It has then become more positive, where 44
percent responded that accepting fewer refugees was a good idea. However, in the last few
years, a slight increase in negative attitudes has appeared which resembles attitudes of the
previous years 2008-2009 (Demker & Sandberg 2013: 13 & Oscarsson & Bergström 2014: 50)
The number of residence permits for refugees have increased steadily since 2011, with 12,726
permits granted in that year, 17,407 (2012), 28,998 (2013) and 35,642 in 20142. This increase
has been mainly due to the ongoing conflict in Syria which has displaced millions of people to
neighboring countries as well as to European nations. Over 4 million people have left Syria,
with around 90,000 having made their way to Sweden since the conflict started. In 2015, over
a million people have sought asylum in the European Union, with around 163,000 seeking
asylum in Sweden. Sweden is the country that has taken the most refugees/asylum seekers in
proportion to its population. One of the biggest challenges in Sweden has been the ability to
accommodate all the people fleeing their countries, thus forcing The Swedish Migration
Agency (Migrationsverket) to find accommodation in hostels and the like.3
2 Residence permits granted 1980-2014 refugees. http://www.migrationsverket.se/English/About-the-Migration-Agency/Facts-and-statistics-/Statistics/Overview-and-time-series.html
3 Migrationsverket – mitt i världen 2015. http://www.migrationsverket.se/Om-Migrationsverket/Fakta-om-migration/Migrationsverket---mitt-i-varlden-2015.html

3
Figure 1. Percent answering the question, “Accept fewer refugees into Sweden?” from 1990
to 2013 at the national level.
Question: Accept fewer refugees into Sweden? Source: The National SOM survey 1990-2013
Five alternatives to question asked: "Very good proposal; Fairly good proposal; Neither good, nor bad proposal; Fairly bad
proposal; Very bad proposal". The results show percent answering "Very good/bad" or "Fairly good/bad" among respondents
who answered the question.
In a survey conducted in November of 2015 among 1,183 individuals between the ages of 18
and 79, where the questions asked were: “How worried are you for the challenge of the refugee
situation in Sweden?” and “Do you think Sweden can handle the refugees who arrived in
Sweden in recent times?” resulted in 36 percent being quite concerned about the refugee
situation in Sweden. 30% were very worried, while 27% were not so worried and only 4% not
worried at all.4
A more recent survey conducted in March of 2016, also shows stronger support for a tougher
refugee policy. 1019 people aged 18 to 79 answered the survey which asked to rate the new
refugee policy implemented in late 2015 as "very good", "fairly good", "very bad", "rather bad"
4 Svenskarna oroliga över flyktingsituationen http://www.svt.se/nyheter/inrikes/svenskarna-oroliga-over-flyktingsituationen
61
56
65
5956 56
54 54
5047
4344
50 5053
4846
4945 46
42 41
4544
17
22
1620 20 21 20 21
2426
28 2825 24 24 24
28 2728
2630 31
2932
0
10
20
30
40
50
60
70
PER
CEN
T
YEAR
Accepting Fewer Refugees
Good proposal Neither good nor bad Bad proposal
4
and "do not know". The reason for the implementation of this new law was to reduce the
number of refugees/asylum seekers in Sweden. This new law gives temporary residence
permits of 1 to 3 years instead of permanent residence directly. There is also less possibilities
for family reunification for those who have already obtained their residence permits and it will
be much easier to obtain permanent residence if one already has a job. This law is supposed to
last three years. A clear majority of the respondents (69%) believed this was a fairly good/very
good policy, whereas only 22% believed it to be fairly bad/very bad.5
2.2 Increasing numbers of refugees
The growing number of refugees into the country, (individuals fleeing conflict or persecution
in their home countries who are protected by international law)6, as well as asylum seekers
(individuals whose request for sanctuary has yet to be processed)7, has made integration a hotly
debated topic in regards to inclusion to the labor market as well as into mainstream society.
The study of attitudes towards immigrants/refugees is important since negative attitudes impact
prospective wages and quality of life (Waisman & Larsen 2008).
Although looking at the development of attitudes towards refugees on the national level
illustrates a steady increase in tolerance towards refugees, it dismisses the mechanisms which
give rise to these attitudes at lower levels of analysis. It is therefore important to understand
how out-group size is associated with in-group attitudes in the case for Swedish municipalities,
since they constitute the political and economic arena where interaction and competition takes
place among native Swedes and immigrants.
Two theoretical perspectives will be taken into account in order to explain how attitudes are
formed towards refugees. First, the effect of the proportion of immigrants in a municipality
will be measured and it will be expected to correlate positively to more tolerant attitudes
towards refugees. This is in line with intergroup contact theory which proposes that contact
5 Stort stöd för regeringens flyktingpolitik. http://www.svt.se/nyheter/inrikes/stort-stod-for-regeringens-flyktingpolitik
6 Refugees. http://www.unhcr.org/refugees.html
7 Asylum seekers. http://www.unhcr.org/asylum-seekers.html

5
between two different gives rise to greater tolerance. Secondly, the effect of poor economic
conditions on attitudes towards refugees will be explored. It will be expected that poorer
economic conditions in a municipality will yield less tolerant attitudes towards refugees.
Operalization of municipalities’ economic conditions will be measured by unemployment rate,
tax power, and percentage receiving welfare benefits (see variables section). Borrowing from
group threat theory, where competition over resources gives rise to hostile attitudes; the poorer
the economic conditions in a municipality should result in negative attitudes towards refugees.
That is, where unemployment is high, where tax power is low, or where there is a high
percentage receiving welfare benefits in a municipality.
2.3 Intergroup contact
The intergroup contact hypothesis was first proposed by Gordon W. Allport (1954 [1958]) who
argued that if there is little or no interaction at all between individuals in different groups, e.g.
native population and immigrants, then this will give rise to more negative, antagonistic views
and attitudes towards immigrants (minority group). In other words, interaction among different
groups results in greater tolerance, and unless prejudice is deeply rooted in an individual’s
character, it may be reduced by equal status contact in pursuit of common goals. He states:
“To be maximally effective, contact and acquaintance programs should lead to a sense
of equality in social status, should occur in ordinary purposeful pursuits, avoid
artificiality, and if possible enjoy the sanction of the community in which they occur. The
deeper and more genuine the association, the greater its effect. While it may help
somewhat to place members of different ethnic groups side by side on a job, the gain is
greater if these members regard themselves as part of a team.” (Allport 1958; 454)
Thus, four features when present, will aid in the decrease of prejudice: 1) equal status contact
between the majority and minority groups, 2) pursuit of common goals, 3) intergroup
cooperation, and 4) institutional support by law, custom, authorities, local atmosphere, etc.
(Allport 1958: 267). These conditions, however, are not crucial to reduce negative attitudes
towards outgroups, but under these conditions contact will reduce negative attitudes more
strongly as concluded in the meta-analytical study of intergroup contact theory by Pettigrew
and Tropp (2006).

6
The quality of the interaction between in and out-groups plays an important role in reducing
negative attitudes towards out-groups. Amir’s (1969) study of the contact hypothesis in ethnic
relations concluded that there is evidence for the support for the change in attitudes through
contact by members of different groups. However, the direction of attitudinal change depends
greatly on the grounds the contact took place, i.e. the quality of the interaction is fundamental.
Favorable conditions have a tendency to reduce prejudice; and unfavorable conditions of
interaction may lead to a rise in negative attitudes. In more recent research, it has been shown
that deeper and more meaningful contact between minority group members decrease prejudice
towards them, while shallower contact can have a negative effect (Dixon 2006). The
mechanisms behind more positive attitudes towards minority group members as contact
increases seem to be mainly through the reduction of anxiety and increased empathy towards
the out-group, and through the attainment of knowledge about the out-group to a lesser degree
(Pettigrew & Tropp 2008; 2011). Thus, in respect to this study, a higher proportion of
individuals with foreign background will be expected to increase the probability of contact and
the formation of meaningful relationships with native Swedes, which in turn will reduce
negative attitudes towards immigrants/refugees. Although the quality of interaction will not be
able to be measured (whether meaningful relationships are formed among natives and
foreigners), it is hypothesized that at the municipal level an increase of individuals with foreign
background will give rise to more tolerant views towards refugees.
Empirical evidence is given by Schlueter and Scheepers (2010) in Dutch municipalities where
partial support is shown for intergroup contact theory. On the one hand, higher percentage of
immigrants increased intergroup contact (measured by answers to the following: ‘‘How many
percent of your friends belong to an ethnic minority group?” and ‘‘How many percent of your
colleagues belong to an ethnic minority group?”), which in turn decreased disapproval of
immigrants. On the other hand, the actual percentage of immigrants influenced the perceived
size of minority groups (measured by the question “How many percent of the people in your
neighborhood are part of an ethnic minority group?”), which was positively associated to anti-
immigrant attitudes. This study reaffirms that the quality of interactions between members of
the in-group and the out-group is relevant when measuring attitudes towards out-group
members. More constant and meaningful contact reduces negative attitudes towards
immigrants, however, the actual number of immigrants in given area influences their perceived
size in contrast to the native population, which in turn gives rise to anti-immigrant attitudes.

7
This duality points out to the importance of the level of analysis when studying attitudes
towards minorities with respect to their proportion in a certain area.
For instance, Coenders (2001) extensive study of nationalism and attitudes towards minorities
in 22 European countries shows that the foreign population and prejudice towards ethnic
minorities are positively correlated. This means that the greater the proportion of
foreigners/immigrants in a European nation, the higher the country’s prejudice towards
minorities. Weber’s (2015) study of 15 European nations concluded that the national
percentage of immigrants is positively correlated with perceived threat, whereas the opposite
is true at the regional level. In other words, a large number of immigrants in a nation may
“coincide with greater worries about the consequences of immigration in a country but less so
within the regions where many immigrants reside” (130). A possible explanation given is the
poor image portrayed by the media and politicians at the national level, which results in an
increase in the perception of threat. Meanwhile, on the regional level, contact decreases the
perception of threat by more frequent interaction. Similarly McLaren’s (2003) study of anti-
immigrant prejudice in European countries shows that higher numbers of immigrants in a
country has a powerful impact on perceived threat. However, it was also found that contact
mediates the effect of threat in periods of high immigration. That is, when there is a large
proportion of immigrants, having more minority friends reduces the level of perceived threat
significantly. On the other hand, when the proportion of immigrants is small, having minority
friends has a weaker impact on the level of threat perception, which is already low (927).
It is thus opportunities for having contact (higher proportion of immigrants), together with
meaningful interactions (such as friendship or working together) with members of a minority
group, which result in reduced prejudice. These effects of intergroup contact are maximized
within smaller units of analysis (Wagner et al. 2003; 2006, Dirksmeier 2014) in contrast to
larger units of analysis such as countries, where the proportion of immigrants becomes subject
of political discussions often giving prominence to political and economic threats to the
majority (Blalock 1967).
2.4 Group threat
Herbert Blumer (1958) proposed that (race) prejudice derived from a sense of group
identity/position rather than individual feelings toward another group. The understanding of

8
prejudice must be thought of as a collective process by the dominant group which forms images
and identities of themselves as well as of out-groups. When creating or characterizing an
outside group, one is simultaneously defining one’s own group vis-à-vis each other. Group
identity and position is central to his thesis and to the understanding of prejudice in the
dominant group. Four characteristics are defined as intrinsic in prejudice in the dominant
group: 1) feeling superior, 2) feeling the subordinate group is different and alien, 3) a feeling
of entitlement to privilege and advantage, and 4) a fear the subordinate group threatens the
position of the dominant group. Blumer considered the fourth claim as essential to prejudice.
It is thus the feeling of probable threat to the dominant position which gives rise to animosity.
It may be expressed as economic competition, or as a transgression to the dominant group’s
“realm,” e.g. through access to better housing and education, which opens the doors to higher
standards of living, usually reserved for those in the dominant group. Group threat theory
presupposes individuals identify themselves with a certain group and that the stronger the threat
against group interests, whether perceived or real, give rise to conflict which in turn result in
negative attitudes. In respect to immigrants/refugees, the threat commonly is presented as
competition over resources, such as housing, welfare benefits and jobs (Fennema 2005;
Pettigrew 1957; Blalock 1957) In other words, the threat of immigrants/refugees increases
when resources are scarce, which results in negative attitudes towards them.
Empirical evidence shows different ways group threat affects attitudes towards minority
groups. Bobo’s study (1983) regarding white’s opposition to busing, demonstrated a
discrepancy among whites’ endorsement of general equality principles and simultaneously
opposing integration through policies like busing. Bobo concluded that whites reacted to busing
as a threat to their social world and group position, where busing portrays itself as a change in
relationships between whites and African-Americans regarding not only schools but other
domains of life such as a change in the racial makeup of their communities. The study by
Quillian (1995) of population composition and anti-immigrant prejudice in Europe shows that
the percentage of immigrants matters only when interacting with GDP per capita, meaning that
poor economic conditions and a large number of immigrants yield negative attitudes, though it
is uncertain if the size of the immigrant population by itself generates negative attitudes.
Similarly Coenders et al. (2008; see also Semyonov et al. 2006; Meuleman et al. 2009) shows
support for ethnic discrimination and negative attitudes towards immigrants in periods of high
immigration and when levels of unemployment are high. Group threat therefore affects

9
attitudes by challenging a dominant group’s position in the social hierarchy by threatening the
order of established relationships through the integration of minority groups into domains such
as educational/residential which were normally exclusive to the majority group, as
demonstrated by Bobo’s study. It also affects attitudes towards minority group members when
poor economic conditions interact with a high number of immigrants. This interaction increases
the perceived threat of immigrants which are thought to compete for jobs with the native
population.
A more specific approach to group threat theory has its focus mainly on the proportion of the
minority/subordinate group living in a certain area. It is assumed that the larger the number of
a minority group, the greater the threat, in this manner fomenting greater hostility. Blalock
(1967) postulates two reasons as to why the majority/dominant group might feel threatened by
the relative size of the minority/subordinate group. First, the larger the relative size of the
minority, the more individuals in this group are in direct or potential competition with those in
the dominant group, in this manner, increasing the feeling of threat and discriminatory
behavior. Secondly, as the numbers of the minority group increases, so does the potential for
political power which could undermine the majority’s dominant status. Following the group
threat theory approach based on minority proportion in a given area, Pettigrew (1957)
examined the percentage of African-Americans in the border-states of Missouri and Kentucky,
and how this affected school desegregation. He noted that areas of higher urbanism (defined as
the ratio of a county’s urban population to its total population) tend to desegregate first,
regardless of proportion of African-Americans, as well as prosperous rural areas with lower
ratios of African-Americans. Thus pointing to an interaction of out-group size and economic
prosperity in rural areas. In other words, a higher ratio of African-Americans in poor rural areas
results in reluctance to school integration, whereas a lower ratio of African-Americans in richer
rural areas results in rapid integration of the school systems. Blalock’s (1957) study of Southern
counties in the United States, similarly concluded a positive correlation as the percentage of
non-whites increased, so did observed discrimination in education and income.
These studies point to the importance between size of immigrant/minority population and
economic factors. Evidence is shown that when there is a greater number of minority group
members accompanied with unfavorable economic conditions, discrimination and anti-
immigrant attitudes rise.

10
2.5 Research on Sweden
Although attitudes towards immigration and refugees are well documented in Sweden at the
national level and even at the municipal level (Demker 2013; 2014), there is a lack of research
in Sweden regarding the relationship of proportion of foreigners in given area and its effect on
attitudes towards refugees. Mikael Hjerm’s (2009) study is one of the few attempts to provide
empirical evidence in this field. Based on group threat theory; he hypothesized the larger the
proportion of immigrants in a municipality, the stronger the anti-immigrant attitudes, as well
as the proportion of immigrants relating positively to anti-immigrant attitudes in less affluent
municipalities. He concluded that the proportion of foreign-born individuals within a
municipality did not impact anti-immigrant attitudes, nor any changes in the proportion of
foreign-born people. However, it is the interaction of the proportion of foreign-born people
with negative economic contexts, which give rise to higher anti-immigrant feelings. That is,
one is more likely to be prejudiced against immigrants if the municipality is poor, and it has a
large proportion of foreigners.
In a similar fashion, Rydgren & Ruth (2013) provide contextual explanations for radical right-
wing support in Sweden. Despite anti-immigration being only part of a broader web of issues
among radical-right wing supporters, it is an essential factor in determining who will vote for
such political parties (2013: 716-717) and thus can be used as a determinant of anti-immigrant
attitudes. The main conclusions of this study pointed towards a negative correlation between
unemployment rates in municipalities and voter support for the Sweden Democrats, as well as
a positive correlation between the percentage receiving welfare benefits in a municipality and
support for the Sweden Democrats. Regarding the proportion of immigrants from the Nordic
countries and EU/EFTA countries, there was a positive correlation for electoral support for the
Sweden Democrats, but the proportion of immigrants from countries outside of Europe
rendered a negative correlation. The results were highly unexpected, and the authors concluded
that socioeconomic factors are very important in understanding variance at the macro-level
when it comes to support for right-wing populist parties. Moreover, socioeconomic factors
explain more of the variance between voting districts than the actual proportion of immigrants
(ibid. 726).

11
In a study of intergroup contact, group threat and tolerance in Scandinavia, Jakobsen et al.
(2013) propose a different approach to the effect of minority group size on anti-immigrant
attitudes. Their point of departure borrows from Inglehart’s (1977) theory of post-materialism.
It is argued that a shift has occurred in Western societies from prioritizing materialist values
such as economic growth and order, to post-materialist values such as quality of life and self-
expression. This is derived from the increased standards of living which ensure physical
security and basic needs, and as a result, the mechanisms behind group threat theory will be
less pronounced than those proposed by intergroup contact theory. Since prosperous conditions
are found in Scandinavia (Norway, Sweden, and Denmark), then the fight over resources is not
as salient. Support for increased levels of immigration leading to increased levels of ethnic
tolerance was found. However, these findings only show support at the regional level (NUTS
2: Sydsverige, Nord-Norge, Syddanmark, etc), and the possibility of social tension at lower
levels of analysis is not discarded. Potentially, a tipping point has not yet been reached in the
number of immigrants in Scandinavian regions (Jakobsen 2013: 355; see also Sigelman et al.
1996), after which intergroup contact would decline.
Both theories receive mixed support in Sweden. At the regional level, an increase in the
proportion of immigrants seems to increase tolerance towards immigrants, whereas at the
municipal level the proportion of foreign-born does not seem to influence attitudes towards
them. It is rather an interaction of economic context and size of immigrant population which
determines attitudes towards immigrants. This interaction, however, does not give conclusive
results.
3. Hypotheses
The main aim of this study is to find out if the proportion of individuals with foreign
background positively correlates with the acceptance of refugees. Additionally, I expect poor
economic conditions (high unemployment, low tax power, and high percentage of welfare
recipients) to correlate negatively to the acceptance of refugees. Previous research on Sweden
is scarce and has found mixed results supporting group threat theory at the municipal level,
when the number of foreigners interacts with poor economic conditions, and supporting
12
intergroup theory at the regional level (Stockholm, Västsverige, Sydsverige, etc). This study
mainly differs from other studies by focusing primarily on refugees. Studies in Sweden have
relied on attitudes towards immigrants8, not precisely on refugees, which may capture different
attitudes and feelings. There is evidence showing that different attitudes arise depending on
which term is used, e.g. unauthorized immigrants, authorized immigrants, or refugees (Murray
& Marx 2013), as well as whether immigrants have a choice to emigrate (economic
immigrants), or whether they lack this choice (refugees escaping war), with the latter receiving
greater acceptance (Verkuyten 2005).
I would like to investigate the postulations of intergroup contact theory on a more fine-grained
level of analysis as opposed to the regional level. As shown in figure 1, national attitudes
towards acceptance of refuges have become more tolerant, which could also explain differences
at the municipal level. Municipalities are important bases for local labor markets, schools,
daycares, etc. Moreover, municipalities are an important political arena, where immigrants
have more political power than at the country level, since they do not need to be citizens in
order to vote. To study out-group numbers and attitudes at this level of analysis is then
reasonable and justifiable when considering most of the competition and contact among
different groups occurs at this level.
Therefore, I hypothesize:
H1: Attitudes towards refugees will be more positive as the proportion of immigrants increases
H2: Poor economic conditions (high unemployment, low tax power, large number of welfare recipients)
will have a negative impact on attitudes towards refugees
8 Hjerm’s (2009) and Jakobsen’s (2013) use the following questions from the European Social Survey
(ESS): 1) Is it generally bad or good for the economy that people come to live here from other
countries?; 2) Is the cultural life undermined or enriched by immigrants?; 3) Immigrants make country
worse or better place to live?

13
4. Data and method
4.1 Data and sample
The data used in this thesis comes from the SOM-institute survey (Society, Opinion and Media)
in the county of Västra Götaland, which also includes the municipality of Kungsbacka in the
adjacent county of Halland.
This survey, Western SOM (Väst-SOM), has been conducted yearly since 1992 and initially
only included the city of Gothenburg and surrounding areas. It was expanded in 1998 to include
the entire county of Västra Götaland County plus the municipality of Kungsbacka. Its purpose
is to study and analyze attitudes and behaviors linked to local and regional issues, with many
questions identical to those used in the national survey (National SOM), in order to compare
smaller regions with Sweden at large.
The sample random and it is representative of the population. It includes 2,983 observations
from individuals aged 16 to 85 who live in Västra Götaland county and Kungsbacka
municipality. From this dataset, I will only use 2,060 observations which correspond to
individuals who have been raised in Sweden, and with both parents who have also been raised
in Sweden. This was done in order to exclude the number of respondents with a
foreign/immigrant background which might bias the results. The final response rate was of
53% and it is mainly due to the difficulty to persuade people who are under 50 to take part in
the survey. The age group most willing to respond consists of 70 to 79 year olds in contrast to
the 16-19 age group which is least likely to respond. The surveys are distributed by mail,
although there is also an electronic version that can be answered online. Follow-up calls and
reminders are carried out in order to maximize the response rate. The collection of data began
in September 2013, and the last survey was received February 27th, 2014.

14
4.2 Method
The respondents in the survey were asked to respond to the proposal “Accept fewer refugees
in Sweden?” given five options: Very Good, Fairly Good, Neither Good nor Bad, Fairly Bad,
and Very bad. Since the dependent variable is on an ordinal scale, Ordered Logistic Regression
is applied to estimate the effect of the number of individuals with foreign background on the
tolerance towards refugees. This method is used when the categories on the dependent variable
are ordered but the distances between these categories are not known. One cannot assume that
the distances between each category are the same, e.g. from Very Good to Fairly Good is not
the same that from Neither Good nor Bad to Fairly Bad. The responses in the dependent
variable are coded as integers from 1 to 5, and perhaps due to this coding, one might be consider
analyzing ordinal outcomes with the linear regression model. However, ordinal dependent
variables violate the assumptions of this model, which can lead to inaccurate results. Therefore,
the Ordinal Regression Model (ORM) is preferred since it does not assume the distances
between categories to be equal. The ORM is usually presented as a latent-variable model,
where the latent variable y* captures the underlying attitudes to a statement from positive to
negative; with the structural model being:
For instance, using the dependent variable of this study which people are asked to respond:
“Take in fewer refugees in Sweden?” with answers to the proposal being: very good, fairly
good, neither good nor bad, fairly bad, and very bad. One can think of the propensity of
answering “very bad,” which is represented by category number five.
When the latent y* crosses a threshold, the observed category changes (Long & Freese 2014:
311). As illustrated in the example below, the categories are ranked, but the distances between
the categories are unknown. The distances between the different thresholds are not the same as
in an interval or ratio scale.
ey i bX*
1 VG if -∞ ≤ y* < τ1
2 FG if τ1 ≤ y* < τ2
yi = 3 NE if τ2 ≤ y* < τ3
4 FB if τ3 ≤ y* < τ4
5 VB if τ4 ≤ y* < ∞

15
Very
Good
(VG) Neither (NE) Fairly Bad (FB)
τ2 τ4
τ1 τ3
Fairly Very Bad (VB)
Good
(FG)
One of the assumptions of the ordered logistic regression is that the relationship between each
pair of outcome groups is the same (parallel-odds assumption). This means that the coefficients,
that explain the relationship between “Very Good,” to all the other higher categories is the
same as the relationship between “Fairly Good,” and all the other higher categories. Since the
relationships between all pairs of outcomes is the same, there is only one model and one set of
coefficients. In order to test the parallel-odds assumption, one can use different commands in
Stata9. The thresholds or cut points (in Stata) illustrate where the latent variable makes a
distinction in order to make the different hierarchical groups of the ordered dependent variable.
In order to conduct a more accurate analysis, the cluster option is used which places the
observations in clusters (in this case 50 municipalities with the average of 41.2 observations
per municipality). This indicates that the observations are nested and correlated within
municipalities but independent between municipalities. Moreover, robust standard errors are
presented in parentheses which show the correct standard errors in the presence of violations
of the assumptions of the model (Long & Freese 2014: 103). The results will be presented in
odds ratios. This means that independent variables with odds ratios greater than one show a
9 When using the brant command which tests the parallel-odds assumption, it shows that only the
variable age is problematic, suggesting that age matters more at the fourth threshold (answering “very
bad”) than it does for the other thresholds. All other variables do not violate this assumption. Measures of
fit were also conducted in order to compare different regression models (Ordered Logistic Regression vs.
Multinomial Logistic Regression and vs. Generalized Logistic Regression), which showed strong support
for OLR.

16
positive correlation to attitudes towards refugees when increasing by one unit. On the contrary,
variables with odds ratios less than one are correlated negatively to attitudes towards refugees.
4.3 Variables
This section describes each of the variables included in the analyses.
Dependent variable
The key outcome in the regression analyses is the response to the following proposal:
“Take in less refugees in Sweden?” (Ta emot färre flyktingar i Sverige)
All responses to the proposal range from Very good proposal to Very bad proposal on a scale
from 1 to 5. (1 = Very good proposal, 2= Quite good proposal, 3= Neither good nor bad, 4=
Quite bad proposal, 5= Very bad proposal).
This means that a positive sign of the parameter on the regression analysis will point to a
probability of answering “very bad,” which in this case shows higher tolerance towards
accepting more refugees. Whereas answering “very good” or “good” will yield a negative
effect, i.e. in support of taking fewer refugees.
Independent variables
Individual level indicators
The purpose for including individual indicators in the analysis is not to explain the effect they
might have on the dependent variable, since the hypotheses are concerned with the proportion
of foreign born in municipalities and with economic conditions, i.e. structural factors rather
than individual. The reason for including individual indicators is to avoid erroneous estimations
for group-level indicators. If a given individual indicator, such as education, has a strong effect
on the dependent variable while unevenly distributed across municipalities, then this could be
the reason for municipal level differences. Individual indicators are thus included in order to
control for the selection of individuals to municipalities.

17
Education: Education is measured in four categories: Low, Medium Low, Medium High and
High. Low education refers to individuals who have at most finished grundskola, i.e. primary
school in the Swedish school system. Medium low consists of people who have at most finished
gymnasium (Secondary school). A medium high education means and individual has studied
at a college or university but has not received a degree, and a high education refers to
individuals who have studied at a university and have obtained a degree.
Unemployed: Whether the respondent is unemployed or not. Dummy variable with 0 =
employed and 1 = unemployed. Only 60 respondents are unemployed which corresponds to
2.9% of the sample.
Household income: Yearly household income is measured on a 12-point scale, ranging from
100,000 SEK or less, to 1,100,000 SEK or more. Average household income is 5.7 on the 12-
point scale which corresponds to 501,000 to 600,000 SEK.
Gender: Whether the respondent identifies as male or female. Dummy variable with 0 = male
and 1 = female. 995 respondents identified themselves as male (48.3%) and 1,075 as female
(51.7%).
Age: Age of the respondent, ranging from 16 to 85. The average age of the respondent is 51
years.
Student: Whether the respondent is a student or not. Dummy variable with 0 = not student and
1 = student. 154 respondents identified themselves as students.
Contextual indicators
Percentage of individuals with foreign background: The proportions of individuals with
foreign background living in each municipality will be used. Foreign background as defined
by Statistics Sweden consists of individuals who were not born in Sweden, or individuals who
were born in Sweden but with both parents born abroad10. This is the main independent variable
10 Utländsk bakgrund definition. http://www.scb.se/sv_/Vara-tjanster/Regionala-statistikprodukter/Fardiga-tabellpaket/Definitioner/

18
which will be used to test the hypotheses. Additionally, the proportion of individuals with
foreign background who were not born in Sweden will be used in the analysis as well as the
proportion of foreigners in each municipality who were neither born in Sweden, nor in Europe
(born in Latin America, Africa, Asia, etc).
Economic context variables: Two different economic indicators are used. The first indicator is
total unemployment as registered by the The Swedish Public Employment Service
(Arbetsförmedlingen); 11 the second is the tax power of each municipality standardized to vary
around 100, collected from Statistics Sweden12, where 100 represents the average tax power in
Sweden. Values higher than 100 represent richer municipalities.
Welfare: Additionally, I have added the percentage of welfare recipients in each municipality
(ekonomiskt bistånd), since this indicator can give insight into the economic situation in each
municipality as well. Higher percentage of welfare recipients might be indicative of poorer
areas and socioeconomic marginalization, which could have an adverse effect on the formation
of attitudes towards immigrants/refugees. In terms of group threat, municipalities with a higher
proportion of welfare recipients and a higher proportion of immigrants, are expected to have
more negative attitudes towards refugees (See Rydgren & Ruth 2013). Data came from The
National Board of Health and Welfare (Socialstyrelsen).13
11 Öppet arbetslösa och sökande i program med aktivitetsstöd, andelar av den registerbaserade arbetskraften. http://www.arbetsformedlingen.se/Om-oss/Statistik-prognoser/Tidigare-statistik.html
12 Skatteunderlag och skattekraft efter region. År 1995 – 2016. http://www.scb.se/sv_/Hitta-statistik/Statistik-efter-amne/Offentlig-ekonomi/Finanser-for-den-kommunala-sektorn/Kommunalskatterna/
13 Ekonomiskt bistånd, Biståndsmottagare inklusive barn i % av befolkningen, en decimal, Ålder: 0-65+, 2013. http://www.socialstyrelsen.se/statistik/statistikdatabas/ekonomisktbistand

19
5. Results
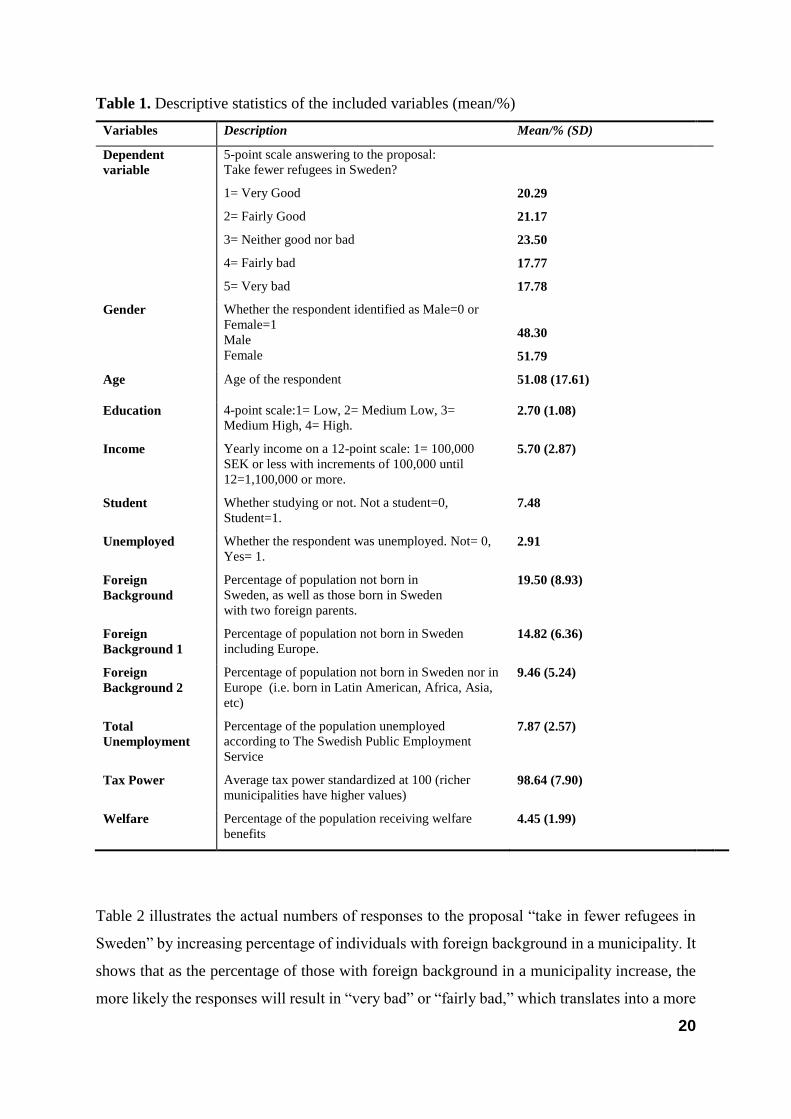
5.1 Descriptive statistics
In this section descriptive statistics of the included variables are presented. Short descriptions
of the variables are presented in the first column of table 1. In the second column the mean (or
the percentage) are shown for each variable. For instance, the percentage of people in the
sample who responded “Very Good,” to the proposal, “Take fewer refugees in Sweden?” is of
20.29, “Fairly Good” 21.17% and so on. Individuals who believe the proposal to be “Very
Good” or “Fairly Good” account for 41.46% of the total. Whereas those answering “Very Bad,”
or “Fairly Bad” account for 35.55% with the remaining 23.50% responding “Neither good nor
bad.” This means that there is a higher probability of agreeing with taking in less refugees on
average when all the municipalities are taken into account. The mean of individuals with a
foreign background as defined by Statistics Sweden is of 19.50 in all the municipalities of
Västra Götaland and including Kungsbacka municipality from Halland county. Means are
calculated for the other contextual variables as well with total unemployment at 7.87, tax power
at 98.64 and individuals currently receiving welfare benefits at 4.45. Standard deviations are
presented as well.
Table A1 (see Appendix) shows in detail context variables for each municipality in this study.
Highlighted are the highest and lowest numbers in each category. The municipality of Göteborg
has the highest percentage of foreign background individuals, taking into account different
measurements of foreign background. In contrast, the municipality of Öckerö has the lowest
proportion of individuals with foreign background. The municipality of Kungsbacka has the
lowest percentage of people receiving welfare benefits at 1.7%, whereas Trollhättan has the
highest percentage at 8.4%. The most affluent municipality as defined by Tax Power is
Kungsbacka with a tax power of 114 and the less affluent Dals-Ed with a tax power of 78.
Finally total unemployment is highest in Trollhättan with 15.85% and lowest in the
municipality of Tjörn with 3.64.
20
Table 1. Descriptive statistics of the included variables (mean/%)
Variables Description Mean/% (SD)
Dependent
variable
5-point scale answering to the proposal:
Take fewer refugees in Sweden?
1= Very Good
2= Fairly Good
3= Neither good nor bad
4= Fairly bad
5= Very bad
5-point scale answering to
Take fewer HERE
20.29
21.17
23.50
17.77
17.78
Gender Whether the respondent identified as Male=0 or
Female=1
Male
Female
48.30
51.79
Age Age of the respondent 51.08 (17.61)
Education 4-point scale:1= Low, 2= Medium Low, 3=
Medium High, 4= High. 2.70 (1.08)
Income Yearly income on a 12-point scale: 1= 100,000
SEK or less with increments of 100,000 until
12=1,100,000 or more.
5.70 (2.87)
Student Whether studying or not. Not a student=0,
Student=1. 7.48
Unemployed Whether the respondent was unemployed. Not= 0,
Yes= 1. 2.91
Foreign
Background
Percentage of population not born in
Sweden, as well as those born in Sweden
with two foreign parents.
19.50 (8.93)
Foreign
Background 1
Percentage of population not born in Sweden
including Europe. 14.82 (6.36)
Foreign
Background 2
Percentage of population not born in Sweden nor in
Europe (i.e. born in Latin American, Africa, Asia,
etc)
9.46 (5.24)
Total
Unemployment
Percentage of the population unemployed
according to The Swedish Public Employment
Service
7.87 (2.57)
Tax Power Average tax power standardized at 100 (richer
municipalities have higher values) 98.64 (7.90)
Welfare Percentage of the population receiving welfare
benefits 4.45 (1.99)
Table 2 illustrates the actual numbers of responses to the proposal “take in fewer refugees in
Sweden” by increasing percentage of individuals with foreign background in a municipality. It
shows that as the percentage of those with foreign background in a municipality increase, the
more likely the responses will result in “very bad” or “fairly bad,” which translates into a more

21
accepting and tolerant view towards refugees. For instance, a change occurs from 16.1% to
19.7% of responses in the “fairly bad” category, when the percentage of the population with
foreign background in a municipality increases from 0.0-9.9% to 20.0+ percent. Similarly, a
change in the “very bad” category occurs from 12.2% to 22.6% when the same increment in
population with foreign background is applied. It is worth remarking that actual change in the
“very good” category decreases only slightly from 19.1% to 18.3% when increasing the
percentage of individuals with foreign background. This may point out to strong beliefs
regarding refugees/immigrants which are not susceptible to change in this part of the
population. However, a larger decrease is appreciated in the “fairly good” category, decreasing
from 25.2% to 19.3%.
Overall, as the percentage of individuals with foreign background in a municipality increases,
so does the likelihood of responding “fairly bad” or “very bad” to the proposal. Nonetheless,
the total amount of responses is greater for categories “very good” and “fairly good” (20.3%
and 21.2% respectively.)
Table 2. Answers given to the proposal “Take in fewer refugees in Sweden?”
in municipalities by increasing percentage of individuals with foreign background.
Take in fewer refugees in
Sweden?
0.0-9.9% 10-19.9% 20.0+ Total
Very Good 44
(19.1)
225
(22.1)
149
(18.3)
418
(20.3)
Fairly Good 58
(25.2)
221
(21.7)
157
(19.3)
436
(21.2)
Neither Good Nor Bad 63
(27.4)
258
(25.8)
163
(20.1)
484
(23.5)
Fairly Bad 37
(16.1)
169
(16.6)
160
(19.7)
366
(17.8)
Very Bad 28
(12.2)
144
(14.2)
184
(22.6)
356
(17.3)
Total 230 1,017 813 2,060

22
5.2 Results from regression analysis
Model 1 tests the first hypothesis (H1) and it shows support for intergroup contact theory.
Attitudes towards refugees are more positive (1.015) as the proportion of foreign born increases
by one percentage point. At the individual level, it seems that highly educated people (3.882)
and people with a medium high education (1.955) hold substantially more positive attitudes
towards refugees. The same can be said of students (2.208), which point to education as a
strong predictor for more positive attitudes. Individuals who identify as female, also display
more positive attitudes (1.367).
Model 2 uses a different definition of what constitutes foreign background; excluding
individuals who were born in Sweden to foreign parents, and only having people who were not
born in Sweden, including other Scandinavian and European countries. There seems to be a
stronger effect in this model, and when looking at Model 3 which looks at the effect of the
proportion of individuals who were not born in Europe, i.e. Latin America, Africa, Asia, etc.,
a slight increase can be appreciated as well. These differences are significant, and show an odds
ratio of 1.022 per percentage point increase in the variable foreign background. Thus with one
percentage point increase in foreign background, the odds are 1.022 times larger of giving a
more tolerant answer to the proposal when the definition of foreign background includes
individuals not born in Sweden (including other European countries). Furthermore, the odds of
having a more tolerant answer to the proposal are 1.025 times larger when the definition of
foreign background excludes people not born in Sweden, nor in a European country. However,
these differences may be driven by the proportion of foreign born in the municipality of
Gothenburg (Göteborg). The highest proportions of foreign born are found in this municipality,
regardless of definition (table A1).

23
Table 3. Ordered Logistic Regression of factors which influence attitudes towards refugees.
Odds ratios (Robust standard errors in parentheses).
Model 1
Model 2
Model 3
Model 4
Model 5
Model 6
Individual indicators
Gender
1.367***
1.367***
1.365***
1.376***
1.371***
1.368***
(0.095) (0.095) (0.095) (0.096) (0.096) (0.097)
Age
1.005
(0.004)
1.005
(0.004)
1.005
(0.004)
1.005
(0.004)
1.005
(0.004)
1.005
(0.004)
Education (Ref. Low)
Medium Low 1.238
(0.179)
1.240
(0.179)
1.240
(0.179)
1.230
(0.182)
1.223
(0.180)
1.237
(0.181)
Medium High
1.955***
(0.241)
1.957***
(0.241)
1.959***
(0.242)
1.920***
(0.237)
1.906***
(0.243)
1.945***
(0.240)
High
3.882***
(0.631)
3.882***
(0.631)
3.894***
(0.632)
3.804***
(0.624)
3.770***
(0.640)
3.839***
(0.636)
Income 1.023
(0.019)
1.024
(0.019)
1.023
(0.019)
1.018
(0.018)
1.019
(0.018)
1.021
(0.019)
Student 2.208***
(0.410)
2.208***
(0.410)
2.214***
(0.413)
2.176***
(0.399)
2.160***
(0.394)
2.190***
(0.402)
Unemployed 1.411
(0.327)
1.411
(0.327)
1.401
(0.326)
1.420
(0.327)
1.413
(0.327)
1.419
(0.327)
Contextual variables
Foreign Background 1.015***
(0.003)
1.024***
(0.004)
1.014***
(0.003)
1.028**
(0.009)
Foreign Background 1
1.022***
(0.005)
Foreign Background 2
1.025***
(0.006)
Total Unemployment
0.947***
(0.014)
Tax
1.009
(0.005)
Welfare 0.938
(0.040)
cut1
_cons 0.391 0.422 0.326 0.089 1.240 0.316
cut2
_cons 1.489 1.520 1.422 1.188 2.338 1.414
cut3
_cons 2.545 2.576 2.479 2.247 3.395 2.471
cut4
_cons 3.571 3.602 3.504 3.275 4.422 3.498
N 2060 2060 2060 2060 2060 2060
p < 0.05, * p < 0.01, ** p < 0.001***

24
I test hypothesis 2 (H2) in models 4, 5 and 6. In model 4, the effect of total unemployment in
a municipality impacts negatively attitudes towards refugees. Attitudes become less positive as
total unemployment increases by one percentage point (0.947). In model 5, an increase in tax
power, i.e. richer municipalities, does not exhibit more positive attitudes towards refugees (that
is, poorer municipalities do not show more negative attitudes as hypothesized). The result
shows an odds ratio of 1.009 as tax power increases by one unit. However, this result is not
statistically significant. Similarly, Model 6 shows that an increase in welfare recipients in a
municipality does not have a statistically significant effect on attitudes towards refugees.
Looking at individual factors in all models, we see that highly educated people have
consistently more positive attitudes towards refugees than others. Students are also more likely
to hold positive attitudes towards refugees, which indicates the presence of education as a
strong predictor for more tolerant attitudes. Identifying as female shows also a statistically
significant positive correlation to more positive attitudes. Other variables such as age, income,
and whether unemployed, shows no significant correlations to the dependent variable.
In addition, I conducted a regression analyses without the municipality/city of Gothenburg (not
shown) which accounted for 588 observations of the sample. This was done in order to detect
the impact this municipality had on the results due to its size. The regression showed that the
proportion of foreign born (regardless of definition) has no statistically significant results when
this municipality is excluded. However, other contextual factors such as total unemployment
(0.951) and welfare (0.910) indicate more negative attitudes towards refugees as these variables
increase by one percentage point. At the individual level, age also becomes a statistically
significant predictor for more positive attitudes towards refugees (1.010).
6. Summary and discussion
The purpose of this thesis was to investigate whether the proportion of foreign born had an
impact on attitudes towards refugees in Swedish municipalities. Using cross sectional data, the
association between the proportion of foreign born and attitudes towards refugees was
examined, as well as the effect of poor economic conditions on attitudes.

25
The findings show – in line with intergroup contact theory- a positive correlation between a
larger proportion of foreign born and attitudes towards immigrants; in this case refugees
(McLaren 2003, Wagner et al. 2003; 2006, Dirksmeier 2014) Although the correlation between
a larger proportion of foreign born in a municipality and attitudes towards refugees is not as
strong as other factors such as education, it is nonetheless statistically significant. Moreover,
as the definition of foreign born becomes narrower, i.e. excluding those who were not born in
Sweden, and those who were not born in Europe, the odds become greater of holding more
positive attitudes. This, however, could be explained by the size of the municipality/city of
Gothenburg. Gothenburg accounts approximately for one third of the total population of Västra
Götaland, and has the highest proportion of persons with foreign background regardless of
definition. As a consequence of this, the results are driven by its size and possibly other
characteristics such as the level of urbanization and the higher probability of meeting a person
of foreign background. In this sense, cities provide the conditions for intergroup
friendships/contacts to form (Pettigrew et al. 2007). Furthermore, when conducting analyses
without the city of Gothenburg, it is shown that the proportion of foreign born does not have a
statistically significant effect on attitudes towards refugees. This can be interpreted as the urban
population having more tolerant attitudes due to greater contact opportunities among different
ethnic groups (Dirksmeier 2014).
When looking at the impact of economic conditions on attitudes; the results show some support
to what was hypothesized. In line with other studies (Hjerm 2009, Rydgren & Ruth 2013),
where economic factors play an important role, it is shown that only total unemployment yields
significant results. Other factors thought to have a negative influence on attitudes towards
refugees such as a low tax power in a community, and a higher percentage of welfare recipients,
do not show any significant results (however, when the city of Gothenburg is excluded from
the analyses, the percentage of welfare recipients becomes statistically significant). Total
unemployment seems to have a slightly greater effect than the proportion of immigrants in each
municipality which point to the importance of economic conditions when understanding the
influence of structural factors on attitudes.

26
The main conclusions of this study found support for intergroup contact theory as well as
support for the negative impact of economic distress on attitudes towards refugees. On one
hand, a larger proportion of foreign born in a municipality results in greater odds of having
more tolerant views towards refugees. On the other hand, higher levels of unemployment
results in less favorable attitudes towards refugees. However, when the city of Gothenburg is
excluded, the proportion of foreign born does not show any significant results, but rather total
unemployment and the percentage of welfare recipients.
The results point to the importance of the proportion of immigrants on attitudes towards
refugees in the largest city of Gothenburg, but most importantly they show that on a macro-
level, unemployment and percentage of welfare in municipalities are potentially strong
predictors of attitudes towards refugees. Perhaps more attention should be paid at economic
factors which influence attitudes rather than the actual proportion of immigrants. However, it
is difficult to assess which theory applies at different levels of analysis. For instance, the
proportion of immigrants at the national level does not have the same effect as the proportion
of immigrants at the municipal level or even at the neighborhood level. At the neighborhood
level, intergroup contact theory could explain more of the variance in attitudes towards
refugees than at the national level. On the other hand, group threat theory could show a stronger
correlation to anti-immigrant attitudes at the national level due to the media portrayal of
immigrants as well as the prevailing political discourse of the time (Esses et al. 2013). This
needs to be explored further and in depth.
One major limitation of this study is its cross-sectional nature. It is only a snapshot of the social
environment of the time and its results can be attributed to other factors such as period or age
effects. Moreover, the average age of the respondents in this study is 51, higher than the
national average of 4114, which could lead to results not representative of the population
(Gerring 2012: 86). Another important factor which limits the study is the small sample size.
Although 2060 observations are used in the regression analysis, they range from five
observations in some municipalities to over 500 observations in others. The sample would have
been more representative if the municipalities with smaller populations had had more
respondents.
14 Regional statistik – Din kommun i siffror. http://www.ekonomifakta.se/Fakta/Regional-statistik/Din-kommun-i-siffror/Nyckeltal-for-regioner/?var=17247

27
If the same survey were conducted today I believe it would show less tolerant results. The
refugee crisis has worsened and events such as the United Kingdom’s withdrawal from the
European Union and the election of Donald Trump as president of the United States, have
created a more hostile milieu for refugees and immigrants in general. Right wing parties have
been on the rise in Europe and Sweden seems to be following the same path as support for the
Sweden Democrats grows.
A proposal for future research would be a longitudinal analysis which would follow the same
respondents over years in order to find out how their attitudes are formed and shaped.
Alternatively, repeated cross-sectional analyses could be performed on the same municipalities
to investigate any change in attitudes. More research needs to be conducted in this field in
Sweden, since the few studies that have been done point to different conclusions. It would be
interesting to conduct research at higher levels of analysis (regions, country) and comparing
these results in order to have a better understanding of how contextual indicators, specifically
larger proportion of foreigners, have an effect on attitudes towards refugees/immigrants. In
addition, more attention should be paid to the differences between cities and suburban areas.
Attitudes towards refugees are more tolerant in the city of Gothenburg and this should be
addressed. It could be the case that more educated people live in cities or that urbanites have
more positive views in general. Also, levels of segregation could play an important role in
attitude formation. This is not taken into account in this study and it would be interesting to see
in future research
28
References
Allport, G. W. (1958). The nature of prejudice: Abridged. Doubleday.
Amir, Y. (1969). Contact hypothesis in ethnic relations. Psychological bulletin, 71(5), pp.
319-342.
Bakalian, A., & Bozorgmehr, M. (2009). Backlash 9/11: Middle Eastern and Muslim
Americans Respond. Univ of California Press.
Blalock, H. M. (1957). Per cent non-white and discrimination in the South. American
Sociological Review, 22(6), 677-682.
Blalock, H. M. (1967). Toward a theory of minority-group relations. John Wiley & Sons.
Blumer, H. (1958). Race prejudice as a sense of group position. The Pacific sociological
review, 1(1), 3-7.
Bobo, L. (1983). Whites' opposition to busing: Symbolic racism or realistic group
conflict?. Journal of Personality and Social Psychology, 45(6), 1196.
Case, C. E., Greeley, A. M., & Fuchs, S. (1989). Social determinants of racial prejudice.
Sociological Perspectives, 32(4), 469-483.
Coenders, Marcel. (2001). Naturalistic Attitudes and Ethnic Exclusionism in a Comparative
Perspective: An Empirical Study of Attitudes Toward the Country and Ethnic Immigrants in
22 Countries. Nijmgen: KUN.s
Coenders, M., & Scheepers, P. (2003). The effect of education on nationalism and ethnic
exclusionism: An international comparison. Political psychology, 24(2), 313-343.
Coenders, M., Lubbers, M., Scheepers, P., & Verkuyten, M. (2008). More than two decades
of changing ethnic attitudes in the Netherlands. Journal of Social Issues, 64(2), 269-285.
Demker, M. (2013). Svensk migrationspolitisk opinion 1991-2012. SOM-institutet.
Demker, M. (2014). Sverige åt svenskarna.Motstånd och mobilisering mot invandring och
invandrare i Sverige. Stockholm: Atlas.
Demker, M. & Sandberg, L. (2013). Ökat motstånd mot flyktingar men starkt stöd för skäl till
uppehåltillstånd. In Svensk migrationspolitik opinion 1991-2012: Göteborgs Universitet:
SOM-Institutet.
Dirksmeier, P. (2014). Are urbanites more permissive? Germany’s urban geography of
prejudice. Urban Affairs Review, 50(6), 835-863.

29
Dixon, J. C. (2006). The ties that bind and those that don't: Toward reconciling group threat
and contact theories of prejudice. Social Forces, 84(4), 2179-2204.
Esses, V. M., Medianu, S., & Lawson, A. S. (2013). Uncertainty, Threat, and the Role of the
Media in Promoting the Dehumanization of Immigrants and Refugees. Journal of Social
Issues, 69(3), 518-536.
Fennema, M. (2005). Populist parties of the right. In Jens Rydgren, Movements of exclusion:
Radical right-wing populism in the Western world, New York: Nova Science pp. 1-24.
Gerring, J. (2012). Social science methodology: A unified framework. Cambridge University
Press.
Glenn, Norval. (2003). Distinguishing Age, Period, and Cohort Effects. Handbook of the Life
Course edited by Jeylan T. Mortimer and Michael J. Shanahan. Kluwer Academic/Plenum
Publishers, New York.
Hjerm, M. (2001). Education, xenophobia and nationalism: A comparative analysis. Journal
of ethnic and Migration Studies, 27(1), 37-60.
Hjerm, M. (2009). Anti-immigrant attitudes and cross-municipal variation in the proportion
of immigrants. Acta Sociologica, 52(1), 47-62.
Inglehart, R. (1977). The Silent Revolution: Changing Values and Political Styles among
Western Publics. Princeton, NJ: Princeton University Press.
Jakobsen, T. G., Isaksen, J. V., Skavhaug, G. K. O., & Strabac, Z. (2013). In Varietate
Harmonia?: Intergroup Contact, Group Threat and Ethnic Tolerance in Scandinavian
Regions. International Journal on Minority and Group Rights, 20(3), 349-369
Long J. Scott & Freese, Jeremy. (2014). Regression Models for Categorical Dependent
Variables Using Stata, Third Edition. College Station, TX: Stata Press.
McLaren, L. M. (2003). Anti-immigrant prejudice in Europe: Contact, threat perception, and
preferences for the exclusion of migrants. Social Forces, 81(3), 909-936.
Meuleman, B., Davidov, E., & Billiet, J. (2009). Changing attitudes toward immigration in
Europe, 2002–2007: A dynamic group conflict theory approach. Social Science
Research, 38(2), 352-365.
Murray, K. E., & Marx, D. M. (2013). Attitudes toward unauthorized immigrants, authorized
immigrants, and refugees. Cultural Diversity and Ethnic Minority Psychology, 19(3), 332.
Oscarsson, H. & Bergström, A. (2014). Swedish Trends 1986-2013. Göteborgs University:
SOM-Institutet.
Pettigrew, T. F. (1957). Demographic correlates of border-state desegregation. American
Sociological Review, 22(6), 683-689.

30
Pettigrew, T. F., & Tropp, L. R. (2006). A meta-analytic test of intergroup contact
theory. Journal of personality and social psychology, 90(5), 751.
Pettigrew, T. F., Christ, O., Wagner, U., & Stellmacher, J. (2007). Direct and indirect
intergroup contact effects on prejudice: A normative interpretation. International Journal of
intercultural relations, 31(4), 411-425.
Pettigrew, T. F., & Tropp, L. R. (2008). How does intergroup contact reduce prejudice?
Meta‐analytic tests of three mediators. European Journal of Social Psychology, 38(6), 922-
934.
Pettigrew, T. F., Tropp, L. R., Wagner, U., & Christ, O. (2011). Recent advances in
intergroup contact theory. International Journal of Intercultural Relations, 35(3), 271-280.
Quillian, L. (1995). Prejudice as a response to perceived group threat: Population
composition and anti-immigrant and racial prejudice in Europe. American sociological
review, 586-611.
Rydgren, J., & Ruth, P. (2013). Contextual explanations of radical right-wing support in
Sweden: socioeconomic marginalization, group threat, and the halo effect. Ethnic and Racial
Studies, 36(4), 711-728.
Scheepers, P., Gijsberts, M., & Coenders, M. (2002). Ethnic exclusionism in European
countries. Public opposition to civil rights for legal migrants as a response to perceived
ethnic threat. European sociological review, 18(1), 17-34.
Schlueter, E., & Scheepers, P. (2010). The relationship between outgroup size and anti-
outgroup attitudes: A theoretical synthesis and empirical test of group threat-and intergroup
contact theory. Social Science Research, 39(2), 285-295.
Semyonov, M., Raijman, R., & Gorodzeisky, A. (2006). The rise of anti-foreigner sentiment
in European societies, 1988-2000. American Sociological Review, 71(3), 426-449.
Sigelman, L., Bledsoe, T., Welch, S., & Combs, M. W. (1996). Making contact? Black-white
social interaction in an urban setting. American Journal of Sociology, 1306-1332.
Smith, A. W. (1981). Racial tolerance as a function of group position. American Sociological
Review, 558-573.
Verkuyten, M. (2005). Immigration discourses and their impact on multiculturalism: A
discursive and experimental study. British Journal of Social Psychology, 44, 223–240
Wagner, Ulrich, Rolf van Dick, Thomas F. Pettigrew, and Oliver Christ. (2003). Ethnic
Prejudice in East and West Germany: The Explanatory Power of Intergroup
Contact. Group Processes & Intergroup Relations 6:22–36.
Wagner, Ulrich, Oliver Christ, Thomas F. Pettigrew, Jost Stellmacher, and Carina
Wolf. (2006). Prejudice and Minority Proportion: Contact Instead of Threat
Effects. Social Psychology Quarterly 69:380–90.

31
Waisman, G., & Larsen, B. (2008). Do attitudes towards immigrants matter?. Linnaeus
Center for Integration Studies (SULCIS) Working Papers, 5.
Weber, H. (2015). National and regional proportion of immigrants and perceived threat of
immigration: A three-level analysis in Western Europe. International Journal of Comparative Sociology, 56(2), 116-140.

32
Appendix
Municipality % Foreign
background
% Foreign
background
not born in
Sweden
% Foreign
background
not born in
Sweden nor
Europe
% Currently
on welfare
benefits
Tax
Power
% Total
unemployment
Ale 18.57 13.4 7.5 2.8 98 6.32
Alingsås 12.64 9.9 5.8 3.1 97 7.52
Bengtsfors 15.81 13.8 4.6 4.3 81 9.80
Bollebygd 10.30 8.1 3.3 2.9 102 5.26
Borås 26.29 19.3 12.3 4.4 94 8.52
Dals-Ed 16.12 14.8 4.2 4.7 78 8.73
Essunga 8.61 7.2 3.1 2.7 88 6.85
Falköping 13.78 11 8.1 5.9 88 8.55
Färgelanda 10.57 9.0 3.7 3.9 84 9.26
Grästorp 7.76 6.3 2.7 2.6 89 8.76
Gullspång 15.54 13.4 6.9 5.8 83 11.80
Göteborg 31.66 23.5 16.8 6.9 102 9.43
Götene 10.80 8.8 4.3 3.4 92 6.62
Herrljunga 12.95 10.1 5.4 4.8 90 6.80
Hjo 7.79 6.5 2.5 3.3 91 7.27
Härryda 13.36 9.9 5.2 1.9 112 4.58
Karlsborg 7.01 6.3 2.3 2.2 94 5.67
Kungälv 10.72 8.0 4.6 2.4 107 3.87
Lerum 11.55 8.7 4.4 2.5 108 3.74
Lidköping 10.63 8.3 5.7 2.4 96 7.99
Lilla Edet 17.50 13.4 5.5 5 93 8.24
Lysekil 12.74 10.7 5.9 4.6 96 5.96
Mariestad 12.48 10.2 5.2 3.2 91 10.29
Mark 13.59 10.5 5.2 3.6 90 6.21
Mellerud 14.05 11.7 5.5 4.7 79 9.40
Munkedal 10.17 8.4 3.7 3.3 85 6.85
Mölndal 18.76 14.1 8.8 2.7 111 5.13
Orust 7.76 6.4 2.8 2.6 100 4.56
Partille 20.37 14.7 9.1 2.5 108 5.34
Skara 14.60 11.7 7.9 4.7 93 8.66
Skövde 16.71 12.7 8.2 2.2 99 8.46
Sotenäs 9.31 8.0 3.2 2.3 100 5.40
Stenungsund 11.10 8.9 4.6 3 106 4.53
Strömstad 26.48 22.9 7.8 1.7 86 5.03
Svenljunga 15.16 12.2 5.2 4.7 87 5.73
Tanum 11.27 10.0 3.8 2.1 87 4.86
Tibro 14.12 11.1 7.5 4 86 10.78
Tidaholm 10.21 8.2 4.6 3.4 88 7.63
Tjörn 8.39 6.9 3.2 2.1 108 3.64
Tranemo 16.76 13.1 6.3 4.3 91 4.88

33
Trollhättan 25.10 18.4 13.1 8.4 92 15.85
Töreboda 10.53 9.0 4.5 4.8 83 10.68
Uddevalla 16.64 12.8 8.7 4.3 93 9.25
Ulricehamn 12.87 10.5 5.4 3.4 91 5.85
Vara 9.08 7.6 3.7 3.1 88 7.68
Vårgårda 11.88 9.5 6.1 3.4 89 7.49
Vänersborg 13.71 10.6 6.7 4.2 92 10.66
Åmål 12.85 10.9 5.7 5.5 84 12.14
Öckerö 5.30 4.6 1.9 2.4 106 3.71
Kungsbacka 8.42 6.9 2.9 1.7 114 4.27