attitudes towards the impartiality of television news
TRANSCRIPT

Attitudes towards the impartiality of
television news Summary of findings
July 2014
Annex 2

2
Opinion on the impartiality of TV news sources
According to results from Ofcom’s Media Tracker, the perception of impartiality in television news among UK
adults has declined since 2010, with the rate of decline greatest between 2010 and 2011. In total, perception of
the impartiality of ‘television overall’ has dropped by nine percentage points since 2010, a decline that is also
evident across individual figures for each of the public service broadcasters (PSBs) and Sky News.
The following slides set out the results from Ofcom’s Media Tracker, together with data from other Ofcom research
on attitudes towards news.

66% 68%
51% 50% 50% 44%
59% 61%
44% 46% 42% 43%
56% 57%
44% 44% 38% 37%
57% 56%
40% 41% 36% 37%
0%
20%
40%
60%
80%
Televisionoverall
The BBC ITV Channel 4/S4C Channel 5 Sky News
2010 2011 2012 2013
% saying impartial (= a score of 1 or 2 out of 5)
Perception of impartiality in television news has
decreased significantly since 2010 and is not restricted
to any individual broadcaster
3
Source: Ofcom Media Tracker 2010, 2011, 2012, 2013.
Base: Base: All respondents 2013 (1,893), 2012 (1,854), 2011 (1,754), 2010 (2141). The BBC = BBC One, BBC Two, BBC News.
Q - Using a scale from 1 to 5, where 1 is very impartial and 5 is very biased, how impartial do you think each of the following news sources is?
Indicates a significant change between 2010 and 2013
Indicates a significant change yoy between 2012 and 2013
The direction of the arrow indicates whether the change is
an increase or decrease

Source: Ofcom Media Tracker 2010, 2011, 2012, 2013.
Base: Base: All respondents 2013 (1,893), 2012 (1,854), 2011 (1,754), 2010 (2141).
Q - Using a scale from 1 to 5, where 1 is very impartial and 5 is very biased, how impartial do you think each of the following news sources is?
66% 57%
25% 30%
19% 17%
59% 52%
24% 29%
20% 18%
56% 49%
23% 28%
19% 15%
57% 49%
21% 28%
18% 15%
0%
20%
40%
60%
80%
Television Radio Newspapers Websites;Broadcasters
Websites:Newspapers
Websites: Other
2010 2011 2012 2013
% saying impartial (= a score of 1 or 2 out of 5)
4
Perception of impartiality in radio news and
newspapers has also decreased significantly since
2010 Indicates a significant change between 2010 and 2013
Indicates a significant change yoy between 2012 and 2013
The direction of the arrow indicates whether the change is
an increase or decrease

5
66% 59% 56% 57%
68% 61%
57% 56% 51%
44% 44% 40%
50% 46% 44% 41% 45% 42%
38% 36% 44% 43%
37% 37%
19% 26%
27% 24%
17% 23%
25% 24%
18%
22% 23% 21%
22% 27% 28% 26%
21% 28% 28%
25% 19% 23%
24% 21%
10% 12% 13% 13%
10% 13% 13%
13%
7% 9% 10%
10%
8% 10% 13%
12% 7%
10% 12%
12% 9% 11%
13% 12%
5% 3% 4% 6% 5% 3% 5% 7%
24% 25% 24% 28%
21% 17% 15%
21% 26%
20% 21% 28% 28%
24% 26% 30%
2010 2011 2012 2013 2010 2011 2012 2013 2010 2011 2012 2013 2010 2011 2012 2013 2010 2011 2012 2013 2010 2011 2012 2013
Don'tKnow
Biased(4-5)
Neutral(3)
Impartial(1-2)
TV as a whole BBC ITV Sky News Channel 4 Channel 5
The proportion of adults opting to answer ‘neutral’
has increased significantly since 2010 % of respondents who rated news impartiality on a scale of 1 – 5 (all adults)
Source: Ofcom Media Tracker 2010, 2011, 2012, 2013.
Base: Base: All respondents 2013 (1,893), 2012 (1,854), 2011 (1,754), 2010 (2141). The BBC = BBC One, BBC Two, BBC News.
Q - Using a scale from 1 to 5, where 1 is very impartial and 5 is very biased, how impartial do you think each of the following news sources is?
Indicates a significant change between 2010 and 2013
Indicates a significant change yoy between 2012 and 2013
The direction of the arrow indicates whether the change is
an increase or decrease
6
61% 55%
51% 44%
64% 55% 56%
51%
67% 61% 59% 59%
75% 68%
59% 65%
69%
55% 58%
62% 63% 60%
56% 60%
21% 27%
27% 30%
18% 27% 27%
29%
18% 27% 24% 23%
15%
18%
28% 20%
18%
32% 28% 24% 22%
24% 29% 21%
10% 12% 17% 13%
12% 16% 13%
14% 11%
11% 13% 13%
7% 11% 11% 13% 11% 11% 11% 9% 11% 13% 12% 15%
8% 7% 6% 12% 6% 1% 4% 7% 4% 1% 4% 5% 3% 2% 3% 3% 2% 2% 3% 4% 3% 3% 4% 4%
2010 2011 2012 2013 2010 2011 2012 2013 2010 2011 2012 2013 2010 2011 2012 2013 2010 2011 2012 2013 2010 2011 2012 2013
Don'tKnow
Biased(4-5)
Neutral(3)
Impartial(1-2)
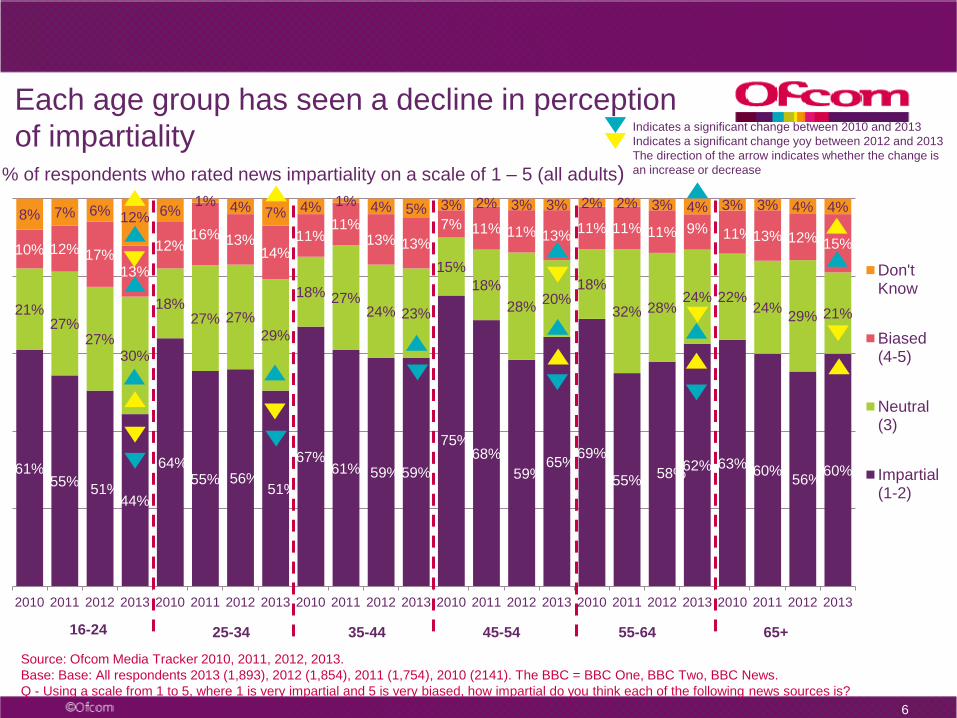
16-24 25-34 35-44 65+ 45-54 55-64
% of respondents who rated news impartiality on a scale of 1 – 5 (all adults)
Each age group has seen a decline in perception
of impartiality
Source: Ofcom Media Tracker 2010, 2011, 2012, 2013.
Base: Base: All respondents 2013 (1,893), 2012 (1,854), 2011 (1,754), 2010 (2141). The BBC = BBC One, BBC Two, BBC News.
Q - Using a scale from 1 to 5, where 1 is very impartial and 5 is very biased, how impartial do you think each of the following news sources is?
Indicates a significant change between 2010 and 2013
Indicates a significant change yoy between 2012 and 2013
The direction of the arrow indicates whether the change is
an increase or decrease

7
69%
59% 56% 58% 63%
59% 57% 55%
17%
25% 26% 23%
21% 27% 29% 26%
10% 13% 14% 14% 10% 11% 11%
11%
3% 3% 4% 4% 6% 3% 4% 8%
2010 2011 2012 2013 2010 2011 2012 2013
Don'tKnow
Biased(4-5)
Neutral(3)
Impartial(1-2)
ABC1 Source: Ofcom Media Tracker 2010, 2011, 2012, 2013.
Base: All respondents: 2141 (2010), 1755 (2011), 1854 (2012), 1893 (2013).
Q - Using a scale from 1 to 5, where 1 is very impartial and 5 is very biased, how impartial do you think each of the following news sources is?
C2DE
% of respondents who rated news impartiality on a scale of 1 – 5 (all adults)
Each socio-economic group has seen a decline in
perception of impartiality Indicates a significant change between 2010 and 2013
Indicates a significant change yoy between 2012 and 2013
The direction of the arrow indicates whether the change is
an increase or decrease

69%
60%
62%
58%
40%
66%
67%
61%
68%
62%
44%
56%
63%
60%
65%
59%
44%
61%
51%
52%
60%
52%
42%
57%
57%
59%
66%
63%
37%
55%
0% 20% 40% 60% 80%
BBC Television
ITV
Sky News Channel
Channel 4 (TV Channel)
Channel 5
Al Jazeera
Importance Accurate & Reliable Trustworthy Impartial & unbiased Offers range of opinionsSource: Ofcom News Report 2013.
Base: Those who use platform to access the news ‘nowadays’ on each type (varies) – Only includes bases over 50. Note: News sources
are ordered by consumption levels.
Attributes for television news sources among those who use each source Proportion of users who rated the source highly (7-10) (%)
‘Impartial and unbiased’ receive lower ratings when
considered against other attributes for TV news sources

9
Source: Ofcom PSB Tracker 2011, 2012.
Base: Self-reported regular viewers of BBC 1 (1604 in 2011; 1678 in 2012), BBC 2 (642 in 2011; 692 in 2012 ), ITV (1049 in 2011; 1117 in 2012),
Channel 4 (605 in 2011; 639 in 2012), Channel 5 (344 in 2011; 284 in 2012).
Q15B: Rating on the statement : “its news programmes are trustworthy”.
% rating (7/8/9/10) all regular viewers who watch each channel
62%
75% 70%
63% 57%
43%
64%
78% 72%
67% 61%
46%
0%
10%
20%
30%
40%
50%
60%
70%
80%
PSBs combined BBC 1 BBC 2 ITV Channel 4 Channel 5
2011
2012
Despite a decline in perception of impartiality, Ofcom
research shows that ratings for the delivery of trustworthy
news programmes have increased year on year
“Its news programmes are trustworthy”
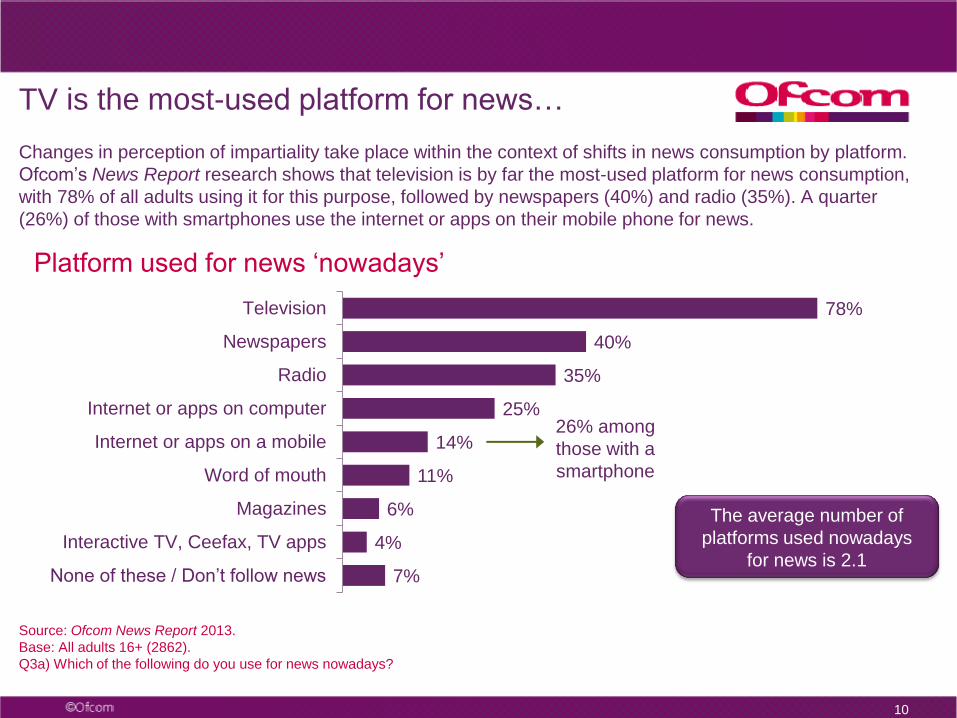
TV is the most-used platform for news…
10
7%
4%
6%
11%
14%
25%
35%
40%
78%
None of these / Don’t follow news
Interactive TV, Ceefax, TV apps
Magazines
Word of mouth
Internet or apps on a mobile
Internet or apps on computer
Radio
Newspapers
Television
Platform used for news ‘nowadays’
Changes in perception of impartiality take place within the context of shifts in news consumption by platform.
Ofcom’s News Report research shows that television is by far the most-used platform for news consumption,
with 78% of all adults using it for this purpose, followed by newspapers (40%) and radio (35%). A quarter
(26%) of those with smartphones use the internet or apps on their mobile phone for news.
26% among
those with a
smartphone
The average number of
platforms used nowadays
for news is 2.1
Source: Ofcom News Report 2013.
Base: All adults 16+ (2862).
Q3a) Which of the following do you use for news nowadays?

11
44%
25%
34%
58%
32%
35%
40%
78%
Internet (any device)
Radio
Newspapers
Television
All adults
16-24s
Source: Ofcom News Report 2013.
Base: All adults 16+ (2862).
Q3a) Which of the following do you use for news nowadays?
…but younger people are more likely to use the
internet for news

12
Ofcom’s Media Tracker research shows that perception of impartiality in television news, among all
adults, has declined significantly since 2010. Although the rate of decline was greatest between 2010 and
2011, it has continued and is present across TV as a whole, as well as among each of the five broadcasters
that respondents were asked about.
There does not appear to be one particular age or socio-economic group that is driving the decline.
Although the largest decline can be seen among 16-24s, the decrease is apparent across all age groups.
The declining perception of impartiality is not targeted at, or restricted to, any individual broadcaster.
The decrease is apparent across all five of the broadcasters that respondents were asked about.
Summary of findings

13
The rate of increase in the perception of bias among UK adults does not equate to the rate of decrease
in impartiality. Although ratings of bias have significantly increased since 2010 for TV as a whole and across
each of the broadcasters asked about individually, bias ratings remain small in proportion to impartial and
neutral ratings. The rate of increase in bias is less than both the increase for neutrality and the rate of
decrease for impartiality.
The proportion of all adults opting to answer ‘neutral’ when asked about their perceptions of news
impartiality has increased significantly since 2010. Although there has been a decline in neutrality ratings
among older age groups (45-54s, 55-64s and over-65s) year on year since 2012, overall neutrality ratings
have increased since 2010.This increase in respondents rating sources as neutral has been concurrent with
the decrease in respondents rating news sources as impartial.
Ofcom’s News Report research (2013) shows that impartiality and bias are rated lower by adults when
considered against other attributes of TV news sources. When respondents are asked to rate the
attributes of TV broadcasters’ news output, they award the highest ratings to importance and accuracy and
reliability. There is no apparent trend between ratings awarded by users for trust, accuracy and reliability and
for impartiality. This may reflect the different ways in which viewers perceive these attributes; for example,
although a source may not be seen to be particularly impartial, the viewer may perceive it to be trustworthy:
they can rely on that the source to deliver news from a particular point of view or to provide an opinion.
Summary of findings

14
According to Ofcom’s PSB Tracker research, adults still trust television news. Ratings for the
delivery of trustworthy news programmes by each PSB channel, captured by the PSB Tracker research,
have increased year on year. Although this does not reflect the decline in impartiality seen in the Media
Tracker research, it may demonstrate that adults' concept of trust is focused around trusting a given news
source to deliver a particular opinion to them, regardless of whether they consider that opinion to be
impartial or biased.
The decline in perception of impartiality, found across all TV broadcasters and among all age
groups, in Ofcom’s Media Tracker research raises questions as to what has driven this shift in
opinion, particularly since 2010. A potential cause of the decline could be that the emergence of online
news is changing traditional habits of news consumption. Slides 10 and 11 highlight that the internet is
increasingly becoming a major platform for news consumption. The internet provides a wider range of
opinion than television can deliver, and as a result perceptions of TV news may be affected. The internet
allows news and opinion to be distributed and consumed immediately, and internet-connected mobile
devices allow consumption of news ‘on-the-go’, so the way news is presented on television may seem
‘outdated’ to online news consumers.
Other potential factors include: adults becoming more media-literate and more aware of alternative news
sources available to them; individuals’ perceptions of impartiality and bias changing in relation to news
and opinion on other platforms; the content of broadcaster news programmes changing over time; or
events such as the Leveson Inquiry influencing people’s views of the media as a whole.
Summary of findings