attracting talent: location choices of foreign-born … · attracting talent: location choices of...
TRANSCRIPT
NBER WORKING PAPER SERIES
ATTRACTING TALENT:LOCATION CHOICES OF FOREIGN-BORN PHDS IN THE US
Jeffrey GroggerGordon H. Hanson
Working Paper 18780http://www.nber.org/papers/w18780
NATIONAL BUREAU OF ECONOMIC RESEARCH1050 Massachusetts Avenue
Cambridge, MA 02138February 2013
We thank the International Growth Centre for financial support and Sam Bazzi, Sieuwerd Gaastra,Chen Liu, and Wei You for excellent research assistance. The views expressed herein are those ofthe authors and do not necessarily reflect the views of the National Bureau of Economic Research.
NBER working papers are circulated for discussion and comment purposes. They have not been peer-reviewed or been subject to the review by the NBER Board of Directors that accompanies officialNBER publications.
© 2013 by Jeffrey Grogger and Gordon H. Hanson. All rights reserved. Short sections of text, notto exceed two paragraphs, may be quoted without explicit permission provided that full credit, including© notice, is given to the source.
Attracting Talent: Location Choices of Foreign-Born PhDs in the USJeffrey Grogger and Gordon H. HansonNBER Working Paper No. 18780February 2013JEL No. J24,J61
ABSTRACT
We use data from the NSF Survey of Earned Doctorates to examine the post-degree location choicesof foreign-born students receiving PhDs from US universities in science and engineering. Over theperiod 1960 to 2008, 77% of foreign-born S&E PhDs state that they plan to stay in the United States.The foreign students more likely to stay in the US are those with stronger academic ability, measuredin terms of parental educational attainment and the student’s success in obtaining graduate fellowships.Foreign students staying in the United States thus appear to be positively selected in terms of academicability. We also find that foreign students are more likely to stay in the United States if in recent yearsthe US economy has had strong GDP growth or the birth country of the foreign student has had weakGDP growth. Foreign students are less likely to remain in the US if they are from countries with higheraverage income levels or that have recently democratized. Education and innovation may thereforebe part of a virtuous cycle in which education enhances prospects for innovation in low-income countriesand innovation makes residing in these countries more attractive for scientists and engineers.
Jeffrey GroggerIrving B. Harris Professor of Urban PolicyHarris School of Public PolicyUniversity of Chicago1155 E. 60th StreetChicago, IL 60637and [email protected]
Gordon H. HansonIR/PS 0519University of California, San Diego9500 Gilman DriveLa Jolla, CA 92093-0519and [email protected]
1
I. Introduction
Scientists and engineers are the core of the high-skilled labor force in the United States.
They are key inputs in research and development (Kapur and McHale, 2005), patent at much
higher rates than other professionals (Hunt and Gauthier-Loiselle, 2010), and are relatively likely
to create high-technology companies (Zucker and Darby 2009).1 Recent theories of economic
growth suggest that expanding the science and engineering (S&E) talent pool would raise the
long-run growth rate of the US economy (Jones, 1995a,b).2
Foreign students comprise the most rapidly growing segment of the US S&E labor force.
Over the last several decades, the share of S&E PhDs granted by US universities going to the
foreign born rose sharply, from 23% in 1970 to 56% in 2007. Whether newly minted degree
holders choose to stay in the US after graduation or to return home largely determines how
quickly the US S&E labor force expands. Yet, we know relatively little about the factors
governing the location choices of these individuals. Existing work examines how the supply of
foreign graduate students affects research output by US universities (Stuen, Mobarak, and
Maskus, 2010) and the earnings and employment of US graduate students (Borjas, 2009; Lan,
2011). Other research considers how the inflow of scholars to the US following the collapse of the
Soviet Union altered the career trajectories of US academics (Borjas and Doran, 2012a,b).3 But
little work considers who stays in the US upon completion of a PhD.4
In this paper, we examine the post-degree location choices of foreign-born students 1 In other related work, Hunt (2011) finds that immigrants entering the United States on student or temporary works visas are more likely to produce patents than individuals entering the country on a green card (the majority of whom would likely have obtained a permanent visa through having relatives in the United States). 2 Hunt and Gauthier-Loiselle (2010) and Kerr and Lincoln (2011) find that US regions that attract more high-skilled immigrants produce larger numbers of S&E patents. 3 Related work includes Bound, Braga, and Golden (2012) who consider how inflows of highly skilled immigrants during technology booms affect the labor market for computer scientists in the United States. 4 One exception is Black and Stephen (2004) who also use the Survey of Earned Doctorates to examine the post-degree location choices of foreign-born PhD recipients. They find that having personal ties to the United States, having US work experience, or coming from a higher ranked program is correlated with the intent to stay.
2
receiving PhDs from US universities. We use data from the NSF Survey of Earned Doctorates
(SED), which contains information on the characteristics of all individuals receiving a PhD from a
US university from 1958 forward. Our data span the period 1960 to 2008. Crucially, the SED asks
individuals if they intend to stay in the United States in the year following degree completion.
Intent-to-stay rates reported in the SED closely track actual stay rates of foreign PhD graduates
derived from earnings reported to the Social Security Administration in the years following
degree completion (Finn 2010).
During the last half century, obtaining an advanced degree in science and engineering,
especially for individuals from lower-income countries, usually meant studying in the United
States (Freeman, 2009). In 1975, the share of science and engineering PhDs graduating from US
universities was 47% of the total among students from major Asian nations and advanced
European economies. This share fell to 25% in 2004, reflecting the internationalization of higher
education and post-9/11 restrictions on student visas (Bound, Turner, and Walsh, 2009). The
United States, however, remains a major destination for S&E training.
We analyze the link between foreign students’ intent to stay in the US and their observed
characteristics. Substantial literature finds evidence consistent with the positive selection of
migrants in terms of skill.5 We examine whether there is positive selection even among the very
highly educated.6 While we do not observe test scores for students, we do observe other correlates
of ability including parental education, whether a student receives fellowships or scholarships
during the course of study, and the rankings of a student’s PhD program and university. Along
most of these dimensions, students who appear to be more able are more likely to desire to stay in
5 See Rosenzweig (2006), Belot and Hatton (2008), Brücker and Defoort (2009), de Grip, Fouarge and Suaermann (2009), and Grogger and Hanson (2011). On the determinants of immigration in high-income countries, see Clark, Hatton, and Williamson (2007), Ortega and Peri (2009), and Mayda (2010). 6 In related work, Hunt (2012) examines the relative economic performance of native and foreign born computer and engineering workers.
3
the United States. This is suggestive evidence that the stayers among foreign PhD students are
positively selected in terms of ability.
We also analyze the link between foreign students’ intent to stay in the US and
macroeconomic conditions both in the US and in their home country. We find that, controlling
for time trends and for birth-country fixed effects, foreign-born students are more likely to desire
to stay in the United States, the higher is the recent rate of US GDP growth, the lower is the
recent rate of GDP growth in the birth country, and the higher is the level of development in the
birth country. Booms in the United States thus help keep foreign PhDs from departing, whereas
booms in the birth country work to draw students home. Relatedly, when a student’s birth country
becomes more democratic, as measured by increases in Polity IV scores that indicate a shift away
from authoritarianism (Marshall and Jaggers, 2002), the likelihood that a graduate returns home
increases. Political opening thus appears to induce the return of highly skilled labor from abroad.7
Our results mesh with recent literature that documents how economic conditions at the
time of labor-market entry affect long-run employment and earnings for high-skilled individuals.
Oyer (2008) finds that better stock-market conditions while MBA students are in graduate school
positively affect the likelihood of their finding employment in investment banking. Graduates
who initially take jobs on Wall Street tend to have higher long-run income. Similar findings hold
for economists (Oyer, 2006). The correlation between business cycles and PhD location choices
that we find suggests the possibility of a virtuous cycle for developing countries. Having a good
run of GDP growth may help a country lure home highly skilled individuals who have been
studying abroad. The return of these workers may enhance prospects for future economic growth,
which then may attract additional PhDs in later periods. Such self-reinforcing processes are
7 Spilimbergo (2009) suggests that there are also forces working in the opposite direction, from studying abroad to democratization, with past flows of students to the United States for undergraduate or graduate study being associated with future transitions to democracy in a country.
4
similar to the mechanisms underlying theories of economic development featuring poverty traps
and their cessation (Azariadis and Stachurski, 2005).8
In section II, we describe the data used for the project and discuss broad trends regarding
the location choices of foreign PhD students educated in the United States. In section III, we
present our empirical specification and results on the intent to stay in the US. In section IV, we
use our empirical results to decompose variation in stay rates for PhDs for the four largest source
countries. And in section V, we offer concluding remarks.
II. Data and Empirical Setting
The Survey of Earned Doctorates covers all individuals receiving a PhD from an
accredited US institution from 1958 forward. We have data through 2008, which include 1.6
million observations. From this sample, we drop individuals who were born in the United States
or in US territories (N=1.1 million); obtained degrees before 1960, years for which we lack
national economic data (N=2,000); obtained PhDs from non-research universities (N=9,000); are
missing data on place of birth (N=56,000); or are missing data on post-graduation plans
(N=6,000). We further drop individuals 45 years of age or older at time of degree (N=28,000),
which consists primarily of those who complete their PhDs over multiple decades and who may
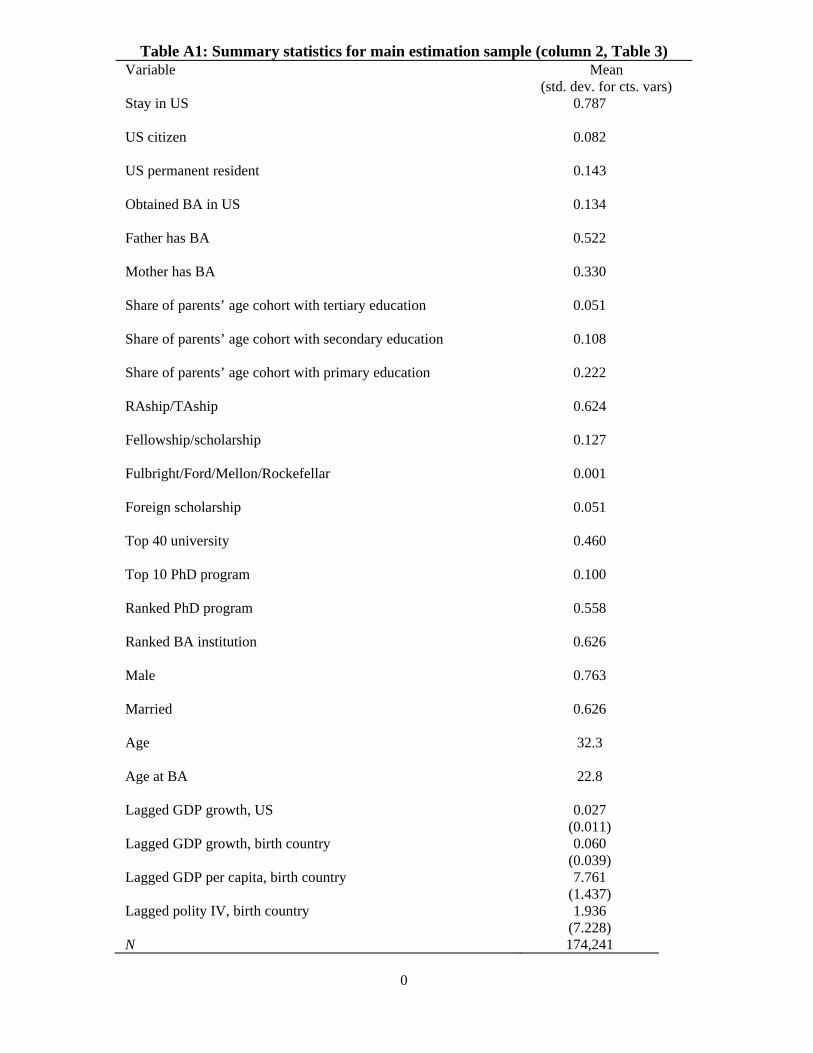
not be comparable to the full-time students that constitute the bulk of the sample. Table A1 gives
summary statistics on the SED and other data used in the empirical estimation.
We focus the analysis on graduates in science and engineering fields, though in some
regressions we also consider students in other fields of study. S&E fields are those most closely
8 Blanchard, Bound, and Turner (2009) identify a related mechanism in which flows of students to the United States for PhD training ultimately improve the quality of higher education in source countries (as students return home), enhancing the local production of human capital.
5
linked to innovation. Using data from the 2003 US National Survey of College Graduates, Hunter
and Gauthier-Loiselle (2010) find that foreign-born scientists and engineers are substantially more
likely than other college graduates or post-graduates to have produced a patent and more likely
still to have produced a patent that has been commercialized. S&E fields include life sciences
(agricultural, biological, and health sciences), physical sciences (atmospheric, earth, and ocean
sciences; chemistry; mathematics and computer science; and physics), and engineering. The non-
S&E fields we consider are economics and management, education, humanities and law, and
social sciences other than economics.
II.A. Rising Presence of the Foreign Born among US PhD Recipients
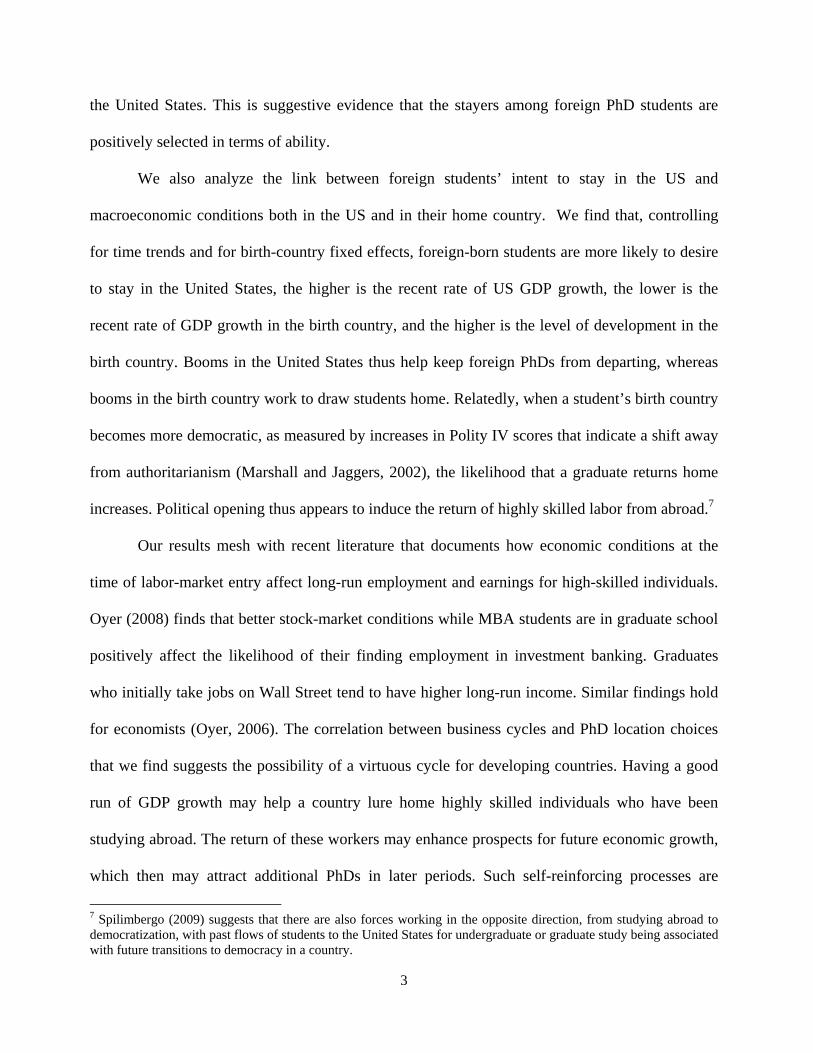
The rising presence of foreign students among new US PhD degree recipients has brought
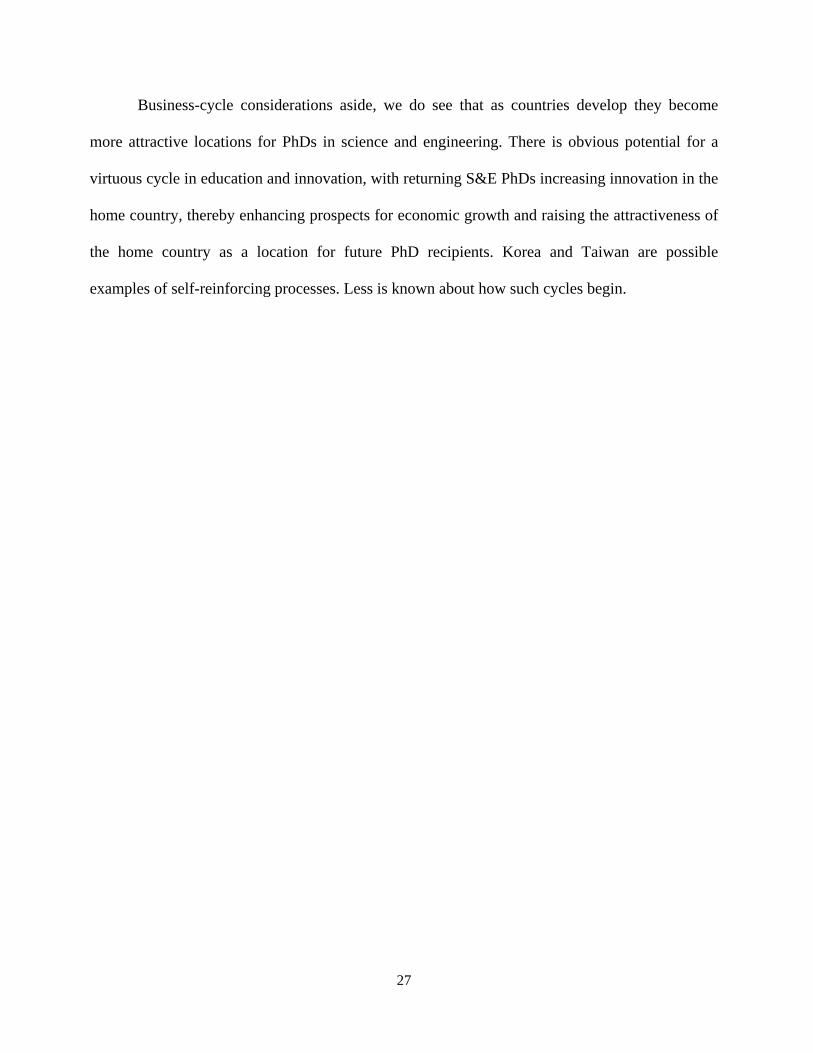
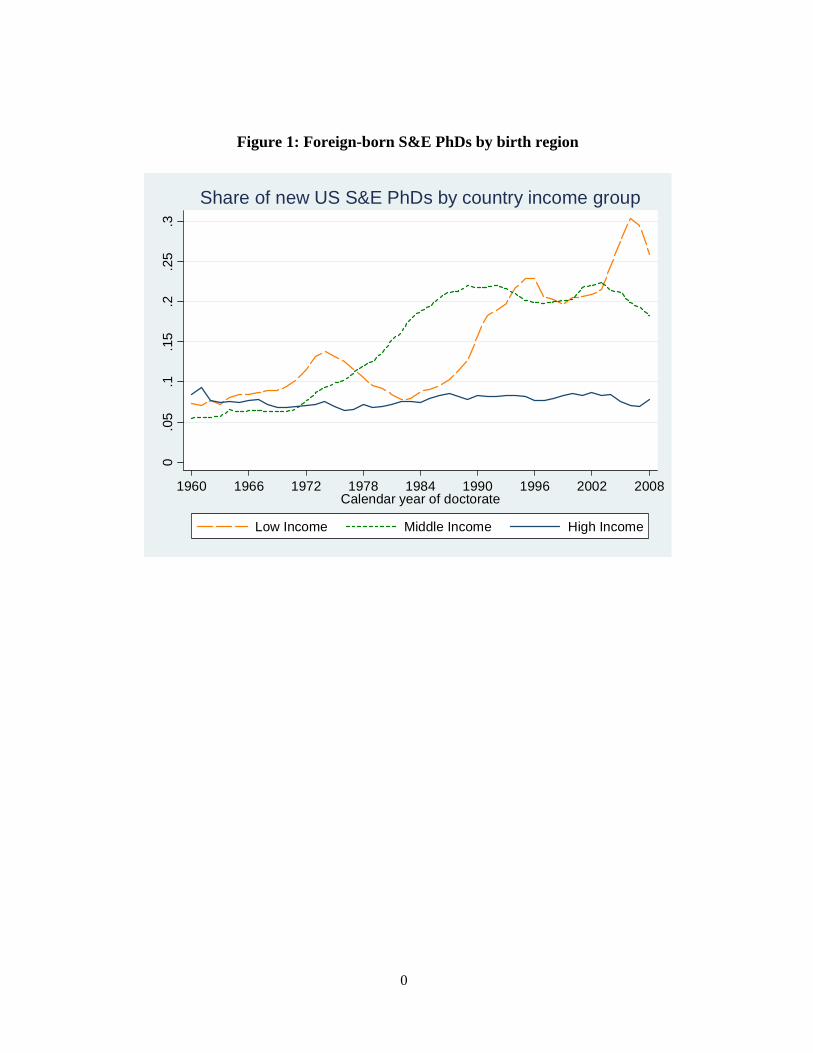
with it a change in the composition of the birth countries represented by these students. Figure 1
shows the share of the foreign born among all new PhDs from US universities with the birth
countries of these students grouped by low, middle, or high-income status.9 In the 1960s, the three
income groups each accounted for roughly equal shares of new US PhDs. Over time, the share of
PhDs from high-income countries has been flat, due in part perhaps to the strengthening of
graduate education in Australia, Canada, Europe, and Japan (Freeman, 2009). Essentially all of
the growth in foreign-born PhDs has come from low and middle-income nations. Student flows
from middle-income countries expanded first, rising from 6% of new US PhDs in the late 1960s
to 22% by the late 1980s, before stabilizing. Low-income countries expanded next, with their
share of new US PhDs rising from 8% in the early 1980s to over 25% in the early 2000s.
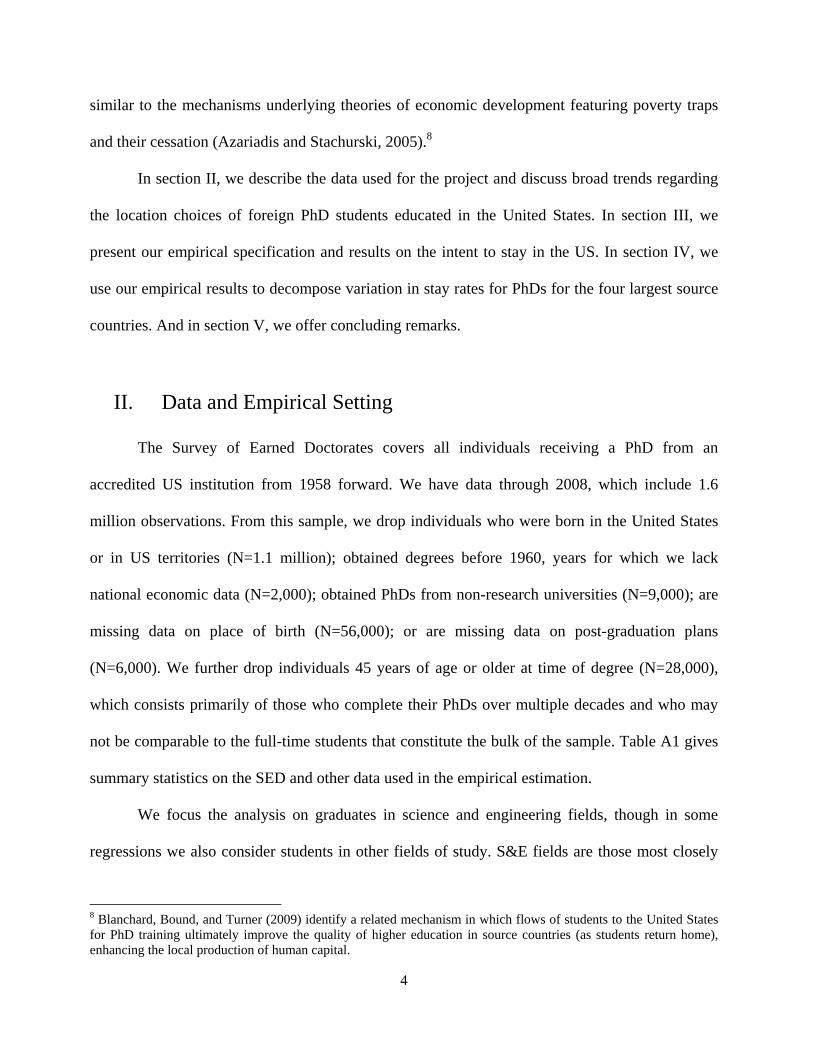
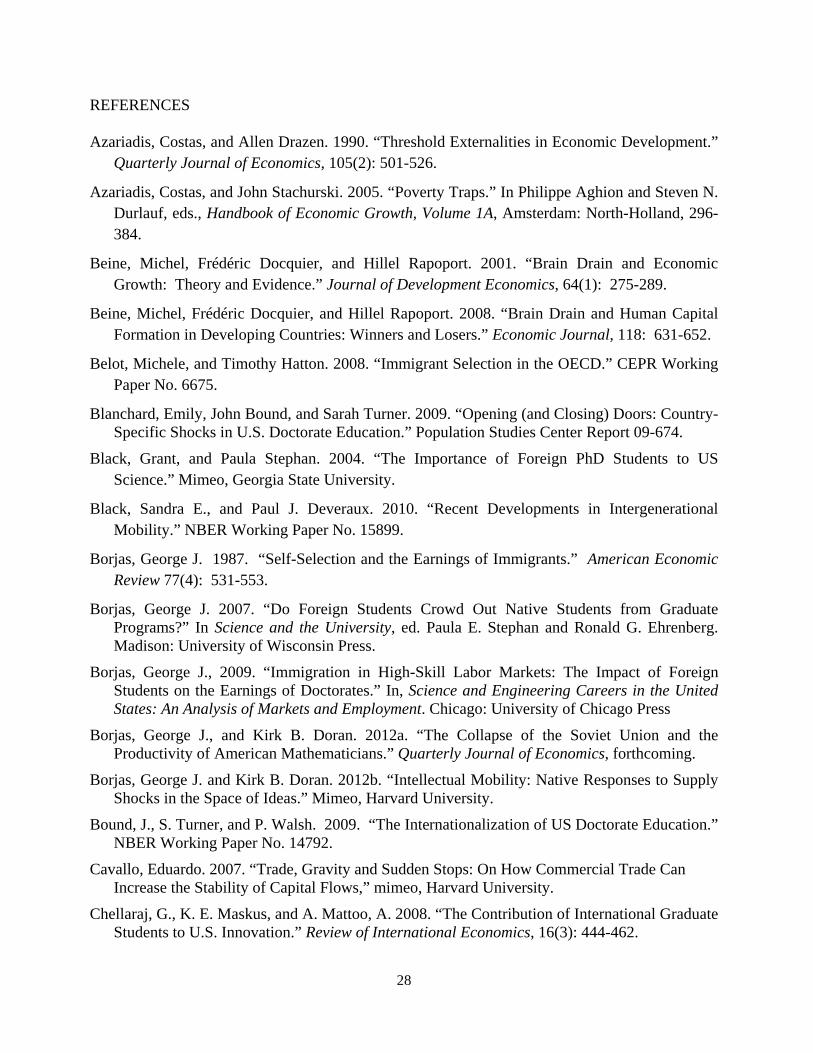
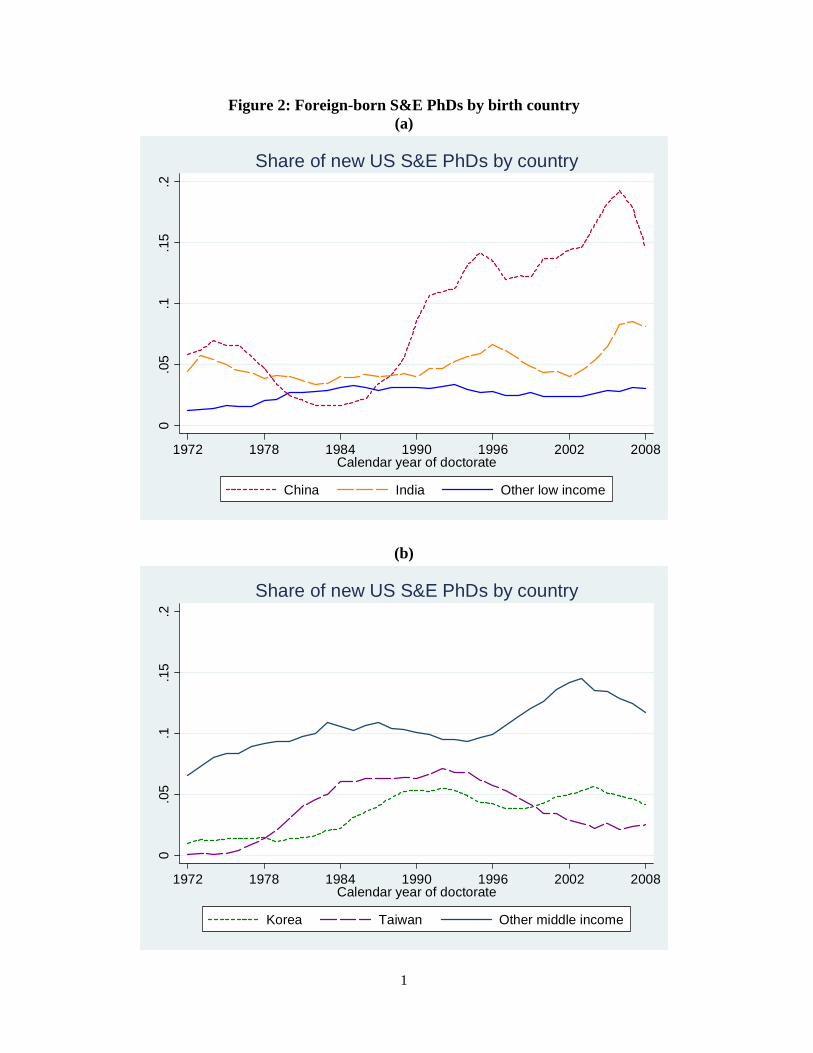
Among low-income countries, China and India are by far the largest sources of PhD
9 The definitions of income groups are per capita GDP of less than $800 for low-income countries, between $800 and $8,000 for middle-income countries, and above $8,000 for high-income countries. Income values are averages for the period 1985-1994. Our income classification closely mirrors that for the World Bank over the same period.
6
students to US universities, as seen in Figure 2a. Over the period, they account for an average of
84% of students from low-income nations completing US science or engineering PhDs.10 Among
middle-income countries, shown in Figure 2b, Korea and Taiwan are the largest source countries,
accounting for an average of 42% of PhD recipients from this income group. The next largest
middle-income source countries for S&E PhDs are Russia, Iran, and Turkey.
China and India are large source countries for PhD students in part because they have
large populations. Additionally, students from these two countries exhibit relatively high
propensities to pursue PhD education in the United States. A crude measure of this propensity is
the number of new US S&E PhDs (a flow) divided by the birth country’s population (a stock).
New US S&E PhDs per capita reached a peak late in the sample period of 3.0 per 10,000
inhabitants in China and 1.7 per 10,000 inhabitants in India but remained at only 0.6 per 10,000
inhabitants in other low-income countries. Korea and especially Taiwan stand out for having very
high propensities to pursue US PhD training. Over the period, new US S&E PhDs averaged 13.0
per 10,000 inhabitants in Korea and an astounding 30.0 per 10,000 inhabitants in Taiwan, nearly
as high as the 34.0 per 10,000 inhabitants for the United States. Thus in the 1990s, individuals
born in Taiwan were nearly as likely to complete a science and engineering PhD in the United
States as were US-born individuals. For comparison, new US S&E PhDs per 10,000 inhabitants
averaged 1.5 for other middle-income countries and 2.0 in non-US high-income countries (many
students from which may pursue advanced training closer to home).
II.B Post-Degree Location Decisions for Foreign PhD Recipients
The SED asks PhD recipients about their post-graduation plans. For our analysis, the
10 In Figure 2a, the shares for China may be inflated in the early 1970s (and in Figure 2b the shares for Taiwan may be deflated) owing to the fact that during this period some individuals born in China and who obtained US PhDs may have been citizens of Taiwan, having moved from mainland China to Taiwan in 1949 or shortly thereafter.
7
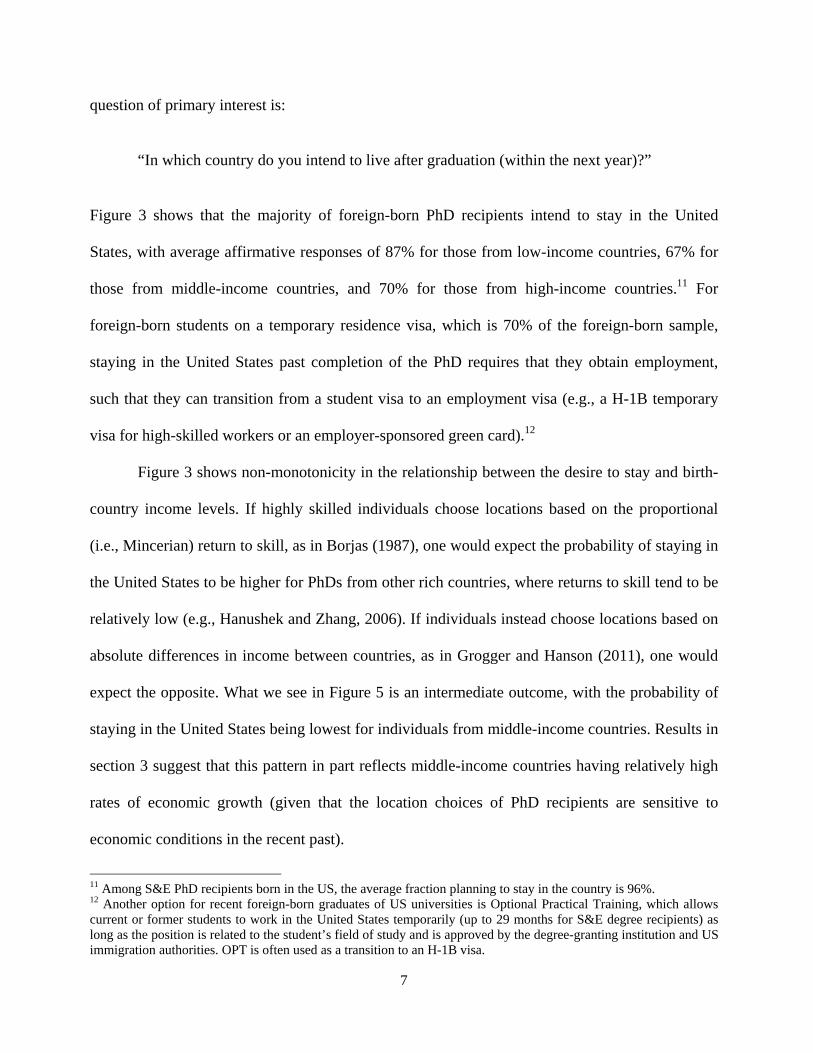
question of primary interest is:
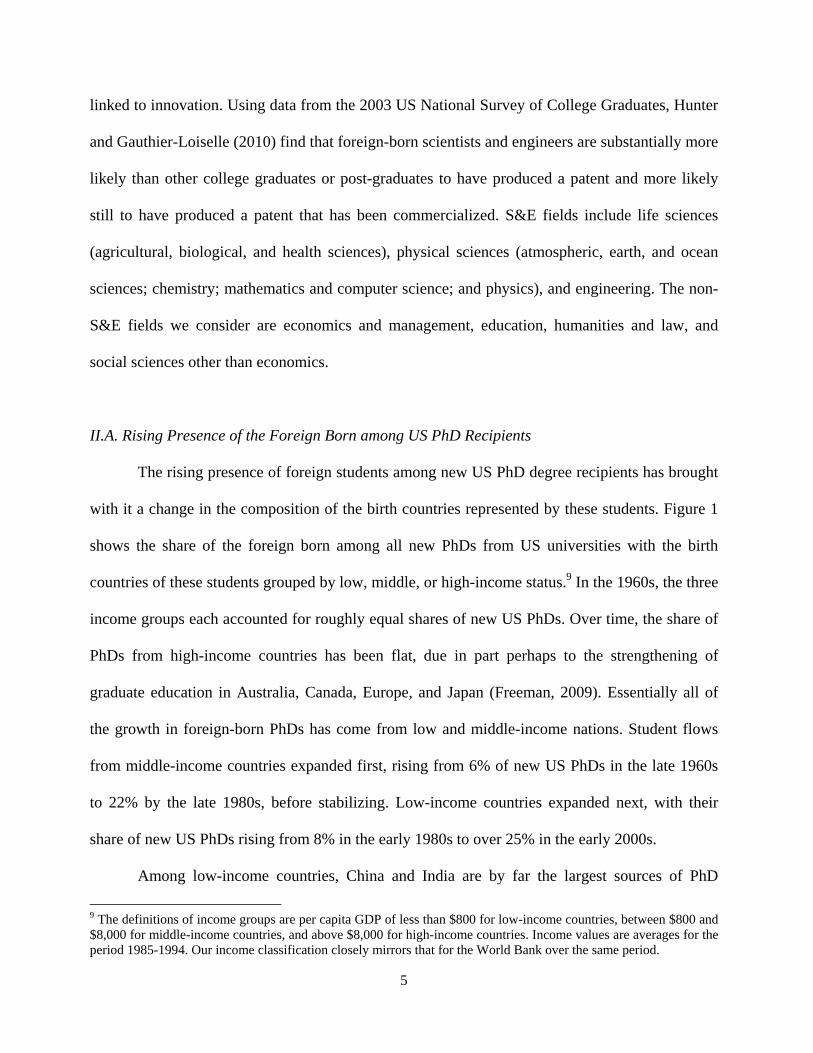
“In which country do you intend to live after graduation (within the next year)?”
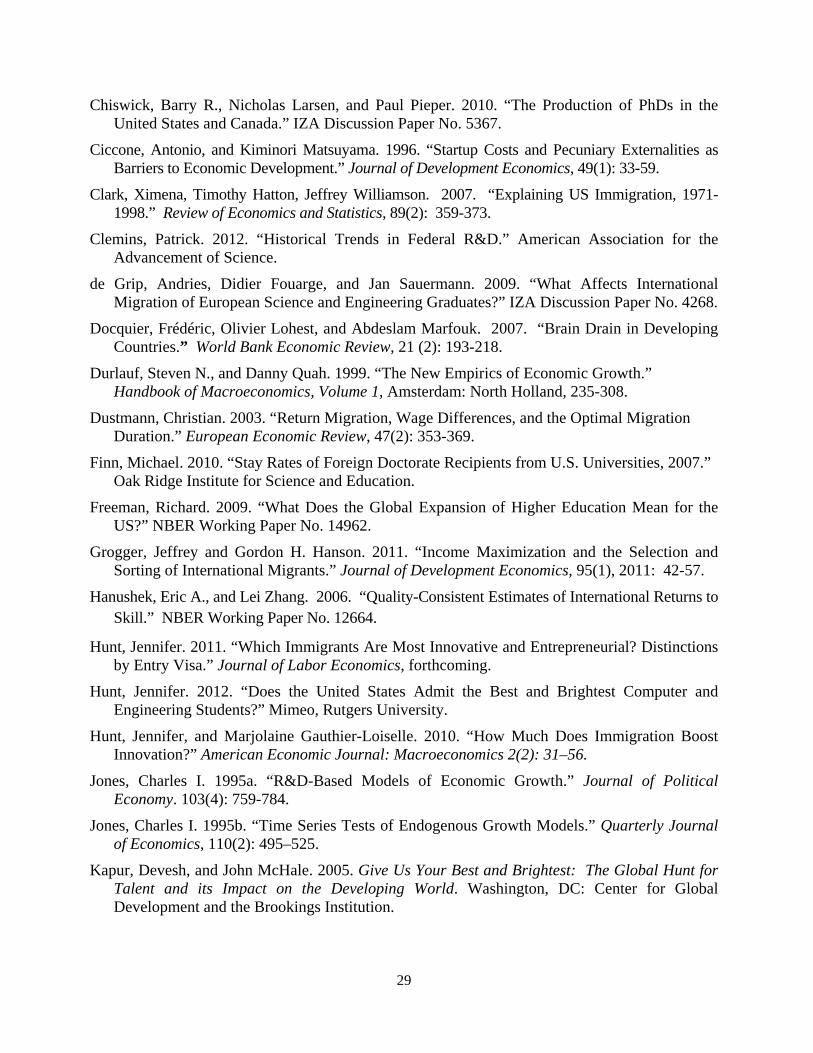
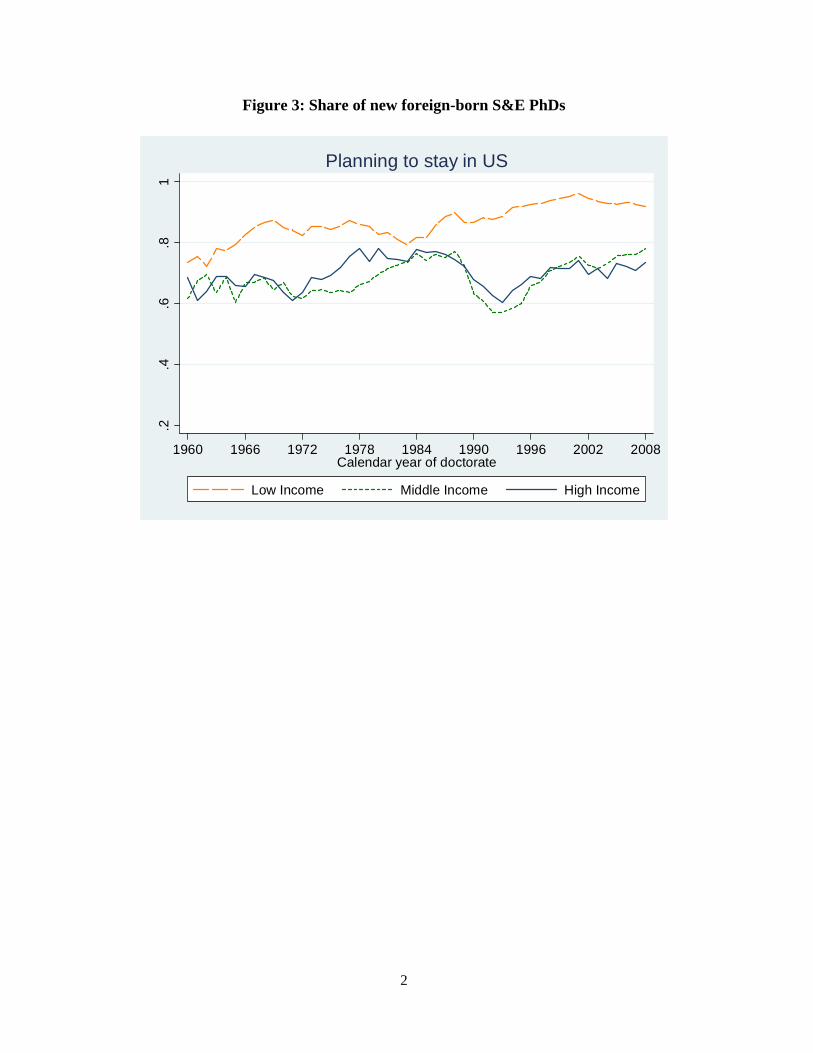
Figure 3 shows that the majority of foreign-born PhD recipients intend to stay in the United
States, with average affirmative responses of 87% for those from low-income countries, 67% for
those from middle-income countries, and 70% for those from high-income countries.11 For
foreign-born students on a temporary residence visa, which is 70% of the foreign-born sample,
staying in the United States past completion of the PhD requires that they obtain employment,
such that they can transition from a student visa to an employment visa (e.g., a H-1B temporary
visa for high-skilled workers or an employer-sponsored green card).12
Figure 3 shows non-monotonicity in the relationship between the desire to stay and birth-
country income levels. If highly skilled individuals choose locations based on the proportional
(i.e., Mincerian) return to skill, as in Borjas (1987), one would expect the probability of staying in
the United States to be higher for PhDs from other rich countries, where returns to skill tend to be
relatively low (e.g., Hanushek and Zhang, 2006). If individuals instead choose locations based on
absolute differences in income between countries, as in Grogger and Hanson (2011), one would
expect the opposite. What we see in Figure 5 is an intermediate outcome, with the probability of
staying in the United States being lowest for individuals from middle-income countries. Results in
section 3 suggest that this pattern in part reflects middle-income countries having relatively high
rates of economic growth (given that the location choices of PhD recipients are sensitive to
economic conditions in the recent past).
11 Among S&E PhD recipients born in the US, the average fraction planning to stay in the country is 96%. 12 Another option for recent foreign-born graduates of US universities is Optional Practical Training, which allows current or former students to work in the United States temporarily (up to 29 months for S&E degree recipients) as long as the position is related to the student’s field of study and is approved by the degree-granting institution and US immigration authorities. OPT is often used as a transition to an H-1B visa.
8
How do we know whether individuals intending to stay in the United States actually end
up doing so? One indication is that at the time of graduation a substantial fraction of new PhDs
have already secured employment. Among foreign-born S&E PhDs at graduation, 53% had
“signed a contract or made a definite commitment for postdoc or other work”, 17% were
continuing in their pre-doctoral employment, and 11% were “negotiating with one or more
specific organizations.” Only 17% were “seeking employment but have no specific prospects.”
Thus, over 80 percent of the individuals intending to stay in the United States either already had a
job or were in the advanced stages of landing a job.
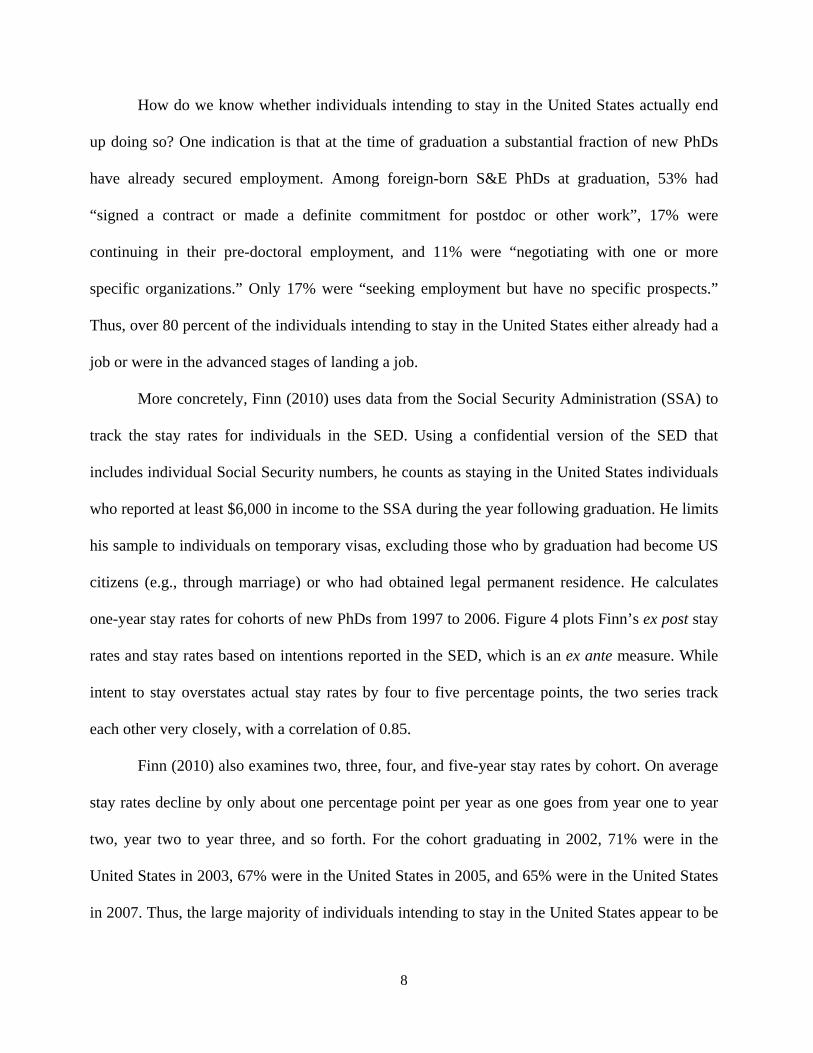
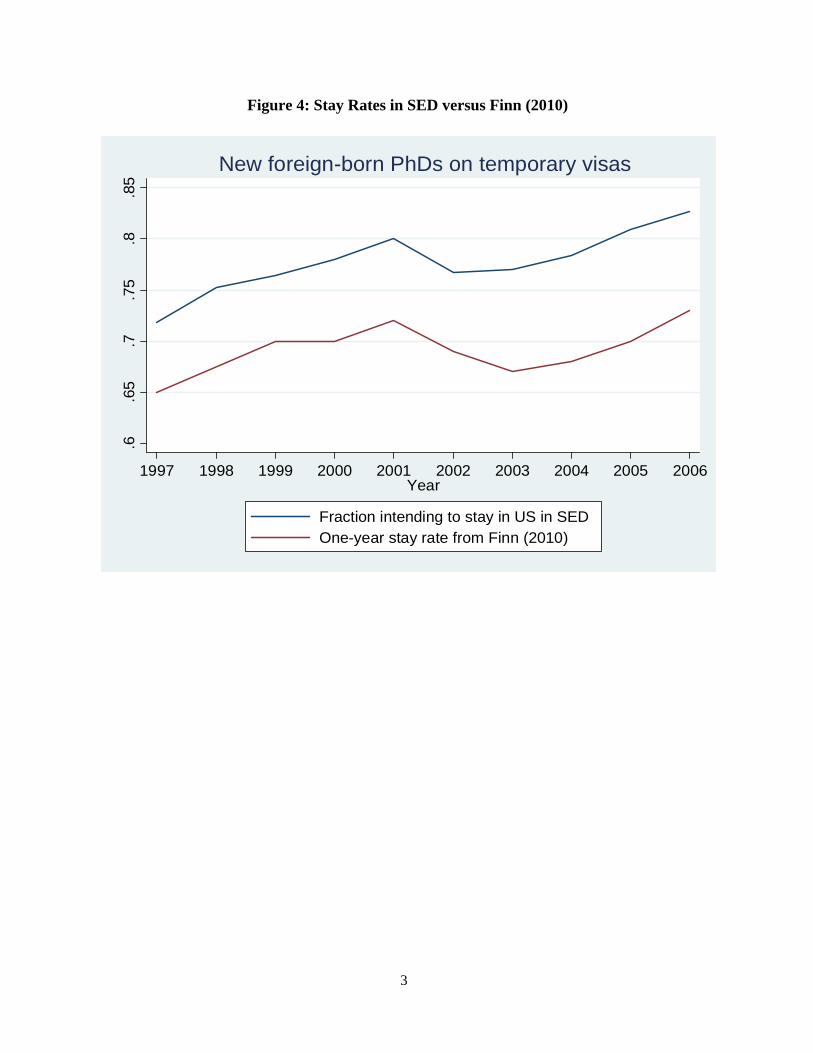
More concretely, Finn (2010) uses data from the Social Security Administration (SSA) to
track the stay rates for individuals in the SED. Using a confidential version of the SED that
includes individual Social Security numbers, he counts as staying in the United States individuals
who reported at least $6,000 in income to the SSA during the year following graduation. He limits
his sample to individuals on temporary visas, excluding those who by graduation had become US
citizens (e.g., through marriage) or who had obtained legal permanent residence. He calculates
one-year stay rates for cohorts of new PhDs from 1997 to 2006. Figure 4 plots Finn’s ex post stay
rates and stay rates based on intentions reported in the SED, which is an ex ante measure. While
intent to stay overstates actual stay rates by four to five percentage points, the two series track
each other very closely, with a correlation of 0.85.
Finn (2010) also examines two, three, four, and five-year stay rates by cohort. On average
stay rates decline by only about one percentage point per year as one goes from year one to year
two, year two to year three, and so forth. For the cohort graduating in 2002, 71% were in the
United States in 2003, 67% were in the United States in 2005, and 65% were in the United States
in 2007. Thus, the large majority of individuals intending to stay in the United States appear to be
9
in the country in the years following graduation, with most of these individuals remaining in the
United States for at least five years. For the 2005 cohort of new PhDs, two-year stay rates were
highest among S&E graduates, especially in computer and electrical engineering (77%), computer
science (75%), physical and life sciences (75%), and mathematics (73%).
Finally, part of the motivation for a recent PhD graduate to stay in the United States after
obtaining his degree may be to obtain a post-doctoral fellowship, which in many fields serves as
an apprenticeship necessary for graduates to succeed in launching independent careers. One might
wonder whether intending to stay in the US is synonymous with seeking a postdoc. The SED
includes a question about whether graduates intend to take a postdoc, but only for years 2003 and
later. Among all foreign-born S&E graduates, 53% intend to take a postdoc (compared to 51% of
US-born graduates). Among just those foreign-born S&E PhDs planning to stay in the United
States, 55% intend to take a postdoc. These patterns suggest that the choice to stay in the United
States is not dictated by a student’s desire for a postdoctoral fellowship.
II.C Location Decisions and Individual Characteristics
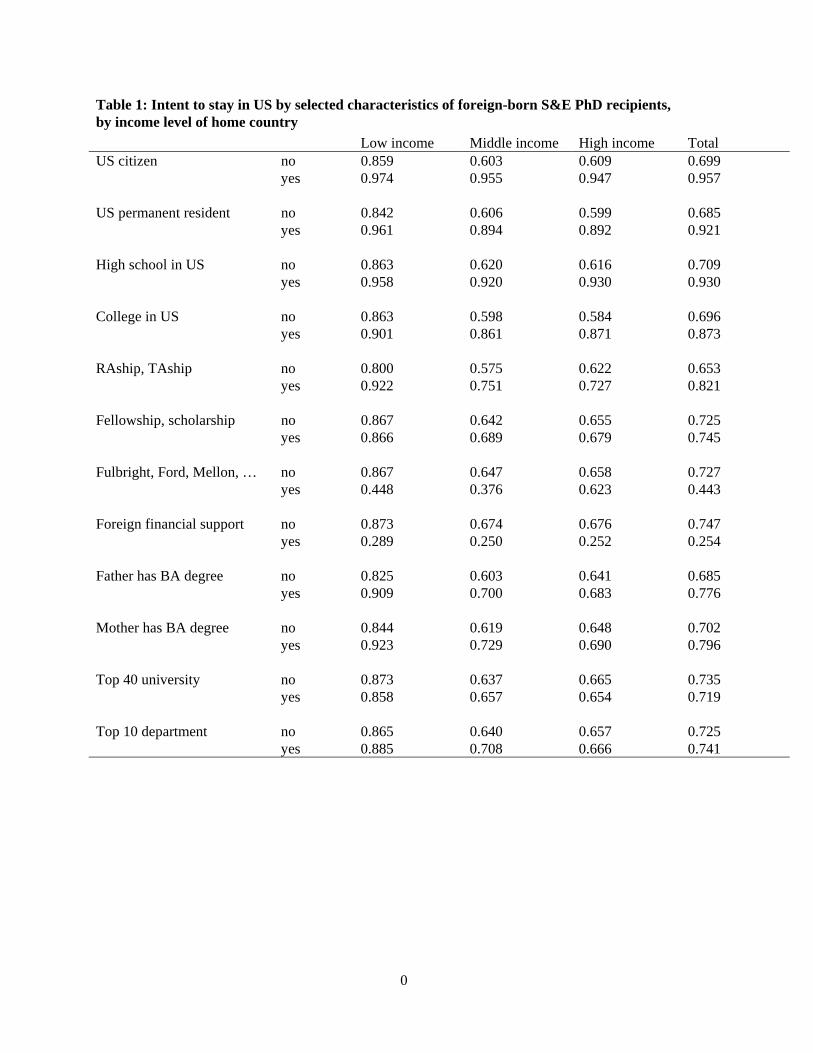
Table 1 shows the fraction of S&E PhD recipients intending to stay in the US broken
down by individual characteristics. One important factor affecting student intent to stay in the
United States is visa status (Black and Stephan, 2004). The SED reports whether foreign-born
students are naturalized US citizens, have a legal permanent residence visa, or have a temporary
residence visa (e.g., a student visa). Being a citizen or having a green card guarantees that a
graduate can work in the United States. There are two primary channels through which
individuals obtain green cards: being sponsored by a family member who is a citizen or legal
10
permanent resident or being sponsored by a US employer.13 Having a green card (or already being
a citizen) therefore indicates the strength of the graduate’s ties to the US, either through family
linkages or through connections to a US company. Obtaining a green card often takes six or more
years (and becoming a citizen an additional five years), meaning that these connections must have
been established well before the date at which we observe the student completing the PhD degree.
In Table 1, the likelihood that a foreign-born graduate intends to stay in the US is much higher for
those who are citizens or who are legal permanent residents. The likelihood is also higher for
those who attended high school or completed their BA in the United States (a result that holds
whether or not we restrict foreign-born students to those on temporary visas).
We have three measures of the academic ability of the PhD recipient: her success in
obtaining graduate fellowships or scholarships, the quality of her university and of the academic
department awarding her PhD degree, and the education level of her parents. The first two
measures indicate the ability of the student as perceived at the time she begins graduate school
(when most graduate funding decisions are made). The third is an indication of the student’s
family background (an interpretation that depends on conditioning on average educational levels
in the birth country, which we do in the regression analysis by virtue of controlling for average
education in the birth cohort of the student’s parents).
Over the sample period, the primary sources of financial support for students are
university research assistantships or teaching assistantships (52%), US fellowships or scholarships
(11% of students), foreign fellowships or scholarships (4%), family support or own funds (11%),
and other or unnamed sources of support (19%). In Table 1, individuals with fellowships,
scholarships, RAships, or TAships are more likely to intend to stay in the United States. The
13 Smaller numbers of green cards are available to refugees, which over the sample period would apply primarily to individuals from Cuba, Cambodia, Laos, or Vietnam, and via a lottery.
11
exceptions are individuals on foreign fellowships or scholarships or fellowships from the Ford
Foundation, the Fulbright Program, the Mellon Foundation, or the Rockefeller Foundation, each
of which imposes restrictions that are meant to compel the graduate to return to the home country
after completing the PhD. We interpret the positive correlation between university financial
support and intent to stay in the US as an indication that students with higher academic ability are
less likely to desire to return home after their studies.
A large literature documents intergenerational persistence in schooling, earnings, and
other economic outcomes (e.g., Solon, 1999; Black and Devereux, 2010). Intergenerational
persistence in schooling may reflect better educated parents raising their children to value
education, passing along genes that are associated with academic success, or being better able to
provide financially for the higher education of their children. PhD recipients whose mother or
father has a BA degree are more likely to intend to stay in the United States. These correlations
provide further evidence of positive selection of stayers in terms of potential academic
performance. Regarding department quality, Table 1 shows that individuals graduating from
higher ranked departments are modestly more likely to desire to stay in the US.
II.D Location Decisions and Macroeconomic Conditions
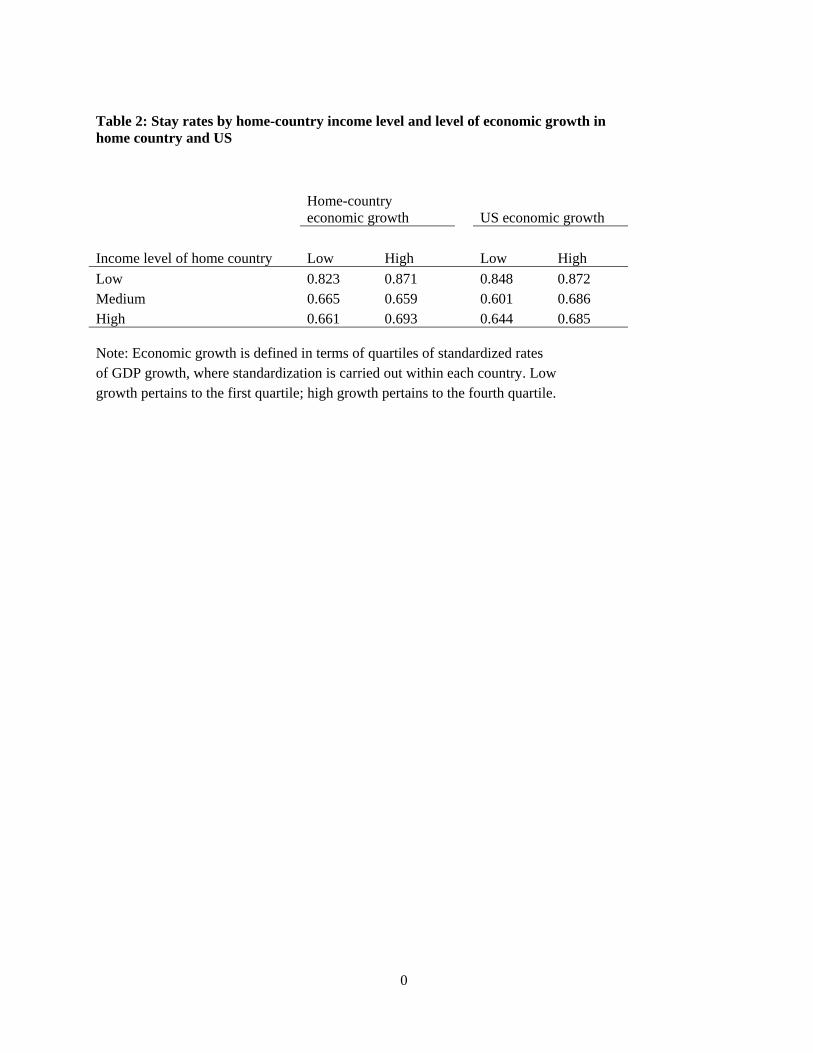
Table 2 provides a look at the relationship between intent-to-stay rates, the income level of
the PhD recipient’s home country, and the state of the business cycle both at home and in the US.
We again divide countries according to low, middle, or high-income status (see note 9). For each
country in the SED, we classified each year in our sample period as falling into a period of low,
medium, or high growth. Economic growth is defined in terms of GDP growth over the three
years prior to graduation, which we term lagged GDP growth. Within each country, we then
12
standardized lagged GDP growth by the within-country standard deviation of lagged GDP
growth. This was done to deal with the substantial heterogeneity across countries in GDP growth
volatility. Finally, we classify all years into low, medium, or high-growth periods depending on
whether the standardized growth rate is below the 25th percentile of the standardized growth
distribution, between the 25th and 75th percentiles, or above the 75th percentile. To account for the
state of the US business cycle, we simply classify years according to quartiles of the lagged US
GDP growth rate distribution.14 Table 2 reports stay rates for low-and high-growth periods; stay
rates during medium-growth periods generally fell between the two.
Looking down the columns of Table 2 expands on the lesson from Figure 2: the stay rate
for low-income countries not only exceeds the stay rate for middle and high-income counties, but
does so largely independent of the state of economic growth either in the home country or the US.
Comparing the first and second columns, we see that stay rates tend to be higher when home-
country growth is higher. The exception is middle-income countries, but for the most part, this is
the opposite relationship from what we would expect. The expected relationship shows up quite
strongly when we compare the third and fourth columns. This shows that, regardless of income
level, S&E PhD graduates are more likely to stay in the US when US GDP growth is high. The
relationship is particularly strong for PhD recipients from middle-income countries, who are
almost 15 percent (e.g., 8.5 percentage points) more likely to stay in the US during periods of
strong economic growth than during periods of weak economic growth.
14 In work not reported here, we experimented with these definitions. We defined lagged GDP growth in terms of a five-year average; we used unstandardized growth rates to define high and low growth, and we defined high and low growth in terms of peaks and troughs of the business cycle rather than in terms of the distribution of lagged GDP growth. All of these alternatives generated results similar to those that we report here, both in Table 2 and in the regression analysis below.
13
III. Results
In the empirical analysis, we estimate a linear probability model of the intent to stay in the
United States for science and engineering PhD recipients born outside of the US. We pool
observations across time and include as regressors measures of the student’s ties to the US
(whether a naturalized citizen, whether has a green card, whether received BA from a US
college), the student’s academic ability (whether father has a BA, whether mother has a BA,
whether student received graduate fellowships or scholarships), the quality of the student’s
graduate degree program (whether university was ranked in 2003 among the top 40 US
universities, whether PhD program was ranked in 1995 by the National Research Council among
the top 10 US programs in the field), recent economic conditions (average growth in log per
capita GDP in the US and in the birth country over the previous three-year period, average log per
capita GDP in the birth country over the previous three-year period), political conditions in the
birth country (average Polity IV score in the previous three-year period), demographic controls
for the student (gender, marital status, quadratic in current age, quadratic in age at completion of
BA degree), average education of the parents’ birth cohort for the student (fraction of adults in the
student’s birth country approximately 25 years older than the student completing primary,
secondary, or tertiary education), a time trend, dummies for the PhD degree field, and dummies
for the birth country. Standard errors are clustered by the country of birth of the graduate.
III.A Intent to Stay in the United States
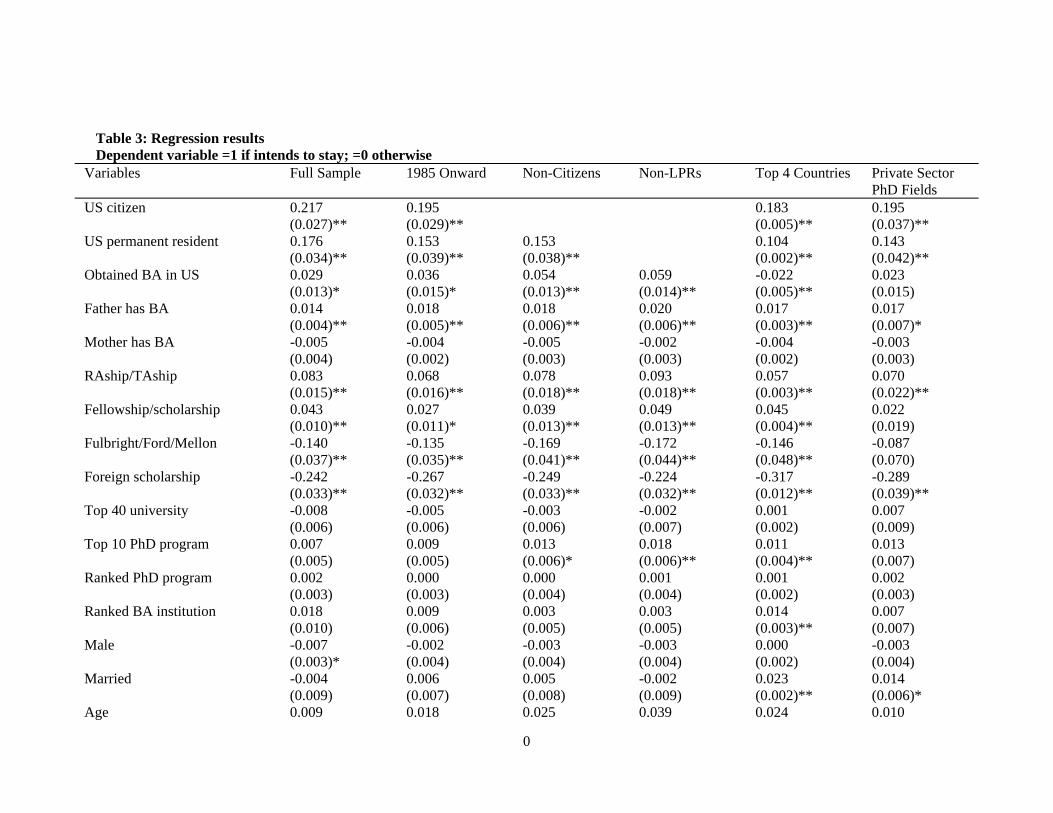
Table 3 presents the baseline regression results. The first column includes the full sample;
the second column restricts the sample to the period after 1984, by which time the post-Mao
relaxation of emigration controls in China began to result in significant numbers of Chinese
14
students completing PhDs in the United States. The third and fourth columns exclude naturalized
citizens or naturalized citizens and legal permanent residents (whose relatively strong ties to the
United States may affect the post-degree location choice); the fifth column limits the sample to
the top four source countries (China, India, Korea, Taiwan); and the sixth column, which we
discuss later, limits the sample to PhD fields that send a relatively high fraction of graduates to
work in the private sector (rather than to academics or to government). Results for the first five
columns are substantially the same, suggesting that coefficient estimates are stable across time,
across birth countries, and for individuals with varying immigration status. Considering the
importance of recent migration from China, we focus our discussion on the post-1984 results in
column (2).
We see that intent to stay in the US is positively associated with being a US citizen,
having a green card, or having received a BA from a US university. Each of these variables is an
indicator of the strength of the graduate’s ties to the United States (Black and Stephan, 2004). Not
surprisingly, intent to stay is more likely among those with stronger US connections, be they
family or professional, which facilitate finding a job and obtaining a visa. In column (2), being a
US citizen is associated with 19.5 percentage point higher stay rate, having a green card is
associated with an 15.3 percentage point higher stay rate, and having graduated from a US college
is associated with a 3.6 percentage point higher stay rate.
Intent to stay is more likely for a graduate whose father has a BA but is uncorrelated with
whether the graduate’s mother has a BA.15 In many lower-income countries, educational
attainment of women lags well behind that of men, especially in earlier decades of the 20th
century when the parents of most of the students in the SED sample would have completed their
schooling. In the SED sample, 52% of students have a father with a BA, compared to only 33% 15 The correlation between father having a BA and mother having a BA is 0.55.
15
who have a mother that has graduated from college (see Table A1). The father’s education may
therefore be a stronger indicator of the student’s inherited ability, wealth, professional
connections, or other attributes that affect educational outcomes. Because we control for average
education in the parents’ birth cohort, the effect of the father’s educational attainment is relative
to the average in the student’s origin country. Having a father who has completed college is
associated with a 1.8 percentage point higher desired stay rate.
Additional measures of individual ability include the student’s success in obtaining
graduate fellowships or scholarships. Intent to stay is more likely among students whose primary
funding for their doctoral education was a university research assistantship, a university teaching
assistantship, a university fellowship, or a scholarship. Having a RAship or TAship is associated
with a 6.8 percentage point higher stay rate and having a fellowship or scholarship is associated
with a 2.7 percentage point higher stay rate. The primary funding alternative to fellowships or
scholarships is own funding or family support. Students who succeed in obtaining financial
support from the university or other US sources are thus more likely to intend to stay in the US
than students on restricted funding or family funding.
Not surprisingly, intent to stay is less likely among students receiving their primary
financial support from a foreign government or other foreign institution or from US donors whose
support tends to be conditional on students returning to their home countries after completing the
PhD.16 Students with foreign funding are 26.7 percentage points less likely to desire to stay in the
United States and students with restrictive support from a US donor (Ford, Fulbright, Mellon, or
Rockefeller) are 13.5 percentage points less likely to desire to stay.
A further indication of student ability is the quality of the student’s PhD program.
16 The latter category includes the Fulbright Program, the Ford Foundation, the Rockefeller Foundation, and the Mellon Foundation.
16
Students from higher ranked PhD programs are more likely to desire to stay in the United States,
though the correlation is not always precisely estimated. Students graduating from programs
ranked in the top 10 in their field (in terms of faculty quality) are 0.9 percentage points more
likely to intend to stay in the United States. After controlling for the quality of the PhD program,
there is essentially zero correlation between the intent to stay and the overall ranking of a
student’s PhD-granting university. There is, however, a positive correlation between intent to stay
and the quality of a student’s undergraduate college. Students obtaining a BA from an institution
that is ranked in the top 400 worldwide are 0.3 to 1.8 percentage points more likely to stay,
though this effect is precisely estimated in only one regression.
The imprecision of the results for department and university rankings may be due in part
to measurement error. We lack time varying measures of program or university quality. For PhD
programs, we use National Research Council rankings from 1995 (and obtain similar results for
NRC rankings from 2005); for overall university rankings, we use the Academic Rankings of
World Universities from 2003. These are the earliest years for which we can obtain
comprehensive rankings on departments and universities.17 We miss any changes in the quality of
academic departments and universities over time, which may be especially important for
disciplines that are relatively young (e.g., neuroscience, computer engineering). Our results thus
may understate the association between program quality and intent to stay.
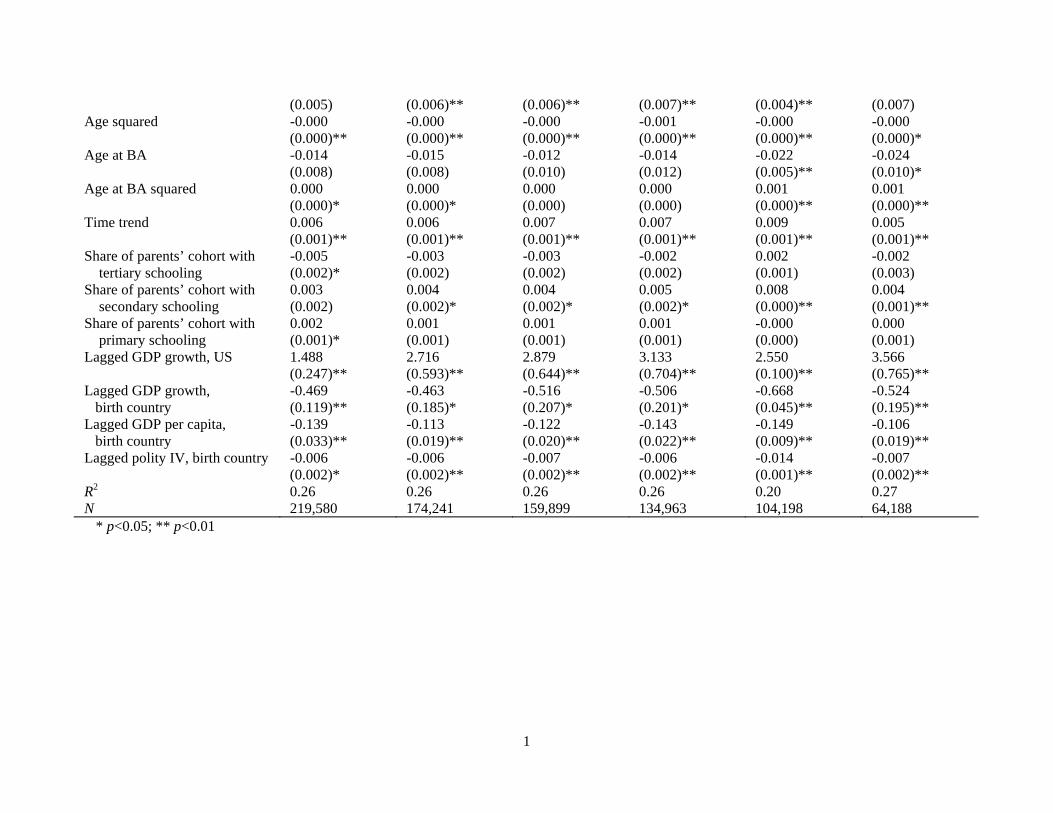
Turning to economic conditions, intent to stay in the United States is weaker in years
following higher per capita GDP growth in the birth country and stronger in years following
higher per capita GDP growth in the US. These findings suggest that recent business-cycle
conditions affect PhD recipient location choices, with students favoring the country with the
stronger recent growth record. In the regressions in Table 3, we use growth rates averaged over 17 See www.arwu.org and http://sites.nationalacademies.org/PGA/Resdoc/index.htm.
17
the three years prior to a student’s degree completion (i.e., for 2000 we use growth rates averaged
over 1996-1997, 1997-1998, and 1998-1999); results are similar if we use growth rates averaged
over the previous five years. Our findings echo Oyer’s (2008) results for MBA graduates. He
shows that the state of the stock market just prior to entering the labor market has enduring effects
on the sector in which business graduates work. We find effects of business-cycle conditions on
the initial country in which a PhD graduate intends to reside. Because of persistence in location
choices, the choice of initial country after the degree is likely to matter for a student’s long-run
location. Finn (2010) finds that the fraction of those working in the United States five years past
the PhD (65%) is only six percentage points lower than the fraction working in the US one year
past the PhD (71%). Our results are thus suggestive of long-lasting effects of business cycles on
the stock of PhDs in a country.
The coefficient estimates indicate that intended stay rates are sensitive to changes in GDP
growth. Both the US and home-country coefficients are significant, although stay rates are more
sensitive to business-cycle fluctuations in the US than at home. Based on the results in column (2)
of Table 3, a one standard deviation increase in the lagged US GDP growth rate (1.2%) is
associated with a 3.3 percentage point increase in the intent to stay; a one standard deviation
increase in the (within-country) birth-country GDP growth rate (4.3%) is associated with a 2.0
percentage point decrease in the intended stay rate. A US economic boom combined with a birth-
country economic bust could therefore produce a sizeable increase in US stay rates. Such an event
occurred in the late 1990s for Korea, as the Asian financial crisis produced a sharp contraction in
the country’s GDP while the US economy grew robustly as part of that decade’s technology
boom. In section four, we graphically depict the importance of business-cycle swings for
observed variation in stay rates for the four major source countries for PhD students in the United
18
States (China, India, Korea, Taiwan).
There is a negative correlation between intent to stay and the recent average level of per
capita GDP in the birth country.18 Because the regressions include controls for birth country fixed
effects, this result indicates that intent to stay weakens as a country develops. Graduates are more
disposed to stay in the United States earlier in the birth country’s development process and more
disposed to leave the US later in the development process. A two standard deviation increase in
per capita GDP (110 log points), which is comparable to the increase in Taiwan’s average income
from 1980 to 2000) is associated with a 15 percentage point increase in the intended stay rate.
One explanation for this finding is that developed countries are likely to have relatively strong
demand for R&D labor (Kortum, 1997), making the desire to return home increasing in the level
development. Over time, this result is suggestive of a feedback mechanism, in which the number
of S&E PhDs locating in a country positively affects its rate of economic growth, thereby
increasing the attractiveness of the country to PhDs in the future, which may have further
beneficial effects on growth. Such feedback effects are prominent in theories of economic growth
that attempt to explain why countries transition from low-growth to high-growth states (e.g.,
Azariadis and Drazen, 1990; Ciccone and Matsuyama, 1996; Durlauf and Quah, 1999).
Finally, we find that there is a negative association between democracy in the birth
country and the desire to stay in the United States. Marshall and Jaggers (2002) measure the
authoritarian tendencies of a regime on a 20 point scale, with -10 being perfect dictatorship and
+10 being perfect democracy. In 2000, Qatar and Saudi Arabia have Polity IV scores of -10,
Liberia and Sierra Leone have scores of 0, and Australia, Canada, New Zealand and most of
Western Europe have scores of 10. The coefficient estimates in column (2) indicate that a two
18 With a time trend in the regression, we cannot separately identify the impact of the level of US per capita GDP (as US average income is nearly perfectly predicted by the trend).
19
standard deviation increase in the Polity IV score (6.6)19 in the three years prior to graduation
would be associated with a 4.0 percentage point decrease in the intent to stay in the United States.
Democratic openings thus appear to induce recently-minted PhD’s to return to their countries of
origin. While existing research documents the impact of political upheaval on foreign student
flows (e.g., Stuen, Mobarak, and Maskus, 2010), we are not aware of research on the impacts of
democratic transitions on return migration.20
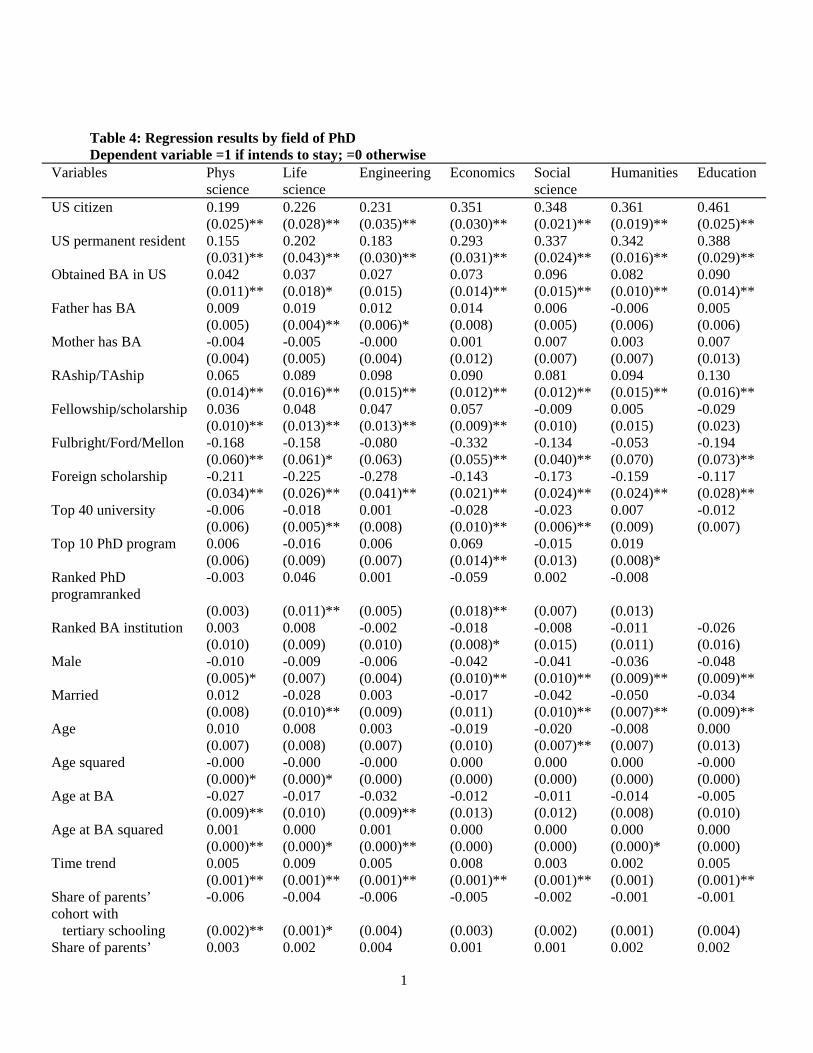
III.B Variation across Academic Disciplines
So far, we have pooled data across S&E fields and ignored disciplines outside of science
and engineering. In Table 4, we replicate the regressions in the second column of Table 3
separately for seven disciplinary categories. Three are S&E fields, physical sciences (atmospheric,
earth, and ocean sciences; chemistry; mathematics and computer science; physics), life sciences
(agricultural science, biological sciences, health sciences), and engineering; and four are non-S&E
fields, economics and management (finance, accounting, marketing, management strategy,
organizational behavior), social sciences (except economics), humanities (including
communications and law), and education.
The results in Table 4 are similar across the three S&E fields, with most coefficient
estimates in the first to third columns being close in value. Among non-S&E fields, the estimates
for economics and management most closely resemble those for science and engineering. In all
non-S&E fields, intent to stay in the US is positively correlated with being a naturalized citizen,
having a green card, or having obtained a BA in the US. Having stronger family or professional
ties to the United States affects location decisions regardless of discipline.
19 For comparison, Korea experienced an 11 point change in its Polity IV score during the democratization process that occurred in the country between 1986 and 1989. 20 For recent research on return migration, see, e.g., Dustmann (2003).
20
Differences between S&E and non-S&E fields emerge when we examine correlates of
academic ability. In all non-S&E fields, the coefficient on father’s education is small and
imprecisely estimated. Coefficient estimates in S&E and non-S&E fields are similar for having a
RAship/TAship but not for having a fellowship or scholarship. The consistent evidence of
positive selection in ability that we observe for the intent to stay in the US among foreign S&E
graduates is weaker outside of science and engineering.
When we examine the impact of economic conditions on location decisions, economics
and management is the only non-S&E discipline for which lagged US GDP growth, lagged birth-
country per capita GDP growth, and lagged birth-country average income each has a statistically
significant impact on the intent to stay in the United States. In the three other non-S&E fields, the
link between economic conditions and location decisions for recent PhD recipients is weaker. For
humanities and education, in particular, the magnitude of these coefficient estimates is much
smaller, though standard errors are too large to reject equality of coefficients across fields.
It is intriguing in Table 4 that the two fields with the largest coefficients on lagged US
GDP growth – engineering and economics – are ones with relatively strong ties to the private
sector. Does the degree of integration between a PhD field and the private-sector job market
matter for the impact of business-cycle conditions on graduate location choices? In column (6) of
Table 4 we investigate this issue. To categorize the private-sector orientation of PhD fields, we
examine the fraction of US-born PhD graduates that plan to take private sector jobs (defined as
jobs in a for-profit industry or business) upon graduation. We choose US-born graduates for the
classification in order to avoid having the language, culture, or visa issues that may affect
immigrant job search play a role in defining the private-sector orientation of a PhD field.
21
Across all fields since 1984, 9.3% of US-born PhDs plan to work in a for-profit business
job upon graduation. The shares are highest in engineering (50.5% in plastics engineering, 44.6%
in ceramics sciences engineering, 41.3% in metallurgical engineering) and in parts of the physical
and life sciences (polymer chemistry 42.3%, forestry science 40.0%, food science 33.8%).
Overall, engineering accounts for 15 of the top 25 PhDs fields in terms of private-sector
orientation (there are 313 total fields). The least private-sector oriented S&E fields tend to be
biological sciences that study entire organisms (evolutionary biology at 0.8%, anatomy at 1.0%,
plant pathology at 1.2%, and zoology at 1.4%). Turning back to Table 3, column (6) restricts the
sample to graduates of S&E fields that have above-median shares of private-sector orientation.
Comparing columns (2) and (6) of Table 3, we see that the coefficient on lagged US GDP
growth is one-third larger for private-sector oriented fields than it is for all fields, with this
difference being highly statistically significant. Results are similar when we define the private-
sector orientation of a field to be above the mean or to be in the top tercile. It thus appears that
foreign student stay rates are more sensitive to the US business cycle in fields that are more
oriented toward the private sector in terms of PhD employment. Coefficients do not differ
significantly across fields for lagged birth-country GDP growth or per capita GDP.
III.C Robustness Checks
One set of concerns about the regressions in Tables 3 and 4 is that the results on lagged
GDP growth or lagged per capita GDP may not reflect the true impact of these variables but the
impact of some omitted variable that is correlated with these outcomes. We proceed to examine
the robustness of our results to the inclusion of additional variables that capture economic
conditions in the birth country. To see if stay rates are a function of specific aspects of economic
22
development rather than simply average income, we include measures of economic openness
(exports plus imports over GDP, inward foreign direct investment over GDP), technological
sophistication (cellphone subscriptions per capita), or industrial sophistication (share of
manufacturing in GDP). In each case, we define these variables as the average over lagged values
in the previous three periods. Adding these variables has no impact on the coefficient estimates
for birth country GDP growth or per capita GDP. Further, none of these variables, except for the
manufacturing share of GDP, is precisely estimated.
A second possibility is that results are being driven by strengthening economic linkages
between the United States and the birth country, which may contribute to economic development
or expand job prospects abroad for US-trained PhDs. Over the sample period, there is a dramatic
expansion in foreign activities by US multinationals, with employment in the foreign affiliates of
US parent firms increasing by 68% between 1983 and 2007. We include measures of the presence
of US multinational enterprises in the birth country (defined to be the level or change in
employment in foreign affiliates owned by US multinationals in the three years previous to a
student’s graduation). These variables are neither economically nor statistically significant.
A third possibility is that stay rates are affected by changes in US government funding for
scientific research. Whereas the inflation-adjusted budgets of the National Science Foundation
and related agencies have been essentially flat since 1992, funding for the National Institutes of
Health increased sharply between 1996 and 2003 (Clemins, 2012), reflecting increased support
for the life sciences. Unfortunately, we do not observe NSF or NIH funding by PhD discipline. As
a crude control for changes in funding priorities by the federal government we allow for a flexible
time trend in stay rates for individuals obtaining PhDs in the biological sciences. The addition of
these terms has no impact on our main results.
23
As further robustness checks, we have controlled for non-linear time trends; replaced our
measure of GDP growth with H-P filtered GDP growth; included lagged sector-specific GDP
growth in the US (for agriculture, construction, government, manufacturing, retail and wholesale
trade, and services); included lagged Gini coefficients for the birth country; and allowed for
interactions between our ability measures (father’s education, having an RAship or TAship) and
business-cycle conditions in the US or the birth country. The additional variables are generally
insignificant and do not materially change the main results reported in Table 3.
IV. Business Cycles and Location Choices for PhD Graduates from
China, India, Korea and Taiwan
Considering how important business cycle conditions are for PhD recipients’ intentions to
stay in the US, we provide a graphical depiction in this section of the link between lagged GDP
growth and graduates’ stay rates. For reasons of space we restrict attention to the four largest
sending countries: China, India, Korea, and Taiwan. Together, these countries accounted for 60.7
percent of all US S&E PhD’s awarded to non-US students in 2007.
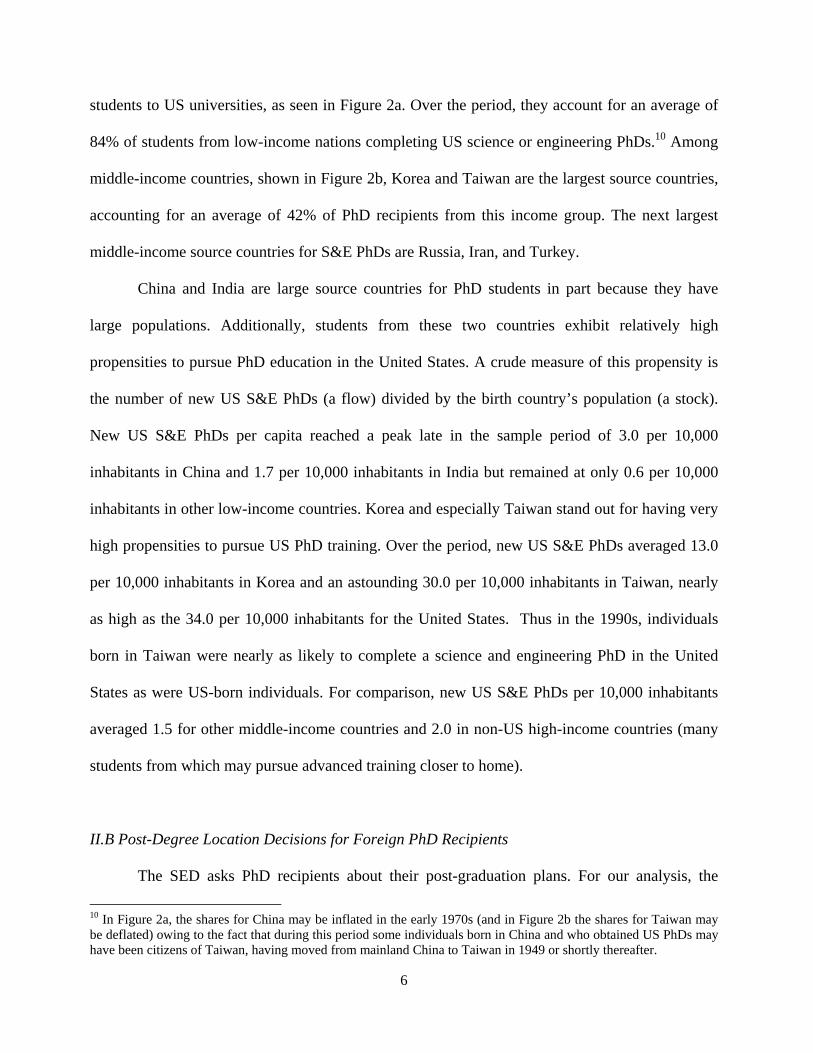
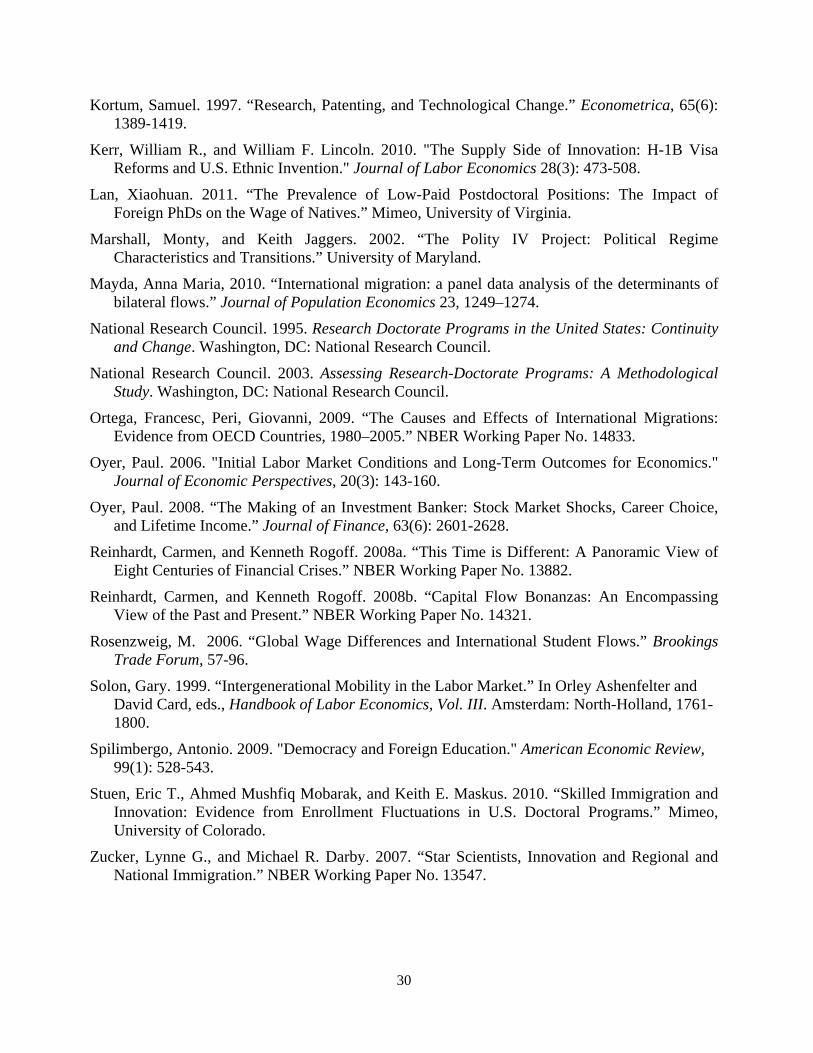
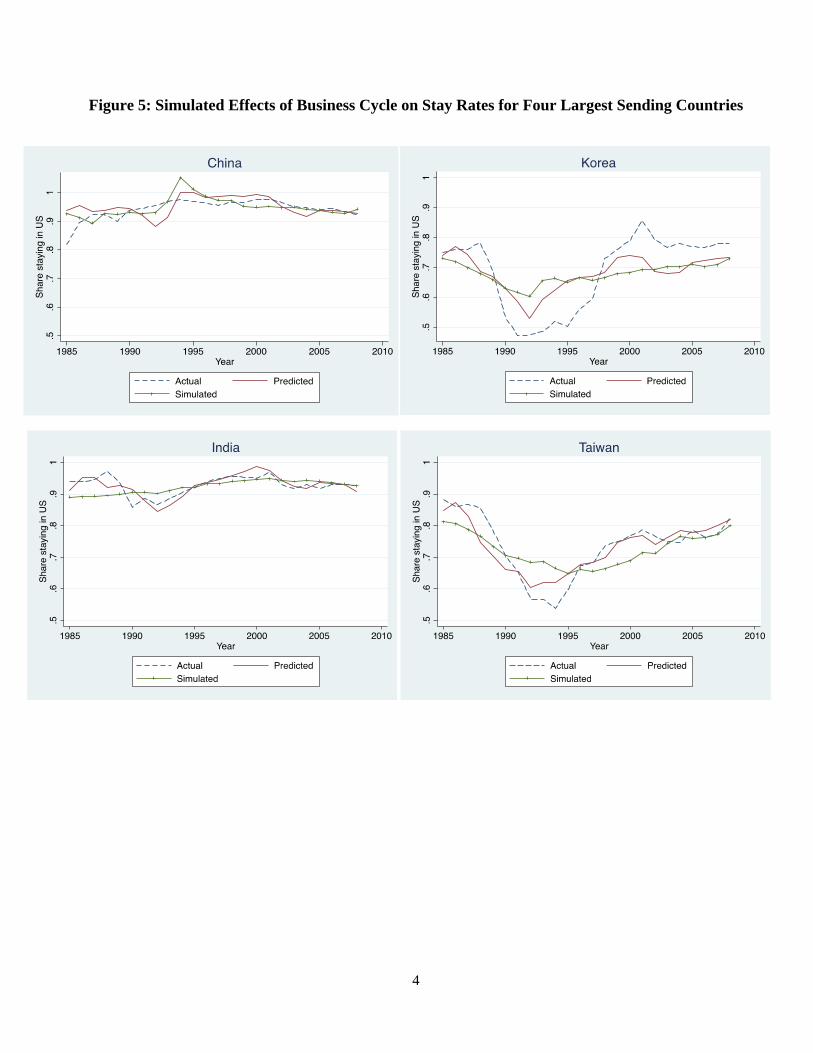
For each country in Figure 5, we plot three lines over time: the actual stay rate, the predicted
stay rate from the model in column (2) of Table 3, and the simulated stay rate. The simulated stay
rate is the predicted value from column (2) of Table 3 in which we have replaced both lagged
home-country GDP growth and lagged US GDP growth with their mean values over the sample
period. Comparing predicted and simulated stay rates provides a depiction of how business cycle
conditions affect the share of S&E PhD recipients who remain in the US after graduating.21
21 Preliminary analyses not reported here indicated that more of the business cycle effect was due to variation in US GDP growth than to variation in home-country GDP growth. This is consistent
24
Before focusing on the effects of the business cycle, we compare actual and predicted stay
rates, depicted as dashed and unmarked solid lines, respectively. The model predicts a shallower
and shorter dip in stay rates in Korea during the early 1990s, which we discuss further below.
Otherwise, the regression model does a reasonably good job capturing the time-series variation in
stay rates, particularly since we do not include variables sometimes used to improve a model’s
time-series fit, such as lagged dependent variables or high-order polynomials in time.
Now, comparing predicted and simulated stay rates, we see that business cycles differ in their
importance in different sending countries. In China and India, stay rates are high, and the
simulated stay rates are nearly constant. This indicates that almost all of the variation in the actual
stay rate over time can be attributed to the business cycle.
In Korea and Taiwan, the difference between the predicted and simulated stay rates shows that
the US recession of the early 1990’s had a pronounced effect on location decisions, reducing stay
rates among Koreans by roughly 8 percentage points (in 1993) and among Taiwanese by nearly
10 percentage points. At the same time, other factors were driving the fluctuations in stay rates in
these countries. In Korea, the transition from military rule to democracy in 1988 seems to have
reduced sharply the share of S&E PhD’s who sought to remain in the US, an effect that is only
partially captured by the regression model. That is, PhD recipients born in Korea appear to be
more responsive to shifts away from authoritarianism in their home country than students from
elsewhere (whose average responsiveness is captured by the regression coefficient). In both Korea
and Taiwan, the Asian financial crisis, which began in 1997, led to a steep rise in the share of
S&E graduates seeking to stay in the US. In the case of Korea, the country’s GDP initially
plunged, falling by seven percent from 1997 to 1998, but then recovered quickly with growth
with our finding above that stay rates were generally more strongly affected by US GDP growth than by home-country GDP growth.
25
rates above four percent in each of the following six years. Again, Korea-born PhDs appear to be
relatively responsive to changes in the environment, in this case lagged GDP growth, when
compared to the average foreign-born PhD. Consequently, predicted stay rates for Korea fluctuate
less around the Asian Financial Crisis than do actual stay rates.
These findings highlight possible limitations in using lagged GDP growth to capture how
uncertainty about the macroeconomic environment may affect PhD location decisions. However,
after considerable experimentation we did not find alternative measures that performed better than
lagged GDP growth. With lagged growth in the regression, measures of recent birth-country
financial, banking, or currency crises from Reinhardt and Rogoff (2008a) or “sudden stops” in
capital inflows from abroad from Reinhardt and Rogoff (2008b) were statistically insignificant in
nearly all cases. Lagged growth rates are the strongest and most robust predictors of the location
choices for foreign-born PhDs.
V. Final Discussion
If innovation is the key to sustaining positive rates of long-run economic growth, highly
skilled labor with training in science and engineering is the input that makes innovation possible.
Graduates in S&E fields have relatively high propensities to produce and to commercialize
patents and the stars among these graduates have relatively high propensities to launch high-
technology business ventures. Over the last half century, the United States has been the most
important training ground for the global supply of science and engineering talent. Where S&E
PhDs choose to locate after they have completed their education is likely to affect the global
distribution of innovative capacity.
26
We find that S&E graduates with the strongest academic ability, measured in terms of
their attributes and performance at the time they enter graduate school, are those most likely to
intend to stay in the US and to find employment in the US job market. These results are consistent
with a growing body of evidence that finds positive selection in emigration from low-income
countries (e.g., Grogger and Hanson, 2011). The United States attracts the best and brightest to
study at its universities and lures the best and brightest among these to stay in the US after their
studies are completed. We know less about the long-run location choices of these individuals in
terms of how many end up remaining in the US as permanent residents or becoming citizens.
Policies surrounding student visas also shape the post-degree location choices of PhD
recipients. Students receiving support from foreign institutions, or from private foundations that
provide incentives for graduates to return to their home countries after the degree, are less likely
to intend to stay in the US. This finding does not necessarily mean that restrictive scholarship
funding is an effective means for low-income countries to produce a highly skilled labor force. At
the application stage, such funding strategies could dissuade individuals from pursuing restrictive
funding options or from seeking to study abroad at all.
Economic conditions are perhaps the most important factor shaping the location choices of
recent PhD recipients in S&E fields. A stronger US economy makes it more likely that graduates
will intend to stay in the US and to find a job. A weaker economy in the graduate’s home country
has the same effect. The responsiveness of PhD location choices to business-cycle conditions
may create a link between the volatility of output and cycles in long-run economic growth. More
short-run volatility appears to produce greater fluctuations in the supply of highly skilled labor,
possibly contributing to variation in long-run growth rates.
27
Business-cycle considerations aside, we do see that as countries develop they become
more attractive locations for PhDs in science and engineering. There is obvious potential for a
virtuous cycle in education and innovation, with returning S&E PhDs increasing innovation in the
home country, thereby enhancing prospects for economic growth and raising the attractiveness of
the home country as a location for future PhD recipients. Korea and Taiwan are possible
examples of self-reinforcing processes. Less is known about how such cycles begin.
28
REFERENCES Azariadis, Costas, and Allen Drazen. 1990. “Threshold Externalities in Economic Development.”
Quarterly Journal of Economics, 105(2): 501-526.
Azariadis, Costas, and John Stachurski. 2005. “Poverty Traps.” In Philippe Aghion and Steven N. Durlauf, eds., Handbook of Economic Growth, Volume 1A, Amsterdam: North-Holland, 296-384.
Beine, Michel, Frédéric Docquier, and Hillel Rapoport. 2001. “Brain Drain and Economic Growth: Theory and Evidence.” Journal of Development Economics, 64(1): 275-289.
Beine, Michel, Frédéric Docquier, and Hillel Rapoport. 2008. “Brain Drain and Human Capital Formation in Developing Countries: Winners and Losers.” Economic Journal, 118: 631-652.
Belot, Michele, and Timothy Hatton. 2008. “Immigrant Selection in the OECD.” CEPR Working Paper No. 6675.
Blanchard, Emily, John Bound, and Sarah Turner. 2009. “Opening (and Closing) Doors: Country-Specific Shocks in U.S. Doctorate Education.” Population Studies Center Report 09-674.
Black, Grant, and Paula Stephan. 2004. “The Importance of Foreign PhD Students to US Science.” Mimeo, Georgia State University.
Black, Sandra E., and Paul J. Deveraux. 2010. “Recent Developments in Intergenerational Mobility.” NBER Working Paper No. 15899.
Borjas, George J. 1987. “Self-Selection and the Earnings of Immigrants.” American Economic Review 77(4): 531-553.
Borjas, George J. 2007. “Do Foreign Students Crowd Out Native Students from Graduate Programs?” In Science and the University, ed. Paula E. Stephan and Ronald G. Ehrenberg. Madison: University of Wisconsin Press.
Borjas, George J., 2009. “Immigration in High-Skill Labor Markets: The Impact of Foreign Students on the Earnings of Doctorates.” In, Science and Engineering Careers in the United States: An Analysis of Markets and Employment. Chicago: University of Chicago Press
Borjas, George J., and Kirk B. Doran. 2012a. “The Collapse of the Soviet Union and the Productivity of American Mathematicians.” Quarterly Journal of Economics, forthcoming.
Borjas, George J. and Kirk B. Doran. 2012b. “Intellectual Mobility: Native Responses to Supply Shocks in the Space of Ideas.” Mimeo, Harvard University.
Bound, J., S. Turner, and P. Walsh. 2009. “The Internationalization of US Doctorate Education.” NBER Working Paper No. 14792.
Cavallo, Eduardo. 2007. “Trade, Gravity and Sudden Stops: On How Commercial Trade Can Increase the Stability of Capital Flows,” mimeo, Harvard University.
Chellaraj, G., K. E. Maskus, and A. Mattoo, A. 2008. “The Contribution of International Graduate Students to U.S. Innovation.” Review of International Economics, 16(3): 444-462.
29
Chiswick, Barry R., Nicholas Larsen, and Paul Pieper. 2010. “The Production of PhDs in the United States and Canada.” IZA Discussion Paper No. 5367.
Ciccone, Antonio, and Kiminori Matsuyama. 1996. “Startup Costs and Pecuniary Externalities as Barriers to Economic Development.” Journal of Development Economics, 49(1): 33-59.
Clark, Ximena, Timothy Hatton, Jeffrey Williamson. 2007. “Explaining US Immigration, 1971-1998.” Review of Economics and Statistics, 89(2): 359-373.
Clemins, Patrick. 2012. “Historical Trends in Federal R&D.” American Association for the Advancement of Science.
de Grip, Andries, Didier Fouarge, and Jan Sauermann. 2009. “What Affects International Migration of European Science and Engineering Graduates?” IZA Discussion Paper No. 4268.
Docquier, Frédéric, Olivier Lohest, and Abdeslam Marfouk. 2007. “Brain Drain in Developing Countries.” World Bank Economic Review, 21 (2): 193-218.
Durlauf, Steven N., and Danny Quah. 1999. “The New Empirics of Economic Growth.” Handbook of Macroeconomics, Volume 1, Amsterdam: North Holland, 235-308.
Dustmann, Christian. 2003. “Return Migration, Wage Differences, and the Optimal Migration Duration.” European Economic Review, 47(2): 353-369.
Finn, Michael. 2010. “Stay Rates of Foreign Doctorate Recipients from U.S. Universities, 2007.” Oak Ridge Institute for Science and Education.
Freeman, Richard. 2009. “What Does the Global Expansion of Higher Education Mean for the US?” NBER Working Paper No. 14962.
Grogger, Jeffrey and Gordon H. Hanson. 2011. “Income Maximization and the Selection and Sorting of International Migrants.” Journal of Development Economics, 95(1), 2011: 42-57.
Hanushek, Eric A., and Lei Zhang. 2006. “Quality-Consistent Estimates of International Returns to Skill.” NBER Working Paper No. 12664.
Hunt, Jennifer. 2011. “Which Immigrants Are Most Innovative and Entrepreneurial? Distinctions by Entry Visa.” Journal of Labor Economics, forthcoming.
Hunt, Jennifer. 2012. “Does the United States Admit the Best and Brightest Computer and Engineering Students?” Mimeo, Rutgers University.
Hunt, Jennifer, and Marjolaine Gauthier-Loiselle. 2010. “How Much Does Immigration Boost Innovation?” American Economic Journal: Macroeconomics 2(2): 31–56.
Jones, Charles I. 1995a. “R&D-Based Models of Economic Growth.” Journal of Political Economy. 103(4): 759-784.
Jones, Charles I. 1995b. “Time Series Tests of Endogenous Growth Models.” Quarterly Journal of Economics, 110(2): 495–525.
Kapur, Devesh, and John McHale. 2005. Give Us Your Best and Brightest: The Global Hunt for Talent and its Impact on the Developing World. Washington, DC: Center for Global Development and the Brookings Institution.
30
Kortum, Samuel. 1997. “Research, Patenting, and Technological Change.” Econometrica, 65(6): 1389-1419.
Kerr, William R., and William F. Lincoln. 2010. "The Supply Side of Innovation: H-1B Visa Reforms and U.S. Ethnic Invention." Journal of Labor Economics 28(3): 473-508.
Lan, Xiaohuan. 2011. “The Prevalence of Low-Paid Postdoctoral Positions: The Impact of Foreign PhDs on the Wage of Natives.” Mimeo, University of Virginia.
Marshall, Monty, and Keith Jaggers. 2002. “The Polity IV Project: Political Regime Characteristics and Transitions.” University of Maryland.
Mayda, Anna Maria, 2010. “International migration: a panel data analysis of the determinants of bilateral flows.” Journal of Population Economics 23, 1249–1274.
National Research Council. 1995. Research Doctorate Programs in the United States: Continuity and Change. Washington, DC: National Research Council.
National Research Council. 2003. Assessing Research-Doctorate Programs: A Methodological Study. Washington, DC: National Research Council.
Ortega, Francesc, Peri, Giovanni, 2009. “The Causes and Effects of International Migrations: Evidence from OECD Countries, 1980–2005.” NBER Working Paper No. 14833.
Oyer, Paul. 2006. "Initial Labor Market Conditions and Long-Term Outcomes for Economics." Journal of Economic Perspectives, 20(3): 143-160.
Oyer, Paul. 2008. “The Making of an Investment Banker: Stock Market Shocks, Career Choice, and Lifetime Income.” Journal of Finance, 63(6): 2601-2628.
Reinhardt, Carmen, and Kenneth Rogoff. 2008a. “This Time is Different: A Panoramic View of Eight Centuries of Financial Crises.” NBER Working Paper No. 13882.
Reinhardt, Carmen, and Kenneth Rogoff. 2008b. “Capital Flow Bonanzas: An Encompassing View of the Past and Present.” NBER Working Paper No. 14321.
Rosenzweig, M. 2006. “Global Wage Differences and International Student Flows.” Brookings Trade Forum, 57-96.
Solon, Gary. 1999. “Intergenerational Mobility in the Labor Market.” In Orley Ashenfelter and David Card, eds., Handbook of Labor Economics, Vol. III. Amsterdam: North-Holland, 1761-1800.
Spilimbergo, Antonio. 2009. "Democracy and Foreign Education." American Economic Review, 99(1): 528-543.
Stuen, Eric T., Ahmed Mushfiq Mobarak, and Keith E. Maskus. 2010. “Skilled Immigration and Innovation: Evidence from Enrollment Fluctuations in U.S. Doctoral Programs.” Mimeo, University of Colorado.
Zucker, Lynne G., and Michael R. Darby. 2007. “Star Scientists, Innovation and Regional and National Immigration.” NBER Working Paper No. 13547.
0
Table A1: Summary statistics for main estimation sample (column 2, Table 3) Variable Mean
(std. dev. for cts. vars) Stay in US 0.787 US citizen 0.082 US permanent resident 0.143 Obtained BA in US 0.134 Father has BA 0.522 Mother has BA 0.330 Share of parents’ age cohort with tertiary education 0.051 Share of parents’ age cohort with secondary education 0.108 Share of parents’ age cohort with primary education 0.222 RAship/TAship 0.624 Fellowship/scholarship 0.127 Fulbright/Ford/Mellon/Rockefellar 0.001 Foreign scholarship 0.051 Top 40 university 0.460 Top 10 PhD program 0.100 Ranked PhD program 0.558 Ranked BA institution 0.626 Male 0.763 Married 0.626 Age 32.3 Age at BA 22.8 Lagged GDP growth, US 0.027 (0.011) Lagged GDP growth, birth country 0.060 (0.039) Lagged GDP per capita, birth country 7.761 (1.437) Lagged polity IV, birth country 1.936 (7.228) N 174,241
0
Figure 1: Foreign-born S&E PhDs by birth region
0.0
5.1
.15
.2.2
5.3
1960 1966 1972 1978 1984 1990 1996 2002 2008Calendar year of doctorate
Low Income Middle Income High Income
Share of new US S&E PhDs by country income group
1
Figure 2: Foreign-born S&E PhDs by birth country (a)
(b)
0.0
5.1
.15
.2
1972 1978 1984 1990 1996 2002 2008Calendar year of doctorate
China India Other low income
Share of new US S&E PhDs by country0
.05
.1.1
5.2
1972 1978 1984 1990 1996 2002 2008Calendar year of doctorate
Korea Taiwan Other middle income
Share of new US S&E PhDs by country
2
Figure 3: Share of new foreign-born S&E PhDs
.2.4
.6.8
1
1960 1966 1972 1978 1984 1990 1996 2002 2008Calendar year of doctorate
Low Income Middle Income High Income
Planning to stay in US
3
Figure 4: Stay Rates in SED versus Finn (2010)
.6.6
5.7
.75
.8.8
5
1997 1998 1999 2000 2001 2002 2003 2004 2005 2006Year
Fraction intending to stay in US in SEDOne-year stay rate from Finn (2010)
New foreign-born PhDs on temporary visas
4
Figure 5: Simulated Effects of Business Cycle on Stay Rates for Four Largest Sending Countries
0
Table 1: Intent to stay in US by selected characteristics of foreign-born S&E PhD recipients, by income level of home country
Low income Middle income High income Total US citizen no 0.859 0.603 0.609 0.699
yes 0.974 0.955 0.947 0.957
US permanent resident no 0.842 0.606 0.599 0.685 yes 0.961 0.894 0.892 0.921
High school in US no 0.863 0.620 0.616 0.709 yes 0.958 0.920 0.930 0.930
College in US no 0.863 0.598 0.584 0.696 yes 0.901 0.861 0.871 0.873
RAship, TAship no 0.800 0.575 0.622 0.653 yes 0.922 0.751 0.727 0.821
Fellowship, scholarship no 0.867 0.642 0.655 0.725 yes 0.866 0.689 0.679 0.745
Fulbright, Ford, Mellon, … no 0.867 0.647 0.658 0.727 yes 0.448 0.376 0.623 0.443
Foreign financial support no 0.873 0.674 0.676 0.747 yes 0.289 0.250 0.252 0.254
Father has BA degree no 0.825 0.603 0.641 0.685 yes 0.909 0.700 0.683 0.776
Mother has BA degree no 0.844 0.619 0.648 0.702 yes 0.923 0.729 0.690 0.796
Top 40 university no 0.873 0.637 0.665 0.735
yes 0.858 0.657 0.654 0.719
Top 10 department no 0.865 0.640 0.657 0.725 yes 0.885 0.708 0.666 0.741
0
Table 2: Stay rates by home-country income level and level of economic growth in home country and US
Home-country economic growth US economic growth
Income level of home country Low High Low High
Low 0.823 0.871 0.848 0.872 Medium 0.665 0.659 0.601 0.686 High 0.661 0.693 0.644 0.685 Note: Economic growth is defined in terms of quartiles of standardized rates of GDP growth, where standardization is carried out within each country. Low growth pertains to the first quartile; high growth pertains to the fourth quartile.
0
Table 3: Regression results Dependent variable =1 if intends to stay; =0 otherwise
Variables Full Sample 1985 Onward Non-Citizens Non-LPRs Top 4 Countries Private Sector PhD Fields
US citizen 0.217 0.195 0.183 0.195 (0.027)** (0.029)** (0.005)** (0.037)** US permanent resident 0.176 0.153 0.153 0.104 0.143 (0.034)** (0.039)** (0.038)** (0.002)** (0.042)** Obtained BA in US 0.029 0.036 0.054 0.059 -0.022 0.023 (0.013)* (0.015)* (0.013)** (0.014)** (0.005)** (0.015) Father has BA 0.014 0.018 0.018 0.020 0.017 0.017 (0.004)** (0.005)** (0.006)** (0.006)** (0.003)** (0.007)* Mother has BA -0.005 -0.004 -0.005 -0.002 -0.004 -0.003 (0.004) (0.002) (0.003) (0.003) (0.002) (0.003) RAship/TAship 0.083 0.068 0.078 0.093 0.057 0.070 (0.015)** (0.016)** (0.018)** (0.018)** (0.003)** (0.022)** Fellowship/scholarship 0.043 0.027 0.039 0.049 0.045 0.022 (0.010)** (0.011)* (0.013)** (0.013)** (0.004)** (0.019) Fulbright/Ford/Mellon -0.140 -0.135 -0.169 -0.172 -0.146 -0.087 (0.037)** (0.035)** (0.041)** (0.044)** (0.048)** (0.070) Foreign scholarship -0.242 -0.267 -0.249 -0.224 -0.317 -0.289 (0.033)** (0.032)** (0.033)** (0.032)** (0.012)** (0.039)** Top 40 university -0.008 -0.005 -0.003 -0.002 0.001 0.007 (0.006) (0.006) (0.006) (0.007) (0.002) (0.009) Top 10 PhD program 0.007 0.009 0.013 0.018 0.011 0.013 (0.005) (0.005) (0.006)* (0.006)** (0.004)** (0.007) Ranked PhD program 0.002 0.000 0.000 0.001 0.001 0.002 (0.003) (0.003) (0.004) (0.004) (0.002) (0.003) Ranked BA institution 0.018 0.009 0.003 0.003 0.014 0.007 (0.010) (0.006) (0.005) (0.005) (0.003)** (0.007) Male -0.007 -0.002 -0.003 -0.003 0.000 -0.003 (0.003)* (0.004) (0.004) (0.004) (0.002) (0.004) Married -0.004 0.006 0.005 -0.002 0.023 0.014 (0.009) (0.007) (0.008) (0.009) (0.002)** (0.006)* Age 0.009 0.018 0.025 0.039 0.024 0.010
1
(0.005) (0.006)** (0.006)** (0.007)** (0.004)** (0.007) Age squared -0.000 -0.000 -0.000 -0.001 -0.000 -0.000 (0.000)** (0.000)** (0.000)** (0.000)** (0.000)** (0.000)* Age at BA -0.014 -0.015 -0.012 -0.014 -0.022 -0.024 (0.008) (0.008) (0.010) (0.012) (0.005)** (0.010)* Age at BA squared 0.000 0.000 0.000 0.000 0.001 0.001 (0.000)* (0.000)* (0.000) (0.000) (0.000)** (0.000)** Time trend 0.006 0.006 0.007 0.007 0.009 0.005 (0.001)** (0.001)** (0.001)** (0.001)** (0.001)** (0.001)** Share of parents’ cohort with -0.005 -0.003 -0.003 -0.002 0.002 -0.002 tertiary schooling (0.002)* (0.002) (0.002) (0.002) (0.001) (0.003) Share of parents’ cohort with 0.003 0.004 0.004 0.005 0.008 0.004 secondary schooling (0.002) (0.002)* (0.002)* (0.002)* (0.000)** (0.001)** Share of parents’ cohort with 0.002 0.001 0.001 0.001 -0.000 0.000 primary schooling (0.001)* (0.001) (0.001) (0.001) (0.000) (0.001) Lagged GDP growth, US 1.488 2.716 2.879 3.133 2.550 3.566 (0.247)** (0.593)** (0.644)** (0.704)** (0.100)** (0.765)** Lagged GDP growth, -0.469 -0.463 -0.516 -0.506 -0.668 -0.524 birth country (0.119)** (0.185)* (0.207)* (0.201)* (0.045)** (0.195)** Lagged GDP per capita, -0.139 -0.113 -0.122 -0.143 -0.149 -0.106 birth country (0.033)** (0.019)** (0.020)** (0.022)** (0.009)** (0.019)** Lagged polity IV, birth country -0.006 -0.006 -0.007 -0.006 -0.014 -0.007 (0.002)* (0.002)** (0.002)** (0.002)** (0.001)** (0.002)** R2 0.26 0.26 0.26 0.26 0.20 0.27 N 219,580 174,241 159,899 134,963 104,198 64,188
* p<0.05; ** p<0.01
1
Table 4: Regression results by field of PhD Dependent variable =1 if intends to stay; =0 otherwise
Variables Phys science
Life science
Engineering Economics Social science
Humanities Education
US citizen 0.199 0.226 0.231 0.351 0.348 0.361 0.461 (0.025)** (0.028)** (0.035)** (0.030)** (0.021)** (0.019)** (0.025)** US permanent resident 0.155 0.202 0.183 0.293 0.337 0.342 0.388 (0.031)** (0.043)** (0.030)** (0.031)** (0.024)** (0.016)** (0.029)** Obtained BA in US 0.042 0.037 0.027 0.073 0.096 0.082 0.090 (0.011)** (0.018)* (0.015) (0.014)** (0.015)** (0.010)** (0.014)** Father has BA 0.009 0.019 0.012 0.014 0.006 -0.006 0.005 (0.005) (0.004)** (0.006)* (0.008) (0.005) (0.006) (0.006) Mother has BA -0.004 -0.005 -0.000 0.001 0.007 0.003 0.007 (0.004) (0.005) (0.004) (0.012) (0.007) (0.007) (0.013) RAship/TAship 0.065 0.089 0.098 0.090 0.081 0.094 0.130 (0.014)** (0.016)** (0.015)** (0.012)** (0.012)** (0.015)** (0.016)** Fellowship/scholarship 0.036 0.048 0.047 0.057 -0.009 0.005 -0.029 (0.010)** (0.013)** (0.013)** (0.009)** (0.010) (0.015) (0.023) Fulbright/Ford/Mellon -0.168 -0.158 -0.080 -0.332 -0.134 -0.053 -0.194 (0.060)** (0.061)* (0.063) (0.055)** (0.040)** (0.070) (0.073)** Foreign scholarship -0.211 -0.225 -0.278 -0.143 -0.173 -0.159 -0.117 (0.034)** (0.026)** (0.041)** (0.021)** (0.024)** (0.024)** (0.028)** Top 40 university -0.006 -0.018 0.001 -0.028 -0.023 0.007 -0.012 (0.006) (0.005)** (0.008) (0.010)** (0.006)** (0.009) (0.007) Top 10 PhD program 0.006 -0.016 0.006 0.069 -0.015 0.019 (0.006) (0.009) (0.007) (0.014)** (0.013) (0.008)* Ranked PhD programranked
-0.003 0.046 0.001 -0.059 0.002 -0.008
(0.003) (0.011)** (0.005) (0.018)** (0.007) (0.013) Ranked BA institution 0.003 0.008 -0.002 -0.018 -0.008 -0.011 -0.026 (0.010) (0.009) (0.010) (0.008)* (0.015) (0.011) (0.016) Male -0.010 -0.009 -0.006 -0.042 -0.041 -0.036 -0.048 (0.005)* (0.007) (0.004) (0.010)** (0.010)** (0.009)** (0.009)** Married 0.012 -0.028 0.003 -0.017 -0.042 -0.050 -0.034 (0.008) (0.010)** (0.009) (0.011) (0.010)** (0.007)** (0.009)** Age 0.010 0.008 0.003 -0.019 -0.020 -0.008 0.000 (0.007) (0.008) (0.007) (0.010) (0.007)** (0.007) (0.013) Age squared -0.000 -0.000 -0.000 0.000 0.000 0.000 -0.000 (0.000)* (0.000)* (0.000) (0.000) (0.000) (0.000) (0.000) Age at BA -0.027 -0.017 -0.032 -0.012 -0.011 -0.014 -0.005 (0.009)** (0.010) (0.009)** (0.013) (0.012) (0.008) (0.010) Age at BA squared 0.001 0.000 0.001 0.000 0.000 0.000 0.000 (0.000)** (0.000)* (0.000)** (0.000) (0.000) (0.000)* (0.000) Time trend 0.005 0.009 0.005 0.008 0.003 0.002 0.005 (0.001)** (0.001)** (0.001)** (0.001)** (0.001)** (0.001) (0.001)** Share of parents’ cohort with
-0.006 -0.004 -0.006 -0.005 -0.002 -0.001 -0.001
tertiary schooling (0.002)** (0.001)* (0.004) (0.003) (0.002) (0.001) (0.004) Share of parents’ 0.003 0.002 0.004 0.001 0.001 0.002 0.002
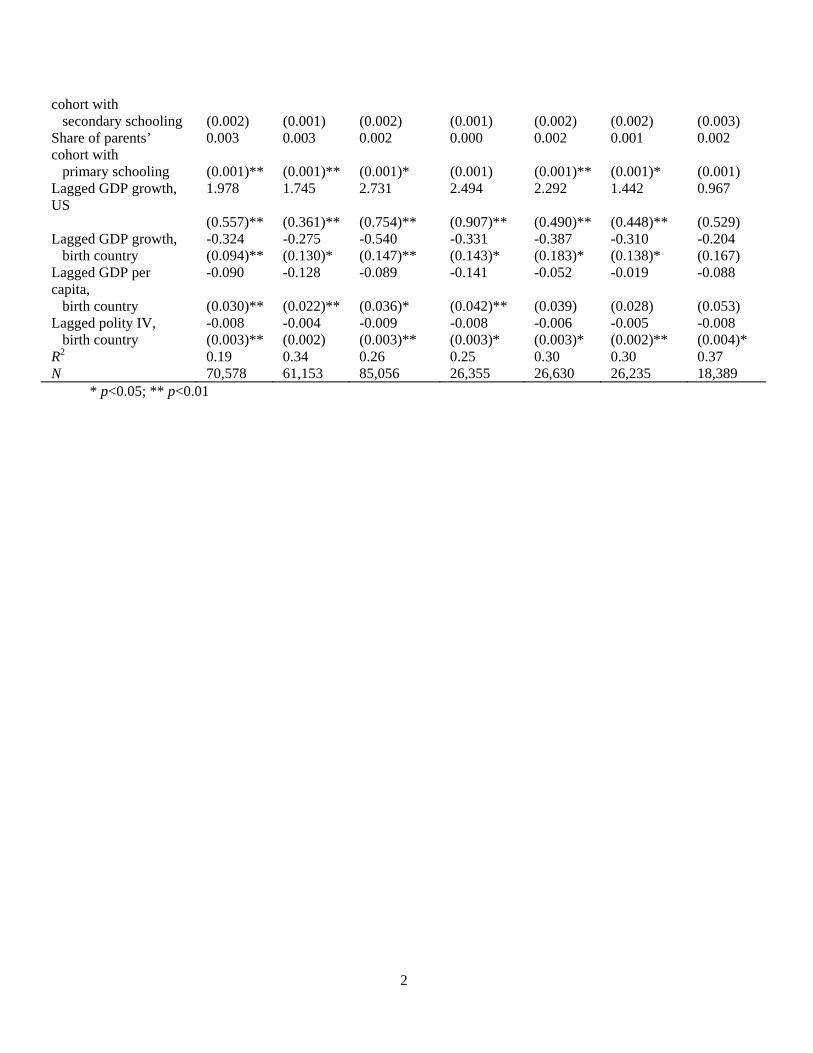
2
cohort with secondary schooling (0.002) (0.001) (0.002) (0.001) (0.002) (0.002) (0.003) Share of parents’ cohort with
0.003 0.003 0.002 0.000 0.002 0.001 0.002
primary schooling (0.001)** (0.001)** (0.001)* (0.001) (0.001)** (0.001)* (0.001) Lagged GDP growth, US
1.978 1.745 2.731 2.494 2.292 1.442 0.967
(0.557)** (0.361)** (0.754)** (0.907)** (0.490)** (0.448)** (0.529) Lagged GDP growth, -0.324 -0.275 -0.540 -0.331 -0.387 -0.310 -0.204 birth country (0.094)** (0.130)* (0.147)** (0.143)* (0.183)* (0.138)* (0.167) Lagged GDP per capita,
-0.090 -0.128 -0.089 -0.141 -0.052 -0.019 -0.088
birth country (0.030)** (0.022)** (0.036)* (0.042)** (0.039) (0.028) (0.053) Lagged polity IV, -0.008 -0.004 -0.009 -0.008 -0.006 -0.005 -0.008 birth country (0.003)** (0.002) (0.003)** (0.003)* (0.003)* (0.002)** (0.004)* R2 0.19 0.34 0.26 0.25 0.30 0.30 0.37 N 70,578 61,153 85,056 26,355 26,630 26,235 18,389
* p<0.05; ** p<0.01