au transhipment 2019/2020 summary (wheat + …...oct-19 nov-19 dec-19 jan-20 feb-20 mar-20 apr-20...
TRANSCRIPT
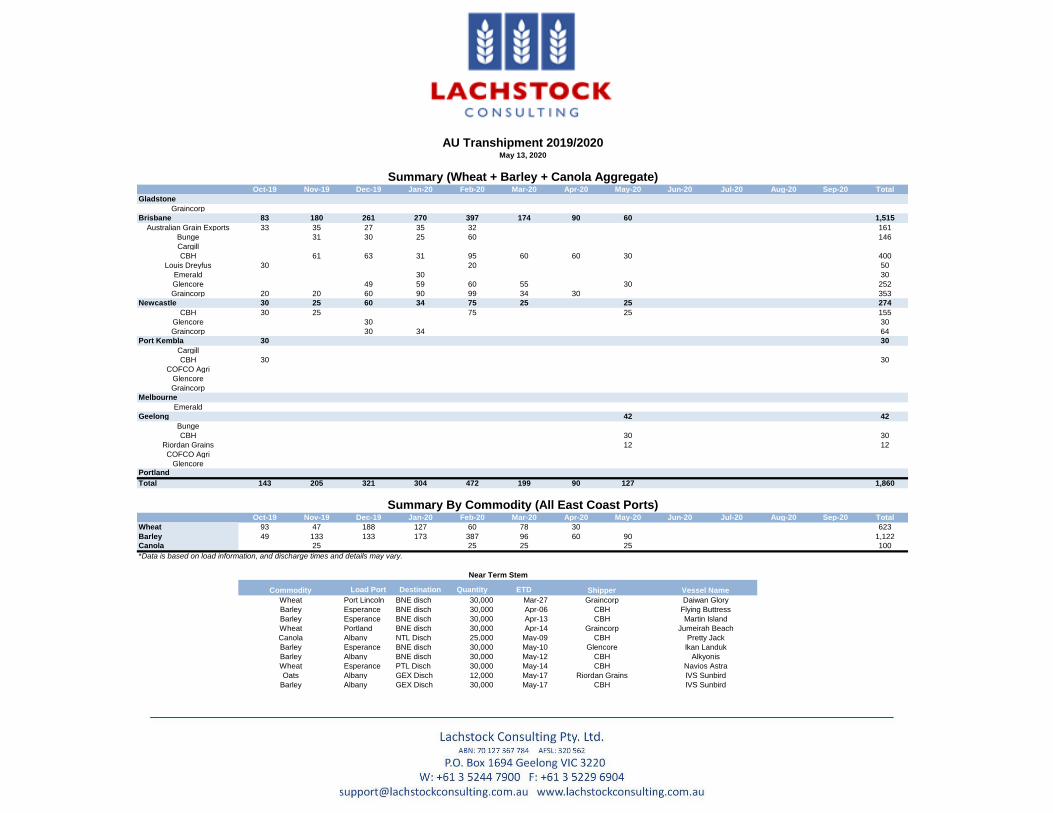
Oct-19 Nov-19 Dec-19 Jan-20 Feb-20 Mar-20 Apr-20 May-20 Jun-20 Jul-20 Aug-20 Sep-20 Total
Gladstone
Graincorp
Brisbane 83 180 261 270 397 174 90 60 1,515
Australian Grain Exports 33 35 27 35 32 161
Bunge 31 30 25 60 146
Cargill
CBH 61 63 31 95 60 60 30 400
Louis Dreyfus 30 20 50
Emerald 30 30
Glencore 49 59 60 55 30 252
Graincorp 20 20 60 90 99 34 30 353
Newcastle 30 25 60 34 75 25 25 274
CBH 30 25 75 25 155
Glencore 30 30
Graincorp 30 34 64
Port Kembla 30 30
Cargill
CBH 30 30
COFCO Agri
Glencore
Graincorp
Melbourne
Emerald
Geelong 42 42
Bunge
CBH 30 30
Riordan Grains 12 12
COFCO Agri
GlencorePortland
Total 143 205 321 304 472 199 90 127 1,860
Oct-19 Nov-19 Dec-19 Jan-20 Feb-20 Mar-20 Apr-20 May-20 Jun-20 Jul-20 Aug-20 Sep-20 Total
Wheat 93 47 188 127 60 78 30 623
Barley 49 133 133 173 387 96 60 90 1,122
Canola 25 25 25 25 100
*Data is based on load information, and discharge times and details may vary.
Load Port Destination Quantity ETD
Port Lincoln BNE disch 30,000 Mar-27
Esperance BNE disch 30,000 Apr-06
Esperance BNE disch 30,000 Apr-13
Portland BNE disch 30,000 Apr-14
Albany NTL Disch 25,000 May-09
Esperance BNE disch 30,000 May-10
Albany BNE disch 30,000 May-12
Esperance PTL Disch 30,000 May-14
Albany GEX Disch 12,000 May-17
Albany GEX Disch 30,000 May-17
Alkyonis
IVS Sunbird
Navios Astra
IVS Sunbird
Daiwan Glory
Martin Island
Jumeirah Beach
Pretty Jack
Ikan LandukBarley
Barley
Wheat
Oats
CBH
Wheat
Barley
Barley
Flying Buttress
Barley
Graincorp
CBH
CBH
Graincorp
CBH
Glencore
CBH
CBH
Riordan Grains
Wheat
Canola
AU Transhipment 2019/2020May 13, 2020
Summary (Wheat + Barley + Canola Aggregate)
Commodity Shipper Vessel Name
Near Term Stem
Summary By Commodity (All East Coast Ports)

ABA Shipping StemShip Reference Destination Commodity Quantity ETD Shipper Vessel Name
Appleton Dock
June
ABA466 TBA Wheat 30000 2020-06-01 Emerald Western Callao
CBH Shipping StemShip Reference Destination Commodity Quantity ETD Shipper Vessel Name
Albany
May
CBH5004 China Barley 33333 2020-05-05 CBH Federal Innoko
CBH5048 China Barley 50000 2020-05-10 CBH African Arrow
CBH5050 NTL Disch Canola 25000 2020-05-11 CBH Pretty Jack
CBH5049 BNE disch Barley 30000 2020-05-14 CBH Alkyonis
CBH5070 GEX Disch Barley 30000 2020-05-19 CBH Ken Breeze
CBH5062 GEX Disch Oats 12000 2020-05-12 Riordan Grains IVS Sunbird
CBH5074 TBA Oats 15000 2020-05-20 CBH Glengyle
CBH5092 TBA Barley 30000 2020-05-28 Graincorp Atlantic Bulker
Esperance
May
CBH5004 China Barley 33333 2020-05-05 CBH Federal Innoko
CBH5064 BNE disch Barley 30000 2020-05-10 Glencore Ikan Landuk
CBH5089 PTL Disch Wheat 30000 2020-05-14 CBH Navios Astra
CBH5071 Brisbane Barley 30000 2020-05-24 CBH Odelmar
CBH5090 Yemen Wheat 25000 2020-05-22 ADM Unity
CBH5107 Yemen Wheat 3500 2020-05-22 Graincorp Unity
CBH5096 China Canola 15000 2020-05-25 CBH San Sebastian
Geraldton
May
CBH5052 TBA Lupins 10000 2020-05-11 CBH Clara Insignia
CBH5079 TBA Wheat 44000 2020-05-17 CBH Jag Akshay
CBH5080 TBA Wheat 50000 2020-05-25 CBH Shail Al Dukhan
CBH5084 TBA Wheat 30000 2020-05-26 Emerald Ikan Jubal
June
CBH5108 TBA Wheat 25000 2020-06-04 Graincorp TBA
CBH5095 TBA Wheat 29701 2020-06-06 Emerald TBA
Kwinana
May
CBH5057 Japan Wheat 24325 2020-05-05 CBH Gant Flair
CBH5063 South Korea Wheat 37000 2020-05-06 Emerald Spring Zephyr
CBH5066 China Wheat 57409 2020-05-02 Graincorp Star Jennifer
CBH5078 TBA Wheat 25000 2020-05-18 CBH Blue Balestier
June
CBH5087 TBA Canola 30000 2020-06-01 Glencore TBA
CBH5019 TBA Wheat 10000 2020-06-16 Cargill TBA
May 13, 2020
Eight Week Shipping Stem
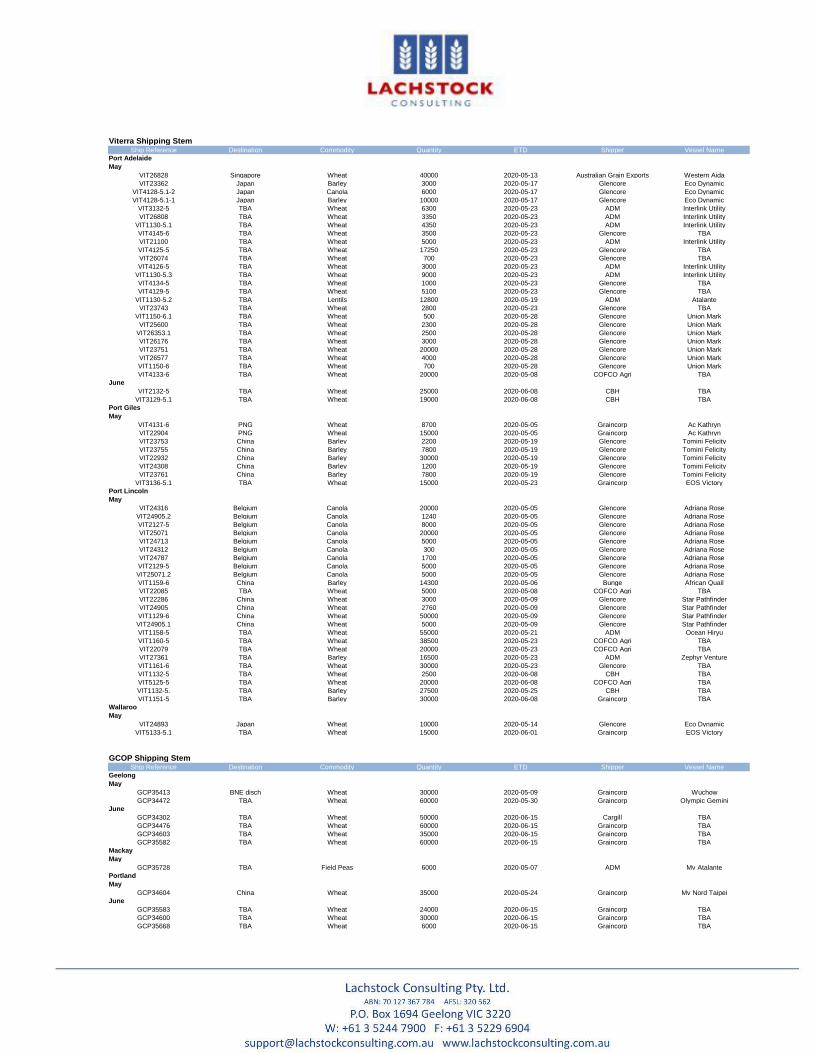
Viterra Shipping StemShip Reference Destination Commodity Quantity ETD Shipper Vessel Name
Port Adelaide
May
VIT26828 Singapore Wheat 40000 2020-05-13 Australian Grain Exports Western Aida
VIT23362 Japan Barley 3000 2020-05-17 Glencore Eco Dynamic
VIT4128-5.1-2 Japan Canola 6000 2020-05-17 Glencore Eco Dynamic
VIT4128-5.1-1 Japan Barley 10000 2020-05-17 Glencore Eco Dynamic
VIT3132-5 TBA Wheat 6300 2020-05-23 ADM Interlink Utility
VIT26808 TBA Wheat 3350 2020-05-23 ADM Interlink Utility
VIT1130-5.1 TBA Wheat 4350 2020-05-23 ADM Interlink Utility
VIT4145-6 TBA Wheat 3500 2020-05-23 Glencore TBA
VIT21100 TBA Wheat 5000 2020-05-23 ADM Interlink Utility
VIT4125-5 TBA Wheat 17250 2020-05-23 Glencore TBA
VIT26074 TBA Wheat 700 2020-05-23 Glencore TBA
VIT4126-5 TBA Wheat 3000 2020-05-23 ADM Interlink Utility
VIT1130-5.3 TBA Wheat 9000 2020-05-23 ADM Interlink Utility
VIT4134-5 TBA Wheat 1000 2020-05-23 Glencore TBA
VIT4129-5 TBA Wheat 5100 2020-05-23 Glencore TBA
VIT1130-5.2 TBA Lentils 12800 2020-05-19 ADM Atalante
VIT23743 TBA Wheat 2800 2020-05-23 Glencore TBA
VIT1150-6.1 TBA Wheat 500 2020-05-28 Glencore Union Mark
VIT25600 TBA Wheat 2300 2020-05-28 Glencore Union Mark
VIT26353.1 TBA Wheat 2500 2020-05-28 Glencore Union Mark
VIT26176 TBA Wheat 3000 2020-05-28 Glencore Union Mark
VIT23751 TBA Wheat 20000 2020-05-28 Glencore Union Mark
VIT26577 TBA Wheat 4000 2020-05-28 Glencore Union Mark
VIT1150-6 TBA Wheat 700 2020-05-28 Glencore Union Mark
VIT4133-6 TBA Wheat 20000 2020-05-08 COFCO Agri TBA
June
VIT2132-5 TBA Wheat 25000 2020-06-08 CBH TBA
VIT3129-5.1 TBA Wheat 19000 2020-06-08 CBH TBA
Port Giles
May
VIT4131-6 PNG Wheat 8700 2020-05-05 Graincorp Ac Kathryn
VIT22904 PNG Wheat 15000 2020-05-05 Graincorp Ac Kathryn
VIT23753 China Barley 2200 2020-05-19 Glencore Tomini Felicity
VIT23755 China Barley 7800 2020-05-19 Glencore Tomini Felicity
VIT22932 China Barley 30000 2020-05-19 Glencore Tomini Felicity
VIT24308 China Barley 1200 2020-05-19 Glencore Tomini Felicity
VIT23761 China Barley 7800 2020-05-19 Glencore Tomini Felicity
VIT3136-5.1 TBA Wheat 15000 2020-05-23 Graincorp EOS Victory
Port Lincoln
May
VIT24316 Belgium Canola 20000 2020-05-05 Glencore Adriana Rose
VIT24905.2 Belgium Canola 1240 2020-05-05 Glencore Adriana Rose
VIT2127-5 Belgium Canola 8000 2020-05-05 Glencore Adriana Rose
VIT25071 Belgium Canola 20000 2020-05-05 Glencore Adriana Rose
VIT24713 Belgium Canola 5000 2020-05-05 Glencore Adriana Rose
VIT24312 Belgium Canola 300 2020-05-05 Glencore Adriana Rose
VIT24787 Belgium Canola 1700 2020-05-05 Glencore Adriana Rose
VIT2129-5 Belgium Canola 5000 2020-05-05 Glencore Adriana Rose
VIT25071.2 Belgium Canola 5000 2020-05-05 Glencore Adriana Rose
VIT1159-6 China Barley 14300 2020-05-06 Bunge African Quail
VIT22085 TBA Wheat 5000 2020-05-08 COFCO Agri TBA
VIT22286 China Wheat 3000 2020-05-09 Glencore Star Pathfinder
VIT24905 China Wheat 2760 2020-05-09 Glencore Star Pathfinder
VIT1129-6 China Wheat 50000 2020-05-09 Glencore Star Pathfinder
VIT24905.1 China Wheat 5000 2020-05-09 Glencore Star Pathfinder
VIT1158-5 TBA Wheat 55000 2020-05-21 ADM Ocean Hiryu
VIT1160-5 TBA Wheat 38500 2020-05-23 COFCO Agri TBA
VIT22079 TBA Wheat 20000 2020-05-23 COFCO Agri TBA
VIT27361 TBA Barley 16500 2020-05-23 ADM Zephyr Venture
VIT1161-6 TBA Wheat 30000 2020-05-23 Glencore TBA
VIT1132-5 TBA Wheat 2500 2020-06-08 CBH TBA
VIT5125-5 TBA Wheat 20000 2020-06-08 COFCO Agri TBA
VIT1132-5. TBA Barley 27500 2020-05-25 CBH TBA
VIT1151-5 TBA Barley 30000 2020-06-08 Graincorp TBA
Wallaroo
May
VIT24893 Japan Wheat 10000 2020-05-14 Glencore Eco Dynamic
VIT5133-5.1 TBA Wheat 15000 2020-06-01 Graincorp EOS Victory
GCOP Shipping StemShip Reference Destination Commodity Quantity ETD Shipper Vessel Name
Geelong
May
GCP35413 BNE disch Wheat 30000 2020-05-09 Graincorp Wuchow
GCP34472 TBA Wheat 60000 2020-05-30 Graincorp Olympic Gemini
June
GCP34302 TBA Wheat 50000 2020-06-15 Cargill TBA
GCP34476 TBA Wheat 60000 2020-06-15 Graincorp TBA
GCP34603 TBA Wheat 35000 2020-06-15 Graincorp TBA
GCP35582 TBA Wheat 60000 2020-06-15 Graincorp TBA
Mackay
May
GCP35728 TBA Field Peas 6000 2020-05-07 ADM Mv Atalante
Portland
May
GCP34604 China Wheat 35000 2020-05-24 Graincorp Mv Nord Taipei
June
GCP35583 TBA Wheat 24000 2020-06-15 Graincorp TBA
GCP34600 TBA Wheat 30000 2020-06-15 Graincorp TBA
GCP35668 TBA Wheat 6000 2020-06-15 Graincorp TBA

Bunge Shipping StemShip Reference Destination Commodity Quantity ETD Shipper Vessel Name
Bunbury
May
BG1290 TBA Wheat 17000 2020-05-08 Bunge Poavosa Ace
QBT Shipping StemShip Reference Destination Commodity Quantity ETD Shipper Vessel Name
NAT Shipping StemShip Reference Destination Commodity Quantity ETD Shipper Vessel Name
Quattro Shipping StemShip Reference Destination Commodity Quantity ETD Shipper Vessel Name
Patrick Shipping StemShip Reference Destination Commodity Quantity ETD Shipper Vessel Name

Bulk Handler Port Commodity October - (ABS) November - (ABS) December - (ABS) January - (ABS) February - (ABS) March April May June July August SeptemberABS Shipments YTD (Oct-
February)
Lineups Shipments ( -
September)
Viterra Port Adelaide Wheat 45,282 23,316 20,866 52,193 23,881 0 46,000 154,350 63,000 0 0 0 165,537 263,350
Barley 1,633 4,709 6,157 2,815 6,538 0 59,500 13,000 0 0 0 0 21,852 72,500
Canola 804 802 225 308 75,076 11,500 32,000 6,000 0 0 0 0 77,216 49,500Total 47,720 28,827 27,248 55,316 105,495 11,500 137,500 173,350 63,000 0 0 0 264,605 385,350
Patrick PAT Terminal Wheat 0 0 0 0 0 0 0 0 0 0 0 0 0 0
Barley 0 0 0 0 0 0 0 0 0 0 0 0 0 0Total 0 0 0 0 0 0 0 0 0 0 0 0 0 0
Total Port Adelaide Wheat 45,282 23,316 20,866 52,193 23,881 0 46,000 154,350 63,000 0 0 0 165,537 263,350
(VIT + PAT) Barley 1,633 4,709 6,157 2,815 6,538 0 59,500 13,000 0 0 0 0 21,852 72,500
Canola 804 802 225 308 75,076 11,500 32,000 6,000 0 0 0 0 77,216 49,500Total 47,720 28,827 27,248 55,316 105,495 11,500 137,500 173,350 63,000 0 0 0 264,605 385,350
Port Giles Wheat 0 0 30,000 29,700 0 79,100 0 38,700 0 0 0 0 59,700 117,800Barley 0 0 0 52,250 0 0 0 49,000 0 0 0 0 52,250 49,000Canola 0 0 0 0 0 0 0 0 0 0 0 0 0 0
Total 0 0 30,000 81,950 0 79,100 0 87,700 0 0 0 0 111,950 166,800
Port Lincoln Wheat 33,000 26,252 92,179 64,550 192,249 172,050 23,000 231,760 0 0 0 0 408,230 426,810Barley 0 0 63,843 63,000 0 36,917 56,000 88,300 0 0 0 0 126,843 181,217Canola 0 0 0 64,756 0 42,363 0 66,240 0 0 0 0 64,756 108,603Total 33,000 26,252 156,022 192,306 192,249 251,330 79,000 386,300 0 0 0 0 599,829 716,630
Thevenard Wheat 0 14,000 43,808 44,000 0 44,000 10,000 0 0 0 0 0 101,808 54,000Barley 0 0 0 0 0 0 0 0 0 0 0 0 0 0Canola 0 0 0 0 0 0 0 0 0 0 0 0 0 0Total 0 14,000 43,808 44,000 0 44,000 10,000 0 0 0 0 0 101,808 54,000
Wallaroo Wheat 0 0 0 0 0 36,700 0 25,000 0 0 0 0 0 61,700Barley 0 0 0 0 0 50,000 22,000 0 0 0 0 0 0 72,000Canola 0 0 0 0 0 0 0 0 0 0 0 0 0 0Total 0 0 0 0 0 86,700 22,000 25,000 0 0 0 0 0 133,700
Total Wheat SA 78,282 63,568 186,853 190,443 216,130 331,850 79,000 449,810 63,000 0 0 0 735,275 923,660
Total Barley SA 1,633 4,709 70,000 118,065 6,538 86,917 137,500 150,300 0 0 0 0 200,945 374,717
Total Canola SA 804 802 225 65,064 75,076 53,863 32,000 72,240 0 0 0 0 141,972 158,103Total SA 80,720 69,079 257,078 373,572 297,744 472,630 248,500 672,350 63,000 0 0 0 1,078,192 1,456,480
CBH Geraldton Wheat 197,036 183,730 94,373 242,900 103,512 130,100 163,442 124,000 54,701 0 0 0 821,551 472,243
Barley 0 0 0 0 0 30,000 27,000 0 0 0 0 0 0 57,000
Canola 0 0 64,431 19,997 11,000 0 0 0 0 0 0 0 95,428 0
Total 197,036 183,730 158,804 262,897 114,512 160,100 190,442 124,000 54,701 0 0 0 916,979 529,243
Kwinana Wheat 195,519 214,850 408,367 382,471 269,419 301,410 136,810 129,860 10,000 0 0 0 1,470,627 578,080Barley 4,298 70,509 149,601 89,273 62,477 13,500 304,000 0 0 0 0 0 376,157 317,500Canola 1,793 32,247 2,072 110,593 76,618 91,878 28,000 0 30,000 0 0 0 223,324 149,878Total 201,610 317,607 560,040 582,337 408,514 406,788 468,810 129,860 40,000 0 0 0 2,070,108 1,045,458
Albany Wheat 24,773 60,500 102,645 242,838 69,775 101,590 91,498 57,409 0 0 0 0 500,530 250,497Barley 41,750 0 0 69,033 102,613 144,100 167,894 167,814 0 0 0 0 213,395 479,808Canola 0 0 119,401 0 0 29,553 0 25,000 0 0 0 0 119,401 54,553Total 66,523 60,500 222,045 311,870 172,388 275,243 259,392 250,223 0 0 0 0 833,326 784,858
Esperance Wheat 48,802 22,000 57,636 148,373 101,233 25,000 252,742 118,500 0 0 0 0 378,044 396,242Barley 0 0 0 0 49,005 67,361 60,000 81,667 0 0 0 0 49,005 209,028Canola 0 0 65,303 107,624 0 59,934 60,000 15,000 0 0 0 0 172,927 134,934Total 48,802 22,000 122,939 255,997 150,238 152,295 372,742 215,167 0 0 0 0 599,976 740,204
Bunge Bunbury Wheat 25,325 0 30,000 27,500 0 0 0 17,000 0 0 0 0 82,825 17,000
Barley 0 0 31,500 12,100 52,379 0 0 0 0 0 0 0 95,979 0
Canola 0 0 0 0 0 40,032 0 0 0 0 0 0 0 40,032Total 25,325 0 61,500 39,600 52,379 40,032 0 17,000 0 0 0 0 178,804 57,032
Total Wheat WA 491,455 481,080 693,021 1,044,081 543,939 558,100 644,492 446,769 64,701 0 0 0 3,253,577 1,714,062
Total Barley WA 46,048 70,509 181,101 170,405 266,473 254,961 558,894 249,481 0 0 0 0 734,536 1,063,336
Total Canola WA 1,793 32,247 251,207 238,214 87,618 221,397 88,000 40,000 30,000 0 0 0 611,080 379,397Total WA 539,296 583,836 1,125,329 1,452,701 898,030 1,034,458 1,291,386 736,250 94,701 0 0 0 4,599,193 3,156,795
ABA Appleton Dock Wheat 20,193 10,675 31,943 39,951 43,375 0 0 0 30,000 0 0 0 146,137 30,000
Barley 1,499 2,104 20,277 69,697 21,454 0 0 0 0 0 20,000 0 115,031 20,000
Canola 3,240 2,942 6,733 4,049 3,411 0 0 0 0 0 0 0 20,374 0Total ABA 24,932 15,720 58,954 113,697 68,240 0 0 0 30,000 0 20,000 0 281,542 50,000
Containers Melb. Cont. Terminal Wheat 0 0 0 0 0 0 0 0 0 0 0 0 0 0
Barley 0 0 0 0 0 0 0 0 0 0 0 0 0 0Total 0 0 0 0 0 0 0 0 0 0 0 0 0 0
Total Melbourne Wheat 20,193 10,675 31,943 39,951 43,375 0 0 0 30,000 0 0 0 146,137 30,000
Barley 1,499 2,104 20,277 69,697 21,454 0 0 0 0 0 20,000 0 115,031 20,000
Canola 3,240 2,942 6,733 4,049 3,411 0 0 0 0 0 0 0 20,374 0Total 24,932 15,720 58,954 113,697 68,240 0 0 0 30,000 0 20,000 0 281,542 50,000
Graincorp Portland Wheat 0 0 0 20,000 0 0 30,000 35,000 60,000 0 0 0 20,000 125,000
Barley 0 0 0 32,536 0 0 0 0 0 0 0 0 32,536 0Canola 30,850 0 0 0 0 70,000 0 0 0 0 0 0 30,850 70,000Total 30,850 0 0 52,536 0 70,000 30,000 35,000 60,000 0 0 0 83,386 195,000
Geelong Wheat 0 0 0 0 0 0 30,000 90,000 205,000 160,000 120,000 60,000 0 665,000Barley 0 0 0 39,180 51,998 0 0 0 0 0 0 0 91,178 0Canola 0 59,400 0 0 0 0 0 60,000 0 0 0 0 59,400 60,000Total 0 59,400 0 39,180 51,998 0 30,000 150,000 205,000 160,000 120,000 60,000 150,578 725,000
Carrington Wheat 0 0 15,655 0 0 0 0 0 0 0 0 0 15,655 0Barley 0 0 0 0 0 0 0 0 0 0 0 0 0 0Canola 0 0 0 0 0 0 0 0 0 0 0 0 0 0Sorghum 0 0 0 0 0 0 0 0 0 0 0 0 0 0Total 0 0 15,655 0 0 0 0 0 0 0 0 0 15,655 0
NAT Newcastle Agri Terminal Wheat 0 0 0 0 0 0 0 0 0 0 0 0 0 0
Barley 0 0 0 0 0 0 0 0 0 0 0 0 0 0
Canola 0 0 0 0 0 0 0 0 0 0 0 0 0 0
Sorghum 0 0 0 0 0 0 0 0 0 0 0 0 0 0Total 0 0 0 0 0 0 0 0 0 0 0 0 0 0
Total Newcastle Terminals Wheat 0 0 15,655 0 0 0 0 0 0 0 0 0 15,655 0
(GCOP + NAT) Barley 0 0 0 0 0 0 0 0 0 0 0 0 0 0
Canola 0 0 0 0 0 0 0 0 0 0 0 0 0 0
Sorghum 0 0 0 0 0 0 0 0 0 0 0 0 0 0Total 0 0 15,655 0 0 0 0 0 0 0 0 0 15,655 0
Quattro Quattro Terminal Wheat 0 0 0 0 0 0 0 0 0 0 0 0 0 0
Barley 0 0 0 0 0 0 0 0 0 0 0 0 0 0
Canola 0 0 0 0 0 0 0 0 0 0 0 0 0 0
Sorghum 0 0 0 0 0 0 0 0 0 0 0 0 0 0Total 0 0 0 0 0 0 0 0 0 0 0 0 0 0
Monthly Shipping Summary

Bulk Handler Port Commodity October - (ABS) November - (ABS) December - (ABS) January - (ABS) February - (ABS) March April May June July August SeptemberABS Shipments YTD (Oct-
February)
Lineups Shipments ( -
September)
Monthly Shipping Summary
Graincorp Port Kembla Wheat 0 0 0 0 0 0 0 0 0 0 0 0 0 0
Barley 0 0 0 0 0 0 0 0 0 0 0 0 0 0Canola 0 0 0 0 0 0 0 0 0 0 0 0 0 0Sorghum 0 0 0 0 0 0 0 0 0 0 0 0 0 0Total 0 0 0 0 0 0 0 0 0 0 0 0 0 0
Total Port Kembla Wheat 0 0 0 0 0 0 0 0 0 0 0 0 0 0
(Quattro + GCOP) Barley 0 0 0 0 0 0 0 0 0 0 0 0 0 0
Canola 0 0 0 0 0 0 0 0 0 0 0 0 0 0
Sorghum 0 0 0 0 0 0 0 0 0 0 0 0 0 0Total 0 0 0 0 0 0 0 0 0 0 0 0 0 0
Sydney Wheat 1,026 3,556 1,823 2,900 1,544 0 0 0 0 0 0 0 10,849 0
Barley 0 0 0 492 0 0 0 0 0 0 0 0 492 0
Canola 0 0 0 1,076 0 0 0 0 0 0 0 0 1,076 0
Total 1,026 3,556 1,823 4,469 1,544 0 0 0 0 0 0 0 12,418 0
Fisherman Islands Wheat 0 0 0 0 0 0 6,000 0 0 0 0 0 0 6,000Sorghum 0 0 0 0 0 0 0 0 0 0 0 0 0 0Total 1,026 3,556 1,823 4,469 1,544 0 6,000 0 0 0 0 0 12,418 6,000
Gladstone Wheat 0 0 0 0 0 0 0 0 0 0 0 0 0 0Sorghum 0 0 0 0 0 0 0 0 0 0 0 0 0 0Total 0 0 0 0 0 0 0 0 0 0 0 0 0 0
Mackay Wheat 0 0 0 0 0 0 0 0 0 0 0 0 0 0Sorghum 0 0 0 0 0 0 0 0 0 0 0 0 0 0Total 0 0 0 0 0 0 0 0 0 0 0 0 0 0
QBT QLD Bulk Terminal Wheat 0 0 0 0 0 0 0 0 0 0 0 0 0 0
Sorghum 0 0 0 0 0 0 0 0 0 0 0 0 0 0Total 0 0 0 0 0 0 0 0 0 0 0 0 0 0
Total Brisbane Terminals Wheat 1,136 315 25 4,635 0 0 6,000 0 0 0 0 0 6,111 6,000
(QBT + GCOP) Sorghum 8,452 1,563 1,019 393 297 0 0 0 0 0 0 0 11,724 0Total 9,588 1,878 1,043 5,028 298 0 6,000 0 0 0 0 0 17,834 6,000
Total Wheat Vic 20,193 10,675 31,943 59,951 43,375 0 60,000 125,000 295,000 160,000 120,000 60,000 166,137 820,000
Total Barley Vic 1,499 2,104 20,277 141,413 73,452 0 0 0 0 0 20,000 0 238,745 20,000
Total Canola Vic 34,090 62,342 6,733 4,049 3,411 70,000 0 60,000 0 0 0 0 110,625 130,000
Total Vic 55,782 75,120 58,954 205,413 120,238 70,000 60,000 185,000 295,000 160,000 140,000 60,000 515,507 970,000
Total Wheat NSW 1,026 3,556 17,478 2,900 1,544 0 0 0 0 0 0 0 26,504 0
Total Barley NSW 0 0 0 492 0 0 0 0 0 0 0 0 492 0
Total Canola NSW 0 0 0 1,076 0 0 0 0 0 0 0 0 1,076 0
Total Sorghum NSW 0 0 0 0 0 0 0 0 0 0 0 0 0 0
Total NSW 1,026 3,556 17,478 4,469 1,544 0 0 0 0 0 0 0 28,073 0
Total Wheat QLD 1,136 315 25 4,635 0 0 6,000 0 0 0 0 0 6,111 6,000
Total Sorghum QLD 8,452 1,563 1,019 393 297 0 0 0 0 0 0 0 11,724 0
Total QLD 9,588 1,878 1,043 5,028 298 0 6,000 0 0 0 0 0 17,834 6,000Total East Coast 66,396 80,554 77,475 214,909 122,079 70,000 66,000 185,000 295,000 160,000 140,000 60,000 561,414 976,000
Total Australia Total Wheat 592,091 559,194 929,320 1,302,010 804,988 889,950 789,492 1,021,579 422,701 160,000 120,000 60,000 4,187,604 3,463,722
Barley 49,180 77,322 271,378 430,376 346,464 341,878 696,394 399,781 0 0 20,000 0 1,174,719 1,458,053Canola 36,688 95,391 258,166 308,403 166,104 345,260 120,000 172,240 30,000 0 0 0 864,752 667,500Sorghum 0 0 0 492 0 0 0 0 0 0 0 0 492 0Total 677,959 731,907 1,458,863 2,041,282 1,317,556 1,577,088 1,605,886 1,593,600 452,701 160,000 140,000 60,000 6,227,568 5,589,275

Export Pace
0
200000
400000
600000
800000
1000000
1200000
Barley Export Pace Comparison
5 yr average 2018/19 YTD ABS 2019/20 Stem SND Forecast
0
500000
1000000
1500000
2000000
Wheat Export Pace Comparison
5 yr average 2018/19 YTD ABS 2019/20 Stem SND Forecast
0
100000
200000
300000
400000
500000
Canola Export Pace Comparison
5 yr average 2018/19 YTD ABS 2019/20 Stem SND Forecast

Total
kmt State % kmt State % kmt State % kmt State % kmt State % kmt % of Total
Bahrain 26 100% 26 1%
Bangladesh 32 100% 32 1%
China 255 79% 51 16% 15 5% 1 0% 323 8%
Egypt 22 19% 68 58% 27 23% 117 3%
Fiji 78 89% 10 11% 88 2%
India 1 100% 1 0%
Indonesia 301 78% 83 21% 3 1% 0 0% 386 9%
Japan 329 94% 1 0% 16 5% 5 1% 351 8%
Kenya 47 100% 47 1%
Kuwait 158 100% 158 4%
Malaysia 162 82% 20 10% 15 7% 0 0% 196 5%
Mauritius 0 100% 0 0%
Mozambique - 0%
New Zealand 3 2% 128 86% 15 10% 2 2% 0 0% 149 4%
Nigeria - 0%
North Korea - 0%
Oman 44 100% 44 1%
Papua New Guinea 100 81% 18 15% 5 4% 124 3%
Philippines 680 95% 30 4% 3 0% 713 17%
PNG - 0%
Singapore 43 91% 1 2% 3 6% 0 0% 47 1%
South Africa - 0%
South Korea 444 100% 1 0% 445 11%
Spain - 0%
Sri Lanka 32 76% 9 21% 1 3% 42 1%
Thailand 168 72% 47 20% 19 8% 1 0% 234 6%
UAE - 0%
Vietnam 182 58% 109 35% 16 5% 4 1% 312 7%
Yemen 175 87% 26 13% 202 5%
Others 97 64% 20 13% 34 23% 0 0% 0 0% 150 4%
Sum 3,254 78% 735 18% 166 4% 27 1% 6 0% 4,188
Total
kmt State % kmt State % kmt State % kmt State % kmt State % kmt % of Total
China 239 48% 63 13% 201 40% 503 43%
Hong Kong - 0%
India - 0%
Indonesia - 0%
Japan 143 96% 6 4% 149 13%
Jordan - 0%
Kuwait - 0%
New Zealand 6 100% 0 0% 6 0%
Oman - 0%
Philippines 3 83% 1 17% 3 0%
Saudi Arabia - 0%
Singapore 0 80% 0 20% 0 0%
South Korea 12 87% 0 2% 2 11% 0 0% 14 1%
Spain - 0%
Sri Lanka - 0%
Taiwan 1 5% 11 55% 8 40% 20 2%
UAE - 0%
Vietnam 75 86% 8 9% 5 5% 88 7%
Others 261 67% 113 29% 17 4% 0 0% 392 33%
Sum 735 63% 201 17% 239 20% 0 0% 1,175
Total
kmt State % kmt State % kmt State % kmt State % kmt State % kmt % of Total
China 211 87% 31 13% 242 28%
EU-27 378 65% 140 24% 59 10% 577 67%
France - 0%
Germany - 0%
Japan 14 78% 2 12% 2 9% 17 2%
Netherlands - 0%
South Africa 0 14% 0 76% 0 9% 0 0%
South Korea - 0%
Spain - 0%
UAE - 0%
Others 9 32% - 0% 19 64% 1 4% 0 0% 29 3%
Sum 611 71% 142 16% 111 13% 1 0% 0 0% 865
Key Canola Exports By Origin State
WA SA VIC NSW QLD
Key Barley Exports By Origin State
WA SA VIC NSW QLD
Key Shipments 2019/20
Key Wheat Exports By Origin State
WA SA VIC NSW QLD

KMT % Of Mkt KMT % Of Mkt KMT % Of Mkt KMT % Of Mkt KMT % Of Mkt KMT % Of Mkt
CBH 1,517 33% 1,397 54% 121 11%
Graincorp 1,191 26% 386 15% 80 7% 725 80%
Glencore 794 17% 379 15% 405 37% 11 35%
ADM 210 5% 22 1% 166 15%
Emerald 187 4% 137 5% 50 6%
Cargill 183 4% 65 3% 18 2% 100 11%
Australian Grain Exports 174 4% 59 2% 115 10%
Bunge 152 3% 58 2% 94 9%
COFCO Agri 104 2% 104 9%
Louis Dreyfus 55 1% 55 2%
Riordans 30 1% 30 3%
JK International 20 0% 20 65%
Cargill Malt 15 0% 15 1%
Top 13 Exporters Total 4,632 100% 2,573 100% 1,102 100% 905 100% 0 0% 100%
Export Market Share 2019/20 - All
Australia Western Australia South Australia Victoria New South Wales Queensland
Top 13 Exporters
Western Australia CBH
Graincorp
Glencore
Emerald
Cargill
Australian Grain Exports
Bunge
Louis Dreyfus
ADM
Cargill Malt
South Australia
Glencore
ADM
CBH
Australian Grain Exports
COFCO Agri
Bunge
Graincorp
Cargill
Queensland
JK International
Glencore
AustraliaCBH
Graincorp
Glencore
ADM
Emerald
Cargill
Australian Grain Exports
Bunge
COFCO Agri
Louis Dreyfus
Riordans
JK International
Cargill Malt

KMT % Of Mkt KMT % Of Mkt KMT % Of Mkt KMT % Of Mkt KMT % Of Mkt KMT % Of Mkt
CBH 973 30% 908 53% 66 9%
Graincorp 951 29% 272 16% 50 7% 629 83%
Glencore 536 16% 281 16% 245 32% 11 100%
ADM 193 6% 22 1% 149 19%
Emerald 167 5% 137 8% 30 4%
Australian Grain Exports 161 5% 54 3% 106 14%
Cargill 128 4% 10 1% 18 2% 100 13%
COFCO Agri 104 3% 104 14%
Bunge 56 2% 28 2% 28 4%
Top 9 Exporters Total 3,269 100% 1,713 100% 765 100% 759 100% 0 0% 11 100%
Export Market Share 2019/20 - Wheat
Top 9 ExportersAustralia Western Australia South Australia Victoria New South Wales Queensland
Western AustraliaCBH
Glencore
Graincorp
Emerald
Australian Grain Exports
Bunge
ADM
Cargill
South Australia
Glencore
ADM
Australian GrainExports
COFCO Agri
CBH
Australia CBH
Graincorp
Glencore
ADM
Emerald
Australian Grain Exports
Cargill
COFCO Agri
Bunge

KMT % Of Mkt KMT % Of Mkt KMT % Of Mkt KMT % Of Mkt KMT % Of Mkt KMT % Of Mkt
CBH 490 43% 435 61% 55 17%
Glencore 211 19% 63 9% 148 46%
Graincorp 180 16% 114 16% 30 9% 36 42%
Bunge 66 6% 66 20%
Louis Dreyfus 55 5% 55 8%
Riordans 30 3% 30 35%
Cargill 30 3% 30 4%
Emerald 20 2% 20 23%
ADM 17 1% 17 5%
Cargill Malt 15 1% 15 2%
Australian Grain Exports 13 1% 4 1% 9 3%
Top 11 Exporters Total 1,127 100% 716 100% 324 100% 86 100% 0 0% 0 0%
Export Market Share 2019/20 - Barley
Top 11 ExportersAustralia Western Australia South Australia Victoria New South Wales Queensland
Western AustraliaCBH
Graincorp
Glencore
Louis Dreyfus
Cargill
Cargill Malt
Australian GrainExports
South Australia
Glencore
Bunge
CBH
Graincorp
AustraliaCBH
Glencore
Graincorp
Bunge
Louis Dreyfus
Riordans
Cargill
Emerald

KMT % Of Mkt KMT % Of Mkt KMT % Of Mkt KMT % Of Mkt KMT % Of Mkt KMT % Of Mkt
Graincorp 60 31% 60 100%
Glencore 41 21% 35 27% 6 100%
CBH 40 20% 40 31%
Bunge 30 15% 30 23%
Cargill 25 13% 25 19%
Top 5 Exporters Total 196 100% 130 100% 6 100% 60 100% 0 0% 0 0%
Export Market Share 2019/20 - Canola
Top 5 ExportersAustralia Western Australia South Australia Victoria New South Wales Queensland
Western Australia
CBH
Glencore
Bunge
Cargill
South Australia
Glencore
Australia
Graincorp
Glencore
CBH
Bunge
Cargill