auctions of government securities in india – an analysis · auctions of government securities in...
TRANSCRIPT

Reserve Bank of India Occasional PapersVol. 29, No. 3, Winter 2008
Auctions of Government Securities in India –An Analysis
Ravi Shankar and Sanjoy Bose*Auction methodology and its practical use have received tremendous importance in
a market oriented mechanism from 1990s onwards. In this paper, we employ empiricalmethods to evaluate various performance parameters associated with auctions ofGovernment of India dated securities. In this analysis we observed that Governmentsecurities auctions in India are fairly efficient as bidding dispersion is quite low withnormality in pricing behaviour. The bidding behaviour analysis of Indian governmentsecurities auctions shows that bidders’ pricing strategy is negatively influenced by bidsize, bid cover ratio and tenor of the security. Indian bidders are reducing their bid amountfor higher priced bids to minimise their ‘winners-curse’ in the auctions. The statisticalanalysis validates various standard auction features. It also establishes that the auctionshelp in determining most commonly perceived market-clearing borrowing rates out ofwell behaved bid-price distributions.
JEL Classification : D44, G10
Keywords : Government Securities Auction, Bidding Strategy.
IntroductionThe Government of India issues debt securities to finance the Public
Debt. Reserve Bank of India conducts the auctions of the Governmentsecurities such as auctions of Treasury Bills and fixed coupon earningdated securities, floating rate bonds, capital index bonds by following apre-announced half-yearly calendar. Dated securities are issued by eitherconducting yield-based auctions for issue of new securities whereincoupon rates emerge on the basis of competitive bidding, or price-basedauctions for re-issue of existing securities. With the reform processinitiated in the 1990s, auctioning government securities evolved out sincethe first auction of dated security was conducted on June 03, 1992.
Auction is a price building process driven by a competitive biddingprocess, wherein the seller receives a collective assessment of prospective
* Ravi Shankar is Assistant Adviser and Sanjoy Bose is Director, Internal Debt ManagementDepartment, Reserve Bank of India, Mumbai. The authors are thankful to Shri H R Khanand Shri R N Kar for their valuable comments and suggestions. The views expressed inthis article are of the authors and not of the institution they belong.

24 RESERVE BANK OF INDIA OCCASIONAL PAPERS
value of the asset to be sold. Modern day auctions bear out detailedempirical data on bidders’ behaviour when different units of goods getallocated at accepted bid prices. The importance of periodic empiricalevaluation of bidding behaviour helps reset the assumptions that gobehind designing auctions, specially the traditionally evolved out complexdesigns like those of Treasury security auctions. As underlying raw bid-price distributions govern a priori the bidder’s demand and informationabout quantum and price, an empirical understanding of the bid data inthe form of panel data analysis of locally differentiated form of a varietyof the empirical frequency distributions, concentration analysis of bidsas also evidences of localised mean reverting bell shaped (near-normal)pricing behaviour, provide valuable insights about overall performanceof the auction design1.
The major participants in these auctions in India are the banks,insurance companies, mutual funds and primary dealers. Banks andinsurance companies participate actively in the auctions to meet theirstatutory requirements while primary dealers participate in the auctionfor market making and positioning the securities for further sale in thesecondary market. Auction data reveal the competitive behaviour ofvarious investor-groups in terms of success ratios, bid shading, totalamount of bonds demanded, bid amount distribution as against respectivebid prices, dispersion as well as concentration of bids around multi-modalbids that could be expected within a heterogeneous cluster of bidders.Panel empirical analyses for a similar set of auctions would elucidatethe bidding pattern and help evaluate the overall efficiency of theauctioning process.
Much of the auction literature deals with the relation between auctionmechanism and the seller’s revenue and with equilibrium biddingstrategies. However, many of the theoretical results are not robust tochanging assumptions when verified by doing hard empirical analyses(Milgrom, 1989). Subtleties of competitive bidding were brought to thefore because of the puzzling conclusions on winner’s curse2 drawn fromthe modern auction theories, which has set the age-old debate aboutperformance of auction designs for the case of sealed-bid Treasury billauctions in which each buyer paying a price equal to the highest rejected

AUCTIONS OF GOVERNMENT SECURITIES IN INDIA – AN ANALYSIS 25
bid (uniform auction) would yield more revenue to the Treasury than theauctions in which winning bidder pays the seemingly higher amountequal to his own bid (multiple-price or discriminatory price auction).Majority of empirical modelling exercises of the subsequent period,however, could not settle this theoretical puzzle. It, therefore, made acase for experimental validation of auction theories in a particular contextand empirical evaluations of the theoretical predictions for a particularauctioning environment. For example, Cammack (1991) studied thebidding strategies and the information content in the US Treasury billauctions purely on an empirical basis and brought out firm evidencestowards imperfect information in the Treasury bill market, downwardbias in average auction bid (bid shading3) and the auction prices feedingon the secondary market price behaviour implying thereby that thesetwo markets aggregate trader’s private information differently.
Early work of Hendricks and Porter (1988) and others provideimportant guidance about bid distribution analyses for substantiatingunderlying assumptions behind an auction. Over a period of time,structural approach has emerged as a positive area of research in buildingup econometric models of auction data, which provide critical policyinputs regarding choice of an auction design and associated issues andassumptions related to auction format4 (Paarsch et al, 2006). Till mid-1990s, only a few empirical studies have attempted to validate theoreticalmodels using real auction data (Laffont et al, 1995). With the improvedestimation and simulation techniques, several rigorous statistical analyseshelp estimate econometric models that are closely derived from auctiontheories. Examples include development of empirical models todiscriminate between common values and private values models in thefirst-price auctions, to quantify the magnitude of the winner’s curse inthe pure common values model5, or say comparing the performances ofopen and sealed bid auctions (Athey et al, 2006). For example, theworking paper of Hortacsu (2002) undertook one of the oldest unresolvedquestions in the auction literature: whether to sell treasury bills bydiscriminatory or uniform auction, or his recent paper (Hortacsu, 2008)on testing for common values in Canadian Treasury Bill markets. In theIndian context also, no hard evidence could be found about superiorityof the uniform auctions over a comparable set of multiple price auctions(RBI Annual Report, 2002-03).

26 RESERVE BANK OF INDIA OCCASIONAL PAPERS
In this paper one-year auction data for 2006-07 (April-March) inrespect of Government of India dated securities, which follow by andlarge a comparable pattern and sizes, have been analysed to capture thebid price distribution pattern so as to gain insights into institutionalbidding behaviour as also overall efficiency of the auction format, designand listed methods and rules for participating in the auction.
The present paper is divided into five sections. The first sectionbriefly describes the commonly adopted auction designs in India andabroad. A theoretical framework focussing on bidding behaviour alongwith literature review is presented in Section II. Performance ofgovernment securities auction with certain stylised data analyses ofbidding behaviour in the recent period is presented in Section III. Thenan empirical evaluation of certain quoted pricing strategy model ispresented in the Section IV and the concluding observations aresummarised in Section V.
Section I
Design of Government Securities Auction in India6
The auction procedure followed by RBI is the commonly usedmultiple-price sealed-bid auction. The bidders electronically submitsealed competitive bids specifying the price they are willing to pay for aparticular amount of debt security. For dated securities auctions, investorsbelonging to eligible categories may also submit non-competitive bidsup to a ceiling of Rs.2 crore without specifying price. These bids areaccepted at the average price of bids accepted in the auction. The totalamount of non-competitive bids is subtracted from the total issue-sizefor allocation to competitive bids. An initial ceiling of 5 per cent of issuesize is kept on the total non-competitive amount but the ceiling limit israrely touched.
Once all the bids are received during the bidding time, RBI allocatesthe competitive bids starting from highest price bid and moving downuntil entire amount is allocated. In a multiple price-auction, eachsuccessful bidder pays the price stated in his bid. In case of ‘uniformprice’ auctions, all successful bidders pay the same price that is cut-off

AUCTIONS OF GOVERNMENT SECURITIES IN INDIA – AN ANALYSIS 27
price at which the market clears the issue. The method of auction isannounced well in advance in the issue announcement notification.
In India, the banks and insurance companies are required to investin government securities as per statutory reserve requirements. Mainauction bidding strategy of the banks and the insurance companies is toprice their bids in such a way that it is beneficial to them than buyingfrom secondary market to meet their growing reserve requirement. Theirbuying demand in secondary market may increase the price in secondarymarket. Therefore, these bidders being long-term investor have to pricetheir bids based on their own values of the security in longer time horizonas against the bidding strategy of other bidders like the primary dealerswho acquire securities in auction mainly to sale later in the secondarymarket and thus their bid pricing would have valuation of shorter-term.The intermediaries like the primary dealers would like to earn quickprofit by acquiring securities in the primary auctions and selling in thesecondary market.
On the other hand, primary dealers have the obligation ofunderwriting the auction issue and get the incentive in the form ofunderwriting commission. Thus, the primary dealers would have ofdifferent bid pricing strategy. Moreover, on account of size (capacity)constraint, the bidding strategy of the primary dealers would be differentthan the banks and insurance companies. The primary dealers are smallerentities as compared to banks and insurance companies, which havehigher financial capacities.
India follows the by and large universally adopted auction methodwith most of the auctions being multi-price (or discriminatory price)auctions. Uniform price auctions were also undertaken in the past (RBIAnnual Report, 2002-03). Countries that follow regularly similar auctiondesigns include the UK, Italy, Canada, Germany and Sweden (KeloharjuM et al, 2005).
Even though the traditional Treasury procedures have theoreticaldrawbacks, it is difficult to prescribe the best way to auction governmentsecurities. The Treasury is obliged to provide easy entry into the auctions,broadening, where possible, the ownership of the public debt; and itmust adhere closely to a crowded schedule of borrowing. While the
28 RESERVE BANK OF INDIA OCCASIONAL PAPERS
Treasury may not always get the top revenue amounts for the issuances,the prevailing auction system help the conduct of monetary policy andensure a deep and active secondary market in government obligations.
Section II
Theoretical Backdrop7
Modern day fascinating world of auction theory and its applicationhas been termed as “auction engineering” and it thrives on multiplediscourses of Game Theory, experimental economics of DesignMechanism, Operation Research and Empirical Sciences like statistics,simulation and computing science. To boot, auction is being increasinglycultivated as a very effective applied tool in pricing and allocatingeconomic good so much so that related auction methods have created“the most single exciting province of applied economics during last dozenyears” (Warsh, 2006).
To have a comprehensive summary on the auction literature is adaunting task as it ‘continues to grow at a prodigious, even acceleratingrate’ even after three decades of intensive work that started in the late1970s and early 1980s, just when the right game-theoretic methods forstudying this subject namely games of incomplete information and perfectequilibrium was becoming widely known (Maskin, 2004).
Auctions help “increase” or “augment” (‘augere’) prices of exchangeof ownership of different kinds of assets in uncertain context where thebuyers and sellers do not have a priori, precise idea on pricing (Aryal etal, 2007). Auctions are used by the governments to set up new assetsmarkets namely energy sources like offshore oil and gas lease,commodities like wool and forest timber, transport infrastructure andlogistics, pollution permits and spectrum for mobile-phone services asalso for privatisation of national firms (Klemperer, 2004). In such a zestfor market-oriented instruments of experimental economics of the newmillennium, a consensus has been reached among the practitioners thatthe most effective way to sell government securities is through auctions(Kastl, 2008). William Vickery’s (1961) classic inquiry into auctions is
AUCTIONS OF GOVERNMENT SECURITIES IN INDIA – AN ANALYSIS 29
considered as the foundation of the theory of auctions. This hadsubsequently flourished into a growing discipline to embrace newenvironments and new theoretical as well as empirical developments.Many practical problems in the form of testable hypotheses came up andmethodologies were developed to carry out laboratory experiments andinferential procedures to validate the field data on bidding behaviour(op cit Paarsch et al, 2006). Auction theories, modified suitably by strongempirical evidences when put to practical work in the 1990s led to highlysuccessful designs on radio spectrum auctions in the mid-1990s. Alongwith came many more theoretical and synthetic developments on a varietyof auction designs (Milgrom, 2004).
William Vickrey established the basic taxonomy of auctions byclassifying them based on the order in which prices are quoted and theway in which bids are entered. First, securities can be awarded at pricesthat are progressively lowered until the entire issue is sold; alternatively,the auctioneer can arrange the bids in ascending order by their price anddecide on a single price that places the total issue. By the second measure,the auction can be a private affair with sealed bids opened by theauctioneer (i.e. price is not known to other bidders), or it can be conductedin real time, with participants in a single room or connected by phone/electronic bidding in public view (i.e price is known to other bidders).This two-by-two classification yields four different types of auctionsnamely (i) the first-price sealed-bid auction, (ii) the second-price sealed-bid auction, (iii) the descending-price open-outcry auction and (iv) theascending-price open-outcry auction.
Treasury auctions wield a composite design known as multiunitsealed bid auctions. Such granular single price bids bestow strategicflexibilities to each bidder so that the stipulated amount of securitiesnotified to be issued gets determined at a cut-off issuance price based ona well spread-out demand schedule, maintaining the competitive rigouras well as transparency in the whole process. Optimality of the best pricedetermination is premised upon the assumption that all the bidders arerational and they put their bids efficiently. Compared to other auctiondesigns, Treasury auctions are expected to yield the highest expected
30 RESERVE BANK OF INDIA OCCASIONAL PAPERS
revenue (utility) to the seller, while leaving sufficient space for strategicmanoeuvrability of bidding for multiple quantities of bonds as price-quantity pair. However, it is currently being debated that new auctiondevises like ascending-price, open bid design is superior over somewhatinefficient versions of the traditional single price bid auctions namelypay-as-bid (or discriminatory) as well as uniform price (or, non-discriminatory) auctions. While the ongoing debate on possible switchingto modern day auction designs like Ausubel types dynamic auctions isevolving, it is a well accepted fact that the established markets have aliking for the traditional auction structure wherein dominant marketparticipants would like to derive comforts from consolidated use of thecurrent processes (Ausubel, 2004). Anecdotal recording on theinstitutionalisation of Treasury securities auctions also suggests that themere prospect of greater efficiency may not necessarily effect changethat requires a large number of factors to alter familiar patterns ofbehaviour; change sometimes also depends on following a path thatfacilitates learning and implementation of new patterns (Garbade, 2004).As evidenced in the case of US securities market, the Treasurysuccessfully configured the present efficient configuration of governmentbond auction8 by combining familiarity, gradualism and a willingness toimprove. Successful migration to a totally changed auction or evenintroduction of a new financial instrument by sovereign issuer requireslot of learning, creating motivation and learning among the participantsas well as resolving many practical issues.
The general framework for analysing bidder behaviour in auctionsused by economists is that of game theory. The auctions can be consideredas strategic games and bidding behaviour determines the price for thesecurity auctioned and thus the revenue raised for Government. Eachbidder in the auctions submits price-quantity pairs. The valuation of eachbidder depends on his or her information about the security. Bidders areassumed to behave competitively and not to collude making auctions asnon-cooperative game. Successful bidding in the auction involvessuccessful guesses about other bidders’ information. Bidder X wins theauction if his bid exceeds the bids of other bidders and price paid is hisbid price. The decision problem bidder X faces is to strategise a set of

AUCTIONS OF GOVERNMENT SECURITIES IN INDIA – AN ANALYSIS 31
bids that maximises his returns. It can be shown that the equilibriumstrategy is a function of the bidders own valuation and the distributionof valuation of other bidders (Krishna, 2002).
It is often argued that sealed bid descending auction has a built-inbias in slapping winner’s curse on successful bidders, which is quenchedtotally in case of open bid ascending auctions. The debate is still unsettledas would glean from the following competing arguments. First, it is arguedtheoretically that there is no systematic advantage of either sealed bid(Dutch) auction over the open bid ascending (English) auctions and vice-versa. This is premised upon a set of innovative results known as PayoffEquivalence theorems, which were first discovered by Vickery (1961)and extended by Myerson (1981), Riley and Samuelson (1981), Milgromand Weber (1982). It began with Vickery’s surprising finding that theaverage revenues and payoffs are same for every auction within a verybroad class. Under certain idealised conditions, changing payment rules(e.g, uniform or multiple pricing, open or closed forms) cannot affectthe participants’ final payoff and thus the revenue finally realised. Suchresults are a kind of irrelevance conclusions, which are ingenuously usedin analysing relative performances of different kinds of auctions.“Practical uses of the equivalence theorems are similar to the uses ofModigliani-Miller Theorem in financial economics, and the monetaryneutrality theorems in macroeconomics” (Milgrom, 2004). It means thatalternative designs are sought for in complex situations where key idealassumptions are not tenable. Otherwise, simpler designs seem to beworking fine. Its veracity, however, requires to be validated based onauction performance data from time to time, as environmental factorsmay undergo periods of remarkable changes, coercing thereby review ofthe assumed auction design. Second, it is argued in the contrary thatirrelevance conclusion does not hold good in real life situations in theface of persistence of different behavioural factors in case of differentforms. For example, proponents of ascending auctions often argue thatno bidder is willing to bid close to fair value unless pushed to do so bythe open competition of the auction design. Third, sealed bid auction isliked by the auctioneer over open bid forms because latter types neverresult in more being paid than is absolutely necessary to win the auction,

32 RESERVE BANK OF INDIA OCCASIONAL PAPERS
whereas sealed bids tenders are frequently evidenced to be leaving “lotsof money being left on the table”. Fourth, inherent rigour of sealed bidtenders relies heavily on the fact that available pricing information isequally and efficiently utilised by the bidders and to that extentpreponderance of possible bid-shading balances possible chances ofwinner’s curse, which could be at times demand driven aggressive biddingbehaviour and there is no harm in collecting the “money left on the table”out of a pay-as-bid behaviour.
Similar arguments revolve around relative merits of two alternativeforms for auctioning securities, namely multiple price versus uniformprice auctions. Informal arguments like government getting more moneyfrom the first scheme, rationalising thereby that each bid paying its ownprice, or the counterpoint in favour of the uniform price auction thatbidders who collectively know that they must pay their own bid whenthey win will bid less as guided by natural ‘bid shading’ behaviour reducethe market-clearing price leading to lower revenues, do not settle theissue. Irrelevance property inherent in the Payoff Equivalence propertyentails that till the designs do not affect the allocation principles amongdifferent groups of bidders, it does not affect the total revenue or theaverage prices obtained by the auctioneer. Data analysis of the biddingpattern revealed not much efficiency gains of uniform auction overmultiple price design in the Indian context (RBI Annual Report, 2002-03).
The auction literature also distinguishes between independent privateand common value auctions following Milgrom and Weber (1982). Thevalue of the securities auctioned is not of private nature as there issecondary market where the securities traded and a bidder has the optionto try to get the security in auction at his bid price or choose to buy itfrom secondary market at the prevailing price. For existence of secondarymarket, Government securities auctions are usually considered ascommon value auctions. Ausubel (2004) have observed that in a commonvalue model the ‘winner’s curse’ is more pronounced. The more amountof the security a bidder wins, the worse news is this for him as bidder hasto pay higher price for the security. Ausubel refers to this phenomenonas ‘champion’s plague’. Rational bidders adjust for champion’s plague
AUCTIONS OF GOVERNMENT SECURITIES IN INDIA – AN ANALYSIS 33
by reducing their demand for any given price. In auction parlance, this isknown as bid shading. Nyborg et al (2002) argue that intra-bidderdispersion and quantity demanded would be impacted by bidder’scapacity. Wilson (1979) described a multi-unit auction model andprescribed that risk neutral bidders would submit downward slopingdemand schedules and the market clearing price will be at the point wherebidders demand curve intersects his residual supply curve. Back andZender (1993) shown that all bidders pay the same price and make noprofit when bidders’ marginal value is constant across the bidders andthe value is perfectly known. Sometimes, auction participation couldalso dwell upon regulatory requirement. Hortacsu (2002, 2006) haveargued that the banks participate in Turkish Treasury auction to fulfiltheir reserve requirement. It is of special importance that markedheterogeneity among the disparate regulated institutional entities mayinfluence their values. Distinguishing features of private value andcommon value items could be understood from Milgrom’s (1982)treatment of oil, gas and mineral rights. Empirical models are also beingdeveloped for testing private value component in otherwise dominatingfeatures of Treasury bills.
Repo auctions are used to inject central bank funds against collateralinto the banking sector. Nyborg et al (2005) analysed the basic bid-dataof the European Central Bank’s (ECB) variable Repo rate auctions. TheECB uses standard discriminatory auctions and hundreds of banksparticipate. The amount auctioned over the monthly reserve maintenanceperiod is in principle exactly what banks collectively need to fulfil reserverequirements. ECB’s bidder-level data study finds: (i) Bidder behaviouris different from what is documented for treasury auctions. Privateinformation and the winner’s curse seem to be relatively unimportant.(ii) Under-pricing is positively related to the difference between the inter-bank rate and the auction minimum bid rate, with the latter appearing tobe a binding constraint. (iii) Bidders are more aggressive when theimbalance of awards in the previous auction is larger. (iv) Large biddersdo better than small bidders.
Literature on multi-unit auctions9 does not provide any definitiverecommendations whether the ultimate goal is that of revenue
34 RESERVE BANK OF INDIA OCCASIONAL PAPERS
maximisation or efficiency of the allocation. So far as country practicesare concerned, there is a clear preference between the two most widelyused mechanisms. As per the survey on auction practices adopted forTreasury securities in 42 industrialised undertaken by IMF staff membersin the second half of the 1990s, it has been recorded that 39 countriesconduct discriminatory auctions and only 3 countries use a uniform priceauctions. Ausubel and Cramton (2002) argued that the comparison ofthe uniform and discriminatory auctions, both in terms of allocationefficiency and revenue maximisation, is an empirical question. Eitherform could be better under different circumstances, which may beevaluated based on empirical analysis. Standard data analysis in the formof mean variance analysis, assessing bid distribution pattern as alsoconcentration analysis across the auctions during a year having certainhomogeneity regarding the environment as well as auction rules andprocedures would provide certain key evaluative information. Moreover,structural econometric modelling of the auction data would statisticallyvalidate certain common hypotheses relating to general performance ofthe auctions in quantitative terms.
Section III
Performance Analysis of Government Securities Auctions in India
1. Empirical background
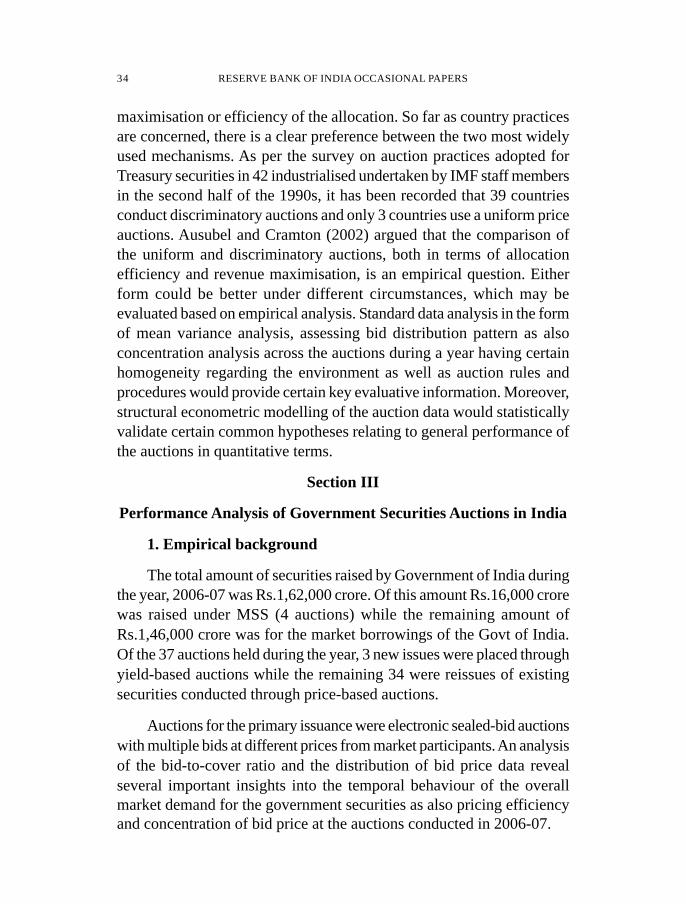
The total amount of securities raised by Government of India duringthe year, 2006-07 was Rs.1,62,000 crore. Of this amount Rs.16,000 crorewas raised under MSS (4 auctions) while the remaining amount ofRs.1,46,000 crore was for the market borrowings of the Govt of India.Of the 37 auctions held during the year, 3 new issues were placed throughyield-based auctions while the remaining 34 were reissues of existingsecurities conducted through price-based auctions.
Auctions for the primary issuance were electronic sealed-bid auctionswith multiple bids at different prices from market participants. An analysisof the bid-to-cover ratio and the distribution of bid price data revealseveral important insights into the temporal behaviour of the overallmarket demand for the government securities as also pricing efficiencyand concentration of bid price at the auctions conducted in 2006-07.

AUCTIONS OF GOVERNMENT SECURITIES IN INDIA – AN ANALYSIS 35
2. Behavioral pattern
2.1 Market demand: Demand for the government securities by themarket can be measured in terms of bid-to-cover ratio (BCR) defined astotal amount of bids received divided by the notified auction amount.The average BCR during 2006-07 was 2.36 as compared to 2.19 during2005-06. Out of 37 auctions, BCR was above 3.0 in three auctions (twoout of 29 auctions during 2005-06) showing higher demand comparedto previous year. Maximum market demand was 4.39 times to notifiedamount for MSS auction of Rs.2000 held on March 22, 2007. In theoverall average BCR is impacted predominantly by the liquidity scenarioand the interest rate expectations. The data on BCR reveal a discerniblepattern in the form of distinct quarterly cycles except a large swingwitnessed in the concluding part of the study year due to a couple ofmarket stabilization scheme (MSS) auctions.
Overall demand for government securities can be analysed in termsof (i) sectoral profile, (ii) demand-price relationship, (iii) effect of issuesize, and (iv) effect of tenure of security.
● Sectoral profile: The Primary Dealers have the obligation tounderwrite the entire auction issue after introduction of the FiscalResponsibility and Budget Management Act 2003 during 2006-
Bid Cover Ratio, 2006-07
1.00
1.50
2.00
2.50
3.00
3.50
4.00
4.50
5.00
Auction Date
Bid
Cover
Rat
io
10-A
pr-0
6
25-A
pr-0
6
04-M
ay-0
6
23-M
ay-0
6
06-Ju
ne-0
6
22-Ju
ne-0
6
11-Ju
ly-0
6
08-A
ug-0
6
18-A
ug-0
6
08-S
ep-0
6
13-O
ct-06
03-N
ov-0
6
24-N
ov-0
6
08-D
ec-06
25-Jan
-07
09-F
eb-0
7
09-M
ar-07
14-M
ar-07
28-M
ar-07
36 RESERVE BANK OF INDIA OCCASIONAL PAPERS
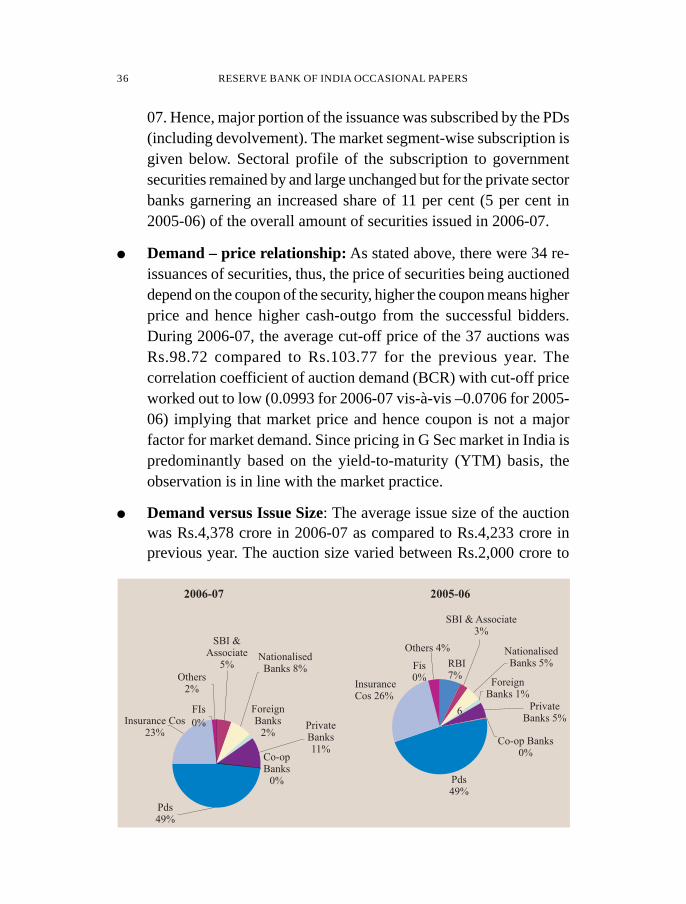
07. Hence, major portion of the issuance was subscribed by the PDs(including devolvement). The market segment-wise subscription isgiven below. Sectoral profile of the subscription to governmentsecurities remained by and large unchanged but for the private sectorbanks garnering an increased share of 11 per cent (5 per cent in2005-06) of the overall amount of securities issued in 2006-07.
● Demand – price relationship: As stated above, there were 34 re-issuances of securities, thus, the price of securities being auctioneddepend on the coupon of the security, higher the coupon means higherprice and hence higher cash-outgo from the successful bidders.During 2006-07, the average cut-off price of the 37 auctions wasRs.98.72 compared to Rs.103.77 for the previous year. Thecorrelation coefficient of auction demand (BCR) with cut-off priceworked out to low (0.0993 for 2006-07 vis-à-vis –0.0706 for 2005-06) implying that market price and hence coupon is not a majorfactor for market demand. Since pricing in G Sec market in India ispredominantly based on the yield-to-maturity (YTM) basis, theobservation is in line with the market practice.
● Demand versus Issue Size: The average issue size of the auctionwas Rs.4,378 crore in 2006-07 as compared to Rs.4,233 crore inprevious year. The auction size varied between Rs.2,000 crore to
2006-07
ForeignBanks
2%
Co-opBanks
0%
FIs
0%
Others2%
NationalisedBanks 8%
PrivateBanks11%
SBI &Associate
5%
Pds49%
2005-06
RBI7%
Pds49%
InsuranceCos 26%
Fis0%
NationalisedBanks 5%
PrivateBanks 5%
Co-op Banks0%
SBI & Associate3%
ForeignBanks 1%
Others 4%
6Insurance Cos
23%

AUCTIONS OF GOVERNMENT SECURITIES IN INDIA – AN ANALYSIS 37
Rs.6,000 crore. The Bid-to-Cover ratio showed a statisticallysignificant inverse relationship with issue-size (correlationcoefficient of –0.3968 in 2006-07 as compared to –0.2218 in 2005-06) i.e. the market demand is lower for larger issues.
● Demand versus Tenor: The tenor of the securities issued during2006-07 varied between 30 years to 2.02 years of residual maturity.The average maturity of the auction issues was 15.20 years in 2006-07 as compared to 17.63 years in 2005-06. Most of the issuancewas in the range upto 16 years of residual maturity and then in the
Bid-cover and Issue Price
0.00
1.00
2.00
3.00
4.00
5.00
84 86 88 90 92 94 96 98 100 102 104 106 108 110
Bid-Cover and Issue Size
1.00
1.50
2.00
2.50
3.00
3.50
4.00
4.50
1000 2000 3000 4000 5000 6000 7000
Size
Bid
-Cover
Rat
io
2006-07
38 RESERVE BANK OF INDIA OCCASIONAL PAPERS
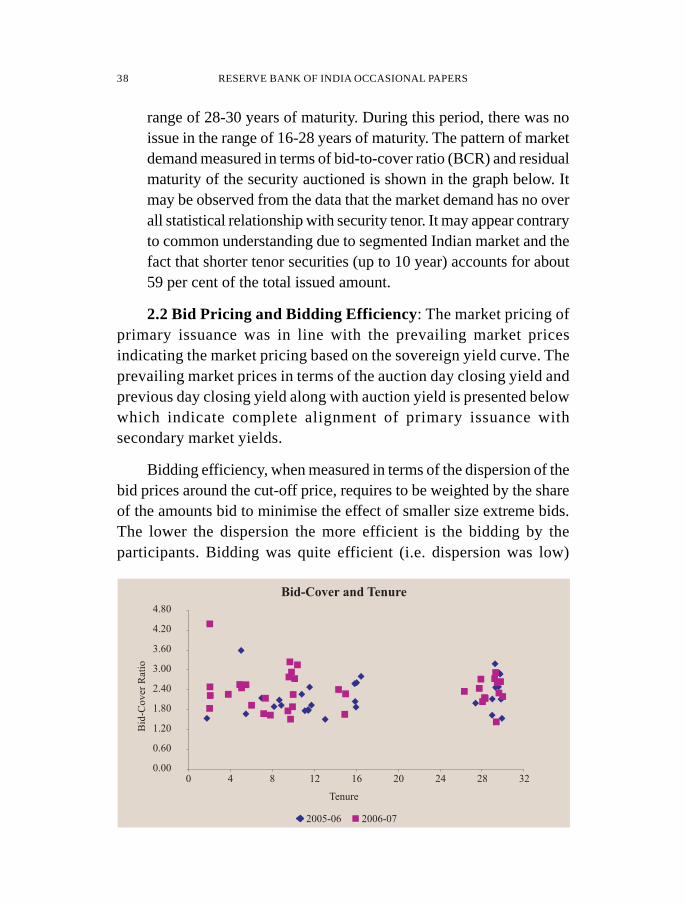
range of 28-30 years of maturity. During this period, there was noissue in the range of 16-28 years of maturity. The pattern of marketdemand measured in terms of bid-to-cover ratio (BCR) and residualmaturity of the security auctioned is shown in the graph below. Itmay be observed from the data that the market demand has no overall statistical relationship with security tenor. It may appear contraryto common understanding due to segmented Indian market and thefact that shorter tenor securities (up to 10 year) accounts for about59 per cent of the total issued amount.
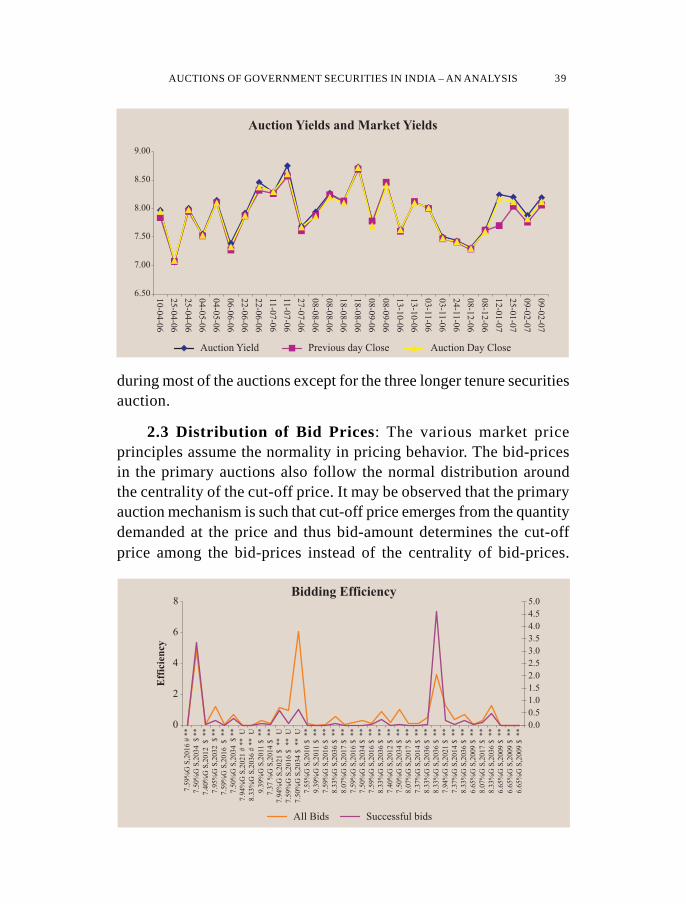
2.2 Bid Pricing and Bidding Efficiency: The market pricing ofprimary issuance was in line with the prevailing market pricesindicating the market pricing based on the sovereign yield curve. Theprevailing market prices in terms of the auction day closing yield andprevious day closing yield along with auction yield is presented belowwhich indicate complete alignment of primary issuance withsecondary market yields.
Bidding efficiency, when measured in terms of the dispersion of thebid prices around the cut-off price, requires to be weighted by the shareof the amounts bid to minimise the effect of smaller size extreme bids.The lower the dispersion the more efficient is the bidding by theparticipants. Bidding was quite efficient (i.e. dispersion was low)
Bid-Cover and Tenure
0.00
0.60
1.20
1.80
2.40
3.00
3.60
4.20
4.80
0 4 8 12 16 20 24 28 32
Tenure
Bid
-Cover
Rat
io
2005-06 2006-07
AUCTIONS OF GOVERNMENT SECURITIES IN INDIA – AN ANALYSIS 39
during most of the auctions except for the three longer tenure securitiesauction.
2.3 Distribution of Bid Prices: The various market priceprinciples assume the normality in pricing behavior. The bid-pricesin the primary auctions also follow the normal distribution aroundthe centrality of the cut-off price. It may be observed that the primaryauction mechanism is such that cut-off price emerges from the quantitydemanded at the price and thus bid-amount determines the cut-offprice among the bid-prices instead of the centrality of bid-prices.
Auction Yields and Market Yields
6.50
7.00
7.50
8.00
8.50
9.00
10-0
4-0
6
25-0
4-0
6
25-0
4-0
6
04-0
5-0
6
04-0
5-0
6
06-0
6-0
6
22-0
6-0
6
22-0
6-0
6
11
-07-0
6
11
-07-0
6
27-0
7-0
6
08-0
8-0
6
08-0
8-0
6
18-0
8-0
6
18-0
8-0
6
08-0
9-0
6
08-0
9-0
6
13-1
0-0
6
13-1
0-0
6
03-1
1-0
6
03-1
1-0
6
24-1
1-0
6
08-1
2-0
6
08-1
2-0
6
12-0
1-0
7
25-0
1-0
7
09-0
2-0
7
09-0
2-0
7
Auction Yield Previous day Close Auction Day Close
0
2
4
6
8
7.5
9%
GS
,2016
#**
7.5
0%
GS
,2034
$**
7.4
0%
GS
,2012
$**
7.9
5%
GS
,2032
$**
7.5
9%
GS
,2016
$**
7.5
0%
GS
,2034
$**
7.9
4%
GS
,2021
#**
U
8.3
3%
GS
,2036
#**
U
9.3
9%
GS
,2011
$**
7.3
7%
GS
,2014
$**
7.9
4%
GS
,2021
$**
U
7.5
9%
GS
,2016
$**
U
7.5
0%
GS
,2034
$**
U
7.5
5%
GS
,2010
$**
9.3
9%
GS
,2011
$**
7.5
9%
GS
,2016
$**
8.3
3%
GS
,2036
$**
8.0
7%
GS
,2017
$**
7.5
9%
GS
,2016
$**
7.5
0%
GS
,2034
$**
7.5
9%
GS
,2016
$**
8.3
3%
GS
,2036
$**
7.4
0%
GS
,2012
$**
7.5
0%
GS
,2034
$**
8.0
7%
GS
,2017
$**
7.3
7%
GS
,2014
$**
8.3
3%
GS
,2036
$**
8.3
3%
GS
,2036
$**
7.9
4%
GS
,2021
$**
7.3
7%
GS
,2014
$**
8.3
3%
GS
,2036
$**
6.6
5%
GS
,2009
$**
8.0
7%
GS
,2017
$**
8.3
3%
GS
,2036
$**
6.6
5%
GS
,2009
$**
6.6
5%
GS
,2009
$**
6.6
5%
GS
,2009
$**
Eff
icie
ncy
0.0
0.5
1.0
1.5
2.0
2.5
3.0
3.5
4.0
4.5
5.0Bidding Efficiency
All Bids Successful bids

40 RESERVE BANK OF INDIA OCCASIONAL PAPERS
Following chart presents the deviations of various measures ofcentrality of bid-prices like simple average, median and modal pricesfrom the cut-off price. It may be observed from the chart that bid-price distribution is quite symmetrical with average, median andmodal bid prices being close to each other in all the auctions. It maybe noted here that average, median and modal bid-prices have beencalculated without any weight to bid amount; all market participants’bid pricing is assumed to be equally likely.
The closeness of cut-off price to the average bid-price shows thecentrality of the market pricing in the auction process. This trend alongwith the closeness in secondary market prices reinforces the price-discovery mechanism of auction process. There were few deviations onaccount of devolvement (auction of 7.59%GS2016 & 7.50%GS2034)when cut-off price was higher than the central bid price. Similarly, auctionof 8.33%GS2036 witnessed higher average bid price than the cut-offprice as bid-cover ratio was lower at 1.43 for this issue for lower marketdemand and thus putting cut-off price lower than the average bid price.The skewness and kurtosis for each auction are also computed (Statement-1), which shows that the pricing behavior follows, by and large, a bell-shaped normal distribution.
2.4 Concentration of Bid Price: Concentration of bid price has
Difference of Average, Median and Modal Price from Cut-Off Price
-2.00
-1.50
-1.00
-0.50
0.00
0.50
1.00
1.50
2.00
2.50
7.5
0%
GS
2034
7.9
5%
G.S
2032
7.4
0%
G.S
.2012
7.5
9%
GS
2016
7.5
0%
GS
2034
9.3
9%
G.S
.2011
7.3
7%
G.S
.2014
7.9
4%
GS
2021
7.5
9%
GS
2016
7.5
0%
GS
2034
7.5
5%
G.S
.2010
7.5
9%
GS
2016
9.3
9%
G.S
.2011
8.0
7%
GS
2017
8.3
3%
GS
2036
7.5
0%
GS
2034
7.5
9%
GS
2016
7.5
9%
GS
2016
8.3
3%
GS
2036
7.4
0%
G.S
.2012
7.5
0%
GS
2034
8.0
7%
GS
2017
7.3
7%
G.S
.2014
8.3
3%
GS
2036
8.3
3%
GS
2036
7.9
4%
GS
2021
7.3
7%
G.S
.2014
8.3
3%
GS
2036
8.0
7%
GS
2017
8.3
3%
GS
2036
6.6
5%
G.S
.2009
6.6
5%
G.S
.2009
6.6
5%
G.S
.2009
6.6
5%
G.S
.2009
Avg-CutOff Median-CutOff Mode-CutOff Stdv PRCE

AUCTIONS OF GOVERNMENT SECURITIES IN INDIA – AN ANALYSIS 41
been measured by the Herfindahl index (op cit RBI Annual Report, 2002-03) of bid prices multiplied by the total number of bids. This is an indicatorof the uniformity of market expectation. Higher the concentration of bidprices more is the uniformity of price/yield expectation of the bidders.Higher concentration around the expected cut-off price/yield is, therefore,more desirable. This measure has generally been high implying reasonableconcentration of bid prices at auctions, which tallies with the observationof efficient bidding for most part of the year. Concentration of bid pricehas been found to be following the trend in BCR, indicating that whenmarket demand is high market also has a reasonably uniform view onbond yields.
2.5. Investor group-wise analysis: The investors participating inthe primary auctions may be categorised into 11 groups for studyingthe investor group-wise bidding behavior namely primary dealers,insurance companies, nationalised banks, State Bank of India and itsAssociates (SBI group), new private sector banks, other private sectorbanks, foreign banks, co-operative banks, mutual funds, other financialinstitutions and individuals. Of these, the last two categories of investorsnamely other financial institutions and individuals had participated infew auctions and thus the data analysis is confined to the major nineinvestor groups.
0
2
4
6
8
10
12
14
7.5
9%
G7.5
0%
G7.4
0%
G7.9
5%
G7.5
9%
G7.5
0%
G7.9
4%
G8.3
3%
G9.3
9%
G7.3
7%
G7.9
4%
G7.5
9%
G7.5
0%
G7.5
5%
G9.3
9%
G7.5
9%
G8.3
3%
G8.0
7%
G7.5
9%
G7.5
0%
G7.5
9%
G8.3
3%
G7.4
0%
G7.5
0%
G8.0
7%
G7.3
7%
G8.3
3%
G8.3
3%
G7.9
4%
G7.3
7%
G8.3
3%
G6.6
5%
G8.0
7%
G8.3
3%
G6.6
5%
G6.6
5%
G6.6
5%
G
0
1
2
3
4
5
Bid Price concentration Bid-to-Cover ratio
Bid-to-Cover ratio and Concentration of Bid Prices
42 RESERVE BANK OF INDIA OCCASIONAL PAPERS
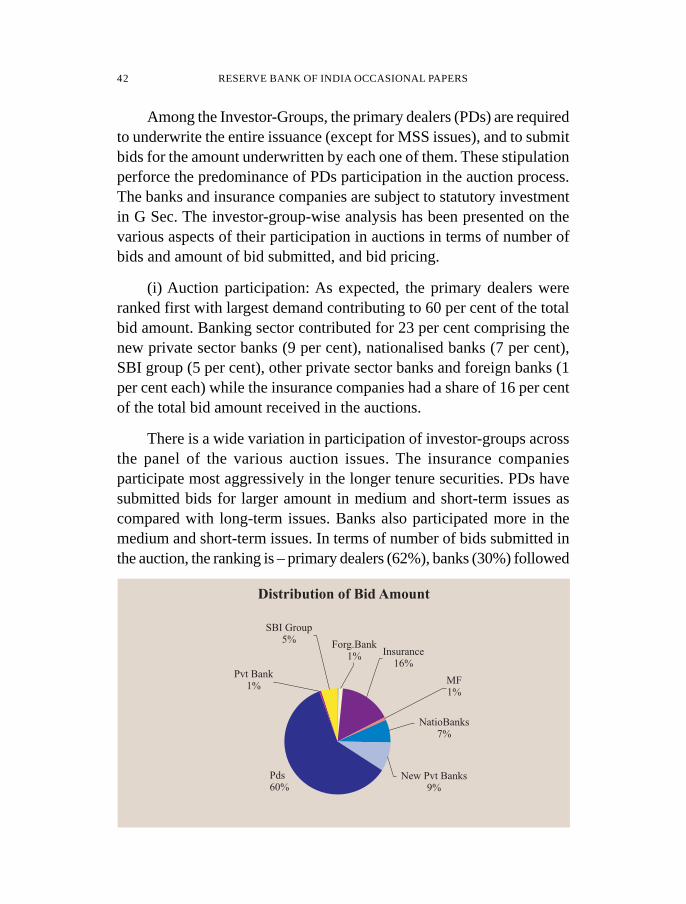
Among the Investor-Groups, the primary dealers (PDs) are requiredto underwrite the entire issuance (except for MSS issues), and to submitbids for the amount underwritten by each one of them. These stipulationperforce the predominance of PDs participation in the auction process.The banks and insurance companies are subject to statutory investmentin G Sec. The investor-group-wise analysis has been presented on thevarious aspects of their participation in auctions in terms of number ofbids and amount of bid submitted, and bid pricing.
(i) Auction participation: As expected, the primary dealers wereranked first with largest demand contributing to 60 per cent of the totalbid amount. Banking sector contributed for 23 per cent comprising thenew private sector banks (9 per cent), nationalised banks (7 per cent),SBI group (5 per cent), other private sector banks and foreign banks (1per cent each) while the insurance companies had a share of 16 per centof the total bid amount received in the auctions.
There is a wide variation in participation of investor-groups acrossthe panel of the various auction issues. The insurance companiesparticipate most aggressively in the longer tenure securities. PDs havesubmitted bids for larger amount in medium and short-term issues ascompared with long-term issues. Banks also participated more in themedium and short-term issues. In terms of number of bids submitted inthe auction, the ranking is – primary dealers (62%), banks (30%) followed
Distribution of Bid Amount
Pds60%
MF1%
SBI Group5%
Forg.Bank1%
Pvt Bank1%
Insurance16%
NatioBanks7%
New Pvt Banks9%

AUCTIONS OF GOVERNMENT SECURITIES IN INDIA – AN ANALYSIS 43
by mutual funds (4 per cent) and insurance companies (2 per cent). Inall, 7,078 bids were received in the 37 auctions during the year of which4,344 bids were submitted by primary dealers, 883 bids by nationalisedbanks, 597 by new private sector banks, 319 by SBI group, 267 bids bymutual funds, 153 bids by insurance companies.
(ii) Bid pricing: The bid pricing by investors is by and large guidedby the yield curve; however, the individual pricing would also beinfluenced by the desire to get allotment in the auction. The bid pricingof investors like banks and insurance companies having statutoryrequirement on investment in government securities, with hold-to-maturity orientation, could be different from bid pricing of primary dealerswho mainly acquires the stock in primary issues for later sale in thesecondary market. In such a scenario, it is most likely that the primarydealers may be pricing their bids keeping near short-term movement ofyield-curve whereas insurance companies would be pricing their bids inview of longer-term expectation of the yield-curve movement.
The investor-group-wise bid pricing behavior has been analysedfor two aspects viz. within group variance in bid price indicating theuniformity of pricing, and difference between the cut-off price and theaverage bid-price in each of the auction. The investor-group-wise variancein bid prices presented in the annexed table shows the uniformity withinthe investors of a group giving similar considerations in bid pricing. Formeasuring the aggressiveness in auction biding, the average of differencefrom cut-off price (bid price – cut-off price) is analysed for each of theinvestor-group in each auction (Statement-2.). It shows clearly that theinsurance companies are bidding aggressively in the longer-tenuresecurities’ auctions having average bid price higher than the cut-off price.On the other hand, primary dealers are very competitive in their bid pricingfor short and medium term securities auctions. The nationalised bankshave the smallest overall difference in the auction bidding.
(iii) Success ratio: The aggressive bid pricing by an investor-groupin the auction of security can be measured in terms of success ratio(amount allocated as percentage to bid amount). The auction-wise successratio of various investor-groups is presented in the Statement-3.

44 RESERVE BANK OF INDIA OCCASIONAL PAPERS
It shows that the insurance companies have achieved a success ratioof hundred percent in nine auctions, - the highest among all the investorgroups. Overall, the insurance companies have the highest success ratioindicating that their bid pricing is comparatively driven by desire to getallotment as compared with other investor groups. SBI group and themutual funds have achieved the success ratio of hundred percent in fourauctions. In terms of the overall success ratio, the ranking is: insurancecompanies (65 per cent), foreign banks and new private sector banks (54per cent each), nationalised banks (50 per cent), SBI group (47 per cent),private sector banks (35 per cent), mutual funds (35 per cent), primarydealers (33per cent) and co-operative banks (23 per cent).
The primary dealers have quite lower success ratio of 33 per centamong the investor-groups because of the compulsion on bidding amount(they are required to underwrite the full amount and the bid amount cannot be lower than the underwriting amount). As a result, bidding of theprimary dealers in some of the auctions of longer tenure is quite negative.In twelve auctions, the primary dealers have success ratio of less than 20per cent, of which, five auctions have success ratios even less than 10per cent.
Section IV
Bid Pricing Strategy – Empirical Model
For understanding the bid pricing behavior of the participants in theauctions of government securities, it is important to focus on the variable‘distance of bid price from cut-off price’ (i.e., bid price – cut-off price)to analyze the pricing strategy across various auctions. For this analysis,the price-based auctions have been considered.
The seminal studies of Nyborg et al (2002), and Hortacsu (2002,2006) have observed the bid-shading in multiple-price auctions tominimise the ‘winners-curse’, i.e. bidders would like to reduce the bidsize (bid amount) for prices which are more likely to get accepted. Thebids above the cut-off price are accepted in the auction. Thus, bid size isone of the important variables to explain the bid pricing strategy. Thenext variable included in the model is market demand for the auction.

AUCTIONS OF GOVERNMENT SECURITIES IN INDIA – AN ANALYSIS 45
The market demand is measured in terms of bid-cover ratio for theauction. It is expected that higher market demand would induce aggressivebidding strategy of higher bid pricing. The securities auctioned are ofvarying maturities and it is expected that longer tenor securities wouldwitness less aggressive pricing as longer duration securities have highermarket-risk. Further, investor-group-wise behavior is also important tobid-pricing strategy as the primary dealers have the obligation ofunderwriting and also their role is mainly of intermediary to get securitiesin auction and later sale in secondary market. In order to measure thesignificance of market makers like primary dealers bid-pricing, a dummyvariable is introduced in the model to capture the bid pricing strategy ofthe primary dealers. On the other hand, insurance companies haveregulatory requirement for investment in the government securities fortheir long-term life-policies in view of India’s ‘population dividend’. Asobserved by Hortacsu (2002, 2006) in Turkish Treasury auctions, andthe preliminary data analysis presented in the previous section alsoindicated a distinct bid-pricing strategy of ling-term investor likeinsurance companies in the auctions. Thus, a dummy variable is includedin the model for insurance companies. Thus, the model is:
DEVCUTOFF = a0+ a1 BIDSIZE + a2 BIDCOVER + a3 TENOR
+ a4 DUMMYPD + a5 DUMMYINS
where DEVCUTOFF = deviation from cut-off price (bid price –cut-off price) of the i-th bid in the j-th auction; BIDSIZE = amount bidedat price in i-th bid; BIDCOVER = Bid-Cover ratio (i.e. total bid amountto the notified amount of the j-th auction; TENOR = tenure of securityfor which bid is placed in the j-th auction; DUMMYPD = 1 if bid belongsto a primary dealer, 0 otherwise; DUMMYINS = 1 if bid belongs to aninsurance company, 0 otherwise.
The ordinary least square estimates of the regression equation ispresented in Table 1 for four scenarios. The above results shows thatmost of the coefficients have the expected sign and are significant. TheR-squared values are low but comparable for such large hetero-scedasticand multi-modal distributed discrete data. Estimates are similar to thoseobtained for other countries’ studies (Nyborg et al, 2002).

46 RESERVE BANK OF INDIA OCCASIONAL PAPERS
As expected, the coefficient of bid size is of negative sign withstatistically significant t-value. The aggressively priced bids are of lowerbid size in the government securities auctions. Indian bidders are shadingtheir bid amount for higher priced bids to minimise their winners-cursein the auctions. However, the coefficient for bid size is positive butinsignificant for the auctions of very short tenor securities under MSSauctions. This observation can be interpreted as negligible ‘winners-curse’due to less market risk for short-tenor securities. The short tenor securities’price would be less volatile in case of sovereign yield curve movementand thus it has opposite sign as compared to securities auctioned undernormal market borrowing having larger tenor.
The bid-cover ratio representing market demand for the auctionedsecurity is observed to have significantly negative coefficient in all typesof the auctions. The bid pricing strategy of bidders in India is to havelarger market demand with less aggressive pricing. The tenor of thesecurity auctioned is also having statistically significant negativecoefficient (except for the longer tenor auctions). As expected, the bidderspricing would become conservative (lower prices) with increase in the
Table 1: Estimation Results
All Auctions Auctions Longer Tenor MSS Auctions(excl. MSS Auctions of Short-tenor
auctions) (tenor>20 yrs) (tenor<3yrs)
1 2 3 4 5
Constant 0.477 0.659 -3.149 2.043(12.08)** (13.48)** (4.74)** (5.42)**
Bid Size -0.231x10⁻³ -0.253 x10⁻³ -0.585 x10⁻³ 0.039 x10⁻³
(2.86)** (2.89)** (2.90)** (0.69)Bid cover -0.176 -0.257 -1.060 -0.039
(12.09)** (13.65)** (16.89)** (8.50)**Tenor -0.010 -0.009 0.200 -0.959
(11.90)** (9.07)** (8.58)** (5.26)**DummyPD -0.132 -0.151 -0.452 -0.013
(7.62)** (7.89)** (8.52)** (1.38)DummyIns 0.247 0.244 0.405 NA
(3.87)** (3.63)** (2.45)*No. of observations 6613 5958 1791 655R-squared 0.06 0.06 0.18 0.12F- Statistics 78.78 77.56 78.99 21.36\(Figures in parentheses are t-statistics - ** significant at 1 % level, * significant at 5% level)

AUCTIONS OF GOVERNMENT SECURITIES IN INDIA – AN ANALYSIS 47
tenor of security auctioned as the fall in the market prices increases withtenor for given rise in yield curve.
For analysing the investor-group’s bidding behavior, two dummyvariables have been included in the model for the two dominant investor-groups namely the primary dealers (DUMMYPD) and the insurancecompanies (DUMMYINS). The sign of the coefficient of ‘ DUMMYPD’observed to be negative indicating the low pricing in bidding strategy ofthe primary dealers. As expected, it is statistically significant in thegovernment borrowing auctions because the primary dealers have theunderwriting obligation and consequent bidding commitments. Primarydealers are necessarily required to submit bids for the amountunderwritten by them and thus low bid pricing strategy along withdownward sloping bid demand is adopted to minimise their ‘winnerscurse’. The dummy becomes insignificant in the monetary stabilizationscheme (MSS) auctions where the primary dealers have no underwritingand bidding commitments. This result has an important policyimplication. There are some countries where primary dealers haveexclusive bidding rights. If such exclusive right is provided in India, thebidding strategy of the primary dealers would result in increasedborrowing cost to the government.
On the other hand, the investor group of the insurance companiesviews their investments in government securities with differentperspective. Insurance companies are mostly held-to-maturity investorsrather than active traders of the government securities and thus theirpricing strategy have to be different than the primary dealers who aremainly active traders. Accordingly, the coefficient of the dummy variable(DUMMYINS) is significantly positive. Insurance Companies have notparticipated in the short tenor MSS auctions.
Section V
Empirical Findings and Results - Summary and Conclusion
The market response to the primary auctions was better in 2006-07as compared with 2005-06. The market demand reveals a discerniblepattern having quarterly cycles with deviation in the concluding part of
48 RESERVE BANK OF INDIA OCCASIONAL PAPERS
the financial year with couple of MSS issuances. The primary dealerswith underwriting obligation for entire issuance has subscribed to themajor portion of issuance. The coupon rate or price of the security beingauctioned is found to be insignificant factor for market demand as themarket is based on yield-to-maturity and not the price.
The market demand has statistically significant inverse relationshipwith issue size. The residual maturity or tenor of the security beingauctioned does not show any statistical relationship with market demand.This aspect could be explained in terms of complimentary demand frombanking and insurance sectors for short-medium and longer maturitysecurities, respectively. The primary dealers act mainly as intermediaryfor primary issuance and not the ultimate investors.
The auction yields are in alignment with secondary market yields.Bidding was quite efficient with low dispersion and high concentrationof bids around the cut-off price reflecting a fair amount of transparentmarket.
Investor-group-wise variance in bid prices shows the intra-groupuniformity giving similar considerations in bid pricing. There is widevariation in participation of investor-groups among various auction issues.The insurance companies participate more in longer tenor securities thanthe short-term securities. The primary dealers had submitted bids forlarger amount in the medium and short-term issues as compared withthe long-term issues. Banks also participated more in the medium andshort-term issues.
The bid pricing of the investors like banks and insurance companies,who are held-to-maturity type of investors with statutory requirement,found to be different from bid pricing of the primary dealers who mainlyacquires the stock in primary issues for later sale in secondary market.The insurance companies are found to be bidding aggressively in thelonger-tenure securities’ auctions with average bid price being higherthan the cut-off price.
Different investor groups show their distinct levels of aggressivenessin bid pricing as reflected in their overall success ratios: insurance

AUCTIONS OF GOVERNMENT SECURITIES IN INDIA – AN ANALYSIS 49
companies with 65 per cent, foreign banks and new private sector bankswith 54 per cent each, nationalised banks with 50 per cent, SBI groupwith 47 per cent, private sector banks and mutual funds with 35 per centeach, primary dealers with 33 per cent and co-operative banks with 23per cent.
Analysis of the bidding behavior for the Indian government securitiesauctions shows that generally bidders pricing strategy is negativelyinfluenced by the bid size, bid cover ratio and tenor of the security. Indianbidders are reducing their bid amount for higher priced bids to minimisetheir winners-curse in the auctions. However, for the auctions of veryshort tenor securities under the auctions of securities issued under MSS,the coefficient is positive but insignificant unlike the other auctions. Ingeneral, the conservative bid pricing strategy increases with the tenor ofsecurity and also with the market demand. The investor-group dummyvariables for the primary dealers and the insurance companies wereobserved to be significant with opposite signs. Primary dealers have theobligations and bidding commitment and thus adopt a conservativepricing strategy to minimise their winners curse. On the other hand,insurance companies adopt a strategy of relatively more aggressivebidding as they like to hold the securities till maturity. Statisticallysignificant difference in bid pricing strategies of the two investor-groupsin auctions in India indicates the private-value case of GoI dated securitiesauction unlike the commonly perceived common-value case ofgovernment securities auctions.
To condude, the present study provides an insight to the biddingstrategy in the auctions of government securities in India. The largefinancing of the Central Government deficit is being raised through theprimary auctions without the recourse to monetisation. The marketresponse to the primary auctions of government securities has been verygood and the bidding has been observed to be quite efficient. The cut-offprices emerged in the auctions were in line with the centrality of marketexpectations and bid pricing observed to follow normal bell shapeddistribution around the cut-off prices. The diversified investor base hasensured the spread of maturity profile of government securities. Variousinvestor-groups participating in the primary auctions have not only

50 RESERVE BANK OF INDIA OCCASIONAL PAPERS
ensured good demand for auctioned securities of various tenors but alsoimparted a fair degree of competitiveness in the auctions. The bid pricingstrategies in auctions in India also confirm the bid-shading behavior ofbidders to minimize their ‘winners-curse’ as observed in other countries.The bid-pricing strategies adopted by ‘market-maker’ investors viz.primary dealers observed to differ significantly than the pricing of buyand hold investors, e.g. insurance companies. The observed differencein the two pricing approaches indicates that while former follows‘common-value’ case having market price movement in mind and latterfollow ‘private-value’ case with long term price in mind.
References
Aryal, J, D. Kulasiri, and G. A. Carnaby (2007): “Auction Theory:Bidder’s Perspective in an English Auction Environment”, Proceedingsof World Academy of Science, Engineering and Technology, Volume 26.Athey, S, and Philip A. Haile (2006): “Empirical Models of Auctions”,NBER Working Paper 12126 (March 2006).Ausubel, L.M and P. Cramton (2002): “Demand reduction andinefficiency in multi-unit auctions”, Mimeo, University of Maryland.Ausubel, L.M. (2004): “An efficient ascending bid auction for multipleobjects”; American Economic Review 94(5).Back, K. and J.F. Zender (1993): “Auctions of divisible goods: On therationale for the treasury experiment”, Review of Financial Studies 6.Cammack, Elizabeth B. (1991): “Evidence on Bidding Strategies andthe Information in Treasury Bill Auctions”, The Journal of PoliticalEconomy, Vol.99, No.1 (Feb. 1991).Elsinger, H. and Christine Zulehner (2007): “Bidding behavior in AustrianTreasury bond auctions”. Monetary Policy & the Economy,Oesterreichische Nationalbank (Q2/2007).Garbade, Kenneth D. (2004): “The Institutionalization of Treasury Noteand Bond Auctions, 1970-75”, FRBNY Economic Policy Review, FederalReserve Bank, May 2004.Hendricks, K., and R.H. Porter (1988): “An Empirical Study of an Auctionwith Asymmetric Information”, American Economic Review, 78, 865-883.
AUCTIONS OF GOVERNMENT SECURITIES IN INDIA – AN ANALYSIS 51
Hortacsu, A. (2002): “Bidding behavior in divisible goods auctions:theory and evidence from Turkish treasury auction market”. Mimeo.Hortacsu, A. (2006): “Mechanism Choice and Strategic Bidding inDivisible Good Auctions: An Empirical Analysis of the Turkish TreasuryAuction Market”, Working Paper, University of Chicago.Hortacsu, A. (2008): “Testing for Common Values in Canadian TreasuryBill Markets”.Kastl, Jakub (2008): “Discrete Bids and Empirical Inference in DivisibleGood Auctions”, Stanford Economics, Research Paper presented At theCzech Republic’s Center for Economic Research & Graduate Education(CERGE-EI), Stanford University.Keloharju, M., K.G.Nyborg and K. Rydqvist (2005): “Strategic Behaviorand Underpricing in Uniform Price Auctions: Evidence from FinnishTreasury Auctions”, The Journal of Finance, Vol. IX, No. 4 (August2005).Klemperer, P (2004): Auctions: Theory and Practice, Princeton UniversityPress.Krishna, V. (2002): Auction Theory, Academic Press.Laffont, Jean-Jacques, Herve Ossard, and Quang Vuong (1995):“Econometrics of First-price Auctions”, Econometrica, Vo. 63, No. 4(July 1995).Maskin, Eric (2004): “The Unity of Auction Theory: Milgrom’sMasterclass”, Journal of Economic Literature, Vol. XVII (December2004).Milgrom, Paul R. and Robert J. Weber (1982): “A Theory of Auctionsand Competitive Bidding”, Econometrica, Vol.50, No. 5 (September1982).Milgrom, Paul R. (1989): “Auctions and Bidding: A Primer”, Journal ofEconomic Perspectives, Vol.3 No.3 (Summer 1989).Milgrom, Paul R. (2004): Putting Auction Theory to Work, CambridgeUniversity Press.Myerson, R. (1981): “Optimal Auction Design”, Mathematics ofOperations Research, Vol.6, No.1 (February 1981).

52 RESERVE BANK OF INDIA OCCASIONAL PAPERS
Nyborg, K.G., K. Rydqvist K, and S. M. Sundaresan (2002): “Bidderbehavior in multiunit auctions: Evidence from Swedish treasuryauctions”; Journal of Political Economy 110(2).
Paarsch, Harry J. and Hang Hong (2006): An Introduction to the StructuralEcononometrics of Auction Data, The MIT Press.
Nyborg, K.G., U. Bindseil and Ilya A. Strebulaev (2002, 2005): “Biddingand Performance in Repo Auctions: Evidence from ECB Open MarketOperations”, Working Paper No. 157, European Central Bank (July 2002),Revised version published as FEEM working paper from StanfordGraduate School of Business (July 2005).
RBI Annual Report (2002-03): Bidding Pattern in Auctions ofGovernment of India Securities 2002-03, Box XI.1 (Chapter XI – PublicDebt Management), Annual Report 2002-03, Reserve Bank of India.
Riley, John G and William F. Samuelson (1981): “Optimal Auctions”,American Economic Review 71, June 1981.
Sundaresan, S (1994): “An empirical analysis of US treasury auctions:Implications for auction and term structure theories”. Journal of FixedIncome.
Vickrey, W. (1961): “Counterspeculation, auctions and competitive sealedtenders”. Journal of Finance 16.
Warsh, D (ed.) (2006): “When Auction Theory Was Put to Work”,available at http://www.economicprincipals.com/, An independentweekly.

AUCTIONS OF GOVERNMENT SECURITIES IN INDIA – AN ANALYSIS 53
Annex
1. Auction designs and rules: There are different ways to classifyauctions. There are open auctions as well as sealed-bid auctions. Besides,bid prices could be put in ascending format (e.g., auctions under hammerin the English style) or the bids are allowed to drop downwards (e.g.,Holland’s flower market). Experts mostly agree on four major auctiontypes of one-sided auctions (bids are as per one-sided sale design, notthe “asks” as in the case of double-sided market design. These arecommonly termed as English, Dutch, First-Price sealed-bid, and Vickrey(uniform second-price) auctions.
Common Auction Designs
Open Bid Sealed Bid
English Dutch First-price Second-priceAuctions Auctions Auctions Auctions
Second-price auction format, which was invented by WilliamVickrey (1961), does not find much real-life application, but its formsand contents are of central theoretical importance. First price auctionsare commonly used for selling mineral rights and Treasury securities.English auctions (open outcry or oral bid system) are mostly used forselling art, used cars etc. and Dutch auctions are used to sell flowers inHolland. One difficulty is the lack of commonality in naming conventions.What some people call a uniform second-price auction is known infinancial communities as a Dutch auction, and no end of confusion results.
The Vickrey auction and other traditional formats like single roundsealed bid auction started evolving out in the early nineties, when auctiontheory was put to work in various challenging areas using hybrid formatscombining both the traditional and newly established design likeascending bid mechanism. Ascending bid auction (English variety) helpsprovide the bidders with more information achieving thereby gain inefficiency over single round sealed-bid auctions, which are generallyused by the central governments like the US Federal Government

54 RESERVE BANK OF INDIA OCCASIONAL PAPERS
especially for the sale of high-value rights such as off-shore oil and gasleases.
Initial developments in the auction theories were on modelling theauctions of a single indivisible object to one of several risk- neutralbidders with independent private value properties. This is the classiccase where the seller holds an auction because seller’s information aboutthe possible buyers with a varied value sense is imperfect and the sellerlikes to extract the best possible price for the object. And the abovecommon formats were the alternative versions of conducting the actualauction.
The common auction rules are as under:
Type Rules(i) English, or ascending-price Seller announces reserve price
or some low opening bid.Bidding increases progressivelyuntil demand falls. Winningbidder pays highest valuation.Bidder may re-assess evaluationduring auction.
(ii) Dutch, or descending-price Seller announces very highopening bid. Bid is loweredprogressively until demandrises to match supply.
(iii) First-price, sealed bid. Bids submitted in written form(Known as discriminatory with no knowledge of bids ofauction in case of multiunit others. Winner pays the exactauctions). amount he bid.
(iv) Second-price, sealed bid or, Bids submitted in written formVickrey auction. (Known as with no knowledge of the bidscompetitive or stop-out price of others. Winner pays theauction in multi-unit auctions. second-highest amount bid.
2. Winner’s curse: Widely recognised as being that phenomenon whena “lucky” winner pays more for an item than it is worth. Auction winners
AUCTIONS OF GOVERNMENT SECURITIES IN INDIA – AN ANALYSIS 55
are faced with the sudden realization that their valuation of an object ishigher as other participants estimated a lower market value for the item.One may appear to have won but actually end up with losing moneybecause profits decrease (akin to Pyrrhic victory with devastating cost tothe victor). The winner is the bidder who made the largest positive errorin his valuation. The losers lose the item, but not any money. Anyonewinning a bid against experts should wonder why the experts bid less. Inauctions in which no bidder is sure of the worth of the good beingauctioned, the winner is the bidder who made the highest guess. If biddershave reasonable information about the worth of the item, then the averageof all the guesses is likely to be correct. The winner, however, offeredthe bid furthest from the actual value.Since most auctions involve atleast some amount of common value, and some degree of uncertaintyabout that common value, the winner’s curse is an important phenomenon.
In the 1950s, when the term winner’s curse was first coined, therewas no accurate method to estimate the potential value of an offshoreMexican oil field. For example, an oil field had an actual intrinsic valueof $10 million, oil companies might guess its value to be anywhere from$5 million to $20 million. The company who wrongly estimated at $20million and placed a bid at that level would win the auction, and laterfind that it was not worth as much. Other commonly cited instances ofauctions where the winner’s curse is significant are:
a. Spectrum auctions in which companies bid on licenses to useportions of the electromagnetic spectrum. Here, the uncertaintywould come from, for example, estimating the value of the cellphone market in New York City.
b. IPOs, in which bidders need to estimate what the market valueof a company’s stock will be.
c. Pay per click advertising online, in which advertisers gain higherranking if they bid higher amounts per click from a searchengine user.
3. Winner’s curse vis-à-vis bid shading: The winner’s curse is aprobable phenomenon that could occur in common value auctions with
56 RESERVE BANK OF INDIA OCCASIONAL PAPERS
incomplete information whereby the winner will tend to overpay.However, an actual overpayment will generally occur only if the winnerfails to account for the winner’s curse when bidding. Despite its dire-sounding name, the winner’s curse does not necessarily have ill effects.Bidders have only estimates of the value of the good. If, on average,bidders are estimating correctly, the highest bid will tend to have beenplaced by someone who overestimated the good’s value. This is anexample of adverse selection very similar to the classic “lemons” exampleof Akerlof. Rational bidders will anticipate the adverse selection so thateven though their information will still turn out to have been overlyoptimistic when they win, they do not pay too much on average. Savvybidders avoid the winner’s curse by bid shading, or placing a bid that isbelow their ex-ante estimation of the value of the item for sale but equalto their ex-post belief about the value of the item, given that they win theauction. The key point is that winning the auction is bad news about thevalue of the item for the winner if he/she was the most optimistic andothers are correct in their average ex-post estimations. Therefore savvybidders revise ex-ante estimations downwards to take account of thiseffect in multi-unit auctions.
4. Auction Format: The core of any auction design is the art of buildingup best price discovery mechanism. It is intrinsically linked withstructuring the process of bid submission known as auction format. Thecommon auction formats are: (i) Live-bid auction is just the mostcommonly perceived format. It is typically a public event held wherebidders and spectators assemble together. (ii) Two-bid auction includesa written pre-auction bid followed by a live auction. The auction is thenrestricted event including only those bidders that submitted a pre-auctionwritten bid. Often the bidding is further restricted to include live biddingfrom only the top five or three pre-auction bidders. This two-bid auctionsystem is used most often when selling items of special value such asexceptional residential building, significant asset like a turnkey businesspackage or systemically valued financial assets. (iii) In on-line bidauctions, Auction Service providers in the US have invested thousandsof dollars and experimented extensively with offering and selling realestate on-line. Internet has provided significant marketing

AUCTIONS OF GOVERNMENT SECURITIES IN INDIA – AN ANALYSIS 57
advantages. (iv) Sealed/ Tender Bid auction format is used when dealingwith complicated commercial sell and purchases of multi-unit/components items like composite housing estates, large tract mineralrights transactions or Treasury securities where specific terms for thepurchase are not all pre-determined by the Seller. Buyers do have roomto negotiate the terms of the purchase of the property, whereas the selleris provided an opportunity to potentially receive a higher price. (v) Openbid format is the new avatar of live bid or the classical outcry system ofprice discovery mechanism. (v) Fax bid auction process, developed in1997, is most often utilised in the US and Canada when dealing withvery high value commercial or multi-family properties.
5. Auction’s capabilities and inherent limitations: Suitability of anauction format depends on the nature of dominantly embedded valueconsideration for the object. Value uncertainty or more specifically,information asymmetry is a key feature of auction. In an auction, eachbidder is assumed to make rational bidding based on his assessment onvalue consideration. Following are the two important valuationspecifications:
a. Private Value - When an object is wanted for personalconsumption and a bidder has no primary motive to resell. The bidder ismotivated to pay up to a certain maximum, independent of valuationsmade by others. Art bought for personal pleasure is an example. A privatevaluation is a subjective decision. It is private in that one bidder does notknow another’s value. Sometimes it is possible to infer this informationby observing other bidders. Private value objects have the features like:(i) No bidder knows fully other bidders’ value content, each bidder keepsthe full value sense strictly as private information, (ii) Knowledge offew bidders’ valuation does not affect how much the object is worth to aparticular bidder, (iii) It is not applicable in case the asset or the objecthas an active resale market. (exact value is derived only on its fullconsumption by any sole bidder as in the case of, say, paintings, stampsand antics).
b. Common Value - Objects acquired primarily for profitable resalein secondary markets. Individual bids not predicated only on personal

58 RESERVE BANK OF INDIA OCCASIONAL PAPERS
valuation but also on valuation of prospective buyers. Each bidder triesto estimate value of an object using the same measurements. Each onetries to estimate object’s ultimate worth using same standard. Art boughtfor resale is an example. Common value objects have some specificfeatures, namely : (i) Actual value is same but not known. (ii) Biddershave different private information about the common value. Availableinformation, called as private signal or a view, could be an expert estimatecorrelated with the value that is going to emerge finally; further add onrelative value estimate could be attached by individual bidders. Exactvalue, as it were, derived from a process with interdependent values.(iii) Common value is a special case of interdependent value, where thevalue is commonly unknown but assumed to be same for all the bidders,as if every bidder is anchored to a pure common value.
Clear classification into common value and private valuecomponents could be quite contentious and Treasury security auctionoccupies the centre stage for that. Real life classifications are not alwaysbased on quantitatively calibrated methods. For example, the auction ofa unique work of art not for resale is prototypical private-values modelwhereas a Treasury auction, with each bidder guessing at the security’svalue at the end of the day, would idealy follow a common-values model.Historically, oil tract auctions are conducted on common valueperceptions. After all the winner’s curse pehnomenon, as realised to bemostly arising out of robust common value component; it came of as aquantitatively established fact in the offshore Mexican oil tract auctiondata. Current research on auction formats proceeds in the form ofextending the theory of private value auctions and making empiricallysuited tailor made evaluations of the real-world auction markets, be itanalysing sealedbid auctions of US Forest Service timber auctions (Athey,S et al, 2004) or Structural Estimation of Czech and Canadian TreasuryBill Auctions (Kastl, 2008a). In a divisible good setting, such as treasurybill auctions, bidders with private values who obtain information aboutrivals’ bids use this information only to update their prior about thedistribution of residual supply. In the model with a common valuecomponent, they also update their prior about the value of the good beingauctioned. Private value case could be relevant in Treasury auction incase some bidders have to route their bids through dealers (e.g., Canadian
AUCTIONS OF GOVERNMENT SECURITIES IN INDIA – AN ANALYSIS 59
treasury bill market, Indian government securities market) who alsosubmit bids on their own. For example, Hortacsu et al (2008) found thatin the Canadian Treasury bill issuance, the null hypothesis of privatevalues in the data for 3-months treasury bills could not be rejected; butthe test rejects private values for 12-months treasury bills.
6. GOI securities auctions system: The government securities marketin India has transformed into a vibrant system in the last one and a halfdecade. Financial reforms in the captive government securities marketscommenced in the beginning of the 1990s, against the backdrop of itbeing portrayed as a highly controlled, sub-venting framework foradministered interest rate mechanism and near static manual system ofbilateral market transactions lacking price-time priority, imposing therebycounter-party credit risk in an otherwise illiquid market with bulgingshort-term debt in the eighties that used to be propelled by an automaticroute of ad hoc Treasury Bills creation by the country’s central bank atthe behest of the government. Reforms process encompasses importantdevelopments in active policy making, strengthening institutional system,establishing dedicated clearing and settlement systems, trading expansion,diversification of market participants and instruments, consolidatingtransparent regulatory system, implementation of state of the arttechnology and enforcing enabling market legislations, rules andprocedures. Some notable milestones are: (i) introduction of ‘delivery-versus-payment’ (DVP) system in the government securities market(1995), (ii) establishing of Primary Dealer system (1996), (iii) statutoryagreement with the central government on withdrawing ad hoc TreasuryBills (1997), (iv) launching price-based auctions (1999), (v) introducingelectronic Trading System (NDS) and CCIL (2002), (vi) legislation ofthe FRBM Act (2003), (vii) When-Issued market (2006), (viii) Short –sale permitted up to five days (2007), (ix) GS Act (2007).
Salient features of the GOI securities auction system are:
● As part of overall economic reforms, auction method of primaryissuance for Government of India Securities was introduced in June 3,1992 (RBI Bulletin Nov 1996). The first price-based auction wasconducted on May 11, 1999. The RBI initiated reforms in Government

60 RESERVE BANK OF INDIA OCCASIONAL PAPERS
securities market has evolved primary auctions over these years. Withimplementation of the Fiscal Responsibility and Budget Management(FRBM) Act, 2003, the participation of RBI in the primary auctionissuance has been prohibited with effect from April 1, 2006. The primaryauctions in Government of India securities during 2006-07 have beensubscribed completely by the market at market determined prices.
● As a part of the reform process in the primary issuance ofGovernment Securities, a few securities were initially issued throughauctions and gradually the portion of market borrowing raised throughauction was increased while RBI’s participation in auction withdevolvement option as well as private placement with RBI declined.The primary auctions become fully market determined with withdrawalof RBI from auction with effect from April 1, 2006 on implementationof FRBM Act. The process can be observed from the gradual reductionin RBI subscriptions of market borrowings as given below:
Year Gross Market Dated Securities Amount ofBorrowings raised through Devolvement on
(Dated securities) Auctions Reserve Bank1 2 3 4
1996-97 27,911 27,911 3,6981997-98 43,390 37,390 7,0281998-99 83,753 53,753 8,2051999-00 86,630 59,630 –2000-01 1,00,183 82,183 13,1512001-02 1,14,213 86,000 6792002-03 1,25,000* 94,000 5,1752003-04 1,21,500* 1,00,000 02004-05 80,350 80,000 8472005-06 1,31,000 1,21,000 02006-07 1,46,000 1,46,000 0
* : Includes borrowings for pre-payment of external debt.Source : RBI Annual Reports.
From 2006-07 onward, entire market borrowing of Government ofIndia being raised at market-determined rate and auction analysis trulyreflects the cent par cent market behaviour in auctions.
AUCTIONS OF GOVERNMENT SECURITIES IN INDIA – AN ANALYSIS 61
● As regards the types and mode of auction bid submission, buyersof the Government of India dated securities typically submit their sealedbids specifying quantity and price (or yield) at which they wish to purchasethe quantity demanded. Initially, bid submission procedure used to bepaper-based, which was moved to electronic form since 2002. Oncesubmitted these bids are arranged from highest to the lowest price (orfrom lowest to highest yield) and the quantity for sale is awarded to thebest bids.
● The annual Budget presented to the Parliament every yearprovides the total quantum of the issuance. Based on the total requirement,RBI, announces the half-yearly calendar of issuance indicating theamount, tenor (maturity bucket) of issuance. The auction calendar helpsin cash flow planning of the prospective investors. The auction calendarfor first half is announced in the last week of March and second halfcalendar is announced in last week of September. The specific issue isnormally notified to the market one week before the auction date. Thesecurities to be auctioned are traded in ‘When-issued’ market for theweek.
● Then follows the actual conduct of auction by the RBI. Followingflowchart highlights the decision-making behaviour of a bidder in theGOI securities auction.
7. Auction theories: Prior to early 1980s, the independent private valuemodel was central to auction theory (cf. Steven A. Matthews DiscussionPaper #1096 on “A Technical Primer on Auction Theory: IndependentPrivate Values” (1995), The Centre for Mathematical Studies inEconomics & Management Sciences, North-western University). Thencame the most influential paper on ‘A Theory of Auctions andCompetitive Bidding’ (Milgrom et al, 1982). Based on the theoreticalanalyses of the classic private value model, seven most important resultsof auction theories were established: (i) First-price auction isstrategically equivalent to Dutch auction. (ii) Second price auction isstrategically equivalent (weekly) to the English auction. (Here it isassumed that successful bidder has a dominant strategy of knowingthe value of the object as opposed to stronger equivalence in case of

62 RESERVE BANK OF INDIA OCCASIONAL PAPERS
first-price auction as it does not require that a bidder know the value ofthe object). (iii) The English as well as second-price auction is Paretooptimal (at the dominant-strategy equilibrium). The winner is the bidderwho values the object most highly (The maximum value he succeedsto get, as it were, known to him as a dominant strategy). (iv) In theindependent private value model, all the four auction formats lead toidentical expected revenues for the seller. (v) At the symmetricequilibriums of the English, Dutch, first-price and second-priceauctions, the expected selling price is the same (popularly known asRevenue Equivalence result). (vi) By viewing bidder’s decisionproblems (conditional upon fixed strategies of the other bidders) asone of choosing a probability distribution of winning and thecorresponding expected pay-off and then, formulating the problem ofauction design (seller’s revenue maximization problem) as a constrainedoptimal problem, the four standard auction forms (with suitably chosenreserve prices or entry fees) are optimal for most of the commonstandard bid probability distributions. (vii) In the case where either theseller or the buyers are risk averse, seller will strictly prefer the Dutch(first-price) auction to the English (second-price) auction.
Backgroundknowledge ofthe security tobe auctioned
Requirement analysisby bidders
When-issued marketSecondary market
position
Money market,
inflation rate
G Sec portfolio -
duration
Buying from
secondary market
Auction
Competition from
other bidders
Allocation in
AuctionPayment

AUCTIONS OF GOVERNMENT SECURITIES IN INDIA – AN ANALYSIS 63
Auction theory, therefore, predicts that in the statistically independentprivate value model, the four most common auction forms lead to thesame expected price.
Auction experts have analysed some of the auction’s capabilitiesand inherent limitations, the roles of various rules, the possibilities forintroducing combinatorial bidding, and some considerations in adaptingthe auction for sales with a revenue goal. Drawing on both traditionaland new elements of auction theory, they conclude that theorists havebeen able to analyse proposed designs, detect biases, predictshortcomings, identify tradeoffs, and recommend solutions. But indesigning real auctions there are important practical questions for whichtheory currently offers no answers. The “bounded rationality” constraintsthat limit the effectiveness of the generalised Vickrey auction have sofar proved particularly resistant to simple analysis. Because of such limitsto our knowledge, auction design is a kind of engineering activity. Itentails practical judgments, guided by theory and all available evidence,but it also uses ad hoc methods to resolve issues about which theory issilent. As with other engineering activities, the practical difficulties ofdesigning effective real auctions themselves inspire new theoreticalanalyses, which appear to be leading to new, more efficient, and morerobust designs.
For example, the US Treasury’s experiments with different kinds ofauctions yielded inconclusive results and the broader empirical literatureis also inconclusive. However, small differences in auction performancecan be significant when such large amounts of money are involved, andcollusion could be an issue in government securities (Klemperer, 2004).Buyer market power leading to collusion and entry deterrence is the keyto auction problems, which suggests that auction design may not mattervery much when there is a large number of potential bidders for whomentry to the auction is easy. It therefore calls forth for periodic empiricalevaluations of the auction bid data emanating from various formats usedto auction government securities even to tightly regulated entities in thefinancial markets.
8. U.S. Treasury auctions: The Federal Reserve issues U.S. Treasurybonds, notes, and bills in accordance with their fiscal policy. These

64 RESERVE BANK OF INDIA OCCASIONAL PAPERS
instruments are brought to market through a Dutch auction process wherethe government dealers and others bid for the particular issue. (cf. AFTERTHE TRADE IS MADE – Processing Securities Transactions by DavidM. Weiss (2006), Portfolio, Penguin Group). Until recently only a specialgroup of dealers known as government dealers could bid for thesesecurities. The auction was a regular auction with the highest bids gettingfilled first. The dealers would sell the issues to their clients and to otherbroker/dealers for investment or for their clients. Fed has then changedits procedures and now permits qualified entities to bid for the issuesdirectly. They also changed the auction process to a Dutch auction, whereall accepted bids filled at the same price. The U.S. Treasury switchedfrom discriminatory to uniform auctions in October 1998 after severalyears of experimentation
9. Multiunit auctions: Treasury auctions typically take place in a multipleprice/quantity bid format in the double sense that the auctioneer puts upmany units for sale and bidders also demand many units. Such format isbasically different from multiunit auctions of Milgrom-Weber varietywhereby bidders demand only one unit. The computation of equilibriumbidding strategies in multiunit Treasury auction is extremely difficult.Based on certain simplifying assumptions on strategic bidding behaviour,it has been established using game theory and associated quadraticoptimisation techniques, that the competitive auctions, also known asstop-out price auctions, where bidders pay the lowest accepted bid, aretechnically more acceptable than its dual version of discriminatoryauctions from the efficiency point of view (i.e., revenue maximisationprinciple) as it optimises truthful bidding and hence efficient transactionis assured. However, the simplicity aspect about strategic behaviourrequires to be underscored as it is also undeniable that experienced andwell-informed bidders could still achieve better performance based ontheir skilful bidding strategies, which may not match with the simplisticassumptions. On the other hand, stop-out bidders in the so-calledcompetitive framework need not be so sophisticated because it is optimalto simply bid one’s true valuation. Pareto-efficiency is always assured ina competitive auction, whereas in a discriminatory auction, it requiresthat all bidders have realistic expectations in a close neighbourhood of
AUCTIONS OF GOVERNMENT SECURITIES IN INDIA – AN ANALYSIS 65
the possible stop-out price range. Though it is claimed that competitivebidding is superior to discriminatory auction both in terms of efficiencyand strategic simplicity, it is not prevalent in financial markets, speciallyin the segment of bond market, whereby more strategic flexibilitiespractised by technically superior bidders like Primary Dealers and Bankersseem to be eking out better gains out of discriminatory auction formats.In case of new assets market (e.g., IPOs floated by newly formedcorporate) with lot of unknowns and skewed information asymmetry,however, discriminatory format ought to be inefficient in the face of theestablished supremacy of the generalised Vickery auction introduced byAusubel (2004). His main contention is about winner’s curse gettinghighly pronounced in case of common value item of assets if there ismore than one unit for sale and bidders demand multi-units quoted atdifferent price tags. This becomes more pronounced so if the number ofbidders is sufficiently large to embrace common investors without anyspecialised perception about value and pricing. Common investors, beinga rational agent, would always take recourse to bid shading as a cautiousapproach, causing thereby inefficient revenue realisation in the case ofsealed bid multiunit single bid auctions. Role of specialised dealers drivenauction markets like that of the bond market in circumventing thephenomenon of bid shading as well as mitigating the winner’s curse,therefore, requires empirical validation about whether the dealers aresuccessful in biding truthfully so that much needed optimality andefficiency targets are maintained.

66 RESERVE BANK OF INDIA OCCASIONAL PAPERS
Statement 1: Auction-wise Bid Price Distribution Statistics
Security Cut-Off Average Median Mode Skewness Kurtosis
7.5% GOVT STOCK2034 94.73 93.57 93.51 94.75 0.015 0.5017.95% G.S 2032 99.33 98.86 99.00 99.50 -2.248 11.8927.40% G.S. 2012 101.64 101.63 101.65 101.69 -0.992 1.4097.59% GOVT.STOCK 2016 100.26 100.23 100.26 100.30 -1.409 4.3537.5% GOVT. STOCK 2034 92.90 92.82 92.95 93.36 -0.874 0.4709.39% G. S. 2011 108.33 108.20 108.26 108.30 -7.821 84.8557.37% G.S. 2014 96.84 96.89 96.94 97.00 -1.984 4.5047.94% GOVT.STOCK 2021 95.65 96.01 96.07 96.00 -1.160 2.1807.59% GOVT.STOCK 2016 95.36 94.99 95.06 95.30 -1.412 3.1947.5% GOVT. STOCK 2034 86.99 85.74 85.61 85.62 0.156 -0.4697.55% G.S. 2010 99.53 99.49 99.53 99.50 -2.914 13.9707.59% GOVT.STOCK 2016 95.51 95.37 95.40 95.32 -3.203 14.8959.39% G. S. 2011 105.76 105.59 105.69 105.65 -10.392 110.7788.07% GS 2017 99.62 99.47 99.51 99.50 -0.729 7.6248.33% GOVT.STOCK 2036 95.76 95.52 95.66 95.85 -1.102 0.8747.5% GOVT. STOCK 2034 89.83 89.44 89.50 89.75 -0.697 0.2277.59% GOVT.STOCK 2016 98.85 98.70 98.72 98.72 -3.940 34.5467.59% GOVT.STOCK 2016 99.71 99.76 99.80 99.80 -1.856 5.1308.33% GOVT.STOCK 2036 102.50 102.06 102.20 102.10 -2.436 9.6777.40% G.S. 2012 99.54 99.45 99.51 99.51 -2.741 11.8187.5% GOVT. STOCK 2034 94.23 93.72 93.88 93.91 -1.654 3.1638.07% GS 2017 104.47 104.42 104.46 104.45 -9.019 111.5077.37% G.S. 2014 100.32 100.21 100.30 100.30 -13.276 197.3188.33% GOVT.STOCK 2036 108.15 107.75 107.90 107.60 -1.391 1.8318.33% GOVT.STOCK 2036 101.00 102.80 103.07 103.12 -0.465 -0.6177.94% GOVT.STOCK 2021 97.81 97.37 97.67 97.40 -2.156 6.3287.37% G.S. 2014 97.25 97.07 97.23 97.41 -2.719 8.4648.33% GOVT.STOCK 2036 101.53 100.73 101.40 101.75 -14.531 214.2858.07% GS 2017 100.05 99.73 99.85 100.00 -3.489 17.3248.33% GOVT.STOCK 2036 99.22 98.42 98.70 98.15 -2.093 5.4946.65% G.S. 2009 97.70 97.65 97.67 97.73 -0.191 -0.6366.65% G.S. 2009 97.55 97.54 97.55 97.55 -1.868 11.3006.65% G.S. 2009 97.49 97.41 97.42 97.42 -1.058 2.6666.65% G.S. 2009 97.26 97.29 97.30 97.31 -0.609 0.255
Note : The above data relates to priced-based auction and large figures are due to few unusualbids in some issues only.
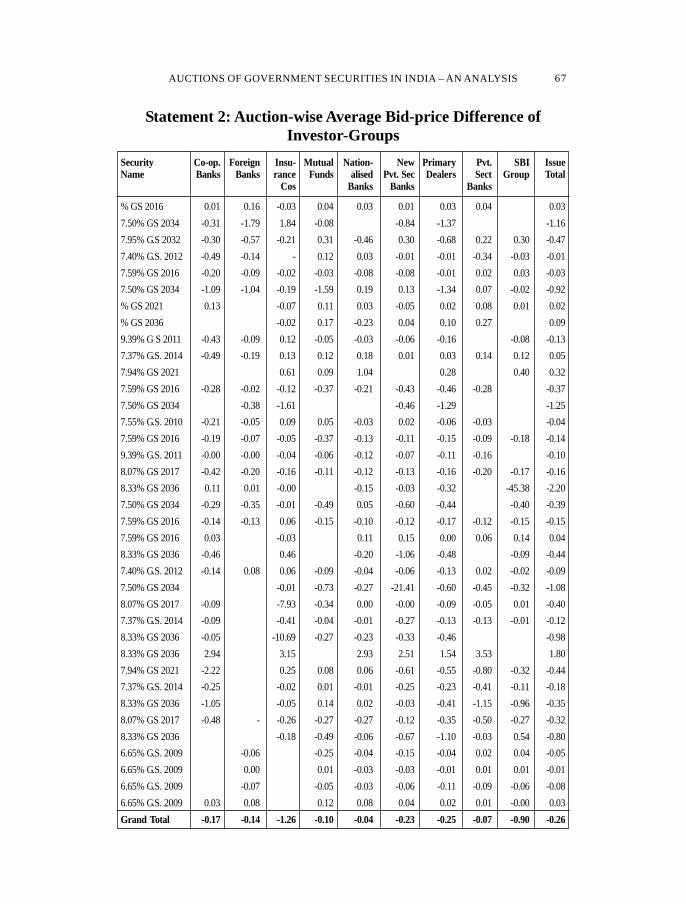
AUCTIONS OF GOVERNMENT SECURITIES IN INDIA – AN ANALYSIS 67
Statement 2: Auction-wise Average Bid-price Difference ofInvestor-Groups
Security Co-op. Foreign Insu- Mutual Nation- New Primary Pvt. SBI IssueName Banks Banks rance Funds alised Pvt. Sec Dealers Sect Group Total
Cos Banks Banks Banks
% GS 2016 0.01 0.16 -0.03 0.04 0.03 0.01 0.03 0.04 0.037.50% GS 2034 -0.31 -1.79 1.84 -0.08 -0.84 -1.37 -1.167.95% G.S 2032 -0.30 -0.57 -0.21 0.31 -0.46 0.30 -0.68 0.22 0.30 -0.477.40% G.S. 2012 -0.49 -0.14 - 0.12 0.03 -0.01 -0.01 -0.34 -0.03 -0.017.59% GS 2016 -0.20 -0.09 -0.02 -0.03 -0.08 -0.08 -0.01 0.02 0.03 -0.037.50% GS 2034 -1.09 -1.04 -0.19 -1.59 0.19 0.13 -1.34 0.07 -0.02 -0.92% GS 2021 0.13 -0.07 0.11 0.03 -0.05 0.02 0.08 0.01 0.02% GS 2036 -0.02 0.17 -0.23 0.04 0.10 0.27 0.099.39% G S 2011 -0.43 -0.09 0.12 -0.05 -0.03 -0.06 -0.16 -0.08 -0.137.37% G.S. 2014 -0.49 -0.19 0.13 0.12 0.18 0.01 0.03 0.14 0.12 0.057.94% GS 2021 0.61 0.09 1.04 0.28 0.40 0.327.59% GS 2016 -0.28 -0.02 -0.12 -0.37 -0.21 -0.43 -0.46 -0.28 -0.377.50% GS 2034 -0.38 -1.61 -0.46 -1.29 -1.257.55% G.S. 2010 -0.21 -0.05 0.09 0.05 -0.03 0.02 -0.06 -0.03 -0.047.59% GS 2016 -0.19 -0.07 -0.05 -0.37 -0.13 -0.11 -0.15 -0.09 -0.18 -0.149.39% G.S. 2011 -0.00 -0.00 -0.04 -0.06 -0.12 -0.07 -0.11 -0.16 -0.108.07% GS 2017 -0.42 -0.20 -0.16 -0.11 -0.12 -0.13 -0.16 -0.20 -0.17 -0.168.33% GS 2036 0.11 0.01 -0.00 -0.15 -0.03 -0.32 -45.38 -2.207.50% GS 2034 -0.29 -0.35 -0.01 -0.49 0.05 -0.60 -0.44 -0.40 -0.397.59% GS 2016 -0.14 -0.13 0.06 -0.15 -0.10 -0.12 -0.17 -0.12 -0.15 -0.157.59% GS 2016 0.03 -0.03 0.11 0.15 0.00 0.06 0.14 0.048.33% GS 2036 -0.46 0.46 -0.20 -1.06 -0.48 -0.09 -0.447.40% G.S. 2012 -0.14 0.08 0.06 -0.09 -0.04 -0.06 -0.13 0.02 -0.02 -0.097.50% GS 2034 -0.01 -0.73 -0.27 -21.41 -0.60 -0.45 -0.32 -1.088.07% GS 2017 -0.09 -7.93 -0.34 0.00 -0.00 -0.09 -0.05 0.01 -0.407.37% G.S. 2014 -0.09 -0.41 -0.04 -0.01 -0.27 -0.13 -0.13 -0.01 -0.128.33% GS 2036 -0.05 -10.69 -0.27 -0.23 -0.33 -0.46 -0.988.33% GS 2036 2.94 3.15 2.93 2.51 1.54 3.53 1.807.94% GS 2021 -2.22 0.25 0.08 0.06 -0.61 -0.55 -0.80 -0.32 -0.447.37% G.S. 2014 -0.25 -0.02 0.01 -0.01 -0.25 -0.23 -0.41 -0.11 -0.188.33% GS 2036 -1.05 -0.05 0.14 0.02 -0.03 -0.41 -1.15 -0.96 -0.358.07% GS 2017 -0.48 - -0.26 -0.27 -0.27 -0.12 -0.35 -0.50 -0.27 -0.328.33% GS 2036 -0.18 -0.49 -0.06 -0.67 -1.10 -0.03 0.54 -0.806.65% G.S. 2009 -0.06 -0.25 -0.04 -0.15 -0.04 0.02 0.04 -0.056.65% G.S. 2009 0.00 0.01 -0.03 -0.03 -0.01 0.01 0.01 -0.016.65% G.S. 2009 -0.07 -0.05 -0.03 -0.06 -0.11 -0.09 -0.06 -0.086.65% G.S. 2009 0.03 0.08 0.12 0.08 0.04 0.02 0.01 -0.00 0.03Grand Total -0.17 -0.14 -1.26 -0.10 -0.04 -0.23 -0.25 -0.07 -0.90 -0.26

68 RESERVE BANK OF INDIA OCCASIONAL PAPERS
Statement 3: Auction-wise Success Ratio of Various Investor Groups(per cent)
Security Co-op. Foreign Insu- Mutual Nation- New Primary Pvt. SBI IssueName Banks Banks rance Funds alised Pvt. Sec Dealers Sect Group Total
Cos Banks Banks Banks
% GS 2016 0.00 4.76 100.00 25.79 52.63 55.81 36.00 37.50 44.067.5% GS 2034 0.00 0.00 100.00 50.00 7.46 3.28 41.567.95% G.S 2032 33.33 11.29 68.13 100.00 11.11 52.94 14.96 100.00 84.31 42.367.40% G.S. 2012 0.00 66.67 46.28 100.00 81.35 66.72 45.93 0.00 59.82 51.657.59% GS 2016 0.00 77.67 50.00 55.56 39.73 40.85 52.79 46.41 100.00 52.827.5% GS 2034 0.00 0.00 99.21 0.00 56.10 57.77 14.70 60.00 52.48 46.25% GS 2021 0.00 49.63 0.00 47.57 100.00 39.14 33.33 40.00 43.73% GS 2036 71.43 0.00 100.00 22.22 28.07 0.00 45.559.39% G. S. 2011 0.00 94.12 100.00 43.48 64.63 98.58 19.31 0.00 40.667.37% G.S. 2014 0.00 0.00 100.00 100.00 98.68 75.00 55.15 90.00 100.00 61.187.94% GS 2021 100.00 66.67 100.00 40.68 100.00 60.067.59% GS 2016 66.67 90.91 9.84 0.00 22.97 0.00 21.23 0.00 21.007.5% GS 2034 14.29 0.00 0.00 4.84 2.557.55% G.S. 2010 0.00 50.00 100.00 77.52 72.08 46.28 35.93 12.57 44.077.59% GS 2016 0.00 19.77 76.58 0.00 3.40 0.00 11.70 31.25 0.00 30.659.39% G. S. 2011 50.00 81.82 0.00 25.13 0.00 18.79 44.52 0.00 39.038.07% GS 2017 0.00 4.00 0.00 45.45 25.06 47.08 39.34 0.00 0.00 31.668.33% GS 2036 82.64 58.33 49.42 16.92 67.89 25.32 2.43 37.727.5% GS 2034 5.56 18.18 56.25 0.00 62.24 60.63 15.43 0.00 36.647.59% GS 2016 8.59 18.35 100.00 0.00 59.99 53.19 17.20 0.00 0.00 35.787.59% GS 2016 63.64 96.92 81.98 97.34 38.57 82.35 100.00 56.558.33% GS 2036 0.00 100.00 12.30 0.00 0.22 0.00 43.217.40% G.S. 2012 14.29 100.00 50.00 8.19 34.67 58.58 30.36 66.67 58.30 39.177.5% GS 2034 97.09 0.00 10.99 0.00 0.56 0.00 0.00 40.898.07% GS 2017 28.00 38.12 66.67 57.28 91.84 21.35 31.03 47.59 36.327.37% G.S. 2014 36.31 0.00 46.68 78.38 39.06 36.05 9.34 53.96 46.498.33% GS 2036 35.00 71.42 9.52 33.33 13.56 15.03 38.248.33% GS 2036 100.00 100.00 100.00 100.00 59.87 100.00 69.777.94% GS 2021 0.00 68.33 42.19 58.15 36.46 34.69 0.00 21.94 41.477.37% G.S. 2014 0.00 0.00 45.83 56.99 0.00 64.42 0.00 26.67 59.548.33% GS 2036 0.00 49.50 66.67 29.00 60.98 24.32 0.00 0.00 34.248.07% GS 2017 0.00 28.57 0.00 16.67 2.38 0.00 40.96 0.00 48.11 33.958.33% GS 2036 57.38 45.45 43.83 0.00 9.01 55.56 79.14 36.546.65% G.S. 2009 0.00 0.00 65.19 2.50 43.75 50.00 64.55 44.986.65% G.S. 2009 33.33 89.84 28.47 64.08 46.86 59.12 12.94 40.226.65% G.S. 2009 10.00 0.00 29.62 34.08 24.32 0.00 4.71 22.796.65% G.S. 2009 100.00 88.89 100.00 94.37 78.86 49.95 69.30 15.87 54.48
Total - Category 22.73 53.44 64.56 34.77 50.11 53.43 32.85 34.88 47.20 41.90