audi investor and analyst day · audi investor and analyst day march 4, 2016 . topic areas for the...
TRANSCRIPT

Dr. Dietmar Voggenreiter Member of the Board of Management
Sales & Marketing, AUDI AG
Audi Investor and Analyst Day
March 4, 2016

Topic areas for the Analyst Day on March 4, 2016
Status Diesel
1.
Digital
Ecosystem
3.
Sales
Performance
2015
2.

Topic areas for the Analyst Day on March 4, 2016
Status Diesel
1.
Digital
Ecosystem
3.
Sales
Performance
2015
2.

Status Diesel
2.0 TDI 1.6 TDI 3.0 TDI
Topic areas for the Analyst Day on March 4, 2016
Status Diesel
1.
Digital
Ecosystem
3.
Sales
Performance
2.

Deliveries to customers – worldwide 2015 vs. 2014 (in thousand vehicles)
1,741 1,803
2014 2015
+ 3.6 %
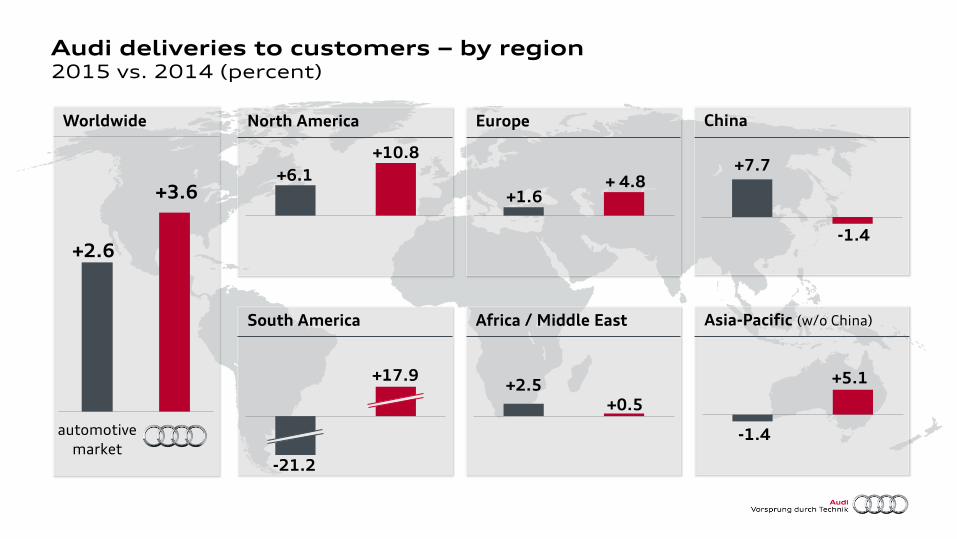
Audi deliveries to customers – by region 2015 vs. 2014 (percent)
North America Europe
Africa / Middle East Asia-Pacific (w/o China) South America
Worldwide
+3.6
+2.6
automotive
market
China
+6.1
+10.8
+1.6 + 4.8
+5.1
-1.4
-21.2
+17.9 +2.5
+0.5
+7.7
-1.4

Product highlights 2016
Audi S4 Limousine Audi A4 allroad quattro
Audi A5 Coupé
Audi S5 Coupé Audi Q2 Audi SQ7
Audi Q7 e-tron
Audi S4 Avant Audi RS Q3 performance
Audi R8 Spyder
Audi TT RS Coupé
Audi TT RS Roadster

Deliveries to customers – worldwide January 2016 vs. January 2015 (in thousand vehicles)
138 143
2015 2016
+ 4.0 %

Topic areas for the Analyst Day on March 4, 2016
Digital
Ecosystem
3.
Sales
Performance
2.
Status Diesel
1.

Digital ecosystem at Audi
Customer
Retail
Car
Web audi.de
03/2015
Audi Investor and Analyst Day

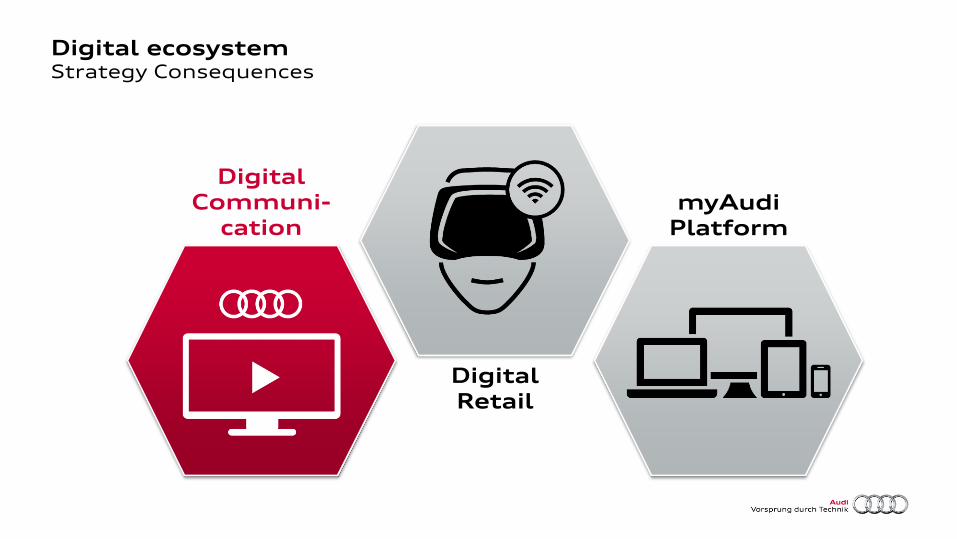
Digital ecosystem Strategy Consequences
Digital Communi-
cation
Digital Retail
myAudi Platform
Digital ecosystem Strategy Consequences
Digital Communi-
cation
Digital Retail
myAudi Platform

Digital ecosystem Strategy Consequences
Digital Communi-
cation
Digital Retail
myAudi Platform

Digital experiences empower cross- and upselling potential
Phase I
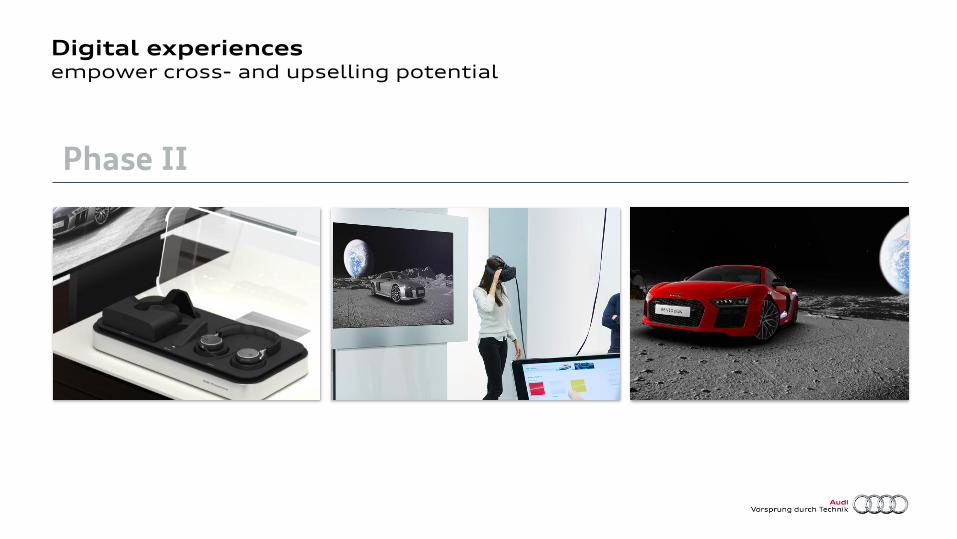
Digital experiences empower cross- and upselling potential
Phase II

Digital ecosystem Strategy Consequences
Digital Communi-
cation
Digital Retail
myAudi Platform

myAudi
1 global myAudi platform / 1 Audi-ID
Connected
Retail
Connected
Mobility
Connected
Car
Connected
Life

Audi mobility Further portfolio development
Audi shared fleet Audi on demand Audi select
One rate
for 1-3 automobiles
Corporate
car sharing
Short term
car rental

Axel Strotbek Member of the Board of Management,
Finance and Organization, AUDI AG
Audi Investor and Analyst Day
March 4, 2016

2013 2014 2015
Economic development of important sales regions 2013 through 2015: GDP growth (percent) compared with prior year
Source: IHS Global Insight, official statistics
Worldwide
South America
Central & Eastern Europe North America Western Europe
Asia-Pacific China
-0.7
+1.8 +2.2 +2.3 +2.4
+1.5
-0.6 +1.1
+2.9
+2.5 +2.7 +2.5
+4.7 +4.9 +4.7
+1.3 0.3
+6.9 +7.3 +7.7
+1.6

Car markets worldwide vs. Audi deliveries to customers 2015 vs. 2014 (percent)
North America Europe
South America
China
Asia-Pacific (w/o China)
+1.6
+6.1 +3.6
+2.6
-1.4 -21.2
+7.7
Car
market
+4.8
+10.8
+17.9
+5.1
-1.4
Worldwide
Africa / Middle East
+2.5 +0.5

Audi Group revenue (IFRS) EUR million
58,420
2015
+8.6%
53,787
2014
Motorcycles segment
EUR 702 million
Automotive segment
EUR 57,719 million

2015 2014 Change
Income Statement of the Audi Group (IFRS) EUR million
Revenue
Cost of goods sold
53,787
-44,415
58,420
-47,043
+8.6%
+5.9%

2015 2014 Change
Income Statement of the Audi Group (IFRS) EUR million
Revenue
Cost of goods sold
Gross profit
53,787
-44,415
9,372
58,420
-47,043
11,376
+8.6%
+5.9%
+21.4%

2015 2014 Change
Income Statement of the Audi Group (IFRS) EUR million
Revenue
Cost of goods sold
Gross profit
Distribution costs
53,787
-44,415
9,372
-4,895
58,420
-47,043
11,376
-5,782
+8.6%
+5.9%
+21.4%
+18.1%

2015 2014 Change
Income Statement of the Audi Group (IFRS) EUR million
Revenue
Cost of goods sold
Gross profit
Distribution costs
Administrative expenses
53,787
-44,415
9,372
-4,895
-587
58,420
-47,043
11,376
-5,782
-640
+8.6%
+5.9%
+21.4%
+18.1%
+9.0%

2015 2014 Change
Income Statement of the Audi Group (IFRS) EUR million
Revenue
Cost of goods sold
Gross profit
Distribution costs
Administrative expenses
Other operating result
53,787
-44,415
9,372
-4,895
-587
1,260
58,420
-47,043
11,376
-5,782
-640
-119
+8.6%
+5.9%
+21.4%
+18.1%
+9.0%
–

2015 2014 Change
Income Statement of the Audi Group (IFRS) EUR million
Revenue
Cost of goods sold
Gross profit
Distribution costs
Administrative expenses
Other operating result
Operating profit
53,787
-44,415
9,372
-4,895
-587
1,260
5,150
58,420
-47,043
11,376
-5,782
-640
-119
4,836
+8.6%
+5.9%
+21.4%
+18.1%
+9.0%
–
-6.1%

Operating profit 2015 vs. 2014 EUR million
2015
4,836
Special items
-298
2015 adjusted
5,134
2014
5,150
All figures are rounded, which can lead to slight discrepancies when added.
-6.1% -0.3%
thereof:
Motorcycles segment
EUR 54 million*
* EUR 31 million including scheduled amortization coming from the
reassessment of assets/liabilities in terms of purchase-price allocation.
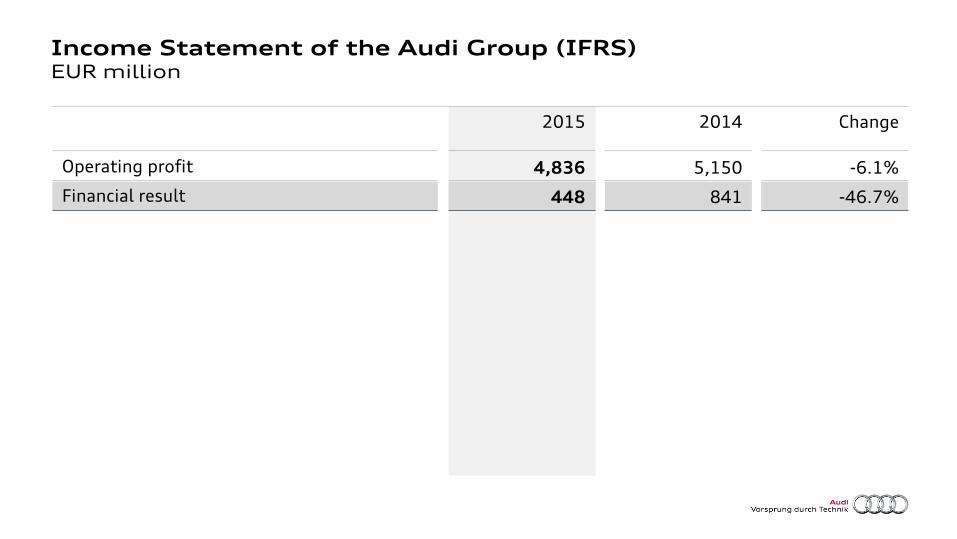
2015 2014 Change
Income Statement of the Audi Group (IFRS) EUR million
Operating profit
Financial result
5,150
841
4,836
448
-6.1%
-46.7%
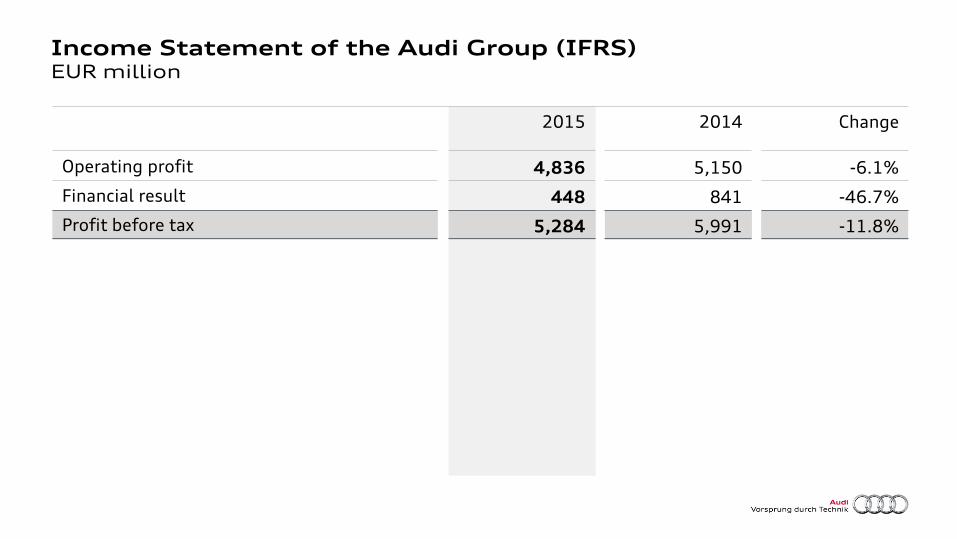
2015 2014 Change
Income Statement of the Audi Group (IFRS) EUR million
Operating profit
Financial result
Profit before tax
5,150
841
5,991
4,836
448
5,284
-6.1%
-46.7%
-11.8%

Audi Group: operating return on sales in percent
Operating return on sales before special items
2015
8.8
2014
9.6
2015 2014
9.6
8.3
Operating return on sales

2015 2014 Change
Cash Flow Statement of the Audi Group EUR million
Cash flow from operating activities 7,421 7,203 -2.9%

2015 2014 Change
Cash Flow Statement of the Audi Group EUR million
Cash flow from operating activities
Investing activities for operating activities
7,421
-4,450
7,203
-5,576*
-2.9%
+25.3%
* incl. EUR 668 million proportional cash-effective purchase price for the HERE transaction

2015 2014 Change
Cash Flow Statement of the Audi Group EUR million
Cash flow from operating activities
Investing activities for operating activities
Net cash flow
7,421
-4,450
2,970
7,203
-5,576*
1,627
-2.9%
+25.3%
-45.2%
* incl. EUR 668 million proportional cash-effective purchase price for the HERE transaction

2015 2014 Change
Cash Flow Statement of the Audi Group EUR million
Cash flow from operating activities
Investing activities for operating activities
Net cash flow
Net liquidity
7,421
-4,450
2,970
16,328
7,203
-5,576*
1,627
16,420
-2.9%
+25.3%
-45.2%
+0.6%
* incl. EUR 668 million proportional cash-effective purchase price for the HERE transaction

Forecast 2016
Outlook
Deliveries of cars of the Audi brand to customers
Revenue
Operating profit/ Operating return on sales
Return on investment (RoI)
between 16 and 18 percent and thus significantly above our minimum rate of return of 9 percent
Net cash flow
Ratio of investments in property, plant and equipment
moderate increase
between EUR 2.0 and 2.5 billion within the strategic target corridor of 5.0 to 5.5 percent
moderate increase within the strategic target corridor
of 8 to 10 percent

Ongoing high investment to strengthen the brand position and for future growth
Complexity Efficiency Synergies
Investments in property, plant and equipment:
2016
> EUR 3 billion

Disclaimer
This presentation contains forward-looking statements and information on the business development of the Audi Group. These statements may be spoken or written and can be recognized by terms such as “expects”, “anticipates”, “intends”, “plans”, “believes”, “seeks”, “estimates”, “will” or words with similar meaning. These statements are based on assumptions relating to the development of the economies of individual countries, and in particular of the automotive industry, which we have made on the basis of the information available to us and which we consider to be realistic at the time of going to press. The estimates given involve a degree of risk, and the actual developments may differ from those forecast.
Consequently, any unexpected fall in demand or economic stagnation in our key sales markets, such as in Western Europe (and especially Germany) or in China or the USA, will have a corresponding impact on the development of our business. The same applies in the event of a significant shift in current exchange rates relative to the US dollar, sterling, yen and Chinese renminbi.
If any of these or other risks occur, or if the assumptions underlying any of these statements prove incorrect, the actual results may significantly differ from those expressed or implied by such statements.
We do not update forward-looking statements retrospectively. Such statements are valid on the date of publication and can be superseded.