audience and impact - usagm.gov · audience by region middle east and north africa 29.3 million...
TRANSCRIPT

usagm.gov | @USAGMgov
AUDIENCE AND IMPACTOVERVIEW FOR 2018

The U.S. Agency for Global Media (USAGM) Global Audience Estimate
provides a snapshot of the total measured audience – the number
of individuals – of the five USAGM media outlets: Voice of America
(VOA), Radio Free Europe/Radio Liberty (RFE/RL), Office of Cuba
Broadcasting (Radio and TV Martí), Radio Free Asia (RFA) and the
Middle East Broadcasting Networks (Alhurra TV and Radio Sawa).
In 2018, USAGM networks attracted 345 million people weekly in unduplicated audience worldwide – including radio, television and Internet – an unprecedented year-on-year increase of 67 million from 278 million in 2017.
In keeping with standards developed by the major western inter-national broadcasters, USAGM measures and reports unduplicated audience, meaning each individual, regardless of how many programs watched or listened to, or media platforms used, is counted only once. This is a conservative approach to quantifying the audience and in keeping with the mission of USAGM to inform and engage people, rather than count individual interactions with them. Hence the reported total audience for a broadcaster is often smaller than the sum of its audience on each platform, and USAGM global audience is smaller than the sum of audiences for all individual networks. The audience estimate is based on surveys • conducted within the past five years; • in more than 100 countries and territories; and • that represent 3 billion people in markets around the globe.
USAGM AUDIENCE BY MEDIA PLATFORM AND PERCENTAGE GROWTH SINCE 2017
+12% TV
201 MILLION
+15%
RAD
IO
140 MILLION
+131%
DIG
ITAL
104 MILLION
+24%
Und
upli
cate
d Au
dien
ce
Acro
ss A
ll M
edia
345 MILLIONThe audience estimate excludes areas where USAGM is unable to conduct audience surveys, including Eritrea, North Korea, Oman, Turk-menistan, and Tibetan and Uyghur regions of China.

Audiences by Network (in millions)
1 Audience estimate for RFA does not include data for North Korea or the Tibetan and Uyghur regions of China, because political risk has made it impossible to carry out representative surveys in the target regions. This represents a significant portion of the countries and regions targeted by RFA language services. 2 Because of the historical limitations of reliable survey data in Cuba, FY 2017 was the first year in which USAGM was able to conduct a representative survey in Cuba and report an audience for OCB.
OVERALL USAGM GROWTH WAS 24% FROM 2017 TO 2018
TOTALING 345 MILLION UNDUPLICATED
VIEWERS ACROSS ALL MEDIA
201820172016201550
100
150
200
250
300
350
FY 2018FY 2017FY 2016FY 2015FY 2014
USAGM
VOA
RFE/RL
RFA1
MBN
OCB2

AUDIENCE BY REGIONMIDDLE EAST AND NORTH AFRICA
29.3 MILLIONIncludes research from the fol-lowing countries and territories: Bahrain, Egypt, Iraq, Jordan, Kuwait, Lebanon, Libya, Morocco, Palestinian Territories, Qatar, Sau-di Arabia, Syria, Tunisia, Turkey, UAE, Yemen
NEAR EAST, SOUTH AND CENTRAL ASIA, EURASIA
57.6 MILLIONIncludes research from the following coun-tries and territories: Abkhazia, Afghanistan, Albania, Armenia, Azerbaijan, Bangladesh, Belarus, Bosnia, Chechnya, Dagestan, Esto-nia, FATA, Georgia, Iran, Kazakhstan, Kosovo, Kyrgyzstan, Latvia, Lithuania, Macedonia, Moldova, Montenegro, Nepal, Pakistan, Russia, Serbia, Sri Lanka, Tajikistan, Ukraine, Uzbekistan
EAST AND SOUTHEAST ASIA
126.6 MILLIONIncludes research from the fol-lowing countries and territories: Burma, Cambodia, China, Hong Kong, Indonesia, Laos, Mongolia, Philippines, South Korea, Taiwan, Thailand, Vietnam
SUB-SAHARAN AFRICA
68.1 MILLIONIncludes research from the following countries: Angola, Botswana, Burkina Faso, Burundi, Cen-tral African Republic, Cote d’Ivoire, Democratic Republic of Congo, Ethiopia, Gabon, Ghana, Guinea, Kenya, Liberia, Madagascar, Malawi, Mali, Mozambique, Niger, Nigeria, Rwanda, Senegal, Sierra Leone, Somalia, South Africa, South Sudan, Tanzania, Uganda, Zambia, Zimbabwe
LATIN AMERICA
63.6 MILLIONIncludes research from the following countries: Argentina, Bolivia, Chile, Colombia, Costa Rica, Cuba, Dominican Republic, Ecuador, El Salvador, Guatema-la, Haiti, Honduras, Mexico, Nicaragua, Panama, Paraguay, Peru, Uruguay, Venezuela

Weekly unduplicated audienceadults who listen/view/use programming at least once a week
In MillionsChina 65.4Indonesia 47.8Mexico 30.6Nigeria 20.8Iran 14.3Iraq 9.0Tanzania 8.9Russia 7.7Ethiopia 7.5Afghanistan 7.2
TOP 10 AUDIENCES FOR U.S. INTERNATIONAL MEDIA IN 2018Overall weekly audiences: adults who listen/view/use programming at least once a week.
As percentage of adult populationKosovo 64.8%Albania 61.0%Burundi 58.0%Armenia 48.3%Iraq 42.6%Kyrgyzstan 40.6%Bahrain 40.4%Kuwait 38.9%Afghanistan 38.5%Qatar 38.1%

In FY 2018, USAGM-commissioned surveys found audience growth in key strategic markets.
COUNTRY PROFILES
CHINA
An IPSOS survey of China conducted from August through December 2017 found that USAGM content is consumed by 6.2 percent of Chinese adults (65 million people) on a weekly basis, with digital audiences outstripping those for traditional broadcasts. Internet is the most used platform for USAGM among Chinese adults, with 5.0 percent of adults consuming USAGM content via that platform. USAGM television programming reaches 1.4 percent and radio pro-gramming reaches 1.3 percent.
These figures are considerably higher than previous estimates for both audiences, and much of the increase is attributable to new questions about the use of indi-vidual programs and blogs that also were identified by the RFA or VOA brand. When the audience for the USAGM broadcasters is measured by the VOA or RFA brand only, without mention of any individual programs, the weekly reach of USAGM brands combined was 1.7 percent of Chinese adults. This figure is most methodologically comparable to previous estimates of USAGM audience, which was measured at 0.3 percent in 2014.
The growth in audience in China brought the opportunity to look at various impact indicators. Previous audience samples had been too small for reliability. Nine in ten weekly audience members trust the content they receive from VOA; three in four for RFA. Around half of the weekly audience says that VOA and RFA have increased their understanding of current events. Three in ten weekly users say that VOA content increased their understanding of U.S. foreign policy and four in ten say that it increased their understanding of American society.
VOA & RFA HAVE EXPANDED ON DIGITAL AND SOCIAL MEDIA PLATFORMS IN CHINA AND ACHIEVED DRAMATIC GROWTH IN A COUNTRY WHERE THEY ARE CENSORED ON MAINSTREAM PLATFORMS
RFA – 44.1M
VOA – 40.7M
RADIO – 13.9M
TV – 15.1M
INTERNET – 53.5M
Survey: August – December 2017
2015 2018
.
6.2% audience
reach in 2018
.3%

IRAN
A Gallup survey of Iran conducted July to October 2017 found that USAGM net-works reach 23.4 percent of Iranian adults (14.3 million people) on a weekly basis across all languages and media platforms. This is an increase from the last survey, conducted in 2015, which found a 14.9 percent weekly audience. The majority of this weekly audience comes from television (11.0 million), versus 5.8 million for radio and 5.3 million for online content. USAGM finds its largest audience share among the critical 15- to 24-year-old audience segment.
Users, especially multi-platform users, trust USAGM networks. Solid majorities of RFE/RL Radio Farda and VOA users trust each network at least somewhat, over three-quarters for RFE/RL and over two-thirds for VOA. Multi-platform users are even more likely to say they trust the network (Radio Farda, over four in five; VOA, over three in four).
USAGM networks increase understanding on many fronts. Three-fifths of past-week users of both networks say the content they consumed has increased their understanding of current events. Just over half of weekly users agree that VOA increased their understanding of U.S. foreign policy, while a little less than half say it has improved their understanding of American culture and society. Over two-thirds of past-week Radio Farda users say that the network has increased their understanding of current events in Iran.
COUNTRY PROFILES
VOA – 9.7M
RFE/RL – 9.6M
RADIO – 5.8M
TV – 11M
INTERNET – 5.3M
Survey: April – June 2018
23.4%PERCENT OF IRANIAN ADULTS REACHED BY USAGM MEDIA
AN INCREASE OF
57% IN A SINGLE YEAR
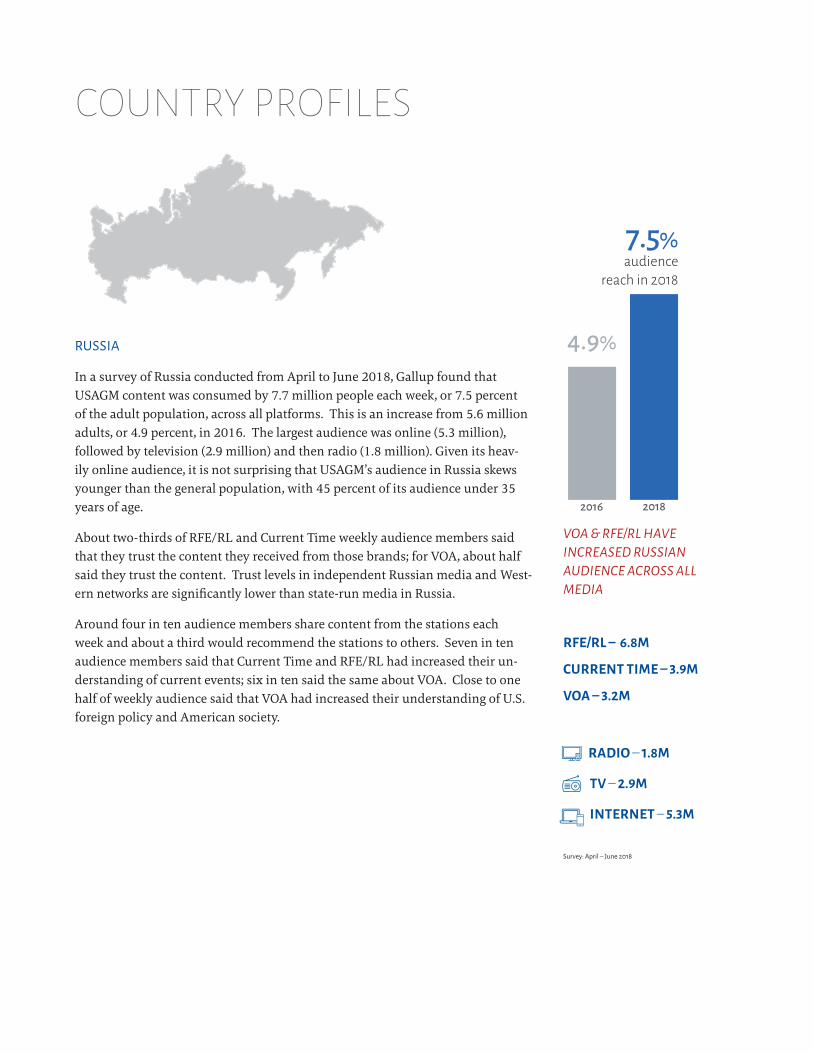
RUSSIA
In a survey of Russia conducted from April to June 2018, Gallup found that USAGM content was consumed by 7.7 million people each week, or 7.5 percent of the adult population, across all platforms. This is an increase from 5.6 million adults, or 4.9 percent, in 2016. The largest audience was online (5.3 million), followed by television (2.9 million) and then radio (1.8 million). Given its heav-ily online audience, it is not surprising that USAGM’s audience in Russia skews younger than the general population, with 45 percent of its audience under 35 years of age.
About two-thirds of RFE/RL and Current Time weekly audience members said that they trust the content they received from those brands; for VOA, about half said they trust the content. Trust levels in independent Russian media and West-ern networks are significantly lower than state-run media in Russia.
Around four in ten audience members share content from the stations each week and about a third would recommend the stations to others. Seven in ten audience members said that Current Time and RFE/RL had increased their un-derstanding of current events; six in ten said the same about VOA. Close to one half of weekly audience said that VOA had increased their understanding of U.S. foreign policy and American society.
COUNTRY PROFILES
VOA & RFE/RL HAVE INCREASED RUSSIAN AUDIENCE ACROSS ALL MEDIA
RFE/RL – 6.8M
CURRENT TIME – 3.9M
VOA – 3.2M
RADIO – 1.8M
TV – 2.9M
INTERNET – 5.3M
Survey: April – June 2018
2016 2018
.
7.5% audience
reach in 2018
4.9%

ETHIOPIA
According to research conducted by Kantar from March through May 2018, VOA’s weekly audience in Ethiopia increased to 7.5 million people, or 12.3 percent of the adult population. This audience was primarily on radio (6.9 million), but also increasingly on television (2.9 million) with only a small portion coming via the Internet. The previous survey (from May 2016) found an audience of 8.6 percent, essentially all on radio. The survey also found high levels of impact with 98 percent of weekly audience members saying that they trusted the news they received from VOA and almost all weekly users saying that VOA had increased their understanding of current events. More than eight in ten weekly users said that VOA’s news increased their understanding of American society and nine in ten weekly users reported that its news helped them form opinions on important topics. More than eight in ten VOA users share news from the network weekly.
COUNTRY PROFILES
98%TRUST
98 PERCENT OF WEEKLY AUDIENCE MEMBERS SAID THAT THEY TRUSTED THE NEWS THEY RECEIVED FROM VOA AND ALMOST ALL WEEKLY USERS SAID THAT VOA HAD INCREASED THEIR UNDERSTANDING OF CURRENT EVENTS
VOA WEEKLY AUDIENCE OF 7.5M (12.3% OF ADULT POPULATION), UP FROM 5.2M (8.6%) IN 2016
RADIO – 6.9M
TV – 2.9M
INTERNET – 0.2M
Survey: April – June 2018
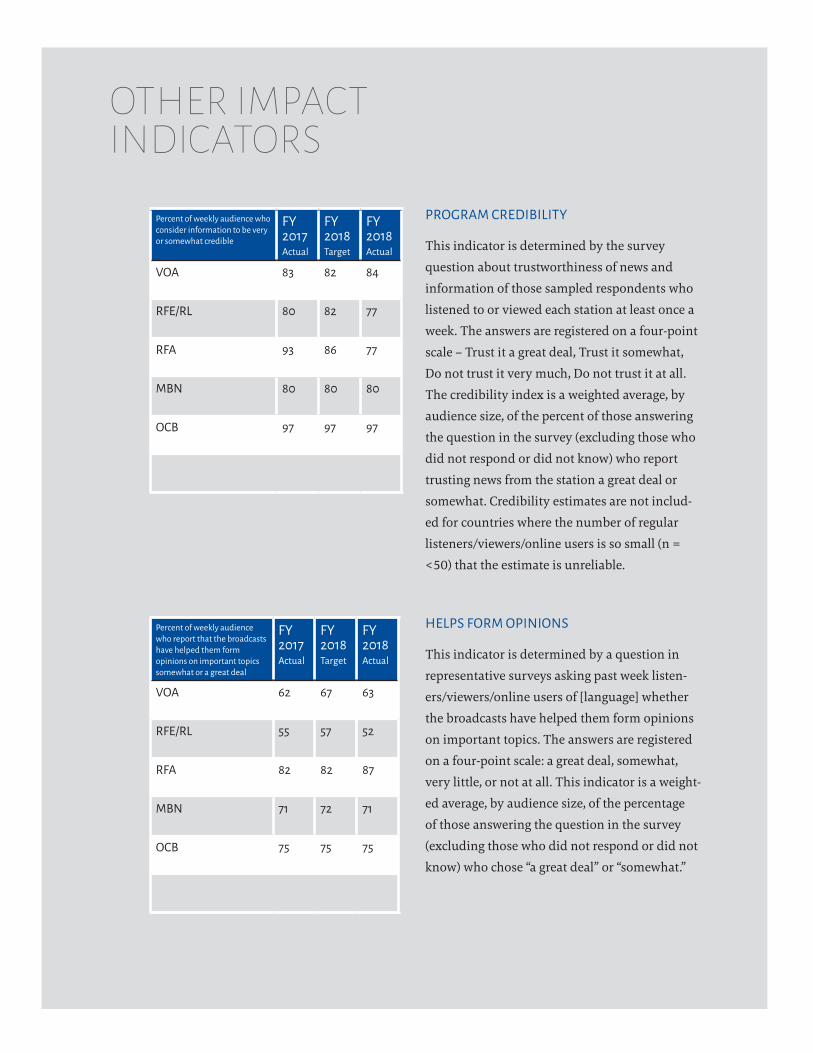
PROGRAM CREDIBILITY
This indicator is determined by the survey
question about trustworthiness of news and
information of those sampled respondents who
listened to or viewed each station at least once a
week. The answers are registered on a four-point
scale – Trust it a great deal, Trust it somewhat,
Do not trust it very much, Do not trust it at all.
The credibility index is a weighted average, by
audience size, of the percent of those answering
the question in the survey (excluding those who
did not respond or did not know) who report
trusting news from the station a great deal or
somewhat. Credibility estimates are not includ-
ed for countries where the number of regular
listeners/viewers/online users is so small (n =
<50) that the estimate is unreliable.
HELPS FORM OPINIONS
This indicator is determined by a question in
representative surveys asking past week listen-
ers/viewers/online users of [language] whether
the broadcasts have helped them form opinions
on important topics. The answers are registered
on a four-point scale: a great deal, somewhat,
very little, or not at all. This indicator is a weight-
ed average, by audience size, of the percentage
of those answering the question in the survey
(excluding those who did not respond or did not
know) who chose “a great deal” or “somewhat.”
OTHER IMPACT INDICATORS
Percent of weekly audience who consider information to be very or somewhat credible
FY 2017 Actual
FY 2018 Target
FY 2018 Actual
VOA 83 82 84
RFE/RL 80 82 77
RFA 93 86 77
MBN 80 80 80
OCB 97 97 97
Percent of weekly audience who report that the broadcasts have helped them form opinions on important topics somewhat or a great deal
FY 2017 Actual
FY 2018 Target
FY 2018 Actual
VOA 62 67 63
RFE/RL 55 57 52
RFA 82 82 87
MBN 71 72 71
OCB 75 75 75

MEASURES OF IMPACT
Over the course of FY 2018, the U.S. Agency for Global Media (USAGM) continued to implement its Impact Model, which measures the impact of its networks. The model is based on the practice of objective journalism and tracks the USAGM mission to inform, engage, and connect audiences in support of freedom and democracy. The model outlines the impact in three sectors: audienc-es, media and governments and includes quantitative and qualitative indicators that represent impact.
Indicators include weekly audience, trustworthiness, audience sharing of content, content co-cre-ation with affiliates, increased understanding of current events, and high-profile news pickups among others. The model is flexible, given the range of media environments in which the USAGM networks operate and accounts for a range of platforms – from shortwave to digital.
WEEKLY AUDIENCE
The Impact Model outlines a host of factors that determine success in target markets; one of the key indicators is measured weekly audience. The measured weekly audience captures the num-ber of people consuming USAGM products – radio listeners, TV viewers, and online users – and is the number of adults (15+) who “listened, watched or saw online materials last week.” It is the standard measure of audience reach for USAGM and other international broadcasters. This num-ber is estimated by scientific survey using probability sampling to identify and project audience members in a given population.
Wherever possible, USAGM-commissioned surveys are national in scope, including rural and eco-nomically marginal populations that are typically excluded from commercial media studies but whose behavior is critical for understanding USAGM’s audience and tracking performance.
Although USAGM has conducted surveys in more than 100 countries and territories, and is find-ing ways within tight budget environments to add key performance indicators to others’ surveys, it cannot survey everywhere that an audience might possibly exist, and the estimate may there-fore reflect an undercount.
Measured audience size and its expression as a percentage of the adults within a population, is not the same as “popularity” or “preferred source of news” – indicators sometimes cited by other polls. Weekly audience is also not the same as “footprint” or the number of people who have access to broadcasts. Measured audience size is in keeping with the standards of the Conference of International Broadcasting Audience Researchers, and is a key indicator of success for interna-tional broadcasters in a local market.
QUALITY RESEARCH
USAGM’s audience and market research is done in accordance with the highest professional standards via local market research firms around the world. The research was conducted through contracts with various research firms from FY 2014 to FY 2018. USAGM has also relied on indus-try experts such as AC Nielsen, comScore and others for market data, although only surveys using USAGM’s standard questions and meeting its methodological and quality-control criteria are currently used to estimate its audience.
To achieve maximum objectivity, measurements are performed independently. Outside research providers under contract to USAGM carry out the representative audience research on VOA, OCB, RFE/RL, RFA, and MBN. Network-wide performance values are computed by the USAGM Office of Policy and Research and verified by each network’s research director.
INVESTMENT IN RESEARCH
Reliable and high quality research allows us to assess our effectiveness, and to tailor program-ming and delivery methods. Research funding obligated in FY 2018 was just under $4 million, which was divided among quantitative and qualitative research ($2.7 million), digital analytics and related services ($900,000), and research methodology ($250,000). In FY 2018, USAGM had an increased emphasis on digital analytics and competitive landscaping, and also began laying the groundwork for future upgrades in methodology.
HARD TO REACH LOCALES
USAGM is able to do legitimate survey research, at our standards of performance, in the over-whelming majority (95 percent) of USAGM target countries and regions. Only in 5 percent of the cases are were we not able to do the work in the five fiscal years ending in FY 2018 (China-XUAR, North Korea, Tibet, Oman, and Turkmenistan). In countries where information is tightly con-trolled and tuning in to foreign broadcasts is sometimes illegal or where populations are hard to access, audiences can be difficult to measure. Numbers for these hard-to-reach countries and regions (where we can only conduct non-representative surveys) are not included in our overall estimate.
OTHER METHODOLOGY TOPICS
Quantitative audience measurements are conducted through national (and to a small extent and sub-national or urban surveys), using face-to-face interviews when possible and phone interviews in a few restricted environments.
Random probability sampling is used where possible, and sample sizes range from 1,000-5,000 respondents. Probability sampling means that survey participants are chosen such that each unit of the population has a known probability of being surveyed. The use of random probability sampling allows a researcher to make extrapolations to the wider population.
Non-representative surveys are surveys that do not employ random probability sampling, and thus cannot be extrapolated to the population. These would include surveys of diaspora or refu-gee populations.
The information in this document was sourced from USAGM’s Performance and Accountability Report, available here.
330 Independence Avenue SWWashington, DC 20237
202.203.4400 | usagm.gov
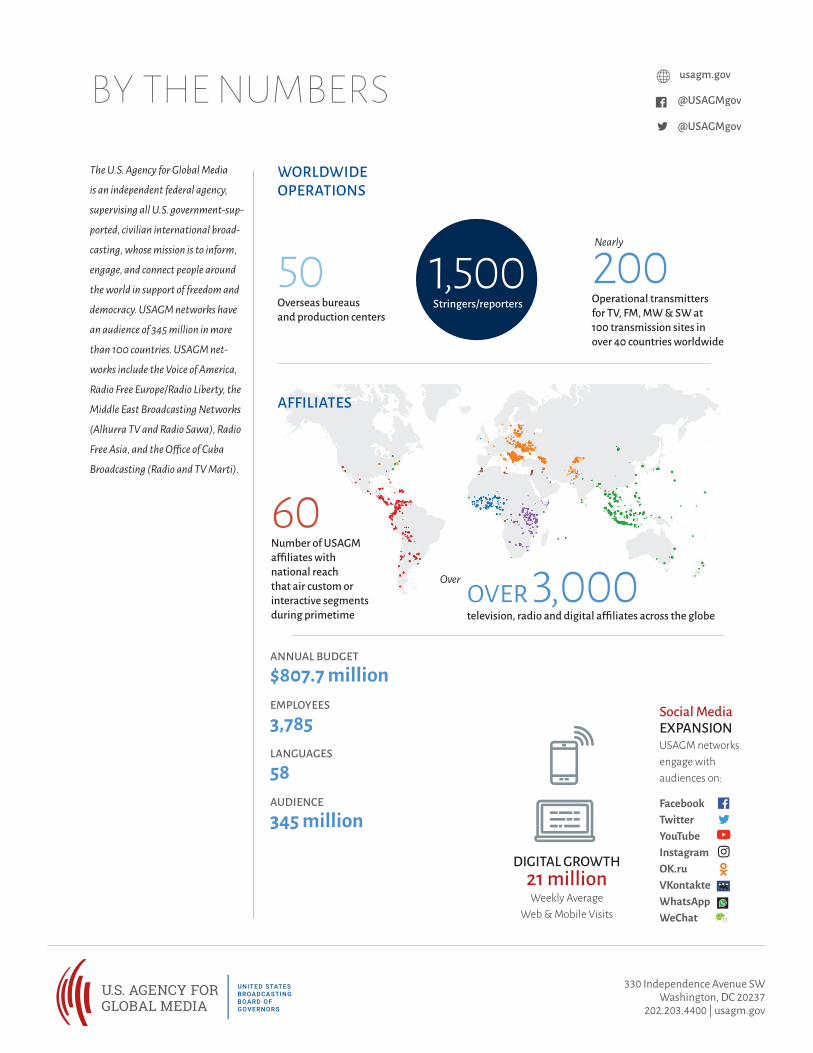
BY THE NUMBERS
ANNUAL BUDGET
$807.7 millionEMPLOYEES
3,785LANGUAGES
58AUDIENCE
345 million
@USAGMgov
@USAGMgov
usagm.gov
OVER 3,000 television, radio and digital affiliates across the globe
60 Number of USAGM affiliates with national reach that air custom or interactive segments during primetime
Over
50 Overseas bureaus and production centers
200 Operational transmitters for TV, FM, MW & SW at 100 transmission sites in over 40 countries worldwide
Nearly
1,500 Stringers/reporters
Social MediaEXPANSION USAGM networks engage with audiences on:
FacebookTwitterYouTubeInstagramOK.ruVKontakteWhatsAppWeChat
DIGITAL GROWTH21 millionWeekly Average
Web & Mobile Visits
AFFILIATES
The U.S. Agency for Global Media
is an independent federal agency,
supervising all U.S. government-sup-
ported, civilian international broad-
casting, whose mission is to inform,
engage, and connect people around
the world in support of freedom and
democracy. USAGM networks have
an audience of 345 million in more
than 100 countries. USAGM net-
works include the Voice of America,
Radio Free Europe/Radio Liberty, the
Middle East Broadcasting Networks
(Alhurra TV and Radio Sawa), Radio
Free Asia, and the Office of Cuba
Broadcasting (Radio and TV Marti).
WORLDWIDE OPERATIONS