audio melody extraction based on timbral...
TRANSCRIPT
AUDIO MELODY EXTRACTION BASED ON TIMBRAL SIMILARITY
Matija Marolt University of Ljubljana
Faculty of Computer and Information Science Trzaska 25, 1000 Ljubljana, Slovenia [email protected]
ABSTRACT The extended abstract presents our approach to extrac-tion of melody from audio recordings, based on timbral similarity of melodic fragments. The algorithm was sub-mitted to MIREX 2005 competition and scored 5th among 9 submissions, with an average score of 59.18% correctly transcribed voiced and unvoiced portions. Keywords: melody extraction, timbre, melodic frag-ments
1 INTRODUCTION Our approach to melody extraction is centered around finding audio fragments with well-defined melody and clustering these fragments based on their pitch, loudness and timbral similarity. Melodic lines are then grown out of the clustered fragments. The algorithm is composed of several consecutive steps. Each step integrates informa-tion from previous ones into a higher-level representa-tion, resulting in a set of melodic lines, out of which the dominant one is picked as the melody. The steps are:
1. finding predominant pitches in short regions of the audio signal;
2. forming melodic fragments by tracking and merg-ing continuous pitch contours;
3. finding fragments with well defined melody (me-lodic seeds), calculating their similarity based on pitch, loudness and timbral features, and cluster-ing seeds based on their similarity matrix. Each cluster is taken to represent one melodic line;
4. making a directed acyclic graph through frag-ments between each pair of seeds, and calculating the least costly path, based on time-frequency proximity and fragment similarity;
5. forming melodic lines as the least costly paths through all the seeds within each cluster. The line in the dominant cluster is picked as the result.
2 PREDOMINANT PITCH ESTIMATION The procedure has been described in more detail in our DAFX-04 paper [1]. To sum up, we first use SMS analy-sis [2] to separate the slowly varying sinusoidal compo-nents of the signal from the rest (transients and noise). The obtained sinusoidal components are subjected to a psychoacoustic masking model that eliminates the com-ponents masked by stronger ones. We then estimate the predominant pitches in short (10 ms) segments of the
signal. Our pitch estimating procedure is based on the PreFEst approach introduced by Goto [3], with some modifications. It uses EM to iteratively estimate domi-nant pitches in segments of processed audio.
3 FORMING MELODIC FRAGMENTS Melodic fragments are formed by tracking the dominant pitches through time and thereby forming fragments with continuous pitch contours (loudness or other factors are not taken into consideration). The first part of the proce-dure is similar to pitch salience calculation as described by Goto [3]. For each pitch with weight greater than a dynamically adjusted threshold, salience is calculated according to its dominance in a 50 ms look-ahead win-dow. The procedure tolerates pitch deviations and indi-vidual noisy frames that might corrupt pitch tracks by looking at the contents of the entire 50 ms window. After saliences are calculated, melodic fragments are formed by continuously tracking the dominant salient peaks and producing fragments along the way. The final result of this simple procedure is an initial set of melodic frag-ments, which may overlap in time, are at least 30 ms long and may have slowly varying pitches. Parameters of each fragment are its start and end time, its time-varying pitch and its time-varying loudness.
Due to various interfering noises or strong vibrato fragments belonging to individual tones may be found in several smaller (broken) pieces. A mending procedure is therefore performed to merge neighbouring broken fragments with similar pitch and loudness into larger units. To resolve ambiguities when several competing options are available for fragment merging, small di-rected acyclic graphs (DAGs) are formed in ambiguous sections. Vertices of DAGs represent fragments, while edges and their costs are determined on the basis of fragment proximity in time, frequency, EM weight and loudness. Fragments are merged by finding shortest paths in these graphs.
Finally, weak fragments (length less than 50 ms or low loudness) are removed and long fragments broken at strong onsets and offsets to prevent individual fragments to extend over different melodic lines.
4 CLUSTERING MELODIC SEEDS We assume that a melodic line is composed of events (melodic fragments) which are similar in pitch, loudness and timbre. Before forming melodic lines, we therefore cluster melodic fragments into several clusters based on their similarity according to features describing pitch,
loudness and timbre. Different clusters are assumed to represent different melodic lines. As timbral features may not be reliably calculated for short or quiet fragments, we first pick a set of fragments with well-defined melody, called melodic seeds. These represent the basis for for-mation of melodic lines. Melodic seeds are clustered and melodic lines grown from them by adjoining neighbour-ing fragments to each line.
4.1 Finding melodic seeds
Melodic seeds are extracted from the set of all me-lodic fragments according to their relative loudness and mean loudness. We define relative loudness as:
( ) ( )
( )f
f frf
t t
l t w tl
L t∈
= ∑ , (1)
where lf(t) is loudness of fragment f at time t, wf(t) weight of the tone model that originated the fragment and L(t) overall loudness of the signal. Relative loudness grows with fragment length, loudness and pitch strength.
Melodic seeds are picked by first using Grubbs' test for eliminating outliers in relative loudness and then picking fragments with relative loudness above one standard deviation from the mean of fragments without outliers. The obtained set of fragments is subjected to another sieve, which removes all fragments with loud-ness smaller than one standard deviation below the mean loudness of fragments. We call fragments in the result-ing set melodic seeds, as they represent regions with strongly defined melody.
4.2 Calculating seed similarity
To calculate fragment similarity, we trained a feed-foward neural network on a set of examples from ISMIR2004 melody extraction competition. Inputs of the network consist of a set of 20 features describing
musical properties of fragments and include: • mean frequency; • average weight of the tone model that originated
the fragment, as calculated by the EM procedure; • mean loudness; • percentages of fragment length covered by frag-
ments an octave above and below; • ratio of first three even to odd harmonics; • spectral centroid and bandwidth of partials be-
longing to the fragment; • spectral irregularity and ratio of even to all har-
monics [4]; • several cepstral coefficients; • tristimulus and inharmonicity [4]. These features were picked out of a larger set of fea-
tures in a training/evaluation procedure for the network. The trained network is used to calculate similarity be-tween all melodic seeds and the obtained similarity ma-trix is used as the basis for clustering.
4.3 Clustering
Clustering is performed on seed similarity matrix with kmeans algorithm. Melodic seeds are clustered into two to five clusters. The optimal number of clusters is then picked according to the silhouette criterion. If between-cluster diversity of the optimal solution is not large enough, all seeds are put into a single cluster. Finally, seeds that lie on cluster borders are assigned to all the neighbouring clusters as well, so that one seed may be-long to several clusters. The results of the procedure are illustrated in parts A and B of Figure 1.
5 FORMING MELODIC LINES Melodic seeds in different clusters represent the founda-tion for formation of melodic lines (one line per cluster).
Figure 1. Steps in finding the melodic line; A: finding melodic fragments, B: melodic seeds are extracted and clustered, C: directed acyclic graphs are formed between closely spaced seeds, D: DAGs are formed and best paths found between each linked pair of seeds, E: best paths are found between DAGs of seeds, F: best cluster is found and melodic line extracted (ground truth on the plot is offset from extracted melody for clarity)
These are formed by adjoining melodic fragments to seeds and thereby growing individual clusters. Finally, the dominant cluster is picked and its melodic line pro-nounced as the winner. The procedure can be explained in several steps, illustrated in Figure 1 and described in the following subsections
5.1 Grouping melodic seeds
Melodic seeds within each cluster are linked into di-rected acyclic graphs (DAGs) according to seed prox-imity in time and frequency. Graphs represent groups of melodic seeds that are close in time, frequency and tim-bral similarity, as all vertices in a graph belong to the same cluster. Such groups form a rough approximation of larger melodic regions within a piece (see Figure 1C).
5.2 Adding fragments to seed groups
After groups of melodic seeds are formed, each linked pair of seeds within each group is joined with a new di-rected acyclic graph through all the melodic fragments between the two seeds. Graph edges are formed accord-ing to time-frequency proximity of fragments. Costs of edges are calculated according to a linear combination of:
• frequency difference between nodes; • loudness difference between nodes; • time gap between nodes; • penalty for interrupting a continuous sequence of
fragments; • similarity (as calculated by the FF network) to all
melodic seeds within the seed group; • similarity between the two nodes. The features and their respective weights within the
linear combination were obtained by optimizing the en-tire melody extraction procedure with a genetic algo-rithm on the ISMIR 2004 dataset.
Shortest path algorithm is then applied to the DAG between a pair of melodic seeds to find the optimal path through fragments between the two seeds and fragments on the path added to the seed group. This results in a finer definition of melody between melodic seeds and is illustrated in Figure 1D.
5.3 Finding best paths within seed groups
Cost of the shortest path between two melodic seeds is taken as the cost of the edge between the two seeds in the DAG defining the group that the two seeds belong to (Figure 1C). Shortest path algorithm is again applied to each seed group to remove the ambiguities that may arise due to competing paths within groups. This results in a clear definition of melody within each group of melodic seeds (see Figure 1E).
5.4 Picking the dominant cluster
Finally, we search for the dominant cluster of fragments to represent the main melodic line. Several criteria, in-cluding fragment loudness, coverage of melody over time
and cluster consistency are involved in the search proce-dure and the cluster with the highest score is taken to represent the main melody, which is decoded from DAGs belonging to the cluster (Figure 1F).
6 PERFORMANCE The presented algorithm was submitted to MIREX
2005 competition and scored 5th among 9 submissions, with an average score of 59.2% correctly transcribed voiced and unvoiced portions. Table 1 lists results for our algorithm (other numbers and results of other ap-proaches are given on http://www.music-ir.org /evaluation/mirex-results/audio-melody/index.html).
Table 1. Results for our algorithm. Description of individual numbers is given on MIREX results web page (see URL above).
Voicing Detection
Voicing FP
Raw Pitch Acc.
Chroma Acc.
Overall Accuracy
71.8% 32.4% 59.8% 66.7% 59.2%
As identity of individual incipits used for evaluation
is not known, it is difficult to assess where the perform-ance was at its worst or best.
Overall, scores and the types of errors are consistent with our previous tests. We do not perform any kind of explicit voicing detection when forming melodic frag-ments. Whatever area is covered by any of the found melodic lines (these consist of melodic fragments) is considered as voiced. It's apparent that our entire frag-ment finding procedure does not perform very well, as our voicing detection scores are amongst the worst of all approaches that actually consider voiced/unvoiced de-tection, lagging significantly behind the top scores. Our fragment finding algorithm has already been identified as the main culprit for poor performance when we tested our approach on the ISMIR 2004 melody extraction dataset augmented with three incipits made available to MIREX 2005 contest participants. The average per-formance on this set was 71.8%, which is somewhat higher, due to several relatively simple synthesized in-cipits. In that set, our fragment finding procedure cor-rectly found only 77% of fragments belonging to the melody (23% of melody was not covered by fragments and therefore missing already at this stage of the algo-rithm). In some cases, the percentage of melodic line covered within a ±25 cent window only reached 50% - i.e. with Madonna's Frozen, shown also in Figure 2. Masking and vibrato, resulting in poor or inexistent fre-quency estimates are the main sources of fragment find-ing errors, poor time resolution (we use 100 ms windows in SMS analysis) another – if we increase the error tol-erance to 50 a cent window, coverage of melodic line in Madonna's Frozen grows to 70%. We are considering replacing the SMS-EM approach with some other tech-nique to improve on fragment finding performance, as
further steps in our algorithm can not remedy the errors made in this stage.
On the other hand, we are quite happy with our ap-proach to forming melodic lines from fragments by clus-tering melodic seeds and growing lines out of these seeds. If we disregard octave errors, which may be prob-lematic (i.e. in piece no 13, where the whole melody was misjudged by an octave), the raw chroma accuracy score is very close to the voicing estimate, showing that out of the found fragments, most were correctly placed into the main or other melodic lines. It may occur that in pieces where melody varies a lot in pitch and/or timbre, frag-ments belonging to the main melodic line get clustered into several clusters, but such cases are rare. If they do occur, this results in a situation where the melody is bro-ken into several melodic lines and the final result (one melodic line) therefore only contains some parts of mel-ody, although other parts were also discovered.
Overall, we shall concentrate our further work pri-marily on improvements of the fragment discovery algo-rithm, as this appears to be the weakest link in our chain.
REFERENCES [1] M. Marolt, "On Finding Melodic Lines in Audio
Recordings," Proceedings of DAFX-04, Naples, Italy.
[2] X. Serra and J. O. Smith, “Spectral Modeling Synthesis: A Sound Analysis/Synthesis System Based on a Deterministic Plus Stochastic Decomposition”, Computer Music Journal 14(4), pp. 14–24, 1990.
[3] M. Goto, “A Predominant-F0 Estimation Method for CD Recordings: MAP Estimation using EM Algorithm for Adaptive Tone Models”, in Proc. of 2001 IEEE International Conference on Acoustics, Speech, and Signal Processing, pp.V-3365-3368, May 2001.
[4] A. Eronen, "Automatic Musical Instrument Recognition", M.Sc. Thesis, Tampere University of Technology, Finland.
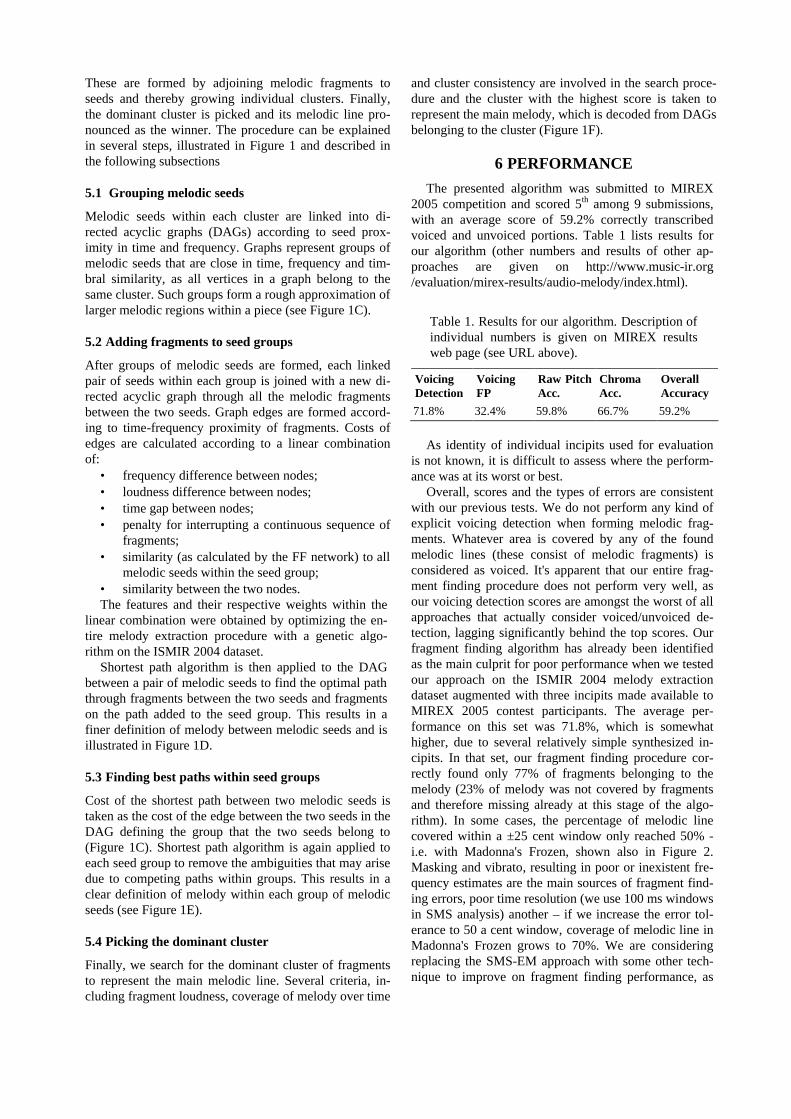
Figure 2. Bad with Madonna: poor fragment finding on Madonna's Frozen. In the shown excerpt, only 40% of the ground truth is covered by found melodic fragments within a ±25 cent window (ground truth ± 25 cents). Such errors cannot be improved in later stages of our approach.