audit assessment of quality of service
TRANSCRIPT

AUDIT & ASSESSMENT OF
QUALITY OF SERVICE
NORTH ZONE – DELHI CIRCLE CELLULAR MOBILE TELEPHONE SERVICE
(CMTS) (APRIL TO JUNE 2016)
PREPARED BY:
PHISTREAM CONSULTING PRIVATE LIMITED (An ISO – 9001:2008 Certified Company)
Office: C – 56A/5, First Floor, Sector – 62, Noida ● Telephone: +91-120-644-7778 ● Email: [email protected]

April to June 2016 – Delhi Circle 2
TABLE OF CONTENTS
1. INTRODUCTION ............................................................................................................................................... 4 1.1. ABOUT TRAI ............................................................................................................................................... 4 1.2. ABOUT PHISTREAM CONSULTING PRIVATE LIMITED ....................................................................................... 4 1.3. OBJECTIVES................................................................................................................................................ 4 1.4. COVERAGE ................................................................................................................................................. 5 1.5. SSA LIST .................................................................................................................................................. 5 1.6. FRAMEWORK USED ..................................................................................................................................... 6
2. PMR REPORTS .............................................................................................................................................. 7 2.1. MONTHLY PMR .......................................................................................................................................... 8 2.2. AUDIT PARAMETER: NETWORK .................................................................................................................... 9 2.3. DATA EXTRACTION POINTS .......................................................................................................................... 9 2.4. AUDIT PROCEDURE ................................................................................................................................... 10 2.5. NETWORK CALCULATION METHODOLOGY ................................................................................................... 11 2.6. 3G VOICE ................................................................................................................................................. 12 2.7. 2G & 3G WIRELESS .................................................................................................................................. 13
3. 3 DAYS LIVE DATA ....................................................................................................................................... 14 3.1. TCBH: SIGNIFICANCE AND SELECTION METHODOLOGY .............................................................................. 14 3.2. CBBH: SIGNIFICANCE AND SELECTION METHODOLOGY .............................................................................. 15
4. CUSTOMER SERVICE PARAMETERS ............................................................................................................... 16 4.1. AUDIT PARAMETERS: CUSTOMER SERVICE ................................................................................................. 16 4.2. CALCULATION METHODOLOGY: CUSTOMER SERVICE PARAMETER ............................................................... 17 4.3. LIVE CALLING: SIGNIFICANCE AND METHODOLOGY ...................................................................................... 18 4.4. BILLING COMPLAINTS ................................................................................................................................ 18 4.5. SERVICE COMPLAINTS REQUESTS ............................................................................................................. 19 4.6. LEVEL 1 .................................................................................................................................................... 19 4.7. PROCESS TO TEST LEVEL 1 SERVICE ......................................................................................................... 19 4.8. CUSTOMER CARE ...................................................................................................................................... 21 4.9. INTER OPERATOR CALL ASSESSMENT ........................................................................................................ 21
5. DRIVE TEST: SIGNIFICANCE AND METHODOLOGY ........................................................................................... 22 5.1. OPERATOR ASSISTED DRIVE TEST ............................................................................................................. 22 5.2. INDEPENDENT DRIVE TEST ........................................................................................................................ 23 5.3. PARAMETERS EVALUATED DURING DRIVE TEST.......................................................................................... 24
6. EXECUTIVE SUMMARY .................................................................................................................................. 25 6.1. OPERATORS COVERED .............................................................................................................................. 25 6.2. AUDIT SCHEDULE ...................................................................................................................................... 26 6.3. 2G VOICE PMR DATA: APRIL ................................................................................................................... 27 6.4. 2G VOICE PMR DATA: MAY ...................................................................................................................... 27 6.5. 2G VOICE PMR DATA: JUNE ..................................................................................................................... 27 6.6. 2G VOICE PMR DATA: CONSOLIDATED ...................................................................................................... 28 6.7. 2G VOICE 3 DAYS LIVE DATA .................................................................................................................... 28 6.8. 2G VOICE 3 DAYS LIVE DATA: APRIL .......................................................................................................... 28 6.9. 2G VOICE 3 DAYS LIVE DATA: MAY ............................................................................................................ 29 6.10. 2G VOICE 3 DAYS LIVE DATA: JUNE ......................................................................................................... 29 6.11. 3 DAYS LIVE DATA: CONSOLIDATED ......................................................................................................... 29 6.12. 3G VOICE PMR: CONSOLIDATED ............................................................................................................. 30 6.13. 3G VOICE PMR: APRIL ........................................................................................................................... 30 6.14. 3G VOICE PMR: MAY ............................................................................................................................. 30 6.15. 3G VOICE PMR: JUNE ............................................................................................................................ 31 6.16. 3G VOICE 3 DAYS LIVE DATA: CONSOLIDATED ......................................................................................... 31 6.17. 3G VOICE 3 DAYS LIVE DATA: APRIL ........................................................................................................ 31 6.18. 3G VOICE 3 DAYS LIVE DATA: MAY .......................................................................................................... 32 6.19. 3G VOICE 3 DAYS LIVE DATA: JUNE ......................................................................................................... 32

April to June 2016 – Delhi Circle 3
6.20. PMR MONTHLY 2G WIRELESS DATA - CONSOLIDATED ................................................................ 33 6.21. PMR MONTHLY 2G WIRELESS DATA - APRIL ................................................................................... 33 6.22. PMR MONTHLY 2G WIRELESS DATA - MAY ..................................................................................... 34 6.23. PMR MONTHLY 2G WIRELESS DATA - JUNE .................................................................................... 34 6.24. PMR 3 DAY LIVE 2G WIRELESS DATA - CONSOLIDATED ............................................................... 35 6.25. PMR 3 DAY LIVE 2G WIRELESS DATA - APRIL ................................................................................. 35 6.26. PMR 3 DAY LIVE 2G WIRELESS DATA - MAY .................................................................................... 36 6.27. PMR 3 DAY LIVE 2G WIRELESS DATA - JUNE .................................................................................. 36 6.28. PMR MONTHLY 3G WIRELESS DATA - CONSOLIDATED ................................................................ 37 6.29. PMR MONTHLY 3G WIRELESS DATA - APRIL .................................................................................... 37 6.30. PMR MONTHLY 3G WIRELESS DATA - MAY ..................................................................................... 38 6.31. PMR MONTHLY 3G WIRELESS DATA – JUNE ................................................................................... 38 6.32. PMR 3 DAY LIVE 3G WIRELESS DATA - CONSOLIDATED ............................................................... 39 6.33. PMR 3 DAY LIVE 3G WIRELESS DATA - APRIL ................................................................................. 40 6.34. PMR 3 DAY LIVE 3G WIRELESS DATA - MAY .................................................................................... 40 6.35. PMR 3 DAY LIVE 3G WIRELESS DATA - JUNE .................................................................................. 41 6.36. POI CONGESTION: CONSOLIDATED .......................................................................................................... 41 6.37. POI CONGESTION: APRIL ........................................................................................................................ 42 6.38. POI CONGESTION: MAY .......................................................................................................................... 42 6.39. POI CONGESTION: JUNE ......................................................................................................................... 42
7. CUSTOMER SERVICE DELIVERY ..................................................................................................................... 43 7.1. BILLING AND CUSTOMER CARE .................................................................................................................. 43 7.2. LIVE CALLING DATA: CONSOLIDATED ......................................................................................................... 44 7.3. 3 DAYS LIVE CALL CENTRE DATA .............................................................................................................. 45
8. L1 CALLING DATA ........................................................................................................................................ 46 8.1. AIRCEL ..................................................................................................................................................... 46 8.2. AIRTEL ..................................................................................................................................................... 47 8.3. IDEA…………….. ..................................................................................................................................... 48 8.4. MTNL ...................................................................................................................................................... 49 8.5. MTS… ..................................................................................................................................................... 50 8.6. RCOM CDMA .......................................................................................................................................... 51 8.7. RCOM GSM ............................................................................................................................................ 52 8.8. TTSL CDMA ............................................................................................................................................ 53 8.9. VODAFONE ............................................................................................................................................... 54
9. OPERATOR ASSISTED DRIVE TEST ................................................................................................................ 55 9.1. MAY: DELHI SSA ...................................................................................................................................... 55 9.2. DISTANCE COVERED: DELHI SSA .............................................................................................................. 55 9.3. ROUTE MAP: DELHI SSA: DAY 1 ................................................................................................................ 56 9.4. ROUTE MAP: DELHI SSA: DAY 2 ................................................................................................................ 56 9.5. ROUTE MAP: DELHI SSA: DAY 3 ................................................................................................................ 57 9.6. DRIVE TEST OUTCOME SUMMARY .............................................................................................................. 57 9.7. JUNE: DELHI SSA ..................................................................................................................................... 58 9.8. DELHI SSA: DISTANCE COVERED .............................................................................................................. 58 9.9. ROUTE MAP: DELHI SSA: DAY 1 ................................................................................................................ 58 9.10. ROUTE MAP: DELHI SSA: DAY 2 .............................................................................................................. 59 9.11. ROUTE MAP: DELHI SSA: DAY 3 .............................................................................................................. 59 9.12. DRIVE TEST OUTCOME ............................................................................................................................ 60
10. COUNTER DETAILS ....................................................................................................................................... 61 10.1. ERICSSON .............................................................................................................................................. 62 10.2. NSN (NOKIA SIEMENS NETWORK) ........................................................................................................... 63 10.3. HUAWEI .................................................................................................................................................. 63
11. BLOCK SCHEMATIC DIAGRAM ....................................................................................................................... 65 11.1. ERICSSON .............................................................................................................................................. 65 11.2. NSN ...................................................................................................................................................... 66 11.3. HUAWEI .................................................................................................................................................. 67
12. ABBREVIATIONS ........................................................................................................................................... 68 13. ANNEXURE .................................................................................................................................................. 69 14 KEY FINDINGS ............................................................................................................................................ 100

April to June 2016 – Delhi Circle 4
1. INTRODUCTION
1.1. ABOUT TRAI
TRAI's mission is to create and nurture conditions for growth of telecommunications in the country in a
manner and at a pace that will enable India to play a leading role in the emerging global information society.
One of the main objectives of TRAI is to provide a fair and transparent policy environment which promotes
a level playing field and facilitates fair competition.
In pursuance of above objective, TRAI has been issuing regulations, order and directives to deal with the
issues or complaints raised by the operators as well as the consumers. These regulations, order and
directives have helped to nurture the growth of multi operator multi service - an open competitive Junket
from a government owned monopoly. Also, the directions, orders and regulations issued cover a wide
range of subjects including tariff, interconnection and quality of service as well as governance of the
Authority.
TRAI initiated a regulation - The Standard of Quality of Service of Basic Telephone Service (Wireline) and
Cellular Mobile Telephone Service regulations, 2009 (7 of 2009) dated June 20, 2009 and Quality of
Service of Broadband Service Regulations, 2006 (11 of 2006) dated April 6, 2006 that provide the
benchmarks for the parameters on customer perception of service to be achieved by service provider.
In order to assess the above regulations, TRAI has commissioned a third party agency to conduct the audit
of the service providers and check the performance of the operators on the various benchmarks set by
Telecom Regulatory Authority of India (TRAI).
1.2. ABOUT PHISTREAM CONSULTING PRIVATE LIMITED
Phistream Consulting Private Limited is an ISO: 9001 certified company who are one of the pioneers in the
field of technical audit, quality assurance and third party inspection services. Established more than a
decade ago in 2004, we aspire to provide longer term savings based on year-on-year productivity. With
our size, we are nimble and aspire to being a full service partner for providing consultancy services.
We have been helping our clients by determining the best solutions and enabling businesses to enjoy the
benefits of top-notch support without distracting their team from the main business focus. Our business
analysts have enough experience to get involved at the requirements gather stage through consulting work
handing off a detailed requirements document to our operations staff who in turn can train our support and
maintenance resources for ongoing engagement.
In keeping with our goal of being a one stop quality assurance and consulting partner, our specialists
employ a strategy and consulting-based implementation methodology and capitalize on strong program
governance to offer a wide range of services for various industry verticals.
1.3. OBJECTIVES
The primary objective of the Audit module is to:
Audit and Assess the Quality of Services being rendered by Cellular Mobile (Wireless) service
against the parameters notified by TRAI. (The parameters of Quality of Services (QoS) have been
specified in the respective regulations published by TRAI).
This report covers the audit results of the audit conducted for Cellular Mobile (Wireless) services in
Delhi circle.

April to June 2016 – Delhi Circle 5
1.4. COVERAGE
The audit was conducted in Delhi Circle covering all SSAs (Secondary Switching Areas).
Image Source: Wikipedia
1.5. SSA LIST
S. No. Circle SSA Name SDCA Name
1 New Delhi NEW DELHI NEW DELHI

April to June 2016 – Delhi Circle 6
1.6. FRAMEWORK USED
Audit Activities
PMR Reports
Monthly PMR
3 Days Live Data
Customer Service
Drive Test
Operator Assisted
Independent
Level 1 Service
CSD Audit
Billing Complain
Service request
Customer Service
Wireline & Broadband
Billing Complain
Service Request
Level 1 Service
Customer Service
Inter Operator Call Assessment

April to June 2016 – Delhi Circle 7
2. PMR REPORTS
Significance and methodology: PMR or Performance Monitoring Reports are generated to assess the
various Quality of Service parameters involved in the mobile telephony service, which indicate the overall
health of service for an operator.
The PMR report for network parameters is taken for each month of the audit quarter and is extracted and
verified in the first week of the subsequent month of the audit month. For example, April 2016 audit data was
collected in the month of May 2016.
The PMR report for customer service parameters is extracted from Customer Service Centre and verified
once every quarter in the subsequent month of the last month of the quarter. For example, data for quarter
ending June 2016 was collected in the month of June 2016.
The raw data extracted from operator’s systems is used to create PMR in the following three formats:
Monthly PMR (Network Parameters)
3 Day Live Measurement Data (Network Parameters)
Customer Service Data
Let us understand these formats in details.
The TSP is intimated about the audit schedule in advance and accordingly the auditor visits the TSP premises to conduct the audit
Raw Data is extracted from the operator’s NOC/OMCR/call centre/billing centre etc. by the auditor with assistance from the operator personnel in order to generate PMR reports (Network/ Billing/ Customer Service etc.)
Calculations are done to generate new PMR from the RAW data
Hard copy of the PMR is duly signed by the auditor and competent authority from operator end.

April to June 2016 – Delhi Circle 8
2.1. MONTHLY PMR
This involved calculation of the various Quality of Service network parameters through monthly Performance
Monitoring Reports (PMR). The PMR reports were generated from the data extracted from operator’s
systems by the auditor with the assistance of the operator at the operator’s premises for the month of April,
May and June 2016. The performance of operators on various parameters was assessed against the
benchmarks.
Parameters includes:
• BTS accumulated downtime • Worst affected BTS due to downtime
Network Availability
• Call Set Up success Rate (CSSR)
Connection Establishment (Accessibility)
• SDCCH/Paging Channel Congestion • TCH Congestion • Point of Interconnection
Network Congestion Parameters
• Call Drop rate • Worst affected cells having more than 3% TCH drop
Connection Maintenance
• % Connections with good voice quality
Voice Quality

April to June 2016 – Delhi Circle 9
R
2.2. AUDIT PARAMETER: NETWORK
Let us now look at the various parameters involved in the audit reports.
2.3. DATA EXTRACTION POINTS
The data is extracted from a terminal/computer connected to NOC or OMCR or OSS on the operator
network.
April to June 2016 – Delhi Circle 10
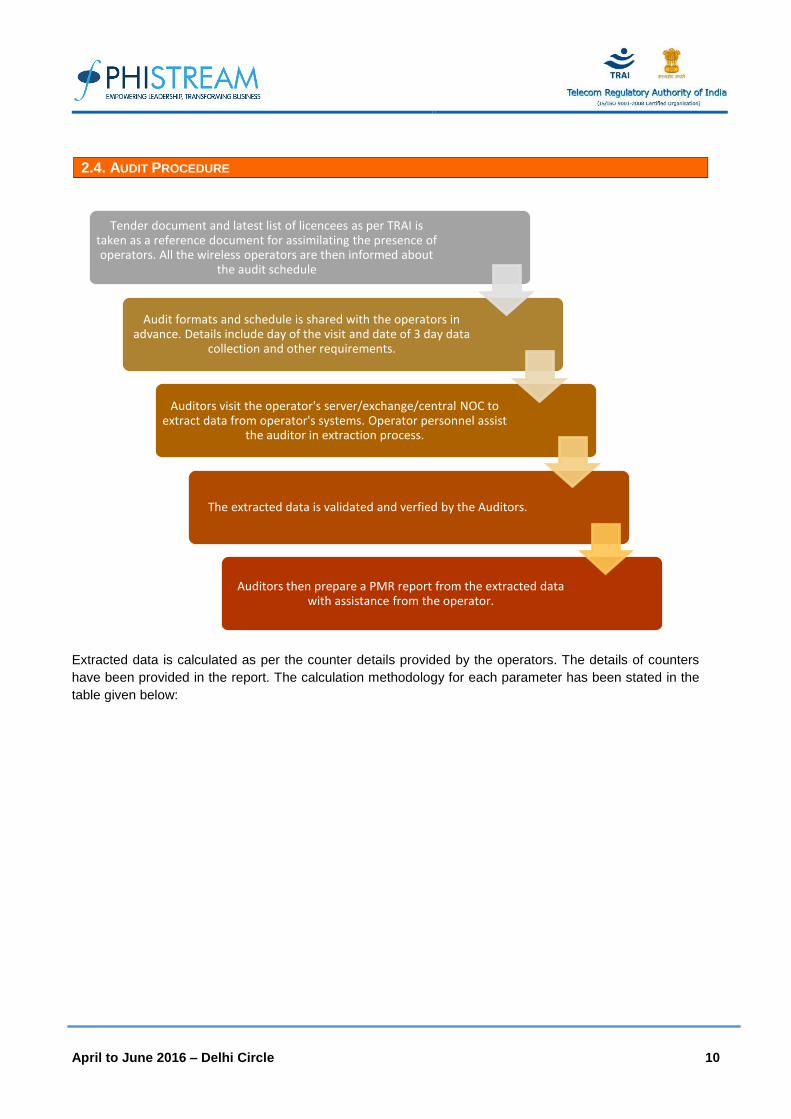
2.4. AUDIT PROCEDURE
Extracted data is calculated as per the counter details provided by the operators. The details of counters
have been provided in the report. The calculation methodology for each parameter has been stated in the
table given below:
Tender document and latest list of licencees as per TRAI is taken as a reference document for assimilating the presence of operators. All the wireless operators are then informed about
the audit schedule
Audit formats and schedule is shared with the operators in advance. Details include day of the visit and date of 3 day data
collection and other requirements.
Auditors visit the operator's server/exchange/central NOC to extract data from operator's systems. Operator personnel assist
the auditor in extraction process.
The extracted data is validated and verfied by the Auditors.
Auditors then prepare a PMR report from the extracted data with assistance from the operator.

April to June 2016 – Delhi Circle 11
2.5. NETWORK CALCULATION METHODOLOGY
Parameter Calculation Methodology
BTS Accumulated Downtime
Sum of downtime of BTSs in a month in hours i.e.
total outage time of all BTSs in hours during a month / (24 x Number of days in a month x
Number of BTSs in the network in licensed service area) x 100
Worst Affected BTS Due to Downtime
(Number of BTSs having accumulated downtime greater than 24 hours in a month / Number of
BTS in
Licensed Service Area) * 100
Call Setup Success Rate (Calls Established / Total Call Attempts) * 100
SDCCH/ Paging Channel Congestion
SDCCH / TCH Congestion% = [(A1 x C1) + (A2 x C2)
+…….+ (An x Cn)] / (A1 + A2 +…+ An)
Where:
A1 = Number of attempts to establish SDCCH / TCH made on day 1
C1 = Average SDCCH / TCH Congestion % on day 1 A2 = Number of attempts to establish
SDCCH / TCH made on day 2
TCH Congestion
C2 = Average SDCCH / TCH Congestion % on day 2 An = Number of attempts to establish
SDCCH / TCH made on day n
Cn = Average SDCCH / TCH Congestion % on day n
POI Congestion
POI Congestion% = [(A1 x C1) + (A2 x C2) +…….+ (An x Cn)] / (A1 + A2 +…+ An) Where:
A1 = POI traffic offered on all POIs (no. of calls) on day 1
C1 = Average POI Congestion % on day 1
A2 = POI traffic offered on all POIs (no. of calls) on day 2
C2 = Average POI Congestion % on day 2
An = POI traffic offered on all POIs (no. of calls) on day n
Cn = Average POI Congestion % on day n
Call Drop Rate Total Calls Dropped / Total Calls Established x 100
Worst Affected Cells having more than
3%
TCH drop
Total number of cells having more than 3% TCH drop during CBBH/ Total number of cells in the
LSA x 100
Connections with good voice quality No. of voice samples with good voice quality / Total number of samples x 100

April to June 2016 – Delhi Circle 12
2.6. 3G VOICE
S. No. Name of Parameter Definition Formula Benchmark
1 Network Availability
a. Total no. of Node B's in LSA
Total no. of Node B's Licensed in LSA
b. Total downtime of all Node B's
When all the sector(s) of a Node B's are down for > 60 minutes at an instant in a whole day
c. No. of Worst Affected Node B's
Node B'ss having more than 24 hours of Downtime in 3 Days
No. of Node B's having accumulated downtime of >24 hours in a month
<=2% ((No. of Node B's having Accumulated Downtime of > 24 hrs in a month) / Total no. of BTSs in the licensed service area)*100
d. Node B's accumulated downtime
Node B's downtime more than 24 hr in 3 days
Total no. of Node B's in the Licensed Service Area
<=2%
Sum of downtime of Node B's in a month in hours i.e. total outage time of all Node B's in hours in a month
[(Sum of downtime of Node B's in a month in hrs)/(24* no. of days in the month*no. of Node B's in the licensed service area)]*100
2 Connection Establishment (Accessibility)
a. Call Setup Success Rate:
It is the % of total no. of call established to the total no. of call attempt
Total No. of Voice Call Attempts
>=95%
Total No. of Voice Call Establishment
CSSR (Call Setup Success Rate = (Total No. of Voice Call Attempts/ Total No. of Voice Call Establishment)*100)
b. RRC Congestion:
RRC Congestion rate is the % of Total No. of RRC Failed Calls to the Total no. of RRC Assigned Calls
RRC Attempts (RRC Connection Access) (A)
<=1% RRC Failed (RRC Connection Access Failed) (B)
RRC Congestion (%) [B/A]*100
c. RAB Congestion:
RAB Congestion rate is the % of Total No. of RAB Failed Calls to the Total no. of RAB Assigned Calls
RAB Attempts (RAB Setup Access) (C)
<=2% RAB Failed (RAB Setup Access Failed) (D)
RAB Congestion (%) [D/C]*100
3 Connection Maintenance (Retainability)
a. Circuit Switched Voice Drop Rate
It is the % of total no. of Dropped Calls to the total no. of Calls Established
Total Established Calls (A)
<=2% Calls Dropped after Establishment (B)
Call Drop Rate [B/A]*100
b. Total No. of Cells (Sector) <=3%

April to June 2016 – Delhi Circle 13
Worst affected cells having more than 3% Circuit Switched Voice Drop Rate:
It is the % of total no. of Cells having > 3% Circuit Switched Voice drop to the total no. cells
Total No. of Cells exceeding 3% Circuit Switched Voice Drop Rate in CBBH (Cell Bouncing Busy Hour)
% of cells having more than 3% Circuit Switched Voice Drop Rate [(No. of cells having Circuit Switched Voice Drop Rate > 3% during CBBH in 31 days*100) / Total no. of cells in the licensed service area]
c.
Percentage of connections with Good Circuit Switched Voice Quality
It can be defined as the % of Good Voice Quality Samples to the total No. of Quality Samples
Percentage of connection with Good Circuit Switched Voice Quality
>=95%
4
Total No. of POI’s in Month having >=0.5% POI congestion
Total no. Of POI's which are exceeding the POI congestion more than 0.5 %.
Total No. of call attempts on POI
<=0.5%
Total traffic served on all POIs (Erlang)
Total No. of circuits on all individual POIs
Total number of working POI Service Area wise
Capacity of all POIs
No. of all POI’s having >=0.5% POI congestion
Name of POI not meeting the benchmark (having >=0.5% POI congestion)
2.7. 2G & 3G WIRELESS
S. No. Name of Parameter Definition Formula Benchmark
1 Service Activation/ Provisioning
This refers to the activation of services after activation of the SIM. This involves programming the various databases with the customer's information and any gateways to standard Internet chat or mail services or any data services.
Total No. of Subscribers for Service Activation (A)
Within 4 Hours with 95% Success Rate Total Service Activations
provided within 4 Hours (B)
Service Activation / Provisioning = (B/A) * 100
2 PDP Context Activation Success Rate
PDP Context Activation Success Rate is the ratio of total number of successfully completed PDP context activations to the total attempts of context activation
Total No. of PDP Context Activation Requests (from SGSN to GGSN) (A)
>=95%
Total No. of PDP Context Activation Success (path created b/w SGSN and GGSN) (B)
PDP Context Activation Success Rate =(B/A) *100
3 Drop Rate
It measures the inability of Network to maintain a connection and is defined as the ratio of abnormal disconnects w.r.t. all disconnects.
RNC originated PS Domain Iu Connection Setup Success (A)
<=5% RNC originated PS Domain Iu Connection Release (B)
Drop Rate = (B/A) * 100

April to June 2016 – Delhi Circle 14
3. 3 DAYS LIVE DATA
The main purpose of 3 day live measurement is to evaluate the network parameters on intraday basis. While
the monthly PMR report provides an overall view of the performance of QoS parameters, the 3 day live data
helps looking at intraday performance on the network parameters discussed earlier. All the calculations are
done on the basis of that raw data of 3 days.
The 3 day live data provides a sample of 9 days in a quarter (3 days each month of a quarter) with hourly
performance, which enables the auditor to identify and validate intraday issues for an operator on the Q0S
network parameters. For example, network congestion being faced by an operator during busy/peak hours.
Network related parameters were evaluated for a period of 3 days in each month. 3 day live audit was
conducted for 3 consecutive weekdays for each month. The data was extracted from each operator’s server/
NOC etc. at the end of the 3rd day. The extracted data is then used to create a report (similar to PMR report)
to assess the various QoS parameters.
3.1. TCBH: SIGNIFICANCE AND SELECTION METHODOLOGY
As per QoS regulations 2009 (7 of 2009), Time Consistent Busy Hour” or “TCBH” means the one hour period
starting at the same time each day for which the average traffic of the resource group concerned is greatest
over the days under consideration and such Time Consistent Busy Hour shall be established on the basis
of analysis of traffic data for a period of ninety days.
During audit, the auditors identified from the raw data that the TCBH for the operators in Apr – May – Jun
2016 was the time period as given below:
Aircel Airtel MTNL Idea RCOM GSM
RCOM CDMA
MTS TTSL CDMA
Vodafone
19:00-20:00
19:00-20:00
19:00-20:00
19:00-20:00
19:00-20:00 19:00-20:00 19:00-20:00
19:00-20:00 19:00-20:00
Daywise RAW Data is fetched from the operator's OMCR and kept in readable format (preferably in MS- Excel). Data for a period of 90 days is used to identify TCBH.
90 Days period is decided upon the basis of month of audit. For example, for the audit of December 2015, the 90 day period data used to identify TCBH would be the data of October, November & December 2015.
For each day, the hour in which average traffic of the resource group concerned is greatest for the day will be the 'Busy Hour' for the operator.
The model frequency of te busy hour is calculated for 90 days period and the hour with highest model frequency will beconsidered as TCBH for the operator.

April to June 2016 – Delhi Circle 15
3.2. CBBH: SIGNIFICANCE AND SELECTION METHODOLOGY
As per QoS regulations 2009 (7 of 2009), Cell Bouncing Busy Hour (CBBH) means the one hour period in a
day during which a cell in cellular mobile telephone network experiences the maximum traffic.
Step by step procedure to identify CBBH for an operator:
Daywise RAW Data is fetched from the operator's OMCR and kept in readable format (preferably in MS- Excel). Data for a period of 90 days is used to identify CBBH.
For each day the hour in which a cell in cellular mobile telephone network experiences maximum traffic for the day will be the 'Busy Hour' for the operator.
The model frequency of the busy hour is calculated for 90 days period and the hour with highest model frequency will be considered as CBBH for the operator.

April to June 2016 – Delhi Circle 16
4. CUSTOMER SERVICE PARAMETERS
The data to generate PMR report for customer service parameters is extracted at the operator premises and
verified once every quarter in the subsequent month of the last month of the quarter. For example, data for
quarter ending June 2016 was collected in the month of June 2016. To extract the data for customer service
parameters for the purpose of audit, auditors primarily visit the following locations/ departments/ offices at
the operator’s end.
Central Billing Center
Central Customer Service Center
The operators are duly informed in advance about the audit schedule.
The Customer Service Quality Parameters include the following:
Metering and billing credibility (post-paid and prepaid)
Resolution of billing/charging complaints
Period of applying credit/waiver/adjustment to customer’s account
Response time to the customer for assistance
Termination/closure of service
Time taken for refund of security deposit after closures.
Most of the customer service parameters were calculated by averaging over the quarter; however billing
parameters were calculated by averaging over one billing cycle for a quarter. All the parameters have been
described in detail along with key findings of the parameter in the report.
The benchmark values for each parameter have been given in the table below.
4.1. AUDIT PARAMETERS: CUSTOMER SERVICE

April to June 2016 – Delhi Circle 17
4.2. CALCULATION METHODOLOGY: CUSTOMER SERVICE PARAMETER
Parameter Calculation Methodology
Metering and billing credibility : Post-paid
Total billing complaints received during the relevant billing
cycle / Total bills generated during the relevant billing cycle
*100
Metering and billing credibility : Pre-paid
Total charging complaints received during the quarter/
Total number of subscribers reported by the operator at the
end of the quarter * 100
Resolution of billing/ charging complaints
(Post-paid + Pre-paid)
There are two benchmarks involved here:
Billing or Charging Complaints resolved in 4 weeks from
date of receipt / Total billing or charging complaints
received during the quarter) x 100
Billing or Charging Complaints resolved in 6 weeks from
date of receipt / Total billing or charging complaints
received during the quarter) x 100
Period of applying credit waiver Number of cases where credit waiver is applied within 7
days/ total number of cases eligible for credit waiver * 100
Call centre performance IVR (Calling getting connected and
answered by IVR)
Number of calls connected and answered by
IVR/ All calls attempted to IVR * 100
Call centre performance (Voice to Voice)
Call centre performance Voice to Voice =
(Number of calls answered by operator within 90 seconds/
All calls attempted to connect to the operator) * 100
The calculation excludes the calls dropped before 90
seconds
Time taken for termination/ closure of service Number of closures done within 7 days/ total number of
closure requests * 100
Time taken for refund for deposit after closures Number of cases of refund after closure done within 60
days/ total number of cases of refund after closure * 100

April to June 2016 – Delhi Circle 18
4.3. LIVE CALLING: SIGNIFICANCE AND METHODOLOGY
Live calling activity was carried out during the period of June 2016. The data considered for live calling was
for the month prior to the month in which the live calling activity was being conducted. In this case, data of
April 2016 was considered for live calling activity conducted in May 2016.
A detailed explanation of each parameter is explained below:
4.4. BILLING COMPLAINTS
Live calling is done to verify Resolution of billing complaints within stipulated time. The process for this
parameter is stated below:
Auditors request the operator provided the database of all the subscribers who reported billing
complaints in one month prior to the auditor visit. In case of BSNL, data for the complaints from the
subscribers belonging to the sample exchanges is requested specifically.
A sample of 10% or 100 complainants, whichever is less, is selected randomly from the list provided
by operator.
Calls are made by auditors to the sample of subscribers to check and record whether the complaint was
resolved within the timeframes as mentioned in the benchmark.
All the complaints related to billing as per clause 3.7.2 of QoS regulation of 20th June, 2016 were considered
as population for selection of samples.
TRAI Benchmark: Resolution of billing/ charging complaints: 98% within 4 weeks, 100% within 6 weeks.
The auditor visits the operator premises for Live Calling. Theoperators provide the RAW data of customer complaints (billingand services) and also the list of customer service numbers tobe verified through live calling
The auditor makes the live calls using operator SIM to a random sample of subscribers from the RAW data provided to verify the resolution of complaints
The auditor verifies the performance of call centre, level 1services by calling the numbers using operator SIM. The list ofcall centre numbersis provided by the operator.
The auditors also make test calls to subscribers of otheroperators to assess the inter-operator call connectivity in thesame licensed service area

April to June 2016 – Delhi Circle 19
4.5. SERVICE COMPLAINTS REQUESTS
“Service request” means a request made to a service provider by its consumer pertaining to his account,
and includes:
A request for change of tariff plan
A request for activation or deactivation of a value added service or a supplementary service or a
special pack
A request for activation of any service available on the service provider’s network
A request for shift or closure or termination of service or for billing details
All the complaints other than billing were covered. A total of 100 calls per service provider for each service
in licensed service area were done by the auditors.
4.6. LEVEL 1
Level 1 is used for accessing special services like emergency services, supplementary services, inquiry and
operator-assisted services.
Level 1 Services include services such as police, fire, ambulance (Emergency services). Test calls were
made from operator SIMs. A total of 150 test calls were made per service provider in the quarter.
While most of the Level 1 services are toll free, it has been observed that some Level 1 services may not be
toll free. In April, May and June’16, auditor has tried contacting the list of Level 1 services provided by TRAI
as per the NNP (National Numbering Plan).
4.7. PROCESS TO TEST LEVEL 1 SERVICE
During the operator assisted drive test, auditors ask the operator authorized personnel to make 5
calls in each SDCA on the Level 1 Service numbers provided by TRAI. The list contains a description
of the numbers along with dialling code.
Operators might also provide a list of L1 services. To identify emergency L1 service numbers,
auditors check if there is any number that starts with code ‘10’ in that list. If auditors find any
emergency number in addition to the below list, that number is also tested during live calling.
On receiving the list, auditors verify it if the below given list of numbers are active in the service
provider’s network.
If there are any other additional numbers provided by the operator, auditors also do live calling on
those numbers along with below list.
If any of these numbers is not active, then we would write the same in our report, auditors write in
the report.
Post verifying the list, auditors do live calling by equally distributing the calls among the various
numbers and update the results in the live calling sheet.

April to June 2016 – Delhi Circle 20
L1 Number Details
100 Police
101 Fire
102 Ambulance
104 Health Information Helpline
108 Emergency and Disaster Management Helpline
138 All India Helpine for Passangers
149 Public Road Transport Utility Service
181 Chief Minister Helpline
182 Indian Railway Security Helpline
1033 Road Accident Management Service
1037 Public Grievance Cell DoT HQ as 'Telecom Consumer Grievance Redressal Helpline'
1056 Emergency Medical Services
106X State of the Art Hospitals - AIIMS
1063 Public Grievance Cell DoT Hq
1064 Anti Corruption Helpline
1070 Relief Commission for Natural Calamities
1071 Air Accident Helpline
1072 Rail Accident Helpline
1073 Road Accident Helpline
1077 Control Room for District Collector
1090 Call Alart ( Crime Branch)
1091 Women Helpline
1097 National AIDS Helpline to NACO
1099 Central Accident and Trauma Services (CATS)
10580 Educational& Vocational Guidance and Counselling
10589 Mother and Child Tracking ( MCTH)
10740 Central Pollution Control Board
10741 Pollution Control Board
1511 Police Related Service for all Metro Railway Project
1512 Prevention of Crime in Railway
1514 National Career Service(NCS)
15100 Free Legal Service Helpline
155304 Municipal Corporations
155214 Labour Helpline
1903 Sashastra Seema Bal (SSB)
1909 National Do Not Call Registry
1912 Complaint of Electricity
1916 Drinking Water Supply
1950 Election Commission of India

April to June 2016 – Delhi Circle 21
4.8. CUSTOMER CARE
Live calling is done to verify response time for customer assistance is done to verify the performance of call
centre in terms of:
Calls getting connected and answered by operator’s IVR.
% age of calls answered by operator / voice to voice) within 90 seconds: In 95% of the cases or
more
The process for this parameter is stated below:
Overall sample size is 100 calls per service provider per circle at different points of time, evenly
distributed across the selected exchanges – 50 calls between 1100 HRS to 1400 HRS and 50 calls
between 1600 HRS to 1900 HRS.
Time to answer the call by the operator was assessed from the time interviewer pressed the requisite
button for being assisted by the operator.
All the supplementary services that have any kind of human intervention are to be covered here. It
also includes the IVR assisted services.
4.9. INTER OPERATOR CALL ASSESSMENT
A total of 100 calls per service provider to all the other service providers in a licensed service area were
done for the purpose of audit.
Inter Operator Call
Assessment Aircel Airtel MTNL Idea
RCOM GSM
RCOM CDMA
TTSL CDMA
Vodafone MTS
Aircel - 100% 100% 100% 100% 100% 100% 100% 100%
Airtel 100% - 100% 100% 100% 100% 100% 100% 100%
MTNL 100% 100% - 100% 100% 100% 100% 100% 100%
Idea 100% 100% 100% - 100% 100% 100% 100% 100%
RCOM GSM 100% 100% 100% 100% - 100% 100% 100% 100%
RCOM CDMA 100% 100% 100% 100% 100% - 100% 100% 100%
TTSL CDMA 100% 100% 100% 100% 100% 100% - 100% 100%
Vodafone 100% 100% 100% 100% 100% 100% 100% - 100%
MTS 100% 100% 100% 100% 100% 100% 100% 100% -

April to June 2016 – Delhi Circle 22
5. DRIVE TEST: SIGNIFICANCE AND METHODOLOGY
Drive test, as the name suggests, is conducted to measure the outdoor coverage in a moving vehicle in a
specified network coverage area.
The main purpose of the drive test is to check the health of the mobile network of various operators in the
area in terms of coverage (signal strength), voice quality, call drop rate, call set up success rate etc.
To assess the indoor coverage, the test is also conducted at two static indoor locations in each SSA, such
as Malls, office buildings, shopping complexes, government buildings etc.
There are two types of drive test as mentioned below.
Operator Assisted Drive Test
Independent Drive Test
The main difference between the two is that in the operator assisted, operators participate in the drive test
along with their hardware, software, phones etc. while in the independent drive test PhiStream conducts the
drive test on solitary basis and uses its own hardware. Operators generally do not have any knowledge of
the independent drive test being conducted.
5.1. OPERATOR ASSISTED DRIVE TEST
Delhi circle consist of total one SSA’s and it needs to be audited in the span of 12 months.
The methodology adopted for the drive test:
3 consecutive days drive test in each SSA. SSA would be defined as per DOT guidelines and month
wise SSA list is finalized by regional TRAI office.
On an average, a minimum of 80 kilometres are covered each day
Route map was designed in such a way that all the major roads, highways and all the important
towns and villages were covered as part of audit.
Special emphasis was given to those areas where the number of complaints received were on the
higher side, if provided by TRAI.
The route is defined in a way that we cover maximum area in the SSA and try to cover maximum
villages and cities within the SSA. The route is designed such that there is no overlap of roads and
we can start from the point from where we had left last day (if possible).
The route was classified as – Within City, Major Roads, Highways, Shopping complex/ Mall and
Office Complex/ Government Building
There were no fixed calls which we need to do for within city, major roads and highways, but a
minimum of 30 calls in each route, i.e., within city, major roads and highways on each day. For
indoors, 20 calls each for shopping and office complex each day preferably in relatively bigger city.
The drive test covered selected cities and adjoining towns/rural areas where the service provider
has commenced service, including congested areas and indoor sites.
The drive test of each mobile network was conducted between 10 am and 8 pm on weekdays.
The Vehicle used in the drive tests was equipped with the test tool that automatically generates calls
on the mobile telephone networks.
The speed of the vehicle was kept at around 30 km/hr.
The holding period of each test call was 120 seconds.
A test call was generated 10 seconds after the previous test call is completed.
Height of the antenna was kept uniform in case of all service providers.

April to June 2016 – Delhi Circle 23
5.2. INDEPENDENT DRIVE TEST
The number of independent drive tests to be conducted and their locations are decided on TRAI
recommendation.
A minimum of 80 kilometres was traversed during the independent drive test in a SSA. The SSA
would be defined as per BSNL and SSA list will be finalized by regional TRAI office.
Route map was designed in such a way that all the major roads, highways and all the important
towns and villages were covered as part of audit.
Special emphasis was given to those areas where the number of complaints received were on the
higher side, if provided by TRAI.
The route is defined in a way that we cover maximum area in the SSA and try to cover maximum
villages and cities within the SSA. The route is designed such that there is no overlap of roads (if
possible).
The route was classified as – Within city, Major Roads, Highways, Shopping complex / Mall and
Office Complex/ Government Building
There were no fixed calls which we need to do for within city, major roads and highways, but a
minimum of 30 calls in each route, i.e., within city, major roads and highways on each day. For
indoors, 20 calls each for shopping and office complex each day preferably in relatively bigger city.
The drive test covered selected cities and adjoining towns/rural areas where the service provider
has commenced service, including congested areas and indoor sites.
The drive test of each mobile network was conducted between 10 am and 8 pm on weekdays.
The Vehicle used in the drive tests was equipped with the test tool that automatically generates calls
on the mobile telephone networks.
The speed of the vehicle was kept at around 30 km/hr.
The holding period of each test call was 120 seconds.
A test call was generated 10 seconds after the previous test call is completed.
Height of the antenna was kept uniform in case of all service providers.

April to June 2016 – Delhi Circle 24
5.3. PARAMETERS EVALUATED DURING DRIVE TEST
The parameters which were captured during the drive test include. Below are the parameters which are
captured for the GSM and CDMA operators.
Coverage-Signal strength (GSM)
Total calls made (A)
Number of calls with signal strength between 0 to -75 dBm
Number of calls with signal strength between 0 to -85 dBm
Number of calls with signal strength between 0 to -95 dBm
Coverage-Signal strength (CDMA)
Total Ec/Io BINS (A)
Total Ec/Io BINS with less than –15 (B)
Low Interference = [1 - (B/A)] x 100
Voice quality (GSM)
Total RxQual Samples– A
RxQual samples with 0-5 value – B
%age samples with good voice quality = B/A x 100
Voice quality (CDMA)
Total FER BINs (forward FER) – A
FER BINs with 0-2 value (forward FER) – B
FER BINs with 0-4 value (forward FER) – C
%age samples with FER bins having 0-2 value (forward FER) = B/A x 100
%age samples with FER bins having 0-4 value (forward FER) = C/A x 100
No. of FER samples with value > 4 = [A-C]
Call setup success rate
Total number of call attempts – A
Total Calls successfully established – B
Call success rate (%age) = (B/A) x 100
Blocked calls
100% - Call Set up Rate
Call drop rate
Total Calls successfully established – A
Total calls dropped after being established – B
Call Drop Rate (%age) = (B/A) x 100

April to June 2016 – Delhi Circle 25
6. EXECUTIVE SUMMARY
The objective assessment of Quality of Service (QoS) carried out gives an insight into the overall
performance of various operators in the Delhi Circle, with a parameter wise performance evaluation as
compared to TRAI benchmark.
6.1. OPERATORS COVERED
Name of Operator Number of Subscriber (Up to June 30, 2016)
Aircel 6354406
Airtel 10624817
Idea 6093777
MTNL 2238203
MTS 936790
RCOM CDMA 2863819
RCOM GSM 2346678
TTSL CDMA 10268792
Vodafone 6354406
TSP No. of cells BTS BSC MSC+GMSC Node B RNC
AIRCEL 11884 4064 23 6+1 NA NA
AIRTEL 17606 6630 62 23+10 6617 27
IDEA 14731 5094 50 7+3 3060 3
MTS 4095 1047 6 1 NA NA
MTNL 3219 1128 31 4+2 DNA DNA
RCOM GSM 6877 2504 14 4+1 2252 4
RCOM CDMA 2648 900 DNA 5+2 NA NA
TTSL CDMA 5122 1471 8 4+4 NA NA
VODAFONE 16658 6345 56 6 + 9 6110 25
Note: Node B & RNC is marked as Not Applicable (N.A.) for the services providers who do not have 3G services licence in the circle.

April to June 2016 – Delhi Circle 26
6.2. AUDIT SCHEDULE
OPERATOR 3 Days Live Apr-16 Apr-16 May-16 Jun-16
AIRCEL 16th Apr 2016 10th May 2016 15th Jun 2016 16th Jul 2016
AIRTEL 8th Apr 2016 9th May 2016 10th Jun 2016 8th Jul 2016
IDEA 11th Apr 2016 6th May 2016 9th Jun 2016 11th Jul 2016
MTS 20th Apr 2016 5th May 2016 8th Jun 2016 20th Jul 2016
MTNL 14th Apr 2016 19th May 2016 16th May 2016 14th Jul 2016
RCOM (GSM + CDMA) 21st Apr 2016 17th May 2016 11th Jun 2016 21st Jul 2016
TTSL CDMA 19th Apr 2016 10th May 2016 7th Jun 2016 19th Jul 2016
VODAFONE 13th Apr 2016 13th May 2016 15th Jun 2016 13th Jul 2016
Note: Audit schedule mentioned above is for the PMR audit for the last month. 3 day live monitoring for the current month was carried along with the PMR audit.
Colour codes to read the report:
Not meeting the benchmark
NNA Not Applicable
DNA Data not available (at TSP premises)

April to June 2016 – Delhi Circle 27
6.3. 2G VOICE PMR DATA: APRIL
6.4. 2G VOICE PMR DATA: MAY
6.5. 2G VOICE PMR DATA: JUNE
Benchmark AIRCEL AIRTEL IDEA MTNL MTS RCOM CDMA RCOM GSM TTSL VODAFONE
Sum of downtime of BTSs in a
month in hrs. in the licensed
service area
≤ 2% 0.07% 0.01% 0.02% 0.00% 0.06% 0.10% 0.05% 0.07% 0.16%
No. of BTSs having accumulated
downtime of >24 hours in a month≤ 2% 0.15% 0.00% 0.00% 0.09% 0.00% 1.23% 0.08% 0.07% 1.01%
Call Set-up Success Rate (Within
Licensee own network≥ 95% 97.50% 99.14% 99.07% 97.23% 99.11% 97.13% 96.24% 99.11% 99.22%
SDDCH/Paging chl. Congestion ≤ 1% 0.17% 0.04% 0.52% 0.58% NA NA 0.54% 0.00% 0.20%
TCH Congestion ≤ 2% 0.88% 0.02% 0.40% 1.77% 0.08% 0.81% 2.18% 0.19% 0.78%
Call Drop Rate (%age) ≤ 2% 0.65% 0.65% 0.62% 1.77% 0.25% 0.32% 0.17% 0.27% 1.01%
Worst Affected cell having more
than 3% TCH drop≤ 3% 2.76% 1.47% 1.95% 2.48% 1.29% 1.38% 0.46% 1.69% 2.43%
%age of connection with good
voice quality≥ 95% 95.85% 98.88% 98.42% 97.40% 99.19% 99.73% 98.86% 99.17% 97.85%
Apr-16
Network Availability
Connection
Establishment
(Accessibility)
Connection
Maintenance
(Retainability)
Network Parameters Name of Service Provider
Benchmark AIRCEL AIRTEL IDEA MTNL MTS RCOM CDMA RCOM GSM TTSL VODAFONE
Sum of downtime of BTSs in a
month in hrs. in the licensed
service area
≤ 2% 0.19% 0.01% 0.08% 0.01% 0.06% 0.11% 0.07% 0.05% 0.29%
No. of BTSs having accumulated
downtime of >24 hours in a month≤ 2% 0.49% 0.00% 0.00% 0.36% 0.00% 1.01% 0.28% 0.14% 1.96%
Call Set-up Success Rate (Within
Licensee own network≥ 95% 97.22% 99.16% 99.17% 97.03% 99.05% 95.53% 96.49% 98.77% 99.13%
SDDCH/Paging chl. Congestion ≤ 1% 0.45% 0.05% 0.42% 0.57% NA NA 0.40% 0.00% 0.14%
TCH Congestion ≤ 2% 1.46% 0.02% 0.32% 1.77% 0.07% 1.66% 2.18% 0.38% 0.87%
Call Drop Rate (%age) ≤ 2% 0.78% 0.69% 0.62% 1.79% 0.29% 0.50% 0.20% 0.40% 1.06%
Worst Affected cell having more
than 3% TCH drop≤ 3% 3.61% 1.56% 2.01% 2.53% 1.56% 1.92% 0.44% 1.57% 2.61%
%age of connection with good
voice quality≥ 95% 95.65% 98.89% 98.42% 97.51% 99.18% 99.79% 98.76% 99.07% 98.75%
Connection
Maintenance
(Retainability)
May-16
Network ParametersName of Service Provider
Network Availability
Connection
Establishment
(Accessibility)
Benchmark AIRCEL AIRTEL IDEA MTNL MTS RCOM CDMA RCOM GSM TTSL VODAFONE
Sum of downtime of BTSs in a
month in hrs. in the licensed
service area
≤ 2% 0.15% 0.01% 0.07% 0.00% 0.05% 0.44% 0.06% 0.10% 0.20%
No. of BTSs having accumulated
downtime of >24 hours in a month≤ 2% 0.29% 0.00% 0.00% 0.09% 0.00% 2.50% 0.20% 0.61% 1.10%
Call Set-up Success Rate (Within
Licensee own network≥ 95% 96.09% 98.98% 98.97% 96.98% 98.65% 97.43% 96.22% 99.04% 98.97%
SDDCH/Paging chl. Congestion ≤ 1% 0.37% 0.03% 0.34% 0.62% NA NA 0.53% 0.00% 0.11%
TCH Congestion ≤ 2% 2.34% 0.02% 0.42% 1.77% 0.40% 0.10% 1.81% 0.22% 1.03%
Call Drop Rate (%age) ≤ 2% 1.09% 0.75% 0.70% 1.80% 0.35% 0.52% 0.22% 0.31% 1.13%
Worst Affected cell having more
than 3% TCH drop≤ 3% 6.16% 1.67% 2.26% 2.59% 1.80% 1.02% 0.50% 1.23% 2.69%
%age of connection with good
voice quality≥ 95% 95.41% 98.87% 98.22% 97.33% 99.17% 99.88% 98.51% 99.14% 97.77%
Connection
Establishment
(Accessibility)
Connection
Maintenance
(Retainability)
Jun-16
Network ParametersName of Service Provider
Network Availability

April to June 2016 – Delhi Circle 28
6.6. 2G VOICE PMR DATA: CONSOLIDATED
AIRCEL has parameter value of 4.18% and failed to meet the benchmark of ≤ 3% Worst Affected cell having more than 3% TCH drop.
RCOM GSM has parameter value of 2.06% and failed to meet the benchmark of ≤ 2% TCH Congestion
6.7. 2G VOICE 3 DAYS LIVE DATA
A three day live measurement was conducted to measure the QoS provided by the operators. It was seen
from the live data collected, that the performance of the operators across all parameters more or less
corroborated with the audit data collected.
6.8. 2G VOICE 3 DAYS LIVE DATA: APRIL
Benchmark AIRCEL AIRTEL IDEA MTNL MTS RCOM CDMA RCOM GSM TTSL VODAFONE
Sum of downtime of BTSs in a
month in hrs. in the licensed
service area
≤ 2% 0.14% 0.01% 0.06% 0.00% 0.06% 0.22% 0.06% 0.07% 0.22%
No. of BTSs having accumulated
downtime of >24 hours in a month≤ 2% 0.31% 0.00% 0.00% 0.18% 0.00% 1.58% 0.19% 0.27% 1.36%
Call Set-up Success Rate (Within
Licensee own network≥ 95% 96.94% 99.09% 99.07% 97.08% 98.94% 96.70% 96.32% 98.97% 99.11%
SDDCH/Paging chl. Congestion ≤ 1% 0.33% 0.04% 0.43% 0.00% NA 0.00% 0.49% 0.00% 0.15%
TCH Congestion ≤ 2% 1.56% 0.02% 0.38% 1.77% 0.19% 0.86% 2.06% 0.26% 0.89%
Call Drop Rate (%age) ≤ 2% 0.84% 0.70% 0.65% 1.79% 0.30% 0.45% 0.20% 0.33% 1.07%
Worst Affected cell having more
than 3% TCH drop≤ 3% 4.18% 1.57% 2.07% 2.53% 1.55% 1.44% 0.47% 1.50% 2.58%
%age of connection with good
voice quality≥ 95% 95.64% 98.88% 98.35% 97.41% 99.18% 99.80% 98.71% 99.12% 98.12%
Network Availability
Connection
Establishment
(Accessibility)
Connection
Maintenance
(Retainability)
Consolidated
Network ParametersName of Service Provider
Benchmark AIRCEL AIRTEL IDEA MTNL MTS RCOM CDMA RCOM GSM TTSL VODAFONE
Sum of downtime of BTSs in a
month in hrs. in the licensed
service area
≤ 2% 0.11% 0.01% 0.03% 0.00% 0.07% 0.09% 0.07% 0.05% 0.18%
No. of BTSs having accumulated
downtime of >24 hours in a month≤ 2% 0.00% 0.00% 0.00% 0.00% 0.00% 0.00% 0.00% 0.00% 0.05%
Call Set-up Success Rate (Within
Licensee own network≥ 95% 97.50% 99.01% 98.63% 97.17% 99.10% 95.48% 99.26% 99.26% 99.12%
SDDCH/Paging chl. Congestion ≤ 1% 0.13% 0.03% 0.64% 0.56% NA NA 0.95% 0.00% 0.17%
TCH Congestion ≤ 2% 0.97% 0.02% 0.77% 1.72% 0.03% 1.25% 2.44% 0.02% 0.88%
Call Drop Rate (%age) ≤ 2% 0.68% 0.69% 0.70% 1.75% 0.28% 0.31% 0.17% 0.25% 1.08%
Worst Affected cell having more
than 3% TCH drop≤ 3% 2.80% 1.66% 2.37% 2.61% 1.30% 1.20% 1.66% 0.60% 2.65%
%age of connection with good
voice quality≥ 95% 95.83% 98.85% 98.35% 97.36% 99.17% 99.72% 98.82% 99.20% 97.83%
Apr-16
Network Parameters Name of Service Provider
Network Availability
Connection
Establishment
(Accessibility)
Connection
Maintenance
(Retainability)

April to June 2016 – Delhi Circle 29
6.9. 2G VOICE 3 DAYS LIVE DATA: MAY
6.10. 2G VOICE 3 DAYS LIVE DATA: JUNE
6.11. 3 DAYS LIVE DATA: CONSOLIDATED
AIRCEL has parameter value of 4.34779577173327% and failed to meet the benchmark of ≤ 3% Worst Affected cell having more than 3% TCH drop
RCOM GSM has parameter value of 2.33% and failed to meet the benchmark of ≤ 2% TCH Congestion
Benchmark AIRCEL AIRTEL IDEA MTNL MTS RCOM CDMA RCOM GSM TTSL VODAFONE
Sum of downtime of BTSs in a
month in hrs. in the licensed
service area
≤ 2% 0.10% 0.01% 0.03% 0.00% 0.04% 0.07% 0.08% 0.05% 0.09%
No. of BTSs having accumulated
downtime of >24 hours in a month≤ 2% 0.00% 0.00% 0.00% 0.00% 0.00% 0.00% 0.00% 0.00% 0.03%
Call Set-up Success Rate (Within
Licensee own network≥ 95% 97.25% 99.22% 99.32% 97.00% 98.69% 95.54% 97.55% 98.78% 99.18%
SDDCH/Paging chl. Congestion ≤ 1% 0.34% 0.06% 0.25% 0.52% NA NA 0.31% NA 0.18%
TCH Congestion ≤ 2% 1.41% 0.01% 0.20% 1.67% 0.40% 1.86% 2.07% 0.44% 0.82%
Call Drop Rate (%age) ≤ 2% 0.80% 0.68% 0.58% 1.76% 0.32% 0.49% 0.18% 0.41% 1.03%
Worst Affected cell having more
than 3% TCH drop≤ 3% 3.81% 1.57% 1.76% 2.44% 1.39% 1.66% 0.38% 1.56% 2.53%
%age of connection with good
voice quality≥ 95% 95.41% 98.86% 98.49% 97.62% 99.17% 99.73% 98.69% 99.08% 97.86%
Connection
Maintenance
(Retainability)
May-16
Network ParametersName of Service Provider
Network Availability
Connection
Establishment
(Accessibility)
Benchmark AIRCEL AIRTEL IDEA MTNL MTS RCOM CDMA RCOM GSM TTSL VODAFONE
Sum of downtime of BTSs in a
month in hrs. in the licensed
service area
≤ 2% 0.31% 0.01% 0.16% 0.00% 0.04% 0.44% 0.00% 0.09% 0.25%
No. of BTSs having accumulated
downtime of >24 hours in a month≤ 2% 0.00% 0.00% 0.00% 0.00% 0.00% 0.00% 0.00% 0.00% 0.11%
Call Set-up Success Rate (Within
Licensee own network≥ 95% 95.94% 98.88% 98.89% 97.16% 98.69% 97.59% 93.81% 98.91% 99.04%
SDDCH/Paging chl. Congestion ≤ 1% 0.25% 0.04% 0.26% 0.67% NA NA 1.32% 0.00% 0.08%
TCH Congestion ≤ 2% 2.10% 0.02% 0.51% 1.85% 0.40% 0.18% 2.48% 0.32% 0.96%
Call Drop Rate (%age) ≤ 2% 1.14% 0.72% 0.66% 1.81% 0.32% 0.64% 0.32% 0.34% 1.29%
Worst Affected cell having more
than 3% TCH drop≤ 3% 6.43% 1.59% 2.16% 2.76% 1.39% 0.97% 0.71% 1.14% 2.60%
%age of connection with good
voice quality≥ 95% 95.44% 98.89% 98.31% 97.11% 99.17% 99.90% 98.27% 99.08% 97.75%
Jun-16
Network ParametersName of Service Provider
Network Availability
Connection
Establishment
(Accessibility)
Connection
Maintenance
(Retainability)
Benchmark AIRCEL AIRTEL IDEA MTNL MTS RCOM CDMA RCOM GSM TTSL VODAFONE
Sum of downtime of BTSs in a
month in hrs. in the licensed
service area
≤ 2% 0.17% 0.01% 0.08% 0.00% 0.05% 0.20% 0.05% 0.06% 0.17%
No. of BTSs having accumulated
downtime of >24 hours in a month≤ 2% 0.00% 0.00% 0.00% 0.00% 0.00% 0.00% 0.00% 0.00% 0.06%
Call Set-up Success Rate (Within
Licensee own network≥ 95% 96.90% 99.03% 98.95% 97.11% 98.83% 96.21% 96.87% 98.98% 99.11%
SDDCH/Paging chl. Congestion ≤ 1% 0.24% 0.04% 0.38% 0.00% NA 0.00% 0.86% 0.00% 0.14%
TCH Congestion ≤ 2% 1.49% 0.02% 0.49% 1.74% 0.28% 1.10% 2.33% 0.26% 0.89%
Call Drop Rate (%age) ≤ 2% 0.88% 0.70% 0.65% 1.77% 0.31% 0.48% 0.23% 0.33% 1.13%
Worst Affected cell having more
than 3% TCH drop≤ 3% 4.35% 1.61% 2.10% 2.60% 1.36% 1.28% 0.92% 1.10% 2.59%
%age of connection with good
voice quality≥ 95% 95.56% 98.87% 98.38% 97.36% 99.17% 99.78% 98.59% 99.12% 97.81%
Connection
Maintenance
(Retainability)
Consolidated
Network ParametersName of Service Provider
Network Availability
Connection
Establishment
(Accessibility)

April to June 2016 – Delhi Circle 30
6.12. 3G VOICE PMR: CONSOLIDATED
Consolidated
Network Parameters Name of Service Provider
Benchmark AIRTEL IDEA MTNL RCOM GSM VODAFONE
Network Availability
Sum of downtime of BTSs in a month in hrs. in the licensed service area
≤ 2% 0.03% 0.13% 0.23% 0.12% 0.26%
No. of BTSs having accumulated downtime of >24 hours in a month
≤ 2% 0.00% 0.00% 0.58% 0.54% 1.73%
Connection Establishment (Accessibility)
Call Set-up Success Rate (Within Licensee own network
≥ 95% 99.20% 99.86% 97.54% 99.92% 99.61%
RRC Congestion: ≤ 1% 0.08% 0.04% 0.55% 0.03% 0.20%
RAB Congestion: ≤ 2% 0.10% 0.01% 1.52% 0.01% 0.15%
Connection Maintenance (Retainability)
Circuit Switched Voice Drop Rate ≤ 2% 0.44% 0.29% 1.57% 0.14% 0.59%
Worst affected cells having more than 3% Circuit Switched Voice Drop Rate:
≤ 3% 2.33% 2.04% 1.61% 0.56% 2.60%
Percentage of connections with Good Circuit Switched Voice Quality
≥ 95% 98.73% 98.46% DNA 99.75% 98.92%
6.13. 3G VOICE PMR: APRIL
Apr-16
Network Parameters Name of Service Provider
Benchmark AIRTEL IDEA MTNL RCOM GSM VODAFONE
Network Availability
Sum of downtime of BTSs in a month in hrs. in the licensed service area
≤ 2% 0.03% 0.04% 0.41% 0.10% 0.19%
No. of BTSs having accumulated downtime of >24 hours in a month
≤ 2% 0.00% 0.00% 0.40% 0.62% 1.21%
Connection Establishment (Accessibility)
Call Set-up Success Rate (Within Licensee own network
≥ 95% 99.29% 99.86% 97.95% 99.92% 99.60%
RRC Congestion: ≤ 1% 0.03% 0.02% 0.40% 0.03% 0.19%
RAB Congestion: ≤ 2% 0.06% 0.00% 1.34% 0.01% 0.15%
Connection Maintenance
(Retainability)
Circuit Switched Voice Drop Rate ≤ 2% 0.42% 0.31% 1.33% 0.08% 0.60%
Worst affected cells having more than 3% Circuit Switched Voice Drop Rate:
≤ 3% 2.11% 2.20% 1.17% 0.42% 2.51%
Percentage of connections with Good Circuit Switched Voice Quality
≥ 95% DNA 98.41% DNA 99.77% 98.89%
6.14. 3G VOICE PMR: MAY
May-16
Network Parameters Name of Service Provider
Benchmark AIRTEL IDEA MTNL RCOM GSM VODAFONE
Network Availability
Sum of downtime of BTSs in a month in hrs. in the licensed service area
≤ 2% 0.03% 0.20% 0.15% 0.13% 0.36%
No. of BTSs having accumulated downtime of >24 hours in a month
≤ 2% 0.00% 0.00% 0.54% 0.35% 2.65%
Connection Establishment (Accessibility)
Call Set-up Success Rate (Within Licensee own network
≥ 95% 99.12% 99.86% 97.75% 99.96% 99.57%
RRC Congestion: ≤ 1% 0.10% 0.03% 0.60% 0.02% 0.24%
RAB Congestion: ≤ 2% 0.10% 0.01% 1.55% 0.01% 0.17%
Connection Maintenance (Retainability)
Circuit Switched Voice Drop Rate
≤ 2% 0.45% 0.28% 1.67% 0.10% 0.57%
Worst affected cells having more than 3% Circuit Switched Voice Drop Rate:
≤ 3% 2.35% 1.92% 1.57% 0.50% 2.63%
Percentage of connections with Good Circuit Switched Voice Quality
≥ 95% 98.74% 98.46% DNA 99.75% 98.94%

April to June 2016 – Delhi Circle 31
6.15. 3G VOICE PMR: JUNE
Jun-16
Network Parameters Name of Service Provider
Benchmark AIRTEL IDEA MTNL RCOM GSM VODAFONE
Network Availability
Sum of downtime of BTSs in a month in hrs. in the licensed service area
≤ 2% 0.02% 0.15% 0.13% 0.13% 0.24%
No. of BTSs having accumulated downtime of >24 hours in a month
≤ 2% 0.00% 0.00% 0.81% 0.66% 1.32%
Connection Establishment (Accessibility)
Call Set-up Success Rate (Within Licensee own network
≥ 95% 99.18% 99.86% 96.92% 99.89% 99.64%
RRC Congestion: ≤ 1% 0.11% 0.08% 0.66% 0.03% 0.18%
RAB Congestion: ≤ 2% 0.14% 0.02% 1.66% 0.02% 0.13%
Connection Maintenance (Retainability)
Circuit Switched Voice Drop Rate ≤ 2% 0.46% 0.29% 1.70% 0.24% 0.59%
Worst affected cells having more than 3% Circuit Switched Voice Drop Rate:
≤ 3% 2.53% 2.01% 2.10% 0.75% 2.66%
Percentage of connections with Good Circuit Switched Voice Quality
≥ 95% 98.72% 98.51% DNA 99.74% 98.93%
6.16. 3G VOICE 3 DAYS LIVE DATA: CONSOLIDATED
Consolidated
Network Parameters Name of Service Provider
Benchmark AIRTEL IDEA MTNL RCOM GSM VODAFONE
Network Availability
Sum of downtime of BTSs in a month in hrs. in the licensed service area
≤ 2% 0.03% 0.07% 0.23% 0.14% 0.21%
No. of BTSs having accumulated downtime of >24 hours in a month
≤ 2% 0.00% 0.00% 0.00% 0.00% 0.05%
Connection Establishment (Accessibility)
Call Set-up Success Rate (Within Licensee own network
≥ 95% 99.20% 99.87% 97.41% 99.96% 99.60%
RRC Congestion: ≤ 1% 0.08% 0.01% 0.49% 0.02% 0.19%
RAB Congestion: ≤ 2% 0.10% 0.01% 1.50% 0.02% 0.15%
Connection Maintenance (Retainability)
Circuit Switched Voice Drop Rate ≤ 2% 0.44% 0.30% 1.53% 0.11% 0.59%
Worst affected cells having more than 3% Circuit Switched Voice Drop Rate:
≤ 3% 2.28% 2.27% 1.36% 0.46% 2.53%
Percentage of connections with Good Circuit Switched Voice Quality
≥ 95% 98.73% 98.45% DNA 99.76% 98.91%
6.17. 3G VOICE 3 DAYS LIVE DATA: APRIL
Apr-16
Network Parameters Name of Service Provider
Benchmark AIRTEL IDEA MTNL RCOM GSM VODAFONE
Network Availability
Sum of downtime of BTSs in a month in hrs. in the licensed service area
≤ 2% 0.04% 0.06% 0.43% 0.13% 0.19%
No. of BTSs having accumulated downtime of >24 hours in a month
≤ 2% 0.00% 0.00% 0.00% 0.00% 0.03%
Connection Establishment (Accessibility)
Call Set-up Success Rate (Within Licensee own network
≥ 95% 99.26% 99.86% 97.95% 99.97% 99.59%
RRC Congestion: ≤ 1% 0.03% 0.00% 0.40% 0.02% 0.16%
RAB Congestion: ≤ 2% 0.06% 0.00% 1.34% 0.01% 0.14%
Connection Maintenance
(Retainability)
Circuit Switched Voice Drop Rate ≤ 2% 0.45% 0.36% 1.33% 0.08% 0.55%
Worst affected cells having more than 3% Circuit Switched Voice Drop Rate:
≤ 3% 2.48% 2.66% 1.17% 0.41% 2.70%
Percentage of connections with Good Circuit Switched Voice Quality
≥ 95% 98.76% 98.40% DNA 99.78% 98.90%

April to June 2016 – Delhi Circle 32
6.18. 3G VOICE 3 DAYS LIVE DATA: MAY
May-16
Network Parameters Name of Service Provider
Benchmark AIRTEL IDEA MTNL RCOM GSM VODAFONE
Network Availability
Sum of downtime of BTSs in a month in hrs. in the licensed service area
≤ 2% 0.01% 0.06% 0.15% 0.16% 0.12%
No. of BTSs having accumulated downtime of >24 hours in a month
≤ 2% 0.00% 0.00% 0.00% 0.00% 0.03%
Connection Establishment (Accessibility)
Call Set-up Success Rate (Within Licensee own network
≥ 95% 99.11% 99.88% 97.75% 99.99% 99.57%
RRC Congestion: ≤ 1% 0.10% 0.01% 0.60% 0.01% 0.22%
RAB Congestion: ≤ 2% 0.11% 0.01% 1.55% 0.01% 0.19%
Connection Maintenance (Retainability)
Circuit Switched Voice Drop Rate ≤ 2% 0.39% 0.21% 1.67% 0.09% 0.61%
Worst affected cells having more than 3% Circuit Switched Voice Drop Rate:
≤ 3% 1.76% 1.48% 1.57% 0.42% 2.45%
Percentage of connections with Good Circuit Switched Voice Quality
≥ 95% 98.75% 98.46% DNA 99.77% DNA
6.19. 3G VOICE 3 DAYS LIVE DATA: JUNE
Jun-16
Network Parameters Name of Service Provider
Benchmark AIRTEL IDEA MTNL RCOM GSM VODAFONE
Network Availability
Sum of downtime of BTSs in a month in hrs. in the licensed service area
≤ 2% 0.03% 0.10% 0.12% 0.14% 0.30%
No. of BTSs having accumulated downtime of >24 hours in a month
≤ 2% 0.00% 0.00% 0.00% 0.00% 0.08%
Connection Establishment (Accessibility)
Call Set-up Success Rate (Within Licensee own network
≥ 95% 99.22% 99.86% 96.51% 99.93% 99.62%
RRC Congestion: ≤ 1% 0.10% 0.01% 0.46% 0.04% 0.18%
RAB Congestion: ≤ 2% 0.12% 0.01% 1.61% 0.03% 0.13%
Connection Maintenance (Retainability)
Circuit Switched Voice Drop Rate
≤ 2% 0.49% 0.33% 1.59% 0.16% 0.61%
Worst affected cells having more than 3% Circuit Switched Voice Drop Rate:
≤ 3% 2.59% 2.68% 1.35% 0.55% 2.45%
Percentage of connections with Good Circuit Switched Voice Quality
≥ 95% 98.68% 98.48% DNA 99.72% 98.92%

April to June 2016 – Delhi Circle 33
6.20. PMR MONTHLY 2G WIRELESS DATA - CONSOLIDATED
6.21. PMR MONTHLY 2G WIRELESS DATA - APRIL
S. No. Name of Parameter Benchmark AIRCEL AIRTEL IDEA MTNL MTS RCOM CDMA RCOM GSM TTSL VODAFONE
1
i)Total No. of Subscribers for Service
Activation (A)1016270.667 DNA DNA DNA 26615 DNA DNA DNA 37107
ii)Total Service Activations provided within
4 Hours (B)997901 DNA DNA DNA 26615 DNA DNA DNA 36881.5
iii)Service Activation / Provisioning = (B/A) *
100
Within 4 Hours
with 95%
Success Rate
0.982015754 DNA DNA DNA 100.00% DNA DNA DNA 99.38%
2
i)Total No. of PDP Context Activation
Requests (from SGSN to GGSN) (A)233199223.7 900450788 294894210 DNA 6686190.667 DNA DNA 8175594.333 9172504.667
ii)
Total No. of PDP Context Activation
Success (path created b/w SGSN and
GGSN) (B)
223949475 899271644 294033071 DNA 6573534.667 DNA DNA 7888149.667 9066204.667
iii)PDP Context Activation Success Rate
=(B/A) *100>=95% 0.959606934 99.87% 0.9970698 DNA 98.32% DNA 99.15% 96.49% 98.73%
3
i)TBF originated PS Domain Iu Connection
Setup Success (A)10686918399 6568142202 11340374060 DNA 122390736.7 DNA DNA 57659480 1786736829
ii)TBF originated PS Domain Iu Connection
Release (B)160817561.3 70477873.7 38290487 DNA 1498091.333 DNA DNA 891273 30900881.59
iii) Drop Rate = (B/A) * 100 <=5% 0.015060239 0.01072086 0.003378022 DNA 0.012293147 DNA DNA 0.015465114 0.015023373
Drop Rate
Consolidated
Cellular Mobile Telephone Services
Network Service Quality Parameter
Service Activation/ Provisioning
PDP Context Activation Success Rate
S. No. Name of Parameter Benchmark AIRCEL AIRTEL IDEA MTNL MTSRCOM
CDMARCOM GSM TTSL VODAFONE
1
i)Total No. of Subscribers for Service
Activation (A)1006831 DNA DNA DNA DNA DNA DNA DNA 35264
ii)Total Service Activations provided within
4 Hours (B)995119 DNA DNA DNA DNA DNA DNA DNA 34990
iii)Service Activation / Provisioning = (B/A) *
100
Within 4 Hours with 95%
Success Rate98.84% DNA DNA DNA DNA DNA DNA DNA 99.22%
2
i)Total No. of PDP Context Activation
Requests (from SGSN to GGSN) (A)283000550 905077285 299524403 DNA 6903189 DNA DNA 7865175 8823538
ii)
Total No. of PDP Context Activation
Success (path created b/w SGSN and
GGSN) (B)
273193392 902922815 298780360 DNA 6780999 DNA DNA 7592060 8804375
iii)PDP Context Activation Success Rate
=(B/A) *100>=95% 96.53% 99.76% 99.75% DNA 98.23% DNA 98.71% 96.53% 99.78%
3
i)TBF originated PS Domain Iu Connection
Setup Success (A)10674331524 6200205636 11237645445 DNA 124428428 DNA DNA 57561052 3571593138
ii)TBF originated PS Domain Iu Connection
Release (B)164086965 63934474 36357099 DNA 1231278 DNA DNA 1221964 61777787
iii) Drop Rate = (B/A) * 100 <=5% 1.54% 1.03% 0.32% DNA 0.99% DNA DNA 2.12% 1.73%
Apr-16
Cellular Mobile Telephone Services
Network Service Quality Parameter
Service Activation/ Provisioning
PDP Context Activation Success Rate
Drop Rate

April to June 2016 – Delhi Circle 34
6.22. PMR MONTHLY 2G WIRELESS DATA - MAY
6.23. PMR MONTHLY 2G WIRELESS DATA - JUNE
S. No. Name of Parameter Benchmark AIRCEL AIRTEL IDEA MTNL MTS RCOM CDMA RCOM GSM TTSL VODAFONE
1
i)Total No. of Subscribers for Service
Activation (A)1124309 DNA DNA DNA 26016 DNA DNA DNA 38950
ii)Total Service Activations provided within
4 Hours (B)1099493 DNA DNA DNA 26016 DNA DNA DNA 38773
iii)Service Activation / Provisioning = (B/A) *
100
Within 4 Hours
with 95%
Success Rate
97.79% DNA DNA DNA 100% DNA DNA DNA 100%
2
i)Total No. of PDP Context Activation
Requests (from SGSN to GGSN) (A)224597937 862126174 296937538 DNA 6925464 DNA DNA 8408074 10440442
ii)
Total No. of PDP Context Activation
Success (path created b/w SGSN and
GGSN) (B)
215438958 861484000 296198170 DNA 6799041 DNA DNA 8107240 10429090
iii)PDP Context Activation Success Rate
=(B/A) *100>=95% 95.92% 99.93% 99.75% DNA 98.17% DNA 99.50% 96.42% 99.89%
3
i)TBF originated PS Domain Iu Connection
Setup Success (A)11324769968 6863557297 11705846100 DNA 130011594 DNA DNA 59096946 DNA
ii)TBF originated PS Domain Iu Connection
Release (B)165344278 73734253 38987541 DNA 1663077 DNA DNA 733808 DNA
iii) Drop Rate = (B/A) * 100 <=5% 1.46% 1.07% 0.33% DNA 1.28% DNA DNA 1.24% DNA
Drop Rate
May-16
Cellular Mobile Telephone Services
Network Service Quality Parameter
Service Activation/ Provisioning
PDP Context Activation Success Rate
S. No. Name of Parameter Benchmark AIRCEL AIRTEL IDEA MTNL MTS RCOM CDMA RCOM GSM TTSL VODAFONE
1
i)Total No. of Subscribers for Service
Activation (A) 917672DNA DNA DNA 27214 DNA DNA DNA DNA
ii)Total Service Activations provided within
4 Hours (B) 899091DNA DNA DNA 27214 DNA DNA DNA DNA
iii)Service Activation / Provisioning = (B/A) *
100
Within 4 Hours
with 95%
Success Rate
97.98% DNA DNA DNA 100.00% DNA DNA DNA DNA
2
i)Total No. of PDP Context Activation
Requests (from SGSN to GGSN) (A) 191999184934148904 288220689 DNA 6229919 DNA DNA 8253534 8253534
ii)
Total No. of PDP Context Activation
Success (path created b/w SGSN and
GGSN) (B) 183216075
933408116 287120683 DNA 6140564 DNA DNA 7965149 7965149
iii)PDP Context Activation Success Rate
=(B/A) *100>=95% 95.43% 99.92% 99.62% DNA 98.57% DNA 99.23% 96.51% 96.51%
3
i)TBF originated PS Domain Iu Connection
Setup Success (A) 100616537046640663673 11077630634 DNA 112732188 DNA DNA 56320442 1880519.666
ii)TBF originated PS Domain Iu Connection
Release (B) 15302144173764894 39526821 DNA 1599919 DNA DNA 718047 23976.18046
iii) Drop Rate = (B/A) * 100 <=5% 1.52% 1.11% 0.36% DNA 1.42% DNA DNA 1.27% 1.27%
Jun-16
Cellular Mobile Telephone Services
Network Service Quality Parameter
Service Activation/ Provisioning
PDP Context Activation Success Rate
Drop Rate

April to June 2016 – Delhi Circle 35
6.24. PMR 3 DAY LIVE 2G WIRELESS DATA - CONSOLIDATED
6.25. PMR 3 DAY LIVE 2G WIRELESS DATA - APRIL
S. No. Name of Parameter Benchmark AIRCEL AIRTEL IDEA MTNL MTS RCOM CDMA RCOM GSM TTSL VODAFONE
1
i) Total No. of Subscribers for Service Activation (A) DNA DNA DNA DNA 2632 DNA DNA DNA DNA
ii) Total Service Activations provided within 4 Hours (B) DNA DNA DNA DNA 2632 DNA DNA DNA DNA
iii) Service Activation / Provisioning = (B/A) * 100Within 4 Hours with
95% Success RateDNA DNA DNA DNA 100% DNA DNA DNA DNA
2
i)Total No. of PDP Context Activation Requests (from SGSN
to GGSN) (A)24821411 88438602.7 29645718.7 DNA 648137 DNA DNA 822814.7 1805302.33
ii)Total No. of PDP Context Activation Success (path created
b/w SGSN and GGSN) (B)23728679.5 88369757 29524371 DNA 636537.7 DNA DNA 794350.7 1803682
iii) PDP Context Activation Success Rate =(B/A) *100 >=95% 95.51% 99.93% 99.59% DNA 98.21% DNA 98.85% 96.54% 99.88%
3
i) TBF originated PS Domain Iu Connection Setup Success (A) 1071962065 656693342 1114778654 DNA 11782250 DNA DNA 23588662 344371724
ii) TBF originated PS Domain Iu Connection Release (B) 15772741.7 7093210 3762688 DNA 148801 DNA DNA 291961 172066764
iii) Drop Rate = (B/A) * 100 <=5% 1.47% 1.08% 0.34% DNA 1.26% DNA DNA 1.22% 1.25%
Drop Rate
Cconsolidated
Cellular Mobile Telephone Services
Network Service Quality Parameter
Service Activation/ Provisioning
PDP Context Activation Success Rate
S. No. Name of Parameter Benchmark AIRCEL AIRTEL IDEA MTNL MTS RCOM CDMA RCOM GSM TTSL VODAFONE
1
i) Total No. of Subscribers for Service Activation (A) DNA DNA DNA DNA DNA DNA DNA DNA DNA
ii) Total Service Activations provided within 4 Hours (B) DNA DNA DNA DNA DNA DNA DNA DNA DNA
iii) Service Activation / Provisioning = (B/A) * 100Within 4 Hours with 95%
Success RateDNA DNA DNA DNA DNA DNA DNA DNA DNA
2
i)Total No. of PDP Context Activation Requests (from
SGSN to GGSN) (A)28378697 96818767 30854961 DNA 633517.00 DNA DNA 802700 1041654
ii)Total No. of PDP Context Activation Success (path
created b/w SGSN and GGSN) (B)27278396 96642524 30792957 DNA 621931.00 DNA DNA 775101 1039249
iii) PDP Context Activation Success Rate =(B/A) *100 >=95% 96.12% 99.82% 99.80% DNA 98.17% DNA 98.73% 96.56% 99.77%
3
i)TBF originated PS Domain Iu Connection Setup
Success (A)1064104607 646587259 1084561217 DNA 11875578 DNA DNA 5750340 340526384
ii) TBF originated PS Domain Iu Connection Release (B) 16336822 6767136 3592702 DNA 133045 DNA DNA 62303 5016813
iii) Drop Rate = (B/A) * 100 <=5% 1.54% 1.05% 0.33% DNA 1.12% DNA DNA 1.08% 1.47%
Apr-16
Cellular Mobile Telephone Services
Network Service Quality Parameter
Service Activation/ Provisioning
PDP Context Activation Success Rate
Drop Rate

April to June 2016 – Delhi Circle 36
6.26. PMR 3 DAY LIVE 2G WIRELESS DATA - MAY
6.27. PMR 3 DAY LIVE 2G WIRELESS DATA - JUNE
S. No. Name of Parameter Benchmark AIRCEL AIRTEL IDEA MTNL MTS RCOM CDMARCOM GSM TTSL VODAFONE
1
i) Total No. of Subscribers for Service Activation (A) DNA DNA DNA DNA 2632 DNA DNA DNA DNA
ii) Total Service Activations provided within 4 Hours (B) DNA DNA DNA DNA 2632 DNA DNA DNA DNA
iii) Service Activation / Provisioning = (B/A) * 100Within 4 Hours with 95%
Success RateDNA DNA DNA DNA 100.00% DNA DNA DNA DNA
2
i)Total No. of PDP Context Activation Requests (from
SGSN to GGSN) (A)21264125 78900693 28599321 DNA 655447 DNA DNA 818231 3360243
ii)Total No. of PDP Context Activation Success (path
created b/w SGSN and GGSN) (B)20178963 78880992 28527511 DNA 643841 DNA DNA 790441 3358457
iii) PDP Context Activation Success Rate =(B/A) *100 >=95% 94.90% 99.98% 99.75% DNA 98.23% DNA 98.84% 96.60% 99.95%
3
i)TBF originated PS Domain Iu Connection Setup
Success (A)1129714551 666125790 1139254079 DNA 11735586 DNA DNA 59096946 DNA
ii) TBF originated PS Domain Iu Connection Release (B) 15691027 7327999 3709721 DNA 156679 DNA DNA 733808 DNA
iii) Drop Rate = (B/A) * 100 <=5% 1.39% 1.10% 0.33% DNA 1.34% DNA DNA 1.24% DNA
May-16
Cellular Mobile Telephone Services
Network Service Quality Parameter
Service Activation/ Provisioning
PDP Context Activation Success Rate
Drop Rate
S. No. Name of Parameter Benchmark AIRCEL AIRTEL IDEA MTNL MTS RCOM CDMA RCOM GSM TTSL VODAFONE
1
i) Total No. of Subscribers for Service Activation (A) DNA DNA DNA DNA 2632 DNA DNA DNA DNA
ii) Total Service Activations provided within 4 Hours (B) DNA DNA DNA DNA 2632 DNA DNA DNA DNA
iii) Service Activation / Provisioning = (B/A) * 100Within 4 Hours with 95%
Success RateDNA DNA DNA DNA 100.00% DNA DNA DNA DNA
2
i)Total No. of PDP Context Activation Requests (from
SGSN to GGSN) (A)DNA 89596348 29482874 DNA 655447 DNA DNA 847513 1014010
ii)Total No. of PDP Context Activation Success (path
created b/w SGSN and GGSN) (B)DNA 89585755 29252645 DNA 643841 DNA DNA 817510 1013340
iii) PDP Context Activation Success Rate =(B/A) *100 >=95% DNA 99.99% 99.22% DNA 98.23% DNA 98.98% 96.46% 99.93%
3
i)TBF originated PS Domain Iu Connection Setup Success
(A)1022067038 657366976 1120520665 DNA 11735586 DNA DNA 5918699 348217063
ii) TBF originated PS Domain Iu Connection Release (B) 15290376 7184495 3985641 DNA 156679 DNA DNA 79772 3607144
iii) Drop Rate = (B/A) * 100 <=5% 1.50% 1.09% 0.36% DNA 1.34% DNA DNA 1.35% 1.04%
Jun-16
Cellular Mobile Telephone Services
Network Service Quality Parameter
Service Activation/ Provisioning
PDP Context Activation Success Rate
Drop Rate

April to June 2016 – Delhi Circle 37
6.28. PMR MONTHLY 3G WIRELESS DATA - CONSOLIDATED
6.29. PMR MONTHLY 3G WIRELESS DATA - APRIL
S. No. Name of Parameter Benchmark AIRTEL IDEA MTNL RCOM GSM VODAFONE
1
i)Total No. of Subscribers for Service
Activation (A)DNA DNA DNA DNA 217110
ii)Total Service Activations provided within
4 Hours (B)DNA DNA DNA DNA 215210
iii)Service Activation / Provisioning = (B/A) *
100
Within 4 Hours
with 95%
Success Rate
DNA DNA DNA DNA 99%
2
i)Total No. of PDP Context Activation
Requests (from SGSN to GGSN) (A)24821533 176523068 DNA DNA 19628578.67
ii)
Total No. of PDP Context Activation
Success (path created b/w SGSN and
GGSN) (B)
24816294 173515589.7 DNA DNA 19302898
iii)PDP Context Activation Success Rate
=(B/A) *100>=95% 99.98% 98.29% DNA 99.27% 98.34%
3
i)RNC originated PS Domain Iu
Connection Setup Success (A)1.073E+09 434416935.3 DNA DNA 752075158.3
ii)RNC originated PS Domain Iu
Connection Release (B)5356709 2827065.333 DNA DNA 10900596.33
iii) Drop Rate = (B/A) * 100 <=5% 0.50% 0.65% DNA DNA 1.45%
Consolidated
Cellular Mobile Telephone Services
Network Service Quality Parameter
Service Activation/ Provisioning
PDP Context Activation Success Rate
Drop Rate
S. No. Name of Parameter Benchmark AIRTEL IDEA MTNLRCOM
GSMVODAFONE
1
i)Total No. of Subscribers for Service
Activation (A)DNA DNA DNA DNA DNA
ii)Total Service Activations provided within
4 Hours (B)DNA DNA DNA DNA DNA
iii)Service Activation / Provisioning = (B/A) *
100
Within 4 Hours
with 95%
Success Rate
DNA DNA DNA DNA DNA
2
i)Total No. of PDP Context Activation
Requests (from SGSN to GGSN) (A) 22997767176612405 DNA DNA 19645983
ii)
Total No. of PDP Context Activation
Success (path created b/w SGSN and
GGSN) (B) 22994649
174254097 DNA DNA 19259361
iii)PDP Context Activation Success Rate
=(B/A) *100>=95% 99.99% 98.66% DNA 99.22% 98.03%
3
i)RNC originated PS Domain Iu
Connection Setup Success (A) 1019696704438104410 DNA DNA 715980497
ii)RNC originated PS Domain Iu
Connection Release (B) 51467642804061 DNA DNA 10848043
iii) Drop Rate = (B/A) * 100 <=5% 0.50% 0.64% DNA DNA 1.52%
Jun-16
Cellular Mobile Telephone Services
Network Service Quality Parameter
Service Activation/ Provisioning
PDP Context Activation Success Rate
Drop Rate

April to June 2016 – Delhi Circle 38
6.30. PMR MONTHLY 3G WIRELESS DATA - MAY
6.31. PMR MONTHLY 3G WIRELESS DATA – JUNE
S. No. Name of Parameter Benchmark AIRTEL IDEA MTNL RCOM GSM VODAFONE
1
i)Total No. of Subscribers for Service
Activation (A)DNA DNA DNA DNA 221455
ii)Total Service Activations provided within
4 Hours (B)DNA DNA DNA DNA 219580.00
iii)Service Activation / Provisioning = (B/A) *
100
Within 4 Hours
with 95%
Success Rate
DNA DNA DNA DNA 99.15%
2
i)Total No. of PDP Context Activation
Requests (from SGSN to GGSN) (A)24234210 178663951 DNA DNA 21274725
ii)
Total No. of PDP Context Activation
Success (path created b/w SGSN and
GGSN) (B)
24229670 175611691 DNA DNA 20959969
iii)PDP Context Activation Success Rate
=(B/A) *100>=95% 99.98% 98.29% DNA 99.29% 98.52%
3
i)RNC originated PS Domain Iu
Connection Setup Success (A)1078865843 441171909 DNA DNA 779421464
ii)RNC originated PS Domain Iu
Connection Release (B)5338180 2786141 DNA DNA 11038351
iii) Drop Rate = (B/A) * 100 <=5% 0.49% 0.63% DNA DNA 1.42%
May-16
Cellular Mobile Telephone Services
Network Service Quality Parameter
Service Activation/ Provisioning
PDP Context Activation Success Rate
Drop Rate
S. No. Name of Parameter Benchmark AIRTEL IDEA MTNLRCOM
GSMVODAFONE
1
i)Total No. of Subscribers for Service
Activation (A)DNA DNA DNA DNA DNA
ii)Total Service Activations provided within
4 Hours (B)DNA DNA DNA DNA DNA
iii)Service Activation / Provisioning = (B/A) *
100
Within 4 Hours
with 95%
Success Rate
DNA DNA DNA DNA DNA
2
i)Total No. of PDP Context Activation
Requests (from SGSN to GGSN) (A) 22997767176612405 DNA DNA 19645983
ii)
Total No. of PDP Context Activation
Success (path created b/w SGSN and
GGSN) (B) 22994649
174254097 DNA DNA 19259361
iii)PDP Context Activation Success Rate
=(B/A) *100>=95% 99.99% 98.66% DNA 99.22% 98.03%
3
i)RNC originated PS Domain Iu
Connection Setup Success (A) 1019696704438104410 DNA DNA 715980497
ii)RNC originated PS Domain Iu
Connection Release (B) 51467642804061 DNA DNA 10848043
iii) Drop Rate = (B/A) * 100 <=5% 0.50% 0.64% DNA DNA 1.52%
Jun-16
Cellular Mobile Telephone Services
Network Service Quality Parameter
Service Activation/ Provisioning
PDP Context Activation Success Rate
Drop Rate

April to June 2016 – Delhi Circle 39
6.32. PMR 3 DAY LIVE 3G WIRELESS DATA - CONSOLIDATED
S. No. Name of Parameter Benchmark AIRTEL IDEA MTNLRCOM
GSM
VODAFO
NE
1
i)Total No. of Subscribers for Service
Activation (A)DNA DNA DNA DNA DNA
ii)Total Service Activations provided within 4
Hours (B)DNA DNA DNA DNA DNA
iii)Service Activation / Provisioning = (B/A) *
100
Within 4 Hours with 95%
Success RateDNA DNA DNA DNA DNA
2
i)Total No. of PDP Context Activation
Requests (from SGSN to GGSN) (A)2372902 17782192 DNA DNA 2930191
ii)
Total No. of PDP Context Activation
Success (path created b/w SGSN and
GGSN) (B)
2372463.67 17329197 DNA DNA 2877207
iii)PDP Context Activation Success Rate
=(B/A) *100>=95% 99.98% 97.46% DNA 99.33% 98.29%
3
i)RNC originated PS Domain Iu Connection
Setup Success (A)107910547 43226049 DNA DNA 48304798
ii)RNC originated PS Domain Iu Connection
Release (B)538315 288878.3 DNA DNA 720136
iii) Drop Rate = (B/A) * 100 <=5% 0.50% 0.67% DNA DNA 1.45%
Drop Rate
CONSOLIDATED
Cellular Mobile Telephone Services
Network Service Quality Parameter
Service Activation/ Provisioning
PDP Context Activation Success Rate

April to June 2016 – Delhi Circle 40
6.33. PMR 3 DAY LIVE 3G WIRELESS DATA - APRIL
6.34. PMR 3 DAY LIVE 3G WIRELESS DATA - MAY
S. No. Name of Parameter Benchmark AIRTEL IDEA MTNLRCOM
GSMVODAFONE
1
i)Total No. of Subscribers for Service Activation
(A)DNA DNA DNA DNA DNA
ii)Total Service Activations provided within 4
Hours (B)DNA DNA DNA DNA DNA
iii) Service Activation / Provisioning = (B/A) * 100Within 4 Hours with
95% Success RateDNA DNA DNA DNA DNA
2
i)Total No. of PDP Context Activation
Requests (from SGSN to GGSN) (A)2825684 17952615 DNA DNA 2123746
ii)Total No. of PDP Context Activation Success
(path created b/w SGSN and GGSN) (B)2824958 17295769 DNA DNA 2090970
iii)PDP Context Activation Success Rate =(B/A)
*100>=95% 99.97% 96.34% DNA 99.37% 98.46%
3
i)RNC originated PS Domain Iu Connection
Setup Success (A)111783008 40675805 DNA DNA 25518376
ii)RNC originated PS Domain Iu Connection
Release (B)556299 301196 DNA DNA 347002
iii) Drop Rate = (B/A) * 100 <=5% 0.50% 0.74% DNA DNA 1.36%
Apr-16
Cellular Mobile Telephone Services
Network Service Quality Parameter
Service Activation/ Provisioning
PDP Context Activation Success Rate
Drop Rate
S. No. Name of Parameter Benchmark AIRTEL IDEA MTNLRCOM
GSM
VODAFO
NE
1
i)Total No. of Subscribers for Service Activation
(A)DNA DNA DNA DNA DNA
ii)Total Service Activations provided within 4 Hours
(B)DNA DNA DNA DNA DNA
iii) Service Activation / Provisioning = (B/A) * 100Within 4 Hours with 95%
Success RateDNA DNA DNA DNA DNA
2
i)Total No. of PDP Context Activation Requests
(from SGSN to GGSN) (A)2147567 17610526 DNA DNA 4685401
ii)Total No. of PDP Context Activation Success
(path created b/w SGSN and GGSN) (B)2147314 17136931 DNA DNA 4589647
iii)PDP Context Activation Success Rate =(B/A)
*100>=95% 99.99% 97.31% DNA 99.27% 97.96%
3
i)RNC originated PS Domain Iu Connection Setup
Success (A)109566309 45468405 DNA DNA DNA
ii)RNC originated PS Domain Iu Connection
Release (B)538347 281770 DNA DNA DNA
iii) Drop Rate = (B/A) * 100 <=5% 0.49% 0.62% DNA DNA DNA
May-16
Cellular Mobile Telephone Services
Network Service Quality Parameter
Service Activation/ Provisioning
PDP Context Activation Success Rate
Drop Rate

April to June 2016 – Delhi Circle 41
6.35. PMR 3 DAY LIVE 3G WIRELESS DATA - JUNE
6.36. POI CONGESTION: CONSOLIDATED
S. No. Name of Parameter Benchmark AIRTEL IDEA MTNL RCOM GSMVODAFO
NE
1
i) Total No. of Subscribers for Service Activation (A) DNA DNA DNA DNA DNA
ii) Total Service Activations provided within 4 Hours (B) DNA DNA DNA DNA DNA
iii) Service Activation / Provisioning = (B/A) * 100Within 4 Hours with
95% Success RateDNA DNA DNA DNA DNA
2
i)Total No. of PDP Context Activation Requests (from
SGSN to GGSN) (A)2145455 17783435 DNA DNA 1981426
ii)Total No. of PDP Context Activation Success (path
created b/w SGSN and GGSN) (B)2145119 17554891 DNA DNA 1951003
iii) PDP Context Activation Success Rate =(B/A) *100 >=95% 99.98% 98.71% DNA 99.37% 98.46%
3
i)RNC originated PS Domain Iu Connection Setup Success
(A)102382324 43533938 DNA DNA 71091220
ii) RNC originated PS Domain Iu Connection Release (B) 520299 283669 DNA DNA 1093270
iii) Drop Rate = (B/A) * 100 <=5% 0.51% 0.65% DNA DNA 1.54%
Jun-16
Cellular Mobile Telephone Services
Network Service Quality Parameter
Service Activation/ Provisioning
PDP Context Activation Success Rate
Drop Rate
S. No. Name of Parameter Benchmark AIRCEL AIRTEL IDEA MTNL MTSRCOM
CDMA
RCOM
GSMTTSL
VODAFON
E
Total No. of call attempts on POI 4321422.3 10989319 40530.949 13412.97516 226073.91 307457.17 469801.41 6299.0435 11429868
Total traffic served on all POIs
(Erlang) 154185.67 246081.98 1797.0153 262.9233077 5526.7459 4863.776 7989.388 243.23245 242981.1
Total No. of circuits on all
individual POIs 154705.45 398548.26 218644.7 56452.6 25876.385 10878.825 10303.922 111329.16 421009.41
Total number of working POI
Service Area wise180.54229 16 90 91 51 15.741859 15.078853 35 391
Capacity of all POIs 150908.25 386657.74 215878.11 56452.6 25878.687 8595.2834 9024.2212 105642.61 425164.19
No. of all POI’s having >=0.5%
POI congestionNIL NIL NIL NIL NIL NIL NIL NIL NIL
Name of POI not meeting the
benchmark (having >=0.5% POI
congestion)
NIL NIL NIL NIL NIL NIL NIL NIL NIL
Consolidated
Monthly TRAI Network Performance Report of Cellular Mobile Telephone Service - Network Service
Network Service Quality Parameter
1
Total No. of POI’s in Month having < = 0.5% POI congestion

April to June 2016 – Delhi Circle 42
6.37. POI CONGESTION: APRIL
6.38. POI CONGESTION: MAY
6.39. POI CONGESTION: JUNE
S. No. Name of Parameter Benchmark AIRCEL AIRTEL IDEA MTNL MTS RCOM CDMA RCOM GSM TTSL VODAFONE
Total No. of call attempts on POI 4037557 10990248 39340 DNA 220374 352873 466300 6685 11194604
Total traffic served on all POIs
(Erlang) 244144 244196 1632 DNA 5459 5630 7859 245 239969
Total No. of circuits on all
individual POIs 153937 393699 217789 DNA 25673 11124 9998 111849 420034
Total number of working POI
Service Area wise178 16 DNA 50 16 15 35 390
Capacity of all POIs 149955 382200 215052 DNA 25675 8990 8692 106149 424179
No. of all POI’s having >=0.5%
POI congestionNIL NIL NIL DNA NIL NIL NIL NIL NIL
Name of POI not meeting the
benchmark (having >=0.5% POI
congestion)
NIL NIL NIL DNA NIL NIL NIL NIL NIL
Network Service Quality Parameter
1
Total No. of POI’s in Month having < = 0.5% POI congestion
Apr-16
Monthly TRAI Network Performance Report of Cellular Mobile Telephone Service - Network Service
S. No. Name of Parameter Benchmark AIRCEL AIRTEL IDEA MTNL MTS RCOM CDMA RCOM GSM TTSL VODAFONE
Total No. of call attempts on POI 4373867 10979805 40474 DNA 223244 308566 467588 6030 11638289
Total traffic served on all POIs
(Erlang) 126419 247050 1198 DNA 5398 4921 7919 252 245213
Total No. of circuits on all
individual POIs 155362 399229 218739 DNA 26096 10362 10176 110863 420279
Total number of working POI
Service Area wise181 16 90 DNA 52 15 15 35 390
Capacity of all POIs 151323 387516 215986 DNA 26100 8080 8964 105197 424427
No. of all POI’s having >=0.5%
POI congestionNIL NIL NIL DNA NIL NIL NIL NIL NIL
Name of POI not meeting the
benchmark (having >=0.5% POI
congestion)
NIL NIL NIL DNA NIL NIL NIL NIL NIL
May-16
Monthly TRAI Network Performance Report of Cellular Mobile Telephone Service - Network Service
Network Service Quality Parameter
1
Total No. of POI’s in Month having < = 0.5% POI congestion
S. No. Name of Parameter Benchmark AIRCEL AIRTEL IDEA MTNL MTS RCOM CDMA RCOM GSM TTSL VODAFONE
Total No. of call attempts on POI 4552843 10997904 41779 13413 234603 260933 475516 6182 11456711
Total traffic served on all POIs
(Erlang) 91994 247000 2561 263 5724 4041 8191 232 243761
Total No. of circuits on all
individual POIs 154818 402716 219406 56453 25860 11151 10738 111276 422715
Total number of working POI
Service Area wise182 16 90 91 51 16 16 35 393
Capacity of all POIs 151447 390257 216597 56453 25862 8715 9417 105581 426887
No. of all POI’s having >=0.5%
POI congestionNIL NIL NIL NIL NIL NIL NIL NIL NIL
Name of POI not meeting the
benchmark (having >=0.5% POI
congestion)
NIL NIL NIL NIL NIL NIL NIL NIL NIL
Jun-16
Monthly TRAI Network Performance Report of Cellular Mobile Telephone Service - Network Service
Network Service Quality Parameter
1
Total No. of POI’s in Month having < = 0.5% POI congestion

April to June 2016 – Delhi Circle 43
7. CUSTOMER SERVICE DELIVERY
7.1. BILLING AND CUSTOMER CARE
% of Complaints
addressed at call
center level
% of Complaints
addressed by
Appellate
Authority
BenchmarkAIRCEL 100.00% 100.00%AIRTEL 90.02% 75.36%MTNL 38.39% 72.00%IDEA 100.00% 100.00%MTS 34.62% 100.00%
RCOM-GSM 100.00% 100.00%RCOM-CDMA 100.00% 100.00%TTSL-CDMA 98.57% 97.16%VODAFONE 93.87% 100.00%
Name of Service Provider
Customer Care & Grievances Redressal
Termination & Closures
Time taken for refund of
deposits after closures:
Benchmark
Postpaid
Subscribers
Prepaid
Subscribers
%age complaints
resolved within
4 weeks
%age
complaints
resolved
within 6 weeks
%age of where
credit/waiver is
received within one
week
% of Termination/
Closure of service
within 7 days (100 %)
Cleared over a period of <60 days
(100%)
%age of calls
answered by
the IVR
%age of call
answered by the
operators ( voice to
voice) within 90
seconds
Benchmark ≤ 0.1% ≤ 0.1% ≥ 98% = 100% = 100% = 100% = 100% ≥ 95% ≥ 95%AIRCEL 0.00% 0.00% 100.00% 100.00% 100.00% 100.00% 100.00% 95.70% 89.71%AIRTEL 0.03% 0.00% 99.94% 100.00% 100.00% 100.00% 100.00% 100.00% 90.06%MTNL 0.09% 0.17% 100.00% 100.00% 100.00% 99.98% 100.00% 98.81% 99.45%IDEA 0.05% 0.03% 100.00% 100.00% 100.00% 100.00% 100.00% 99.72% 96.75%MTS 0.08% 0.01% 100.00% 0.00% 100.00% 100.00% 100.00% 98.99% 120.28%
RCOM-GSM 0.09% 0.01% 100.00% 100.00% 100.00% 100.00% 96.29% 99.27% 79.95%RCOM-CDMA 0.09% 0.09% 100.00% 100.00% 100.00% 100.00% 93.69% 99.73% 70.73%TTSL-CDMA 0.00% 0.00% 100.00% 100.00% 100.00% 100.00% 100.00% 99.06% 97.72%VODAFONE 0.14% 0.02% 100.00% 100.00% 100.00% 100.00% 100.00% 100.00% 97.96%
Name of Service Provider
Metering and Billing
credibilityBilling Complaints
Response time to customer for
assistance

April to June 2016 – Delhi Circle 44
7.2. LIVE CALLING DATA: CONSOLIDATED
Name of Service Provider
Metering and Billing (Service Request) Response time to
customer for Assistance
Total Calls
Attempted
No. of Subscribers
reached
Complaints/ Request
attended to satisfaction
% of Complaints/
Request attended to satisfaction
Accessibility of call
centre / Customer
care
%age of call
answered by the
operators ( voice to
voice) within 90 seconds
Benchmark ≥ 95% ≥ 95%
AIRCEL 80 49 45 91.84% 100.00% 96.00%
AIRTEL 211 119 115 96.64% 100% 100%
MTNL 897 627 625 99.68% 100.00% 100.00%
IDEA 345 200 198 99.00% 100% 100%
MTS 445 299 295 98.66% 100% 100%
RCOM-GSM 230 179 174 97.21% 97.00% 97.00%
RCOM-CDMA
154 92 91 98.91% 97.00% 97.00%
TTSL-CDMA
150 89 87 97.75% 100% 100%
VODAFONE 300 122 119 97.54% 100% 100%
Live calling data has been conducted by the auditor from the operator call centre(s).

April to June 2016 – Delhi Circle 45
7.3. 3 DAYS LIVE CALL CENTRE DATA
Response time to customer assistance
OPERATOR
Total no of calls
attempted to
customer care/Call
center
Total no. of calls
successfully established to customer
care/Call center
% age of Accessibility
of Call centre
Total Calls
reached to
operator for (Voice to Voice)
Total number of calls
answered by the
operator (Voice to
voice) within 90 seconds
% age calls
answered by the
operator within 90 seconds
DAYS AVERAGE
OPERATOR >=95% >=95%
AIRCEL 728401 718114 98.59% 137636 135643 98.55%
AIRTEL 137004 137004 100.00% 221963 213524 96.20%
MTNL 26472 26472 100.00% 16140 15934 98.72%
IDEA 844489 832906 98.63% 185734 185375 99.81%
MTS 67910 67276 99.07% 15435 14735 95.46%
RCOM-GSM 386078 385215 99.78% 84955 73112 86.06%
RCOM-CDMA
80652 79900 99.07% 18602 16635 89.43%
TTSL-CDMA
143287 141005 98.41% 12078 11891 98.45%
VODAFONE 663815 663815 100.00% 269091 261122 97.04%

April to June 2016 – Delhi Circle 46
8. L1 CALLING DATA
L1 Calling data covers all the SDCA covered across the two operator assisted drive tests:
Noida & Ghaziabad: 23rd May to 25th May 2016 Gurgaon / Faridabad: 6th June 2015 to 8th June 2016
8.1. AIRCEL
SR. NO. EMERGENCY NUMBER NOIDA GHAZIABAD GREATER NOIDA Gurgoan
1 100
2 101
3 102
4 104
5 108
6 138
7 149
8 181
9 182
10 1033
11 1037
12 1056
13 1060
14 1063
15 1064
16 1070
17 1071
18 1072
19 1073
20 1077
21 1090
22 1091
23 1097
24 1099
25 1511
26 1512
27 1514
28 1903
29 1909
30 1912
31 1916
32 1950
33 10580
34 10589
35 10740
36 10741
37 15100
38 155214
39 155304

April to June 2016 – Delhi Circle 47
8.2. AIRTEL
SR. NO. EMERGENCY NUMBER NOIDA GHAZIABAD GREATER
NOIDA GURGAON FARIDABAD
1 100
2 101
3 102
4 104
5 108
6 138
7 149
8 181
9 182
10 1033
11 1037
12 1056
13 1060
14 1063
15 1064
16 1070
17 1071
18 1072
19 1073
20 1077
21 1090
22 1091
23 1097
24 1099
25 1511
26 1512
27 1514
28 1903
29 1909
30 1912
31 1916
32 1950
33 10580
34 10589
35 10740
36 10741
37 15100
38 155214
39 155304

April to June 2016 – Delhi Circle 48
8.3. IDEA
SR. NO
.
EMERGENCY NUMBER
NOIDA
GHAZIABAD
GREATER NOIDA
Gurgaon(Day1)
Gurgaon(Day2)
Faridabad(Day3)
1 100
2 101
3 102
4 104
5 108
6 138
7 149
8 181
9 182
10 1033
11 1037
12 1056
13 1060
14 1063
15 1064
16 1070
17 1071
18 1072
19 1073
20 1077
21 1090
22 1091
23 1097
24 1099
25 1511
26 1512
27 1514
28 1903
29 1909
30 1912
31 1916
32 1950
33 10580
34 10589
35 10740
36 10741
37 15100
38 155214
39 155304

April to June 2016 – Delhi Circle 49
8.4. MTNL
SR. NO. EMERGENCY NUMBER NOIDA GHAZIABAD GREATER NOIDA Gurgaon Faridabad
1 100
2 101
3 102
4 104
5 108
6 138
7 149
8 181
9 182
10 1033
11 1037
12 1056
13 1060
14 1063
15 1064
16 1070
17 1071
18 1072
19 1073
20 1077
21 1090
22 1091
23 1097
24 1099
25 1511
26 1512
27 1514
28 1903
29 1909
30 1912
31 1916
32 1950
33 10580
34 10589
35 10740
36 10741
37 15100
38 155214
39 155304

April to June 2016 – Delhi Circle 50
8.5. MTS
SR. NO. EMERGENCY NUMBER NOIDA GHAZIABAD GREATER NOIDA GURGAON GURGAON FARIDABAD
1 100
2 101
3 102
4 104
5 108
6 138
7 149
8 181
9 182
10 1033
11 1037
12 1056
13 1060
14 1063
15 1064
16 1070
17 1071
18 1072
19 1073
20 1077
21 1090
22 1091
23 1097
24 1099
25 1511
26 1512
27 1514
28 1903
29 1909
30 1912
31 1916
32 1950
33 10580
34 10589
35 10740
36 10741
37 15100
38 155214
39 155304

April to June 2016 – Delhi Circle 51
8.6. RCOM CDMA
SR. NO. EMERGENCY NUMBER NOIDA GHAZIABAD GREATER NOIDA NOIDA GHAZIABAD GREATER NOIDA
1 100
2 101
3 102
4 104
5 108
6 138
7 149
8 181
9 182
10 1033
11 1037
12 1056
13 1060
14 1063
15 1064
16 1070
17 1071
18 1072
19 1073
20 1077
21 1090
22 1091
23 1097
24 1099
25 1511
26 1512
27 1514
28 1903
29 1909
30 1912
31 1916
32 1950
33 10580
34 10589
35 10740
36 10741
37 15100
38 155214
39 155304

April to June 2016 – Delhi Circle 52
8.7. RCOM GSM
SR. NO. EMERGENCY NUMBER NOIDA GHAZIABAD GREATER NOIDA GURGAON GURGAON FARIDABAD
1 100
2 101
3 102
4 104
5 108
6 138
7 149
8 181
9 182
10 1033
11 1037
12 1056
13 1060
14 1063
15 1064
16 1070
17 1071
18 1072
19 1073
20 1077
21 1090
22 1091
23 1097
24 1099
25 1511
26 1512
27 1514
28 1903
29 1909
30 1912
31 1916
32 1950
33 10580
34 10589
35 10740
36 10741
37 15100
38 155214
39 155304

April to June 2016 – Delhi Circle 53
8.8. TTSL CDMA
SR. NO. EMERGENCY NUMBER NOIDA GHAZIABAD GREATER NOIDA GURGAON FARIDABAD
1 100
2 101
3 102
4 104
5 106
6 108
7 138
8 149
9 181
10 182
11 1033
12 1037
13 1056
14 1063
15 1064
16 1070
17 1071
18 1072
19 1073
20 1077
21 1090
22 1091
23 1097
24 1099
25 1511
26 1512
27 1514
28 1903
29 1909
30 1912
31 1916
32 1950
33 10580
34 10589
35 10740
36 10741
37 15100
38 155214
39 155304

April to June 2016 – Delhi Circle 54
8.9. VODAFONE
SR. NO. EMERGENCY
NUMBER NOIDA GHAZIABAD
GREATER NOIDA
Gurgoan Faridabad
1 100
2 101
3 102
4 104
5 108
6 138
7 149
8 181
9 182
10 1033
11 1037
12 1056
13 1060
14 1063
15 1064
16 1070
17 1071
18 1072
19 1073
20 1077
21 1090
22 1091
23 1097
24 1099
25 1511
26 1512
27 1514
28 1903
29 1909
30 1912
31 1916
32 1950
33 10580
34 10589
35 10740
36 10741
37 15100
38 155214
39 155304

April to June 2016 – Delhi Circle 55
9. OPERATOR ASSISTED DRIVE TEST
The drive test was conducted simultaneously for all the operators present in the Delhi circle. As per
the new directive given by TRAI headquarters, drive test for the month of April, May and June, 2016
were conducted at a SSA level. Drive test was conducted for three days in each SSA and the selection
of routes ensured that the maximum towns, villages, highways are covered as part of drive test. The
routes were selected on basis of the complaints received from the customers. The auditors were
present in vehicles of every operator. The holding period for all test calls was 120 seconds and the
gap between calls was 10 seconds.
For measuring voice quality RxQual samples for GSM operators and Frame Error Rate (FERs) for
CDMA service providers were measured. RxQual greater than 5 meant that the sample was not of
appropriate voice quality and for CDMA operators FERs of more than 4 were considered bad. Call
drops were measured by the number of calls that were dropped to the total number of calls established
during the drive test. Similarly CSSR was measured as the ratio of total calls established to the total
call attempts made. Signal strength was measured in Dbm with strength > -75dbm for indoor, -85 dbm
for in-vehicle and > -95 dbm outdoor routes. Below is the schedule and operators involved in the
drive test for the Delhi circle.
9.1. MAY: DELHI SSA
Month Name of SSA covered Drive Test Schedule
May 2016 Delhi May 23, 2016 to May 25, 2016
9.2. DISTANCE COVERED: DELHI SSA
Drive Test Distance Covered Day 1 Day 2 Day 3
Delhi SSA 120 km 125 km 100 km

April to June 2016 – Delhi Circle 56
9.3. ROUTE MAP: DELHI SSA: DAY 1
9.4. ROUTE MAP: DELHI SSA: DAY 2

April to June 2016 – Delhi Circle 57
9.5. ROUTE MAP: DELHI SSA: DAY 3
9.6. DRIVE TEST OUTCOME SUMMARY
Call Events Aircel Airtel Idea MTNL RCOM CDMA RCOM GSM
TTSL Vodafone MTS
Total Calls Attempt (A) 600 617 599 532 605 610 645 606 642
Total Calls Blocked (B) 8 9 15 41 0 14 0 11 4
Blocked Call Rate in % (B*100/A)
1.33% 1.46% 2.50% 7.71% 0.00% 2.30% 0.00% 1.82% 0.62%
Total Calls Established ('C) 590 607 579 491 605 596 645 595 638
Total Calls Drop (D) 3 6 4 38 11 4 1 7 5
Dropped Calls Rate in % (D*100/C)
0.51% 0.99% 0.69% 7.74% 1.82% 0.67% 0.16% 1.18% 0.78%
Call Setup Success Rate in % (C*100/A)
98.33% 98.38% 96.66% 92.29% 100.00% 97.70% 100.00% 98.18% 99.38%
Handover Success Rate % (total HO Success * 100/Total HO attempt)
98.56% 97.22% 98.41% 79.50% 100.00% 94.56% 100.00% 100.00% 98.52%

April to June 2016 – Delhi Circle 58
9.7. JUNE: DELHI SSA
Month Name of SSA covered Drive Test Schedule
June 2015 Delhi June 06, 2015 to June 08, 2015
9.8. DELHI SSA: DISTANCE COVERED
Drive Test Distance Covered Day 1 Day 2 Day 3
Delhi SSA 112 km 88 km 98 km
9.9. ROUTE MAP: DELHI SSA: DAY 1

April to June 2016 – Delhi Circle 59
9.10. ROUTE MAP: DELHI SSA: DAY 2
9.11. ROUTE MAP: DELHI SSA: DAY 3

April to June 2016 – Delhi Circle 60
9.12. DRIVE TEST OUTCOME
Call Events Aircel Airtel Idea MTNL RCOM CDMA RCOM GSM
TTSL Vodafone MTS
Total Calls Attempt (A) 633 615 583 629 713 618 714 641 659
Total Calls Blocked (B) 15 9 3 41 0 10 2 7 2
Blocked Call Rate in % (B*100/A)
2.37% 1.46% 0.51% 6.52% 0.00% 1.62% 0.28% 1.09% 0.30%
Total Calls Established ('C) 594 603 579 586 713 608 714 634 657
Total Calls Drop (D) 5 4 9 29 6 3 2 4 0
Dropped Calls Rate in % (D*100/C)
0.84% 0.66% 1.55% 4.95% 0.84% 0.49% 0.28% 0.63% 0.00%
Call Setup Success Rate in % (C*100/A)
93.84% 98.05% 99.31% 93.16% 100.00% 98.38% 100.00% 98.91% 99.70%
Handover Success Rate % (total HO Success *
100/Total HO attempt) 98.78% 96.79% 97.41% 84.50% 100.00% 96.66% 100.00% 100.00% 98.32%

April to June 2016 – Delhi Circle 61
10. COUNTER DETAILS
Sl
No. KPI Formula with Counter Description
1 CSSR= (No of established Calls / No of Attempted Calls)%
No of established Calls = ([Assignment Requests]-([Failed Assignments (Signaling Channel)]+[Failed Assignments during MOC on the A Interface (Including Directed Retry)]+[Failed Assignments during MTC on the A Interface (Including Directed Retry)]+[Failed Assignments during Emergency Call on the A Interface (Including Directed Retry)] +[Failed Assignments during Call Re-establishment on the A Interface (Including Directed Retry)]+[Failed Mode Modify Attempts (MOC) (TCHF)]+[Failed Mode Modify Attempts (MTC) (TCHF)]+[Failed Mode Modify Attempts (Emergency Call) (TCHF)]+[Failed Mode Modify Attempts (Call Re-establishment) (TCHF)]+[Failed Mode Modify Attempts (MOC) (TCHH)]+[Failed Mode Modify Attempts (MTC) (TCHH)]+[Failed Mode Modify Attempts (Call Re-establishment) (TCHH)]))/No of Attempted Calls = ([Assignment Requests (Signaling Channel) (TCH)] + [Assignment Requests (Signaling Channel) (SDCCH)] + [Assignment Requests (TCHF Only)] + [Assignment Requests (TCHH Only)] + [Assignment Requests (TCHF Preferred, Channel Type Unchangeable)] + [Assignment Requests (TCHH Preferred, Channel Type Unchangeable)] + [Assignment Requests (TCHF or TCHH, Channel Type Unchangeable)] + [Assignment Requests (TCHF Preferred, Channel Type Changeable)] + [Assignment Requests (TCHH Preferred, Channel Type Changeable)] + [Assignment Requests (TCHF or TCHH, Channel Type Changeable)])
2 SDCCH congestion= (SDCCH Failure/SDCCH attempts)%
SDCCH Failure= ([Channel Assignment Failures (All Channels Busy or Channels Unconfigured) in Immediate Assignment Procedure (SDCCH)] + [Failed Internal Intra-Cell Handovers (No Channel Available) (SDCCH)] + [Number of Unsuccessful Incoming Internal Inter-Cell Handovers (No Channel Available) (SDCCH)] + [Failed Incoming External Inter-Cell Handovers (No Channel Available) (SDCCH)])/SDCCH attempts = ([Channel Assignment Requests in Immediate Assignment Procedure (SDCCH)] + [Internal Intra-Cell Handover Requests (SDCCH)] + [Number of Incoming Internal Inter-Cell Handover Requests (SDCCH) (900/850/810-900/850/810)] + [Number of Incoming Internal Inter-Cell Handover Requests (SDCCH) (1800/1900-1800/1900)] + [Number of Incoming Internal Inter-Cell Handover Requests (SDCCH) (900/850/810-1800/1900)] + [Number of Incoming Internal Inter-Cell Handover Requests (SDCCH) (1800/1900-900/850/810)] + [Incoming External Inter-Cell Handover Requests (SDCCH) (900/850/810-900/850/810)] + [Incoming External Inter-Cell Handover Requests (SDCCH) (1800/1900-1800/1900)] + [Incoming External Inter-Cell Handover Requests (SDCCH) (900/850/810-1800/1900)] + [Incoming External Inter-Cell Handover Requests (SDCCH) (1800/1900-900/850/810)])
3 TCH congestion= (TCH Failures /TCH Attempts)%
TCH Failures= ((Failed TCH Seizures due to Busy TCH (Signaling Channel)+([Failed Assignments (First Assignment, No Channel Available in Assignment Procedure)]+[Failed Assignments (First Assignment, No Channel Available in Directed Retry Procedure)]+[Failed Assignments (Reconnection to Old Channels, No Channel Available in Assignment)]+[Failed Assignments (Reconnection to Old Channels, No Channel Available in Directed Retry)])/TCH Attempts = ([Assignment Requests (Signaling Channel) (TCH)] + [Assignment Requests (Signaling Channel) (SDCCH)] + [Assignment Requests (TCHF Only)] + [Assignment Requests (TCHH Only)] + [Assignment Requests (TCHF Preferred, Channel Type Unchangeable)] + [Assignment Requests (TCHH Preferred, Channel Type Unchangeable)] + [Assignment Requests (TCHF or TCHH, Channel Type Unchangeable)] + [Assignment Requests (TCHF Preferred, Channel Type Changeable)] + [Assignment Requests (TCHH Preferred, Channel Type Changeable)] + [Assignment Requests (TCHF or TCHH, Channel Type Changeable)])
4 Call Drop Rate= (The total no of dropped calls*100)/Total no of calls successfully established (where traffic channel is allotted)
The total no of dropped calls= ([Call Drops on Radio Interface in Stable State (Traffic Channel)] + [Call Drops on Radio Interface in Handover State (Traffic Channel)] + [Call Drops Due to No MR from MS for a Long Time (Traffic Channel)] + [Call Drops due to Abis Terrestrial Link Failure (Traffic Channel)] + [Call Drops due to Equipment Failure (Traffic Channel)] + [Call Drops due to Forced Handover (Traffic Channel)] + [Call Drops due to local switching Start Failure] + [Call Drops due to Failures to Return to Normal Call from local switching])/Total no of calls successfully established (where traffic channel is allotted) = ([Assignment Requests]-([Failed Assignments (Signaling Channel)]+[Failed Assignments during MOC on the A Interface (Including Directed Retry)]+[Failed Assignments during MTC on the A Interface (Including Directed Retry)]+[Failed Assignments during Emergency Call on the A Interface (Including Directed Retry)] +[Failed Assignments during Call Re-establishment on the A Interface (Including Directed Retry)]+[Failed Mode Modify Attempts (MOC) (TCHF)]+[Failed Mode Modify Attempts (MTC) (TCHF)]+[Failed Mode Modify Attempts (Emergency Call) (TCHF)]+[Failed Mode Modify Attempts (Call Re-establishment)

April to June 2016 – Delhi Circle 62
(TCHF)]+[Failed Mode Modify Attempts (MOC) (TCHH)]+[Failed Mode Modify Attempts (MTC) (TCHH)]+[Failed Mode Modify Attempts (Call Re-establishment) (TCHH)])
5 Call Drop Rate= (No of cells having call drop rate >3% during CBBH in a month*100)/Total no of cells in the licensed service area
Above formula with counters being used in CBBH.
6 Connection with good quality voice= (Connection with good quality voice/Total voice samples)%
Connection with good quality voice = ((Number of MRs on Downlink TCHF (Receive Quality Rank 0)+Number of MRs on Downlink TCHF (Receive Quality Rank 1)+Number of MRs on Downlink TCHF (Receive Quality Rank 2)+Number of MRs on Downlink TCHF (Receive Quality Rank 3)+Number of MRs on Downlink TCHF (Receive Quality Rank 4)+Number of MRs on Downlink TCHF (Receive Quality Rank 5)+Number of MRs on Downlink TCHH (Receive Quality Rank 0)+Number of MRs on Downlink TCHH (Receive Quality Rank 1)+Number of MRs on Downlink TCHH (Receive Quality Rank 2)+Number of MRs on Downlink TCHH (Receive Quality Rank 3)+Number of MRs on Downlink TCHH (Receive Quality Rank 4)+Number of MRs on Downlink TCHH (Receive Quality Rank 5)) /Total voice samples= ((Number of MRs on Downlink TCHF (Receive Quality Rank 0)+Number of MRs on Downlink TCHF (Receive Quality Rank 1)+Number of MRs on Downlink TCHF (Receive Quality Rank 2)+Number of MRs on Downlink TCHF (Receive Quality Rank 3)+Number of MRs on Downlink TCHF (Receive Quality Rank 4)+Number of MRs on Downlink TCHF (Receive Quality Rank 5)+Number of MRs on Downlink TCHF (Receive Quality Rank 6)+Number of MRs on Downlink TCHF (Receive Quality Rank 7)+Number of MRs on Downlink TCHH (Receive Quality Rank 0)+:Number of MRs on Downlink TCHH (Receive Quality Rank 1)+Number of MRs on Downlink TCHH (Receive Quality Rank 2)+Number of MRs on Downlink TCHH (Receive Quality Rank 3)+Number of MRs on Downlink TCHH (Receive Quality Rank 4)+Number of MRs on Downlink TCHH (Receive Quality Rank 5)+Number of MRs on Downlink TCHH (Receive Quality Rank 6)+Number of MRs on Downlink TCHH (Receive Quality Rank 7))
10.1. ERICSSON
Sl
No. KPI Ericsson
1 CSSR= (No of established Calls / No of Attempted Calls)%
CSSR (No of established Calls / No of Attempted Calls)=(TCASSALL/TASSALL)*100
2 SDCCH congestion= (SDCCH Failure/SDCCH attempts)%
SDCCH congestion (SDCCH Failure/SDCCH attempts)% = (CCONGS/CCALLS)*100
3 TCH congestion= (TCH Failures /TCH Attempts)%
TCH congestion (TCH Failures /TCH Attempts)%= (CNRELCONG+TNRELCONG)/TASSALL)*100
4 Call Drop Rate= (The total no of dropped calls*100)/Total no of calls successfully established (where traffic channel is allotted)
Call Drop Rate (Total no dropped calls/No of established calls)%= (TNDROP)/TCASSALL*100
5 Call Drop Rate= (No of cells having call drop rate >3% during CBBH in a month*100)/Total no of cells in the licensed service area
Above formula with counters being used in CBBH.
6 Connection with good quality voice= (Connection with good quality voice/Total voice samples)%
Connection with good quality voice (Connection with good quality voice samples 0-5 /Total voice samples)= 100 * (QUAL50DL + QUAL40DL + QUAL30DL + QUAL20DL + QUAL10DL + QUAL00DL) / (QUAL70DL + QUAL60DL + QUAL50DL + QUAL40DL + QUAL30DL + QUAL20DL + QUAL10DL + QUAL00DL)
Ericsson Counters Counter Counter Description TCASSALL Number of assignment complete messages on TCH for all MS classes TASSALL Number of first assignment attempts on TCH for all MS classes. CNRELCONG Number of released connections on SDCCH due to TCH or Transcoder (TRA) congestion. TNRELCONG Number of released TCH signalling connections due to transcoder resource congestion during immediate assignment
on TCH CCONGS Congestion counter for SDCCH. Stepped per congested allocation attempt. CCALLS Channel allocation attempt counter on SDCCH. TNDROP The total number of dropped TCH Connections. QUAL00DL Number of quality 0 reported on downlink. QUAL10DL Number of quality 1 reported on downlink. QUAL20DL Number of quality 2 reported on downlink.

April to June 2016 – Delhi Circle 63
QUAL30DL Number of quality 3 reported on downlink. QUAL40DL Number of quality 4 reported on downlink. QUAL50DL Number of quality 5 reported on downlink. QUAL60DL Number of quality 6 reported on downlink. QUAL70DL Number of quality 7 reported on downlink
10.2. NSN (NOKIA SIEMENS NETWORK)
Sl No.
KPI NSN
1 CSSR= (No of established Calls / No of Attempted Calls)%
CSSR= 100-100*((SDCCH_BUSY_ATT)-(TCH_SEIZ_DUE_SDCCH_CON) + (SDCCH_RADIO_FAIL)+(SDCCH_RF_OLD_HO)+(SDCCH_USER_ACT)+(SDCCH_BCSU_RESET)+(SDCCH_NETW_ACT)+(SDCCH_BTS_FAIL)+(SDCCH_LAPD_FAIL)+ (BLCK_8I_NOM)/ {(CH_REQ_MSG_REC)+(PACKET_CH_REQ)}-{(GHOST_CCCH_RES)-(REJ_SEIZ_ATT_DUE_DIST)}
2 SDCCH congestion= (SDCCH Failure/SDCCH attempts)%
SDCCH congestion = (sdcch_busy_att - .tch_seiz_due_sdcch_con)/{(CH_REQ_MSG_REC)+(PACKET_CH_REQ)}-{(GHOST_CCCH_RES)-(REJ_SEIZ_ATT_DUE_DIST)}
3 TCH congestion= (TCH Failures /TCH Attempts)%
TCH congestion = BLCK_8I_NOM / {(TCH_NORM_SEIZ)+(MSC_I_SDCCH_TCH_AT)+(BSC_I_SDCCH_TCH_AT)}
4 Call Drop Rate= (The total no of dropped calls*100)/Total no of calls successfully established (where traffic channel is allotted)
TCH Drop = ( drop_after_tch_assign)-(tch_re_est_release) / {(TCH_NORM_SEIZ)+(MSC_I_SDCCH_TCH_AT)+(BSC_I_SDCCH_TCH_AT)}
5 Call Drop Rate= (No of cells having call drop rate >3% during CBBH in a month*100)/Total no of cells in the licensed service area
Above formula with counters being used in CBBH.
6 Connection with good quality voice= (Connection with good quality voice/Total voice samples)%
Connection with good quality voice= (FREQ_DL_QUAL0+FREQ_DL_QUAL1+FREQ_DL_QUAL2+FREQ_DL_QUAL3+FREQ_DL_QUAL4+FREQ_DL_QUAL5) / (FREQ_DL_QUAL0+FREQ_DL_QUAL1+FREQ_DL_QUAL2+FREQ_DL_QUAL3+FREQ_DL_QUAL4+FREQ_DL_QUAL5+FREQ_DL_QUAL6+FREQ_DL_QUAL7)
10.3. HUAWEI
SR .NO
KPI HUAWEI FORMULA
1 CALL SETUP SUCCES (NUM)
[Successful CS IS-95 Orig Call Setups + Successful CS IS-2000 Orig Call Setups + Successful CS IS-95 Term Call Setups + Successful CS IS-2000 Term Call Setups] ([1157628567] + [1157628587] + [1157628568] + [1157628588] )
2 CALL SETUP SUCCES (DEN)
[CS IS-95 Orig Attempts + CS IS-2000 Orig Attempts + CS IS-95 Term Attempts + CS IS-2000 Term Attempts] ([1157628553] + [1157628573] + [1157628554] + [1157628574] )
3 CALL SETUP SUCCESS RATE (%)
CALL SETUP SUCCES (NUM) / CALL SETUP SUCCES (DEN) * 100\
4 CALL DROP RATE (NUM)
[CS IS-95 Call Drops (Too many Erasure frames) + CS IS-2000 Call Drops (Too many Erasure frames) + CS IS-95 Call Drops (No reverse frame received) + CS IS-2000 Call Drops (No reverse frame received) + CS IS-95 Call Drops (Abis interface abnormal) + CS IS-2000 Call Drops (Abis interface abnormal) + CS IS-95 Call Drops (A2 interface abnormal) + CS IS-2000 Call Drops (A2 interface abnormal) + CS IS-95 Call Drops (HHO fail) + CS IS-2000 Call Drops (HHO fail) + CS IS-95 Call Drops (Other causes) + CS IS-2000 Call Drops (Other causes)] ([1157628608] + [1157628614] + [1157628609] + [1157628615] + [1157628610] + [1157628616] + [1157628611] + [1157628617] + [1157628612] + [1157628618] + [1157628613] + [1157628619])
5 CALL DROP RATE(DEN)
[Successful CS IS-95 Orig Call Setups + Successful CS IS-2000 Orig Call Setups + Successful CS IS-95 Term Call Setups + Successful CS IS-2000 Term Call Setups + CS IS-95 Successful Incoming Hard HOs + CS IS-2000 Successful Incoming Hard HOs] [1157628619]) x 100/([1157628567] + [1157628587] + [1157628568] + [1157628588] + [1157628569] + [1157628589]) ]
6 Call DROP Rate CALL DROP RATE (NUM) / CALL DROP RATE(DEN) * 100\
7 RF BLOCK RATE (NUM)
{[(TCH Assignment Requests-CS Orig-IS95[Times] + TCH Assignment Requests-CS Orig-IS2000[Times] + TCH Assignment Requests-CS Term-IS95[Times] + TCH Assignment Requests-CS Term-IS2000[Times]) - (Successful TCH Assignments-CS Orig-IS95[Times] + Successful TCH Assignments-CS

April to June 2016 – Delhi Circle 64
Orig-IS2000[Times] + Successful TCH Assignments-CS Term-IS95[Times] + Successful TCH Assignments-CS Term-IS2000[Times] )] {[(1157628621 + 1157628628 + 1157628635+ 1157628642)
8 RF BLOCK RATE (DEN)
[((TCH Assignment Requests-CS Orig-IS95[Times] + TCH Assignment Requests-CS Orig-IS2000[Times] + TCH Assignment Requests-CS Term-IS95[Times] + TCH Assignment Requests-CS Term-IS2000[Times]))]} [(1157628621 + 1157628628 + 1157628635+ 1157628642)]}
9 RF BLOCK RATE
RF BLOCK RATE (NUM) / RF BLOCK RATE (DEN) *100
10 Call Quality (RFER)
CS Reverse Link Average FER of Carrier[%

April to June 2016 – Delhi Circle 65
11. BLOCK SCHEMATIC DIAGRAM
11.1. ERICSSON

April to June 2016 – Delhi Circle 66
11.2. NSN

April to June 2016 – Delhi Circle 67
11.3. HUAWEI

April to June 2016 – Delhi Circle 68
12. ABBREVIATIONS
Following terms/abbreviations have been used in this report. This section provides meaning of the abbreviations
used in the report.
TRAI – Telecom Regulatory Authority of India
PCPL – Phistream Consulting Private Limited
QoS – Quality of Service
AMJ’16 – Refers to the quarter of April, May and June 2016
SSA – Secondary Switching Area
NOC – Network Operation Center
OMC – Operations and Maintenance Center
MSC – Mobile Switching Center
PMR – Performance Monitoring Reports
TCBH – Time Consistent Busy Hour
CBBH - Cell Bouncing Busy Hour
BTS – Base Transceiver Station
CSSR – Call Setup Success Rate
TCH – Traffic Channel
SDCCH – Standalone Dedicated Control Channel
CDR – Call Drop Rate
FER – Frame Error Rate
SIM – Subscriber Identity Module
GSM – Global System for Mobile
CDMA – Code Division Multiple Access
NA – Not Applicable
NC – Non Compliance
POI – Point of Interconnection
IVR – Interactive Voice Response
STD – Standard Trunk Dialling
ISD – International Subscriber Dialling

January to March 2016– Delhi Circle 69
13 ANNEXURE
13.1. 2G VOICE PMR DATA: CONSOLIDATED
Benchmark AIRCEL AIRTEL IDEA MTNL MTS RCOM CDMA RCOM GSM TTSL VODAFONE
Sum of downtime of BTSs in a
month in hrs. in the licensed
service area
≤ 2% 0.14% 0.01% 0.06% 0.00% 0.06% 0.22% 0.06% 0.07% 0.22%
No. of BTSs having accumulated
downtime of >24 hours in a month≤ 2% 0.31% 0.00% 0.00% 0.18% 0.00% 1.58% 0.19% 0.27% 1.36%
Call Set-up Success Rate (Within
Licensee own network≥ 95% 96.94% 99.09% 99.07% 97.08% 98.94% 96.70% 96.32% 98.97% 99.11%
SDDCH/Paging chl. Congestion ≤ 1% 0.33% 0.04% 0.43% 0.00% NA 0.00% 0.49% 0.00% 0.15%
TCH Congestion ≤ 2% 1.56% 0.02% 0.38% 1.77% 0.19% 0.86% 2.06% 0.26% 0.89%
Call Drop Rate (%age) ≤ 2% 0.84% 0.70% 0.65% 1.79% 0.30% 0.45% 0.20% 0.33% 1.07%
Worst Affected cell having more
than 3% TCH drop≤ 3% 4.18% 1.57% 2.07% 2.53% 1.55% 1.44% 0.47% 1.50% 2.58%
%age of connection with good
voice quality≥ 95% 95.64% 98.88% 98.35% 97.41% 99.18% 99.80% 98.71% 99.12% 98.12%
Network Availability
Connection
Establishment
(Accessibility)
Connection
Maintenance
(Retainability)
Consolidated
Network ParametersName of Service Provider

January to March 2016– Delhi Circle 70
13.2. 3G VOICE PMR: CONSOLIDATED

January to March 2016– Delhi Circle 71
13.3. BILLING AND CUSTOMER CARE
Termination & Closures
Time taken for refund of
deposits after closures:
Benchmark
Postpaid
Subscribers
Prepaid
Subscribers
%age complaints
resolved within
4 weeks
%age
complaints
resolved
within 6 weeks
%age of where
credit/waiver is
received within one
week
% of Termination/
Closure of service
within 7 days (100 %)
Cleared over a period of <60 days
(100%)
%age of calls
answered by
the IVR
%age of call
answered by the
operators ( voice to
voice) within 90
seconds
Benchmark ≤ 0.1% ≤ 0.1% ≥ 98% = 100% = 100% = 100% = 100% ≥ 95% ≥ 95%AIRCEL 0.00% 0.00% 100.00% 100.00% 100.00% 100.00% 100.00% 95.70% 89.71%AIRTEL 0.03% 0.00% 99.94% 100.00% 100.00% 100.00% 100.00% 100.00% 90.06%MTNL 0.09% 0.17% 100.00% 100.00% 100.00% 99.98% 100.00% 98.81% 99.45%IDEA 0.05% 0.03% 100.00% 100.00% 100.00% 100.00% 100.00% 99.72% 96.75%MTS 0.08% 0.01% 100.00% 0.00% 100.00% 100.00% 100.00% 98.99% 120.28%
RCOM-GSM 0.09% 0.01% 100.00% 100.00% 100.00% 100.00% 96.29% 99.27% 79.95%RCOM-CDMA 0.09% 0.09% 100.00% 100.00% 100.00% 100.00% 93.69% 99.73% 70.73%TTSL-CDMA 0.00% 0.00% 100.00% 100.00% 100.00% 100.00% 100.00% 99.06% 97.72%VODAFONE 0.14% 0.02% 100.00% 100.00% 100.00% 100.00% 100.00% 100.00% 97.96%
Name of Service Provider
Metering and Billing
credibilityBilling Complaints
Response time to customer for
assistance

January to March 2016– Delhi Circle 72
13.4. PMR COMPARISON (TSP VS. AUDIT AGENCY): NETWORK PARAMETERS
**For each instance of “DNA (Data Not Available)”, please refer the respective hard copy of audit report(s).
Benchmark AIRCEL AIRTEL IDEA MTNL MTS RCOM-CDMA RCOM-GSM TTSL VODAFONE
Agency 0.14% 0.01% 0.06% 0.12% 0.06% 0.21% 0.06% 0.07% 0.22%
TSP 0.14% 0.14% 0.06% 0.12% 0.07% 0.20% 0.06% 0.07% 0.22%
Agency 0.31% 0.00% 0.00% 0.18% 0.00% 1.58% 0.19% 0.27% 1.36%
TSP 0.31% 0.00% 0.00% 0.18% 0.00% 0.45% 0.19% 0.27% 1.36%
Agency 96.94% 99.09% 99.07% 97.08% 98.94% 96.70% 96.32% 98.97% 99.11%
TSP 96.94% 99.13% 99.07% 97.08% 99.04% 96.83% 97.10% 98.97% 99.10%
Agency 0.33% 0.04% 0.43% 0.59% NA 0.00% 0.49% 0.00% 0.15%TSP 0.33% 0.04% 0.43% 0.59% 0.00% 0.00% 0.39% 0.00% 0.15%
Agency 1.56% 0.02% 0.38% 1.77% 0.19% 0.86% 2.06% 0.26% 0.89%TSP 1.56% 0.02% 0.38% 1.77% 0.11% 0.73% 1.35% 0.26% 0.90%
Agency 0.84% 0.70% 0.65% 1.79% 0.30% 0.45% 0.20% 0.33% 1.07%TSP 0.84% 0.68% 0.65% 1.79% 0.30% 0.45% 0.20% 0.33% 1.07%
Agency 4.18% 1.57% 2.07% 2.53% 1.55% 1.44% 0.47% 1.50% 2.58%TSP 4.18% 1.53% 2.07% 2.53% 1.49% 1.41% 0.56% 1.50% 2.65%
Agency 95.64% 98.88% 98.35% 97.41% 99.18% 99.80% 98.71% 99.12% 98.12%TSP 95.64% 98.88% 98.35% 97.41% 99.18% 99.81% 98.71% 99.12% 98.12%
Network Parameters
Name of Service Provider
PMR Report Comparison between Audit Agency and TSP
Network Availability
Sum of downtime of BTSs in a month
in hrs. in the licensed service area≤ 2%
No. of BTSs having accumulated
downtime of >24 hours in a month≤ 2%
Connection
Establishment
(Accessibility)
Call Set-up Success Rate (Within
Licensee own network≥ 95%
SDDCH/Paging chl. Congestion ≤ 1%
TCH Congestion ≤ 2%
Connection
Maintenance
(Retainability)
Call Drop Rate (%age) ≤ 2%
Worst Affected cell having more than
3% TCH drop≤ 3%
%age of connection with good voice
quality≥ 95%

January to March 2016– Delhi Circle 73
13.4.1. SUM OF DOWNTIME OF BTSS IN A MONTH IN HRS. IN THE LICENSED SERVICE
AIRCEL AIRTEL IDEA MTNL MTSRCOM-CDMA
RCOM-GSM TTSL VODAFONE
PMR Audit 2G Agency(PCPL) 0.14% 0.01% 0.06% 0.12% 0.06% 0.21% 0.06% 0.07% 0.22%
PMR Audit 2G TSP 0.14% 0.01% 0.06% 0.12% 0.07% 0.20% 0.06% 0.07% 0.22%
3 Day Live Audit 2G 0.17% 0.01% 0.08% 0.00% 0.05% 0.20% 0.05% 0.06% 0.17%
Benchmark ≤ 2% 2.00% 2.00% 2.00% 2.00% 2.00% 2.00% 2.00% 2.00% 2.00%
0.1
4%
0.0
1%
0.0
6%
0.1
2%
0.0
6%
0.2
1%
0.0
6%
0.0
7%
0.2
2%
0.1
4%
0.0
1%
0.0
6%
0.1
2%
0.0
7%
0.2
0%
0.0
6%
0.0
7%
0.2
2%
0.1
7%
0.0
1%
0.0
8%
0.0
0%
0.0
5%
0.2
0%
0.0
5%
0.0
6%
0.1
7%
0.00%
0.50%
1.00%
1.50%
2.00%
2.50%
Sum of downtime of BTSs in a month in hrs. in the licensed service area
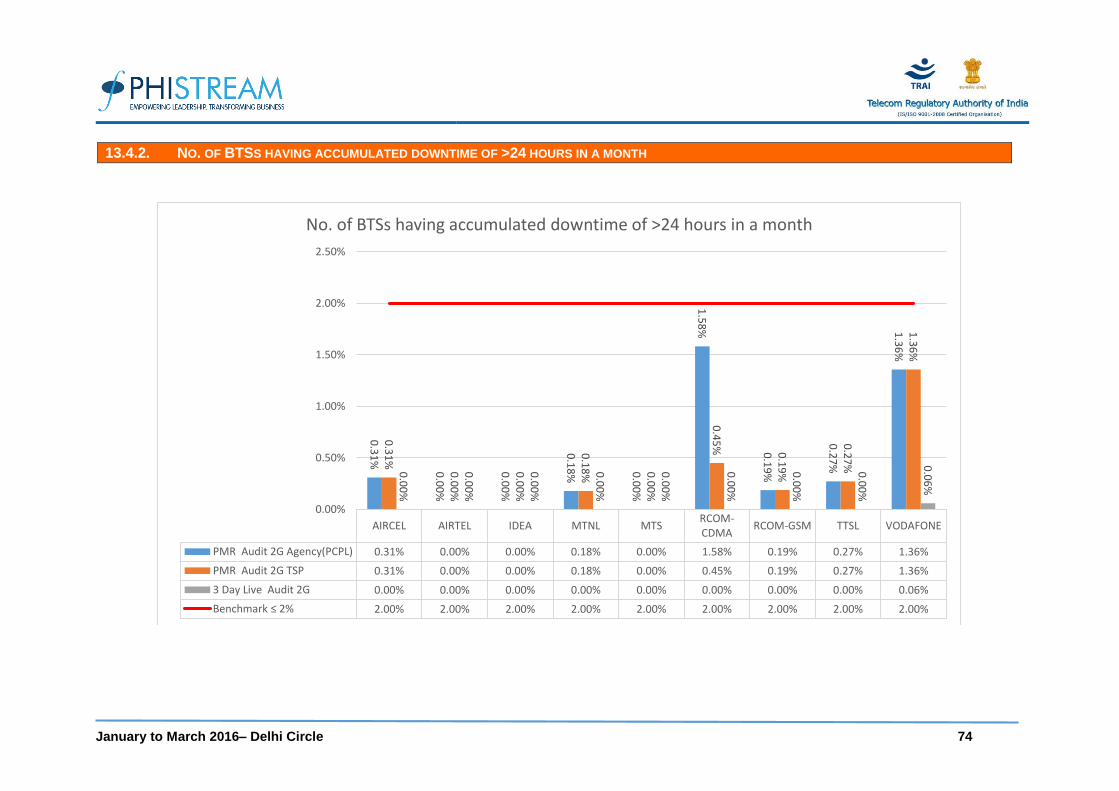
January to March 2016– Delhi Circle 74
13.4.2. NO. OF BTSS HAVING ACCUMULATED DOWNTIME OF >24 HOURS IN A MONTH
AIRCEL AIRTEL IDEA MTNL MTSRCOM-CDMA
RCOM-GSM TTSL VODAFONE
PMR Audit 2G Agency(PCPL) 0.31% 0.00% 0.00% 0.18% 0.00% 1.58% 0.19% 0.27% 1.36%
PMR Audit 2G TSP 0.31% 0.00% 0.00% 0.18% 0.00% 0.45% 0.19% 0.27% 1.36%
3 Day Live Audit 2G 0.00% 0.00% 0.00% 0.00% 0.00% 0.00% 0.00% 0.00% 0.06%
Benchmark ≤ 2% 2.00% 2.00% 2.00% 2.00% 2.00% 2.00% 2.00% 2.00% 2.00%
0.3
1%
0.0
0%
0.0
0%
0.1
8% 0.0
0%
1.5
8%
0.1
9%
0.2
7%
1.3
6%
0.3
1%
0.0
0%
0.0
0%
0.1
8% 0.0
0%
0.4
5% 0
.19
%
0.2
7%
1.3
6%
0.0
0%
0.0
0%
0.0
0%
0.0
0%
0.0
0%
0.0
0%
0.0
0%
0.0
0%
0.0
6%
0.00%
0.50%
1.00%
1.50%
2.00%
2.50%
No. of BTSs having accumulated downtime of >24 hours in a month

January to March 2016– Delhi Circle 75
13.4.3. CALL SET-UP SUCCESS RATE (WITHIN LICENSEE OWN NETWORK)
AIRCEL AIRTEL IDEA MTNL MTSRCOM-CDMA
RCOM-GSM
TTSL VODAFONE
PMR Audit 2G Agency(PCPL) 96.94% 99.09% 99.07% 97.08% 98.94% 96.70% 96.32% 98.97% 99.11%
PMR Audit 2G TSP 96.94% 99.13% 99.07% 97.08% 99.04% 96.83% 97.10% 98.97% 99.10%
3 Day Live Audit 2G 96.90% 99.03% 98.95% 97.11% 98.83% 96.21% 96.87% 98.98% 99.11%
Benchmark ≤ 2% 95.00% 95.00% 95.00% 95.00% 95.00% 95.00% 95.00% 95.00% 95.00%
96
.94
%
99
.09
%
99
.07
%
97
.08
%
98
.94
%
96
.70
%
96
.32
%
98
.97
%
99
.11
%
96
.94
%
99
.13
%
99
.07
%
97
.08
%
99
.04
%
96
.83
%
97
.10
%
98
.97
%
99
.10
%
96
.90
%
99
.03
%
98
.95
%
97
.11
%
98
.83
%
96
.21
%
96
.87
%
98
.98
%
99
.11
%
92.00%
93.00%
94.00%
95.00%
96.00%
97.00%
98.00%
99.00%
100.00%
Call Set-up Success Rate (Within Licensee own network)

January to March 2016– Delhi Circle 76
13.4.4. SDDCH/PAGING CHL. CONGESTION
AIRCEL AIRTEL IDEA MTNL MTSRCOM-CDMA
RCOM-GSM TTSL VODAFONE
PMR Audit 2G Agency(PCPL) 0.33% 0.04% 0.43% 0.59% 0.00% 0.00% 0.49% 0.00% 0.15%
PMR Audit 2G TSP 0.33% 0.04% 0.43% 0.59% 0.00% 0.00% 0.39% 0.00% 0.15%
3 Day Live Audit 2G 0.24% 0.04% 0.38% 0.00% 0.00% 0.00% 0.86% 0.00% 0.14%
Benchmark ≤ 2% 1.00% 1.00% 1.00% 1.00% 1.00% 1.00% 1.00% 1.00% 1.00%
0.3
3%
0.0
4%
0.4
3%
NA
0.0
0%
NA
0.4
9%
NA
0.1
5%
0.3
3%
0.0
4%
0.4
3%
0.5
9%
0.0
0%
0.0
0%
0.3
9%
0.0
0%
0.1
5%
0.2
4%
0.0
4%
0.3
8%
NA
0.0
0%
NA
0.8
6%
NA
0.1
4%
0.00%
0.20%
0.40%
0.60%
0.80%
1.00%
1.20%
SDDCH/Paging chl. Congestion

January to March 2016– Delhi Circle 77
13.4.5. TCH CONGESTION
AIRCEL AIRTEL IDEA MTNL MTSRCOM-CDMA
RCOM-GSM TTSL VODAFONE
PMR Audit 2G Agency(PCPL) 1.56% 0.02% 0.38% 1.77% 0.19% 0.86% 2.06% 0.26% 0.89%
PMR Audit 2G TSP 1.56% 0.02% 0.38% 1.77% 0.11% 0.73% 1.35% 0.26% 0.90%
3 Day Live Audit 2G 1.49% 0.02% 0.49% 1.74% 0.28% 1.10% 2.33% 0.26% 0.89%
Benchmark ≤ 2% 2.00% 2.00% 2.00% 2.00% 2.00% 2.00% 2.00% 2.00% 2.00%
1.5
6%
0.0
2%
0.3
8%
1.7
7%
0.1
9%
0.8
6%
2.0
6%
0.2
6%
0.8
9%
1.5
6%
0.0
2%
0.3
8%
1.7
7%
0.1
1%
0.7
3%
1.3
5%
0.2
6%
0.9
0%
1.4
9%
0.0
2%
0.4
9%
1.7
4%
0.2
8%
1.1
0%
2.3
3%
0.2
6%
0.8
9%
0.00%
0.50%
1.00%
1.50%
2.00%
2.50%
TCH Congestion

January to March 2016– Delhi Circle 78
13.4.6. CALL DROP RATE (%AGE)
AIRCEL AIRTEL IDEA MTNL MTSRCOM-CDMA
RCOM-GSM TTSL VODAFONE
PMR Audit 2G Agency(PCPL) 0.84% 0.70% 0.65% 1.79% 0.30% 0.45% 0.20% 0.33% 1.07%
PMR Audit 2G TSP 0.84% 0.68% 0.65% 1.79% 0.30% 0.45% 0.20% 0.33% 1.07%
3 Day Live Audit 2G 0.88% 0.70% 0.65% 1.77% 0.31% 0.48% 0.23% 0.33% 1.13%
Benchmark ≤ 2% 2.00% 2.00% 2.00% 2.00% 2.00% 2.00% 2.00% 2.00% 2.00%
0.8
4% 0.7
0%
0.6
5%
1.7
9%
0.3
0%
0.4
5%
0.2
0%
0.3
3%
1.0
7%
0.8
4% 0.6
8%
0.6
5%
1.7
9%
0.3
0%
0.4
5%
0.2
0%
0.3
3%
1.0
7%0
.88
% 0.7
0%
0.6
5%
1.7
7%
0.3
1%
0.4
8%
0.2
3%
0.3
3%
1.1
3%
0.00%
0.50%
1.00%
1.50%
2.00%
2.50%
Call Drop Rate (%age)

January to March 2016– Delhi Circle 79
13.4.7. WORST AFFECTED CELL HAVING MORE THAN 3% TCH DROP
AIRCEL AIRTEL IDEA MTNL MTS RCOM-CDMA RCOM-GSM TTSL VODAFONE
PMR Audit 2G Agency(PCPL) 4.18% 1.57% 2.07% 2.53% 1.55% 1.44% 0.47% 1.50% 2.58%
PMR Audit 2G TSP 4.18% 1.53% 2.07% 2.53% 1.49% 1.41% 0.56% 1.50% 2.65%
3 Day Live Audit 2G 4.35% 1.61% 2.10% 2.60% 1.36% 1.28% 0.92% 1.10% 2.59%
Benchmark ≤ 2% 3.00% 3.00% 3.00% 3.00% 3.00% 3.00% 3.00% 3.00% 3.00%
4.1
8%
1.5
7%
2.0
7%
2.5
3%
1.5
5%
1.4
4%
0.4
7%
1.5
0%
2.5
8%
4.1
8%
1.5
3%
2.0
7%
2.5
3%
1.4
9%
1.4
1%
0.5
6%
1.5
0%
2.6
5%
4.3
5%
1.6
1%
2.1
0%
2.6
0%
1.3
6%
1.2
8% 0
.92
%
1.1
0%
2.5
9%
0.00%
0.50%
1.00%
1.50%
2.00%
2.50%
3.00%
3.50%
4.00%
4.50%
5.00%
Worst Affected cell having more than 3% TCH drop

January to March 2016– Delhi Circle 80
13.4.8. %AGE OF CONNECTION WITH GOOD VOICE QUALITY
AIRCEL AIRTEL IDEA MTNL MTSRCOM-CDMA
RCOM-GSM TTSL VODAFONE
PMR Audit 2G Agency(PCPL) 95.64% 98.88% 98.35% 97.41% 99.18% 99.80% 98.71% 99.12% 98.12%
PMR Audit 2G TSP 95.64% 98.88% 98.35% 97.41% 99.18% 99.81% 98.71% 99.12% 98.12%
3 Day Live Audit 2G 95.56% 98.87% 98.38% 97.36% 99.17% 99.78% 98.59% 99.12% 97.81%
Benchmark ≤ 2% 95.00% 95.00% 95.00% 95.00% 95.00% 95.00% 95.00% 95.00% 95.00%
95
.64
%
98
.88
%
98
.35
%
97
.41
%
99
.18
%
99
.80
%
98
.71
%
99
.12
%
98
.12
%
95
.64
%
98
.88
%
98
.35
%
97
.41
%
99
.18
%
99
.81
%
98
.71
%
99
.12
%
98
.12
%
95
.56
%
98
.87
%
98
.38
%
97
.36
%
99
.17
%
99
.78
%
98
.59
%
99
.12
%
97
.81
%
92.00%
93.00%
94.00%
95.00%
96.00%
97.00%
98.00%
99.00%
100.00%
101.00%
%Age of connection with good voice quality

January to March 2016– Delhi Circle 81
13.5. PMR COMPARISON (TSP VS. AUDIT AGENCY): NETWORK PARAMETERS

January to March 2016– Delhi Circle 82
13.5.1. SUM OF DOWNTIME OF BTSS IN A MONTH IN HRS. IN THE LICENSED SERVICE AREA
AIRTEL IDEA MTNL RCOM-GSM VODAFONE
PMR Audit 3G Agency(PCPL) 0.03% 0.13% 0.23% 0.12% 0.26%
PMR Audit 3G TSP 0.03% 0.13% 0.21% 0.14% 0.26%
3 Day Live Audit 3G 0.03% 0.07% 0.23% 0.14% 0.21%
Benchmark ≤ 2% 2.00% 2.00% 2.00% 2.00% 2.00%
0.0
3%
0.1
3%
0.2
3%
0.1
2%
0.2
6%0
.03
%
0.1
3%
0.2
1%
0.1
4%
0.2
6%0
.03
%
0.0
7%
0.2
3%
0.1
4%
0.2
1%
0.00%
0.50%
1.00%
1.50%
2.00%
2.50%
Sum of downtime of BTSs in a month in hrs. in the licensed service area

January to March 2016– Delhi Circle 83
13.5.2. NO. OF BTSS HAVING ACCUMULATED DOWNTIME OF >24 HOURS IN A MONTH
AIRTEL IDEA MTNL RCOM-GSM VODAFONE
PMR Audit 3G Agency(PCPL) 0.00% 0.00% 0.58% 0.54% 1.73%
PMR Audit 3G TSP 0.00% 0.00% 0.63% 0.76% 1.70%
3 Day Live Audit 3G 0.00% 0.00% 0.00% 0.00% 0.05%
Benchmark ≤ 2% 2.00% 2.00% 2.00% 2.00% 2.00%
0.0
0%
0.0
0%
0.5
8%
0.5
4%
1.7
3%
0.0
0%
0.0
0%
0.6
3%
0.7
6%
1.7
0%
0.0
0%
0.0
0%
0.0
0%
0.0
0%
0.0
5%
0.00%
0.50%
1.00%
1.50%
2.00%
2.50%
No. of BTSs having accumulated downtime of >24 hours in a month

January to March 2016– Delhi Circle 84
13.5.3. CALL SET-UP SUCCESS RATE (WITHIN LICENSEE OWN NETWORK)
AIRTEL IDEA MTNL RCOM-GSM VODAFONE
PMR Audit 3G Agency(PCPL) 99.20% 99.86% 97.54% 99.92% 99.61%
PMR Audit 3G TSP 99.20% 99.86% 97.48% 99.92% 99.61%
3 Day Live Audit 3G 99.20% 99.87% 97.41% 99.96% 99.60%
Benchmark ≤ 2% 95.00% 95.00% 95.00% 95.00% 95.00%
99
.20
%
99
.86
%
97
.54
%
99
.92
%
99
.61
%
99
.20
%
99
.86
%
97
.48
%
99
.92
%
99
.61
%
99
.20
%
99
.87
%
97
.41
%
99
.96
%
99
.60
%
92.00%
93.00%
94.00%
95.00%
96.00%
97.00%
98.00%
99.00%
100.00%
Call Set-up Success Rate (Within Licensee own network)

January to March 2016– Delhi Circle 85
13.5.4. RRC CONGESTION
AIRTEL IDEA MTNL RCOM-GSM VODAFONE
PMR Audit 3G Agency(PCPL) 0.08% 0.04% 0.55% 0.03% 0.20%
PMR Audit 3G TSP 0.07% 0.04% 0.57% 0.02% 0.20%
3 Day Live Audit 3G 0.08% 0.01% 0.49% 0.02% 0.19%
Benchmark ≤ 2% 1.00% 1.00% 1.00% 1.00% 1.00%
0.0
8%
0.0
4%
0.5
5%
0.0
3%
0.2
0%
0.0
7%
0.0
4%
0.5
7%
0.0
2%
0.2
0%
0.0
8% 0.0
1%
0.4
9%
0.0
2%
0.1
9%
0.00%
0.20%
0.40%
0.60%
0.80%
1.00%
1.20%
RRC Congestion

January to March 2016– Delhi Circle 86
13.5.5. RAB CONGESTION
AIRTEL IDEA MTNL RCOM-GSM VODAFONE
PMR Audit 3G Agency(PCPL) 0.10% 0.01% 1.52% 0.01% 0.15%
PMR Audit 3G TSP 0.09% 0.01% 1.50% 0.02% 0.15%
3 Day Live Audit 3G 0.10% 0.01% 1.50% 0.02% 0.15%
Benchmark ≤ 2% 2.00% 2.00% 2.00% 2.00% 2.00%
0.1
0%
0.0
1%
1.5
2%
0.0
1%
0.1
5%
0.0
9%
0.0
1%
1.5
0%
0.0
2%
0.1
5%
0.1
0%
0.0
1%
1.5
0%
0.0
2%
0.1
5%
0.00%
0.50%
1.00%
1.50%
2.00%
2.50%
RAB Congestion

January to March 2016– Delhi Circle 87
13.5.6. CIRCUIT SWITCHED VOICE DROP RATE
AIRTEL IDEA MTNL RCOM-GSM VODAFONE
PMR Audit 3G Agency(PCPL) 0.44% 0.29% 1.57% 0.14% 0.59%
PMR Audit 3G TSP 0.44% 0.29% 1.53% 0.14% 0.59%
3 Day Live Audit 3G 0.44% 0.30% 1.53% 0.11% 0.59%
Benchmark ≤ 2% 2.00% 2.00% 2.00% 2.00% 2.00%
0.4
4% 0.2
9%
1.5
7%
0.1
4%
0.5
9%0.4
4% 0.2
9%
1.5
3%
0.1
4%
0.5
9%0.4
4% 0.3
0%
1.5
3%
0.1
1%
0.5
9%
0.00%
0.50%
1.00%
1.50%
2.00%
2.50%
Circuit Switched Voice Drop Rate

January to March 2016– Delhi Circle 88
13.5.7. WORST AFFECTED CELLS HAVING MORE THAN 3% CIRCUIT SWITCHED VOICE DROP RATE
AIRTEL IDEA MTNL RCOM-GSM VODAFONE
PMR Audit 3G Agency(PCPL) 2.33% 2.04% 1.61% 0.56% 2.60%
PMR Audit 3G TSP 2.26% 2.05% 1.63% 0.68% 2.60%
3 Day Live Audit 3G 2.28% 2.27% 1.36% 0.46% 2.53%
Benchmark ≤ 2% 3.00% 3.00% 3.00% 3.00% 3.00%
2.3
3% 2
.04
%
1.6
1%
0.5
6%
2.6
0%2
.26
% 2.0
5%
1.6
3%
0.6
8%
2.6
0%2
.28
%
2.2
7%
1.3
6%
0.4
6%
2.5
3%
0.00%
0.50%
1.00%
1.50%
2.00%
2.50%
3.00%
3.50%
Worst affected cells having more than 3% Circuit Switched Voice Drop Rate

January to March 2016– Delhi Circle 89
13.5.8. PERCENTAGE OF CONNECTIONS WITH GOOD CIRCUIT SWITCHED VOICE QUALITY
AIRTEL IDEA MTNL RCOM-GSM VODAFONE
PMR Audit 3G Agency(PCPL) 98.73% 98.46% 0.00% 99.75% 98.92%
PMR Audit 3G TSP 98.75% 98.46% 64.73% 96.29% 98.92%
3 Day Live Audit 3G 98.73% 98.45% 0.00% 99.76% 98.91%
Benchmark ≤ 2% 95.00% 95.00% 95.00% 95.00% 95.00%
98
.73
%
98
.46
%
0.0
0%
99
.75
%
98
.92
%
98
.75
%
98
.46
%
64
.73
%
96
.29
%
98
.92
%
98
.73
%
98
.45
%
0.0
0%
99
.76
%
98
.91
%
0.00%
10.00%
20.00%
30.00%
40.00%
50.00%
60.00%
70.00%
80.00%
90.00%
100.00%
Percentage of connections with Good Circuit Switched Voice Quality

January to March 2016– Delhi Circle 90
13.6. PMR COMPARISON (TSP VS. AUDIT AGENCY): CSD PARAMETERS

January to March 2016– Delhi Circle 91
13.6.1. METERING AND BILLING CREDIBILITY : POSTPAID

January to March 2016– Delhi Circle 92
13.6.2. METERING AND BILLING CREDIBILITY : PREPAID
AIRCEL AIRTEL IDEA MTNL MTS RCOM-CDMA RCOM-GSM TTSL-CDMA VODAFONE
Agency(PCPL) 0.00% 0.00% 0.17% 0.03% 0.01% 0.01% 0.09% 0.00% 0.02%
TSP 0.00% 0.00% 0.17% 0.02% 0.01% 0.01% 0.09% 0.00% 0.02%
Benchmark ≤ 0.1% 0.10% 0.10% 0.10% 0.10% 0.10% 0.10% 0.10% 0.10% 0.10%
0.0
0%
0.0
0%
0.1
7%
0.0
3%
0.0
1%
0.0
1%
0.0
9%
0.0
0%
0.0
2%0
.00
%
0.0
0%
0.1
7%
0.0
2%
0.0
1%
0.0
1%
0.0
9%
0.0
0%
0.0
2%
0.00%
0.02%
0.04%
0.06%
0.08%
0.10%
0.12%
0.14%
0.16%
0.18%
0.20%
Metering and Billing Credibility : Prepaid

January to March 2016– Delhi Circle 93
13.6.3. PERCENTAGE COMPLAINT RESOLVED WITHIN 4 WEEKS
AIRCEL AIRTEL IDEA MTNL MTS RCOM-CDMA RCOM-GSM TTSL-CDMA VODAFONE
Agency(PCPL) 100% 100% 100% 100% 100% 100% 100% 100% 100%
TSP 100% 100% 100% 100% 100% 100% 100% 100% 100%
Benchmark ≥ 98% 98% 98% 98% 98% 98% 98% 98% 98% 98%
10
0%
10
0%
10
0%
10
0%
10
0%
10
0%
10
0%
10
0%
10
0%
10
0%
10
0%
10
0%
10
0%
10
0%
10
0%
10
0%
10
0%
10
0%
97%
98%
98%
99%
99%
100%
100%
%Age complaints resolved within 4 weeks

January to March 2016– Delhi Circle 94
13.6.4. PERCENTAGE COMPLAINTS RESOLVED WITHIN 6 WEEKS
AIRCEL AIRTEL IDEA MTNL MTSRCOM-CDMA
RCOM-GSM TTSL-CDMA VODAFONE
Agency(PCPL) 100% 100% 100% 100% 100% 100% 100% 100% 100%
TSP 100% 100% 100% 100% 100% 100% 100% 100% 100%
Benchmark = 100% 100% 100% 100% 100% 100% 100% 100% 100% 100%
10
0%
10
0%
10
0%
10
0%
10
0%
10
0%
10
0%
10
0%
10
0%
10
0%
10
0%
10
0%
10
0%
10
0%
10
0%
10
0%
10
0%
10
0%
0%
10%
20%
30%
40%
50%
60%
70%
80%
90%
100%
%Age complaints resolved within 6 weeks
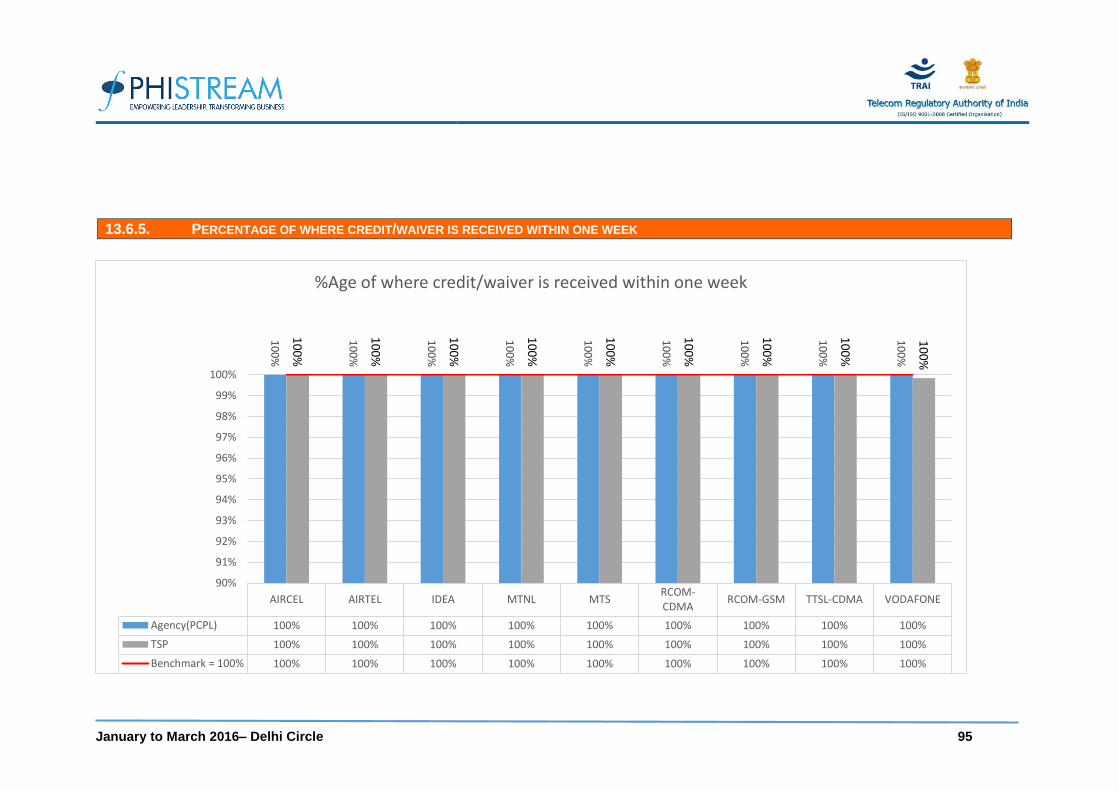
January to March 2016– Delhi Circle 95
13.6.5. PERCENTAGE OF WHERE CREDIT/WAIVER IS RECEIVED WITHIN ONE WEEK
AIRCEL AIRTEL IDEA MTNL MTSRCOM-CDMA
RCOM-GSM TTSL-CDMA VODAFONE
Agency(PCPL) 100% 100% 100% 100% 100% 100% 100% 100% 100%
TSP 100% 100% 100% 100% 100% 100% 100% 100% 100%
Benchmark = 100% 100% 100% 100% 100% 100% 100% 100% 100% 100%
10
0%
10
0%
10
0%
10
0%
10
0%
10
0%
10
0%
10
0%
10
0%
10
0%
10
0%
10
0%
10
0%
10
0%
10
0%
10
0%
10
0%
10
0%
90%
91%
92%
93%
94%
95%
96%
97%
98%
99%
100%
%Age of where credit/waiver is received within one week

January to March 2016– Delhi Circle 96
13.6.6. PERCENTAGE OF CALLS ANSWERED BY THE IVR
AIRCEL AIRTEL IDEA MTNL MTS RCOM-CDMA RCOM-GSM TTSL-CDMA VODAFONE
Agency(PCPL) 95.70% 100.00% 98.81% 99.72% 98.99% 99.27% 99.73% 99.06% 100.00%
TSP 95.70% 100.00% 98.81% 96.92% 98.99% 99.27% 99.73% 99.06% 100.00%
Live Calling 100% 100% 100% 100% 100% 97.00% 97.00% 100% 100%
Benchmark ≥ 95% 95% 95% 95% 95% 95% 95% 95% 95% 95%
95
.70
%
10
0.0
0% 9
8.8
1%
99
.72
% 98
.99
%
99
.27
%
99
.73
%
99
.06
%
10
0.0
0%
95
.70
%
10
0.0
0% 9
8.8
1%
96
.92
%
98
.99
%
99
.27
%
99
.73
%
99
.06
%
10
0.0
0%
10
0%
10
0%
10
0%
10
0%
10
0%
97
.00
%
97
.00
%
10
0%
10
0%
92.00%
93.00%
94.00%
95.00%
96.00%
97.00%
98.00%
99.00%
100.00%
%Age of calls answered by the IVR

January to March 2016– Delhi Circle 97
13.6.7. PERCENTAGE OF CALLS ANSWERED BY THE OPERATORS (VOICE TO VOICE) WITHIN 90 SECONDS
AIRCEL AIRTEL IDEA MTNL MTS RCOM-CDMA RCOM-GSM TTSL-CDMA VODAFONE
Agency(PCPL) 89.71% 90.06% 99.45% 96.75% 95.22% 79.95% 70.73% 97.72% 97.96%
TSP 89.71% 90.06% 99.45% 96.72% 95.18% 79.95% 70.73% 97.72% 97.99%
Live Calling 96.00% 100% 100% 100% 100% 97.00% 97.00% 100% 100%
Benchmark ≥ 95% 95% 95% 95% 95% 95% 95% 95% 95% 95%
89
.71
%
90
.06
%
99
.45
%
96
.75
%
95
.22
% 79
.95
%
70
.73
%
97
.72
%
97
.96
%
89
.71
%
90
.06
%
99
.45
%
96
.72
%
95
.18
% 79
.95
%
70
.73
%
97
.72
%
97
.99
%
96
.00
%
10
0%
10
0%
10
0%
10
0%
97
.00
%
97
.00
%
10
0%
10
0%
0.00%
10.00%
20.00%
30.00%
40.00%
50.00%
60.00%
70.00%
80.00%
90.00%
100.00%
%Age of call answered by the operators ( voice to voice) within 90 seconds

January to March 2016– Delhi Circle 98
13.6.8. PERCENTAGE OF TERMINATION/CLOSURE OF SERVICE WITHIN 7 DAYS
AIRCEL AIRTEL IDEA MTNL MTSRCOM-CDMA
RCOM-GSM TTSL-CDMA VODAFONE
Agency(PCPL) 100% 100% 99.98% 100% 100% 100% 100% 100% 100%
TSP 100% 100% 99.91% 100% 100% 100% 100% 100% 100%
Benchmark = 100% 100% 100% 100% 100% 100% 100% 100% 100% 100%
10
0%
10
0%
99
.98
%
10
0%
10
0%
10
0%
10
0%
10
0%
10
0%
10
0%
10
0%
99
.91
%
10
0%
10
0%
10
0%
10
0%
10
0%
10
0%
80%
82%
84%
86%
88%
90%
92%
94%
96%
98%
100%
%Age of Termination/ Closure of service within 7 days

January to March 2016– Delhi Circle 99
13.6.9. CLEARED OVER A PERIOD OF <60 DAYS
AIRCEL AIRTEL IDEA MTNL MTS RCOM-CDMA RCOM-GSM TTSL-CDMA VODAFONE
Agency(PCPL) 100% 100% 100% 100% 100% 96.29% 93.69% 100% 100%
TSP 100% 100% 100% 100% 100% 96.29% 93.69% 100% 100%
Benchmark = 100% 100% 100% 100% 100% 100% 100% 100% 100% 100%
10
0%
10
0%
10
0%
10
0%
10
0%
96
.29
%
93
.69
%
10
0%
10
0%
10
0%
10
0%
10
0%
10
0%
10
0%
96
.29
%
93
.69
%
10
0%
10
0%
90%
91%
92%
93%
94%
95%
96%
97%
98%
99%
100%
101%
Cleared over a period of <60 days

January to March 2016– Delhi Circle 100
14 KEY FINDINGS
NETWORK FINDINGS:
RCOM GSM has parameter value of 2.05% and failed to meet the benchmark of ≤ 2% TCH Congestion.
AIRCEL has parameter value of 4.17% and failed to meet the benchmark of ≤ 3% Worst Affected cell having more than 3% TCH drop. CUSTOMER SERVICE DELIVERY:
IDEA has parameter value of 0.17% and failed to meet the benchmark of ≤ 0.1% Metering and Billing Credibility (Prepaid Subscribers)
AIRCEL has parameter value of 89.71% and failed to meet the benchmark ≥ 95% Percentage of call answered by the operators (voice to voice) within 90 seconds
AIRTEL has parameter value of 90.06% and failed to meet the benchmark ≥ 95% Percentage of call answered by the operators (voice to voice) within 90 seconds
RCOM CDMA has parameter value of 79.95% and failed to meet the benchmark ≥ 95% Percentage of call answered by the operators (voice to voice) within 90 seconds
RCOM GSM has parameter value of 70.73% and failed to meet the benchmark ≥ 95% Percentage of call answered by the operators (voice to voice) within 90 seconds
RCOM CDMA has parameter value of 96.29% and failed to meet the benchmark = 100% Refund of deposits cleared over a period of <60 days
RCOM GSM has parameter value of 93.69% and failed to meet the benchmark = 100% Refund of deposits cleared over a period of <60 days