audit expectation-performance gap revisited: evidence from new zealand and the united kingdom. part...
TRANSCRIPT

Audit Expectation-Performance GapRevisited: Evidence from NewZealand and the United KingdomPart 2: Changes in the Gap in NewZealand 1989–2008 and in the UnitedKingdom 1999–2008ija_444 1..33
Brenda Porter1, Ciaran Ó hÓgartaigh2 andRachel Baskerville3
1Exeter University, UK and Chulalongkorn University, Thailand2University College Dublin, Ireland3Victoria University, New Zealand
Investigation of changes in the audit expectation-performancegap in New Zealand (NZ) and the United Kingdom (UK)revealed that, between 1989 and 1999, in both countriesthe reasonableness gap widened as developments inauditing’s external environment stimulated an increase insociety’s unreasonable expectations of auditors but thedeficient performance gap narrowed as monitoring of auditors’performance resulted in societal perception of improvedperformance. Between 1999 and 2008, in the UK, widespreaddiscussion of the environmental developments and relatedaudit issues, along with more stringent monitoring of auditors’performance, resulted in a narrowing of the reasonableness anddeficient performance gaps. In NZ, lacking these factors, thesegaps widened. Additionally, changes to auditing standardsresulted in some ‘reasonably expected’ responsibilitiesbecoming actual responsibilities of auditors and, in bothcountries, the deficient standards gap narrowed. The researchfindings illuminate the means by which the audit expectation-performance gap might be narrowed.
Key words: Audit expectation-performance gap, reasonablenessgap, deficient standards, deficient performance, society’sexpectations, monitoring auditors
Correspondence to: Professor Brenda Porter, Visiting Professor, School of Business and Economics, Exeter University, UK. Email:[email protected]
International Journal of Auditing doi:10.1111/j.1099-1123.2011.00444.xInt. J. Audit. ••: ••–•• (2012)
ISSN 1090-6738© 2012 Blackwell Publishing Ltd

SUMMARY
For at least three decades, auditors have beenseverely criticised as a result of failing to meetsociety’s expectations of them – as a result of theaudit expectation-performance gap. Followingstudies in New Zealand (NZ) in 1989 and in NZand the United Kingdom (UK) in 1999, researchwas undertaken to investigate the composition,structure and extent of this gap in NZ and the UKin 2008 and changes thereto between 1989 and2008. This paper reports the second part of thisresearch.
In 1989 no survey like that conducted in NZwas undertaken in the UK but the findings ofHumphrey et al.’s (1993) study indicate that thegap in the UK in 1990 was similar to that in NZ in1989. Between 1989 and 1999 developments inauditing’s external environment were primarilyresponsible for a dramatic increase in society’s(unreasonable) expectations of auditors and, hence,for a marked widening of the reasonableness gap.Additionally, the introduction of monitoringauditors’ performance (in 1990 in NZ and 1991 inthe UK) resulted in NZ and UK society perceivingimproved performance by auditors – and anarrowing of the deficient performance gap. In1999, the composition, structure and extent of theaudit expectation-performance gap in NZ and theUK were very similar.
Between 1999 and 2008, in the UK thereasonableness gap narrowed significantly assome of the responsibilities unreasonablyexpected of auditors were discarded from‘society’s expectations of auditors’ and otherswere adjudged as reasonable to expect ofauditors. It is conjectured that these changesresulted from widespread public discussion of thedevelopments in auditing’s external environment.In NZ, where the issues attracted little publicdebate, the reasonableness gap widened. Changesto auditing standards between 1999 and 2008resulted in some ‘reasonably expected’responsibilities becoming actual responsibilitiesof auditors – and a narrowing of the deficientstandards gap in both countries. Further, whilemonitoring of auditors’ performance continuedalmost unchanged in NZ, its stringency wasincreased in the UK; as a consequence, thedeficient performance gap narrowed markedly inthe UK but widened in NZ. Given these changesin the gap’s components in the UK and NZbetween 1999 and 2008, it is not surprising that, in
2008, the audit expectation-performance gap wassignificantly wider in NZ than in the UK.
The research findings indicate that the auditexpectation-performance gap could be narrowedby adopting a tripartite approach: (i) ensuring thatnew issues in the audit arena are widelydiscussed, and society becomes aware of what is,and is not, feasible for auditors to accomplish;(ii) encapsulating in auditing standards theresponsibilities society expects of auditors whichare cost-beneficial for auditors to perform; and(iii) ensuring auditing standards specify what isrequired of auditors in fulfilment of theirresponsibilities and monitoring their performanceto ensure the requirements are met. Suchmeasures should align auditors’ performance withsociety’s expectations of them, thereby reducingsocietal criticism and loss of confidence in theirwork.
1. INTRODUCTION
During the past 100 or so years, criticism of externalauditors and loss of confidence in their work havebeen fuelled by the unexpected demise of majorcompanies shortly after receiving an unqualifiedaudit report and by well-publicised cases ofcorporate fraud of which the auditors gave nowarning (Carty, 1985; Russell, 1986; Chandler &Edwards, 1996; Porter, 2009). The criticism andloss of confidence in auditors results from theirfailure to fulfil the responsibilities expected ofthem by society1 – that is, from the auditexpectation-performance gap.2
As explained in Part 1 of this paper (see previousissue of International Journal of Auditing), the auditexpectation gap has been the subject of numerousstudies over an extended period. Most of the studiessought to ascertain whether an audit expectationgap exists in the country where the research wasconducted and to identify its contributing factors.They all found that financial statement users (and, insome cases, a broad range of interest groups) havelittle understanding of the role and responsibilitiesof external auditors and, in general, expect far moreof auditors than it is feasible for them to provide.Further, comparing the results of earlier and laterstudies (for example, those of Lee, 1970; Humphreyet al., 1993; and Porter & Gowthorpe, 2004, all ofwhich were conducted in the UK) reveals thatinterest groups’ understanding has not improvedover time but their expectations of auditors have
2 B. Porter et al.
Int. J. Audit. ••: ••–•• (2012)© 2012 Blackwell Publishing Ltd

increased markedly as changes have occurred in thecorporate arena.3
Adopting a different approach from otherstudies, Porter (1993) and Porter and Gowthorpe(2004) investigated the structure, composition andextent of the audit expectation-performance gapin NZ in 1989 and in NZ and the UK in 1999,respectively. In 2008, a further study was conductedin NZ and the UK to (i) ascertain and explaindifferences in the structure, composition and extentof the audit expectation-performance gap in thetwo countries in 2008 and (ii) identify and explainchanges in the gap in NZ between 1989 and 2008and in the UK between 1999 and 2008.
The results of the first component of the researchwere reported in Part 1 of this paper. This partreports the findings of the second portion. In thenext section, the methodology adopted for theresearch is outlined. This is followed, in Section 3,by a discussion of changes in the contributionand composition of the reasonableness, deficientstandards and deficient performance componentsof the audit expectation-performance gap in NZbetween 1989 and 2008 and in the UK between 1999and 2008. In Section 4 changes in the extent of thegap in the two countries over the relevant periodsare reviewed and, in Section 5, conclusions fromthe research are presented.
2. RESEARCH METHODOLOGY
As reported in Part 1 of this paper, the researchundertaken in 2008 replicated the studiesconducted in NZ in 1989 (Porter, 1993) and in NZand the UK in 1999 (Porter & Gowthorpe, 2004).Each involved a mail survey of participantsrandomly selected from four broad interest groups– auditors, auditees and audit beneficiaries fromboth the financial and non-financial community.
Essentially the same research instrument wasused for all three surveys but the number ofsuggested responsibilities of auditors listed in thequestionnaire increased between 1989 and 2008,particularly between 1989 and 1999. As shown inAppendix 1, in 1989 the questionnaire included 30suggested responsibilities of auditors; in 1999 thiswas increased to 514 – an increase which reflectsthe marked expansion of audit-related issuesover the decade. Eight of the 21 additionalresponsibilities resulted from specifyingsuggested responsibilities in greater detail. Theserelate to issues which gained in significancebetween 1989 and 1999 – for example, detecting
and reporting the theft of auditees’ assets, andexamining and reporting on the effectiveness oftheir internal controls and on the reliability ofdisclosures in their annual reports. The other 13additional suggested responsibilities5 reflectissues with audit implications which rose toprominence between 1989 and 1999. Theserelate, for example, to corporate governancerequirements, companies’ risk managementprocedures, information technology andcompanies’ environmental impact.
In 2008, the survey instrument included 55suggested responsibilities – 49 of the 51 included inthe 1999 questionnaire6 and a further six. Four ofthe additional responsibilities resulted fromspecifying suggested responsibilities in greaterdetail. These relate to companies’ environmentalimpact, risk assessment procedures and reportingon the Internet – issues whose significanceincreased markedly between 1999 and 2008.The other two additional responsibilitiesconcern auditors reporting significant difficultiesencountered during the audit to the client’sdirectors (or audit committee) and/or in the auditreport – an issue which became important in theauditing arena between 1999 and 2008. InAppendix 1, suggested responsibilities resultingfrom specifying responsibilities in greater detail areindicated by the symbol **; those arising from‘new’ issues are signified by the symbol †††.
For each survey (1989, 1999 and 2008), thequestionnaire was pilot-tested with selectedmembers of the interest groups in NZ and the UKand non-responses were followed up twice atmonthly intervals. In each case, the responses weretested for non-response bias but no significantdifference in the responses received from the initialand two subsequent mailings was detected. Despiteusing the same research methodology for eachsurvey, as shown in Figure 1, the usable responserates declined markedly between 1989 and 2008.
3. CHANGES IN THE STRUCTURE ANDCOMPOSITION OF THE AUDITEXPECTATION-PERFORMANCEGAP IN NZ 1989–2008 AND THEUK 1999–2008
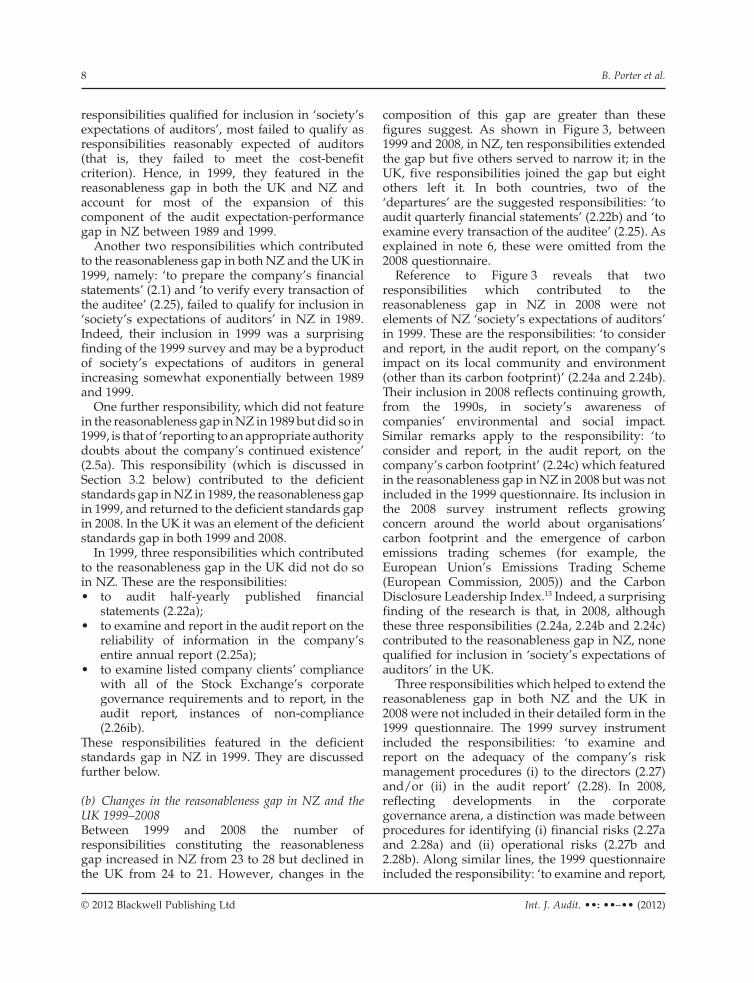
Figure 2 summarises the changes in the auditexpectation-performance gap in NZ between 1989and 2008 and in the UK between 1999 and 2008.Details of the structure of the gap and thecomposition of its components – the
Audit Expectation-Performance Gap Revisited 3
Int. J. Audit. ••: ••–•• (2012)© 2012 Blackwell Publishing Ltd

reasonableness, deficient standards and deficientperformance gaps – are presented for NZ inFigures 6, 7 and 8 for 1989, 1999 and 2008,respectively, and for the UK for 1999 and 2008 inFigures 9 and 10. (For ease of reference, Figures6–10 are located at the end of this paper.)
3.1 Changes in the reasonableness gap in NZ1989–2008 and the UK 1999–2008
3.1.1 Changes in the contribution andcomposition of the reasonableness gap
The reasonableness gap comprises responsibilitiessociety expects auditors to perform but it is notcost-effective for them to do so.7 As shown inFigure 2, in NZ between 1989 and 1999 thecontribution of the reasonableness gap to the auditexpectation-performance gap rose sharply – from31 to 43 per cent, and the number of responsibilitiesconstituting this gap jumped from nine to 23.Between 1999 and 2008 the contribution of this gapincreased further – from 43 to 50 per cent and itsconstituent responsibilities increased from 23 to 28.In the UK between 1999 and 2008, the contributionof the reasonableness gap to the audit expectationgap rose from 52 to 55 per cent but the number ofits constituent responsibilities fell from 24 to 21.
(a) Composition of the reasonableness gap in NZ in1989 and in NZ and the UK in 1999Reference to Figures 6, 7 and 9 reveals that all ninesuggested responsibilities which constituted thereasonableness gap in NZ in 1989 contributed tothis gap in both NZ and the UK in 1999. These nineresponsibilities are:• to guarantee that (i) the company’s financial
statements are accurate and (ii) a company witha ‘clean’ audit report is financially sound (2.2and 2.4);8
• to disclose in the audit report, or to a regulatoryauthority, minor theft of company assets bynon-managerial employees detected during theaudit (2.11a and 2.12a9);
• to detect, and to report in the audit report,illegal acts by the company’s directors/seniormanagers which only indirectly impact on thefinancial statements (2.14b and 2.15b);
• to examine and report, in the audit report, on(i) the reliability of non-financial informationprovided in the company’s annual report and(ii) the efficiency and effectiveness of thecompany’s management and administration(2.1710 and 2.21);
• to report breaches of tax law discovered duringthe audit to the Inland Revenue (2.7).
Reviewing these responsibilities, the failure ofmost to qualify as responsibilities that arecost-effective for auditors to perform – and, hence,not reasonably expected of auditors – may bereadily explained. Most are either not feasible forauditors to perform (for example, responsibilities2.2 and 2.4; see above) or are remote from the focusof auditors’ work (for example, responsibilities2.14b, 2.15b and 2.21). It seems likely that theadditional costs of auditors performing theseresponsibilities (those that are feasible) wouldoutweigh the benefits derived by financialstatement users and other parties interested in theentity from them doing so.11
As shown in Figure 3, 15 responsibilities servedto extend the reasonableness gap in NZ between1989 and 1999; of these, 12 were not included in the1989 questionnaire. Eleven of the 12 also featuredin the reasonableness gap in the UK in 1999. Theseare the responsibilities:• to detect minor theft of company assets by (i)
non-managerial employees and (ii) thedirectors/senior managers (2.9a and 2.9b);
• to report to an appropriate authority materialtheft of company assets by non-managerialemployees detected during the audit (2.11b);
• to examine and report, in the audit report, on(i) the company’s policy and record in respectof equal employment opportunities, productsafety, and occupational health and safety, (ii) itsIT systems, (iii) the effectiveness of its internal
dnalaeZweNmodgniKdetinUraeY
No. of surveyparticipants
No. of usableresponses
Usable responserate
No. of surveyparticipants
No. of usableresponses
Usable responserate
1989 – – – 1,727 1,184 69%1999 1,610 425 26% 1,534 499 33%2008 1,610 219 14% 1,555 450 29%
Figure 1: Survey participants and usable response rates, 1989–2008.
4 B. Porter et al.
Int. J. Audit. ••: ••–•• (2012)© 2012 Blackwell Publishing Ltd

dnal aeZ
w eN
m odgniK
de tinU
r aeY
Con
trib
utio
nof
com
pone
nts
toth
eau
dit
expe
ctat
ion-
perf
orm
ance
gap
Con
trib
utio
nof
com
pone
nts
toth
eau
dit
expe
ctat
ion-
perf
orm
ance
gap
Def
icie
ntpe
rfor
man
cega
pD
efic
ient
stan
dard
sga
pR
easo
nabl
enes
sga
pD
efic
ient
perf
orm
ance
gap
Def
icie
ntst
anda
rds
gap
Rea
sona
blen
ess
gap
1989
c–
––
11%
58%
31%
1999
d9%
39%
52%
6%51
%43
%20
08e
4%41
%55
%7%
43%
50%
s eitili bisn opsertn eutit sn oc
fo. oN
s eit ilibis nopsert ne uti ts n oc
fo.oN
Def
icie
ntpe
rfor
man
cega
pD
efic
ient
stan
dard
sga
pR
easo
nabl
enes
sga
pD
efic
ient
perf
orm
ance
gap
Def
icie
ntst
anda
rds
gap
Rea
sona
blen
ess
gap
1989
c9
015
––
–19
99d
89
245
1423
2008
e6
921
711
28
Mea
sure
ofun
fulf
ille
dex
pect
atio
nsa
Mea
sure
ofun
fulf
ille
dex
pect
atio
nsa
Def
icie
ntpe
rfor
man
cega
pD
efic
ient
stan
dard
sga
pR
easo
nabl
enes
sga
pD
efic
ient
perf
orm
ance
gap
Def
icie
ntst
anda
rds
gap
Rea
sona
blen
ess
gap
1989
c–
––
125
unit
s66
7un
its
348
unit
s19
99d
144
unit
s59
1un
its
804
unit
s94
unit
s83
2un
its
713
unit
s20
08e
41un
its
415
unit
s55
7un
its
116
unit
s72
5un
its
834
unit
s
Tot
alex
tent
ofau
dit
expe
ctat
ion
gapb
Tot
alex
tent
ofau
dit
expe
ctat
ion
gapb
1989
cstinu
041, 1–
1999
dstin u
936 ,1s tinu
935,120
08e
stin u57 6,1
stinu31 0, 1
aD
eter
min
edby
tota
lling
the
prop
orti
onof
the
soci
ety
grou
pw
hoin
dic
ated
,for
each
resp
onsi
bilit
yco
nsti
tuti
ngth
ega
p,th
atth
eyex
pect
aud
itor
sto
perf
orm
the
resp
onsi
bilit
y(f
orth
ed
efic
ient
stan
dard
san
dre
ason
able
ness
gaps
)ort
hey
perc
eive
aud
itor
spe
rfor
mth
ere
spon
sibi
lity
poor
ly(f
orth
ed
efic
ient
perf
orm
ance
gap)
.b
Det
erm
ined
byto
talli
ngth
em
easu
res
ofun
fulf
illed
expe
ctat
ions
atta
chin
gto
each
ofth
eth
ree
cons
titu
ent
gaps
.c
In19
89,3
0re
spon
sibi
litie
sw
ere
incl
uded
inth
eN
Zqu
esti
onna
ire.
dIn
1999
,51
resp
onsi
bilit
ies
wer
ein
clud
edin
the
UK
,and
49in
the
NZ
,que
stio
nnai
re.
eIn
2008
,55
resp
onsi
bilit
ies
wer
ein
clud
edin
the
UK
,and
53in
the
NZ
,que
stio
nnai
re.
Figu
re2:
Cha
nges
inth
eau
dit
expe
ctat
ion-
perf
orm
ance
gap
inth
eU
K19
99–2
008
and
inN
Z19
89–2
008.
Audit Expectation-Performance Gap Revisited 5
Int. J. Audit. ••: ••–•• (2012)© 2012 Blackwell Publishing Ltd

Per
iod
ofch
ange
modgniK
de ti nU
dn ala eZ
weN
Ext
ende
dth
ega
pN
arro
wed
the
gap
Ext
ende
dth
ega
pN
arro
wed
the
gap
Res
paSo
urce
Res
paD
esti
nati
onR
espa
Sour
ceR
espa
Des
tina
tion
1989
–199
92.
1*So
ciet
y’s
expe
ctat
ions
2.5a
Def
icie
ntst
anda
rds
gap
2.9a
*N
ewre
spon
sibi
lity
2.9b
*N
ewre
spon
sibi
lity
2.11
a*N
ewre
spon
sibi
lity
2.17
a*N
ewre
spon
sibi
lity
2.17
Rep
lace
d2.
17b*
New
resp
onsi
bilit
y2.
17c*
New
resp
onsi
bilit
y2.
18b*
New
resp
onsi
bilit
y2.
19*
New
resp
onsi
bilit
y2.
20N
ewre
spon
sibi
lity
2.22
b*N
ewre
spon
sibi
lity
2.25
*So
ciet
y’s
expe
ctat
ions
2.28
*N
ewre
spon
sibi
lity
2.29
*N
ewre
spon
sibi
lity
s’yt eicosni
t oN
a71 .2pag
sd radna ts
tnei cifeD
a5 .2s
dr adnatstn eicif e
Da22 .2
8002–9991ex
pect
atio
nss’y tei co s
nito
Nb71. 2
s noi tatce px es’yt eicoS
a42 .2ex
pect
atio
nss’y tei co s
nito
Nc71. 2
snoi ta tcepx es’yt eicoS
b42 .2ex
pect
atio
ns2.
24c
New
resp
onsi
bilit
y2.
22b
Om
itte
din
2008
2.20
Soci
ety’
sex
pect
atio
ns2.
22b
Om
itte
din
2008
2.26
bSu
bsum
edin
1999
2.25
Om
itte
din
2008
2.26
iaD
efic
ient
stan
dard
sga
p2.
25O
mit
ted
in20
08pag
sd rad nat s
tn e icif eD
a52.2ytili bisnop ser
w eN
b72 .2yt ilibisnopse r
weN
b7 2.2 2.28
aN
ewre
spon
sibi
lity
2.28
Rep
lace
dby
2.28
a&
bb
&a82. 2
ybd ecal pe
R82.2
ytili bisn op serw e
Nb82 .2
yt i libisnopserwe
Nb82.2 2.
29b
New
resp
onsi
bilit
y2.
29R
epla
ced
by2.
29a
&b
2.29
bN
ewre
spon
sibi
lity
2.29
Rep
lace
dby
2.29
a&
b2.
30b
New
resp
onsi
bilit
y
aTh
eke
yto
the
resp
onsi
bilit
ies
iden
tifi
edby
num
ber
ispr
ovid
edin
App
end
ix1.
*R
espo
nsib
iliti
esal
soco
ntri
buti
ngto
the
reas
onab
lene
ssga
pin
the
UK
in19
99.
Figu
re3:
Cha
nges
inth
ere
spon
sibi
liti
esco
ntri
buti
ngto
the
reas
onab
lene
ssga
pin
NZ
1989
–200
8an
dth
eU
K19
99–2
008.
6 B. Porter et al.
Int. J. Audit. ••: ••–•• (2012)© 2012 Blackwell Publishing Ltd

non-financial controls and (iv) the adequacy ofits risk management procedures (2.17a, 2.17b,2.17c, 2.19, 2.18b and 2.28);
• to audit quarterly published financialstatements (2.22b);
• to examine and report, in an attached auditreport, on the reliability of financial informationprovided by the company on the Internet (2.29).
The twelfth responsibility not included in the1989 questionnaire which contributed to thereasonableness gap in NZ in 1999, namely: ‘toexamine and report, in the audit report, on theauditee’s non-financial performance’ (2.20) failed toqualify as an element of society’s expectations ofauditors in the UK.12
These 12 ‘additional responsibilities’ reflectsignificant developments in auditing’s externalenvironment between 1989 and 1999. Probably themost influential, in terms of its impact on society’sexpectations of auditors, is the development ofcorporate governance requirements. These resulted,primarily, from three inter-related factors, namely:
(i) reports (particularly from the USA) ofwidespread fraudulent financial reporting(for example, the Treadway Commission’sReport of the National Commission onFraudulent Financial Reporting (NCFFR,1987));
(ii) the unexpected failure, during the 1980s, ofmajor companies in many countries in thewestern world, including the UK and NZ,which culminated in the October 1987 StockMarket Crash;
(iii) evidence of fraud, other illegal acts,negligence and/or recklessness by directorsand/or senior executives which came to lightduring regulatory investigations of some ofthe failed companies.
These developments resulted in calls bypoliticians, the media and society in general (in theUK and NZ, as elsewhere) for greater corporateaccountability and responsible corporategovernance – and for external auditors to play amore active role in combating corporate ills (Porter,1997, 2009). Responding to these calls in the UK,in 1991 the Financial Reporting Council (FRC),the London Stock Exchange and the Institute ofChartered Accountants in England and Wales(ICAEW) established the Committee on theFinancial Aspects of Corporate Governance(CFACG; Cadbury Committee). In its report, theCadbury Committee highlighted the importance ofexternal auditors, audit committees and internal
controls as key elements in securing responsiblecorporate governance (CFACG, 1992). By 1999,further reports had been published in the UK (forexample, those of the Study Group on Directors’Remuneration (1995) and the Committee onCorporate Governance (1998a)), and similar reportshad been issued in many other countries in thewestern world. Further, in many countries someform of Code of Corporate Governance had alsobeen promulgated (for example, The Combined Code(Committee on Corporate Governance, 1998b) inthe UK) and many Stock Exchanges required listedcompanies to comply with the Code and to reportin their annual reports that they had done so (or, asin the UK, to report on their compliance with theCode or explain their non-compliance).
Another notable development in auditing’sexternal arena between 1989 and 1999 wasincreasing societal awareness, particularly withinwestern societies, of the environmental and socialimpact of major companies and growing demandfor companies to act as good corporate citizens. Thiswas accompanied by the media, politicians andother interested parties urging companies to reporton their environmental and social performance.Increasingly since the early 1990s, major companiesaround the globe have provided such information intheir annual, or in stand-alone, reports and asignificant number have also had such informationindependently assured (Porter et al., 2008).
Three further important changes in the auditenvironment between 1989 and 1999 are theemergence of the Internet as an efficient andeffective means of communication, increasedrecognition of the importance of non-financialmeasures for evaluating company performance (see,for example, Eccles et al., 2001), and significantgrowth in the quantity and range of informationprovided in companies’ annual reports.
Accompanying the developments outlinedabove was a marked increase in society’sexpectations of auditors – an expectation that theywould perform responsibilities in respect of, forexample, detecting and reporting corporate fraud,and ensuring their clients meet their corporategovernance obligations and provide reliablefinancial information on the Internet, and reliablenon-financial (as well as financial) information intheir annual reports. Most of the additionalsuggested responsibilities included in the 1999questionnaire reflect these developments.However, in 1999, these issues remained relativelynew and, although virtually all of the additional
Audit Expectation-Performance Gap Revisited 7
Int. J. Audit. ••: ••–•• (2012)© 2012 Blackwell Publishing Ltd
responsibilities qualified for inclusion in ‘society’sexpectations of auditors’, most failed to qualify asresponsibilities reasonably expected of auditors(that is, they failed to meet the cost-benefitcriterion). Hence, in 1999, they featured in thereasonableness gap in both the UK and NZ andaccount for most of the expansion of thiscomponent of the audit expectation-performancegap in NZ between 1989 and 1999.
Another two responsibilities which contributedto the reasonableness gap in both NZ and the UK in1999, namely: ‘to prepare the company’s financialstatements’ (2.1) and ‘to verify every transaction ofthe auditee’ (2.25), failed to qualify for inclusion in‘society’s expectations of auditors’ in NZ in 1989.Indeed, their inclusion in 1999 was a surprisingfinding of the 1999 survey and may be a byproductof society’s expectations of auditors in generalincreasing somewhat exponentially between 1989and 1999.
One further responsibility, which did not featurein the reasonableness gap in NZ in 1989 but did so in1999, is that of ‘reporting to an appropriate authoritydoubts about the company’s continued existence’(2.5a). This responsibility (which is discussed inSection 3.2 below) contributed to the deficientstandards gap in NZ in 1989, the reasonableness gapin 1999, and returned to the deficient standards gapin 2008. In the UK it was an element of the deficientstandards gap in both 1999 and 2008.
In 1999, three responsibilities which contributedto the reasonableness gap in the UK did not do soin NZ. These are the responsibilities:• to audit half-yearly published financial
statements (2.22a);• to examine and report in the audit report on the
reliability of information in the company’sentire annual report (2.25a);
• to examine listed company clients’ compliancewith all of the Stock Exchange’s corporategovernance requirements and to report, in theaudit report, instances of non-compliance(2.26ib).
These responsibilities featured in the deficientstandards gap in NZ in 1999. They are discussedfurther below.
(b) Changes in the reasonableness gap in NZ and theUK 1999–2008Between 1999 and 2008 the number ofresponsibilities constituting the reasonablenessgap increased in NZ from 23 to 28 but declined inthe UK from 24 to 21. However, changes in the
composition of this gap are greater than thesefigures suggest. As shown in Figure 3, between1999 and 2008, in NZ, ten responsibilities extendedthe gap but five others served to narrow it; in theUK, five responsibilities joined the gap but eightothers left it. In both countries, two of the‘departures’ are the suggested responsibilities: ‘toaudit quarterly financial statements’ (2.22b) and ‘toexamine every transaction of the auditee’ (2.25). Asexplained in note 6, these were omitted from the2008 questionnaire.
Reference to Figure 3 reveals that tworesponsibilities which contributed to thereasonableness gap in NZ in 2008 were notelements of NZ ‘society’s expectations of auditors’in 1999. These are the responsibilities: ‘to considerand report, in the audit report, on the company’simpact on its local community and environment(other than its carbon footprint)’ (2.24a and 2.24b).Their inclusion in 2008 reflects continuing growth,from the 1990s, in society’s awareness ofcompanies’ environmental and social impact.Similar remarks apply to the responsibility: ‘toconsider and report, in the audit report, on thecompany’s carbon footprint’ (2.24c) which featuredin the reasonableness gap in NZ in 2008 but was notincluded in the 1999 questionnaire. Its inclusion inthe 2008 survey instrument reflects growingconcern around the world about organisations’carbon footprint and the emergence of carbonemissions trading schemes (for example, theEuropean Union’s Emissions Trading Scheme(European Commission, 2005)) and the CarbonDisclosure Leadership Index.13 Indeed, a surprisingfinding of the research is that, in 2008, althoughthese three responsibilities (2.24a, 2.24b and 2.24c)contributed to the reasonableness gap in NZ, nonequalified for inclusion in ‘society’s expectations ofauditors’ in the UK.
Three responsibilities which helped to extend thereasonableness gap in both NZ and the UK in2008 were not included in their detailed form in the1999 questionnaire. The 1999 survey instrumentincluded the responsibilities: ‘to examine andreport on the adequacy of the company’s riskmanagement procedures (i) to the directors (2.27)and/or (ii) in the audit report’ (2.28). In 2008,reflecting developments in the corporategovernance arena, a distinction was made betweenprocedures for identifying (i) financial risks (2.27aand 2.28a) and (ii) operational risks (2.27b and2.28b). Along similar lines, the 1999 questionnaireincluded the responsibility: ‘to examine and report,
8 B. Porter et al.
Int. J. Audit. ••: ••–•• (2012)© 2012 Blackwell Publishing Ltd

in an attached audit report, on the reliability offinancial information provided by the company onthe Internet’ (2.29). In 2008, as a result of majorgrowth in the financial information provided bycompanies on the Internet, a distinction was madebetween financial information on the Internet (i) incompanies’ audited financial statements (2.29a) and(ii) other than in their audited financial statements(2.29b).
In 1999, in both NZ and the UK, responsibility2.27 featured in the deficient standards gap butresponsibilities 2.28 and 2.29 contributed to thereasonableness gap. In 2008, responsibilities2.27b, 2.28b and 2.29b were elements of thereasonableness gap in both countries; likewise,responsibility 2.28a in NZ.14 The presence ofresponsibilities 2.27b, 2.28b and 2.29b in thereasonableness gap suggests that, in 2008, althoughsignificant developments had occurred in thecorporate governance and Internet domains, NZand UK society considered that reporting oncompanies’ procedures for identifyingnon-financial risks and on the reliability offinancial information they provide on the Internetother than in their audited financial statements,are too remote from the focus of auditors’ workto be responsibilities that are reasonable to expectof auditors. The failure of responsibility 2.28a(reporting, in the audit report, on companies’procedures for identifying financial risks) toqualify as a responsibility reasonably expected ofauditors in NZ in 2008 while doing so in the UK,may result from differences in the developmentof corporate governance requirements in thetwo countries. While listed companies in the UKhad been expected to comply with corporategovernance requirements since publication of theCadbury Report in 1992 (CFACG, 1992), the NZStock Exchange (NZX) did not publish a Code ofCorporate Governance until 2003 (NZX, 2003) andthe NZ Securities Commission (NZSC) did notpublish Corporate Governance Guidelines until2004 (NZSC, 2004).
Another responsibility which contributed to thereasonableness gap in NZ in 2008, but was absentfrom the 1999 questionnaire, concerns auditorsreporting difficulties encountered during the auditin the audit report (2.30b). This, like its complement(reporting difficulties encountered during the auditto the directors (2.30a) – an actual responsibility ofauditors in NZ and the UK in 2008) reflects an issuewhich came to the fore between 1999 and 2008.However, in NZ, possibly as a result of the country’s
small population and well developed grapevine, itattracted less societal discussion than in the UKwhere it was highlighted by groups such as theAudit Quality Forum’s (AQF) Working Group onAuditor Reporting (AQF, 2007). As a consequence,in 2008, responsibility 2.30b contributed to thereasonableness gap in NZ but was an element of thedeficient standards gap in the UK.
The remaining two responsibilities whichcontributed to the reasonableness gap in NZ in 2008,but did not do so in 1999, involve auditors auditinghalf-yearly published financial statements (2.22a)and examining listed company clients’ compliancewith all of the Stock Exchange’s corporategovernance requirements and reporting, in theaudit report, instances of non-compliance (2.26b). InNZ, in both 1989 and 1999, responsibility 2.22acontributed to the deficient standards gap. Itsrecognition in these years as a responsibilityreasonably expected of auditors probably resultsfrom the increasing number of companies which,from the mid-1980s, published half-yearly financialstatements, together with widespread publicconcern about the prevalence of fraudulent financialreporting. The latter was highlighted in theTreadway Report (NCFFR, 1987) and emphasisedthroughout the 1990s by, for instance, officials fromthe Securities and Exchange Commission (SEC) inthe USA (see, for example, Walker, 1999; Turner,2000). It seems likely that the change ofresponsibility 2.22a in NZ between 1999 and 2008,from being reasonably to unreasonably expected ofauditors, results from a combination of three factorswhich ‘discounted’ the benefits to be gained fromauditors performing the responsibility, namely:
(i) NZ society’s awareness of the increasedregulation governing NZ companies’financial statements (as elsewhere) since theturn of the 21st century;
(ii) its realisation of the size of audit fees(resulting from companies being required todisclose these fees in their annual financialstatements); and
(iii) its recognition that, if companies fabricatetheir interim financial statements, it is likelyto come to light when their audited annualfinancial statements are published.
It may be that UK society was cognisant of suchfactors earlier than its NZ counterpart becauseresponsibility 2.22a was an element of thereasonableness gap in the UK in both 1999 and 2008.
In NZ in 1999, responsibility 2.26b (see above) wassubsumed by the wider responsibility: ‘to examine
Audit Expectation-Performance Gap Revisited 9
Int. J. Audit. ••: ••–•• (2012)© 2012 Blackwell Publishing Ltd

listed company clients’ compliance with all of theStock Exchange’s corporate governancerequirements and to report, in the audit report, ontheir compliance therewith’ (2.26a) (rather thanmerely reporting instances of non-compliance(2.26b)).15 In 2003, the NZX published a Code ofCorporate Governance (NZX, 2003) and, in 2004, theNZSC published Corporate Governance Principles andGuidelines (NZSC, 2004). NZ companies are notrequired to comply with the NZX’s Code or theNZSC’s Guidelines, but the former requires listedcompanies to disclose in their annual report theextent to which their corporate governanceprocesses materially differ from the principles setout in the Code (NZX, 2003, p. 3). Along similarlines, the NZSC has noted: ‘Implementing [itsPrinciples] necessarily includes reporting aboutcorporate governance practices to shareholdersand other stakeholders’ (NZSC, 2004, p. 6). It ispossible that these developments resulted in theNZ survey respondents in 2008 distinguishingbetween ‘reporting instances of non-compliance’and ‘reporting on companies’ compliance’with the corporate governance requirements(responsibilities 2.26b and 2.26a). In 2008,responsibility 2.26a contributed to the deficientstandards gap in NZ (as in 1999) but the morelimited responsibility (2.26b) featured in thereasonableness gap.
In the UK, auditors are required to review theirlisted company clients’ compliance with a specifiedset of corporate governance requirements andto report, in the audit report, instances of non-compliance (responsibility 2.26iib). In 1999 (similarto the position in NZ), the responsibility: ‘toexamine listed company clients’ compliance witha specified set of the Stock Exchange’s corporategovernance requirements and to report, in theaudit report, on their compliance therewith’(2.26iia) was subsumed by the responsibility: ‘toexamine listed company clients’ compliance withall of the Stock Exchange’s corporate governancerequirements and to report on their compliancetherewith’ (2.26ia). However, in 2008, the UKrespondents distinguished between suggestedresponsibilities 2.26ia and 2.26iia and, possiblybecause they recognised the costs involved ifauditors were to perform the wider responsibility(2.26ia), it did not qualify as a responsibilityreasonably expected of auditors and thus featuredin the reasonableness gap in 2008. The narrowerresponsibility (2.26iia) did so qualify andcontributed to the deficient standards gap.
The remaining responsibility which helped toextend the reasonableness gap in the UK between1999 and 2008, namely: ‘to examine and report, inthe audit report, on companies’ non-financialperformance’ (2.20), did not qualify for inclusion inUK society’s expectations of auditors in 1999. Thischange may result from the increased emphasisgiven to companies’ non-financial performanceduring the period. It seems that, in 2008 (unlikein 1999), UK society recognised the importance ofcompanies’ non-financial, as well as financial,performance – something NZ society may haverecognised a decade earlier, as this responsibilityfeatured in ‘society’s expectations of auditors’ (andthe reasonableness gap) in NZ in both 1999 and2008.
While the responsibilities discussed aboveextended the reasonableness gap in NZ and theUK between 1999 and 2008, others served tonarrow it. As may be seen from Figure 3, in theUK, three responsibilities which contributed tothe reasonableness gap in 1999 failed to qualify forinclusion in ‘society’s expectations of auditors’ in2008. These are the responsibilities: ‘to examineand report, in the audit report, on the reliability ofinformation provided in companies’ annualreports on their policy and record in respect ofequal employment opportunities, product safety,and occupational health and safety’ (2.17a, 2.17band 2.17c). This finding accords with that notedearlier, namely, the failure of the responsibilitiesrelating to reporting on the auditee’s impact on itslocal community and environment and on itscarbon footprint (2.24a, 2.24b and 2.24c) to qualifyfor inclusion in UK ‘society’s expectations ofauditors’ in both 1999 and 2008. These findingsmay reflect the more advanced nature of corporateresponsibility reporting in the UK compared withNZ and, more particularly, the widespreadpublication of stand-alone corporate responsibilityreports by major UK companies and theincreasing number who have such informationindependently assured (Porter et al., 2008).However, it may also be linked to the change instatus of the responsibility: ‘to examine and reportin the audit report on the reliability of informationin the auditee’s entire annual report’ (2.25a).16 In1999, this responsibility contributed to thereasonableness gap in the UK but, in 2008, it metthe cost-benefit criterion to feature in the deficientstandards gap. In NZ, this responsibility was anelement of the deficient standards gap in both1999 and 2008.
10 B. Porter et al.
Int. J. Audit. ••: ••–•• (2012)© 2012 Blackwell Publishing Ltd

3.1.2 Changes in the extent of thereasonableness gap
From Figure 2 it may be seen that, not only did thenumber of responsibilities constituting thereasonableness gap in NZ rise sharply between1989 and 2008 (from nine to 28), but the measureof society’s unfulfilled expectations resulting fromauditors not performing these (unreasonablyexpected) responsibilities also increased markedly– from 348 to 713 units (an increase of 105 percent) between 1989 and 1999, and from 713 to834 units (an increase of 17 per cent) between1999 and 2008.17 However, comparison ofFigures 6, 7 and 8 reveals that the increase in NZsociety’s unfulfilled expectations resulted almostentirely from the additional responsibilitiesauditors were expected to perform in 1999compared with 1989, and in 2008 compared with1999.
Figure 2 also shows that, in contrast to thechanges in NZ, the number of responsibilitiesconstituting the reasonableness gap in the UK fellfrom 24 to 21 between 1999 and 2008 and the level ofsociety’s unfulfilled expectations declined from 804to 557 units (a decline of nearly 31 per cent). Further,by comparing Figures 9 and 10, it may be seen that,for every responsibility which contributed to thereasonableness gap in the UK in both 1999 and 2008,the extent of society’s unfulfilled expectationsattaching to the responsibility declined over theperiod (indicating that, in 2008, a smaller proportionof UK society unreasonably expected auditors toperform these responsibilities than in 1999). Asexplained in Part 1 of this paper, the difference inthe extent of the reasonableness gap in the UK andNZ in 2008 may result from UK society’s greaterawareness of financial and corporate matters ingeneral and, to quote the Cohen Commission(Commission on Auditors’ Responsibilities, 1978),of ‘what auditors can and should reasonably expectto accomplish’ (p. xi).
3.2 Changes in the deficient standards gapin NZ 1989–2008 and the UK 1999–2008
3.2.1 Changes in the contribution andcomposition of the deficient standards gap
The deficient standards gap consists ofresponsibilities society reasonably expects auditorsto perform but they are not required to do so by thelaw, regulations or professional promulgations.
From Figure 2 it may be seen that, in NZ, changesto this gap differ markedly from those affectingthe reasonableness gap. Between 1989 and 1999,the contribution of the deficient standards gapto the audit expectation-performance gap declinedfrom 58 to 51 per cent and between 1999 and 2008declined further, from 51 to 43 per cent.However, between 1989 and 1999, the number ofresponsibilities constituting this gap increasedfrom 10 to 14 but between 1989 and 2008 fellagain, from 14 to 11. In the UK, between 1999and 2008, in contrast to NZ, the contributionof the deficient standards gap to the auditexpectation gap increased from 42 to 45 per centbut the gap was composed of nine responsibilitiesin both years.
(a) Composition of the deficient standards gap in NZ in1989 and in NZ and the UK in 1999Reference to Figure 4 reveals that changes in thecomposition of the deficient standards gap in bothNZ and the UK are greater than the figures citedabove suggest. In NZ, between 1989 and 1999, fiveresponsibilities extended the gap but one helpedto narrow it; between 1999 and 2008, tworesponsibilities joined the gap but five departedfrom it. In the UK, between 1999 and 2008, fiveresponsibilities were added to the gap but fiveothers left it. Notwithstanding these changes, as forthe reasonableness gap, the composition of thedeficient standards gap in NZ and the UK isremarkably similar. Further, in NZ, nine of the 10responsibilities which constituted this gap in 1989also contributed to it in 1999; similarly, nine of the14 responsibilities which comprised the gap in 1999were elements of it in 2008.
Comparison of Figures 6 and 7 reveals that thenine responsibilities which contributed to thedeficient standards gap in NZ in both 1989 and1999 are as follows:• to report, in the audit report, if during the audit
it is discovered that the directors/seniormanagers have embezzled company assets orcommitted other illegal acts which directlyimpact on the financial statements (2.12c and2.15a);
• to report to an appropriate regulatory authorityif the auditor detects or suspects (i)embezzlement of company assets or otherillegal acts by the directors/senior managers or(ii) the company’s financial statements havebeen deliberately distorted (2.11c, 2.16, 2.11dand 2.13);
Audit Expectation-Performance Gap Revisited 11
Int. J. Audit. ••: ••–•• (2012)© 2012 Blackwell Publishing Ltd

Per
iod
ofch
ange
modgniK
detinU
d nalaeZ
w eN
Ext
ende
dth
ega
pN
arro
wed
the
gap
Ext
ende
dth
ega
pN
arro
wed
the
gap
Res
paSo
urce
Res
paD
esti
nati
onR
espa
Sour
ceR
espa
Des
tina
tion
1989
–199
92.
12b*
New
resp
onsi
bilit
y2.
5aR
easo
nabl
enes
sga
p2.
17d
New
resp
onsi
bilit
y2.
25a
New
resp
onsi
bilit
y2.
26a*
New
resp
onsi
bilit
y2.
27*
New
resp
onsi
bilit
y
1999
–200
82.
5aR
easo
nabl
enes
sga
p2.
12c
Act
ualr
espo
nsib
ility
2.25
aR
easo
nabl
enes
sga
p2.
12c
Act
ualr
espo
nsib
ility
2.15
aA
ctua
lres
pons
ibili
ty2.
26iia
Subs
umed
1999
2.13
Act
ualr
espo
nsib
ility
2.17
dA
ctua
lres
pons
ibili
ty2.
28a
New
resp
onsi
bilit
y2.
15a
Act
ualr
espo
nsib
ility
2.29
aN
ewre
spon
sibi
lity
2.22
aR
easo
nabl
enes
sga
p2.
29a
New
resp
onsi
bilit
y2.
26ia
Rea
sona
blen
ess
gap
2.27
Rep
lace
dby
2.27
a&
b2.
27a
Act
ualr
espo
nsib
ility
2.30
bN
ewre
spon
sibi
lity
2.27
Rep
lace
dby
2.27
a&
b2.
27a
Act
ualr
espo
nsib
ility pag
ssenelbanosaeR
b72.2pag
ssenel banosaeR
b 72.2
aTh
eke
yto
the
resp
onsi
bilit
ies
iden
tifi
edby
num
ber
ispr
ovid
edin
App
end
ix1.
*R
espo
nsib
iliti
esal
soco
ntri
buti
ngto
the
def
icie
ntst
anda
rds
gap
inth
eU
Kin
1999
.
Figu
re4:
Cha
nges
inth
ere
spon
sibi
liti
esco
ntri
buti
ngto
the
defi
cien
tst
anda
rds
gap
inN
Z19
89–2
008
and
the
UK
1999
–200
8.
12 B. Porter et al.
Int. J. Audit. ••: ••–•• (2012)© 2012 Blackwell Publishing Ltd

• to examine and report, in the audit report, on(i) the effectiveness of the company’s internalfinancial controls and (ii) the reasonableness offinancial forecasts included in the company’sannual report (2.18a and 2.23);
• to audit half-yearly published financialstatements (2.22a).
In 1999, five of these responsibilities (2.12c, 2.13,2.15a, 2.18a and 2.23) also contributed to thedeficient standards gap in the UK but three others– responsibilities 2.11c, 2.11d and 2.16 – wereexisting responsibilities of UK auditors and, asnoted in Section 3.1, responsibility 2.22a was anelement of the UK’s reasonableness gap.
The tenth responsibility which contributed to thedeficient standards gap in NZ in 1989, namely, ‘toreport to an appropriate authority doubts about thecompany’s continued existence’ (2.5a), featured inthe reasonableness gap in 1999 but returned to thedeficient standards gap in 2008. Its failure, in 1999,to qualify as a responsibility reasonably expected ofauditors may be linked to NZ society’s perceptionof a marked improvement in auditors’ performanceof their (actual) responsibility: ‘to report in theaudit report doubts about the company’s continuedexistence’ (2.5b) and its conclusion that it is notcost-effective to require auditors also to report suchdoubts to a regulatory authority. Nevertheless,following the well-publicised company failuresaround the turn of the 21st century, NZ societyappears to have reconsidered its position and, in2008, concluded that it is reasonable to expectauditors to report their doubts about the futureviability of an auditee to an appropriate authorityas well providing some warning in the audit report.This view seems to have been shared in the UK as,in both 1999 and 2008, responsibility 2.5acontributed to the deficient standards gap in theUK.
Reviewing the responsibilities that contributedto the deficient standards gap in NZ in both 1989and 1999, it may be seen that most involve auditorsreporting untoward matters discovered (orsuspected) during an audit to a regulatoryauthority and/or in the audit report. Given thatthese matters are within the knowledge of auditors,it seems unlikely that the costs resulting fromauditors performing these responsibilities wouldoutweigh the benefits that would accrue tofinancial statement users and others interested inthe entity from them doing so. Auditing standardsetters seem to have agreed because, in 2008, allsix of these ‘reasonably expected’ responsibilities
were actual responsibilities of auditors in the UK;similarly, two (2.12c and 2.15a) were also actualresponsibilities of auditors in NZ.
The responsibilities: ‘to examine and report, inthe audit report, on (i) the effectiveness of thecompany’s internal financial controls and (ii) thereasonableness of financial forecasts included inthe company’s annual report’ (2.18a and 2.23),which contributed to the deficient standards gap inNZ in 1989, also featured in this gap in both NZand the UK in 1999 and 2008. The surveyrespondents’ recognition of responsibility 2.18a asa responsibility that is reasonable to expect ofauditors was endorsed in 2002 by enactment ofthe Sarbanes-Oxley Act in the USA. Although notgenerally a responsibility of auditors in NZ or theUK, in 2008 it was an actual responsibility ofauditors who audit companies that are listed orregistered in the USA or are significantcomponents thereof.
Recognition of responsibility 2.23 as one whichis reasonable to expect of auditors reflectsfinancial statement users’ desire for someguidance on the reasonableness of future-orientedinformation provided in companies’ annualreports. Such a responsibility falls within auditors’area of expertise and in many countries auditorsare required to provide some assurance on future-oriented information in companies’ prospectuses.Although performing this responsibility is likelyto entail additional audit work, the surveyfindings indicate that the additional costs wouldbe outweighed by the resulting benefits forfinancial statement users and other externalparties.18
‘To audit half-yearly financial statements’ (2.22a)is the remaining responsibility which featured inthe deficient standards gap in NZ in both 1989 and1999. This was discussed in Section 3.1 in relation tothe reasonableness gap.
From Figure 4 it may be seen that, between 1989and 1999, the deficient standards gap in NZ wasextended by five responsibilities, none of whichwere included in the 1989 questionnaire. These arethe responsibilities:• to report, in the audit report, material theft of
company assets by non-managerial employeesdetected during the audit (2.12b);
• to examine and report, in the audit report, onthe reliability of information in the company’sentire annual report and, more particularly,about its directors’ remuneration (2.25a and2.17d);
Audit Expectation-Performance Gap Revisited 13
Int. J. Audit. ••: ••–•• (2012)© 2012 Blackwell Publishing Ltd

• to examine and report, in the audit report, onlisted company clients’ compliance with all ofthe Stock Exchange’s corporate governancerequirements (2.26a);
• to examine and report to the directors on theadequacy of the company’s risk managementprocedures (2.27).
Responsibilities 2.12b, 2.26a (or its equivalent in theUK questionnaire, 2.26ia) and 2.27 similarlyfeatured in the deficient standards gap in the UK in1999. However, in that year, responsibility 2.17dwas an existing responsibility of UK auditors and,as noted in Section 3.1, responsibility 2.25a was anelement of the UK’s reasonableness gap. However,in 2008, responsibility 2.25a contributed to theUK’s deficient standards gap (see Figure 4).
A review of the responsibilities whichcontributed to the deficient standards gap in NZ in1999, but not in 1989, reveals that they reflect thedevelopments in auditing’s external environmentbetween 1989 and 1999 discussed above in relationto the reasonableness gap – in particular,increased societal concern about corporate fraud,the development of corporate governancerequirements and the increasing quantity and rangeof financial and, more especially, non-financialinformation in companies’ annual reports.However, unlike the responsibilities which featuredin the reasonableness gap, the deficient standardsgap responsibilities met the cost-benefit criterion tobe reasonably expected of auditors – a view sharedby the standard setters in respect of responsibility2.17d. This responsibility was an actualresponsibility of NZ auditors in 2008 and of UKauditors in both 1999 and 2008.
(b) Changes in the deficient standards gap in NZ andthe UK 1999–2008In Section 3.1 it was noted that the responsibilities:‘to examine and report, in an attached audit report,on the reliability of information provided on theInternet by the company in its audited financialstatements’ (2.29a) and ‘to examine and report inthe audit report on the adequacy of the company’sprocedures for identifying financial risks’ (2.28a)were not included in the 1999 questionnaire in thisform. In 2008, a distinction was made betweenfinancial information provided by an auditeeon the Internet (i) within and (ii) outwith itsaudited financial statements (responsibilities2.29a and 2.29b) and between auditees’ proceduresfor identifying (i)financial and (ii) operational risks(responsibilities 2.28a and 2.28b).
As shown in Figure 4, in 2008, responsibility2.29a contributed to the deficient standards gap inboth NZ and the UK. It seems that society in bothcountries was aware that, although auditedfinancial statements published on the Internet byauditees should include the related audit report,auditees are able to alter their audited financialstatements before, or while, they are posted on theInternet. The survey findings indicate that, ifauditors were to provide assurance that theirclients’ audited financial statements on the Internetare unchanged from when the audit report wassigned and dated, the benefits derived by Internetusers would outweigh the costs involved. Figure 4also shows that, in 2008, responsibility 2.28a(auditors reporting in the audit report on clients’procedures for identifying financial risks) was anelement of the deficient standards gap in the UK.However, in NZ, this responsibility contributedto the reasonableness gap. It was noted in Section3.1 that the presence of this responsibility inthe deficient standards gap in the UK, but thereasonableness gap in NZ, may stem from the moreadvanced nature of corporate governancerequirements in the UK compared with NZ.
The responsibility: ‘to report, in the audit report,significant difficulties encountered during theaudit’ (2.30b) was not included in the 1999questionnaire but, in 2008, like responsibility 2.28a,it contributed to the deficient standards gap inthe UK but to the reasonableness gap in NZ.Its recognition in the UK, but not in NZ, as aresponsibility reasonably expected of auditorsmay reflect greater awareness of the issue in theUK through wider publicity and discussion ofcorporate and financial matters in general and,more specifically, about the usefulness of thestandard audit report and the information financialstatement users would like to see provided therein(see, for example, AQF, 2007).
A further responsibility which helped to extendthe deficient standards gap in the UK between 1999and 2008 concerns auditors examining listedcompany clients’ compliance with a specified setof the Stock Exchange’s corporate governancerequirements and reporting on its compliancetherewith (2.26iia; see Figure 4). However, theaddition of this responsibility to the deficientstandards gap in 2008 was offset by the departureof responsibility 2.26ia. As noted in Section 3.1,in 1999, responsibility 2.26iia was subsumed byresponsibility 2.26ia – ‘to examine listed companyclients’ compliance with all of the Stock Exchange’s
14 B. Porter et al.
Int. J. Audit. ••: ••–•• (2012)© 2012 Blackwell Publishing Ltd

corporate governance requirements and to reporton their compliance therewith’. However, in 2008,the UK survey respondents distinguished betweenthe two responsibilities and, while the wider (andmore costly) responsibility (2.26ia) contributed tothe reasonableness gap, the narrower responsibility(2.26iia) met the cost-benefit criterion to featurein the deficient standards gap. Responsibility2.26iia is broader than UK auditors’ existingresponsibility: ‘to examine listed company clients’compliance with a specified set of the StockExchange’s corporate governance requirementsand to report on instances of non-compliance’(2.26iib) and reflects UK society’s preference forauditors to report on listed company clients’compliance (or otherwise) with the corporategovernance requirements rather than merelyreporting on instances of their non-compliance.
Considering the responsibilities which helped tonarrow the deficient standards gap in NZ and theUK between 1999 and 2008, Figure 4 indicates that,in 2008, four such responsibilities were actualresponsibilities of auditors in NZ and/or the UK.As a result of changes to International Standardson Auditing (ISAs) between 1999 and 2008, theresponsibilities: ‘to report in the audit report ifduring the audit it is discovered that the directors/senior managers have embezzled company assetsor committed other illegal acts which directlyimpact on the financial statements’ (2.12c and 2.15a)were actual responsibilities of auditors in both NZand the UK in 2008.19 The same applies to part ofthe responsibility: ‘to examine and report to theclient’s directors on the adequacy of the company’srisk management procedures’ (2.27). As explainedearlier, although this responsibility appeared inthe 1999 questionnaire, in 2008 a distinction wasmade between reporting to the directors on thecompany’s procedures for identifying (i) financialrisks (2.27a) and operational risks (2.27b). In 2008,responsibility 2.27a was an actual responsibility ofauditors in both NZ and the UK and responsibility2.27b was an element of the reasonableness gap inboth countries.
Similarly, as a result of changes to ISA (UK &Ireland) 250 Section A: Consideration of laws andregulations in an audit of financial statements(Auditing Practices Board, 2008) the responsibility:‘to report to an appropriate authority suspicions ofa material theft of the company’s assets ordeliberate distortion of its financial statements’(2.13) was an actual responsibility of auditors in theUK in 200820 (but not in NZ).21 Along similar lines,
through changes to the NZ version of InternationalAccounting Standard 24 (NZ IAS 24): Related partydisclosures (New Zealand Institute of CharteredAccountants (NZICA), 2004), the responsibility:‘to examine and report in the audit report onthe reliability of information in the company’sannual report about its directors’ remuneration’(2.17d) was an actual responsibility of auditors inNZ in 2008. As noted earlier, it was an actualresponsibility of UK auditors in both 1999 and2008.
3.2.2 Changes in the extent of the deficientstandards gap
From Figure 2 it may be seen that, in NZ between1989 and 1999, while the number of responsibilitiesconstituting the deficient standards gap increasedfrom 10 to 14, the measure of society’s unfulfilledexpectations associated with this gap (resultingfrom auditors not being required to perform these‘reasonably expected’ responsibilities) jumpedfrom 667 to 832 units (an increase of nearly25 per cent). However, examination of Figures 6and 7 reveals that, like the widening of thereasonableness gap between 1989 and 1999,virtually all of this increase is accounted forby the additional responsibilities whichcontributed to this component of the auditexpectation-performance gap in NZ in 1999compared with 1989. As may be seen by comparingFigures 6 and 7, in virtually all cases, where aresponsibility contributed to the deficientstandards gap in NZ in both 1989 and 1999, theextent of society’s unfulfilled expectationsassociated with the responsibility decreased overthe decade.
Between 1999 and 2008, the number ofresponsibilities constituting the deficient standardsgap in NZ decreased from 14 to 11 and the measureof NZ society’s unfulfilled expectations resultingfrom auditors not performing these responsibilitiesdeclined from 832 to 725 units (a decrease ofnearly 13 per cent). However, comparison ofFigures 7 and 8 shows that, in contrast to theprevious decade, for almost of all theresponsibilities which contributed to the deficientstandards gap in NZ in both 1999 and 2008, theextent of NZ society’s unfulfilled expectationsincreased over the period. Given that the extentof unfulfilled expectations attaching to theresponsibilities which contributed to the deficientstandards gap in both years increased, it is evident
Audit Expectation-Performance Gap Revisited 15
Int. J. Audit. ••: ••–•• (2012)© 2012 Blackwell Publishing Ltd
that the decline in the overall level of NZ society’sunfulfilled expectations associated with this gapresulted from the decrease in the number ofresponsibilities constituting the gap in 2008compared with 1999.
Changes in the extent of the deficientstandards gap in the UK between 1999 and 2008present a different picture. Although the numberof responsibilities constituting this gap was thesame in both years, the measure of society’sunfulfilled expectations attaching to theseresponsibilities declined by nearly 30 per cent(from 591 to 415 units). From Figures 9 and10 it may be seen that, in direct contrast to thechanges in NZ, for every responsibility thatcontributed to the deficient standards gap in both1999 and 2008, the extent of society’s expectationsattaching to the responsibility decreased over theperiod.22
3.3 Changes in the deficient performance gapin NZ 1989–2008 and the UK 1999–2008
3.3.1 Changes in the contribution andcomposition of the deficientperformance gap
The deficient performance gap comprises actualresponsibilities of auditors which society perceivesto be performed deficiently. From Figure 2 it maybe seen that, in NZ between 1989 and 1999,the contribution of this gap to the auditexpectation-performance gap declined from 11 tosix per cent but between 1999 and 2008 it increasedfrom six to seven per cent (a result which is notstatistically significant). Further, while fiveresponsibilities constituted this gap in NZ in both1989 and 1999, seven did so in 2008. Between 1999and 2008 in the UK, the contribution of thedeficient performance gap to the audit expectationgap fell from nine to four per cent and the numberof responsibilities constituting this gap decreasedfrom eight to six.
(a) Composition of the deficient performance gap in NZin 1989 and in NZ and the UK in 1999Reference to Figures 6 and 7 reveals that the samefive responsibilities constituted the deficientperformance gap in NZ in both 1989 and 1999.These are the responsibilities:• to detect material theft of company assets by
(i) non-managerial employees and (ii) thedirectors/senior managers (2.8a and 2.8b);
• to detect illegal acts by the directors/seniormanagers which directly impact on thecompany’s financial statements (2.14a);
• to disclose in the audit report (i) doubts aboutthe company’s continued existence and (ii)deliberate distortion of the company’s financialstatements (2.5b and 2.12d).
Figure 9 shows that these five responsibilities alsocontributed to the deficient performance gap in theUK in 1999. However, three further responsibilitiesalso featured in this gap in the UK in 1999, namely:‘to report to a regulatory authority if during theaudit it is discovered that (i) the financialstatements have been deliberately distorted or (ii)the directors/senior managers have embezzledcompany assets or committed other illegal acts’(2.11d, 2.11c and 2.16).
(b) Changes in the deficient performance gap in NZ andthe UK 1999–2008Changes in the composition of the deficientperformance gap in NZ and the UK between 1999and 2008 are greater than the figures cited abovemight suggest. As noted in Section 3.2, as a resultof changes to Auditing and Accounting Standards,four additional responsibilities were actualresponsibilities of auditors in NZ and/or the UKin 2008 compared with 1999. These are theresponsibilities:• to report in the audit report if during the audit
it is discovered that the directors/seniormanagers have embezzled company assets orcommitted other illegal acts which directlyimpact on the company’s financial statements(2.12c and 2.15a);
• to report to the directors on the adequacy of thecompany’s procedures for identifying financialrisks (2.27a); and
• for auditors in the UK: to report to anappropriate authority if during the auditsuspicions of theft or deliberate distortion of thefinancial statements are aroused (2.13);
• for auditors in NZ: to examine and report onthe reliability of information in the company’sannual report on its directors’ remuneration(2.17d).
Additionally, through changes to ISA 260:Communication with those charged with governance(International Auditing and Assurance StandardsBoard (IAASB), 2007), the responsibility: ‘to reportto the directors on difficulties encountered duringthe audit’ (2.30a), which was included in the 2008
16 B. Porter et al.
Int. J. Audit. ••: ••–•• (2012)© 2012 Blackwell Publishing Ltd

but not the 1999 questionnaire, was an actualresponsibility of auditors in both NZ and the UK in2008.
In 2008, the NZ society group23 adjudgedauditors’ performance of three of their fiveadditional responsibilities to be satisfactory (2.17d,2.27a and 2.30a) but their performance ofresponsibilities 2.12c and 2.15a was consideredto be deficient. As shown in Figure 5, theseresponsibilities contributed to the deficientperformance gap. Additionally, in 2008 the groupsignified that NZ auditors’ performance of theresponsibility: ‘to detect deliberate distortion of thecompany’s financial statements’ (2.10), which wasassessed as satisfactory in 1989 and 1999, was sub-standard. Conversely, their performance of theresponsibility: ‘to disclose in the audit report doubtsabout the company’s continued existence’ (2.5b),which was evaluated as deficient in 1989 and 1999,was adjudged as satisfactory in 2008 (see Figure 5).
As in NZ, in 2008 the UK society groupperceived auditors’ performance of three of theirfive additional responsibilities (2.13, 2.27a and2.30a) to be satisfactory but their performance ofthe other two (2.12c and 2.15a) was considered tobe deficient. Contrarily, UK auditors’ performanceof four other responsibilities, which contributedto the deficient performance gap in 1999, wasadjudged by the UK society group to be satisfactoryin 2008. As indicated in Figure 5, these are theresponsibilities:• to disclose in the audit report (i) doubts about
the company’s continued existence and (ii)deliberate distortion of the company’s financialstatements (2.5b and 2.12d);
• to report to an appropriate authority if duringthe audit it is discovered that the directors/senior managers have embezzled companyassets or committed other illegal acts whichdirectly impact on the company’s financialstatements (2.11c and 2.16).
3.3.2 Changes in the extent of the deficientperformance gap
From Figure 2 it may be seen that, althoughfive responsibilities constituted the deficientperformance gap in NZ in both 1989 and 1999, themeasure of NZ society’s unfulfilled expectationsresulting from perceived poor performance byauditors of these responsibilities decreasedfrom 125 units in 1989 to 94 units in 1999 (adecline of nearly 25 per cent). Comparison of
Figures 6 and 7 reveals that, for all of theresponsibilities which contributed to the deficientperformance gap in both years, roughly the same,or a smaller proportion of the society groupsignified that auditors perform the responsibilitypoorly in 1999 than did so in 1989.
In contrast to the previous decade, between 1999and 2008, the measure of NZ society’s perceptionof poor performance by auditors increased from94 to 116 units (an increase of 23 per cent).Nevertheless, as may be seen by comparingFigures 7 and 8, for each of the four responsibilitieswhich contributed to this gap in NZ in both 1999and 2008, a similar proportion of the society groupadjudged auditors’ performance of theresponsibility to be poor in both years. It followsthat the widening of the deficient performance gapin NZ between 1999 and 2008 resulted from theadditional responsibilities which contributed to thegap in 2008 compared with 1999.
Unlike in NZ, in the UK between 1999 and 2008,the deficient performance gap narrowedsignificantly – from 144 units of unfulfilledexpectations in 1999 to 41 units in 2008 (a decreaseof nearly 72 per cent). As might be expected, and asmay be seen by comparing Figures 9 and 10, foreach responsibility which contributed to this gap inboth 1999 and 2008, the proportion of the UKsociety group who indicated that auditors performthe responsibility poorly declined markedly.
It seems likely that monitoring of auditors’performance is, in large part, responsible for theperceived improvement in auditors’ performancein NZ between 1989 and 1999 and in the UKbetween 1999 and 2008. As explained in Part 1 ofthis paper, Practice Review was introduced in NZby NZICA in 1990. It involves a Practice ReviewPanel (appointed by NZICA) reviewing theperformance of all NZICA members who hold aPublic Practice Certificate; it thus applies to allcompany auditors. In the UK, monitoring ofauditors’ performance was introduced in 1991 but,unlike in NZ, it is an element of a governmentalregulatory system and focuses exclusively oncompany auditors and audits.
Introduction of the monitoring of auditors’performance may have resulted in auditeesobserving improved performance by their auditors;it may also have resulted in society perceivingimproved performance as a consequence ofbecoming aware of the monitoring of auditors’performance through reference to it in the financialpress or by other means. However, in NZ, Practice
Audit Expectation-Performance Gap Revisited 17
Int. J. Audit. ••: ••–•• (2012)© 2012 Blackwell Publishing Ltd

Per
iod
ofch
ange
modgniK
detinU
dn alaeZ
weN
Ext
ende
dth
ega
pN
arro
wed
the
gap
Ext
ende
dth
ega
pN
arro
wed
the
gap
Res
paSo
urce
Res
paD
esti
nati
onR
espa
Sour
ceR
espa
Des
tina
tion
1989
–199
919
99–2
008
2.10
Sati
sfac
tory
perf
orm
ance
2.5b
Sati
sfac
tory
perf
orm
ance
2.12
cD
efic
ient
stan
dard
sga
p2.
5bSa
tisf
acto
rype
rfor
man
ce ecnamrofrep
yrotcafsitaSc11.2
pags
dradnatstneicife
Da51.2
pags
dradnatstneicife
Dc21.2 2.
15a
Def
icie
ntst
anda
rds
gap
2.12
dSa
tisf
acto
rype
rfor
man
ce2.
16Sa
tisf
acto
rype
rfor
man
ce
aTh
eke
yto
the
resp
onsi
bilit
ies
iden
tifi
edby
num
ber
ispr
ovid
edin
App
end
ix1.
Figu
re5:
Cha
nges
inth
ere
spon
sibi
liti
esco
ntri
buti
ngto
the
defi
cien
tpe
rfor
man
cega
pin
NZ
1989
–200
8an
dth
eU
K19
99–2
008.
18 B. Porter et al.
Int. J. Audit. ••: ••–•• (2012)© 2012 Blackwell Publishing Ltd

Review has remained virtually unchanged sinceits inception and no reports on its process oroutcomes are placed in the public domain;similarly, little publicity is given to disciplinaryaction taken against errant auditors by NZICA.The reason for NZ society’s perception of adecline in the standard of auditors’ performancebetween 1999 and 2008 may lie in the absenceof new developments in, and publicity about,the monitoring of NZ auditors’ performance,combined with extensive media coverage ofcorporate debacles and apparent audit failures in anumber of countries during the 2000s.24
In the UK, since 1991, when the RecognisedSupervisory Bodies (RSBs) became responsible formonitoring the performance of their registrantauditors,25 the monitoring process has becomemore stringent. Additionally, since 2004, monitoringby the RSBs has been supplemented by inspectionsof the audits of companies listed on the LondonStock Exchange (and of other public interestentities) by the Audit Inspection Unit (AIU).26
Further, since the inception of monitoring, the RSBs,and latterly the AIU, have submitted annual reportson the conduct and outcomes of their monitoringactivities to the Department of Business, Innovationand Skills (or predecessor Department). Monitoringof their performance has resulted in a significantnumber of UK auditors being debarred fromauditing or subject to other sanctions; between 1992and 2006, sub-standard performance by auditorsregistered with the Institutes of CharteredAccountants in England and Wales, of Scotland or inIreland, resulted in 138 registered auditors beingdebarred from accepting appointment as companyauditors or having restrictions placed on their auditregistration (Porter et al., 2008). Further, when anRSB takes disciplinary action against one of itsregistrant auditors, the matter is publicised in thefinancial press. It seems likely that these factorscontributed to UK society’s perception of a markedimprovement in UK auditors’ performance between1999 and 2008.
4. CHANGES IN THE EXTENT OFTHE AUDIT EXPECTATION-PERFORMANCE GAP IN NZ1989–2008 AND THE UK 1999–2008
As noted earlier, in 1989 no survey equivalent tothat conducted in NZ was undertaken in the UK.However, the findings of a study by Humphreyet al. (1993) indicate that the audit expectation gap
in the UK in 1990 was similar to that found toexist in NZ in 1989. Comparing the findings ofHumphrey et al. (1993) with those of the surveyconducted in the UK in 1999 (Porter & Gowthorpe,2004), it is conjectured that changes in the auditexpectation gap in the UK between 1989 and 1999are not dissimilar from those which occurred inNZ.
As reported in Section 3, between 1989 and 1999the external environment of auditing in NZ and theUK was characterised by change – in particular,by growth in the size and incidence of corporatefraud, the development of corporate governancerequirements (especially in the UK), increasingsocietal concern about the environmental and socialimpact of major companies, expansion in thequantity and range of information in companies’annual reports, and the emergence of the Internetas an effective means of communication. Thesechanges resulted in a dramatic increase in society’s(unreasonable) expectations of auditors and amarked widening of the reasonableness gap (by105 per cent in NZ; see Figure 2). They also resultedin additional responsibilities being expected ofauditors which were cost-beneficial for them toperform and, hence, in a broadening of the deficientstandards gap (by about 25 per cent in NZ).However, the widening of the reasonableness anddeficient standards gaps during the decade wasoffset, to an extent, by a narrowing of the deficientperformance gap (by about 25 per cent in NZ),probably primarily as a result of the introduction ofmonitoring of auditors’ performance. Despite thenarrowing of the deficient performance gap, overall,the audit expectation-performance gap in NZwidened significantly between 1989 and 1999 – from1,140 units of society’s unfulfilled expectations in1989 to 1,639 units in 1999 (an increase of 44per cent).
In 1999, the composition of the components ofthe audit expectation-performance gap in NZ andthe UK were very similar. Nevertheless, thereasonableness and deficient performance gapswere 13 and 53 per cent, respectively, wider in theUK than in NZ but the deficient standards gap was30 per cent narrower (see Figure 2). The greaterwidth of the reasonableness gap in the UK isprobably a consequence of the more advancedstage of corporate governance requirements inthe UK compared with NZ resulting in UKsociety having enhanced expectations of auditorswith respect to corporate governance-relatedresponsibilities. The comparative narrowness of the
Audit Expectation-Performance Gap Revisited 19
Int. J. Audit. ••: ••–•• (2012)© 2012 Blackwell Publishing Ltd

deficient standards gap in the UK is explained bythe fact that, as noted in Section 3.2, five fewerresponsibilities featured in this gap in the UK thanin NZ. The greater width of the deficientperformance gap in the UK than in NZ in 1999 ismore difficult to explain. Given that monitoringof auditors’ performance commenced in bothcountries at about the same time and that, in theUK, it is an element of a governmental regulatorysystem and its outcomes are placed in the publicdomain, it might be expected that the deficientperformance gap would be narrower, rather thanwider, in the UK. However, the unexpected failureof the Bank of Credit & Commerce International(BCCI) in 1991 and Barings Bank in 1995 severelyimpacted many private investors, pension funds,and local authority investments in the UK and,thus, had a major adverse impact on UK society; noequivalent debacle affected NZ between 1989 and1999. The failure of UK auditors to give warningof the banks’ impending demise may have resultedin UK society being more dissatisfied than itsNZ counterpart with auditors’ performance.Notwithstanding the differences noted above inthe extent of the components of the auditexpectation-performance gap in NZ and the UK, in1999 the extent of the overall gap in the twocountries was remarkably similar; it represented1,639 units of society’s unfulfilled expectations ofauditors in NZ compared with 1,539 units in theUK (a difference of six per cent; see Figure 2).
Between 1999 and 2008, the developments inauditing’s external environment continued butat a slower pace. Additionally, stimulated bywell-publicised corporate collapses around theturn of the 21st century and the global financialcrisis which commenced in early 2008, there wasmore public discussion than previously aboutcorporate and financial matters and relatedauditing issues.27 Possibly as a result of suchdiscussion, together with many of thedevelopments of the 1989–1999 period becomingcommonplace or further advanced, the benefitsto be derived from auditors performing someextended responsibilities seems to have beenrecognised by UK and NZ society. As aconsequence, some of the responsibilities whichcontributed to the reasonableness gap in 1999 metthe cost-benefit criterion in 2008 and, thus, featuredin the deficient standards gap in that year. UKsociety also seems to have become more cognisantof what auditors can and cannot accomplishbecause three of the responsibilities which
contributed to the reasonableness gap in the UK in1999 were omitted from ‘society’s expectations ofauditors’ in 2008. These responsibilities (whichwere elements of the reasonableness gap in NZ in1999 and 2008) concern auditors examining andreporting on the reliability of information providedin companies’ annual reports about their policyand record in respect of (i) equal employmentopportunities, (ii) product safety and (iii)occupational health and safety (responsibilities2.17a, 2.17b, 2.17c). Further, as may be seen bycomparing Figures 7 and 8, and Figures 9 and 10,while in NZ the level of society’s unfulfilledexpectations associated with each responsibilitywhich contributed to the reasonableness gap inboth 1999 and 2008 remained virtually unchanged,it declined quite markedly in the UK. As anoutcome of the changes which occurred between1999 and 2008, the reasonableness gap widened inNZ by 17 per cent but narrowed in the UK by 31 percent (see Figure 2).
Although developments in auditing’s externalenvironment continued between 1999 and 2008,this period is primarily characterised by changesin its internal environment, particularly bychanges in auditing and accounting standardsand, in the UK, by more stringent monitoring ofauditors’ performance. As noted in Section 3.3, asa result of changes in auditing and accountingstandards, five responsibilities that featured in thedeficient standards gap in NZ and/or the UK in1999 were actual responsibilities of auditors in2008. Additionally, the level of society’s unfulfilledexpectations attaching to each responsibilitywhich contributed to the deficient standards gapin both 1999 and 2008 increased to a small extentin NZ but fell sharply in the UK. As aconsequence, between 1999 and 2008 the deficientstandards gap narrowed in both countries – by 13per cent in NZ and 28 per cent in the UK (seeFigure 2).
While recognising the factors which affectedthe extent of the reasonableness and deficientstandards gaps in NZ and the UK between 1999and 2008, of greater significance are those whichaffected the deficient performance gap. Asexplained in Section 3.3, it appears that, between1999 and 2008, the process of monitoring auditors’performance changed little (if at all) in NZ, but itsrigour increased in the UK. Possibly reflecting thisdifference, while NZ society perceived auditors’performance to deteriorate over the period, UKsociety perceived a marked improvement in
20 B. Porter et al.
Int. J. Audit. ••: ••–•• (2012)© 2012 Blackwell Publishing Ltd

auditors’ performance. The measure of society’sunfulfilled expectations resulting from auditors notperforming their responsibilities to the expectedstandard (and, hence, the extent of the deficientperformance gap) increased in NZ by 23 per centbut decreased in the UK by 72 per cent (seeFigure 2).
As noted above, in 1999 the extent of the auditexpectation-performance gap in NZ and the UKwas remarkably similar. However, between 1999and 2008, the audit expectation-performance gap inNZ widened from 1,639 to 1,675 units of society’sunfulfilled expectations (an increase of 2 per cent,a result which is not statistically significant), whilein the UK it narrowed from 1,539 to 1,013 units (adecrease of 34 per cent). As a consequence, in 2008,the extent of the gap in the two countries differedby nearly 40 per cent.
5. CONCLUDING REMARKS:A PROCESS IDENTIFIED
Reflecting on the changes in the auditexpectation-performance gap in NZ and the UKbetween 1989 and 2008, a process may bediscerned. It seems that, when significant changesoccur in the corporate arena, society expectsauditors to accept a range of new responsibilitiesto help constrain corporate managementsfrom exploiting the changes to their, rather thansociety’s, benefit. Initially, society appears to givelittle thought to the costs of auditors performingthese responsibilities and most contribute to thereasonableness component of the audit expectationgap. However, as the ‘emerging issues’ becomemore commonplace, society begins to recognisethat the potential costs of auditors performingsome of the ‘newly expected’ responsibilitiesoutweigh the potential benefits to be derivedtherefrom, and these responsibilities are discardedfrom society’s expectations of auditors and, thus,from the audit expectation gap. This is reflected,for example, in the exclusion in 2008 in the UK ofthe responsibilities: ‘to examine and report on thereliability of information included in clients’annual reports about their policy and record inrespect of (i) equal employment opportunities, (ii)product safety and (iii) occupational health andsafety’ (2.17a, 2.17b, 2.17c). At the same time, thepotential benefits to be derived from auditorsperforming other emerging issues-relatedresponsibilities are gradually appreciated. This
changes the cost-benefit equation and theresponsibilities concerned change from beingunreasonably, to reasonably, expected of auditorsand move from the reasonableness to the deficientstandards component of the audit expectation gap.Such a change is reflected in the responsibility:‘to examine and report, in an attached audit report,on the reliability of information provided on theInternet by the auditee in its audited financialstatements’ (2.29a) moving from the reasonablenessto the deficient standards gap in both NZ and theUK in 2008.
As society’s familiarity with the changes inauditing’s external environment evolves,recognition of the benefits to be obtained fromauditors performing responsibilities that arereasonably expected (but not required) of themincreases until, through a change in legislation,regulations or auditing standards, they becomeactual responsibilities of auditors. Most often thischange follows a major crisis (such as the 1987Stock Market Crash, the 2001 collapse of Enron,or the 2008 global financial crisis) which prompts areview by politicians, regulators and the auditingprofession of the part played by auditors in – or,more frequently, not played by them in preventing– the crisis, and in regulatory reform designedto correct the perceived deficiency. This processcan be seen, for example, in enactment of theSarbanes-Oxley Act of 2002 in the USA followingthe Enron and WorldCom debacles, and the UKHouse of Lords’ Economic Affairs Committeeenquiry into the role of auditors following the 2008financial crisis. As politicians become involved inthe profession’s affairs, the profession’s standardsetting bodies review – and in many cases – revisetheir auditing standards. In 2004, the IAASBcommenced a review of all of the ISAs and thisresulted in ‘One new standard, addressingcommunication of deficiencies in internal control;16 standards containing new and revisedrequirements . . . ; and 20 standards that havebeen redrafted’ (IAASB, 2010). As an outcome ofsuch changes, some ‘deficient standards gapresponsibilities’ become actual responsibilities ofauditors – for example, the responsibilities: ‘toreport in the audit report if during the audit it isdiscovered that the directors/senior managershave embezzled company assets or committedother illegal acts which directly impact on thefinancial statements’ (2.12c and 2.15a), which wereactual responsibilities of auditors in both NZ andthe UK in 2008.
Audit Expectation-Performance Gap Revisited 21
Int. J. Audit. ••: ••–•• (2012)© 2012 Blackwell Publishing Ltd

As the number of auditors’ actual responsibilitiesincrease or become more demanding (particularlyif the changes are prompted by a major crisis),society’s perception of their performance may, atleast initially, deteriorate. Nevertheless, historysuggests that legislative and regulatory changeslike those mentioned above usually includeenhanced requirements for auditors’ competenceand/or performance. For instance, following the1987 Stock Market Crash, the UK Companies Act1989 introduced a requirement for companyauditors to be registered with an RSB which wasresponsible, inter alia, for monitoring itsregistrants’ competency and performance. Alongsimilar lines, during the House of Lords enquiryinto the role of auditors, following publication ofcritical reports by the AIU of auditors’ performancein the UK in 2010, it was mooted that the auditors ofpublic listed companies (and other public interestentities) be specially licensed or required to meetnew competency requirements (Christodoulou,2010).
The findings of research conducted in NZ andthe UK since 1989 (Porter, 1993; Humphrey et al.,1993; Porter & Gowthorpe, 2004; and the presentstudy) indicate that auditors’ performance (orsociety’s perception thereof) has improvedmarkedly during the past two decades –particularly in the UK. The apparent improvementmay result from auditing standards being moredemanding and/or specifying auditors’responsibilities more clearly than previously,and/or from auditors becoming more familiarwith the requirements. However, the primaryreason is probably increased scrutiny of theirperformance.
It was reported in Part 1 of this paper that, someeight decades ago, Limperg (1932, reproduced inLimperg Instituut, 1985) asserted that auditorshave a dual responsibility: not to arouse in the‘sensible layman’ (p. 18) greater expectations thancan be fulfilled by the work done, and to carryout the work in a manner that does not betraythe expectations evoked. This suggests that it isincumbent on auditors to restrain society’sexpectations of them to those that it is cost-beneficialfor them to perform, to accept responsibilities whichmeet the cost-benefit criterion as rightfully theirsand to perform these responsibilities to the highstandard society expects. The findings of theresearch reported in this paper indicate that, in orderto achieve this goal, the auditing profession (and/or
relevant regulator) needs to adopt a tripartiteapproach, namely:
(i) to ensure that developments in the corporatearena, and the related auditing issues, arewidely publicised and discussed and thatsociety becomes aware of what is, and is not,feasible for auditors to accomplish;
(ii) to subject the responsibilities society expectsauditors to perform to cost-benefit analysisand to encapsulate in auditing standardsthose that are found to be cost-effective forauditors to perform;
(iii) to ensure that auditing standards clearlyspecify what is required of auditors infulfilment of their responsibilities, to monitorauditors’ performance to ensure that therequirements are met and to publicise themonitoring process and its outcomes.
If the auditing profession takes the initiativeand implements the measures indicated above,society’s perception of the services auditors deliverwill be better aligned with its expectations. As aconsequence, the criticism faced by auditors shouldabate and confidence in the profession and its workshould gradually be restored.
ACKNOWLEDGEMENTS
The authors thank Professor Jenny Stewart, Editor-in-Chief of the International Journal of Auditing forinviting the submission of this two part paper,and for her helpful comments and advice onearlier drafts. They also acknowledge with thanksthe financial support provided for the research bythe International Auditing and AssuranceStandards Board and the American Institute ofCertified Public Accountants. They alsoacknowledge and thank senior members of theauditing profession in both the UK and NewZealand who generously gave their time, thoughtsand expertise to assist with developing thequestionnaire. Additionally, they extend thanks toall those in the UK and NZ who participated inthe pilot study and completed the questionnaire.Without the help of these people, the researchreported here would not have been possible.Thanks are also due to colleagues and conferenceand seminar participants who provided feedbackon earlier drafts of this paper. Their helpful advicehas been appreciated and has helped to improvethe paper.
22 B. Porter et al.
Int. J. Audit. ••: ••–•• (2012)© 2012 Blackwell Publishing Ltd

Soc
iety
’s snoitatcepxe of
aud
itor
sb
seituD
’s rot iduA
ylban os aergnit sixe
du
ties
cd etcep xe
of
audi
tors
d
%13%8 5
%1 1
Du
ty
Res
pon
se
Con
trib
. D
uty
R
espo
nse
C
ontr
ib.
D
uty
R
espo
nse
C
ontr
ib.
%e
%f
%e
%f
%e
%f
2.
5b
37
30
2.11
d
76
11
2.
11a,
b 51
15
2.
12d
27
21
2.18
a,b
75
11
2.12
a,b
47
14
2.8b
21
17
2.
11c
74
11
2.4
41
12
2.
14a
21
17
2.12
c
70
11
2.
14b
40
11
2.
8a
1915
2.
15a
68
10
2.15
b 40
11
12
5 10
0 2.
16
64
10
2.2
39
11
2.
23
63
10
2.7
33
10
2.22
a,b
62
9
2.
17a,
b,c,
d 32
9
2.13
60
9
2.21
25
7
2.5a
55
8
348
100
66
7001
a A
udito
rs’
duti
es p
erce
ived
by
the
soci
ety
grou
p to
be
perf
orm
ed d
efic
ient
ly.
b R
espo
nsib
ilit
ies
expe
cted
of
audi
tors
by
20%
or
mor
e of
at l
east
one
soc
iety
gro
up (
audi
tees
, fin
anci
al c
omm
unit
y an
d no
n-fi
nanc
ial c
omm
unit
y au
dit b
enef
icia
ries
).
c E
xist
ing
resp
onsi
bili
ties
def
ined
by
refe
renc
e to
sta
tute
law
, cas
e la
w r
egul
atio
ns a
nd p
rofe
ssio
nal p
rom
ulga
tion
s.
d R
espo
nsib
ilit
ies
whi
ch a
re c
ost-
bene
fici
al f
or a
udit
ors
to p
erfo
rm.
e P
ropo
rtio
n of
the
soci
ety
grou
p (a
udit
ees,
fin
anci
al c
omm
unit
y an
d no
n-fi
nanc
ial c
omm
unit
y au
dit b
enef
icia
ries
) w
hose
exp
ecta
tion
s w
ith
resp
ect t
o th
e re
spon
sibi
lity
are
not
bei
ng f
ulfi
lled
. f
Rel
ativ
e co
ntri
buti
on o
f re
spon
sibi
liti
es to
the
com
pone
nt.
Per
form
ance
gap
Def
icie
nt
perf
orm
ance
Def
icie
nt
stan
dard
sU
nrea
sona
ble
expe
ctat
ions
Rea
sona
blen
ess
gap
Soc
iety
’s
perc
epti
on o
f au
dito
rs’
defi
cien
t pe
rfor
man
cea
Aud
itex
pec t
ati o
n-pe
rfor
man
cega
p
Figu
re6:
Con
trib
utio
nof
Res
pons
ibil
itie
sto
Com
pone
nts
and
ofC
ompo
nent
sto
the
Aud
itE
xpec
tati
on-P
erfo
rman
ceG
apin
NZ
in19
89.
(Ple
ase
note
:The
key
tore
spon
sibi
litie
sid
enti
fied
bynu
mbe
ris
pres
ente
din
App
endi
x1)
Audit Expectation-Performance Gap Revisited 23
Int. J. Audit. ••: ••–•• (2012)© 2012 Blackwell Publishing Ltd

Soc
iety
’s
expe
ctat
ions
of
aud
itor
sb
pagss enel bano sa e
Rpag
ecn amr ofre
P
seituD
’ srotiduA
y lban osaergnitsixe
du
ties
cde tce pxe
of
audi
tors
d
el bano saernU
tne ic ifeD
tneici feD
snoitatcepxesdr adnats
ec namr ofrep
%1 5%6
43%
Du
ty
Res
pon
se
Con
trib
. D
uty
R
espo
nse
C
ontr
ib.
Du
ty
Res
pon
se
Con
trib
. D
uty
R
espo
nse
C
ontr
ib.
%e
%f
%
e %
f%
e %
f
%e
%f
2.
8b
21
23
2.12
c 77
9
2.11
b 51
7
2.7
30
4
2.5b
20
21
2.
15a
74
9 2.
5a
44
6 2.
11a
29
4
2.12
d 18
19
2.
11c
70
8 2.
18b
43
6 2.
22b†
29
4
2.8a
18
19
2.
11d
66
8 2.
4 42
6
2.19
28
4
2.14
a 17
18
2.18
a
63
8 2.
14b
42
6 2.
21
27
4
94
100
2.27
a,b
63
8
2.15
b 39
5
2.17
c 20
3
2.
12b
61
7
2.2
38
5 2.
17b
19
3
2.
16
58
7 2.
9b
38
5 2.
17a
18
3
2.
23
57
7 2.
28a,
b 38
5
2.20
17
2
2.13
52
6
2.9a
34
5
2.25
† 12
2
2.22
a 48
6
2.29
a,b
33
5 2.
1 10
1
2.
25a
48
6 2.
12a
32
5
713
100
2.26
a 48
6
2.17
d 4
7 5
83
2 10
0
a A
udit
ors’
dut
ies
perc
eive
d by
the
soci
ety
grou
p to
be
perf
orm
ed d
efic
ient
ly.
b R
espo
nsib
ilit
ies
expe
cted
of
audi
tors
by
20%
or
mor
e of
at l
east
one
soc
iety
gro
up (
audi
tees
, fin
anci
al c
omm
unit
y an
d no
n-fi
nanc
ial c
omm
unit
y au
dit b
enef
icia
ries
).
c E
xist
ing
resp
onsi
bili
ties
def
ined
by
refe
renc
e to
sta
tute
law
, cas
e la
w r
egul
atio
ns a
nd p
rofe
ssio
nal p
rom
ulga
tion
s.
d R
espo
nsib
ilit
ies
whi
ch a
re c
ost-
bene
fici
al f
or a
udit
ors
to p
erfo
rm.
e P
ropo
rtio
n of
the
soci
ety
grou
p (a
udit
ees,
fin
anci
al c
omm
unit
y an
d no
n-fi
nanc
ial c
omm
unit
y au
dit b
enef
icia
ries
) w
hose
exp
ecta
tion
s w
ith
resp
ect t
o th
e re
spon
sibi
lity
are
not
bei
ng f
ulfi
lled
. f †
Rel
ativ
e co
ntri
buti
on o
f re
spon
sibi
liti
es to
the
com
pone
nt.
E
xclu
ded
from
the
2008
sur
vey
inst
rum
ent.
The
num
bers
of
subs
equ
ent r
espo
nsib
ilit
ies
have
bee
n ad
just
ed a
ccor
ding
ly, t
o re
flec
t the
ir n
umbe
r in
the
2008
que
stio
nnai
re.
Soc
iety
’s
perc
epti
on o
f au
dito
rs’
defi
cien
t pe
rfor
man
cea
Aud
it e
xpec
tati
on-p
erfo
rman
ce g
ap
Figu
re7:
Rel
ativ
eC
ontr
ibut
ion
ofR
espo
nsib
ilit
ies
toC
ompo
nent
san
dof
Com
pone
nts
toth
eA
udit
Exp
ecta
tion
-Per
form
ance
gap
inN
Zin
1999
.(P
leas
eno
te:T
heke
yto
duti
esid
enti
fied
bynu
mbe
ris
pres
ente
din
App
endi
x1)
24 B. Porter et al.
Int. J. Audit. ••: ••–•• (2012)© 2012 Blackwell Publishing Ltd

Soc
iety
’s
Aud
it e
xpec
tati
on-p
erfo
rman
ce g
ap
ex
pect
atio
ns
of a
udit
orsb
pagsse nelbanosae
Rpag
ec namrof re
P
seituD
yl banosaer’sr otidu
Afo
detcep xegnitsixe
du
ties
csr ot idua
d
elbanosaernU
tne icifeD
tneicif eD
snoitatcepxesdradnats
ecnamr ofr ep D
uty
R
espo
nse
C
ontr
ib.
Du
ty
Res
pon
se
Con
trib
. D
uty
R
espo
nse
C
ontr
ib.
Du
ty
Res
pon
se
Con
trib
%e
%f
%e
%f
%e
%f
%e
%f
2.8b
20
17
2.
11d
82
11
2.11
b 54
7
2.11
a 28
3
2.8a
17
15
2.
18a
80
11
2.28
a 50
6
2.27
b 28
3
2.12
c 17
15
2.
11c
78
11
2.30
b 49
6
2.19
27
3
2.14
a 17
15
2.
16
68
9 2.
18b
45
5 2.
21
24
3 2.
10
16
13
2.12
b 65
9
2.22
45
5
2.29
b 24
3
2.12
d 15
13
2.
5a
63
9 2.
26b
44
5 2.
28b
21
3 2.
15a
1412
2.
29a
60
8 2
.7
40
5 2.
17b
17
2
116
100
2.13
59
8
2.4
39
5
2.17
c 17
2
2.
25a
59
8 2.
15b
38
5 2.
20
17
2 251
c42 .24
63b41.2
865
32.2a6 2.2
55
8 2.
9b
35
4 2.
17a
14
2 5 27
100
2.2`
33
4
2.24
b 14
2
2.
12a
30
4 2.
24a
12
1
2.9a
29
3
2.1
9
1438
100
a A
udito
rs’
duti
es p
erce
ived
by
the
soci
ety
grou
p to
be
perf
orm
ed d
efic
ient
ly.
b R
espo
nsib
ilit
ies
expe
cted
of
audi
tors
by
20%
or
mor
e of
at
leas
t one
soc
iety
gro
up (
audi
tees
, fin
anci
al c
omm
unit
y an
d no
n-fi
nanc
ial c
omm
unit
y au
dit b
enef
icia
ries
).
c E
xist
ing
resp
onsi
bili
ties
def
ined
by
refe
renc
e to
sta
tute
law
, cas
e la
w r
egul
atio
ns a
nd p
rofe
ssio
nal p
rom
ulga
tion
s.
d R
espo
nsib
ilit
ies
whi
ch a
re c
ost-
bene
fici
al f
or a
udit
ors
to p
erfo
rm.
e P
ropo
rtio
n of
the
soci
ety
grou
p (a
udit
ees,
fin
anci
al c
omm
unit
y an
d no
n-fi
nanc
ial c
omm
unit
y au
dit b
enef
icia
ries
) w
hose
exp
ecta
t ion
s w
ith
resp
ect t
o th
e re
spon
sibi
lity
are
not
bei
ng f
ulfi
lled
. f
Rel
ativ
e co
ntri
buti
on o
f re
spon
sibi
liti
es to
the
com
pone
nt.
7%43
%
50%
Soc
iety
’s
perc
epti
on o
f au
dito
rs’
defi
cien
t pe
rfor
man
cea
Figu
re8:
Rel
ativ
eC
ontr
ibut
ion
ofR
espo
nsib
ilit
ies
toC
ompo
nent
san
dC
ompo
nent
sto
the
Aud
itE
xpec
tati
on-P
erfo
rman
ceG
apin
NZ
in20
08.
(Ple
ase
note
:The
key
todu
ties
iden
tifie
dby
num
ber
isA
ppen
dix
1)
Audit Expectation-Performance Gap Revisited 25
Int. J. Audit. ••: ••–•• (2012)© 2012 Blackwell Publishing Ltd

S
ocie
ty’s
A
udit
exp
ecta
tion
-per
form
ance
gap
expe
ctat
ions
of
aud
itor
sb
pags sen elbanosa e
Rpa g
ec namrofr eP
seituD
’sro tid uA
yl ban osae rgn itsixe
du
ties
cdetc epxe
of
audi
tors
d
elbanosaernU
tneicifeD
tne icifeD
snoitat cepxesdradnats
ecnamrofrep
%25%93
%9
Du
ty
Res
pon
se
Con
trib
. D
uty
R
espo
nse
C
ontr
ib.
Du
ty
Res
pon
se
Con
trib
. D
uty
R
espo
nse
C
ontr
ib
%e
%f
%e
%f
%e
%f
%e
%f
† 23
3
13
9 2.
23
53
9 2.
18b
41
5 2.
12a
23
3
100
2.26
ia
51
9 2.
26ib
39
5
2.17
b 21
3
666ai62.2
10
0 2.
2 37
5
2.17
c 21
3
†10
1
2.5b
2316
2.12
c82
142.
11b
537
2.9b
344
2.8b
2215
2.15
a79
132.
25a
496
2.14
b33
42.
8a21
152.
18a
7913
2.7
486
2.9a
273
2.14
a18
122.
27a,
b68
112.
22a
466
2.1
263
2.16
1712
2.12
b64
112.
28a,
b45
62.
11a
253
2.12
d17
122.
1362
102.
445
62.
2125
32.
11c
139
2.5a
539
2.29
a,b
435
2.22
b2.
11c
144
2.15
b36
42.
17a
202
2.19
344
2.25
804
100
a A
udit
ors’
dut
ies
perc
eive
d by
the
soci
ety
grou
p to
be
perf
orm
ed d
efic
ient
ly.
b R
espo
nsib
ilit
ies
expe
cted
of
audi
tors
by
20%
or
mor
e of
at l
east
one
soc
iety
gro
up (
audi
tees
, fin
anci
al c
omm
unit
y an
d no
n-fi
nanc
ial c
omm
unit
y au
dit b
enef
icia
ries
).
c E
xist
ing
resp
onsi
bili
ties
def
ined
by
refe
renc
e to
sta
tute
law
, cas
e la
w r
egul
atio
ns a
nd p
rofe
ssio
nal p
rom
ulga
tion
s.
d R
espo
nsib
ilit
ies
whi
ch a
re c
ost-
bene
fici
al f
or a
udit
ors
to p
erfo
rm.
e P
ropo
rtio
n of
the
soci
ety
grou
p (a
udit
ees,
fin
anci
al c
omm
unit
y an
d no
n-fi
nanc
ial c
omm
unit
y au
dit b
enef
icia
ries
) w
hose
exp
ecta
t ion
s w
ith
resp
ect t
o th
e re
spon
sibi
lity
are
not
bei
ng f
ulfi
lled
. f †
Rel
ativ
e co
ntri
buti
on o
f re
spon
sibi
liti
es to
the
com
pone
nt.
E
xclu
ded
from
the
2008
sur
vey
inst
rum
ent.
The
num
bers
of
subs
eque
nt r
espo
nsib
ilit
ies
have
bee
n ad
just
ed a
ccor
ding
ly, t
o re
flec
t the
ir n
umbe
r in
the
2008
sur
vey.
Soc
iety
’s
perc
epti
on o
f au
dito
rs’
defi
cien
t pe
rfor
man
cea
Figu
re9:
Rel
ativ
eC
ontr
ibut
ion
ofR
espo
nsib
ilit
ies
toC
ompo
nent
san
dof
Com
pone
nts
toth
eA
udit
Exp
ecta
tion
-Per
form
ance
Gap
inU
Kin
1999
.(P
leas
eno
te:T
heke
yto
duti
esid
enti
fied
bynu
mbe
ris
pres
ente
din
App
endi
x1)
26 B. Porter et al.
Int. J. Audit. ••: ••–•• (2012)© 2012 Blackwell Publishing Ltd

Soc
iety
’s
p agecna
m rofrep -no ita tce pxet iduA
expe
ctat
ions
1
of a
udit
orsb
p agss enelb ano sae
Rpa g
ec nam rof re
P
s ei tuD
’s ro tiduA
ylban os a erg nitsi xe
du
ties
cde tcepx e
of
audi
tors
d
e lbanosaernU
tneicifeD
tneici feD
s no it atc ep xesdr adn a ts
e cnamro fr e p D
uty
Res
pon
se
Con
trib
. D
uty
Res
pons
e C
ontr
ib.
Dut
y R
esp
onse
C
ontr
ib.
Dut
y R
espo
nse
Con
trib
%e
%f
%e
%f
%e
%f
%e
%f
2.15
a 9
24
2.18
a 65
13
2.
11b
46
8 2.
21
23
4 2.
12c
8 22
2.
5a
52
11
2.7
40
7 2.
11a
22
4 2.
14a
8 22
2.
12b
49
10
2.26
ia
36
6 2.
19
22
4 2.
8a
6 16
2.
29a
47
10
2.18
b 35
6
2.28
b 20
4
2.8b
6
16
2.23
44
9
2.15
b 33
6
2.27
b 19
3
2.11
d 4
16
2.25
a 44
9
2.22
33
6
2.29
b 19
3
4
1 10
0 2.
30b
43
9 2.
26ib
32
6
2.9a
17
3
2.
26ii
a 41
9
2.4
31
6
2.12
a 17
3
2.
28a
30
6 2.
14b
31
6 2.
1 16
3
415
100
2.9b
26
5
2.20
16
3755
432
`2.2
10
0
a A
udito
rs’
duti
es p
erce
ived
by
the
soci
ety
grou
p to
be
perf
orm
ed d
efic
ient
ly.
b R
espo
nsib
ilit
ies
expe
cted
of
audi
tors
by
20%
or
mor
e of
at l
east
one
soc
iety
gro
up (
audi
tees
, fin
anci
al c
omm
unit
y an
d no
n-fi
nanc
ial c
omm
unit
y au
dit b
enef
icia
ries
).
c E
xist
ing
resp
onsi
bili
ties
def
ined
by
refe
renc
e to
sta
tute
law
, cas
e la
w r
egul
atio
ns a
nd p
rofe
ssio
nal p
rom
ulga
tion
s.
d R
espo
nsib
ilit
ies
whi
ch a
re c
ost-
bene
fici
al f
or a
udit
ors
to p
erfo
rm.
e P
ropo
rtio
n of
the
soci
ety
grou
p (a
udit
ees,
fin
anci
al c
omm
unit
y an
d no
n-fi
nanc
ial c
omm
unit
y au
dit b
enef
icia
ries
) w
hose
exp
ecta
tion
s w
ith
resp
ect t
o th
e re
spon
sibi
lity
are
not
bei
ng f
ulfi
lled
. f
Rel
ativ
e co
ntri
buti
on o
f re
spon
sibi
liti
es to
the
com
pone
nt.
4%41
%
55%
Soc
iety
’s
perc
epti
on o
f au
dito
rs’
defi
cien
t pe
rfor
man
cea
Figu
re10
:Rel
ativ
eC
ontr
ibut
ion
ofR
espo
nsib
ilit
ies
toC
ompo
nent
san
dC
ompo
nent
sto
the
Aud
itE
xpec
tati
on-P
erfo
rman
ceG
apin
the
UK
in20
08.
(Ple
ase
note
:The
key
todu
ties
iden
tifie
dby
num
ber
ispr
esen
ted
inA
ppen
dix
1)
Audit Expectation-Performance Gap Revisited 27
Int. J. Audit. ••: ••–•• (2012)© 2012 Blackwell Publishing Ltd

NOTES
1. In this paper, ‘society’ means the populationat large, inclusive of auditees and auditbeneficiaries but exclusive of auditors; thatis, all non-auditors. This accords with themeaning ascribed to the word by the CohenCommission (Commission on Auditors’Responsibilities, 1978).
2. Traditionally, the gap has been termed the‘audit expectation(s) gap’ and defined as thegap between the responsibilities societyexpects auditors to perform and those auditorsacknowledge as theirs. However, recognisingthat society’s perception of sub-standardperformance by auditors contributes to thecriticism of, and a loss of confidence in,auditors, Porter (1993) adopted the term ‘auditexpectation-performance gap’. In this paper theterms are used interchangeably.
3. Further details of prior expectation gap studiesare provided in Part 1 of this paper.
4. Due to differences between auditors’responsibilities in the UK and NZ (resultingfrom differences in the countries’ StockExchange’s corporate governancerequirements), in 1999 and 2008 two fewersuggested responsibilities were included inthe NZ, than in the UK, version of thequestionnaire. In 1999 and 2008, the NZ versionincluded 49 and 53 suggested responsibilities,respectively, compared with 51 and 55 in the UKversion.
5. Eleven additional responsibilities in NZ – seenote 4.
6. As a result of discussions with senior auditingpractitioners in the UK and NZ, and a reviewof the 1999 survey results, the suggestedresponsibilities: ‘to audit quarterly financialstatements’ (2.22b) and ‘to verify everytransaction of the auditee’ (2.25), were omittedfrom the 2008 questionnaire (see Appendix 1).
7. The means by which the components of theaudit expectation-performance gap have beenidentified is explained in Part 1 of this paper.
8. For ease of reference, the suggestedresponsibilities of auditors are identified in thispaper by the number they were assigned inthe survey instrument. They are presented innumerical order in Appendix 1.
9. The 1989 questionnaire included the suggestedresponsibility: ‘to disclose in the audit reporttheft of company assets by non-managerial
employees detected during the audit’. As aresult of increased societal concern aboutcorporate fraud and emphasis by politiciansand the media on auditors’ role in detectingand reporting it (Porter, 1997), the 1999questionnaire distinguished between minorand material theft of auditee assets. In 1989,the suggested responsibility contributed to thereasonableness gap in NZ; in 1999 ‘reportingminor theft of company assets by non-managerial employees detected during theaudit’ (2.12a) was an element of thereasonableness gap in both NZ and the UK,but ‘reporting material theft of company assetsby non-managerial employees’ (2.12b)contributed to the deficient standards gap inboth countries.
10. The 1989 questionnaire included the suggestedresponsibility: ‘to examine and report in theaudit report on the reliability of non-financialinformation provided in the company’s annualreport’. In 1999, as a result of increased societalawareness of, and concern about, companies’environmental and social impact, responsibility2.17 was replaced by the responsibilities: ‘toexamine and report in the audit report on thereliability of information in the company’sannual report about its policy and record inrespect of equal employment (2.17a), productsafety (2.17b) and occupational health andsafety’ (2.17c). Additionally, ‘to examine andreport on the reliability of information in thecompany’s annual report about its directors’remuneration’ (2.17d) was included to reflect arelated change in legislation in the UK. In 1999,2.17d was a responsibility of auditors in the UKbut contributed to the deficient standards gapin NZ.
11. These nine responsibilities also featured in thereasonableness gap in NZ and the UK in 2008and are discussed in detail in Part 1 of thispaper.
12. As explained in Part 1 of this paper, theresponsibilities constituting ‘society’sexpectations of auditors’ (the right boundaryof the audit expectation gap) are those thatwere identified by 20 per cent or more of anon-auditor interest group as responsibilitiesauditors should perform.
13. The Carbon Disclosure Project (CDP) waslaunched in 2002 as an independent non-profitorganisation centred in the UK. It seeks toprovide information to 315 major institutional
28 B. Porter et al.
Int. J. Audit. ••: ••–•• (2012)© 2012 Blackwell Publishing Ltd

shareholders around the world (which managetotal assets of US$41 trillion). On behalf of theseinstitutional investors, CDP seeks informationfrom the world’s largest companies (2,400 in2007) about the commercial risks they facefrom, and opportunities presented by, climatechange and greenhouse gas emissions (CDP,2007).
14. In 2008, responsibility 2.27a was an existingresponsibility of auditors in both NZ and theUK and is discussed in Section 3.3 below.Responsibility 2.28a contributed to thedeficient standards gap in the UK, and 2.29afeatured in the deficient standards gap in bothNZ and the UK; these responsibilities arediscussed further in Section 3.2.
15. In 1999, all of the NZ respondents whoindicated that auditors should/should notperform suggested responsibilities 2.26a and2.26b gave identical responses for both. Inorder to avoid double counting, their responsesto the broader responsibility (i.e., 2.26a) werecounted but those to the narrowerresponsibility (2.26b) were not.
16. The information embraced by suggestedresponsibilities 2.17a, 2.17b, 2.17c, 2.24a, 2.24band 2.24b is likely to be provided, to an extent,within companies’ annual reports. In the UK,quoted companies are required by theCompanies Act 2006, s.417, to includeenvironmental and social information in thebusiness review section of their directors’reports.
17. Calculation of the measure of society’sunfulfilled expectations of auditors isexplained in Part 1 of this paper.
18. This suggested responsibility, and itscontribution to the deficient standards gapin NZ and the UK in 2008, is discussed ingreater detail in Section 4.4 of Part 1 of thispaper.
19. Details of the authority (statute or case law, orauditing standards) for classifying suggestedresponsibilities included in the questionnaireas actual responsibilities of auditors can beobtained from the first named author of thispaper.
20. As indicated in ISA (UK & Ireland) 250, sectionA footnote 15, responsibility 2.13 is aresponsibility of UK auditors by virtue ofanti-money-laundering legislation.
21. While auditors in the UK are required to reportto an appropriate authority untoward matters
uncovered during an audit when it is in thepublic interest to do so, auditors in NZare required to maintain their duty ofconfidentiality to the client.
22. Given enactment of the Sarbanes-Oxley Act in2002 and the emphasis placed on theimportance of internal controls in the FRC’sCombined Code of Corporate Governance(FRC, 2003, 2006, 2008), the decrease in theproportion of the UK’s society group whosignified that they expect auditors to‘report in the audit report on theeffectiveness of the company’s internalfinancial controls’ (2.18a) from 79 per cent in1999 to 65 per cent in 2008 (see Figures 9 and10) is surprising.
23. As explained in Part 1 of this paper, the ‘societygroup’ is represented by the combinedresponses of the non-auditor interest groups(auditees and financial and non-financialcommunity audit beneficiaries). In order toeliminate the effect of differing sample sizes,the average of the proportion of each of theinterest groups who indicated that auditorsperform a responsibility well, adequately orpoorly (as applicable), has been accepted asrepresenting the opinion of the society group.The means by which ‘satisfactory’ and‘deficient’ performance have been identified isexplained in Part 1 of this paper.
24. It is pertinent to note that, with enactment inNZ of the Auditor Regulation Act 2011, theregulation of company auditors in NZ and themonitoring of their performance will from July2012 be more akin to the regulatory systemoperating in the UK.
25. In general, all company auditors in the UKmust be registered with one of the five RSBs:the Institutes of Chartered Accountants inEngland and Wales, of Scotland, and in Ireland,and the Associations of Certified CharteredAccountants and Authorised PublicAccountants.
26. The AIU is a component of the PublicOversight Board of the FRC.
27. This development is discussed in detail in Part1 of this paper.
REFERENCES
Auditing Practices Board (2008), InternationalStandard on Auditing (UK and Ireland) 250 Section
Audit Expectation-Performance Gap Revisited 29
Int. J. Audit. ••: ••–•• (2012)© 2012 Blackwell Publishing Ltd

A: Consideration of laws and regulations in an audit offinancial statements. London: Financial ReportingCouncil.
Audit Quality Forum (AQF) (2007), Fundamentals –Auditor Reporting (Report of the Working Groupon Auditor Reporting). London: Institute ofChartered Accountants in England and Wales(ICAEW).
Carbon Disclosure Project (CDP) (2007), CarbonDisclosure Project: About the Carbon DisclosureProject. Available at: www.cdproject.net.
Carty, J. (1985), Fraud and other irregularities.Certified Accountant, September, p. 30.
Chandler, R. & Edwards, J. R. (1996), ‘Recurring issuesin auditing: back to the future?’ Accounting,Auditing & Accountability Journal, Vol. 9, No. 2, pp.4–29.
Christodoulou, M. (2010), Small firms threatenedwith licence reform. Accountancy Age, 7 October.Available at: www.accountancyage.com/print_article/aa/analysis/1808542/small-firms-threatened-licence-reform (accessed 8October 2010).
Commission on Auditors’ Responsibilities (CohenCommission) (1978), Report, conclusions andrecommendations, New York: American Institute ofCertified Public Accountants.
Committee on Corporate Governance (HampelCommittee) (1998a), Final Report of the Committee onCorporate Governance. London: The London StockExchange.
Committee on Corporate Governance (1998b), TheCombined Code. London: The London StockExchange.
Committee on the Financial Aspects of CorporateGovernance (CFACG) (1992), Report of the committeeof the financial aspects of corporate governance(Cadbury Committee). London: Gee and Co. Ltd.
Eccles, R. G., Herz, E., Keegan, M. & Phillips, D. M. H.(2001), The Value Reporting Revolution. London: JohnWiley & Sons.
European Commission (2005), European CommissionClimate Action: Emissions Trading Scheme (EU ETS).Available at: http://ec.europa.er/clima/policies/ets.
Financial Reporting Council (FRC) (2003), TheCombined Code on Corporate Governance. London:FRC.
Financial Reporting Council (FRC) (2006), TheCombined Code on Corporate Governance. London:FRC.
Financial Reporting Council (FRC) (2008), TheCombined Code on Corporate Governance. London:FRC.
Humphrey, C. G., Moizer, P. & Turley, S. (1993), ‘Theaudit expectations gap in Britain: an empiricalinvestigation’, Accounting and Business Research, Vol.23, No. 91A, pp. 395–411.
International Auditing and Assurance Board (IAASB)(2007), International Standards on Auditing (ISA)260: Communication with those charged with
governance: New York: International Federation ofAccountants.
International Auditing and Assurance Board (IAASB)(2010), IAASB Clarity Center: The Clarified Standards.Available at: www.ifac.org/clarity-center/the-clarified-standards.
Lee, T. A. (1970), ‘The nature of auditing and itsobjectives’, Accountancy, Vol. 81, No. 920, pp. 292–6.
Limperg, T. (1932), The social responsibility of theauditor, reproduced in Limperg Instituut, (1985).The Netherlands: Limperg Institute.
National Commission on Fraudulent FinancialReporting (Treadway Commission) (1987), Reportof the National Commission on Fraudulent FinancialReporting. New York: American Institute ofCertified Public Accountants.
New Zealand Institute of Chartered Accountants(NZICA) (2004), New Zealand Equivalent toInternational Accounting Standard 24 Related PartyDisclosures NZ (IAS 24). Wellington: NZICA.
New Zealand Securities Commission (NZSC) (2004),Corporate Governance in New Zealand Principles andGuidelines. Wellington: Securities Commission.
NZX (2003), NZX Corporate Governance Best PracticeCode. Wellington: NZX.
Porter, B. A. (1993), ‘An empirical study of the auditexpectation-performance gap’, Accounting andBusiness Research, Vol. 24, No. 93, pp. 49–68.
Porter, B. A. (1997), ‘Auditors’ responsibilities withrespect to corporate fraud – a controversial issue’, inSherer, M. and Turley, S. (eds), Current Issues inAuditing, 3rd edn. London: Paul Chapman.
Porter, B. A. (2009), ‘The audit trinity: the key tosecuring corporate accountability’, ManagerialAuditing Journal, Vol. 24, No. 2, pp. 156–82.
Porter, B. A. & Gowthorpe, C. (2004), Auditexpectation-performance gap in the United Kingdom in1999 and comparison with the gap in New Zealand in1989 and 1999. Edinburgh: Institute of CharteredAccountants of Scotland.
Porter, B., Simon J. & Hatherly, D. (2008), Principles ofExternal Auditing, 3rd edn. Chichester: John Wileyand Sons.
Russell, G. (1986), ‘All eyes on accountants’, Time, 21April, p. 58.
Study Group on Directors’ Remuneration (GreenburyCommittee) (1995), Report of the Study Group onDirectors’ Remuneration. London: Gee.
Turner, L. E. (2000), Remarks to the Panel on AuditEffectiveness, 10 July. New York.
Walker, R. H. (1999), Behind the Numbers of the SEC’sRecent Financial Fraud Cases. Speech, 27th NationalAmerican Institute of Certified Public Accountants’Conference on Current SEC Developments, 7December.
AUTHOR PROFILES
Brenda Porter is currently Visiting Professor,teaching auditing, at Exeter University in the UK,
30 B. Porter et al.
Int. J. Audit. ••: ••–•• (2012)© 2012 Blackwell Publishing Ltd

in the Spring semester, and at ChulalongkornUniversity, Bangkok, during the Fall semester. Sherecently retired as Professor and Head of theSchool of Accounting and Commercial Law atVictoria University of Wellington, New Zealand.She is a qualified accountant and holds a PhD fromMassey University, New Zealand. Her mainresearch interests are the role of external auditorsin society; the audit expectation-performance gap;and the role of ‘the audit trinity’ (internal auditors,external auditors and audit committees) in securingresponsible corporate governance. She haspublished widely in many business, professionaland academic journals including, for example,Accounting and Business Research, Accounting,Auditing, and Accountability Journal, FinancialAccountability and Management and Issues inAccounting Education. She is also co-author ofPrinciples of External Auditing (John Wiley & Sons).
Ciarán Ó hÓgartaigh is Professor of Accountingat University College Dublin and Dean of the UCDSchool of Business, encompassing the UCDMichael Smurfit Graduate School of Business andUCD Quinn School of Business. He is a graduate of
the National University of Ireland, Galway and aChartered Accountant. He holds a PhD from theUniversity of Leeds. His major research interestsinclude the framing of financial reporting andother annual report disclosures. He has publishedwidely in this area in, for example, BehavioralResearch in Accounting, British Accounting Review,Critical Perspectives on Accounting and Journal ofBusiness Research.
Rachel Baskerville has been a Professor ofAccounting at Victoria University of Wellington(VUW), New Zealand, since 2010, and HonoraryFellow of the University of Exeter. She is involvedin teaching financial accounting and reporting atthe second year undergraduate level, current issuesin financial reporting in a post-graduate offering,and supervising PhD and Masters projects. Hercurrent research projects include ‘Limits ofTranslatability: the case of international accountingand auditing standards’, with Professor Lisa Evans(Stirling University). She is also undertakingresearch on ‘Financing Sports Organisations inNew Zealand: the impact of governors’ choices’,with Dr Carolyn Cordery (VUW).
Audit Expectation-Performance Gap Revisited 31
Int. J. Audit. ••: ••–•• (2012)© 2012 Blackwell Publishing Ltd

APPENDIX 1: Suggested Responsibilities Included in the Questionnaire: NZ 1989–2008;UK 1999 and 2008
Resp No. Suggested responsibilities of auditorsa 1989 1999 2008
2.1 Prepare the client’s financial statements √ √ √
2.2 Guarantee the client’s financial statements are accurate √ √ √
2.3 State whether the client’s financial statements fairly reflect its financial affairs √ √ √
2.4 Guarantee a client (with a ‘clean’ audit report) is financially sound √ √ √
2.5a Report to an appropriate authority (e.g. FSA or DBERR) doubts about the client’s continuedexistence
√ √ √
2.5b Disclose in the audit report doubts about the client’s continued existence. √ √ √
2.6 Ensure compliance with the disclosure requirements of the Cos Acts √ √ √
2.7 Report breaches of tax law to HM Revenue & Customs √ √ √
2.8a Detect the theft of a material amount (e.g. >5% of turnover or total assets) of the client’s assetsby non-managerial employees
√ √ √
2.8b Detect the theft of a material amount (e.g. >5% of turnover or total assets) of the client’s assetsby the directors/senior management
√ √ √
2.9a Detect minor (but not petty) theft of the client’s assets by non-managerial employees – ** √
2.9b Detect minor (but not petty) theft of the client’s assets by the directors/senior management – ** √
2.10 Detect deliberate distortion of the client’s financial statements √ √ √
2.11a In the absence of a regulated industry duty, report to an appropriate authority (e.g. police, FSAor DBERR), minor (but not petty) theft of the client’s assets by non-managerial employees
– ** √
2.11b In the absence of a regulated industry duty, report to an appropriate authority (e.g. police, FSAor DBERR), theft of a material amount of the client’s assets by non-managerial employees
√ √ √
2.11c In the absence of a regulated industry duty, report to an appropriate authority (e.g. police, FSAor DBERR), embezzlement of the client’s assets by the directors/senior management
√ √ √
2.11d In absence of regulated industry duty, report to an appropriate authority (e.g. police, FSA orDBERR), deliberate distortion of the client’s financial statements
√ √ √
2.12a Disclose in the audit report minor (but not petty) theft of the client’s assets by non-managerialemployees
– ** √
2.12b Disclose in the audit report theft of a material amount of the client’s assets by non-managerialemployees
√ √ √
2.12c Disclose in the audit report embezzlement of the client’s assets by the directors/seniormanagement
√ √ √
2.12d Disclose in the audit report deliberate distortion of the client’s financial statements √ √ √
2.13 In absence of a regulated industry duty, report to an appropriate authority (e.g. police, FSA orDBERR) suspicions of theft or deliberate distortion of the client’s financial statements
√ √ √
2.14a Detect illegal acts by the client’s directors/senior management which directly impact on theclient’s financial statements (e.g. political payoffs)
√ √ √
2.14b Detect illegal acts by the client’s directors/senior management which only indirectly impact onthe client’s financial statements (e.g. breaches of environmental laws and regulations)
√ √ √
2.15a Disclose in the audit report illegal acts by the client’s directors/senior management whichdirectly impact on the client’s financial statements
√ √ √
2.15b Disclose in the audit report illegal acts by the client’s directors/senior management which onlyindirectly impact on the client’s financial statements (e.g. breaches of environmental laws)
√ √ √
2.16 In the absence of a regulated industry duty, report to an appropriate authority (e.g. police, FSAor DBERR) illegal acts by the client’s directors/managements
√ √ √
2.17a Examine and report (in the audit report) on reliability of information in the client’s annual reportabout its equal employment opportunities policy and record
√b √ √
2.17b Examine and report (in the audit report) on the reliability of information in the client’s annualreport about its product safety policy and record
** √
2.17c Examine and report (in the audit report) on the reliability of information in the client’s annualreport about its occupational health and safety policy and record
** √
2.17d Examine and report (in the audit report) on the reliability of information in the client’s annualreport about its directors’ remuneration
** √
2.18a Examine and report (in the audit report) on the effectiveness of the client’s internal financialcontrols
√ √ √
32 B. Porter et al.
Int. J. Audit. ••: ••–•• (2012)© 2012 Blackwell Publishing Ltd

APPENDIX 1: ContinuedResp No. Suggested responsibilities of auditorsa 1989 1999 2008
2.18b Examine and report (in the audit report) on the effectiveness of the client’s operating systems andinternal non-financial controls
– ** √
2.19 Examine and report (in the audit report) on the client’s IT systems – ††† √
2.20 Examine and report (in the audit report) on the client’s non-financial performance – ††† √
2.21 Examine and report (in the audit report) on the efficiency and effectiveness of the client’smanagement and administration
√ √ √
2.22a Audit half-yearly published financial statements √ √ √
2.22b Audit quarterly published financial statements – ††† –
2.23 Examine and report (in the audit report) on the reasonableness of financial forecasts included in theclient’s annual report
√ √ √
2.24a Consider and report (in the audit report) on the client’s impact on its local community √ √ √
2.24b Consider and report (in the audit report) on the client’s impact on its environment (other than itscarbon footprint)c
– ††† √
2.24c Consider and report (in the audit report) on the client’s carbon footprint – – **
2.25 Verify every transaction of the auditee √ √ –
2.25a Examine and report (in the audit report) on the reliability of information in the client’s entireannual report
– ††† √
2.25b Examine and report (in the audit report) on information in the client’s annual report which isinconsistent with its financial statements
– ††† √
2.26ia For listed company clients, examine compliance with all of the Stock Exchange’s corporategovernance requirements and report (in the audit report) on compliance therewith
– ††† √
2.26ib For listed company clients, examine compliance with all of the Stock Exchange’s corporategovernance requirements and report (in the audit report) instances of non-compliance
– ††† √
2.26iia† For listed company clients, examine compliance with a specified set of the Stock Exchange’scorporate governance requirements and report (in the audit report) on compliance therewith
– ††† √
2.26iib† For listed company clients, examine compliance with a specified set of the Stock Exchange’scorporate governance requirements and report (in the audit report) instances of non-compliance
– ††† √
2.27a Examine and report to the client’s directors (or audit committee) on the adequacy of the client’sprocedures for identifying financial risks (e.g. credit, interest rate, foreign exchange & liquidityrisks)
– ††† √
2.27b Examine and report to the client’s directors (or audit committee) on the adequacy of procedures foridentifying operational risks (e.g. machinery breakdown, entering new markets, materials orlabour shortages)
– **
2.28a Examine and report (in the audit report) on the adequacy of the client’s procedures for identifyingfinancial risks (e.g. credit, interest rate, foreign exchange risks)
– ††† √
2.28b Examine and report (in the audit report) on the adequacy of the client’s procedures for identifyingoperational risks (e.g. machinery breakdown, labour shortages)
– **
2.29a Examine and report (in an attached audit report) on the reliability of information provided on theInternet by the client in its audited financial statements
– ††† √
2.29b Examine and report (in an attached audit report) on the reliability of financial information (otherthan in its audited financial statements) posted on Internet by client
– **
2.30a Report to the directors (or audit committee) significant difficulties encountered during the audit(e.g. disagreements with senior managers re financial reporting matters)
– – †††
2.30b Report in the audit report significant difficulties encountered during the audit (e.g. disagreementswith senior managers about financial reporting matters)
– – †††
Total number of suggested responsibilities in questionnaire 30 51 55
Number of additional suggested responsibilities due to expressing responsibilities in greater detail – 8 4
Number of additional suggested responsibilities which reflect ‘new’ issues – 13 2a The suggested responsibilities presented here are abbreviated from their expression in the questionnaire.b In 1989 suggested responsibility 2.17 was expressed as: ‘Examine and report (in the audit report) on the reliability of non-financial information presented in the
client’s annual report’.c Reference to the client’s carbon footprint was introduced in the 2008 questionnaire.
† Not included in the NZ version of the questionnaire. In the NZ questionnaire, 26ia and 26ib were numbered 26a and 26b, respectively. In 1999 and 2008 the NZversion of the questionnaire included two less responsibilities than indicated (49 and 53, respectively).
√ Responsibility included in the questionnaire in its original form (except for responsibility 2.17: see above).
** Suggested responsibilities which were expressed in greater detail than in the previous questionnaire.††† Suggested responsibility was included in the previous questionnaire (reflects ‘new’ issues).
Audit Expectation-Performance Gap Revisited 33
Int. J. Audit. ••: ••–•• (2012)© 2012 Blackwell Publishing Ltd