audit report - lg chem, ltd
TRANSCRIPT

LG Chem, Ltd.Separate Financial StatementsDecember 31, 2010 and 2009

LG Chem, Ltd.IndexDecember 31, 2010 and 2009
Page(s)
Report of Independent Auditors ............................................................................................... 1 - 2
Separate Financial Statements
Statements of Financial Position .................................................................................................. 3 - 4
Statements of Income......................................................................................................................... 5
Statements of Comprehensive Income .............................................................................................. 6
Statements of Changes in Shareholders’ Equity ................................................................................ 7
Statements of Cash Flows ................................................................................................................ 8
Notes to the Separate Financial Statements .............................................................................. 9 - 45
Report of Independent Accountants' Review of Internal Accounting Control System ....... 46 - 47
Report on the Operations of Internal Accounting Control System .............................................. 48

LS Yongsan Tower, 191, Hangangno 2-ga, Yongsan-gu, Seoul 140-702, Korea (Yongsan P.O Box 266, 140-600) www.samil.com
Samil PricewaterhuseCoopers is the Korean network firm of PricewaterhouseCoopers International Limited (PwCIL). "PricewaterhouseCoopers" and "PwC"refer to the network of member firms of PwCIL. Each member firm is a separate legal entity and does not act as an agent of PwCIL or any other member firm.
Report of Independent Auditors
To the Board of Directors and Shareholders ofLG Chem, Ltd.
We have audited the accompanying separate statements of financial position of LG Chem, Ltd. (the“Company”) as of December 31, 2010 and 2009, and the related separate statements of income,comprehensive income, changes in shareholders’ equity and cash flows for the years then ended,expressed in Korean won. These financial statements are the responsibility of the Company’smanagement. Our responsibility is to express an opinion on these financial statements based on ouraudits.
We conducted our audits in conformity with auditing standards generally accepted in the Republic ofKorea. Those standards require that we plan and perform the audit to obtain reasonable assurance aboutwhether the financial statements are free of material misstatement. An audit includes examining, on a testbasis, evidence supporting the amounts and disclosures in the financial statements. An audit alsoincludes assessing the accounting principles used and significant estimates made by management, aswell as evaluating the overall financial statement presentation. We believe that our audits provide areasonable basis for our opinion.
In our opinion, based on our audits, the separate financial statements referred to above present fairly, inall material respects, the financial position of LG Chem, Ltd. as of December 31, 2010 and 2009, and theresults of its operations and cash flows for the years then ended in conformity with international financialreporting standards as adopted by the Republic of Korea (“Korean IFRS”).

Auditing standards and their application in practice vary among countries. The procedures and practicesused in the Republic of Korea to audit such financial statements may differ from those generally acceptedand applied in other countries. Accordingly, this report is for use by those who are informed about Koreanauditing standards and their application in practice.
Acoa Mczak useL ear
Seoul, KoreaMarch 10, 2011
This report is effective as of March 10, 2011, the audit report date. Certain subsequent events orcircumstances, which may occur between the audit report date and the time of reading this report,could have a material impact on the accompanying separate financial statements and notes thereto.Accordingly, the readers of the audit report should understand that there is a possibility that the aboveaudit report may have to be revised to reflect the impact of such subsequent events or circumstances,if any.
2

LG Chem, Ltd.Separate Statements of Financial Position
December 31, 2010 and 2009, and January 1, 2009
(in millions of Korean won)Notes
December 31,
2010
December 31,
2009
January 1,
2009
Assets
Current assets
Cash and cash equivalents 3, 4 1,130,818 862,585 373,300
Trade receivables 3, 5, 27 2,173,032 2,177,103 1,942,277
Other receivables 3, 5 105,311 154,034 215,393
Other financial assets 3, 6 2,194 378 -
Other current assets 13 69,077 59,588 61,286
Inventories 9 1,731,344 1,340,931 1,508,938
Total current assets 5,211,776 4,594,619 4,101,194
Non-current assets
Trade receivables 3, 5 - 40 130
Other receivables 3, 5 14,189 17,227 31,554
Other financial assets 3, 6 4,044 22,041 53,812
Investments in subsidiaries 10 780,667 575,762 616,164
Investments in associates 10 154,593 202,960 184,625
Deferred income tax assets 25 - - 34,857
Property, plant and equipment 11 4,672,081 3,860,280 3,867,666
Intangible assets 12 167,696 150,440 179,704
Other non-current assets 13 9,563 11,369 21,097
Total non-current assets 5,802,833 4,840,119 4,989,609
Total assets 11,014,609 9,434,738 9,090,803
Liabilities and equity
Liabilities
Current liabilities
Trade payables 3, 27 973,413 868,232 527,150
Other payables 3, 27 840,920 680,917 620,307
Borrowings 3, 14 1,061,723 1,404,000 1,394,058
Other financial liabilities 3 20,535 39 -
Provisions 15 4,906 5,304 -
Current income tax liabilities 25 363,775 185,975 367,620
Other current liabilities 17 71,037 69,926 72,105
Total current liabilities 3,336,309 3,214,393 2,981,240
Non-current liabilities
Other payables 3, 27 47,181 28,991 5,864
Borrowings 3, 14 215,712 404,239 819,944
Other financial liabilities 3 - 35,024 26,961
Defined benefit liability 16 6,056 53,261 65,372
Deferred income tax liabilities 25 12,847 3,594 -
Total non-current liabilities 281,796 525,109 918,141
Total liabilities 3,618,105 3,739,502 3,899,381
3

LG Chem, Ltd.Separate Statements of Financial Position
December 31, 2010 and 2009, and January 1, 2009
(in millions of Korean won)Notes
December 31,
2010
December 31,
2009
January 1,
2009
Equity
Share capital 1 369,500 369,500 419,500
Capital surplus 1,157,572 1,157,572 1,314,549
Other components of equity (15,484) (479,756) (14,600)
(3,216) (7,318) (16,053)
Retained earnings 5,888,132 4,655,238 3,488,026
Total equity 7,396,504 5,695,236 5,191,422
Total liabilities and equity 11,014,609 9,434,738 9,090,803
The accompanying notes are an integral part of these separate financial statements.
Accumulated other comprehensiveincome (expense)
4

LG Chem, Ltd.Separate Statements of Income
Years Ended December 31, 2010 and 2009
(in millions of Korean won, except per share amounts) Notes 2010 2009
Revenue 27 16,850,454 13,694,516
Cost of sales 20, 27 (13,353,672) (10,866,711)
Gross profit 3,496,782 2,827,805
Selling, general and administrative expenses 19, 20, 27 (981,230) (866,301)
Other operating income 22 404,376 502,334
Other operating expenses 20, 23 (423,684) (609,357)
Operating profit 2,496,244 1,854,481
Non-operating income and expenses
Financial income 24 185,429 188,330
Financial expenses 24 (151,592) (205,106)
Other non-operating expenses (12,285) (10,943)
21,552 (27,719)
Profit before Income tax 2,517,796 1,826,762
Income tax expense 25 (546,803) (412,377)
Profit from continuing operations 1,970,993 1,414,385
Loss from discontinued operations - (29,913)
Profit for the year 1,970,993 1,384,472
Earnings per share for profit during the year
(in won) 26
Earnings per share for profit attributable to
the ordinary equity holders of the Company
Basic and diluted earnings per share
for profit from continuing operations 26,798 18,607
Basic and diluted earnings per share
for profit for the year 26,798 18,213
Earnings per share for profit attributable to
the preferred equity holders of the Company
Basic and diluted earnings per share
for profit from continuing operations 26,848 18,655
Basic and diluted earnings per share
for profit for the year 26,848 18,261
The accompanying notes are an integral part of these separate financial statements.
5

LG Chem, Ltd.Separate Statements of Comprehensive Income
Years Ended December 31, 2010 and 2009
(in millions of Korean won) Notes 2010 2009
Profit for the year 1,970,993 1,384,472
Other comprehensive income
Actuarial loss on defined benefit liability 16 (17,771) (10,272)
Cash flow hedges 5,411 12,488
Income tax effect relating to components of
other comprehensive income 387 (1,539)
Other comprehensive income
for the year, net of tax (11,973) 677
Total comprehensive income for the year 1,959,020 1,385,149
The accompanying notes are an integral part of these separate financial statements.
6

LG Chem, Ltd.Separate Statements of Changes in Shareholders' Equity
Years Ended December 31, 2010 and 2009
(in millions of Korean won) Notes
Balance at January 1, 2009 419,500 1,314,549 (14,600) (16,053) 3,488,026 5,191,422
Comprehensive income:
Profit for the year - - - - 1,384,472 1,384,472
Actuarial loss on defined benefit liability 16 - - - - (8,058) (8,058)
Cash flow hedges - - - 8,735 - 8,735
Total comprehensive income - - - 8,735 1,376,414 1,385,149
Transactions with owners:
Fair value of non-cash assets
distributed due to spin-off (50,000) (154,800) (464,272) - - (669,072)
Purchase of treasury shares - - (2,293) - - (2,293)
Disposal of treasury shares - - 1,785 - - 1,785
Dividends - - - - (209,202) (209,202)
Others - (2,177) (376) - - (2,553)
Total transactions with owners (50,000) (156,977) (465,156) - (209,202) (881,335)
Balance at December 31, 2009 369,500 1,157,572 (479,756) (7,318) 4,655,238 5,695,236
Balance at January 1, 2010 369,500 1,157,572 (479,756) (7,318) 4,655,238 5,695,236
Comprehensive income:
Profit for the year - - - - 1,970,993 1,970,993
Actuarial loss on defined benefit liability 16 - - - - (16,075) (16,075)
Cash flow hedges - - - 4,102 - 4,102
Total comprehensive income - - - 4,102 1,954,918 1,959,020
Transactions with owners:
Loss on capital reduction - - 464,272 - (464,272) -
Dividends - - - - (257,752) (257,752)
Total transactions with owners - - 464,272 - (722,024) (257,752)
Balance at December 31, 2010 369,500 1,157,572 (15,484) (3,216) 5,888,132 7,396,504
Other
Accumulated
The accompanying notes are an integral part of these separate financial statements.
Total
equity
comprehensive
other
income (expense)
Retained
earnings
Share
capital
Capital
surplus
components
of equity
7

LG Chem, Ltd.Separate Statements of Cash Flows
Years Ended December 31, 2010 and 2009
(in millions of Korean won) Notes 2010 2009
Cash flows from operating activities
Cash generated from operations 29 2,757,457 2,473,941
Interest received 23,277 22,734
Interest paid (50,287) (87,733)
Dividends 73,818 8,347
Income taxes paid (359,364) (565,513)
Net cash generated from operating activities 2,444,901 1,851,776
Cash flows from investing activities
Decrease in other receivables 200,000 148,300
Decrease in non-current other receivables 5,851 273
Decrease in non-current other financial assets 7 6,078
Proceeds from disposal of property, plant and equipment 329 11,549
Proceeds from disposal of intangible assets 182 -
Increase in other receivables (105,000) (100,000)
Increase in non-current other receivables (9,960) -
Increase in non-current other financial assets (7) (2,959)
Acquisition of investments in subsidiaries (142,328) (56,181)
Acquisition of investments in associates (14,210) (18,823)
Purchases of property, plant and equipment (1,321,915) (942,753)
Purchases of intangible assets (23,890) (15,811)
Net cash used in investing activities (1,410,941) (970,327)
Cash flows from financing activities
Proceeds from borrowings - 429,090
Proceeds from settlement of derivatives - 28,442
Repayments of borrowings (506,735) (423,593)
Purchase of treasury shares - (2,293)
Dividends (257,771) (209,192)
Net cash used in financing activities (764,506) (177,546)
Cash flows from spin-off - (214,015)
Net increase in cash and cash equivalents 269,454 489,888
Cash and cash equivalents at beginning of year 862,585 373,300
Exchange losses on cash and cash equivalents (1,221) (603)
Cash and cash equivalents at the end of year 1,130,818 862,585
The accompanying notes are an integral part of these separate financial statements.
8

LG Chem, Ltd.Notes to the Seperate Financial StatementsDecember 31, 2010 and 2009, and January 1, 2009
9
1. General information
The Company was spun off on April 1, 2001, from LG Chem Investment Ltd. (formerly LG Chemical
Ltd.), engaged in the petrochemicals, industrial materials, and information and electronic materials
business. It completed its registration process on April 3, 2001. The Company’s shares have
been listed on the Korea Stock Exchange since April 25, 2001.
The Company merged with LG Daesan Petrochemical Ltd. on January 1, 2006, and with LG
Petrochemical Co., Ltd. on November 1, 2007, and spun off its Industrial Materials segment to LG
Hausys, Ltd. on April 1, 2009.
As of December 31, 2010, the Company has its manufacturing facilities in Yeosu, Cheongju,
Ulsan, Naju, Iksan, Daesan, Ochang and Gimcheon.
The Company is authorized to issue 292 million shares of ordinary shares with par value of ₩5,000
per share. As of December 31, 2010, the Company has issued 66,271,100 ordinary shares
(₩331,356 million) and 7,628,921 preferred shares (₩38,144 million). The largest shareholder of
the Company is LG Corp., which owns 33.53% of the Company’s ordinary shares. Preferred
shareholders have no voting rights but are entitled to receive dividends at a rate 1% more than
those paid to ordinary shareholders.
2. Summary of significant accounting policies
The principal accounting policies applied in the preparation of these financial statements are
summarized below. These policies have been consistently applied to all years presented, unless
otherwise stated.
2. 1 Basis of preparation
The Company has adopted International Financial Reporting Standards as adopted by the Republic
of Korea (“Korean IFRS”) from the annual period beginning on January 1, 2010. Korean IFRS are
the standards, subsequent amendments and related interpretations issued by the International
Accounting Standards Board ("IASB") that have been adopted by the Republic of Korea. The
Company’s transition date to Korean IFRS in accordance with Korean IFRS 1101 is January 1,
2009, and its Korean IFRS adoption date is January 1, 2010. Reconciliations and descriptions of
the effect of the transition from the accounting principles generally accepted in the Republic of
Korean (“K-GAAP”) to Korean IFRS on the Company’s equity, its comprehensive income and cash
flows are provided in Note 30.

LG Chem, Ltd.Notes to the Seperate Financial StatementsDecember 31, 2010 and 2009, and January 1, 2009
10
The accompanying financial statements have been prepared in accordance with the Korean IFRS
standards and interpretations issued and effective at the reporting date, December 31, 2010. The
preparation of financial statements in conformity with Korean IFRS requires the use of certain
critical accounting estimates. It also requires management to exercise judgment in the process of
applying the Company’s accounting policies. The areas involving a higher degree of judgment or
complexity, or areas where assumptions and estimates are significant to the separate financial
statements are disclosed in Note 4 of the consolidated financial statements.
2.2 Investments in subsidiaries, joint venture and associates
The accompanying financial statements are the separate financial statements of the Company
prepared in accordance with Korean IFRS 1027, ‘Consolidated and separate financial statements’.
Investments in subsidiaries, jointly controlled entities and associates are recorded at acquisition
cost based on its direct equity investments. At the date of transition from K-GAAP to Korean IFRS,
the Company has used the K-GAAP carrying amount at the transition date as deemed cost. The
Company recognizes a dividend from a subsidiary, jointly controlled entity or associate in profit or
loss when its right to receive the dividend is established.
2.3 Other significant accounting policies
Please refer to the consolidated financial statements for other significant accounting policies
adopted by the Company.
3. Financial instruments by category
(1) Categorizations of financial instruments are as follows:
(in millions of Korean won) December 31, 2010
Financial assets
Loans and
receivables
Assets at fair
value through
profit or loss
Assets
classified as
available-for-
sale Total
Cash and cash equivalents 1,130,818 - - 1,130,818
Trade receivables 2,173,032 - - 2,173,032
Other receivables 105,311 - - 105,311
Other financial assets - 2,194 - 2,194
Other non-current receivables 14,189 - - 14,189
Other non-current financial
assets - - 4,044 4,044
Total 3,423,350 2,194 4,044 3,429,588

LG Chem, Ltd.Notes to the Seperate Financial StatementsDecember 31, 2010 and 2009, and January 1, 2009
11
(in millions of Korean won) December 31, 2010
Financial liabilities
Hedging
derivatives
Liabilities at
amortized cost Total
Trade payables - 973,413 973,413
Other payables - 840,920 840,920
Borrowings (current) - 1,061,723 1,061,723
Borrowings (non-current) - 215,712 215,712
Other current financial
liabilities 20,535 - 20,535
Other non-current payables - 47,181 47,181
Total 20,535 3,138,949 3,159,484
(in millions of Korean won) December 31, 2009
Financial assets
Loans and
receivables
Assets at fair
value
through
profit or loss
Hedging
derivatives
Assets
classified as
available-for-
sale Total
Cash and cash equivalents 862,585 - - - 862,585
Trade receivables 2,177,103 - - - 2,177,103
Other receivables 154,034 - - - 154,034
Other financial assets - 378 - - 378
Trade receivables (non-current) 40 - - - 40
Other non-current receivables 17,227 - - - 17,227
Other non-current financial
assets - - 17,997 4,044 22,041
Total 3,210,989 378 17,997 4,044 3,233,408
(in millions of Korean won) December 31, 2009
Financial liabilities
Assets at fairvalue
throughprofit or loss
Hedgingderivatives
Liabilities atamortized cost Total
Trade payables - - 868,232 868,232
Other payables - - 680,917 680,917
Borrowings (current) - - 1,404,000 1,404,000
Borrowings (non-current) - - 404,239 404,239
Other financial liabilities 39 - - 39
Other non-current payables - - 28,991 28,991
Other non-current financial
liabilities - 35,024 - 35,024
Total 39 35,024 3,386,379 3,421,442

LG Chem, Ltd.Notes to the Seperate Financial StatementsDecember 31, 2010 and 2009, and January 1, 2009
12
(in millions of Korean won) January 1, 2009
Financial assets
Loans and
receivables
Assets at fair
value through
profit or loss
Assets
classified as
available-for-
sale Total
Cash and cash equivalents 373,300 - - 373,300
Trade receivables 1,942,277 - - 1,942,277
Other receivables 215,393 - - 215,393
Other financial assets 130 - - 130
Other non-current receivables 31,554 - - 31,554
Other non-current financial
assets - 51,845 1,967 53,812
Total 2,562,654 51,845 1,967 2,616,466
(in millions of Korean won) January 1, 2009
Financial liabilities
Hedging
derivatives
Liabilities at
amortized cost Total
Trade payables - 527,150 527,150
Other payables - 620,307 620,307
Borrowings (current) - 1,394,058 1,394,058
Borrowings (non-current) - 819,944 819,944
Other non-current payables - 5,864 5,864
Other non-current financial liabilities 26,961 - 26,961
Total 26,961 3,367,323 3,394,284
4. Cash and cash equivalents
(1) Details of cash and cash equivalents are as follows:
(in millions of Korean won) December 31,
2010
December 31,
2009
January 1,
2009
Bank deposits and cash on hand 49,536 52,850 55,690
Financial deposits, others 1,081,282 809,735 317,610
Total 1,130,818 862,585 373,300
(2) As of December 31, 2010, non-current other receivables amounted to ₩40 million are restricted
from withdrawal in connection with maintaining checking accounts (December 31, 2009: ₩40
million; January 1, 2009: ₩46 million).

LG Chem, Ltd.Notes to the Seperate Financial StatementsDecember 31, 2010 and 2009, and January 1, 2009
13
5. Trade and other receivables
(1) Trade and other receivables, net of allowance for doubtful accounts, are as follows:
(in millions of
Korean won)December 31, 2010 December 31, 2009 January 1, 2009
Original
amount
Less :
allowance for
doubtful
accounts
Carrying
amount
Original
amount
Less :
allowance for
doubtful
accounts
Carrying
amount
Original
amount
Less :
allowance for
doubtful
accounts
Carrying
amount
Current
Trade receivables 2,179,185 (6,153) 2,173,032 2,188,620 (11,517) 2,177,103 1,975,434 (33,157) 1,942,277
Other receivables 105,311 - 105,311 155,446 (1,412) 154,034 225,704 (10,311) 215,393
Non-current
Trade receivables - - - 43 (3) 40 146 (16) 130
Other receivables 14,189 - 14,189 17,227 - 17,227 31,554 - 31,554
Total 2,298,685 (6,153) 2,292,532 2,361,336 (12,932) 2,348,404 2,232,838 (43,484) 2,189,354
(2) Details of other receivables are as follows:
(in millions of Korean won) December 31, 2010 December 31, 2009 January 1, 2009
Current
Non-trade receivables 89,106 51,219 66,160
Financial deposits 5,000 100,000 148,300
Accrued income 3,943 2,815 933
Deposits 7,262 - -
Subtotal 105,311 154,034 215,393
Non-current
Non-trade receivables - - 196
Financial deposits 40 40 46
Loans 36 50 206
Deposits 14,113 17,137 31,106
Subtotal 14,189 17,227 31,554
Total 119,500 171,261 246,947
(3) The aging analysis of these trade and other receivables is as follows:
(in millions of Korean won) December 31, 2010 December 31, 2009 January 1, 2009
Up to 3 months 2,149,727 2,086,630 1,881,314
3 to 6 months 24,801 87,066 58,320
Over 6 months 4,657 14,924 35,800
Total 2,179,185 2,188,620 1,975,434

LG Chem, Ltd.Notes to the Seperate Financial StatementsDecember 31, 2010 and 2009, and January 1, 2009
14
(4) The movements in bad debt allowance for the years ended December 31, 2010 and 2009, are
as follows:
2010 2009
Trade receivables Other receivables Trade receivables Other receivables
(in millions of Koreanwon)
CurrentNon-
currentCurrent
Non-current
CurrentNon-
currentCurrent
Non-current
Beginning balance 11,517 3 1,412 - 33,517 16 10,311 -
Addition - - - - 7,225 - 2,263 -
Reversal (775) (3) - - (3) (13) - -
Write-off (4,589) - (1,412) - (2,573) - - -
Spin-off - - - - (26,289) - (11,612) -
Ending balance 6,153 - - - 11,517 3 1,412 -
(5) As of December 31, 2010, the maximum exposure amount of credit risk is the carrying amount
of each receivable mentioned above.
(6) The fair values of trade and other receivables are same as their carrying amounts.
6. Other financial assets and liabilities
(1) Details of other financial assets and liabilities are as follows:
(in millions of Korean won) December 31, 2010 December 31, 2009 January 1, 2009
Other financial assets
Derivatives (Note 8) 2,194 18,375 51,845
Available-for-sale (Note 7) 4,044 4,044 1,967
Less: current portions (2,194) (378) -
Total 4,044 22,041 53,812
Other financial liabilities
Derivatives (Note 8) 20,535 35,063 26,961
Less: current portions (20,535) (39) -
Total - 35,024 26,961

LG Chem, Ltd.Notes to the Seperate Financial StatementsDecember 31, 2010 and 2009, and January 1, 2009
15
7. Financial assets classified as available-for-sale
(1) The movement in financial assets classified as available-for-sale for the years ended December
31, 2010 and 2009, is as follows:
(in millions of Korean won) 2010 2009
Beginning balance 4,044 1,967
Additions 7 2,959
Disposals (7) (1,786)
Reclassification - 1,281
Spin-off - (195)
Impairment - (182)
Ending balance 4,044 4,044
(1) Available-for-sale financial assets consist of listed and unlisted equity securities. The unlistedequity securities are measured at cost as their fair values cannot be measured reliably.
(2) As of December 31, 2010, none of these financial assets classified as available-for-sale is either
overdue or impaired. In 2009, ₩182 million of impairment losses were recognized for unlisted
equity securities.
8. Derivative financial instruments
(1) Details of derivative financial assets and liabilities are as follows:
(in millions of Korean won)
December 31, 2010 December 31, 2009 January 1, 2009
Assets Liabilities Assets Liabilities Assets Liabilities
Current
Interest rate swaps-cash flow
hedges - 20,535 - - - -
Forward foreign exchange
contract- held-for-trading 2,194 - 378 39 - -
Total 2,194 20,535 378 39 - -
Non-current
Interest rate swaps-cash flow
hedges - - 17,997 35,024 51,845 26,961

LG Chem, Ltd.Notes to the Seperate Financial StatementsDecember 31, 2010 and 2009, and January 1, 2009
16
(2) Details of derivative financial contracts are as follows:
Classification
December 31, 2010
Contractor Contract date
Contract amount
(in thousands) Contract period Contract terms
Forward foreignexchange contract
Korea ExchangeBank and 15other banks
2010.12.10various
US$ 10,000various
2010.12.10 ~2011.01.04 various
\ 1145.66 / US$ various
Currency swap BTMU 2008.12.19 ¥5,000,000 2008.12.19 ~ 2011.12.19 \ 15.53/¥
BTMU 2008.12.19 ¥5,000,000 2008.12.19 ~ 2011.12.19 \ 15.67/¥
Classification
December 31, 2009
Contractor Contract date
Contract
amount
(in thousands) Contract period Contract terms
Forward foreignexchange contract
Shinhan Bank and12 other banks
2009.11.27various
US$ 5,000various
2009.11.27 ~2010.02.26 various
\ 1173.10 / US$ various
Currency swap Woori Bank(*) 2006.07.20 US$ 50,000 2006.07.20 ~ 2011. 07.20 \ 944.00/US$
ING Bank 2006.07.20 US$ 50,000 2006.07.20 ~ 2010. 07.20 \ 944.30/US$
BTMU 2008.12.19 ¥5,000,000 2008.12.19 ~ 2011.12.19 \ 15.53/¥
BTMU 2008.12.19 ¥5,000,000 2008.12.19 ~ 2011.12.19 \ 15.67/¥
(*) The contract was terminated in 2010.
Classification
January 1, 2009
Contractor Contract date
Contract amount
(in thousands) Contract period Contract terms
Currency swap Hana Bank 2006.04.13 US$ 52,029 2006.04.13 ~ 2009.04.13 ₩961.00/US$
Woori Bank(*) 2006.07.20 US$ 50,000 2006.07.20 ~ 2011.07.20 \ 944.00/US$
ING Bank 2006.07.20 US$ 50,000 2006.07.20 ~ 2010.07.20 \ 944.30/US$
BOA(*) 2008.01.10 US$ 50,000 2008.01.10 ~ 2012.01.10 ₩939.80/US$
BTMU 2008.12.19 ¥5,000,000 2008.12.19 ~ 2011.12.19 \ 15.53/¥
BTMU 2008.12.19 ¥5,000,000 2008.12.19 ~ 2011.12.19 \ 15.67/¥
(*) The contract was terminated in 2009.
(3) Trading derivative is classified as a current asset or liability. The fair values of a hedging
derivative is classified as a non-current asset or liability if the remaining maturity of the hedged
item is more than 12 months and, as a current asset or liability, if the remaining maturity of the
hedged item is less than 12 months.
(4) There was no ineffectiveness to be recorded from cash flow hedges.

LG Chem, Ltd.Notes to the Seperate Financial StatementsDecember 31, 2010 and 2009, and January 1, 2009
17
9. Inventories
(1) Details of Inventories are as follows:
(in millions of
Korean won)
December 31, 2010 December 31, 2009 January 1, 2009
Original
amount
Valuation
allowance
Carrying
amount
Original
amount
Valuation
allowance
Carrying
amount
Original
amount
Valuation
allowance
Carrying
amount
Merchandise 51,190 (17) 51,173 36,743 (58) 36,685 67,368 (363) 67,005
Finished products 834,503 (5,867) 828,636 617,725 (4,374) 613,351 751,525 (12,513) 739,012
Semi-finished products 237,091 - 237,091 170,693 - 170,693 177,578 - 177,578
Work-in-process 1,032 - 1,032 595 - 595 494 - 494
Raw materials 418,037 (754) 417,283 381,403 (375) 381,028 351,942 (421) 351,521
Supplies 40,906 - 40,906 46,142 - 46,142 41,333 - 41,333
Materials-in-transit 155,223 - 155,223 92,437 - 92,437 131,995 - 131,995
Total 1,787,982 (6,638) 1,731,344 1,345,738 (4,807) 1,340,931 1,522,235 (13,297) 1,508,938
(2) The cost of inventories recognized as expense and included in ‘Cost of Sales’ amounted to
₩11,414,464 million (2009: ₩9,144,463 million).

LG Chem, Ltd.Notes to the Seperate Financial StatementsDecember 31, 2010 and 2009, and January 1, 2009
18
10. Investments in subsidiaries, joint venture and associates
(1) Details of investments in subsidiaries and associates for the years ended December 31, 2010
and 2009, and January 1, 2009, are as follows:
Subsidiaries Country Ownership (%) Amount
2010.
12.31
2009.
12.31
2009.
1.1
2010.
12.31
2009.
12.31
2009.
1.1
Tianjin LG Dagu Chemical Co., Ltd. China 75 75 75 24,265 24,265 24,265
Ningbo LG Yongxing Chemical Co., Ltd.1 China 75 75 75 135,908 135,908 135,908
LG Chemical Hong Kong Ltd. Hong Kong 100 100 100 11,159 11,159 11,159
LG Chem America, Inc. USA 100 100 100 3,620 3,620 -
LG Chemical India Pvt. Ltd.2 India 100 100 100 54,929 54,929 54,929
LG Polymer India Pvt. Ltd. 2 India - - - - - -
LG Chemical (Guangzhou) Engineering
Plastics Co., Ltd. China 100 100 100 21,911 21,911 21,911
LG Chem (Nanjing) Information & Electronics
Materials Co., Ltd.3 China 81 81 83 151,975 126,344 98,921
LG Chem (Taiwan), Ltd. Taiwan 100 100 100 18 18 -
LG Chem Display Materials (Beijing) Co., Ltd. China 90 90 90 12,450 12,450 12,450
Tianjin LG Bohai Chemical Co., Ltd.4 China 65 65 65 105,847 105,847 105,847
LG Chem (China) Investment Co., Ltd.6 China 100 100 100 50,092 46,337 46,337
LG Chem (Tianjin) Engineering Plastics Co.,
Ltd. China 90 90 90 14,733 14,733 14,733
LG Chem Europe GmbH Germany 100 100 100 3,085 3,085 3,085
LG Chem Poland Sp. Z.O.O Poland 100 100 100 8,196 8,196 8,196
LG Chem Michigan Inc.7 USA 100 100 100 29,269 983 983
LG Chem Power Inc.7 USA 100 100 100 6,712 - -
Tianjin LG Botian Chemical Co., Ltd.4,5 China 41 36 - 9,550 5,977 -
Ningbo Zhenhai LG Yongxing Trade Co., Ltd.1 China - - - - - -
LG Polycarbonate Ltd.10 Korea 100 - - 136,948 - -
Tianjin LG New Building Materials Co., Ltd.11 China - - 85 - - 51,689
LG Hausys America, Inc.11 USA - - 100 - - 7,396
LG Chem Trading (Shanghai) Co., Ltd. 11 China - - 100 - - 2,473
LG Chem Industrial Materials Inc.11 USA - - 100 - - 15,882
Total 780,667 575,762 616,164

LG Chem, Ltd.Notes to the Seperate Financial StatementsDecember 31, 2010 and 2009, and January 1, 2009
19
Associates Country Ownership (%) Amount
2010.
12.31
2009.
12.31
2009.
1.1
2010.
12.31
2009.
12.31
2009.
1.1
LG Polycarbonate Ltd.10 Korea - 50 50 - 62,577 62,577
SEETEC Co., Ltd. Korea 50 50 50 58,416 58,416 58,416
LG Vina Chemical J/V Company Vietnam 40 40 40 1,313 1,313 1,313
LG Holdings (HK) Ltd. Hong Kong 26 26 18 77,535 77,535 58,207
LG Chem Brasil, Ltd. 8 Brazil 100 100 100 258 258 258
TECWIN Co., Ltd. 13 Korea 20 20 20 2,861 2,861 2,861
HL Greenpower Co., Ltd. 9 Korea 49 - - 14,210 - -
LG Yongxing International Trading Co., Ltd 8,12 China - - - - - -
M. Dohmen S.A.11 Swiss - - 49 - - 993
Total 154,593 202,960 184,625
1In 2009, Ningbo LG Yongxing Chemical Co., Ltd. established Ningbo Zhenhai LG Yongxing Trade Co.,
Ltd. with 100% ownership.2LG Chemical India Pvt. Ltd. owns 100% of LG Polymer India Pvt. Ltd. shares.
3In 2010, the Company acquired additional shares of LG Chem (Nanjing) Information & Electronics
Materials Co., Ltd. for ₩25,631 million.4
As of December 31, 2010 Tianjin LG Bohai Chemical Co., Ltd. owns 20.30% of Tianjin LG Botian
Chemical Co., Ltd. shares.5
In 2010, the Company acquired additional shares of Tianjin LG Botian Chemical Co., Ltd. for ₩3,573
million.6
In 2010, the Company acquired additional shares of LG Chem (China) Investment Co., Ltd. for
₩3,755 million.7
In 2010, the Company acquired additional shares of Compact Power Inc. for ₩34,998 million.
Compact Power Inc. changed its company name to LG Chem Michigan Inc. In addition, LG Chem
Power Inc. is the newly formed entity which has been span off from Compact Power Inc. in 2010.8
Classified as investment in associate due to its small scale.9In 2010, the Company newly acquired shares of HL Greenpower Co., Ltd. for ₩14,210 million.
10The Company obtained controls over LG Polycarbonate Ltd. on October 1, 2010 and accordingly, this
investment has been reclassified from an associate to a subsidiary.11
This investment was transferred to LG Hausys, Ltd., as a result of spin-off.12
This entity was established by Ningbo LG Yongxing Chemical Co., Ltd. which is one of the Company’s
subsidiaries.
LG Chem, Ltd.Notes to the Seperate Financial StatementsDecember 31, 2010 and 2009, and January 1, 2009
20
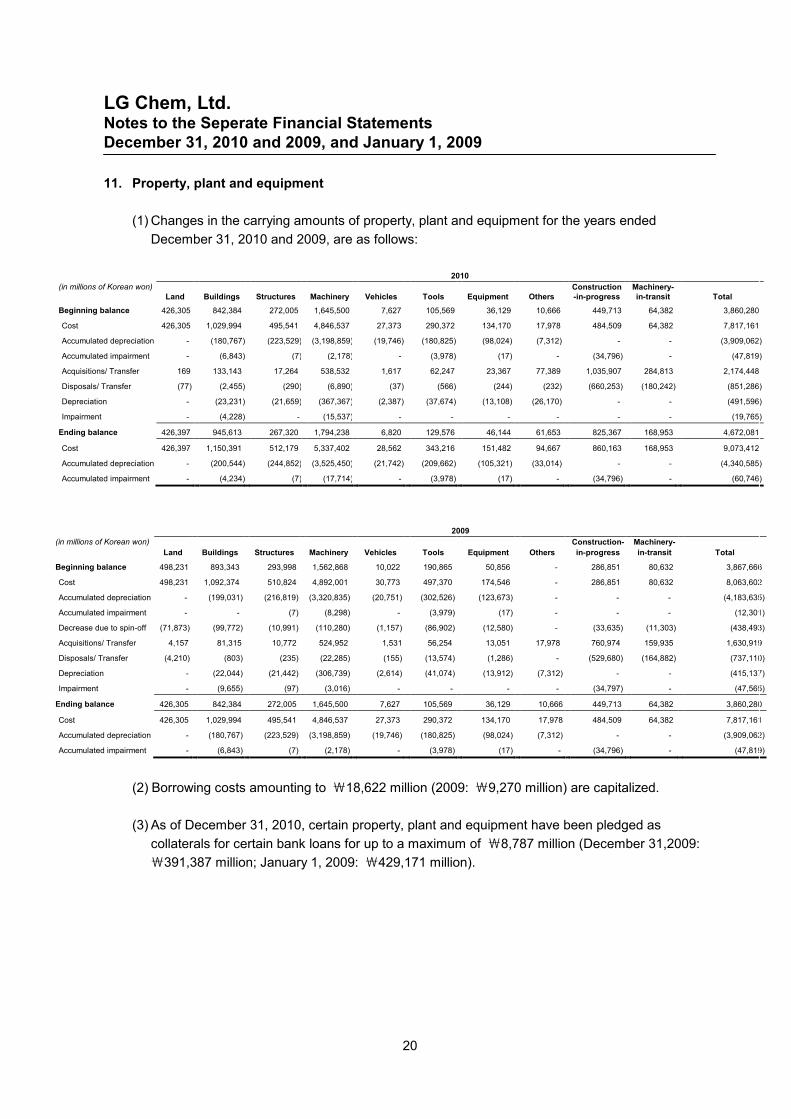
11. Property, plant and equipment
(1) Changes in the carrying amounts of property, plant and equipment for the years ended
December 31, 2010 and 2009, are as follows:
2010
(in millions of Korean won)Land Buildings Structures Machinery Vehicles Tools Equipment Others
Construction-in-progress
Machinery-in-transit Total
Beginning balance 426,305 842,384 272,005 1,645,500 7,627 105,569 36,129 10,666 449,713 64,382 3,860,280
Cost 426,305 1,029,994 495,541 4,846,537 27,373 290,372 134,170 17,978 484,509 64,382 7,817,161
Accumulated depreciation - (180,767) (223,529) (3,198,859) (19,746) (180,825) (98,024) (7,312) - - (3,909,062)
Accumulated impairment - (6,843) (7) (2,178) - (3,978) (17) - (34,796) - (47,819)
Acquisitions/ Transfer 169 133,143 17,264 538,532 1,617 62,247 23,367 77,389 1,035,907 284,813 2,174,448
Disposals/ Transfer (77) (2,455) (290) (6,890) (37) (566) (244) (232) (660,253) (180,242) (851,286)
Depreciation - (23,231) (21,659) (367,367) (2,387) (37,674) (13,108) (26,170) - - (491,596)
Impairment - (4,228) - (15,537) - - - - - - (19,765)
Ending balance 426,397 945,613 267,320 1,794,238 6,820 129,576 46,144 61,653 825,367 168,953 4,672,081
Cost 426,397 1,150,391 512,179 5,337,402 28,562 343,216 151,482 94,667 860,163 168,953 9,073,412
Accumulated depreciation - (200,544) (244,852) (3,525,450) (21,742) (209,662) (105,321) (33,014) - - (4,340,585)
Accumulated impairment - (4,234) (7) (17,714) - (3,978) (17) - (34,796) - (60,746)
(2) Borrowing costs amounting to ₩18,622 million (2009: ₩9,270 million) are capitalized.
(3) As of December 31, 2010, certain property, plant and equipment have been pledged as
collaterals for certain bank loans for up to a maximum of ₩8,787 million (December 31,2009:
₩391,387 million; January 1, 2009: ₩429,171 million).
2009
(in millions of Korean won)
Land Buildings Structures Machinery Vehicles Tools Equipment Others
Construction-
in-progress
Machinery-
in-transit Total
Beginning balance 498,231 893,343 293,998 1,562,868 10,022 190,865 50,856 - 286,851 80,632 3,867,666
Cost 498,231 1,092,374 510,824 4,892,001 30,773 497,370 174,546 - 286,851 80,632 8,063,602
Accumulated depreciation - (199,031) (216,819) (3,320,835) (20,751) (302,526) (123,673) - - - (4,183,635)
Accumulated impairment - - (7) (8,298) - (3,979) (17) - - - (12,301)
Decrease due to spin-off (71,873) (99,772) (10,991) (110,280) (1,157) (86,902) (12,580) - (33,635) (11,303) (438,493)
Acquisitions/ Transfer 4,157 81,315 10,772 524,952 1,531 56,254 13,051 17,978 760,974 159,935 1,630,919
Disposals/ Transfer (4,210) (803) (235) (22,285) (155) (13,574) (1,286) - (529,680) (164,882) (737,110)
Depreciation - (22,044) (21,442) (306,739) (2,614) (41,074) (13,912) (7,312) - - (415,137)
Impairment - (9,655) (97) (3,016) - - - - (34,797) - (47,565)
Ending balance 426,305 842,384 272,005 1,645,500 7,627 105,569 36,129 10,666 449,713 64,382 3,860,280
Cost 426,305 1,029,994 495,541 4,846,537 27,373 290,372 134,170 17,978 484,509 64,382 7,817,161
Accumulated depreciation - (180,767) (223,529) (3,198,859) (19,746) (180,825) (98,024) (7,312) - - (3,909,062)
Accumulated impairment - (6,843) (7) (2,178) - (3,978) (17) - (34,796) - (47,819)

LG Chem, Ltd.Notes to the Seperate Financial StatementsDecember 31, 2010 and 2009, and January 1, 2009
21
(4) As of December 31, 2010, the Company has a finance lease agreement on certain property,
plant and equipment at the MTBE factory. The carrying amount of leased assets and
depreciation are as follows:
(in millions of Korean won) 2010 2009
Carrying amount 2,223 4,405
Depreciation 2,182 2,182
The said agreement is non-cancellable finance lease agreement. The lease term is 15 years, andthe Company has the title to the leased assets.
(5) Depreciation of property, plant and equipment was classified as follows:
(in millions of Korean won) 2010 2009
Cost of sales 453,442 364,661
Selling, general and administrative expenses 37,445 35,458
Others(*) 709 15,018
Total 491,596 415,137
(*) Amounts capitalized to development costs and charged to discontinued operations are included.
12. Intangible assets
(1) Changes in the carrying amount of intangible assets for the years ended December 31, 2010and 2009, are as follows:
(in millions of Korean won) 2010
Development
costs
Industrial
property
rights Goodwill Memberships Others Total
Beginning balance 23,413 38,033 33,415 46,747 8,832 150,440
Acquisitions/ Transfer 8,871 12,746 - 1,911 7,434 30,962
Disposals/ Transfer (2) (642) - (236) (29) (909)
Amortization (7,640) (2,301) - - (2,856) (12,797)
Ending balance 24,642 47,836 33,415 48,422 13,381 167,696

LG Chem, Ltd.Notes to the Seperate Financial StatementsDecember 31, 2010 and 2009, and January 1, 2009
22
(in millions of Korean won) 2009
Development
costs
Industrial
property
rights Goodwill Memberships Others Total
Beginning balance 45,908 32,339 33,415 57,570 10,472 179,704
Acquisitions/ Transfer 7,909 12,599 - - 2,527 23,035
Disposals/ Transfer (265) (785) - - (48) (1,098)
Amortization (9,542) (1,872) - - (2,663) (14,077)
Impairment (16,948) - - - - (16,948)
Decrease due to spin-off (3,649) (4,248) - (10,823) (1,456) (20,176)
Ending balance 23,413 38,033 33,415 46,747 8,832 150,440
(1) Amortization of intangible assets was classified as follows:
(in millions of Korean won) 2010 2009
Cost of sales 5,401 6,006
Selling, general and administrative expenses 7,396 7,307
Others(*) - 764
Total 12,797 14,077
(*) Amounts charged to discontinued operations are included.
13. Other current and non-current assets
Details of other current and non-current assets are as follows:
(in millions of Korean won) December 31, 2010 December 31, 2009 January 1, 2009
Current:
Advances to suppliers - 2,544 8,848
Prepaid expenses 15,513 19,463 28,150
Prepaid value added tax 46,747 33,278 19,193
Others 6,817 4,303 5,095
Total 69,077 59,588 61,286
Non-current:
Long-term prepaid expenses 9,563 11,369 19,476
Other investment assets - - 1,621
Total 9,563 11,369 21,097

LG Chem, Ltd.Notes to the Seperate Financial StatementsDecember 31, 2010 and 2009, and January 1, 2009
23
14. Borrowings
Details of borrowings are as follows:
(1) Current borrowings
1Notes discounted that are not yet due.
2Bank loans are secured by certain property, plant and equipment (Note 11).
(2) Non-current borrowings
(in millions of Korean won)December 31, 2010
Bank
Annual
interest rate (%) Maturity Total amount
Current
maturities
Long-term
debts
1. Debentures
Won currency debentures Woori Security 4.85 2012.4.29 149,692 - 149,692
Foreign currency debentures1 Woori Security 3Tibor+3.0 2011.12.19 139,543 139,543 -
Subtotal 289,235 139,543 149,692
2. Bank loansWon currency loans Kookmin Bank,
others3.00, various 2011.9.15~2020.3.21
2,996 1,133 1,863Foreign currency loans KDB, others Libor+0.36,
various2010.10.1~2015.10.15
113,890 56,945 56,945Subtotal 116,886 58,078 58,808
3. Finance lease liabilities
Finance lease liabilities2 Hyundai Oil Bank 9.00 2014.10.29 9,024 1,812 7,212
Subtotal 9,024 1,812 7,212
Total 415,145 199,433 215,712
(in millions of Korean won) Bank
Annual interest
rate (%) at
12.31, 2010
Carrying Amount
December
31, 2010
December
31, 2009
January 1,
2009
Notes discounted1
Shinhan Bank,
others
Libor+1.3,
various 862,290 949,353 818.916
Current maturities of long-term debts
Debentures Woori Security 3Tibor+3.00 139,543 158,294 506,271
Bank loans2
Shinhan Bank,
others
Libor+0.36,
various 58,078 294,694 67,353
Finance lease liabilities Hyundai Oil Bank 9.00 1,812 1,659 1,518
Total 1,061,723 1,404,000 1,394,058

LG Chem, Ltd.Notes to the Seperate Financial StatementsDecember 31, 2010 and 2009, and January 1, 2009
24
(in millions of Korean won)December 31, 2009
Bank
Annual
interest rate (%) Maturity
Total
amount
Current
maturities
Long-term
debts
1. Debentures
Won currency debentures Woori Security 4.5~ 4.85 2010.3.16~2012.4.29 249,399 99.926 149,473
Foreign currency debentures1 Woori Security Libor+0.26~
Tibor+3.0
2010.9.17~2011.12.19
184,354 58,368 125,986
Subtotal433,753 158,294 275,459
2. Bank loans
Won currency loans Kookmin Bank, others 0~3.25 2010.6.15~2020.3.21 5,792 2,795 2,997
Foreign currency loans KDB, others Libor+0.3,various
2010.2.27~2015.10.15408,658 291,899 116,759
Subtotal 414,450 294,694 119,756
3. Finance lease liabilities
Finance lease liabilities2 Hyundai Oil Bank 9.00 2014.10.29 10,683 1,659 9,024
Subtotal 10,683 1,659 9,024
Total 858,886 454,647 404,239
(in millions of Korean won)
January 1, 2009
Bank
Annual
interest rate (%) Maturity
Total
amount
Current
maturities
Long-term
debts
1. Debentures
Won currency debentures Woori Security 3.5~5.02 2009.4.26~2013.10.27 458,824 299,438 159,386
Won currency debentures Woori Bank,others
5.02~5.32 2009.4.13~2009.5.30100,000 100,000 -
Foreign currency debentures1 Woori Security Libor+0.26~Tibor+3.00
2009.9.23~2011.12.19308,595 106,833 201,762
Subtotal 867,419 506,271 361,148
2. Bank loans
Won currency loans Kookmin Bank,others 3.00~4.25,CD+0.6
2010.6.15~2020.3.219,914 1,926 7,988
Foreign currency loans KDB, others Libor+0.3,various
2010.2.27~2015.10.15505,552 65,427 440,125
Subtotal 515,466 67,353 448,113
3. Finance lease liabilities
Finance lease liabilities2 Hyundai Oil Bank 9.00 2014.10.29 12,201 1,518 10,683
Subtotal 12,201 1,518 10,683
Total 1,395,086 575,142 819,944
1Floating rate notes issued on March 20, 2007, were repaid on September 17, 2010, the maturity
date.2
Finance lease liabilities are liabilities associated with sales and leaseback arrangements on
property, plant and equipment of MTBE factory (Note 11).

LG Chem, Ltd.Notes to the Seperate Financial StatementsDecember 31, 2010 and 2009, and January 1, 2009
25
(3) Carrying amounts and fair values of non-current borrowings are as follows:
1 Fair values are based on cash flows discounted using Korean won currency note yield (AA+) in
the same credit grade with the Company, and borrowing rate quoted by People’s Bank of China
and others.
(4) Changes in the carrying amount of debentures for the years ended December 31, 2010 and
2009, are as follows:
2010 2009
Beginning balance 433,753 867,419
Amortization 776 1,342
Increase - 298,653
Repayment (158,380) (506,887)
Decrease due to spin-off - (209,172)
Exchange difference 13,086 (17,602)
Ending balance 289,235 433,753
(5) Lease liabilities are effectively secured as the rights to the leased assets revert to the lessor in
the event of default.
(6) The present value of finance lease liabilities is as follows:
(in millions
of Korean won)
December 31, 2010 December 31, 2009 January 1, 2009Minimum
lease
payments
Future
finance
costs
Present
value
Minimum
lease
payments
Future
finance
costs
Present
value
Minimum
lease
payments
Future
finance
costs
Present
value
Within 1 year 2,481 669 1,812 2,481 822 1,659 2,480 962 1,518
1 to 5 years 8,157 945 7,212 10,637 1,613 9,024 9,922 2,313 7,609
Over 5 years - - - - - - 3,196 122 3,074
(in millions of Korean
won)
December 31, 2010 December 31, 2009 January 1, 2009
Carrying
amount Fair value1
Carrying
amount Fair value1
Carrying
amount Fair value1
Debentures 149,692 153,716 275,459 276,247 361,148 350,276
Bank loans 58,808 58,852 119,756 119,343 448,113 446,943
Finance lease liabilities 7,212 7,197 9,024 8,948 10,683 10,326
Total 215,712 219,765 404,239 404,538 819,944 807,544

LG Chem, Ltd.Notes to the Seperate Financial StatementsDecember 31, 2010 and 2009, and January 1, 2009
26
15. Provisions
Changes in the carrying amount of provisions for the years ended December 31, 2010, and 2009,
are as follows:
(in millions of Korean won) 2010
Sales returns1
Warranty2
Total
Beginning balance 3,512 1,792 5,304
Additions - 335 335
Reversals (733) - (733)
Ending balance 2,779 2,127 4,906
(in millions of Korean won) 2009
Sales returns1
Warranty2
Total
Beginning balance - - -
Additions 3,512 5,131 8,643
Decrease due to spin-off - (3,339) (3,339)
Ending balance 3,512 1,792 5,304
1 Sales return provisions have been accrued for the estimated sales returns determined based on
historical experience.2 Warranty provisions have been accrued for the estimated warranty service costs to be incurred
based on the terms of warranty and historical experience.
16. Defined benefit liability
(1) The amounts recognized in the statements of financial position are determined as follows:
(in millions of Korean won) December 31, 2010 December 31, 2009 January 1, 2009
Present value of obligations(*)
157,782 218,128 248,479
Fair value of plan assets (151,726) (164,867) (183,107)
Liability in the statement of
financial position 6,056 53,261 65,372
(*)The present value of retirement benefit obligations is net of existing contributions to the National
Pension Plan of ₩1,021 million (December 31, 2009; ₩1,926 million; January 1, 2009; ₩2,756
million).

LG Chem, Ltd.Notes to the Seperate Financial StatementsDecember 31, 2010 and 2009, and January 1, 2009
27
(2) The amounts recognized in the statements of income for the years ended December 31, 2010
and 2009, are as follows:
(in millions of Korean won) 2010 2009
Current service cost1
37,251 38,021
Interest cost 10,730 12,595
Expected return on plan assets (7,621) (5,672)
Loss from discontinued operations - (3,173)
Curtailment of plan 7,967 -
Past service cost (8,834) -
Total, included in employee benefit expenses 39,493 41,771
1The above amounts excluded ₩127 million (2009: ₩1,436 million) of expenses capitalized to
construction in progress and development costs.
(3) The amounts recognized in the statement of income for the years ended December 31, 2010
and 2009, are as follows:
(in millions of Korean won) 2010 2009
Cost of sales 30,366 28,399
Selling, general and administrative expenses 9,127 13,372
Total 39,493 41,771
(4) Actuarial gains and losses recognized as other comprehensive income for the years ended
December 31, 2010 and 2009, are as follows:
(in millions of Korean won) 2010 2009
Actuarial losses before tax (17,771) (10,272)
Income tax effect 1,696 2,214
Actuarial losses after tax (16,075) (8,058)
As of December 31, 2010, ₩24,133 million (2009: ₩8,058 million; January 1, 2009: Nil) of
accumulated actuarial losses are included in other comprehensive income.

LG Chem, Ltd.Notes to the Seperate Financial StatementsDecember 31, 2010 and 2009, and January 1, 2009
28
(5) Changes in the carrying amount of defined benefit obligations for the years ended December 31,
2010 and 2009, are as follows:
(in millions of Korean won) 2010 2009
Beginning balance 218,128 248,479
Transfer in 452 708
Current service cost 37,378 36,284
Interest expense 10,730 12,595
Actuarial losses(before tax) 16,769 12,340
Benefits paid (34,741) (39,249)
Spin-off - (53,029)
Curtailment of plan 7,967 -
Settlements of plan (90,067) -
Past service cost (8,834) -
Ending balance 157,782 218,128
(6) Changes in the fair value of plan assets for the years ended December 31, 2010 and 2009, are
as follows:
(in millions of Korean won) 2010 2009
Beginning balance 164,867 183,107
Expected return on plan assets 7,621 5,672
Actuarial gains(losses)(before tax) (1,002) 2,068
Employer contributions 52,500 33,000
Benefits paid (20,388) (22,470)
Spin-off - (36,510)
Settlements of plan (51,872) -
Ending balance 151,726 164,867
(7) The actual return on plan assets was ₩6,619 million (2009: ₩7,740 million).
(8) The principal actuarial assumptions used are as follows:
December 31,
2010
December 31,
2009
January 1,
2009
Discount rate 5.7% 5.7% 6.8%
Expected return on plan assets 4.3% 5.0% 3.7%
Future salary increase 4.7% 3.6% 3.6%
(9) The sensitivity analysis for changes in key actuarial assumptions is as follows:
(in millions of Korean won) Increase by 1% Decrease by 1%
Discount rate:
Increase(decrease) of defined benefit
obligations (12,651) 14,638

LG Chem, Ltd.Notes to the Seperate Financial StatementsDecember 31, 2010 and 2009, and January 1, 2009
29
(10) Plan assets consist of:
(in millions of Korean
won) December 31, 2010 December 31, 2009 January 1, 2009
Amount Proportion Amount Proportion Amount Proportion
Equity instruments 29,669 20% - 0% - 0%
Time deposits 54,901 36% - 0% - 0%
Insurance contracts with
guaranteed yield 67,156 44% 164,867 100% 183,107 100%
Total1
151,726 100% 164,867 100% 183,107 100%
1Based on management’s estimation, the expected contributions to plan assets for the year
ending December 31, 2011, are ₩20,498 million.
(11) The amounts of experience adjustments on the defined benefit obligations and the plan assets
are as follows:
(in millions of Korean won)
December 31,
2010
December 31,
2009
Present value of defined benefit obligations 157,782 218,128
Fair value of plan assets (151,726) (164,867)
Deficit in the plan 6,056 53,261
Experience adjustments on plan liabilities (20,393) (4,674)
Experience adjustments on plan assets (1,002) 2,068
17. Other current liabilities
Other current liabilities consist of as follows:
(in millions of Korean won)
December 31,
2010
December 31,
2009
January 1,
2009
Advances from customers 9,868 16,814 18,160
Dividends payable 43 61 51
Value added tax withheld 1,415 - -
Withholding 31,707 38,518 47,641
Advance income 6,407 4,362 4,332
Others 21,597 10,171 1,921
Total 71,037 69,926 72,105

LG Chem, Ltd.Notes to the Seperate Financial StatementsDecember 31, 2010 and 2009, and January 1, 2009
30
18. Commitments and contingencies
(1) The Company and the newly established company, LG Hausys Ltd., are jointly liable for theobligations outstanding as of April 1, 2009, the spin-off date.
(2) As of December 31, 2010 and 2009, the Company has been provided with guarantees from theSeoul Guarantee Insurance for the execution of supply contracts.
(3) As of December 31, 2010, the Company has provided one blank promissory note to the Korea
National Oil Corporation as collateral in relation to petroleum import surcharges.
(4) As of December 31, 2010, the Company has bank overdraft agreements with several banks for
up to ₩64,000 million. The Company has also entered into contracts with several financial
institutions to open purchase card agreements for up to ₩210,000 million and has entered into
contracts with several financial institutions for discounting notes from export and derivative
financial instruments for up to US$ 445 million and US$ 30 million, respectively. The Company
has entered into credit line agreements which are related to trade finance and import & export
with several financial institutions for up to ₩1,554,500 million and US$ 290 million.
(5) As of December 31, 2010, the Company has entered into B2B purchase contracts with several
financial institutions.
(6) As of December 31, 2010, the Company has been named as a plaintiff for five legal actions
involving ₩2,348 million in claims and defendant for 11 legal actions with ₩4,483 million in
claims. The ultimate outcome of these cases cannot be determined at this time.
(7) As of December 31, 2010, the Company has entered into technology license agreements with
KBR and other companies for the production of polymer and rubber products. Further, the
Company has entered into manufacture and production technical contracts with Exxon Mobile
and others.
(8) The Company has entered into license agreement with LG Corp. to use trademarks on theproducts that the Company manufactures and sells, and on the services the Company providesin relation to its business.
(9) As of December 31, 2010, the Controlling Company has a long-term purchase contract for
certain raw materials and was provided with a US$ 68 million guarantee for this contract. Further,
as of December 31, 2010, the Controlling Company provided a US$ 17 million guarantee in
regard to a purchase contract for certain raw materials.

LG Chem, Ltd.Notes to the Seperate Financial StatementsDecember 31, 2010 and 2009, and January 1, 2009
31
(10) As of the reporting date, the Company has guaranteed the repayment of various obligations of
its subsidiaries and associates. The outstanding balance of such guarantees as of December
31, 2010, amounts to US$ 168 million, EUR 1 million and PLN 32,000 million (total equivalent to
₩205,466 million) (2009: US$ 152 million, EUR 3 million and PLN 32 million, total equivalent to
₩195,444 million). Details of guarantees provided as of December 31, 2010 and 2009, are as
follows:
(in millions of Korean won) 2010
Guarantor Guarantee beneficiary
Amount of
guarantee Financial institution
Outstanding
loan amount
The Company LG Chem (Nanjing) Information &
Electronics Materials Co., Ltd. 66,455 Bank of China 66,455
˝ 22,778 Woori Bank 22,778
˝ 34,167 Export-Import Bank of Korea 34,167
LG Chem Poland Sp.ZOO. 13,731 Nordea Bank 8,865
LG Chem America, Inc. 5,695 Bank of America -
LG Chem Michigan, Inc. 39,862 Bank of America 20,272
LG Chem Power, Inc. 11,389 Woori Bank 3,417
LG Chem Power, Inc. 11,389 Comerica Bank 2,278
. 205,466 158,232
(in millions of Korean won) 2009
Guarantor
Guarantee beneficiary Amount of
guarantee Financial institution
Outstanding
loan amount
The Company LG Chem (Nanjing) Information &
Electronics Materials Co., Ltd. 68,129 Bank of China 63,377
˝ 23,352 Woori Bank 23,352
˝ 35,028 Export-Import Bank of Korea 35,028
Tianjin LG Bohai Chemical Co., Ltd. 3,892 Export-Import Bank of Korea 3,892
LG Chem Poland Sp.Z.O.O. 17,989 Nordea Bank 11,261
LG Hausys America, Inc. 29,540 Kookmin Bank 29,540
LG Chem America, Inc. 11,676 Bank of America -
LG Chem Michigan, Inc. 5,838 Bank of America 3,503
195,444 169,953
(11) Capital expenditure contracted for at the end of the year but not yet incurred is as follows:
(in millions of Korean won) December 31, 2010 December 31, 2009
Property, plant and equipment 772,084 881,468

LG Chem, Ltd.Notes to the Seperate Financial StatementsDecember 31, 2010 and 2009, and January 1, 2009
32
19. Selling, general and administrative expenses
Selling, general and administrative expenses for the years ended December 31, 2010 and 2009,
are as follows:
(in millions of Korean won) 2010 2009
Wages and salaries 184,839 155,372
Pension costs (Note 16) 9,127 13,372
Welfare expense 35,017 31,555
Travel expense 17,635 14,647
Water & utilities 14,697 14,517
Packaging expense 3,993 3,812
Rental expense 49,279 40,418
Commission expense 173,065 146,973
Depreciation(Note 11) 37,445 35,458
Advertising expense 10,813 9,123
Freight expense 289,133 261,285
Training expense 9,118 7,261
Amortization (Note 12) 7,396 7,307
Sample expense 6,844 6,363
Others 132,829 118,838
Total 981,230 866,301
20. Expenses by nature
Expenses that are recorded by nature as cost of sales, selling, general and administrative expenses
and other operating expenses in the statements of income for the years ended December 31, 2010
and 2009, consist of:
(in millions of Korean won) 2010 2009
Changes in inventories (296,608) 95,940
Raw materials and consumables used 11,132,449 8,573,824
Purchase of merchandise 578,622 474,699
Pension costs (Note 21) 682,129 619,662
Advertising expense 11,680 9,858
Transportation expense 312,122 284,531
Service fees 235,940 201,879
Depreciation, amortization and impairment 523,449 478,709
Operating lease payments 23,384 20,671
Other expenses 1,555,419 1,582,594
Total 14,758,586 12,342,367

LG Chem, Ltd.Notes to the Seperate Financial StatementsDecember 31, 2010 and 2009, and January 1, 2009
33
21. Employee benefit expense
(in millions of Korean won) 2010 2009
Wages and salaries 599,552 537,769
Pension costs (Note 16) 39,493 41,771
Others 43,084 40,122
Total 682,129 619,662
22. Other operating income
Details of other operating income for the years ended December 31, 2010 and 2009, are as follows:
(in millions of Korean won) 2010 2009
Foreign exchange gains 365,307 451,724
Gain on foreign currency translation 11,540 22,459
Gain on disposal of property, plant and equipment 4,569 456
Others 22,960 27,695
Total 404,376 502,334
23. Other operating expenses
Details of other operating expenses for the years ended December 31, 2010 and 2009, are asfollows:
(in millions of Korean won) 2010 2009
Foreign exchange loss 369,557 456,358
Loss on foreign currency translation 13,165 20,878
Loss on disposal of property, plant and equipment 10,665 24,939
Loss on disposal of intangible assets 727 1,097
Impairment loss on property, plant and equipment 19,765 47,565
Impairment loss on intangible assets - 16,948
Others 9,805 41,572
Total 423,684 609,357

LG Chem, Ltd.Notes to the Seperate Financial StatementsDecember 31, 2010 and 2009, and January 1, 2009
34
24. Financial income and expense
Details of financial income and expense for the years ended December 31, 2010 and 2009, are as
follows:
(in millions of Korean won) 2010 2009
Financial income
Interest income1
24,416 17,384
Dividend income 73,763 8,392
Foreign exchange gain 56,235 77,573
Gain on foreign exchange translation 2,985 48,836
Gain on settlement of trading derivatives 9,995 -
Gain on settlement of hedging derivatives 2,415 31,474
Gain on valuation of trading derivatives 2,194 -
Gain on valuation of hedging derivatives 13,426 378
Others - 4,293
Total 185,429 188,330
Financial expense
Interest expense2
32,758 75,402
Foreign exchange loss 73,753 83,670
Loss on foreign exchange translations 14,763 770
Loss on settlement of trading derivatives 29,199 -
Loss on settlement of hedging derivatives 1,118 23,113
Others 1 22,151
Total 151,592 205,106
1Details of interest income are as follows:
(in millions of Korean won) 2010 2009
Bank deposits 24,402 17,359
Financial assets classified as available- for- sale 1 1
Other receivables 13 24
Total 24,416 17,384
2Details of interest expense are as follows:
(in millions of Korean won) 2010 2009
Interest on bank overdraft and borrowings 28,914 39,786
Interest on finance lease liabilities 822 962
Interest on debentures 8,994 26,429
Other interest expenses 12,650 17,495
Capitalized interest for qualifying assets (18,622) (9,270)
Total 32,758 75,402

LG Chem, Ltd.Notes to the Seperate Financial StatementsDecember 31, 2010 and 2009, and January 1, 2009
35
25. Income taxes
(1) Details of income tax expense are as follows:
(in millions of Korean won) 2010 2009(*)
Current tax on profit for the year 517,445 374,849
Adjustments in respect of prior years 19,718 9,018
Deferred tax 5,730 16,447
Subtotal 542,893 400,314
Current tax charged directly to equity 3,910 -
Income tax expense 546,803 400,314
(2) The income taxes charged directly to components of other comprehensive income for the years
ended December 31, 2010 and 2009, are as follows:
(in millions of Korean won) 2010 2009(*)
Current tax
Actuarial loss on defined benefit liability 3,910 -
Deferred tax
Actuarial loss on defined benefit liability (2,214) 2,214
Cash flow hedges (1,309) (3,753)
Total (3,523) (1,539)
(*) Includes income tax expense related to discontinued operations.
(3) The movement in deferred tax assets (liabilities) for the years ended December 31, 2010 and2009, is as follows:
(in millions of Korean won) 2010
Increase(Decrease)
Beginning
balance
Profit
for the year
Other
comprehensive
income
Ending
balance
Defined benefit liability 30,292 (4,333) - 25,959
Plan assets (35,701) 4,347 - (31,354)
Reserve for technology development (41,083) (18,479) - (59,562)
Allowance for doubtful accounts 5,382 (312) - 5,070
Property, plant and equipment 1,855 3,564 - 5,419
Investments in subsidiaries and associates1 (3,519) 2,473 - (1,046)
Accrued interest income (681) (273) - (954)
Others 35,310 7,283 - 42,593
Subtotal (8,145) (5,730) - (13,875)
Deferred tax charged directly to equity 4,551 - (3,523) 1,028
Deferred income tax assets (3,594) (5,730) (3,523) (12,847)

LG Chem, Ltd.Notes to the Seperate Financial StatementsDecember 31, 2010 and 2009, and January 1, 2009
36
(in millions of Korean won) 2009
Increase(Decrease)
Beginning
balance
Profit for the
year
Other
comprehensive
income Spin-off
Ending
balance
Defined benefit liability 33,310 6,996 - (10,014) 30,292
Plan assets (39,053) (4,680) - 8,032 (35,701)
Reserve for technology development (41,300) (281) - 498 (41,083)
Allowance for doubtful accounts 13,321 71 - (8,010) 5,382
Property, plant and equipment 14,378 (12,523) - - 1,855
Investments in subsidiaries andassociates
1 5,584 - - (9,103) (3,519)
Accrued interest income (226) (455) - - (681)
Others 42,753 (5,575) - (1,868) 35,310
Subtotal 28,767 (16,447) - (20,465) (8,145)
Deferred tax charged directly toequity
6,090 - (1,539) - 4,551
Deferred income tax assets 34,857 (16,447) (1,539) (20,465) (3,594)
(4) The reconciliation between income tax expense and accounting profit is as follows:
(in millions of Korean won) 2010 2009
Profit before income tax 2,517,796 1,784,786
Profit before income tax from continuing operations 2,517,796 1,826,762
Loss before income tax from discontinued operations - (41,976)
Income tax expense based on applicable tax rate 609,280 431,891
Tax adjustments
Income not subject to tax (4,342) (11,859)
Expenses not deductible for tax purposes 7,056 3,720
Tax credit (75,706) (45,156)
Others 10,515 21,718
Income tax expense1
546,803 400,314
Effective tax rate (income tax expense/ profit before
income tax) 21.72% 22.43%
1Income tax related to discontinued operations is included.
(5) Realization of the future tax benefits related to the deferred tax assets is dependent on many
factors, including the Company’s ability to generate taxable income within the period during
which the temporary differences reverse, the outlook of the economic environment, and the
overall future industry outlook. Management periodically considers these factors in reaching its
conclusion.

LG Chem, Ltd.Notes to the Seperate Financial StatementsDecember 31, 2010 and 2009, and January 1, 2009
37
26. Earnings per share
Basic earnings per share is calculated by dividing the profit attributable to shareholders of the
Company by the weighted average number of shares in issue excluding shares purchased by the
Company and held as treasury shares. As of the reporting date, the Company has no potential
ordinary shares. Preferred shares have a right to participate in the profits of the Company.
These participation rights have been considered in presenting the EPS for ordinary shares and
preferred shares.
(1) Basic earnings per share attributable to the owners of the Company for the years ended
December 31, 2010 and 2009, is computed as follows:
(in millions of Korean won) 2010 2009
Profit attributable to ordinary shares1
1,766,317 1,240,601
Profit from continuing operations attributable to ordinary shares 1,766,317 1,267,413
Loss from discontinued operations attributable to ordinary shares - (26,812)
Weighted average number of ordinary shares outstanding2
65,911,322 68,116,575
Basic earnings per ordinary share (in won) 26,798 18,213
Earnings per ordinary share from continuing operations 26,798 18,607
Earnings (loss) per ordinary share from discontinued operations - (394)
(in millions of Korean won) 2010 2009
Profit attributable to preferred shares1
204,676 143,871
Profit from continuing operations attributable to preferred shares 204,676 146,972
Loss from discontinued operations attributable to preferred
shares - (3,101)
Weighted average number of preferred shares outstanding2
7,623,403 7,878,573
Basic earnings per preferred share (in won) 26,848 18,261
Earnings per preferred share from continuing operations 26,848 18,655
Earnings (loss) per preferred share from discontinued operations - (394)

LG Chem, Ltd.Notes to the Seperate Financial StatementsDecember 31, 2010 and 2009, and January 1, 2009
38
1Profit attributable to ordinary and preferred shares are as follows:
(in millions of Korean won) 2010 2009
Profit from continuing operations 1,970,993 1,414,385
Ordinary shares dividends (A) 263,645 230,689
Preferred shares dividends (B) 30,875 27,063
Undistributed earnings from continuing operations 1,676,473 1,156,633
Continuing operations available for ordinary shares (C) 1,502,672 1,036,724
Continuing operations available for preferred shares (D) 173,801 119,909
Profit from continuing operations attributable to ordinary
shares (A+C) 1,766,317 1,267,413
Profit from continuing operations attributable to preferred
shares (B+D) 204,676 146,972
Loss from discontinued operations - (29,913)
Discontinued operations attributable to ordinary shares - (26,812)
Discontinued operations attributable to preferred shares - (3,101)
2Weighted average numbers of shares are calculated as follows:
2010
Ordinary shares Period
Number of
shares
Number
of days
Number of shares x
days
Beginning 2010.1.1 ~ 2010.12.31 65,911,322 365 24,057,632,530
Purchase of treasury shares 2010.12.31 ~ 2010.12.31 (3) 1 (3)
Total 24,057,632,527
Weighted average number of ordinary shares outstanding: 24,057,632,527 / 365 = 65,911,322 shares
2010
Preferred shares Period
Number of
shares
Number
of days
Number of shares x
days
Beginning 2010.1.1 ~ 2010.12.31 7,623,403 365 2,782,542,095
Purchase of treasury shares 2010.12.31 ~ 2010.12.31 (1) 1 (1)
Total 2,782,542,094
Weighted average number of preferred shares outstanding: 2,782,542,094 / 365 = 7,623,403 shares

LG Chem, Ltd.Notes to the Seperate Financial StatementsDecember 31, 2010 and 2009, and January 1, 2009
39
2009
Ordinary shares Period
Number of
shares
Number
of days
Number of shares x
days
Beginning 2009.1.1 ~ 2009.12.31 74,849,856 365 27,320,197,440
Spin-off 2009.4.1 ~ 2009.12.31 (8,967,670) 275 (2,466,109,250)
Sale of treasury shares 2009.4.1 ~ 2009.12.31 46,356 275 12,747,900
Purchase of treasury shares 2009.4.27 ~ 2009.12.31 (17,214) 249 (4,286,286)
Purchase of treasury shares 2009.12.31 ~ 2009.12.31 (6) 1 (6)
Total 24,862,549,798
Weighted average number of ordinary shares outstanding: 24,862,549,798 / 365 = 68,116,575 shares
2009
Preferred shares Period
Number of
shares
Number
of days
Number of shares x
days
Beginning 2009.1.1 ~ 2009.12.31 8,657,592 365 3,160,021,080
Spin-off 2009.4.1 ~ 2009.12.31 (1,032,330) 275 (283,890,750)
Sale of treasury shares 2009.4.1 ~ 2009.12.31 437 275 120,175
Purchase of treasury shares 2009.4.27 ~ 2009.12.31 (2,294) 249 (571,206)
Purchase of treasury shares 2009.12.31 ~ 2009.12.31 (2) 1 (2)
Total 2,875,679,297
Weighted average number of preferred shares outstanding: 2,875,679,297 / 365 = 7,878,573 shares
(2) There are no dilutive potential outstanding ordinary shares at the reporting date. Accordingly,
diluted earnings per share and diluted earnings per share from continuing operations are
identical to basic earnings per share and basic earnings per share from continuing operations
attributable to owners of the Company, respectively.
27. Related party transactions
(1) Significant transactions, which occurred in the ordinary course of business with related parties
for the years ended December 31, 2010 and 2009, and the related account balances as of
December 31, 2010 and 2009, are summarized as follows:
(in millions of Korean won) 2010 2009
Sales Purchases Sales Purchases
Entities with significantinfluence over the Company
12 42,705 - 37,677
Subsidiaries 1,582,312 698,429 1,173,392 460,791
Associates 128,534 217,036 151,746 197,346
Key management - 48,014 - 63,377
Others2
17,691 588,844 11,606 416,273
Total 1,728,539 1,595,028 1,336,744 1,175,464

LG Chem, Ltd.Notes to the Seperate Financial StatementsDecember 31, 2010 and 2009, and January 1, 2009
40
(in millions of Korean won) December 31, 2010 December 31, 2009 January 1, 2009
Receivables Payables Receivables Payables Receivables Payables
Entities with significantinfluence over theCompany
15,541 6,923 5,276 1,943 7,723 6,024
Subsidiaries 383,391 131,644 476,516 76,748 381,921 46,653Associates 1,325 18,961 16,783 18,329 15,877 9,885Key management - 51,768 - 36,664 - 53,640Others
231,100 142,247 30,717 102,868 39,032 63,322
Total 421,357 351,543 529,292 236,326 444,553 179,524
1The largest shareholder of the Company is LG Corp., which owns 33.53% of the Company’s
ordinary shares (Note 1).2
Includes LG Corp.’s subsidiaries.
(2) Compensation for key management of the Company for the years ended December 31, 2010
and 2009, consists of:
(in millions of Korean won) 2010 2009
Wages and salaries 33,768 51,055
Pension costs 2,621 2,122
Other long-term employee benefits 11,625 10,200
Total 48,014 63,377
Key management includes directors and audit committee members having duties and
responsibilities over planning, operations and controlling of the Company’s business activities.
(3) The receivables from related parties arise mainly from sales transactions. The receivables
are unsecured in nature and bear no interest. There are no provisions held against receivables
from related parties (2009: Nil).
(4) Details of the guarantees provided by the Company for related parties as of the reporting date
are disclosed in Note 18.
28. Statement of appropriation of retained earnings
The statement of appropriation of retained earnings for the years ended December 31, 2010 and 2009,
are as follows:
(Dates of appropriation: March 18, 2011 and March 19, 2010 for the years ended December 31, 2010
and 2009, respectively)

LG Chem, Ltd.Notes to the Seperate Financial StatementsDecember 31, 2010 and 2009, and January 1, 2009
41
(in millions of Korean won) 2010 2009
Retained earnings before appropriation
Unappropriated retained earnings carried over
from prior year 320,559 451,280
Profit for the year 1,970,993 1,384,472
Actuarial losses (16,075) (8,058)
2,275,477 1,827,694
Transfer from other reserves
Reserve for technology development 60,000 90,000
Appropriation of retained earnings
Legal reserve 29,452 25,775
Dividends 294,520 257,752
Reserve for technology development 2,011,500 745,788
Reserve for investment losses - 103,548
Losses on capital reduction - 464,272
2,335,472 1,597,135
Unappropriated retained earnings
carried forward to subsequent year 5 320,559

LG Chem, Ltd.Notes to the Seperate Financial StatementsDecember 31, 2010 and 2009, and January 1, 2009
42
29. Cash generated from operations
(1) Reconciliation between operating profit and net cash inflow (outflow) from operating activities for
the years ended December 31, 2010 and 2009, is as follows:
(in millions of Korean won) 2010 2009 (*)
Profit before income tax 2,517,796 1,784,786
Adjustments for:
Depreciation 490,887 414,607
Amortization 12,797 14,077
Pension costs 39,493 44,944
Financial income (129,534) (115,152)
Financial expense 82,072 124,755
Foreign exchange differences (12,430) (107,694)
Gain on disposal of property, plant and equipment (4,569) (725)
Loss on disposal of property, plant and equipment 10,665 31,725
Loss on disposal of intangible assets 727 1,097
Other expenses 20,112 54,230
Inventories (385,453) (480,897)
Trade receivables 2,906 91,024
Other receivables (40,139) (11,050)
Settlement of derivatives (18,866) 11,807
Trade payables 103,953 471,189
Other payables 173,792 174,565
Defined benefit liability (104,592) (49,553)
Other cash flows from operation (2,160) 20,206
Cash generated from operations 2,757,457 2,473,941
(*) Discontinued operating income is included.
(2) The principal non-cash transactions for the years ended December 31, 2010 and 2009, are as
follows:
(in millions of Korean won) 2010 2009
Transfer of construction-in-progress 660,253 529,680
Transfer of machinery-in-transit 180,242 164,882
Reclassification of current maturities of borrowings 199,432 539,512
Gain(loss) on valuation of derivatives recognized as
other comprehensive income 5,411 12,488

LG Chem, Ltd.Notes to the Seperate Financial StatementsDecember 31, 2010 and 2009, and January 1, 2009
43
30. Transition to Korean IFRS
(1) Effects on financial position and operating results
1) Effects on total assets, total liabilities and shareholders’ equity as of the date of transition to
Korean IFRS, January 1, 2009, are as follows:
(in millions of Korean won)
Total
assets
Total
liabilities
Total
shareholders’
equity
K-GAAP 8,036,382 3,146,688 4,889,694
Adjustments
Derecognition of accounts receivable1
825,576 818,915 6,661
Employee benefits2
(1,867) (27,973) 26,106
Amortization on negative goodwill3
235,018 - 235,018
Income tax effects4
(4,306) (38,249) 33,943
Total adjustments 1,054,421 752,693 301,728
Korean IFRS 9,090,803 3,899,381 5,191,422
1As of January 1, 2009, discounted trade accounts receivable which have not yet matured are
recognized as borrowings.2Changes in defined benefit liability using actuarial valuation.
3Balance of negative goodwill was reversed entirely.
4Income tax effects from above adjustments and deferred income tax classified as non-current
assets or liabilities.

LG Chem, Ltd.Notes to the Seperate Financial StatementsDecember 31, 2010 and 2009, and January 1, 2009
44
2) Effects on total assets, total liabilities and shareholders’ equity as of December 31, 2009, are as
follows:
(in millions of Korean won)Total
assetsTotal
liabilities
Totalshareholders’
equity
K-GAAP 8,358,827 2,874,492 5,484,335
Adjustments
Transition to cost method from
equity-method1
(62,087) - (62,087)
Derecognition of accounts receivable2
954,219 949,353 4,866
Employee benefits3
(1,646) (16,167) 14,521
Amortization on negative goodwill4
195,848 - 195,848
Withdrawal of amortization on goodwill5
5,130 - 5,130
Income tax effect6
(15,553) (68,176) 52,623
Total adjustments 1,075,911 865,010 210,901
Korean IFRS 9,434,738 3,739,502 5,695,236
1Changes in method of accounting for investments in subsidiaries and associates which have been
treated as equity-method stocks.2As of January 1, 2009, discounted trade accounts receivable which have not yet matured are
recognized as borrowings.3Changes in defined benefit liability using actuarial valuation.
4Balance of negative goodwill was reversed entirely.
5Cancellation of goodwill amortization.
6Income tax effects from above adjustments and deferred income tax classified as non-current
assets or liabilities.

LG Chem, Ltd.Notes to the Seperate Financial StatementsDecember 31, 2010 and 2009, and January 1, 2009
45
3) Effects on net income and comprehensive income for 2009 are as follows:
(in millions of Korean won)
Net
income
Comprehensive
income
K-GAAP 1,507,131 1,468,640
Adjustments
Transition to cost method from equity-method1
(128,282) (66,709)
Derecognition of accounts receivable2
(1,795) (1,795)
Employee benefits3
4,761 (5,511)
Withdrawal of amortization on negative goodwill4
(39,170) (39,170)
Withdrawal of amortization on goodwill5
5,130 5,130
Spin-off effects of industrial materials division6
(1,110) (1,110)
Income tax effect7
34,128 21,995
Others 3,679 3,679
Total adjustments (122,659) (83,491)
Korean IFRS 1,384,472 1,385,149
1Changes in method of accounting for investments in subsidiaries and associates which have been
treated as equity-method stocks.2As of January 1, 2009, discounted trade accounts receivable which have not yet matured are
recognized as borrowings.3Changes in defined benefit liability using actuarial valuation.
4Balance of negative goodwill was reversed entirely.
5Cancellation of goodwill amortization.
6Effects from the application of Korean IFRIC 2117, ‘Distribution of non-cash assets to owners’, for
the spin-off of Industrial Materials Segment.7
Income tax effects from above adjustments.
(2) The principal Korean IFRS transition effects presented by the Company in the statements of cash
flows for the year ended December 31, 2009, were as follows:
According to Korean IFRS, cash flows of the related income (expenses) and assets (liabilities) are
adjusted to separately disclose the cash flows from interest received, interest paid and cash payments
of income taxes that were not presented separately under K-GAAP. And the effects of the change in
exchange rate on cash and cash equivalents held or due in a foreign currency are presented
separately from cash flows from operating, investing and financing activities.
Cash flows from operating and financing activities are adjusted respectively because some
transactions are treated as borrowings with collateralized trade receivables, which were treated as a
selling transaction under K-GAAP. Also, other Korean IFRS transition effects are reflected on cash
flows if they have an effect on cash flow.

46
Report of Independent Accountants'
Review of Internal Accounting Control System
To the President of
LG Chem, Ltd.
We have reviewed the accompanying management’s report on the operations of the Internal
Accounting Control System (“IACS”) of LG Chem, Ltd. (the “Company”) as of December 31,
2010. The Company’s management is responsible for designing and operating IACS and for its
assessment of the effectiveness of IACS. Our responsibility is to review the management’s
report on the operations of the IACS and issue a report based on our review. The
management’s report on the operations of the IACS of the Company states that “based on its
assessment of the operations of the IACS as of December 31, 2010, the Company’s IACS has
been designed and is operating effectively as of December 31, 2010, in all material respects, in
accordance with the IACS standards established by the Internal Accounting Control System
Operations Committee (IACSOC) of the Korea Listed Companies Association.”
Our review was conducted in accordance with the IACS review standards established by the
Korean Institute of Certified Public Accountants. Those standards require that we plan and
perform, in all material respects, the review of management’s report on the operations of the
IACS to obtain a lower level of assurance than an audit. A review is to obtain an understanding
of a company’s IACS and consists principally of inquiries of management and, when deemed
necessary, a limited inspection of underlying documents, which is substantially less in scope
than an audit.
A company’s IACS is a system to monitor and operate those policies and procedures designed
to provide reasonable assurance regarding the reliability of financial reporting and the
preparation of financial statements for external purposes in accordance with accounting
principles generally accepted in the Republic of Korea. Because of its inherent limitations, IACS
may not prevent or detect a material misstatement of the financial statements. Also, projections
of any evaluation of effectiveness to future periods are subject to the risk that controls may
become inadequate because of changes in conditions, or that the degree of compliance with the
policies or procedures may deteriorate.

47
Based on our review, nothing has come to our attention that causes us to believe that
management’s report on the operations of the IACS, referred to above, is not presented fairly, in
all material respects, in accordance with the IACS standards established by IACSOC.
Our review is based on the Company’s IACS as of December 31, 2010, and we did not review
management’s assessment of its IACS subsequent to December 31, 2010. This report has
been prepared pursuant to the Acts on External Audit for Stock Companies in Korea and may
not be appropriate for other purposes or for other users.
Samil PricewaterhouseCoopers
March 10, 2011

48
Report on the Operations of the Internal Accounting Control System
To the Board of Directors and Audit Committee of
LG Chem, Ltd.
I, as the Internal Accounting Control Officer (“IACO”) of LG Chem, Ltd. (“the Company”),
assessed the status of the design and operations of the Company’s internal accounting control
system (“IACS”) for the year ended December 31, 2010.
The Company’s management including IACO is responsible for designing and operating IACS. I,
as the IACO, assessed whether the IACS has been effectively designed and is operating to
prevent and detect any error or fraud which may cause any misstatement of the financial
statements, for the purpose of establishing the reliability of financial reporting and the
preparation of financial statements for external purposes. I, as the IACO, applied the IACS
standard for the assessment of design and operations of the IACS.
Based on the assessment on the operations of the IACS, the Company’s IACS has been
effectively designed and is operating as of December 31, 2010, in all material respects, in
accordance with the IACS standards.
January 28, 2011
Cho Seok-Je, Internal Accounting Control System Officer
Peter Bahnsuk Kim, Chief Executive Officer