audited annual report jpmorgan funds (ireland) icav unaudited annual rep… · jpmorgan funds...
TRANSCRIPT
JPMorgan Funds (Ireland) ICAVA VARIABLE CAPITAL COLLECTIVE INVESTMENT CORPORATE BODY
(an umbrella fund with segregated liability between sub-funds)
(CBI Reg No C165199)
31 December 2019
Audited Annual Report
JPMorgan Funds (Ireland) ICAV
Audited Annual Report
For the year ended 31 December 2019
Contents Page
Directors and General Information 1
Board of Directors’ Report 2
Investment Manager’s Report 7
Report of the Depositary to the Shareholders 9
Independent Auditor’s Report 10
Financial Statements
Statement of Financial Position 13
Statement of Comprehensive Income 14
Statement of Changes in Net Assets Attributable to Shareholders 15
Statement of Cash Flows 16
Notes to the Financial Statements 17
Schedule of Investments
JPMorgan Funds (Ireland) ICAV - Developed World Equity Index Fund 28
Unaudited Statement of Significant Portfolio Changes
JPMorgan Funds (Ireland) ICAV - Developed World Equity Index Fund 40
Unaudited Appendix
1. UCITS Remuneration Disclosures 41
2. Securities Financing Transactions 42
3. Efficient Portfolio Management 44
For additional information, please consult www.jpmorganassetmanagement.com.
JPMorgan Funds (Ireland) ICAVDirectors and General Information
DirectorsDaniel J. Watkins (Connected Non-Executive Director and Chair)Lorcan Murphy (Independent Non-Executive Director and Irishresident)Bronwyn Wright (Independent Non-Executive Director and Irishresident)
Administrator & SecretaryJ.P. Morgan Administration Services (Ireland) Limited200 Capital Dock79 Sir John Rogerson’s QuayDublin 2, D02 RK57Ireland
Independent AuditorsPricewaterhouseCoopersOne Spencer DockNorth Wall QuayDublin 1Ireland
Registered Office200 Capital Dock79 Sir John Rogerson’s QuayDublin 2, D02 RK57Ireland
Management CompanyJPMorgan Asset Management (Europe) S.à r.l.6, route de Trèves,L-2633 Senningerberg,Grand Duchy of Luxembourg
DepositaryJ.P. Morgan Bank (Ireland) plc200 Capital Dock79 Sir John Rogerson’s QuayDublin 2, D02 RK57Ireland
Legal AdvisorsMatheson70 Sir John Rogerson’s QuayDublin 2Ireland
Investment ManagerJ.P. Morgan Investment Inc270 Park AvenueNew York, NY 10017United States of America
1

2
The Board of Directors (the “Board”) is pleased to present the Audited Annual Report of JPMorgan Funds (Ireland) ICAV (the “Fund”) for theyear ended 31 December 2019.
Board of Directors
Lorcan Murphy (Independent Non-Executive Director and Irish resident. A member of the Board since February 2017) is an IndependentNon-Executive Director and marketing and distribution consultant for a number of Irish and UK companies providing 20 years’ knowledge ofglobal mutual funds, spanning operational management, risk management, compliance, product development and asset gathering. He isformer Head of Private Wealth, EMEA and former Head of Pooled Funds Group with Barclays Global Investors Ltd. Mr. Murphy is a member ofthe Institute of Chartered Accountants in Ireland and has a Bachelor of Business Science degree (Economics major) from Trinity CollegeDublin.
Daniel J. Watkins (Connected Non-Executive Director and Chair. A member of the Board since February 2017) is the Chief Executive Officer ofAsia Pacific, J.P. Morgan Asset Management. He is responsible for overseeing the Asset Management Asia Pacific business, which operates inseven locations and includes more than 1,400 employees. Mr Watkins is a member of the Asset Management Operating Committee and thefirm-wide Asia Pacific Management team. Mr Watkins has been an employee since 1997. Prior to taking his current role in 2019, he wasDeputy CEO of JPMorgan Asset Management Europe and Global Head of AM Client Services and Business Platform. Mr Watkins has also held anumber of positions at JPMorgan namely Head of Europe COO and Global IM Operations, Head of the European Operations Team, Head of theEuropean Transfer Agency, Head of Luxembourg Operations, manager of European Transfer Agency and London Investment Operations andmanager of the Flemings Investment Operations Teams. Mr Watkins obtained a BA in Politics from the University of York and is a qualifiedFinancial Advisor. Mr Watkins is currently a Director of several JPMorgan managed Luxembourg and Irish domiciled investment funds andalso several UK legal entities.
Bronwyn Wright (Independent Non-Executive Director and Irish resident. A member of the Board since February 2017) is a former ManagingDirector for a global financial institution, having worked in Capital Markets and Banking, where she was Head of Securities and Fund Servicesfor Ireland with responsibility for the management, growth and strategic direction of the securities and fund services business whichincluded funds, custody, security finance and global agency and trust. Due to her role in managing, leading and growing the Europeanfiduciary business, Ms Wright has extensive knowledge of regulatory requirements and best market practice in the UK, Luxembourg, Jerseyand Ireland. She has sat and chaired the boards of the applicable legal vehicles for the fiduciary businesses in each jurisdiction. Due to herengagement in due diligence exercises she also understands the Nordics, Germany and Asia. She has also been engaged in pre-acquisitiondue diligence in Asia and led a post-acquisition integration across EMEA. Ms Wright holds a degree in Economics and Politics as well as aMasters degree in Economics from University College Dublin.
Ms Wright is past chairperson of the Irish Funds Industry Association committee for Trustee Services. Bronwyn has contributed to the IrishFunds educational development in various capacities, including co-author of a Diploma in Mutual Funds, virtual web based lectures infinancial services and part of an executive committee for a PhD finance programme. She has written numerous industry articles and chairsand participates in industry seminars in Europe and the US.
Structure of the Fund
The Fund is a variable capital investment company, organised as an “Irish Collective Asset-management Vehicle (”ICAV")", under the laws ofthe Republic of Ireland. The Board has appointed JPMorgan Asset Management (Europe) S.à r.l. (“JPMAME”) as Management Company of theFund. The Fund is organised as an “umbrella” with one Sub-Fund which has its own investment objective, policy and restrictions.
The Fund was authorised as an ICAV by the Central Bank of Ireland on 4 January 2017.
The objective of the Fund is to place the money available to it in transferable securities and other permitted assets of any kind, in accordancewith the Fund’s Prospectus, with the purpose of spreading investment risks and affording shareholders the results of the management oftheir portfolios.
The Fund qualifies as an Undertaking for Collective Investment in Transferable Securities (“UCITS”) under the EC Directive 2009/65/EC of 13July 2009 and is subject to the Irish Collective Asset-management Vehicles Act 2015 (the “ICAV Act”) and the UCITS Regulations. The Fundmay therefore be offered for sale in European Union Member States, subject to notification in countries other than the Republic of Ireland. Inaddition, applications to register the Fund and its Sub-Funds may be made in other countries.
The Fund currently has 1 active Sub-Fund. All of the Share Classes are registered for offer and distribution in the Republic of Ireland. Duringthe year there was a registration in the United Kingdom of the JPM Developed World Equity Index X (acc) - USD share class on 20 March 2019.
Role and Responsibility of the Board of Directors
The responsibility of the Board of Directors is governed exclusively by Irish law and any relevant EU law.
The Directors’ are responsible for preparing the directors’ report and the financial statements in accordance with the ICAV Act and the UCITSRegulations, 2011 (as amended) (the “UCITS Regulations”) and International Financial Reporting Standards (“IFRS”), as adopted by theEuropean Union.
The Directors are responsible for ensuring that accounting records as outlined in Sections 109-113 of the ICAV Act are kept by the Fund. Toachieve this, JPMAME have employed J.P. Morgan Administration Services (Ireland) as administrator of the Fund (the “Administrator”). Theaccounting records are maintained at the offices of the Administrator at 200 Capital Dock, 79 Sir John Rogerson’s Quay, Dublin 2, D02 RK57,Ireland.
The ICAV Act requires the directors to prepare financial statements for each financial year. Under the ICAV Act, the Directors have elected toprepare the financial statements in accordance with International Financial Reporting Standards as adopted by the European Union(“relevant financial reporting framework”). Under the ICAV Act, the Directors must not approve the financial statements unless they aresatisfied that they give a true and fair view of the assets, liabilities and financial position of the Fund as at the financial year end date and ofthe profit or loss of the Fund for the financial year and otherwise comply with the ICAV Act.
JPMorgan Funds (Ireland) ICAVBoard of Directors’ ReportFor the year ended 31 December 2019
3
In preparing those financial statements, the Directors are required to:
· select suitable accounting policies and then apply them consistently;· make judgments and estimates that are reasonable and prudent;· state whether they have been prepared in accordance with the applicable accounting standards, identify those standards, and note the
effect and the reasons for any material departure from those standards; and· prepare the financial statements on the going concern basis unless it is inappropriate to presume that the Fund will continue in business.
The financial statements are published on the Management Company’s website. The Directors, together with the Management Company areresponsible for the maintenance and integrity of the financial information included on this website. Legislation in the Republic of Irelandgoverning the presentation and dissemination of the financial statements may differ from legislation in other jurisdictions.
The Directors are responsible for ensuring the maintenance of adequate accounting records which disclose with reasonable accuracy at anytime the assets, liabilities, financial position and profit or loss of the Fund and enable them to ensure that the financial statements complywith the ICAV Act and the UCITS Regulations. They have general responsibility for taking such steps as are reasonably open to them tosafeguard the assets of the Fund. In this regard they have entrusted the assets of the Fund to J.P. Morgan Bank (Ireland) plc (the “Depositary”)for safe-keeping. The Directors have general responsibility for taking such steps as are reasonably open to them to prevent and detect fraudand other irregularities. The Directors are also responsible for preparing a Directors’ Report that complies with the requirements of the ICAVAct.
Board Governance
A management agreement between the Fund and JPMAME sets out the matters over which the Board has delegated to the ManagementCompany. This includes management of the Fund’s assets and the provision of administration, registration, domiciliation agent andmarketing services. All other matters are reserved for approval by the Board and a schedule setting out such matters for clarity is in placebetween the Board and the Management Company. The matters reserved for the Board include determination of each Sub-Fund’sinvestment objective and policies, investment restrictions and powers, amendments to the Prospectus and Supplements, reviewing andapproving key investment and financial data, including the annual accounts, as well as the appointment of, and review of the servicesprovided by, the Management Company, Auditor and Depositary.
Prior to each Board meeting the Directors receive detailed and timely information allowing them to be prepared for the items underdiscussion during the meeting. For each quarterly meeting the Board requests, and receives, reports from, amongst others, the ManagementCompany, the investment managers, risk management as well as proposals for changes to existing Sub-Funds or proposals to launch newones as appropriate. Senior representatives of each of these functions attend Board meetings by invitation to enable the Directors toquestion the reports presented to them.
The Directors take decisions in the interests of the Fund and its shareholders as a whole and refrain from taking part in any deliberation ordecision which creates a conflict of interest between their personal interests and those of the Fund and its shareholders. The subject ofconflicts of interest is documented in the Prospectus and the Management Company’s policy on conflicts of interest is available for inspectionon the website:http://www.jpmorganassetmanagement.lu/EN/dms/Conflicts_of_Interest_Policy_[LUC]_[LU_EN].pdf
The Board can take independent professional advice if necessary and at the Fund’s expense.
Board CompositionThe Board is chaired by Mr. Watkins and currently consists of two Independent Non-Executive Directors and one Connected Non - ExecutiveDirector. The Board defines a Connected Non-Executive Director as someone who is employed by JPMorgan Chase & Co or any of its affiliatesbut who is not directly involved in the primary business of the Fund which in this case is investment management and an IndependentNon-Executive Director as someone who is free of any business, family or other relationship with the Fund or JPMorgan Chase & Co or any ofits affiliates.
In appointing a Director the Board takes into account the relative mix and composition of the Board, which as a whole has a breadth ofinvestment knowledge, financial skills, as well as other experience relevant to the Fund’s business.
The Board does not limit the number of years of Directors’ service and it does take into account the nature and requirements of the fundindustry and of the Fund’s business when appointing Directors. The terms of each Director’s appointment are set out in a letter ofappointment.
At the Board Meeting on 26 March 2020, the Directors resolved to appoint Samantha McConnell as an Independent Non-Executive Directorsubject to receiving Regulatory approval from the Central Bank of Ireland (CBI).
Ms McConnell holds a number of INED roles for fund companies and is currently Head of TAS Ireland, Willis Towers Watson Ireland. She hasover 20 years’ experience in the investment industry having held the role of Chief Investment for a MiFID regulated entity for over fourteenyears with responsibility for leading an in-house investment team. Ms McConnell is entrepreneurial in focus and throughout her career hasled diverse teams through significant change and is experienced in dealing with high level stakeholder groups. She currently holdsIndependent Non-Executive roles in two Super Management Companies and is Chair of the Investment Committee of an AIFM which overseesover eighty different investment funds covering the entire asset management spectrum. She holds an IoD Chartered Director Diploma, is aCFA charterholder and has completed the ACCA qualification.
Induction and TrainingAll new Directors will receive an induction incorporating relevant information regarding the Fund and their duties and responsibilities as aDirector. In addition, the Board takes active steps to keep up to date with developments relevant to the Fund and have ensured that a formaltraining programme is in place.
Board EvaluationThe Board carries out an annual review of its performance, which is formally documented every other year.
JPMorgan Funds (Ireland) ICAVBoard of Directors’ Report (continued)For the year ended 31 December 2019
4
Board RemunerationThe Board believes that the remuneration of its members should reflect the responsibilities and experience of the Board as a whole and befair and appropriate given the size, complexity and investment objectives of the Fund. The remuneration is reviewed on an annual basis. TheDirectors are currently paid EUR 26,000 per annum apart from the Connected Non-Executive Director who has agreed to waive hisremuneration. No element of the remuneration paid by the Fund to the Directors is performance related.
Board Meetings and CommitteesThe Board meets quarterly but if necessary additional meetings will be arranged. Given the scope and nature of the business of the Fund, theBoard does not currently consider it necessary to have a formal Audit or Remuneration Committee or indeed any other standing committees.However, this is kept under review. All Board related matters are therefore currently approved by the Board or, where there are specificmatters that need further consideration, a Sub-Committee of the Board could be formed for this specific purpose. Such circumstances couldbe where the Board requests some amendments to the Prospectus and where it is not appropriate to wait till the next quarterly Boardmeeting for this to be approved. These Sub-Committee meetings are usually formed of a minimum of two Directors.
There were six Board meetings held during the year. Four of these were quarterly Board meetings where, amongst other matters, the agendaincluded those items highlighted under the section above called ‘Role and Responsibility of the Board of Directors’ and two were ad hocBoard meetings.
Internal ControlInvestment management and all administrative services are provided by the Management Company, or its delegates, and custody of assets isprovided by J.P. Morgan Bank (Ireland) plc. The Board’s system of internal control therefore mainly comprises monitoring the servicesprovided by the Management Company and the Depositary, including the operational and compliance controls established by them to meetthe Fund’s obligations to shareholders as set out in the Prospectus, Instrument of Incorporation as well as all relevant regulations. TheManagement Company formally reports to the Board on a quarterly basis on the various activities it is responsible for and in addition shallinform the Board without delay of any material administrative or accounting matters.
Corporate Governance and Irish Funds Industry Association Code of ConductThe Board is responsible for ensuring that a high level of corporate governance is met and considers that the Fund has complied with the bestpractices in the Irish funds industry.
In particular the Board has adopted the Irish Funds Industry Association Code of Conduct (the “Code”) indicated inhttps://www.irishfunds.ie/regulatory-technical/corporate-governance which sets provisions on good governance in the following areas:
1. Composition of the Board2. Chairperson3. Independent Directors4. Role of the Board5. Appointments6. Meetings7. Reserved Powers8. Compliance9. Delegates10. Risk Management, Audit, Control & Compliance
The Board considers that the Fund has been in compliance with the principles in all material aspects throughout the financial year ended 31December 2019. The Board will undertake an annual review of ongoing compliance with the Code.
Proxy Voting PolicyThe Board delegates responsibility for proxy voting to the Management Company. The Management Company manages the voting rights ofthe shares entrusted in a prudent and diligent manner, based exclusively on the reasonable judgement of what will best serve the financialinterests of clients. So far as is practicable, the Management Company will vote at all of the meetings called by companies in which they areinvested.
A copy of the J.P. Morgan Asset Management which Global Proxy Voting Policy is available from the Fund’s registered office upon request oron the website:
https://am.jpmorgan.com/uk/institutional/corporate-governance
Directors and Officers Indemnity Insurance
The Fund’s Instrument of Incorporation indemnifies the Directors against expenses reasonably incurred in connection with any claim againstthem arising in the course of their duties or responsibilities as long as they have not acted fraudulently or dishonestly. To protectshareholders against any such claim, the Board has taken out Directors and Officers Indemnity Insurance which indemnifies the Directorsagainst certain liabilities arising in the course of their duties and responsibilities but does not cover against any negligent, fraudulent ordishonest actions on their part.
Review of Performance and Fund Business
A review of the Fund’s performance and activities for the year ended 31 December 2019 is included in the Investment Manager’s Report.
Risk Management Objectives and Policies
The principal risks faced by the Fund are the investment risks associated with the portfolio of investments of each of the Sub-Funds and theoperational risks associated with their management and administration.
The main risks of the sub-fund and the policies and procedures to manage financial risks are outlined in Note 12.
JPMorgan Funds (Ireland) ICAVBoard of Directors’ Report (continued)For the year ended 31 December 2019
5
Directors’ Interests in Shares of the Fund
No Director, nor the Company Secretary, had any beneficial interest in the shares of the Fund during the year.
Other than as disclosed in Note 12 to the financial statements, there were no contracts or agreements of any significance in relation to thebusiness of the Fund in which the Directors had any interest, as defined in the Act, at any time during the year.
Transactions with Connected Persons
The UCITS Regulations require that any transaction carried out with the Fund by a manager or depositary to the UCITS, the delegates orsub-delegates of the manager or depositary, and any associated or group companies of such a manager, depositary, delegate orsub-delegate (“connected persons”) must be carried out as if negotiated at arm’s length. Transactions must be in the best interests of theshareholders.
The Directors are satisfied that there are arrangements (evidenced by written procedures) in place, to ensure that the obligations set out inRegulation 41(1) of the Central Bank UCITS Regulations are applied to all transactions with connected persons, and are satisfied thattransactions with connected parties entered into during the period complied with the obligations set out in Regulation 41(1) of the CentralBank UCITS Regulations.
The connected persons are the Management Company and the Investment Manager; the Administrator and the Depositary. The relevant feescharged by these connected persons are detailed in Note 14.
Key Performance Indicators
The key performance indicators monitored for each Sub-Fund include the performance of the Sub-Funds and compliance with investmentrestrictions and risk limits. The performance of the Sub-Funds is reviewed in the Investment Manager’s Reports on page 6-7.
Dividends
Dividend distributions declared for the sub-funds during the year are disclosed in Note 15.
Employees
The Fund had no employees during the year ended 31 December 2019.
Future Developments
The Fund will continue to act as an investment vehicle as set out in the Prospectus.
Independent Auditor
PricewaterhouseCoopers, Chartered Accountants and Registered Auditors, were appointed in accordance with the ICAV Act and haveexpressed their willingness to continue in office.
Annual General Meeting
The Board have exercised their discretion and dispensed with annual general meetings in accordance with the Fund’s Instrument ofIncorporation.
Privacy Policy
The Management Company complies with a privacy policy that has been issued by J.P. Morgan Asset Management which can be accessed atwww.jpmorgan.com/emea-privacy-policy. This policy was updated to comply with the General Data Protection Regulation.
Significant Events During the Year
During the year, the total net assets of the Fund increased from USD 21 million to USD 27 million at year end.
a) Sub-Fund full redemptionsWith effect from October 2019 the below sub-funds were removed from the prospectus as they had been fully redeemed:
JPMorgan Funds (Ireland) ICAV - Emerging Markets Government Bond Index Fund
JPMorgan Funds (Ireland) ICAV - Global Corporate Bond Index Fund
JPMorgan Funds (Ireland) ICAV - Global Government Bond Index Fund
JPMorgan Funds (Ireland) ICAV - Canada Equity Index Fund
JPMorgan Funds (Ireland) ICAV - China Equity Index Fund
JPMorgan Funds (Ireland) ICAV - Emerging Markets Equity Index Fund
JPMorgan Funds (Ireland) ICAV - Europe ex-UK Equity Index Fund
JPMorgan Funds (Ireland) ICAV - Japan Equity Index Fund
JPMorgan Funds (Ireland) ICAV - Pacific ex-Japan Equity Index Fund
JPMorgan Funds (Ireland) ICAV - UK Equity Index Fund
JPMorgan Funds (Ireland) ICAV - US Equity Index Fund
JPMorgan Funds (Ireland) ICAVBoard of Directors’ Report (continued)For the year ended 31 December 2019
b) Changes to the Prospectus:The significant events for the Sub-Fund during the year are disclosed in Note 20.
Significant Events After the Year end
a) Removal of Swing Waiver mechanism:With effect from 1 January 2020, JPMorgan Funds (Ireland) ICAV - Developed World Equity Index Fund was removed from the swing waivermechanism.
b) At the Board Meeting on 26 March 2020, the Directors resolved to appoint Samantha McConnell as an Independent Non-Executive Directorsubject to receiving Regulatory approval from the Central Bank of Ireland (CBI).
c) Covid-19 AddendumBeginning in January 2020, global financial markets have experienced and may continue to experience significant volatility resulting fromthe spread of COVID-19. The outbreak of COVID-19 has resulted in travel and border restrictions, quarantines, supply chain disruptions, lowerconsumer demand and general market uncertainty. This has led to a significant correction in the financial markets. The effects of COVID-19have and may continue to adversely affect the global economy, the economies of certain nations and individual issuers, all of which maynegatively impact the market. The ICAV’s service providers have implemented contingency measures and continue to operate as expected.
On behalf of the Board
Director Director
Date: 22 April 2020 Date: 22 April 2020
6
JPMorgan Funds (Ireland) ICAVBoard of Directors’ Report (continued)For the year ended 31 December 2019
7
JPMorgan Funds (Ireland) ICAVInvestment Manager’s ReportFor the year ended 31 December 2019
Market Review
Equity markets delivered fantastic returns in 2019. The MSCI World Index was up 28%, led by US equities (+31%), with European equities(+27%) in hot pursuit. Despite this roaring return from equities, government bonds also delivered good returns.After the sharp falls in equities during the fourth quarter of 2018, the first four months of 2019 brought a strong rebound, as central bankssignalled that rather than raise interest rates they would provide yet more stimulus to try to keep the economic expansion intact. Equitiesclearly believed the central banks would succeed.Then, from the end of April to end of September, global equities broadly traded sideways with some bumps in the road, as investors digestedthe ebbs and flows in the trade negotiations between the US and China, and the continued deterioration in macroeconomic indicators.Remarkably, by the end of September, the 20+ year Treasury index was up 20%, while the MSCI World was up 18%. The flood of central bankliquidity had lifted all boats. Such strong returns for both traditional risk-off and risk-on assets, at the same time, is unusual. By the timeOctober began, both the bulls and the bears had been very well fed.However, the fourth quarter has decided the year in favour of the bulls. Global equities rose 9% in the last three months of the year, whiledeveloped market government bonds gave up some of their gains.Several factors helped drive equities and bond yields higher in the final quarter. First of all, the US and eurozone manufacturing businesssurveys picked up slightly from September, although they remain weak. Second, the service sector business surveys in the US and Europealso picked up. Most importantly, despite headlines involving large job cuts at some companies in Europe, overall employment has held upwell, and in the US over 200,000 jobs were added in November. The pick up in the service sectors, and the resilience of overall employment tothe weakness in manufacturing, has helped restore market confidence that a recession is not imminent.The fourth quarter also saw two significant political risks avoided, at least for now. US tariffs on China were scheduled to increase on 15December but a phase one trade deal avoided that outcome and provided a significant relief for equity markets. The fact that the US alsodidn’t impose tariffs on European Union auto exports also helped support equities. How long the trade peace will last is anyone’s guess butthe market ended the quarter cheered by the fact the worst case scenario for trade had, at least for now, been avoided.The large majority for the Conservative Party in the UK election in December removed the threat of nationalisation for some utilitycompanies. The utility sector in the UK rallied 6% following the election result. In addition, the election meant that the UK could pass aEuropean Union withdrawal bill, activating a transition period during which little will change, until the end of 2020. The combination of theseelection implications helped lift UK stocks and sterling over the quarter. However, sterling’s initial rally after the election result soon fadedwhen it was announced that it would be made law that there would be no extension to the transition period beyond the end of 2020, givingthe UK government a very short period of time to agree a free trade deal that avoids a hard Brexit.The fourth quarter was also notable for personnel changes at key central banks with Christine Lagarde taking over from Mario Draghi at theEuropean Central Bank (ECB) and Andrew Bailey being announced as Mark Carney’s successor at the Bank of England. In terms of policyaction, both the Federal Reserve and the ECB started to expand their balance sheets again and the Fed cut interest rates for the third time thisyear.
Outlook
2019 was a great year to be invested, almost irrespective of what you were invested in. Next year is unlikely to be so indiscriminate and suchhigh returns are likely to be harder to come by. If the global economy reaccelerates, equities should rise, although higher starting valuationsmight limit the extent of the upside. In this scenario, government bond yields should also move higher, rather than fall as they did in 2019.However, if growth continues to slow and profit pressures cause companies to cut jobs, then 2020 could be another good year forgovernment bonds, and a more challenging year for equities and credit. Either way, with the Brexit trade negotiations and the US election tocontend with, 2020 certainly won’t be a quiet one, with plenty of uncertainty likely to linger.While 2019 shows that uncertainty doesn’t have to be the enemy of investors, to navigate this prolonged political uncertainty amid a latecycle economic backdrop will be no easy task. As we start the year, we continue to think a broadly neutral, balanced portfolio of equities,government bonds and defensive alternatives, still makes sense until both the economic and political outlook is clearer.
JPMorgan Funds (Ireland) ICAVInvestment Manager’s Report (continued)For the year ended 31 December 2019
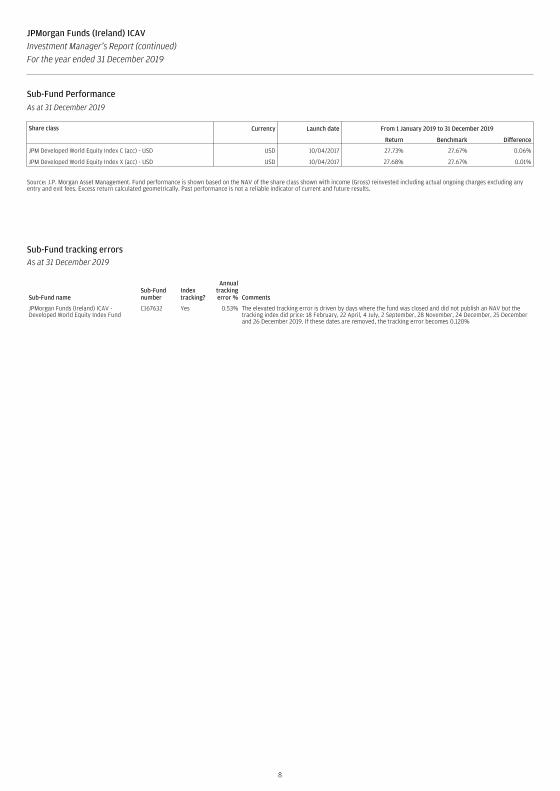
Sub-Fund PerformanceAs at 31 December 2019
Share class Currency Launch date From 1 January 2019 to 31 December 2019
Return Benchmark Difference
JPM Developed World Equity Index C (acc) - USD USD 10/04/2017 27.73% 27.67% 0.06%
JPM Developed World Equity Index X (acc) - USD USD 10/04/2017 27.68% 27.67% 0.01%
Source: J.P. Morgan Asset Management. Fund performance is shown based on the NAV of the share class shown with income (Gross) reinvested including actual ongoing charges excluding anyentry and exit fees. Excess return calculated geometrically. Past performance is not a reliable indicator of current and future results.
Sub-Fund tracking errorsAs at 31 December 2019
Sub-Fund nameSub-Fundnumber
Indextracking?
Annualtrackingerror % Comments
JPMorgan Funds (Ireland) ICAV -Developed World Equity Index Fund
C167632 Yes 0.53% The elevated tracking error is driven by days where the fund was closed and did not publish an NAV but thetracking index did price: 18 February, 22 April, 4 July, 2 September, 28 November, 24 December, 25 Decemberand 26 December 2019. If these dates are removed, the tracking error becomes 0.120%
8
9
JPMorgan Funds (Ireland) ICAVReport of the Depositary to the ShareholdersFor the year ended 31 December 2019
We, J.P.Morgan Bank (Ireland) plc, appointed Depositary to JPMorgan Funds (Ireland) ICAV (“the ICAV”) provide this report solely in favour ofthe Shareholders of the ICAV for the year ended 31 December 2019 (“the Accounting Period”).
This report is provided in accordance with the UCITS Regulations - European Communities (Undertakings for Collective Investment inTransferable Securities) Regulations 2011, as amended, (“the Regulations”). We do not, in the provision of this report, accept nor assumeresponsibility for any other purpose or to any other person to whom this report is shown.
In accordance with our Depositary obligation as provided for under the Regulations, we have enquired into the conduct of the ICAV for theAccounting Period and we hereby report thereon to the Shareholders of the ICAV as follows;
We are of the opinion that the ICAV has been managed during the Accounting Period, in all material respects:
(i) in accordance with the limitations imposed on the investment and borrowing powers of the ICAV by the constitutional documents and theRegulations; and
(ii) otherwise in accordance with the provisions of the constitutional documents and the Regulations.
For and on behalf of
J.P. Morgan Bank (Ireland) plc200 Capital Dock79 Sir John Rogerson’s QuayDublin 2, D02 RK57Ireland
Date: 22 April 2020
10
Independent auditors’ report to the shareholders of JPMorgan Funds (Ireland) ICAV
Report on the audit of the financial statements
Opinion
In our opinion, JPMorgan Funds (Ireland) ICAV’s financial statements:
· give a true and fair view of the ICAV’s assets, liabilities and financial position as at 31 December 2019 and of its results and cash flows for the year thenended;
· have been properly prepared in accordance with International Financial Reporting Standards (“IFRSs”) as adopted by the European Union; and· have been properly prepared in accordance with the requirements of the Irish Collective Asset-management Vehicles Act 2015 and the European
Communities (Undertakings for Collective Investment in Transferable Securities) Regulations 2011 (as amended).
We have audited the financial statements, included within the Audited Annual Report, which comprise:
· the Statement of Financial Position as at 31 December 2019;· the Statement of Comprehensive Income for the year then ended;· the Statement of Cash Flows for the year then ended;· the Statement of Changes in Net Assets Attributable to Holders of Redeemable Shares for the year then ended;· the Schedule of Investments as at 31 December 2019; and· the notes to the financial statements, which include a description of the significant accounting policies.
Basis for opinion
We conducted our audit in accordance with International Standards on Auditing (Ireland) (“ISAs (Ireland)”) and applicable law.
Our responsibilities under ISAs (Ireland) are further described in the Auditors’ responsibilities for the audit of the financial statements section of our report.We believe that the audit evidence we have obtained is sufficient and appropriate to provide a basis for our opinion.
Independence
We remained independent of the ICAV in accordance with the ethical requirements that are relevant to our audit of the financial statements in Ireland, whichincludes IAASA’s Ethical Standard, and we have fulfilled our other ethical responsibilities in accordance with these requirements.
Conclusions relating to going concern
We have nothing to report in respect of the following matters in relation to which ISAs (Ireland) require us to report to you where:
· the directors’ use of the going concern basis of accounting in the preparation of the financial statements is not appropriate; or· the directors have not disclosed in the financial statements any identified material uncertainties that may cast significant doubt about the ICAV’s ability
to continue to adopt the going concern basis of accounting for a period of at least twelve months from the date when the financial statements areauthorised for issue.
However, because not all future events or conditions can be predicted, this statement is not a guarantee as to the ICAV’s ability to continue as a goingconcern.
11
Reporting on other information
The other information comprises all of the information in the Audited Annual Report other than the financial statements and our auditors’ report thereon.The directors are responsible for the other information. Our opinion on the financial statements does not cover the other information and, accordingly, we donot express an audit opinion or, except to the extent otherwise explicitly stated in this report, any form of assurance thereon. In connection with our audit ofthe financial statements, our responsibility is to read the other information and, in doing so, consider whether the other information is materiallyinconsistent with the financial statements or our knowledge obtained in the audit, or otherwise appears to be materially misstated. If we identify an apparentmaterial inconsistency or material misstatement, we are required to perform procedures to conclude whether there is a material misstatement of thefinancial statements or a material misstatement of the other information. If, based on the work we have performed, we conclude that there is a materialmisstatement of this other information, we are required to report that fact. We have nothing to report based on these responsibilities.
Based on the responsibilities described above and our work undertaken in the course of the audit, the Irish Collective Asset-management Vehicles Act 2015requires us to also report the opinion as described below:
· In our opinion, based on the work undertaken in the course of the audit, the information given in the Board of Directors’ Report for the year ended 31December 2019 is consistent with the financial statements.
Responsibilities for the financial statements and the audit
Responsibilities of the directors for the financial statements
As explained more fully in the Role and Responsibility of the Board of Directors the directors are responsible for the preparation of the financial statements inaccordance with the applicable framework and for being satisfied that they give a true and fair view.
The directors are also responsible for such internal control as they determine is necessary to enable the preparation of financial statements that are freefrom material misstatement, whether due to fraud or error.
In preparing the financial statements, the directors are responsible for assessing the ICAV’s ability to continue as a going concern, disclosing as applicable,matters related to going concern and using the going concern basis of accounting unless the directors either intend to liquidate the ICAV or to ceaseoperations, or have no realistic alternative but to do so.
Auditors’ responsibilities for the audit of the financial statements
Our objectives are to obtain reasonable assurance about whether the financial statements as a whole are free from material misstatement, whether due tofraud or error, and to issue an auditors’ report that includes our opinion. Reasonable assurance is a high level of assurance, but is not a guarantee that anaudit conducted in accordance with ISAs (Ireland) will always detect a material misstatement when it exists. Misstatements can arise from fraud or error andare considered material if, individually or in the aggregate, they could reasonably be expected to influence the economic decisions of users taken on thebasis of these financial statements.
A further description of our responsibilities for the audit of the financial statements is located on the IAASA website at:
https://www.iaasa.ie/getmedia/b2389013-1cf6-458b-9b8f-a98202dc9c3a/Description_of_auditors_responsibilities_for_audit.pdf.
This description forms part of our auditors’ report.
Use of this report
This report, including the opinions, has been prepared for and only for the ICAV’s shareholders as a body in accordance with section 120 of the Irish CollectiveAsset-management Vehicles Act 2015 and for no other purpose. We do not, in giving these opinions, accept or assume responsibility for any other purpose orto any other person to whom this report is shown or into whose hands it may come save where expressly agreed by our prior consent in writing.
12
Other required reporting
Irish Collective Asset-management Vehicles Act 2015 exception reporting
Directors’ remuneration
Under the Irish Collective Asset-management Vehicles Act 2015 we are required to report to you if, in our opinion, the disclosures of directors’ remunerationspecified by section 117 of that Act have not been made. We have no exceptions to report arising from this responsibility.
PricewaterhouseCoopersChartered Accountants and Statutory Audit FirmDublin22 April 2020
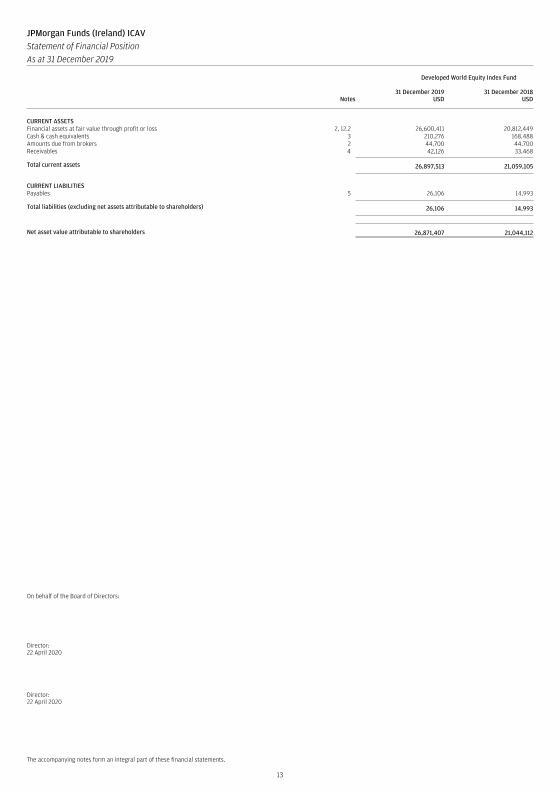
JPMorgan Funds (Ireland) ICAVStatement of Financial PositionAs at 31 December 2019
Developed World Equity Index Fund
Notes31 December 2019
USD31 December 2018
USD
CURRENT ASSETSFinancial assets at fair value through profit or loss 2, 12.2 26,600,411 20,812,449Cash & cash equivalents 3 210,276 168,488Amounts due from brokers 2 44,700 44,700Receivables 4 42,126 33,468
Total current assets 26,897,513 21,059,105
CURRENT LIABILITIESPayables 5 26,106 14,993
Total liabilities (excluding net assets attributable to shareholders) 26,106 14,993
Net asset value attributable to shareholders 26,871,407 21,044,112
On behalf of the Board of Directors:
Director:22 April 2020
Director:22 April 2020
The accompanying notes form an integral part of these financial statements.
13
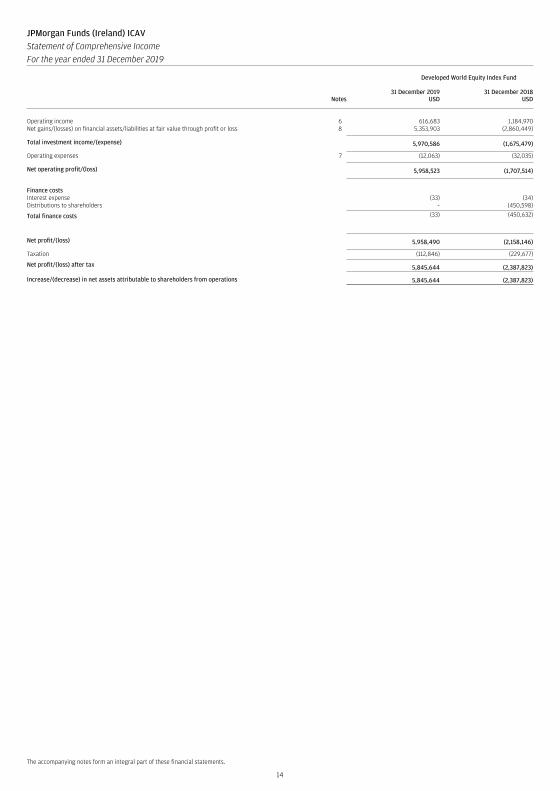
JPMorgan Funds (Ireland) ICAVStatement of Comprehensive IncomeFor the year ended 31 December 2019
Developed World Equity Index Fund
Notes31 December 2019
USD31 December 2018
USD
Operating income 6 616,683 1,184,970Net gains/(losses) on financial assets/liabilities at fair value through profit or loss 8 5,353,903 (2,860,449)
Total investment income/(expense) 5,970,586 (1,675,479)
Operating expenses 7 (12,063) (32,035)
Net operating profit/(loss) 5,958,523 (1,707,514)
Finance costsInterest expense (33) (34)Distributions to shareholders – (450,598)
Total finance costs (33) (450,632)
Net profit/(loss) 5,958,490 (2,158,146)
Taxation (112,846) (229,677)
Net profit/(loss) after tax 5,845,644 (2,387,823)
Increase/(decrease) in net assets attributable to shareholders from operations 5,845,644 (2,387,823)
The accompanying notes form an integral part of these financial statements.
14
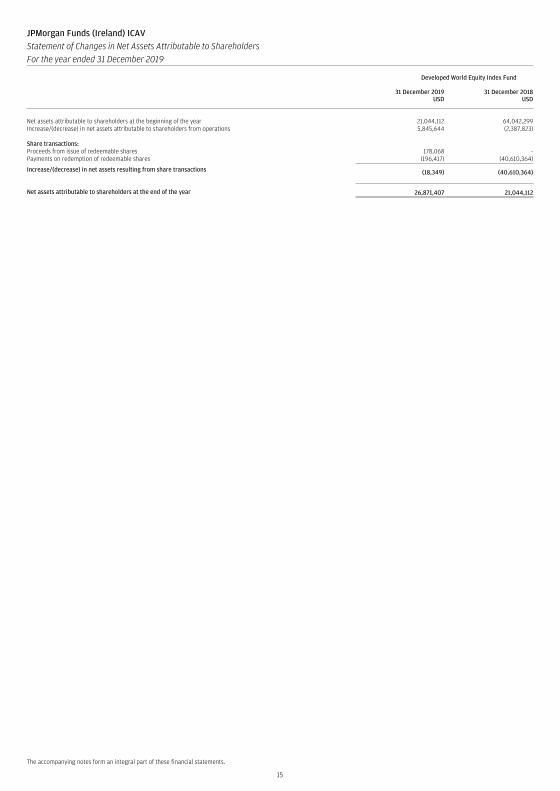
JPMorgan Funds (Ireland) ICAVStatement of Changes in Net Assets Attributable to ShareholdersFor the year ended 31 December 2019
Developed World Equity Index Fund
31 December 2019USD
31 December 2018USD
Net assets attributable to shareholders at the beginning of the year 21,044,112 64,042,299Increase/(decrease) in net assets attributable to shareholders from operations 5,845,644 (2,387,823)
Share transactions:Proceeds from issue of redeemable shares 178,068 -Payments on redemption of redeemable shares (196,417) (40,610,364)
Increase/(decrease) in net assets resulting from share transactions (18,349) (40,610,364)
Net assets attributable to shareholders at the end of the year 26,871,407 21,044,112
The accompanying notes form an integral part of these financial statements.
15
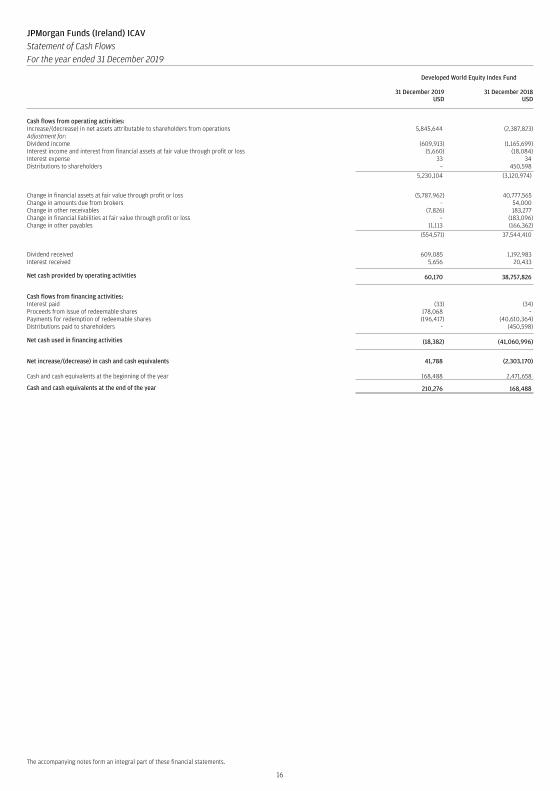
JPMorgan Funds (Ireland) ICAVStatement of Cash FlowsFor the year ended 31 December 2019
Developed World Equity Index Fund
31 December 2019USD
31 December 2018USD
Cash flows from operating activities:Increase/(decrease) in net assets attributable to shareholders from operations 5,845,644 (2,387,823)Adjustment for:Dividend income (609,913) (1,165,699)Interest income and interest from financial assets at fair value through profit or loss (5,660) (18,084)Interest expense 33 34Distributions to shareholders – 450,598
5,230,104 (3,120,974)
Change in financial assets at fair value through profit or loss (5,787,962) 40,777,565Change in amounts due from brokers – 54,000Change in other receivables (7,826) 183,277Change in financial liabilities at fair value through profit or loss – (183,096)Change in other payables 11,113 (166,362)
(554,571) 37,544,410
Dividend received 609,085 1,192,983Interest received 5,656 20,433
Net cash provided by operating activities 60,170 38,757,826
Cash flows from financing activities:Interest paid (33) (34)Proceeds from issue of redeemable shares 178,068 –Payments for redemption of redeemable shares (196,417) (40,610,364)Distributions paid to shareholders - (450,598)
Net cash used in financing activities (18,382) (41,060,996)
Net increase/(decrease) in cash and cash equivalents 41,788 (2,303,170)
Cash and cash equivalents at the beginning of the year 168,488 2,471,658
Cash and cash equivalents at the end of the year 210,276 168,488
The accompanying notes form an integral part of these financial statements.
16
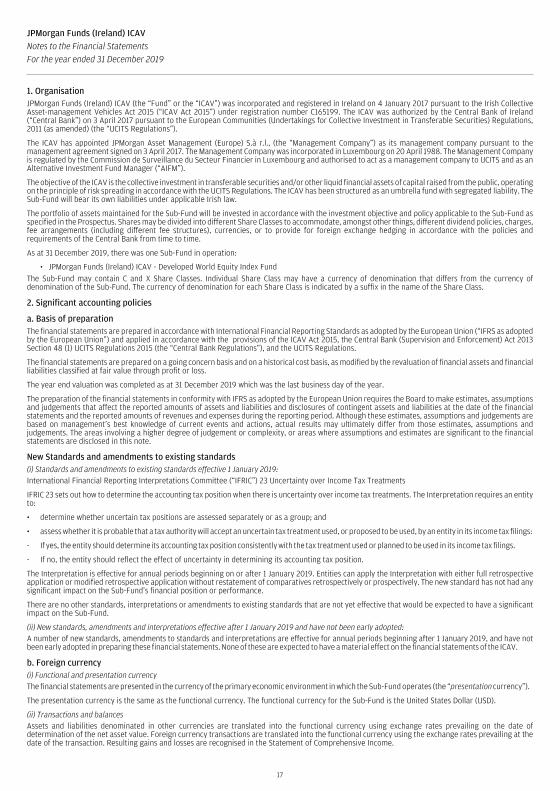
1. OrganisationJPMorgan Funds (Ireland) ICAV (the “Fund” or the “ICAV”) was incorporated and registered in Ireland on 4 January 2017 pursuant to the Irish CollectiveAsset-management Vehicles Act 2015 (“ICAV Act 2015”) under registration number C165199. The ICAV was authorized by the Central Bank of Ireland(“Central Bank”) on 3 April 2017 pursuant to the European Communities (Undertakings for Collective Investment in Transferable Securities) Regulations,2011 (as amended) (the “UCITS Regulations”).
The ICAV has appointed JPMorgan Asset Management (Europe) S.à r.l., (the “Management Company”) as its management company pursuant to themanagement agreement signed on 3 April 2017. The Management Company was incorporated in Luxembourg on 20 April 1988. The Management Companyis regulated by the Commission de Surveillance du Secteur Financier in Luxembourg and authorised to act as a management company to UCITS and as anAlternative Investment Fund Manager (“AIFM”).
The objective of the ICAV is the collective investment in transferable securities and/or other liquid financial assets of capital raised from the public, operatingon the principle of risk spreading in accordance with the UCITS Regulations. The ICAV has been structured as an umbrella fund with segregated liability. TheSub-Fund will bear its own liabilities under applicable Irish law.
The portfolio of assets maintained for the Sub-Fund will be invested in accordance with the investment objective and policy applicable to the Sub-Fund asspecified in the Prospectus. Shares may be divided into different Share Classes to accommodate, amongst other things, different dividend policies, charges,fee arrangements (including different fee structures), currencies, or to provide for foreign exchange hedging in accordance with the policies andrequirements of the Central Bank from time to time.
As at 31 December 2019, there was one Sub-Fund in operation:
• JPMorgan Funds (Ireland) ICAV - Developed World Equity Index FundThe Sub-Fund may contain C and X Share Classes. Individual Share Class may have a currency of denomination that differs from the currency ofdenomination of the Sub-Fund. The currency of denomination for each Share Class is indicated by a suffix in the name of the Share Class.
2. Significant accounting policies
a. Basis of preparationThe financial statements are prepared in accordance with International Financial Reporting Standards as adopted by the European Union (“IFRS as adoptedby the European Union”) and applied in accordance with the provisions of the ICAV Act 2015, the Central Bank (Supervision and Enforcement) Act 2013Section 48 (1) UCITS Regulations 2015 (the “Central Bank Regulations”), and the UCITS Regulations.
The financial statements are prepared on a going concern basis and on a historical cost basis, as modified by the revaluation of financial assets and financialliabilities classified at fair value through profit or loss.
The year end valuation was completed as at 31 December 2019 which was the last business day of the year.
The preparation of the financial statements in conformity with IFRS as adopted by the European Union requires the Board to make estimates, assumptionsand judgements that affect the reported amounts of assets and liabilities and disclosures of contingent assets and liabilities at the date of the financialstatements and the reported amounts of revenues and expenses during the reporting period. Although these estimates, assumptions and judgements arebased on management’s best knowledge of current events and actions, actual results may ultimately differ from those estimates, assumptions andjudgements. The areas involving a higher degree of judgement or complexity, or areas where assumptions and estimates are significant to the financialstatements are disclosed in this note.
New Standards and amendments to existing standards(i) Standards and amendments to existing standards effective 1 January 2019:International Financial Reporting Interpretations Committee (“IFRIC”) 23 Uncertainty over Income Tax Treatments
IFRIC 23 sets out how to determine the accounting tax position when there is uncertainty over income tax treatments. The Interpretation requires an entityto:
• determine whether uncertain tax positions are assessed separately or as a group; and
• assess whether it is probable that a tax authority will accept an uncertain tax treatment used, or proposed to be used, by an entity in its income tax filings:
- If yes, the entity should determine its accounting tax position consistently with the tax treatment used or planned to be used in its income tax filings.
- If no, the entity should reflect the effect of uncertainty in determining its accounting tax position.
The Interpretation is effective for annual periods beginning on or after 1 January 2019. Entities can apply the Interpretation with either full retrospectiveapplication or modified retrospective application without restatement of comparatives retrospectively or prospectively. The new standard has not had anysignificant impact on the Sub-Fund’s financial position or performance.
There are no other standards, interpretations or amendments to existing standards that are not yet effective that would be expected to have a significantimpact on the Sub-Fund.
(ii) New standards, amendments and interpretations effective after 1 January 2019 and have not been early adopted:A number of new standards, amendments to standards and interpretations are effective for annual periods beginning after 1 January 2019, and have notbeen early adopted in preparing these financial statements. None of these are expected to have a material effect on the financial statements of the ICAV.
b. Foreign currency(i) Functional and presentation currencyThe financial statements are presented in the currency of the primary economic environment in which the Sub-Fund operates (the “presentation currency”).
The presentation currency is the same as the functional currency. The functional currency for the Sub-Fund is the United States Dollar (USD).
(ii) Transactions and balancesAssets and liabilities denominated in other currencies are translated into the functional currency using exchange rates prevailing on the date ofdetermination of the net asset value. Foreign currency transactions are translated into the functional currency using the exchange rates prevailing at thedate of the transaction. Resulting gains and losses are recognised in the Statement of Comprehensive Income.
17
JPMorgan Funds (Ireland) ICAVNotes to the Financial StatementsFor the year ended 31 December 2019
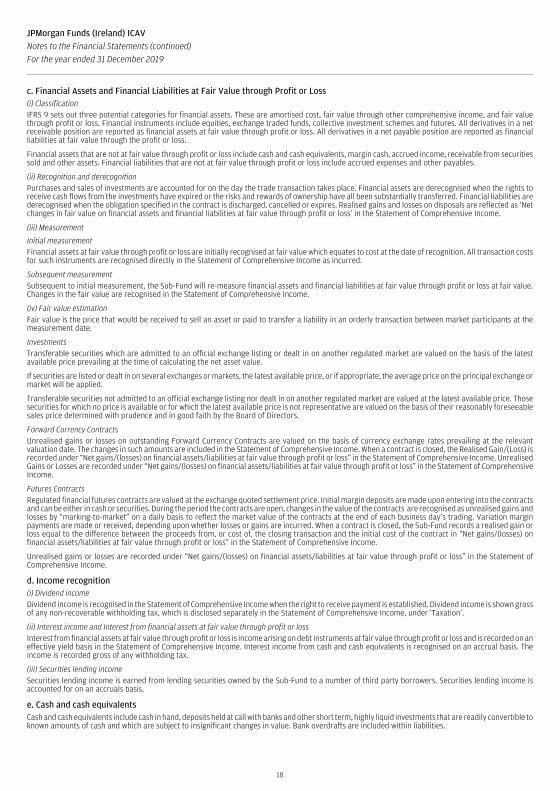
c. Financial Assets and Financial Liabilities at Fair Value through Profit or Loss(i) ClassificationIFRS 9 sets out three potential categories for financial assets. These are amortised cost, fair value through other comprehensive income, and fair valuethrough profit or loss. Financial instruments include equities, exchange traded funds, collective investment schemes and futures. All derivatives in a netreceivable position are reported as financial assets at fair value through profit or loss. All derivatives in a net payable position are reported as financialliabilities at fair value through the profit or loss.
Financial assets that are not at fair value through profit or loss include cash and cash equivalents, margin cash, accrued income, receivable from securitiessold and other assets. Financial liabilities that are not at fair value through profit or loss include accrued expenses and other payables.
(ii) Recognition and derecognitionPurchases and sales of investments are accounted for on the day the trade transaction takes place. Financial assets are derecognised when the rights toreceive cash flows from the investments have expired or the risks and rewards of ownership have all been substantially transferred. Financial liabilities arederecognised when the obligation specified in the contract is discharged, cancelled or expires. Realised gains and losses on disposals are reflected as ‘Netchanges in fair value on financial assets and financial liabilities at fair value through profit or loss’ in the Statement of Comprehensive Income.
(iii) Measurement
Initial measurementFinancial assets at fair value through profit or loss are initially recognised at fair value which equates to cost at the date of recognition. All transaction costsfor such instruments are recognised directly in the Statement of Comprehensive Income as incurred.
Subsequent measurementSubsequent to initial measurement, the Sub-Fund will re-measure financial assets and financial liabilities at fair value through profit or loss at fair value.Changes in the fair value are recognised in the Statement of Comprehensive Income.
(iv) Fair value estimationFair value is the price that would be received to sell an asset or paid to transfer a liability in an orderly transaction between market participants at themeasurement date.
InvestmentsTransferable securities which are admitted to an official exchange listing or dealt in on another regulated market are valued on the basis of the latestavailable price prevailing at the time of calculating the net asset value.
If securities are listed or dealt in on several exchanges or markets, the latest available price, or if appropriate, the average price on the principal exchange ormarket will be applied.
Transferable securities not admitted to an official exchange listing nor dealt in on another regulated market are valued at the latest available price. Thosesecurities for which no price is available or for which the latest available price is not representative are valued on the basis of their reasonably foreseeablesales price determined with prudence and in good faith by the Board of Directors.
Forward Currency ContractsUnrealised gains or losses on outstanding Forward Currency Contracts are valued on the basis of currency exchange rates prevailing at the relevantvaluation date. The changes in such amounts are included in the Statement of Comprehensive Income. When a contract is closed, the Realised Gain/(Loss) isrecorded under “Net gains/(losses) on financial assets/liabilities at fair value through profit or loss” in the Statement of Comprehensive Income. UnrealisedGains or Losses are recorded under “Net gains/(losses) on financial assets/liabilities at fair value through profit or loss” in the Statement of ComprehensiveIncome.
Futures ContractsRegulated financial futures contracts are valued at the exchange quoted settlement price. Initial margin deposits are made upon entering into the contractsand can be either in cash or securities. During the period the contracts are open, changes in the value of the contracts are recognised as unrealised gains andlosses by “marking-to-market” on a daily basis to reflect the market value of the contracts at the end of each business day’s trading. Variation marginpayments are made or received, depending upon whether losses or gains are incurred. When a contract is closed, the Sub-Fund records a realised gain orloss equal to the difference between the proceeds from, or cost of, the closing transaction and the initial cost of the contract in “Net gains/(losses) onfinancial assets/liabilities at fair value through profit or loss” in the Statement of Comprehensive Income.
Unrealised gains or losses are recorded under “Net gains/(losses) on financial assets/liabilities at fair value through profit or loss” in the Statement ofComprehensive Income.
d. Income recognition(i) Dividend incomeDividend income is recognised in the Statement of Comprehensive Income when the right to receive payment is established. Dividend income is shown grossof any non-recoverable withholding tax, which is disclosed separately in the Statement of Comprehensive Income, under ‘Taxation’.
(ii) Interest income and Interest from financial assets at fair value through profit or lossInterest from financial assets at fair value through profit or loss is income arising on debt instruments at fair value through profit or loss and is recorded on aneffective yield basis in the Statement of Comprehensive Income. Interest income from cash and cash equivalents is recognised on an accrual basis. Theincome is recorded gross of any withholding tax.
(iii) Securities lending incomeSecurities lending income is earned from lending securities owned by the Sub-Fund to a number of third party borrowers. Securities lending income isaccounted for on an accruals basis.
e. Cash and cash equivalentsCash and cash equivalents include cash in hand, deposits held at call with banks and other short term, highly liquid investments that are readily convertible toknown amounts of cash and which are subject to insignificant changes in value. Bank overdrafts are included within liabilities.
18
JPMorgan Funds (Ireland) ICAVNotes to the Financial Statements (continued)For the year ended 31 December 2019
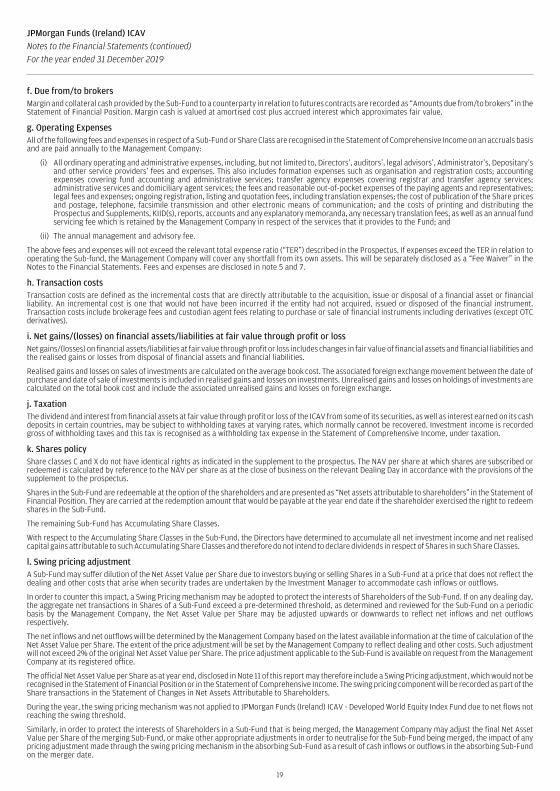
f. Due from/to brokersMargin and collateral cash provided by the Sub-Fund to a counterparty in relation to futures contracts are recorded as “Amounts due from/to brokers” in theStatement of Financial Position. Margin cash is valued at amortised cost plus accrued interest which approximates fair value.
g. Operating ExpensesAll of the following fees and expenses in respect of a Sub-Fund or Share Class are recognised in the Statement of Comprehensive Income on an accruals basisand are paid annually to the Management Company:
(i) All ordinary operating and administrative expenses, including, but not limited to, Directors’, auditors’, legal advisors’, Administrator’s, Depositary’sand other service providers’ fees and expenses. This also includes formation expenses such as organisation and registration costs; accountingexpenses covering fund accounting and administrative services; transfer agency expenses covering registrar and transfer agency services;administrative services and domiciliary agent services; the fees and reasonable out-of-pocket expenses of the paying agents and representatives;legal fees and expenses; ongoing registration, listing and quotation fees, including translation expenses; the cost of publication of the Share pricesand postage, telephone, facsimile transmission and other electronic means of communication; and the costs of printing and distributing theProspectus and Supplements, KIID(s), reports, accounts and any explanatory memoranda, any necessary translation fees, as well as an annual fundservicing fee which is retained by the Management Company in respect of the services that it provides to the Fund; and
(ii) The annual management and advisory fee.
The above fees and expenses will not exceed the relevant total expense ratio (“TER”) described in the Prospectus. If expenses exceed the TER in relation tooperating the Sub-fund, the Management Company will cover any shortfall from its own assets. This will be separately disclosed as a “Fee Waiver” in theNotes to the Financial Statements. Fees and expenses are disclosed in note 5 and 7.
h. Transaction costsTransaction costs are defined as the incremental costs that are directly attributable to the acquisition, issue or disposal of a financial asset or financialliability. An incremental cost is one that would not have been incurred if the entity had not acquired, issued or disposed of the financial instrument.Transaction costs include brokerage fees and custodian agent fees relating to purchase or sale of financial instruments including derivatives (except OTCderivatives).
i. Net gains/(losses) on financial assets/liabilities at fair value through profit or lossNet gains/(losses) on financial assets/liabilities at fair value through profit or loss includes changes in fair value of financial assets and financial liabilities andthe realised gains or losses from disposal of financial assets and financial liabilities.
Realised gains and losses on sales of investments are calculated on the average book cost. The associated foreign exchange movement between the date ofpurchase and date of sale of investments is included in realised gains and losses on investments. Unrealised gains and losses on holdings of investments arecalculated on the total book cost and include the associated unrealised gains and losses on foreign exchange.
j. TaxationThe dividend and interest from financial assets at fair value through profit or loss of the ICAV from some of its securities, as well as interest earned on its cashdeposits in certain countries, may be subject to withholding taxes at varying rates, which normally cannot be recovered. Investment income is recordedgross of withholding taxes and this tax is recognised as a withholding tax expense in the Statement of Comprehensive Income, under taxation.
k. Shares policyShare classes C and X do not have identical rights as indicated in the supplement to the prospectus. The NAV per share at which shares are subscribed orredeemed is calculated by reference to the NAV per share as at the close of business on the relevant Dealing Day in accordance with the provisions of thesupplement to the prospectus.
Shares in the Sub-Fund are redeemable at the option of the shareholders and are presented as “Net assets attributable to shareholders” in the Statement ofFinancial Position. They are carried at the redemption amount that would be payable at the year end date if the shareholder exercised the right to redeemshares in the Sub-Fund.
The remaining Sub-Fund has Accumulating Share Classes.
With respect to the Accumulating Share Classes in the Sub-Fund, the Directors have determined to accumulate all net investment income and net realisedcapital gains attributable to such Accumulating Share Classes and therefore do not intend to declare dividends in respect of Shares in such Share Classes.
l. Swing pricing adjustmentA Sub-Fund may suffer dilution of the Net Asset Value per Share due to investors buying or selling Shares in a Sub-Fund at a price that does not reflect thedealing and other costs that arise when security trades are undertaken by the Investment Manager to accommodate cash inflows or outflows.
In order to counter this impact, a Swing Pricing mechanism may be adopted to protect the interests of Shareholders of the Sub-Fund. If on any dealing day,the aggregate net transactions in Shares of a Sub-Fund exceed a pre-determined threshold, as determined and reviewed for the Sub-Fund on a periodicbasis by the Management Company, the Net Asset Value per Share may be adjusted upwards or downwards to reflect net inflows and net outflowsrespectively.
The net inflows and net outflows will be determined by the Management Company based on the latest available information at the time of calculation of theNet Asset Value per Share. The extent of the price adjustment will be set by the Management Company to reflect dealing and other costs. Such adjustmentwill not exceed 2% of the original Net Asset Value per Share. The price adjustment applicable to the Sub-Fund is available on request from the ManagementCompany at its registered office.
The official Net Asset Value per Share as at year end, disclosed in Note 11 of this report may therefore include a Swing Pricing adjustment, which would not berecognised in the Statement of Financial Position or in the Statement of Comprehensive Income. The swing pricing component will be recorded as part of theShare transactions in the Statement of Changes in Net Assets Attributable to Shareholders.
During the year, the swing pricing mechanism was not applied to JPMorgan Funds (Ireland) ICAV - Developed World Equity Index Fund due to net flows notreaching the swing threshold.
Similarly, in order to protect the interests of Shareholders in a Sub-Fund that is being merged, the Management Company may adjust the final Net AssetValue per Share of the merging Sub-Fund, or make other appropriate adjustments in order to neutralise for the Sub-Fund being merged, the impact of anypricing adjustment made through the swing pricing mechanism in the absorbing Sub-Fund as a result of cash inflows or outflows in the absorbing Sub-Fundon the merger date.
19
JPMorgan Funds (Ireland) ICAVNotes to the Financial Statements (continued)For the year ended 31 December 2019
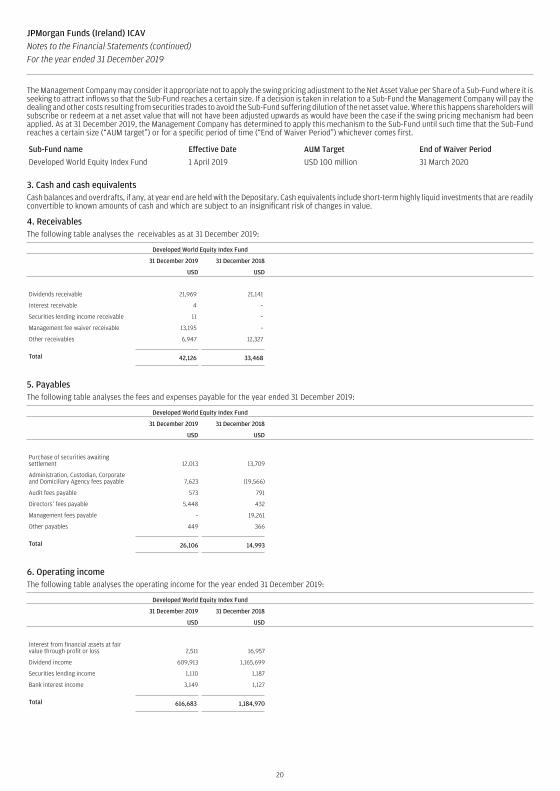
The Management Company may consider it appropriate not to apply the swing pricing adjustment to the Net Asset Value per Share of a Sub-Fund where it isseeking to attract inflows so that the Sub-Fund reaches a certain size. If a decision is taken in relation to a Sub-Fund the Management Company will pay thedealing and other costs resulting from securities trades to avoid the Sub-Fund suffering dilution of the net asset value. Where this happens shareholders willsubscribe or redeem at a net asset value that will not have been adjusted upwards as would have been the case if the swing pricing mechanism had beenapplied. As at 31 December 2019, the Management Company has determined to apply this mechanism to the Sub-Fund until such time that the Sub-Fundreaches a certain size (“AUM target”) or for a specific period of time (“End of Waiver Period”) whichever comes first.
Sub-Fund name Effective Date AUM Target End of Waiver Period
Developed World Equity Index Fund 1 April 2019 USD 100 million 31 March 2020
3. Cash and cash equivalentsCash balances and overdrafts, if any, at year end are held with the Depositary. Cash equivalents include short-term highly liquid investments that are readilyconvertible to known amounts of cash and which are subject to an insignificant risk of changes in value.
4. ReceivablesThe following table analyses the receivables as at 31 December 2019:
Developed World Equity Index Fund
31 December 2019 31 December 2018
USD USD
Dividends receivable 21,969 21,141
Interest receivable 4 –
Securities lending income receivable 11 –
Management fee waiver receivable 13,195 –
Other receivables 6,947 12,327
Total 42,126 33,468
5. PayablesThe following table analyses the fees and expenses payable for the year ended 31 December 2019:
Developed World Equity Index Fund
31 December 2019 31 December 2018
USD USD
Purchase of securities awaitingsettlement 12,013 13,709
Administration, Custodian, Corporateand Domiciliary Agency fees payable 7,623 (19,566)
Audit fees payable 573 791
Directors’ fees payable 5,448 432
Management fees payable – 19,261
Other payables 449 366
Total 26,106 14,993
6. Operating incomeThe following table analyses the operating income for the year ended 31 December 2019:
Developed World Equity Index Fund
31 December 2019 31 December 2018
USD USD
Interest from financial assets at fairvalue through profit or loss 2,511 16,957
Dividend income 609,913 1,165,699
Securities lending income 1,110 1,187
Bank interest income 3,149 1,127
Total 616,683 1,184,970
20
JPMorgan Funds (Ireland) ICAVNotes to the Financial Statements (continued)For the year ended 31 December 2019
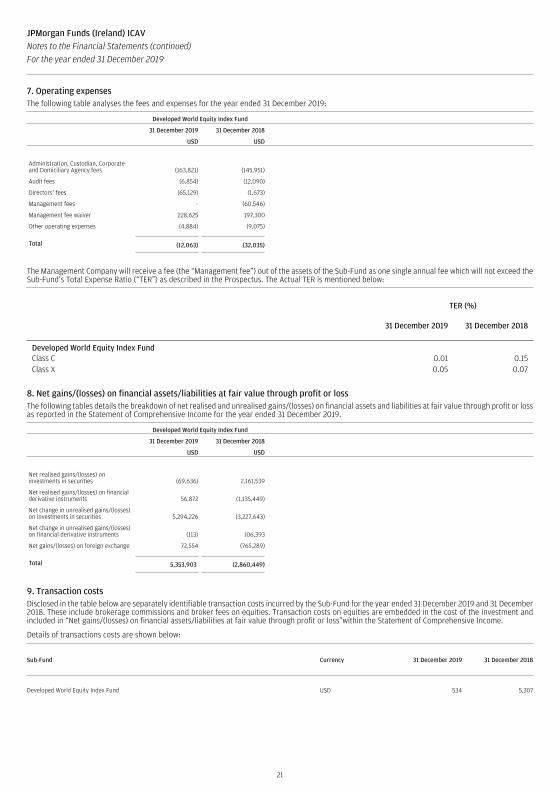
7. Operating expensesThe following table analyses the fees and expenses for the year ended 31 December 2019:
Developed World Equity Index Fund
31 December 2019 31 December 2018
USD USD
Administration, Custodian, Corporateand Domiciliary Agency fees (163,821) (145,951)
Audit fees (6,854) (12,090)
Directors’ fees (65,129) (1,673)
Management fees – (60,546)
Management fee waiver 228,625 197,300
Other operating expenses (4,884) (9,075)
Total (12,063) (32,035)
The Management Company will receive a fee (the “Management fee”) out of the assets of the Sub-Fund as one single annual fee which will not exceed theSub-Fund’s Total Expense Ratio (“TER”) as described in the Prospectus. The Actual TER is mentioned below:
TER (%)
31 December 2019 31 December 2018
Developed World Equity Index FundClass C 0.01 0.15Class X 0.05 0.07
8. Net gains/(losses) on financial assets/liabilities at fair value through profit or lossThe following tables details the breakdown of net realised and unrealised gains/(losses) on financial assets and liabilities at fair value through profit or lossas reported in the Statement of Comprehensive Income for the year ended 31 December 2019.
Developed World Equity Index Fund
31 December 2019 31 December 2018
USD USD
Net realised gains/(losses) oninvestments in securities (69,636) 2,161,539
Net realised gains/(losses) on financialderivative instruments 56,872 (1,135,449)
Net change in unrealised gains/(losses)on investments in securities 5,294,226 (3,227,643)
Net change in unrealised gains/(losses)on financial derivative instruments (113) 106,393
Net gains/(losses) on foreign exchange 72,554 (765,289)
Total 5,353,903 (2,860,449)
9. Transaction costsDisclosed in the table below are separately identifiable transaction costs incurred by the Sub-Fund for the year ended 31 December 2019 and 31 December2018. These include brokerage commissions and broker fees on equities. Transaction costs on equities are embedded in the cost of the investment andincluded in “Net gains/(losses) on financial assets/liabilities at fair value through profit or loss”within the Statement of Comprehensive Income.
Details of transactions costs are shown below:
Sub-Fund Currency 31 December 2019 31 December 2018
Developed World Equity Index Fund USD 534 5,307
21
JPMorgan Funds (Ireland) ICAVNotes to the Financial Statements (continued)For the year ended 31 December 2019
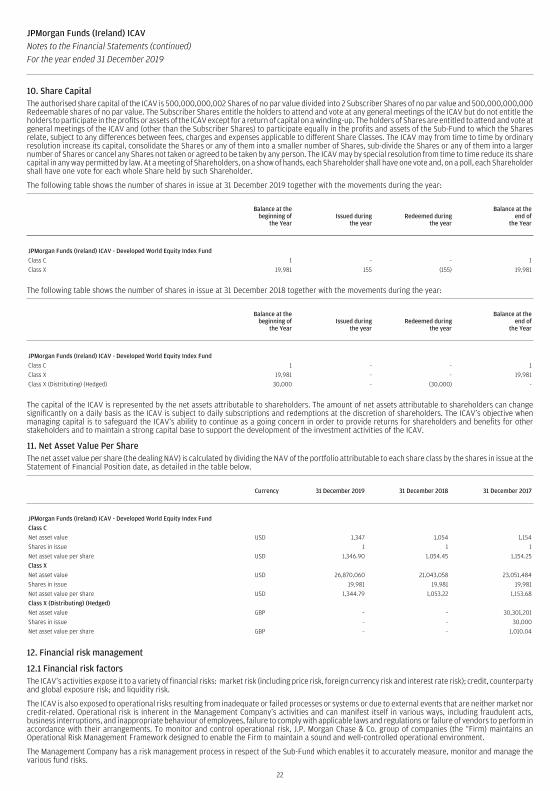
10. Share CapitalThe authorised share capital of the ICAV is 500,000,000,002 Shares of no par value divided into 2 Subscriber Shares of no par value and 500,000,000,000Redeemable shares of no par value. The Subscriber Shares entitle the holders to attend and vote at any general meetings of the ICAV but do not entitle theholders to participate in the profits or assets of the ICAV except for a return of capital on a winding-up. The holders of Shares are entitled to attend and vote atgeneral meetings of the ICAV and (other than the Subscriber Shares) to participate equally in the profits and assets of the Sub-Fund to which the Sharesrelate, subject to any differences between fees, charges and expenses applicable to different Share Classes. The ICAV may from time to time by ordinaryresolution increase its capital, consolidate the Shares or any of them into a smaller number of Shares, sub-divide the Shares or any of them into a largernumber of Shares or cancel any Shares not taken or agreed to be taken by any person. The ICAV may by special resolution from time to time reduce its sharecapital in any way permitted by law. At a meeting of Shareholders, on a show of hands, each Shareholder shall have one vote and, on a poll, each Shareholdershall have one vote for each whole Share held by such Shareholder.
The following table shows the number of shares in issue at 31 December 2019 together with the movements during the year:
Balance at thebeginning of
the YearIssued during
the yearRedeemed during
the year
Balance at theend of
the Year
JPMorgan Funds (Ireland) ICAV - Developed World Equity Index Fund
Class C 1 - - 1
Class X 19,981 155 (155) 19,981
The following table shows the number of shares in issue at 31 December 2018 together with the movements during the year:
Balance at thebeginning of
the YearIssued during
the yearRedeemed during
the year
Balance at theend of
the Year
JPMorgan Funds (Ireland) ICAV - Developed World Equity Index Fund
Class C 1 - - 1
Class X 19,981 - - 19,981
Class X (Distributing) (Hedged) 30,000 - (30,000) -
The capital of the ICAV is represented by the net assets attributable to shareholders. The amount of net assets attributable to shareholders can changesignificantly on a daily basis as the ICAV is subject to daily subscriptions and redemptions at the discretion of shareholders. The ICAV’s objective whenmanaging capital is to safeguard the ICAV’s ability to continue as a going concern in order to provide returns for shareholders and benefits for otherstakeholders and to maintain a strong capital base to support the development of the investment activities of the ICAV.
11. Net Asset Value Per ShareThe net asset value per share (the dealing NAV) is calculated by dividing the NAV of the portfolio attributable to each share class by the shares in issue at theStatement of Financial Position date, as detailed in the table below.
Currency 31 December 2019 31 December 2018 31 December 2017
JPMorgan Funds (Ireland) ICAV - Developed World Equity Index Fund
Class C
Net asset value USD 1,347 1,054 1,154
Shares in issue 1 1 1
Net asset value per share USD 1,346.90 1,054.45 1,154.25
Class X
Net asset value USD 26,870,060 21,043,058 23,051,484
Shares in issue 19,981 19,981 19,981
Net asset value per share USD 1,344.79 1,053.22 1,153.68
Class X (Distributing) (Hedged)
Net asset value GBP – – 30,301,201
Shares in issue – – 30,000
Net asset value per share GBP – – 1,010.04
12. Financial risk management
12.1 Financial risk factorsThe ICAV’s activities expose it to a variety of financial risks: market risk (including price risk, foreign currency risk and interest rate risk); credit, counterpartyand global exposure risk; and liquidity risk.
The ICAV is also exposed to operational risks resulting from inadequate or failed processes or systems or due to external events that are neither market norcredit-related. Operational risk is inherent in the Management Company’s activities and can manifest itself in various ways, including fraudulent acts,business interruptions, and inappropriate behaviour of employees, failure to comply with applicable laws and regulations or failure of vendors to perform inaccordance with their arrangements. To monitor and control operational risk, J.P. Morgan Chase & Co. group of companies (the “Firm) maintains anOperational Risk Management Framework designed to enable the Firm to maintain a sound and well-controlled operational environment.
The Management Company has a risk management process in respect of the Sub-Fund which enables it to accurately measure, monitor and manage thevarious fund risks.
22
JPMorgan Funds (Ireland) ICAVNotes to the Financial Statements (continued)For the year ended 31 December 2019
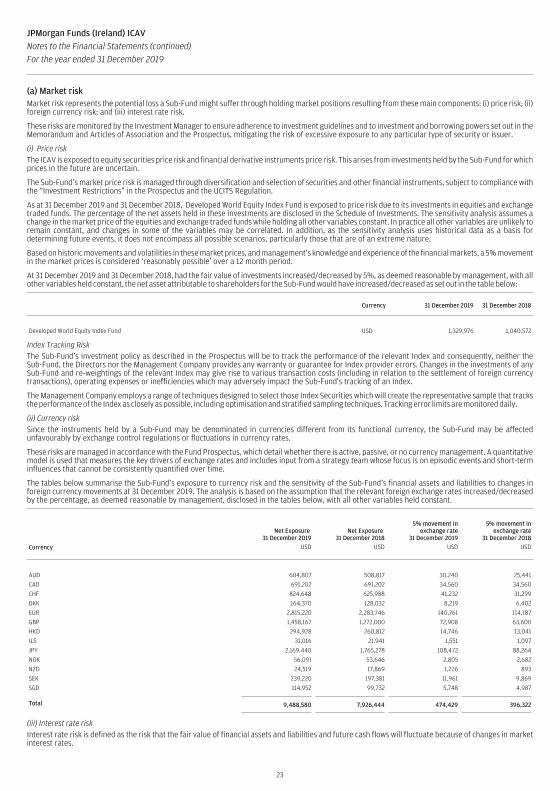
(a) Market riskMarket risk represents the potential loss a Sub-Fund might suffer through holding market positions resulting from these main components: (i) price risk; (ii)foreign currency risk; and (iii) interest rate risk.
These risks are monitored by the Investment Manager to ensure adherence to investment guidelines and to investment and borrowing powers set out in theMemorandum and Articles of Association and the Prospectus, mitigating the risk of excessive exposure to any particular type of security or issuer.
(i) Price riskThe ICAV is exposed to equity securities price risk and financial derivative instruments price risk. This arises from investments held by the Sub-Fund for whichprices in the future are uncertain.
The Sub-Fund’s market price risk is managed through diversification and selection of securities and other financial instruments, subject to compliance withthe “Investment Restrictions” in the Prospectus and the UCITS Regulation.
As at 31 December 2019 and 31 December 2018, Developed World Equity Index Fund is exposed to price risk due to its investments in equities and exchangetraded funds. The percentage of the net assets held in these investments are disclosed in the Schedule of Investments. The sensitivity analysis assumes achange in the market price of the equities and exchange traded funds while holding all other variables constant. In practice all other variables are unlikely toremain constant, and changes in some of the variables may be correlated. In addition, as the sensitivity analysis uses historical data as a basis fordetermining future events, it does not encompass all possible scenarios, particularly those that are of an extreme nature.
Based on historic movements and volatilities in these market prices, and management’s knowledge and experience of the financial markets, a 5% movementin the market prices is considered ‘reasonably possible’ over a 12 month period.
At 31 December 2019 and 31 December 2018, had the fair value of investments increased/decreased by 5%, as deemed reasonable by management, with allother variables held constant, the net asset attributable to shareholders for the Sub-Fund would have increased/decreased as set out in the table below:
Currency 31 December 2019 31 December 2018
Developed World Equity Index Fund USD 1,329,976 1,040,572
Index Tracking RiskThe Sub-Fund’s investment policy as described in the Prospectus will be to track the performance of the relevant Index and consequently, neither theSub-Fund, the Directors nor the Management Company provides any warranty or guarantee for Index provider errors. Changes in the investments of anySub-Fund and re-weightings of the relevant Index may give rise to various transaction costs (including in relation to the settlement of foreign currencytransactions), operating expenses or inefficiencies which may adversely impact the Sub-Fund’s tracking of an Index.
The Management Company employs a range of techniques designed to select those Index Securities which will create the representative sample that tracksthe performance of the Index as closely as possible, including optimisation and stratified sampling techniques. Tracking error limits are monitored daily.
(ii) Currency riskSince the instruments held by a Sub-Fund may be denominated in currencies different from its functional currency, the Sub-Fund may be affectedunfavourably by exchange control regulations or fluctuations in currency rates.
These risks are managed in accordance with the Fund Prospectus, which detail whether there is active, passive, or no currency management. A quantitativemodel is used that measures the key drivers of exchange rates and includes input from a strategy team whose focus is on episodic events and short-terminfluences that cannot be consistently quantified over time.
The tables below summarise the Sub-Fund’s exposure to currency risk and the sensitivity of the Sub-Fund’s financial assets and liabilities to changes inforeign currency movements at 31 December 2019. The analysis is based on the assumption that the relevant foreign exchange rates increased/decreasedby the percentage, as deemed reasonable by management, disclosed in the tables below, with all other variables held constant.
Net Exposure31 December 2019
Net Exposure31 December 2018
5% movement inexchange rate
31 December 2019
5% movement inexchange rate
31 December 2018
Currency USD USD USD USD
AUD 604,807 508,817 30,240 25,441
CAD 691,202 691,202 34,560 34,560
CHF 824,648 625,988 41,232 31,299
DKK 164,370 128,032 8,219 6,402
EUR 2,815,220 2,283,746 140,761 114,187
GBP 1,458,167 1,272,000 72,908 63,600
HKD 294,928 260,812 14,746 13,041
ILS 31,016 21,941 1,551 1,097
JPY 2,169,440 1,765,278 108,472 88,264
NOK 56,091 53,646 2,805 2,682
NZD 24,519 17,869 1,226 893
SEK 239,220 197,381 11,961 9,869
SGD 114,952 99,732 5,748 4,987
Total 9,488,580 7,926,444 474,429 396,322
(iii) Interest rate riskInterest rate risk is defined as the risk that the fair value of financial assets and liabilities and future cash flows will fluctuate because of changes in marketinterest rates.
23
JPMorgan Funds (Ireland) ICAVNotes to the Financial Statements (continued)For the year ended 31 December 2019
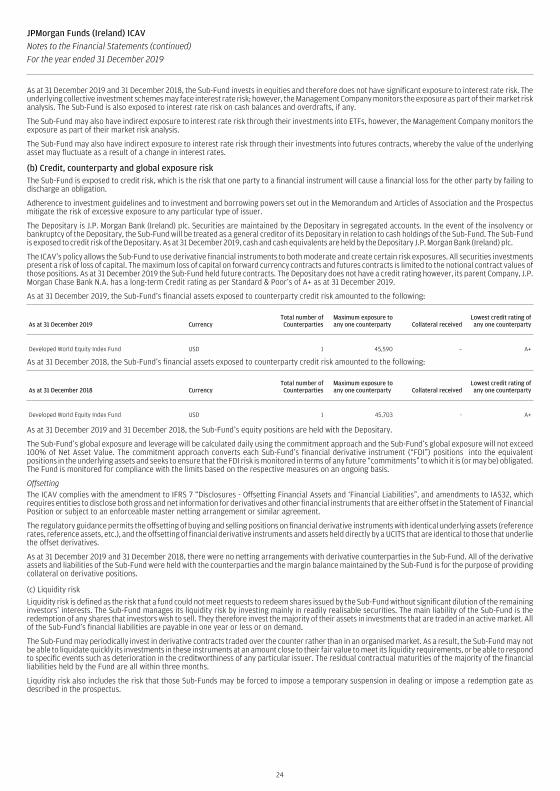
As at 31 December 2019 and 31 December 2018, the Sub-Fund invests in equities and therefore does not have significant exposure to interest rate risk. Theunderlying collective investment schemes may face interest rate risk; however, the Management Company monitors the exposure as part of their market riskanalysis. The Sub-Fund is also exposed to interest rate risk on cash balances and overdrafts, if any.
The Sub-Fund may also have indirect exposure to interest rate risk through their investments into ETFs, however, the Management Company monitors theexposure as part of their market risk analysis.
The Sub-Fund may also have indirect exposure to interest rate risk through their investments into futures contracts, whereby the value of the underlyingasset may fluctuate as a result of a change in interest rates.
(b) Credit, counterparty and global exposure riskThe Sub-Fund is exposed to credit risk, which is the risk that one party to a financial instrument will cause a financial loss for the other party by failing todischarge an obligation.
Adherence to investment guidelines and to investment and borrowing powers set out in the Memorandum and Articles of Association and the Prospectusmitigate the risk of excessive exposure to any particular type of issuer.
The Depositary is J.P. Morgan Bank (Ireland) plc. Securities are maintained by the Depositary in segregated accounts. In the event of the insolvency orbankruptcy of the Depositary, the Sub-Fund will be treated as a general creditor of its Depositary in relation to cash holdings of the Sub-Fund. The Sub-Fundis exposed to credit risk of the Depositary. As at 31 December 2019, cash and cash equivalents are held by the Depositary J.P. Morgan Bank (Ireland) plc.
The ICAV’s policy allows the Sub-Fund to use derivative financial instruments to both moderate and create certain risk exposures. All securities investmentspresent a risk of loss of capital. The maximum loss of capital on forward currency contracts and futures contracts is limited to the notional contract values ofthose positions. As at 31 December 2019 the Sub-Fund held future contracts. The Depositary does not have a credit rating however, its parent Company, J.P.Morgan Chase Bank N.A. has a long-term Credit rating as per Standard & Poor’s of A+ as at 31 December 2019.
As at 31 December 2019, the Sub-Fund’s financial assets exposed to counterparty credit risk amounted to the following:
As at 31 December 2019 CurrencyTotal number ofCounterparties
Maximum exposure toany one counterparty Collateral received
Lowest credit rating ofany one counterparty
Developed World Equity Index Fund USD 1 45,590 – A+
As at 31 December 2018, the Sub-Fund’s financial assets exposed to counterparty credit risk amounted to the following:
As at 31 December 2018 CurrencyTotal number ofCounterparties
Maximum exposure toany one counterparty Collateral received
Lowest credit rating ofany one counterparty
Developed World Equity Index Fund USD 1 45,703 - A+
As at 31 December 2019 and 31 December 2018, the Sub-Fund’s equity positions are held with the Depositary.
The Sub-Fund’s global exposure and leverage will be calculated daily using the commitment approach and the Sub-Fund’s global exposure will not exceed100% of Net Asset Value. The commitment approach converts each Sub-Fund’s financial derivative instrument (“FDI”) positions into the equivalentpositions in the underlying assets and seeks to ensure that the FDI risk is monitored in terms of any future “commitments” to which it is (or may be) obligated.The Fund is monitored for compliance with the limits based on the respective measures on an ongoing basis.
OffsettingThe ICAV complies with the amendment to IFRS 7 “Disclosures - Offsetting Financial Assets and ‘Financial Liabilities”, and amendments to IAS32, whichrequires entities to disclose both gross and net information for derivatives and other financial instruments that are either offset in the Statement of FinancialPosition or subject to an enforceable master netting arrangement or similar agreement.
The regulatory guidance permits the offsetting of buying and selling positions on financial derivative instruments with identical underlying assets (referencerates, reference assets, etc.), and the offsetting of financial derivative instruments and assets held directly by a UCITS that are identical to those that underliethe offset derivatives.
As at 31 December 2019 and 31 December 2018, there were no netting arrangements with derivative counterparties in the Sub-Fund. All of the derivativeassets and liabilities of the Sub-Fund were held with the counterparties and the margin balance maintained by the Sub-Fund is for the purpose of providingcollateral on derivative positions.
(c) Liquidity risk
Liquidity risk is defined as the risk that a fund could not meet requests to redeem shares issued by the Sub-Fund without significant dilution of the remaininginvestors’ interests. The Sub-Fund manages its liquidity risk by investing mainly in readily realisable securities. The main liability of the Sub-Fund is theredemption of any shares that investors wish to sell. They therefore invest the majority of their assets in investments that are traded in an active market. Allof the Sub-Fund’s financial liabilities are payable in one year or less or on demand.
The Sub-Fund may periodically invest in derivative contracts traded over the counter rather than in an organised market. As a result, the Sub-Fund may notbe able to liquidate quickly its investments in these instruments at an amount close to their fair value to meet its liquidity requirements, or be able to respondto specific events such as deterioration in the creditworthiness of any particular issuer. The residual contractual maturities of the majority of the financialliabilities held by the Fund are all within three months.
Liquidity risk also includes the risk that those Sub-Funds may be forced to impose a temporary suspension in dealing or impose a redemption gate asdescribed in the prospectus.
24
JPMorgan Funds (Ireland) ICAVNotes to the Financial Statements (continued)For the year ended 31 December 2019
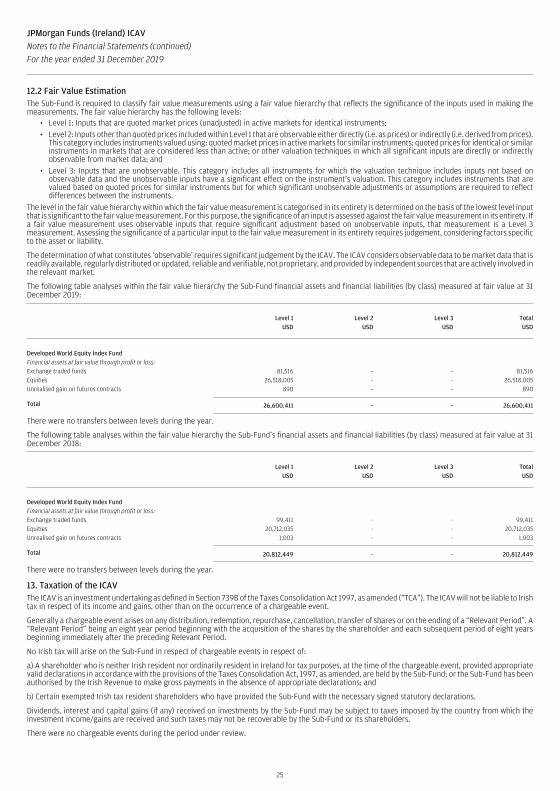
12.2 Fair Value EstimationThe Sub-Fund is required to classify fair value measurements using a fair value hierarchy that reflects the significance of the inputs used in making themeasurements. The fair value hierarchy has the following levels:
• Level 1: Inputs that are quoted market prices (unadjusted) in active markets for identical instruments;• Level 2: Inputs other than quoted prices included within Level 1 that are observable either directly (i.e. as prices) or indirectly (i.e. derived from prices).
This category includes instruments valued using: quoted market prices in active markets for similar instruments; quoted prices for identical or similarinstruments in markets that are considered less than active; or other valuation techniques in which all significant inputs are directly or indirectlyobservable from market data; and
• Level 3: Inputs that are unobservable. This category includes all instruments for which the valuation technique includes inputs not based onobservable data and the unobservable inputs have a significant effect on the instrument’s valuation. This category includes instruments that arevalued based on quoted prices for similar instruments but for which significant unobservable adjustments or assumptions are required to reflectdifferences between the instruments.
The level in the fair value hierarchy within which the fair value measurement is categorised in its entirety is determined on the basis of the lowest level inputthat is significant to the fair value measurement. For this purpose, the significance of an input is assessed against the fair value measurement in its entirety. Ifa fair value measurement uses observable inputs that require significant adjustment based on unobservable inputs, that measurement is a Level 3measurement. Assessing the significance of a particular input to the fair value measurement in its entirety requires judgement, considering factors specificto the asset or liability.
The determination of what constitutes ‘observable’ requires significant judgement by the ICAV. The ICAV considers observable data to be market data that isreadily available, regularly distributed or updated, reliable and verifiable, not proprietary, and provided by independent sources that are actively involved inthe relevant market.
The following table analyses within the fair value hierarchy the Sub-Fund financial assets and financial liabilities (by class) measured at fair value at 31December 2019:
Level 1 Level 2 Level 3 TotalUSD USD USD USD
Developed World Equity Index FundFinancial assets at fair value through profit or loss:Exchange traded funds 81,516 – – 81,516Equities 26,518,005 - – 26,518,005Unrealised gain on futures contracts 890 – – 890
Total 26,600,411 – – 26,600,411
There were no transfers between levels during the year.
The following table analyses within the fair value hierarchy the Sub-Fund’s financial assets and financial liabilities (by class) measured at fair value at 31December 2018:
Level 1 Level 2 Level 3 TotalUSD USD USD USD
Developed World Equity Index FundFinancial assets at fair value through profit or loss:Exchange traded funds 99,411 - - 99,411Equities 20,712,035 - - 20,712,035Unrealised gain on futures contracts 1,003 - - 1,003
Total 20,812,449 - - 20,812,449
There were no transfers between levels during the year.
13. Taxation of the ICAVThe ICAV is an investment undertaking as defined in Section 739B of the Taxes Consolidation Act 1997, as amended (“TCA”). The ICAV will not be liable to Irishtax in respect of its income and gains, other than on the occurrence of a chargeable event.
Generally a chargeable event arises on any distribution, redemption, repurchase, cancellation, transfer of shares or on the ending of a “Relevant Period”. A“Relevant Period” being an eight year period beginning with the acquisition of the shares by the shareholder and each subsequent period of eight yearsbeginning immediately after the preceding Relevant Period.
No Irish tax will arise on the Sub-Fund in respect of chargeable events in respect of:
a) A shareholder who is neither Irish resident nor ordinarily resident in Ireland for tax purposes, at the time of the chargeable event, provided appropriatevalid declarations in accordance with the provisions of the Taxes Consolidation Act, 1997, as amended, are held by the Sub-Fund; or the Sub-Fund has beenauthorised by the Irish Revenue to make gross payments in the absence of appropriate declarations; and
b) Certain exempted Irish tax resident shareholders who have provided the Sub-Fund with the necessary signed statutory declarations.
Dividends, interest and capital gains (if any) received on investments by the Sub-Fund may be subject to taxes imposed by the country from which theinvestment income/gains are received and such taxes may not be recoverable by the Sub-Fund or its shareholders.
There were no chargeable events during the period under review.
25
JPMorgan Funds (Ireland) ICAVNotes to the Financial Statements (continued)For the year ended 31 December 2019
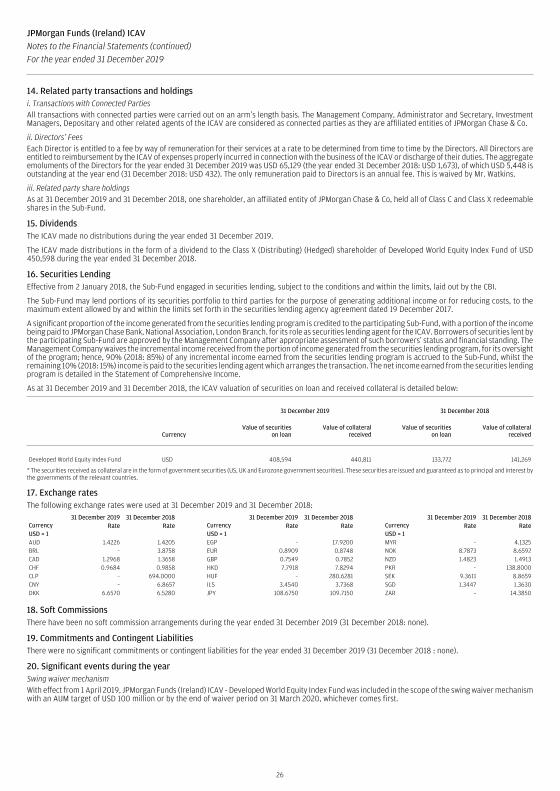
14. Related party transactions and holdingsi. Transactions with Connected PartiesAll transactions with connected parties were carried out on an arm’s length basis. The Management Company, Administrator and Secretary, InvestmentManagers, Depositary and other related agents of the ICAV are considered as connected parties as they are affiliated entities of JPMorgan Chase & Co.
ii. Directors’ FeesEach Director is entitled to a fee by way of remuneration for their services at a rate to be determined from time to time by the Directors. All Directors areentitled to reimbursement by the ICAV of expenses properly incurred in connection with the business of the ICAV or discharge of their duties. The aggregateemoluments of the Directors for the year ended 31 December 2019 was USD 65,129 (the year ended 31 December 2018: USD 1,673), of which USD 5,448 isoutstanding at the year end (31 December 2018: USD 432). The only remuneration paid to Directors is an annual fee. This is waived by Mr. Watkins.
iii. Related party share holdingsAs at 31 December 2019 and 31 December 2018, one shareholder, an affiliated entity of JPMorgan Chase & Co, held all of Class C and Class X redeemableshares in the Sub-Fund.
15. DividendsThe ICAV made no distributions during the year ended 31 December 2019.
The ICAV made distributions in the form of a dividend to the Class X (Distributing) (Hedged) shareholder of Developed World Equity Index Fund of USD450,598 during the year ended 31 December 2018.
16. Securities LendingEffective from 2 January 2018, the Sub-Fund engaged in securities lending, subject to the conditions and within the limits, laid out by the CBI.
The Sub-Fund may lend portions of its securities portfolio to third parties for the purpose of generating additional income or for reducing costs, to themaximum extent allowed by and within the limits set forth in the securities lending agency agreement dated 19 December 2017.
A significant proportion of the income generated from the securities lending program is credited to the participating Sub-Fund, with a portion of the incomebeing paid to JPMorgan Chase Bank, National Association, London Branch. for its role as securities lending agent for the ICAV. Borrowers of securities lent bythe participating Sub-Fund are approved by the Management Company after appropriate assessment of such borrowers’ status and financial standing. TheManagement Company waives the incremental income received from the portion of income generated from the securities lending program, for its oversightof the program; hence, 90% (2018: 85%) of any incremental income earned from the securities lending program is accrued to the Sub-Fund, whilst theremaining 10% (2018: 15%) income is paid to the securities lending agent which arranges the transaction. The net income earned from the securities lendingprogram is detailed in the Statement of Comprehensive Income.
As at 31 December 2019 and 31 December 2018, the ICAV valuation of securities on loan and received collateral is detailed below:
31 December 2019 31 December 2018
CurrencyValue of securities
on loanValue of collateral
receivedValue of securities
on loanValue of collateral
received
Developed World Equity Index Fund USD 408,594 440,811 133,772 141,269
* The securities received as collateral are in the form of government securities (US, UK and Eurozone government securities). These securities are issued and guaranteed as to principal and interest bythe governments of the relevant countries.
17. Exchange ratesThe following exchange rates were used at 31 December 2019 and 31 December 2018:
18. Soft CommissionsThere have been no soft commission arrangements during the year ended 31 December 2019 (31 December 2018: none).
19. Commitments and Contingent LiabilitiesThere were no significant commitments or contingent liabilities for the year ended 31 December 2019 (31 December 2018 : none).
20. Significant events during the yearSwing waiver mechanismWith effect from 1 April 2019, JPMorgan Funds (Ireland) ICAV - Developed World Equity Index Fund was included in the scope of the swing waiver mechanismwith an AUM target of USD 100 million or by the end of waiver period on 31 March 2020, whichever comes first.
26
JPMorgan Funds (Ireland) ICAVNotes to the Financial Statements (continued)For the year ended 31 December 2019
31 December 2019 31 December 2018Currency Rate RateUSD = 1AUD 1.4226 1.4205BRL – 3.8758CAD 1.2968 1.3658CHF 0.9684 0.9858CLP – 694.0000CNY – 6.8657DKK 6.6570 6.5280
31 December 2019 31 December 2018Currency Rate RateUSD = 1EGP – 17.9200EUR 0.8909 0.8748GBP 0.7549 0.7852HKD 7.7918 7.8294HUF – 280.6281ILS 3.4540 3.7368JPY 108.6750 109.7150
31 December 2019 31 December 2018Currency Rate RateUSD = 1MYR – 4.1325NOK 8.7873 8.6592NZD 1.4823 1.4913PKR – 138.8000SEK 9.3611 8.8659SGD 1.3447 1.3630ZAR – 14.3850

21. Significant events after the year enda) Removal of Swing Waiver mechanism:With effect from 1 January 2020, JPMorgan Funds (Ireland) ICAV - Developed World Equity Index Fund was removed from the swing waiver mechanism.
b) At the Board Meeting on 26 March 2020, the Directors resolved to appoint Samantha McConnell as an Independent Non-Executive Director subject toreceiving Regulatory approval from the Central Bank of Ireland (CBI).
c) Covid-19 AddendumBeginning in January 2020, global financial markets have experienced and may continue to experience significant volatility resulting from the spread ofCOVID-19. The outbreak of COVID-19 has resulted in travel and border restrictions, quarantines, supply chain disruptions, lower consumer demand andgeneral market uncertainty. This has led to a significant correction in the financial markets. The effects of COVID-19 have and may continue to adverselyaffect the global economy, the economies of certain nations and individual issuers, all of which may negatively impact the market. COVID-19 is anon-adjusting event and its post year end impact has not been taken account of in the recognition and measurement of the ICAV’s assets or liabilities as at31 December 2019.
22. Approval of the financial statementsThe Directors approved the financial statements on 22 April 2020.
27
JPMorgan Funds (Ireland) ICAVNotes to the Financial Statements (continued)For the year ended 31 December 2019
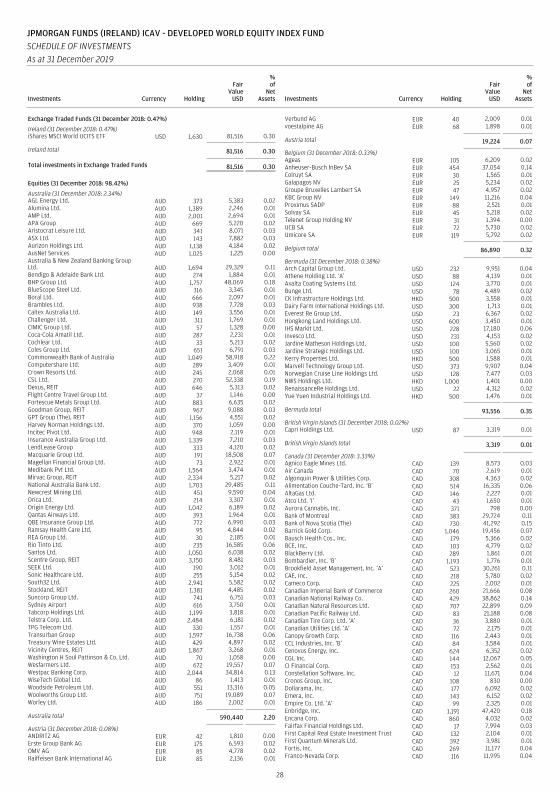
Exchange Traded Funds (31 December 2018: 0.47%)
Ireland (31 December 2018: 0.47%)iShares MSCI World UCITS ETF USD 1,630 81,516 0.30
Ireland total 81,516 0.30
Total investments in Exchange Traded Funds 81,516 0.30
Equities (31 December 2018: 98.42%)
Australia (31 December 2018: 2.34%)AGL Energy Ltd. AUD 373 5,383 0.02Alumina Ltd. AUD 1,389 2,246 0.01AMP Ltd. AUD 2,001 2,694 0.01APA Group AUD 669 5,220 0.02Aristocrat Leisure Ltd. AUD 341 8,071 0.03ASX Ltd. AUD 143 7,882 0.03Aurizon Holdings Ltd. AUD 1,138 4,184 0.02AusNet Services AUD 1,025 1,225 0.00Australia & New Zealand Banking GroupLtd. AUD 1,694 29,329 0.11Bendigo & Adelaide Bank Ltd. AUD 274 1,884 0.01BHP Group Ltd. AUD 1,757 48,069 0.18BlueScope Steel Ltd. AUD 316 3,345 0.01Boral Ltd. AUD 666 2,097 0.01Brambles Ltd. AUD 938 7,728 0.03Caltex Australia Ltd. AUD 149 3,556 0.01Challenger Ltd. AUD 311 1,769 0.01CIMIC Group Ltd. AUD 57 1,328 0.00Coca-Cola Amatil Ltd. AUD 287 2,231 0.01Cochlear Ltd. AUD 33 5,213 0.02Coles Group Ltd. AUD 651 6,791 0.03Commonwealth Bank of Australia AUD 1,049 58,918 0.22Computershare Ltd. AUD 289 3,409 0.01Crown Resorts Ltd. AUD 245 2,068 0.01CSL Ltd. AUD 270 52,338 0.19Dexus, REIT AUD 646 5,313 0.02Flight Centre Travel Group Ltd. AUD 37 1,146 0.00Fortescue Metals Group Ltd. AUD 883 6,635 0.02Goodman Group, REIT AUD 967 9,088 0.03GPT Group (The), REIT AUD 1,156 4,551 0.02Harvey Norman Holdings Ltd. AUD 370 1,059 0.00Incitec Pivot Ltd. AUD 948 2,119 0.01Insurance Australia Group Ltd. AUD 1,339 7,210 0.03LendLease Group AUD 333 4,120 0.02Macquarie Group Ltd. AUD 191 18,508 0.07Magellan Financial Group Ltd. AUD 73 2,922 0.01Medibank Pvt Ltd. AUD 1,564 3,474 0.01Mirvac Group, REIT AUD 2,334 5,217 0.02National Australia Bank Ltd. AUD 1,703 29,485 0.11Newcrest Mining Ltd. AUD 451 9,590 0.04Orica Ltd. AUD 214 3,307 0.01Origin Energy Ltd. AUD 1,042 6,189 0.02Qantas Airways Ltd. AUD 393 1,964 0.01QBE Insurance Group Ltd. AUD 772 6,990 0.03Ramsay Health Care Ltd. AUD 95 4,844 0.02REA Group Ltd. AUD 30 2,185 0.01Rio Tinto Ltd. AUD 235 16,585 0.06Santos Ltd. AUD 1,050 6,038 0.02Scentre Group, REIT AUD 3,150 8,481 0.03SEEK Ltd. AUD 190 3,012 0.01Sonic Healthcare Ltd. AUD 255 5,154 0.02South32 Ltd. AUD 2,941 5,582 0.02Stockland, REIT AUD 1,381 4,485 0.02Suncorp Group Ltd. AUD 741 6,751 0.03Sydney Airport AUD 616 3,750 0.01Tabcorp Holdings Ltd. AUD 1,199 3,818 0.01Telstra Corp. Ltd. AUD 2,484 6,181 0.02TPG Telecom Ltd. AUD 330 1,557 0.01Transurban Group AUD 1,597 16,738 0.06Treasury Wine Estates Ltd. AUD 429 4,897 0.02Vicinity Centres, REIT AUD 1,867 3,268 0.01Washington H Soul Pattinson & Co. Ltd. AUD 70 1,058 0.00Wesfarmers Ltd. AUD 672 19,557 0.07Westpac Banking Corp. AUD 2,044 34,814 0.13WiseTech Global Ltd. AUD 86 1,413 0.01Woodside Petroleum Ltd. AUD 551 13,316 0.05Woolworths Group Ltd. AUD 751 19,089 0.07Worley Ltd. AUD 186 2,002 0.01
Australia total 590,440 2.20
Austria (31 December 2018: 0.08%)ANDRITZ AG EUR 42 1,810 0.00Erste Group Bank AG EUR 175 6,593 0.02OMV AG EUR 85 4,778 0.02Raiffeisen Bank International AG EUR 85 2,136 0.01
Verbund AG EUR 40 2,009 0.01voestalpine AG EUR 68 1,898 0.01
Austria total 19,224 0.07
Belgium (31 December 2018: 0.33%)Ageas EUR 105 6,209 0.02Anheuser-Busch InBev SA EUR 454 37,054 0.14Colruyt SA EUR 30 1,565 0.01Galapagos NV EUR 25 5,234 0.02Groupe Bruxelles Lambert SA EUR 47 4,957 0.02KBC Group NV EUR 149 11,216 0.04Proximus SADP EUR 88 2,521 0.01Solvay SA EUR 45 5,218 0.02Telenet Group Holding NV EUR 31 1,394 0.00UCB SA EUR 72 5,730 0.02Umicore SA EUR 119 5,792 0.02
Belgium total 86,890 0.32
Bermuda (31 December 2018: 0.38%)Arch Capital Group Ltd. USD 232 9,951 0.04Athene Holding Ltd. ‘A’ USD 88 4,139 0.01Axalta Coating Systems Ltd. USD 124 3,770 0.01Bunge Ltd. USD 78 4,489 0.02CK Infrastructure Holdings Ltd. HKD 500 3,558 0.01Dairy Farm International Holdings Ltd. USD 300 1,713 0.01Everest Re Group Ltd. USD 23 6,367 0.02Hongkong Land Holdings Ltd. USD 600 3,450 0.01IHS Markit Ltd. USD 228 17,180 0.06Invesco Ltd. USD 231 4,153 0.02Jardine Matheson Holdings Ltd. USD 100 5,560 0.02Jardine Strategic Holdings Ltd. USD 100 3,065 0.01Kerry Properties Ltd. HKD 500 1,588 0.01Marvell Technology Group Ltd. USD 373 9,907 0.04Norwegian Cruise Line Holdings Ltd. USD 128 7,477 0.03NWS Holdings Ltd. HKD 1,000 1,401 0.00RenaissanceRe Holdings Ltd. USD 22 4,312 0.02Yue Yuen Industrial Holdings Ltd. HKD 500 1,476 0.01
Bermuda total 93,556 0.35
British Virgin Islands (31 December 2018: 0.02%)Capri Holdings Ltd. USD 87 3,319 0.01
British Virgin Islands total 3,319 0.01
Canada (31 December 2018: 3.33%)Agnico Eagle Mines Ltd. CAD 139 8,573 0.03Air Canada CAD 70 2,619 0.01Algonquin Power & Utilities Corp. CAD 308 4,363 0.02Alimentation Couche-Tard, Inc. ‘B’ CAD 514 16,335 0.06AltaGas Ltd. CAD 146 2,227 0.01Atco Ltd. ‘I’ CAD 43 1,650 0.01Aurora Cannabis, Inc. CAD 371 798 0.00Bank of Montreal CAD 383 29,724 0.11Bank of Nova Scotia (The) CAD 730 41,292 0.15Barrick Gold Corp. CAD 1,046 19,456 0.07Bausch Health Cos., Inc. CAD 179 5,366 0.02BCE, Inc. CAD 103 4,779 0.02BlackBerry Ltd. CAD 289 1,861 0.01Bombardier, Inc. ‘B’ CAD 1,193 1,776 0.01Brookfield Asset Management, Inc. ‘A’ CAD 523 30,261 0.11CAE, Inc. CAD 218 5,780 0.02Cameco Corp. CAD 225 2,002 0.01Canadian Imperial Bank of Commerce CAD 260 21,666 0.08Canadian National Railway Co. CAD 429 38,862 0.14Canadian Natural Resources Ltd. CAD 707 22,899 0.09Canadian Pacific Railway Ltd. CAD 83 21,188 0.08Canadian Tire Corp. Ltd. ‘A’ CAD 36 3,880 0.01Canadian Utilities Ltd. ‘A’ CAD 72 2,175 0.01Canopy Growth Corp. CAD 116 2,443 0.01CCL Industries, Inc. ‘B’ CAD 84 3,584 0.01Cenovus Energy, Inc. CAD 624 6,352 0.02CGI, Inc. CAD 144 12,067 0.05CI Financial Corp. CAD 153 2,562 0.01Constellation Software, Inc. CAD 12 11,671 0.04Cronos Group, Inc. CAD 108 830 0.00Dollarama, Inc. CAD 177 6,092 0.02Emera, Inc. CAD 143 6,152 0.02Empire Co. Ltd. ‘A’ CAD 99 2,325 0.01Enbridge, Inc. CAD 1,191 47,420 0.18Encana Corp. CAD 860 4,032 0.02Fairfax Financial Holdings Ltd. CAD 17 7,994 0.03First Capital Real Estate Investment Trust CAD 132 2,104 0.01First Quantum Minerals Ltd. CAD 392 3,981 0.01Fortis, Inc. CAD 269 11,177 0.04Franco-Nevada Corp. CAD 116 11,995 0.04
28
JPMORGAN FUNDS (IRELAND) ICAV - DEVELOPED WORLD EQUITY INDEX FUNDSCHEDULE OF INVESTMENTSAs at 31 December 2019
Investments Currency Holding
FairValue
USD
%of
NetAssets Investments Currency Holding
FairValue
USD
%of
NetAssets

George Weston Ltd. CAD 49 3,893 0.01Gildan Activewear, Inc. CAD 125 3,701 0.01Great-West Lifeco, Inc. CAD 169 4,335 0.02Husky Energy, Inc. CAD 201 1,615 0.01Hydro One Ltd. CAD 186 3,597 0.01iA Financial Corp., Inc. CAD 60 3,300 0.01IGM Financial, Inc. CAD 50 1,437 0.01Imperial Oil Ltd. CAD 166 4,397 0.02Intact Financial Corp. CAD 82 8,879 0.03Inter Pipeline Ltd. CAD 240 4,172 0.02Keyera Corp. CAD 115 3,017 0.01Kinross Gold Corp. CAD 708 3,363 0.01Kirkland Lake Gold Ltd. CAD 118 5,209 0.02Loblaw Cos. Ltd. CAD 125 6,458 0.02Lundin Mining Corp. CAD 372 2,226 0.01Magna International, Inc. CAD 193 10,597 0.04Manulife Financial Corp. CAD 1,150 23,377 0.09Methanex Corp. CAD 41 1,586 0.01Metro, Inc. CAD 139 5,744 0.02National Bank of Canada CAD 193 10,728 0.04Nutrien Ltd. CAD 348 16,684 0.06Onex Corp. CAD 50 3,168 0.01Open Text Corp. CAD 149 6,575 0.02Parkland Fuel Corp. CAD 88 3,238 0.01Pembina Pipeline Corp. CAD 326 12,100 0.05Power Corp. of Canada CAD 199 5,133 0.02Power Financial Corp. CAD 144 3,880 0.01PrairieSky Royalty Ltd. CAD 121 1,421 0.01Quebecor, Inc. ‘B’ CAD 105 2,683 0.01Restaurant Brands International, Inc. CAD 158 10,086 0.04RioCan Real Estate Investment Trust CAD 90 1,857 0.01Rogers Communications, Inc. ‘B’ CAD 210 10,442 0.04Royal Bank of Canada CAD 848 67,193 0.25Saputo, Inc. CAD 131 4,061 0.02Shaw Communications, Inc. ‘B’ CAD 256 5,202 0.02Shopify, Inc. ‘A’ CAD 61 24,287 0.09SmartCentres Real Estate InvestmentTrust CAD 73 1,757 0.01Stars Group, Inc. (The) CAD 136 3,554 0.01Sun Life Financial, Inc. CAD 346 15,799 0.06Suncor Energy, Inc. CAD 940 30,851 0.11TC Energy Corp. CAD 554 29,547 0.11Teck Resources Ltd. ‘B’ CAD 293 5,088 0.02TELUS Corp. CAD 96 3,722 0.01Thomson Reuters Corp. CAD 126 9,026 0.03Toronto-Dominion Bank (The) CAD 1,091 61,274 0.23Waste Connections, Inc. USD 156 14,163 0.05West Fraser Timber Co. Ltd. CAD 33 1,458 0.01Wheaton Precious Metals Corp. CAD 263 7,837 0.03WSP Global, Inc. CAD 59 4,034 0.02
Canada total 910,064 3.39
Cayman Islands (31 December 2018: 0.24%)ASM Pacific Technology Ltd. HKD 100 1,387 0.01BeiGene Ltd. ADR USD 20 3,315 0.01Budweiser Brewing Co. APAC Ltd. HKD 700 2,363 0.01CK Asset Holdings Ltd. HKD 1,500 10,829 0.04CK Hutchison Holdings Ltd. HKD 1,500 14,303 0.06Melco Resorts & Entertainment Ltd. ADR USD 140 3,384 0.01Sands China Ltd. HKD 1,600 8,553 0.03WH Group Ltd. HKD 6,000 6,199 0.02Wharf Real Estate Investment Co. Ltd. HKD 1,000 6,103 0.02Wynn Macau Ltd. HKD 800 1,971 0.01
Cayman Islands total 58,407 0.22
Curacao (31 December 2018: 0.14%)Schlumberger Ltd. USD 831 33,406 0.12
Curacao total 33,406 0.12
Denmark (31 December 2018: 0.60%)AP Moller - Maersk A/S ‘A’ DKK 2 2,713 0.01AP Moller - Maersk A/S ‘B’ DKK 4 5,773 0.02Carlsberg A/S ‘B’ DKK 64 9,554 0.03Chr Hansen Holding A/S DKK 57 4,533 0.02Coloplast A/S ‘B’ DKK 68 8,442 0.03Danske Bank A/S DKK 425 6,882 0.03Demant A/S DKK 59 1,859 0.01DSV Panalpina A/S DKK 131 15,109 0.06Genmab A/S DKK 39 8,679 0.03H Lundbeck A/S DKK 41 1,567 0.01ISS A/S DKK 93 2,233 0.01Novo Nordisk A/S ‘B’ DKK 1,058 61,451 0.23Novozymes A/S ‘B’ DKK 127 6,219 0.02Orsted A/S DKK 112 11,592 0.04Pandora A/S DKK 62 2,699 0.01
Tryg A/S DKK 55 1,632 0.01Vestas Wind Systems A/S DKK 116 11,731 0.04
Denmark total 162,668 0.61
Finland (31 December 2018: 0.43%)Elisa OYJ EUR 84 4,644 0.02Fortum OYJ EUR 264 6,519 0.02Kone OYJ ‘B’ EUR 202 13,215 0.05Metso OYJ EUR 61 2,409 0.01Neste OYJ EUR 251 8,740 0.03Nokia OYJ EUR 3,340 12,357 0.05Nokian Renkaat OYJ EUR 65 1,870 0.01Nordea Bank Abp SEK 1,914 15,466 0.06Orion OYJ ‘B’ EUR 60 2,779 0.01Sampo OYJ ‘A’ EUR 270 11,793 0.04Stora Enso OYJ ‘R’ EUR 345 5,021 0.02UPM-Kymmene OYJ EUR 322 11,172 0.04Wartsila OYJ Abp EUR 253 2,797 0.01
Finland total 98,782 0.37
France (31 December 2018: 3.58%)Accor SA EUR 106 4,968 0.02Aeroports de Paris EUR 18 3,558 0.01Air Liquide SA EUR 282 39,948 0.15Alstom SA EUR 113 5,357 0.02Amundi SA EUR 33 2,589 0.01Arkema SA EUR 40 4,252 0.02Atos SE EUR 53 4,421 0.02AXA SA EUR 1,143 32,217 0.12BioMerieux EUR 23 2,049 0.01BNP Paribas SA EUR 668 39,614 0.15Bollore SA EUR 489 2,135 0.01Bouygues SA EUR 133 5,655 0.02Bureau Veritas SA EUR 171 4,465 0.02Capgemini SE EUR 92 11,246 0.04Carrefour SA EUR 343 5,756 0.02Casino Guichard Perrachon SA EUR 33 1,545 0.01Cie de Saint-Gobain EUR 294 12,046 0.04Cie Generale des Etablissements MichelinSCA EUR 102 12,491 0.05CNP Assurances EUR 98 1,950 0.01Covivio, REIT EUR 26 2,954 0.01Credit Agricole SA EUR 675 9,793 0.04Danone SA EUR 369 30,610 0.11Dassault Aviation SA EUR 2 2,627 0.01Dassault Systemes SE EUR 79 12,996 0.05Edenred EUR 142 7,348 0.03Eiffage SA EUR 44 5,038 0.02Electricite de France SA EUR 349 3,889 0.01Engie SA EUR 1,058 17,101 0.06EssilorLuxottica SA EUR 167 25,457 0.09Eurazeo SE EUR 26 1,780 0.01Eutelsat Communications SA EUR 99 1,610 0.01Faurecia SE EUR 43 2,318 0.01Gecina SA, REIT EUR 26 4,658 0.02Getlink SE, Registered EUR 264 4,596 0.02Hermes International EUR 19 14,208 0.05ICADE, REIT EUR 26 2,832 0.01Iliad SA EUR 15 1,946 0.01Ingenico Group SA EUR 36 3,912 0.01Ipsen SA EUR 23 2,040 0.01JCDecaux SA EUR 50 1,542 0.00Kering SA EUR 46 30,217 0.11Klepierre SA, REIT EUR 114 4,332 0.02Legrand SA EUR 157 12,802 0.05L’Oreal SA EUR 151 44,747 0.17LVMH Moet Hennessy Louis Vuitton SE EUR 167 77,645 0.29Natixis SA EUR 535 2,377 0.01Orange SA EUR 1,183 17,422 0.06Pernod Ricard SA EUR 124 22,187 0.08Peugeot SA EUR 353 8,440 0.03Publicis Groupe SA EUR 123 5,572 0.02Remy Cointreau SA EUR 12 1,475 0.00Renault SA EUR 109 5,161 0.02Safran SA EUR 197 30,439 0.11Sanofi EUR 672 67,602 0.25Sartorius Stedim Biotech EUR 17 2,818 0.01Schneider Electric SE EUR 329 33,791 0.13SCOR SE EUR 92 3,864 0.01SEB SA EUR 13 1,932 0.01Societe Generale SA EUR 482 16,781 0.06Sodexo SA EUR 53 6,285 0.02Suez EUR 211 3,194 0.01Teleperformance EUR 34 8,297 0.03Thales SA EUR 62 6,439 0.02
29
JPMORGAN FUNDS (IRELAND) ICAV - DEVELOPED WORLD EQUITY INDEX FUNDSCHEDULE OF INVESTMENTS (continued)As at 31 December 2019
Investments Currency Holding
FairValue
USD
%of
NetAssets Investments Currency Holding
FairValue
USD
%of
NetAssets
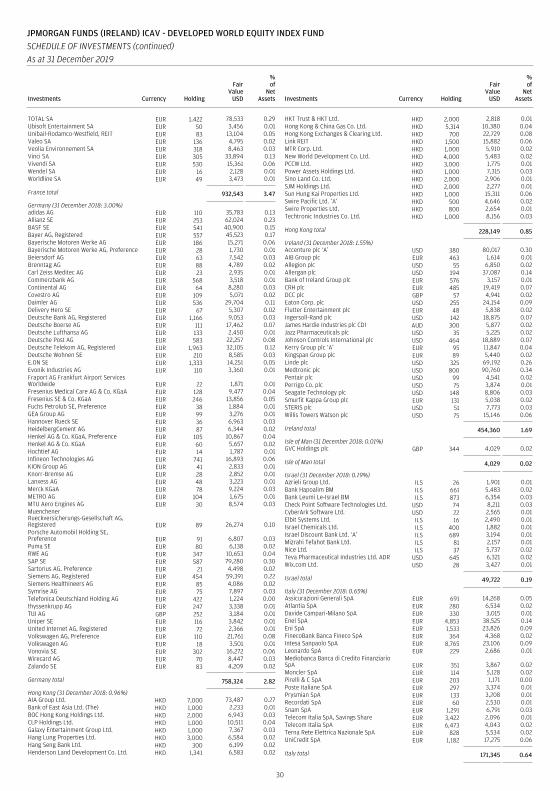
TOTAL SA EUR 1,422 78,533 0.29Ubisoft Entertainment SA EUR 50 3,456 0.01Unibail-Rodamco-Westfield, REIT EUR 83 13,104 0.05Valeo SA EUR 136 4,795 0.02Veolia Environnement SA EUR 318 8,463 0.03Vinci SA EUR 305 33,894 0.13Vivendi SA EUR 530 15,361 0.06Wendel SA EUR 16 2,128 0.01Worldline SA EUR 49 3,473 0.01
France total 932,543 3.47
Germany (31 December 2018: 3.00%)adidas AG EUR 110 35,783 0.13Allianz SE EUR 253 62,024 0.23BASF SE EUR 541 40,900 0.15Bayer AG, Registered EUR 557 45,523 0.17Bayerische Motoren Werke AG EUR 186 15,271 0.06Bayerische Motoren Werke AG, Preference EUR 28 1,730 0.01Beiersdorf AG EUR 63 7,542 0.03Brenntag AG EUR 88 4,789 0.02Carl Zeiss Meditec AG EUR 23 2,935 0.01Commerzbank AG EUR 568 3,518 0.01Continental AG EUR 64 8,280 0.03Covestro AG EUR 109 5,071 0.02Daimler AG EUR 536 29,704 0.11Delivery Hero SE EUR 67 5,307 0.02Deutsche Bank AG, Registered EUR 1,166 9,053 0.03Deutsche Boerse AG EUR 111 17,462 0.07Deutsche Lufthansa AG EUR 133 2,450 0.01Deutsche Post AG EUR 583 22,257 0.08Deutsche Telekom AG, Registered EUR 1,963 32,105 0.12Deutsche Wohnen SE EUR 210 8,585 0.03E.ON SE EUR 1,333 14,251 0.05Evonik Industries AG EUR 110 3,360 0.01Fraport AG Frankfurt Airport ServicesWorldwide EUR 22 1,871 0.01Fresenius Medical Care AG & Co. KGaA EUR 128 9,477 0.04Fresenius SE & Co. KGaA EUR 246 13,856 0.05Fuchs Petrolub SE, Preference EUR 38 1,884 0.01GEA Group AG EUR 99 3,276 0.01Hannover Rueck SE EUR 36 6,963 0.03HeidelbergCement AG EUR 87 6,344 0.02Henkel AG & Co. KGaA, Preference EUR 105 10,867 0.04Henkel AG & Co. KGaA EUR 60 5,657 0.02Hochtief AG EUR 14 1,787 0.01Infineon Technologies AG EUR 741 16,893 0.06KION Group AG EUR 41 2,833 0.01Knorr-Bremse AG EUR 28 2,852 0.01Lanxess AG EUR 48 3,223 0.01Merck KGaA EUR 78 9,224 0.03METRO AG EUR 104 1,675 0.01MTU Aero Engines AG EUR 30 8,574 0.03MuenchenerRueckversicherungs-Gesellschaft AG,Registered EUR 89 26,274 0.10Porsche Automobil Holding SE,Preference EUR 91 6,807 0.03Puma SE EUR 80 6,138 0.02RWE AG EUR 347 10,653 0.04SAP SE EUR 587 79,280 0.30Sartorius AG, Preference EUR 21 4,498 0.02Siemens AG, Registered EUR 454 59,391 0.22Siemens Healthineers AG EUR 85 4,086 0.02Symrise AG EUR 75 7,897 0.03Telefonica Deutschland Holding AG EUR 422 1,224 0.00thyssenkrupp AG EUR 247 3,338 0.01TUI AG GBP 252 3,184 0.01Uniper SE EUR 116 3,842 0.01United Internet AG, Registered EUR 72 2,366 0.01Volkswagen AG, Preference EUR 110 21,761 0.08Volkswagen AG EUR 18 3,501 0.01Vonovia SE EUR 302 16,272 0.06Wirecard AG EUR 70 8,447 0.03Zalando SE EUR 83 4,209 0.02
Germany total 758,324 2.82
Hong Kong (31 December 2018: 0.96%)AIA Group Ltd. HKD 7,000 73,487 0.27Bank of East Asia Ltd. (The) HKD 1,000 2,233 0.01BOC Hong Kong Holdings Ltd. HKD 2,000 6,943 0.03CLP Holdings Ltd. HKD 1,000 10,511 0.04Galaxy Entertainment Group Ltd. HKD 1,000 7,367 0.03Hang Lung Properties Ltd. HKD 3,000 6,584 0.02Hang Seng Bank Ltd. HKD 300 6,199 0.02Henderson Land Development Co. Ltd. HKD 1,341 6,583 0.02
HKT Trust & HKT Ltd. HKD 2,000 2,818 0.01Hong Kong & China Gas Co. Ltd. HKD 5,314 10,380 0.04Hong Kong Exchanges & Clearing Ltd. HKD 700 22,729 0.08Link REIT HKD 1,500 15,882 0.06MTR Corp. Ltd. HKD 1,000 5,910 0.02New World Development Co. Ltd. HKD 4,000 5,483 0.02PCCW Ltd. HKD 3,000 1,775 0.01Power Assets Holdings Ltd. HKD 1,000 7,315 0.03Sino Land Co. Ltd. HKD 2,000 2,906 0.01SJM Holdings Ltd. HKD 2,000 2,277 0.01Sun Hung Kai Properties Ltd. HKD 1,000 15,311 0.06Swire Pacific Ltd. ‘A’ HKD 500 4,646 0.02Swire Properties Ltd. HKD 800 2,654 0.01Techtronic Industries Co. Ltd. HKD 1,000 8,156 0.03
Hong Kong total 228,149 0.85
Ireland (31 December 2018: 1.55%)Accenture plc ‘A’ USD 380 80,017 0.30AIB Group plc EUR 463 1,614 0.01Allegion plc USD 55 6,850 0.02Allergan plc USD 194 37,087 0.14Bank of Ireland Group plc EUR 576 3,157 0.01CRH plc EUR 485 19,419 0.07DCC plc GBP 57 4,941 0.02Eaton Corp. plc USD 255 24,154 0.09Flutter Entertainment plc EUR 48 5,838 0.02Ingersoll-Rand plc USD 142 18,875 0.07James Hardie Industries plc CDI AUD 300 5,877 0.02Jazz Pharmaceuticals plc USD 35 5,225 0.02Johnson Controls International plc USD 464 18,889 0.07Kerry Group plc ‘A’ EUR 95 11,847 0.04Kingspan Group plc EUR 89 5,440 0.02Linde plc USD 325 69,192 0.26Medtronic plc USD 800 90,760 0.34Pentair plc USD 99 4,541 0.02Perrigo Co. plc USD 75 3,874 0.01Seagate Technology plc USD 148 8,806 0.03Smurfit Kappa Group plc EUR 131 5,038 0.02STERIS plc USD 51 7,773 0.03Willis Towers Watson plc USD 75 15,146 0.06
Ireland total 454,360 1.69
Isle of Man (31 December 2018: 0.01%)GVC Holdings plc GBP 344 4,029 0.02
Isle of Man total 4,029 0.02
Israel (31 December 2018: 0.19%)Azrieli Group Ltd. ILS 26 1,901 0.01Bank Hapoalim BM ILS 661 5,483 0.02Bank Leumi Le-Israel BM ILS 873 6,354 0.03Check Point Software Technologies Ltd. USD 74 8,211 0.03CyberArk Software Ltd. USD 22 2,565 0.01Elbit Systems Ltd. ILS 16 2,490 0.01Israel Chemicals Ltd. ILS 400 1,882 0.01Israel Discount Bank Ltd. ‘A’ ILS 689 3,194 0.01Mizrahi Tefahot Bank Ltd. ILS 81 2,157 0.01Nice Ltd. ILS 37 5,737 0.02Teva Pharmaceutical Industries Ltd. ADR USD 645 6,321 0.02Wix.com Ltd. USD 28 3,427 0.01
Israel total 49,722 0.19
Italy (31 December 2018: 0.65%)Assicurazioni Generali SpA EUR 691 14,268 0.05Atlantia SpA EUR 280 6,534 0.02Davide Campari-Milano SpA EUR 330 3,015 0.01Enel SpA EUR 4,853 38,525 0.14Eni SpA EUR 1,533 23,826 0.09FinecoBank Banca Fineco SpA EUR 364 4,368 0.02Intesa Sanpaolo SpA EUR 8,765 23,106 0.09Leonardo SpA EUR 229 2,686 0.01Mediobanca Banca di Credito FinanziarioSpA EUR 351 3,867 0.02Moncler SpA EUR 114 5,128 0.02Pirelli & C SpA EUR 203 1,171 0.00Poste Italiane SpA EUR 297 3,374 0.01Prysmian SpA EUR 133 3,208 0.01Recordati SpA EUR 60 2,530 0.01Snam SpA EUR 1,291 6,791 0.03Telecom Italia SpA, Savings Share EUR 3,422 2,096 0.01Telecom Italia SpA EUR 6,473 4,043 0.02Terna Rete Elettrica Nazionale SpA EUR 828 5,534 0.02UniCredit SpA EUR 1,182 17,275 0.06
Italy total 171,345 0.64
30
JPMORGAN FUNDS (IRELAND) ICAV - DEVELOPED WORLD EQUITY INDEX FUNDSCHEDULE OF INVESTMENTS (continued)As at 31 December 2019
Investments Currency Holding
FairValue
USD
%of
NetAssets Investments Currency Holding
FairValue
USD
%of
NetAssets
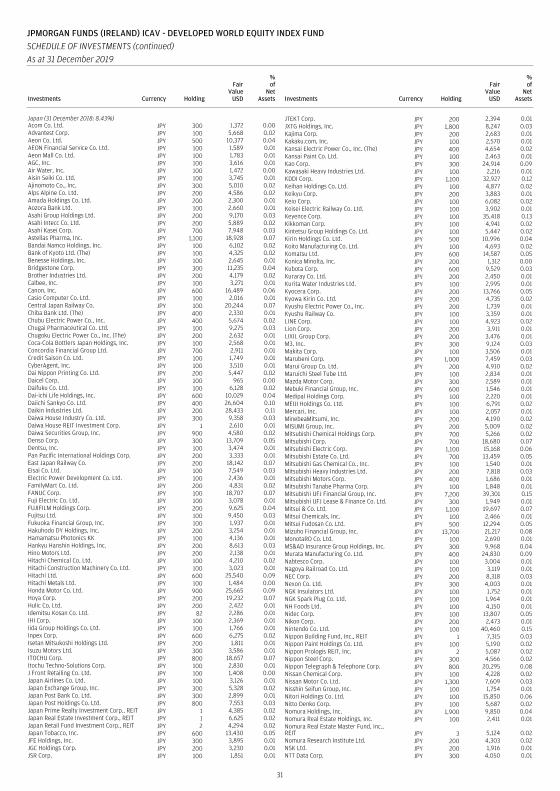
Japan (31 December 2018: 8.43%)Acom Co. Ltd. JPY 300 1,372 0.00Advantest Corp. JPY 100 5,668 0.02Aeon Co. Ltd. JPY 500 10,377 0.04AEON Financial Service Co. Ltd. JPY 100 1,589 0.01Aeon Mall Co. Ltd. JPY 100 1,783 0.01AGC, Inc. JPY 100 3,616 0.01Air Water, Inc. JPY 100 1,472 0.00Aisin Seiki Co. Ltd. JPY 100 3,745 0.01Ajinomoto Co., Inc. JPY 300 5,010 0.02Alps Alpine Co. Ltd. JPY 200 4,586 0.02Amada Holdings Co. Ltd. JPY 200 2,300 0.01Aozora Bank Ltd. JPY 100 2,660 0.01Asahi Group Holdings Ltd. JPY 200 9,170 0.03Asahi Intecc Co. Ltd. JPY 200 5,889 0.02Asahi Kasei Corp. JPY 700 7,948 0.03Astellas Pharma, Inc. JPY 1,100 18,928 0.07Bandai Namco Holdings, Inc. JPY 100 6,102 0.02Bank of Kyoto Ltd. (The) JPY 100 4,325 0.02Benesse Holdings, Inc. JPY 100 2,645 0.01Bridgestone Corp. JPY 300 11,235 0.04Brother Industries Ltd. JPY 200 4,179 0.02Calbee, Inc. JPY 100 3,271 0.01Canon, Inc. JPY 600 16,489 0.06Casio Computer Co. Ltd. JPY 100 2,016 0.01Central Japan Railway Co. JPY 100 20,244 0.07Chiba Bank Ltd. (The) JPY 400 2,330 0.01Chubu Electric Power Co., Inc. JPY 400 5,674 0.02Chugai Pharmaceutical Co. Ltd. JPY 100 9,275 0.03Chugoku Electric Power Co., Inc. (The) JPY 200 2,632 0.01Coca-Cola Bottlers Japan Holdings, Inc. JPY 100 2,568 0.01Concordia Financial Group Ltd. JPY 700 2,911 0.01Credit Saison Co. Ltd. JPY 100 1,749 0.01CyberAgent, Inc. JPY 100 3,510 0.01Dai Nippon Printing Co. Ltd. JPY 200 5,447 0.02Daicel Corp. JPY 100 965 0.00Daifuku Co. Ltd. JPY 100 6,128 0.02Dai-ichi Life Holdings, Inc. JPY 600 10,029 0.04Daiichi Sankyo Co. Ltd. JPY 400 26,604 0.10Daikin Industries Ltd. JPY 200 28,433 0.11Daiwa House Industry Co. Ltd. JPY 300 9,358 0.03Daiwa House REIT Investment Corp. JPY 1 2,610 0.01Daiwa Securities Group, Inc. JPY 900 4,580 0.02Denso Corp. JPY 300 13,709 0.05Dentsu, Inc. JPY 100 3,474 0.01Pan Pacific International Holdings Corp. JPY 200 3,333 0.01East Japan Railway Co. JPY 200 18,142 0.07Eisai Co. Ltd. JPY 100 7,549 0.03Electric Power Development Co. Ltd. JPY 100 2,436 0.01FamilyMart Co. Ltd. JPY 200 4,831 0.02FANUC Corp. JPY 100 18,707 0.07Fuji Electric Co. Ltd. JPY 100 3,078 0.01FUJIFILM Holdings Corp. JPY 200 9,625 0.04Fujitsu Ltd. JPY 100 9,450 0.03Fukuoka Financial Group, Inc. JPY 100 1,937 0.01Hakuhodo DY Holdings, Inc. JPY 200 3,254 0.01Hamamatsu Photonics KK JPY 100 4,136 0.01Hankyu Hanshin Holdings, Inc. JPY 200 8,613 0.03Hino Motors Ltd. JPY 200 2,138 0.01Hitachi Chemical Co. Ltd. JPY 100 4,210 0.02Hitachi Construction Machinery Co. Ltd. JPY 100 3,023 0.01Hitachi Ltd. JPY 600 25,540 0.09Hitachi Metals Ltd. JPY 100 1,484 0.00Honda Motor Co. Ltd. JPY 900 25,665 0.09Hoya Corp. JPY 200 19,232 0.07Hulic Co. Ltd. JPY 200 2,422 0.01Idemitsu Kosan Co. Ltd. JPY 82 2,286 0.01IHI Corp. JPY 100 2,369 0.01Iida Group Holdings Co. Ltd. JPY 100 1,766 0.01Inpex Corp. JPY 600 6,275 0.02Isetan Mitsukoshi Holdings Ltd. JPY 200 1,811 0.01Isuzu Motors Ltd. JPY 300 3,586 0.01ITOCHU Corp. JPY 800 18,657 0.07Itochu Techno-Solutions Corp. JPY 100 2,830 0.01J Front Retailing Co. Ltd. JPY 100 1,408 0.00Japan Airlines Co. Ltd. JPY 100 3,126 0.01Japan Exchange Group, Inc. JPY 300 5,328 0.02Japan Post Bank Co. Ltd. JPY 300 2,899 0.01Japan Post Holdings Co. Ltd. JPY 800 7,553 0.03Japan Prime Realty Investment Corp., REIT JPY 1 4,385 0.02Japan Real Estate Investment Corp., REIT JPY 1 6,625 0.02Japan Retail Fund Investment Corp., REIT JPY 2 4,294 0.02Japan Tobacco, Inc. JPY 600 13,430 0.05JFE Holdings, Inc. JPY 300 3,895 0.01JGC Holdings Corp. JPY 200 3,230 0.01JSR Corp. JPY 100 1,851 0.01
JTEKT Corp. JPY 200 2,394 0.01JXTG Holdings, Inc. JPY 1,800 8,247 0.03Kajima Corp. JPY 200 2,683 0.01Kakaku.com, Inc. JPY 100 2,570 0.01Kansai Electric Power Co., Inc. (The) JPY 400 4,654 0.02Kansai Paint Co. Ltd. JPY 100 2,463 0.01Kao Corp. JPY 300 24,914 0.09Kawasaki Heavy Industries Ltd. JPY 100 2,216 0.01KDDI Corp. JPY 1,100 32,927 0.12Keihan Holdings Co. Ltd. JPY 100 4,877 0.02Keikyu Corp. JPY 200 3,883 0.01Keio Corp. JPY 100 6,082 0.02Keisei Electric Railway Co. Ltd. JPY 100 3,902 0.01Keyence Corp. JPY 100 35,418 0.13Kikkoman Corp. JPY 100 4,941 0.02Kintetsu Group Holdings Co. Ltd. JPY 100 5,447 0.02Kirin Holdings Co. Ltd. JPY 500 10,996 0.04Koito Manufacturing Co. Ltd. JPY 100 4,693 0.02Komatsu Ltd. JPY 600 14,587 0.05Konica Minolta, Inc. JPY 200 1,312 0.00Kubota Corp. JPY 600 9,529 0.03Kuraray Co. Ltd. JPY 200 2,450 0.01Kurita Water Industries Ltd. JPY 100 2,995 0.01Kyocera Corp. JPY 200 13,766 0.05Kyowa Kirin Co. Ltd. JPY 200 4,735 0.02Kyushu Electric Power Co., Inc. JPY 200 1,739 0.01Kyushu Railway Co. JPY 100 3,359 0.01LINE Corp. JPY 100 4,923 0.02Lion Corp. JPY 200 3,911 0.01LIXIL Group Corp. JPY 200 3,476 0.01M3, Inc. JPY 300 9,124 0.03Makita Corp. JPY 100 3,506 0.01Marubeni Corp. JPY 1,000 7,459 0.03Marui Group Co. Ltd. JPY 200 4,910 0.02Maruichi Steel Tube Ltd. JPY 100 2,834 0.01Mazda Motor Corp. JPY 300 2,589 0.01Mebuki Financial Group, Inc. JPY 600 1,546 0.01Medipal Holdings Corp. JPY 100 2,220 0.01MEIJI Holdings Co. Ltd. JPY 100 6,791 0.02Mercari, Inc. JPY 100 2,057 0.01MinebeaMitsumi, Inc. JPY 200 4,190 0.02MISUMI Group, Inc. JPY 200 5,009 0.02Mitsubishi Chemical Holdings Corp. JPY 700 5,266 0.02Mitsubishi Corp. JPY 700 18,680 0.07Mitsubishi Electric Corp. JPY 1,100 15,168 0.06Mitsubishi Estate Co. Ltd. JPY 700 13,459 0.05Mitsubishi Gas Chemical Co., Inc. JPY 100 1,540 0.01Mitsubishi Heavy Industries Ltd. JPY 200 7,818 0.03Mitsubishi Motors Corp. JPY 400 1,686 0.01Mitsubishi Tanabe Pharma Corp. JPY 100 1,848 0.01Mitsubishi UFJ Financial Group, Inc. JPY 7,200 39,301 0.15Mitsubishi UFJ Lease & Finance Co. Ltd. JPY 300 1,949 0.01Mitsui & Co. Ltd. JPY 1,100 19,697 0.07Mitsui Chemicals, Inc. JPY 100 2,466 0.01Mitsui Fudosan Co. Ltd. JPY 500 12,294 0.05Mizuho Financial Group, Inc. JPY 13,700 21,217 0.08MonotaRO Co. Ltd. JPY 100 2,690 0.01MS&AD Insurance Group Holdings, Inc. JPY 300 9,968 0.04Murata Manufacturing Co. Ltd. JPY 400 24,830 0.09Nabtesco Corp. JPY 100 3,004 0.01Nagoya Railroad Co. Ltd. JPY 100 3,119 0.01NEC Corp. JPY 200 8,318 0.03Nexon Co. Ltd. JPY 300 4,003 0.01NGK Insulators Ltd. JPY 100 1,752 0.01NGK Spark Plug Co. Ltd. JPY 100 1,964 0.01NH Foods Ltd. JPY 100 4,150 0.01Nidec Corp. JPY 100 13,807 0.05Nikon Corp. JPY 200 2,473 0.01Nintendo Co. Ltd. JPY 100 40,460 0.15Nippon Building Fund, Inc., REIT JPY 1 7,315 0.03Nippon Paint Holdings Co. Ltd. JPY 100 5,190 0.02Nippon Prologis REIT, Inc. JPY 2 5,087 0.02Nippon Steel Corp. JPY 300 4,566 0.02Nippon Telegraph & Telephone Corp. JPY 800 20,295 0.08Nissan Chemical Corp. JPY 100 4,228 0.02Nissan Motor Co. Ltd. JPY 1,300 7,609 0.03Nisshin Seifun Group, Inc. JPY 100 1,754 0.01Nitori Holdings Co. Ltd. JPY 100 15,850 0.06Nitto Denko Corp. JPY 100 5,687 0.02Nomura Holdings, Inc. JPY 1,900 9,850 0.04Nomura Real Estate Holdings, Inc. JPY 100 2,411 0.01Nomura Real Estate Master Fund, Inc.,REIT JPY 3 5,124 0.02Nomura Research Institute Ltd. JPY 200 4,303 0.02NSK Ltd. JPY 200 1,916 0.01NTT Data Corp. JPY 300 4,050 0.01
31
JPMORGAN FUNDS (IRELAND) ICAV - DEVELOPED WORLD EQUITY INDEX FUNDSCHEDULE OF INVESTMENTS (continued)As at 31 December 2019
Investments Currency Holding
FairValue
USD
%of
NetAssets Investments Currency Holding
FairValue
USD
%of
NetAssets
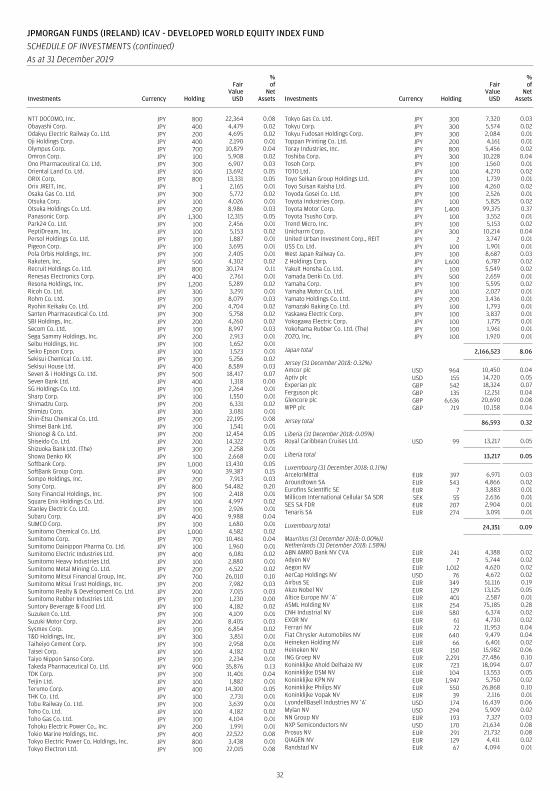
NTT DOCOMO, Inc. JPY 800 22,364 0.08Obayashi Corp. JPY 400 4,479 0.02Odakyu Electric Railway Co. Ltd. JPY 200 4,695 0.02Oji Holdings Corp. JPY 400 2,190 0.01Olympus Corp. JPY 700 10,879 0.04Omron Corp. JPY 100 5,908 0.02Ono Pharmaceutical Co. Ltd. JPY 300 6,907 0.03Oriental Land Co. Ltd. JPY 100 13,692 0.05ORIX Corp. JPY 800 13,331 0.05Orix JREIT, Inc. JPY 1 2,165 0.01Osaka Gas Co. Ltd. JPY 300 5,772 0.02Otsuka Corp. JPY 100 4,026 0.01Otsuka Holdings Co. Ltd. JPY 200 8,986 0.03Panasonic Corp. JPY 1,300 12,315 0.05Park24 Co. Ltd. JPY 100 2,456 0.01PeptiDream, Inc. JPY 100 5,153 0.02Persol Holdings Co. Ltd. JPY 100 1,887 0.01Pigeon Corp. JPY 100 3,695 0.01Pola Orbis Holdings, Inc. JPY 100 2,405 0.01Rakuten, Inc. JPY 500 4,302 0.02Recruit Holdings Co. Ltd. JPY 800 30,174 0.11Renesas Electronics Corp. JPY 400 2,761 0.01Resona Holdings, Inc. JPY 1,200 5,289 0.02Ricoh Co. Ltd. JPY 300 3,291 0.01Rohm Co. Ltd. JPY 100 8,079 0.03Ryohin Keikaku Co. Ltd. JPY 200 4,704 0.02Santen Pharmaceutical Co. Ltd. JPY 300 5,758 0.02SBI Holdings, Inc. JPY 200 4,260 0.02Secom Co. Ltd. JPY 100 8,997 0.03Sega Sammy Holdings, Inc. JPY 200 2,913 0.01Seibu Holdings, Inc. JPY 100 1,652 0.01Seiko Epson Corp. JPY 100 1,523 0.01Sekisui Chemical Co. Ltd. JPY 300 5,256 0.02Sekisui House Ltd. JPY 400 8,589 0.03Seven & i Holdings Co. Ltd. JPY 500 18,417 0.07Seven Bank Ltd. JPY 400 1,318 0.00SG Holdings Co. Ltd. JPY 100 2,264 0.01Sharp Corp. JPY 100 1,550 0.01Shimadzu Corp. JPY 200 6,331 0.02Shimizu Corp. JPY 300 3,081 0.01Shin-Etsu Chemical Co. Ltd. JPY 200 22,195 0.08Shinsei Bank Ltd. JPY 100 1,541 0.01Shionogi & Co. Ltd. JPY 200 12,454 0.05Shiseido Co. Ltd. JPY 200 14,322 0.05Shizuoka Bank Ltd. (The) JPY 300 2,258 0.01Showa Denko KK JPY 100 2,668 0.01Softbank Corp. JPY 1,000 13,430 0.05SoftBank Group Corp. JPY 900 39,387 0.15Sompo Holdings, Inc. JPY 200 7,913 0.03Sony Corp. JPY 800 54,482 0.20Sony Financial Holdings, Inc. JPY 100 2,418 0.01Square Enix Holdings Co. Ltd. JPY 100 4,997 0.02Stanley Electric Co. Ltd. JPY 100 2,926 0.01Subaru Corp. JPY 400 9,988 0.04SUMCO Corp. JPY 100 1,680 0.01Sumitomo Chemical Co. Ltd. JPY 1,000 4,582 0.02Sumitomo Corp. JPY 700 10,461 0.04Sumitomo Dainippon Pharma Co. Ltd. JPY 100 1,960 0.01Sumitomo Electric Industries Ltd. JPY 400 6,081 0.02Sumitomo Heavy Industries Ltd. JPY 100 2,880 0.01Sumitomo Metal Mining Co. Ltd. JPY 200 6,522 0.02Sumitomo Mitsui Financial Group, Inc. JPY 700 26,010 0.10Sumitomo Mitsui Trust Holdings, Inc. JPY 200 7,982 0.03Sumitomo Realty & Development Co. Ltd. JPY 200 7,015 0.03Sumitomo Rubber Industries Ltd. JPY 100 1,230 0.00Suntory Beverage & Food Ltd. JPY 100 4,182 0.02Suzuken Co. Ltd. JPY 100 4,109 0.01Suzuki Motor Corp. JPY 200 8,405 0.03Sysmex Corp. JPY 100 6,854 0.02T&D Holdings, Inc. JPY 300 3,851 0.01Taiheiyo Cement Corp. JPY 100 2,958 0.01Taisei Corp. JPY 100 4,182 0.02Taiyo Nippon Sanso Corp. JPY 100 2,234 0.01Takeda Pharmaceutical Co. Ltd. JPY 900 35,876 0.13TDK Corp. JPY 100 11,401 0.04Teijin Ltd. JPY 100 1,882 0.01Terumo Corp. JPY 400 14,300 0.05THK Co. Ltd. JPY 100 2,731 0.01Tobu Railway Co. Ltd. JPY 100 3,639 0.01Toho Co. Ltd. JPY 100 4,182 0.02Toho Gas Co. Ltd. JPY 100 4,104 0.01Tohoku Electric Power Co., Inc. JPY 200 1,991 0.01Tokio Marine Holdings, Inc. JPY 400 22,522 0.08Tokyo Electric Power Co. Holdings, Inc. JPY 800 3,438 0.01Tokyo Electron Ltd. JPY 100 22,015 0.08
Tokyo Gas Co. Ltd. JPY 300 7,320 0.03Tokyu Corp. JPY 300 5,574 0.02Tokyu Fudosan Holdings Corp. JPY 300 2,084 0.01Toppan Printing Co. Ltd. JPY 200 4,161 0.01Toray Industries, Inc. JPY 800 5,456 0.02Toshiba Corp. JPY 300 10,228 0.04Tosoh Corp. JPY 100 1,560 0.01TOTO Ltd. JPY 100 4,270 0.02Toyo Seikan Group Holdings Ltd. JPY 100 1,739 0.01Toyo Suisan Kaisha Ltd. JPY 100 4,260 0.02Toyoda Gosei Co. Ltd. JPY 100 2,526 0.01Toyota Industries Corp. JPY 100 5,825 0.02Toyota Motor Corp. JPY 1,400 99,375 0.37Toyota Tsusho Corp. JPY 100 3,552 0.01Trend Micro, Inc. JPY 100 5,153 0.02Unicharm Corp. JPY 300 10,214 0.04United Urban Investment Corp., REIT JPY 2 3,747 0.01USS Co. Ltd. JPY 100 1,901 0.01West Japan Railway Co. JPY 100 8,687 0.03Z Holdings Corp. JPY 1,600 6,787 0.02Yakult Honsha Co. Ltd. JPY 100 5,549 0.02Yamada Denki Co. Ltd. JPY 500 2,659 0.01Yamaha Corp. JPY 100 5,595 0.02Yamaha Motor Co. Ltd. JPY 100 2,027 0.01Yamato Holdings Co. Ltd. JPY 200 3,436 0.01Yamazaki Baking Co. Ltd. JPY 100 1,793 0.01Yaskawa Electric Corp. JPY 100 3,837 0.01Yokogawa Electric Corp. JPY 100 1,775 0.01Yokohama Rubber Co. Ltd. (The) JPY 100 1,961 0.01ZOZO, Inc. JPY 100 1,920 0.01
Japan total 2,166,523 8.06
Jersey (31 December 2018: 0.32%)Amcor plc USD 964 10,450 0.04Aptiv plc USD 155 14,720 0.05Experian plc GBP 542 18,324 0.07Ferguson plc GBP 135 12,251 0.04Glencore plc GBP 6,636 20,690 0.08WPP plc GBP 719 10,158 0.04
Jersey total 86,593 0.32
Liberia (31 December 2018: 0.05%)Royal Caribbean Cruises Ltd. USD 99 13,217 0.05
Liberia total 13,217 0.05
Luxembourg (31 December 2018: 0.11%)ArcelorMittal EUR 397 6,971 0.03Aroundtown SA EUR 543 4,866 0.02Eurofins Scientific SE EUR 7 3,883 0.01Millicom International Cellular SA SDR SEK 55 2,636 0.01SES SA FDR EUR 207 2,904 0.01Tenaris SA EUR 274 3,091 0.01
Luxembourg total 24,351 0.09
Mauritius (31 December 2018: 0.00%)1Netherlands (31 December 2018: 1.58%)ABN AMRO Bank NV CVA EUR 241 4,388 0.02Adyen NV EUR 7 5,744 0.02Aegon NV EUR 1,012 4,620 0.02AerCap Holdings NV USD 76 4,672 0.02Airbus SE EUR 349 51,116 0.19Akzo Nobel NV EUR 129 13,125 0.05Altice Europe NV ‘A’ EUR 401 2,587 0.01ASML Holding NV EUR 254 75,185 0.28CNH Industrial NV EUR 580 6,374 0.02EXOR NV EUR 61 4,730 0.02Ferrari NV EUR 72 11,953 0.04Fiat Chrysler Automobiles NV EUR 640 9,479 0.04Heineken Holding NV EUR 66 6,401 0.02Heineken NV EUR 150 15,982 0.06ING Groep NV EUR 2,291 27,486 0.10Koninklijke Ahold Delhaize NV EUR 723 18,094 0.07Koninklijke DSM NV EUR 104 13,553 0.05Koninklijke KPN NV EUR 1,947 5,750 0.02Koninklijke Philips NV EUR 550 26,868 0.10Koninklijke Vopak NV EUR 39 2,116 0.01LyondellBasell Industries NV ‘A’ USD 174 16,439 0.06Mylan NV USD 294 5,909 0.02NN Group NV EUR 193 7,327 0.03NXP Semiconductors NV USD 170 21,634 0.08Prosus NV EUR 291 21,732 0.08QIAGEN NV EUR 129 4,411 0.02Randstad NV EUR 67 4,094 0.01
32
JPMORGAN FUNDS (IRELAND) ICAV - DEVELOPED WORLD EQUITY INDEX FUNDSCHEDULE OF INVESTMENTS (continued)As at 31 December 2019
Investments Currency Holding
FairValue
USD
%of
NetAssets Investments Currency Holding
FairValue
USD
%of
NetAssets
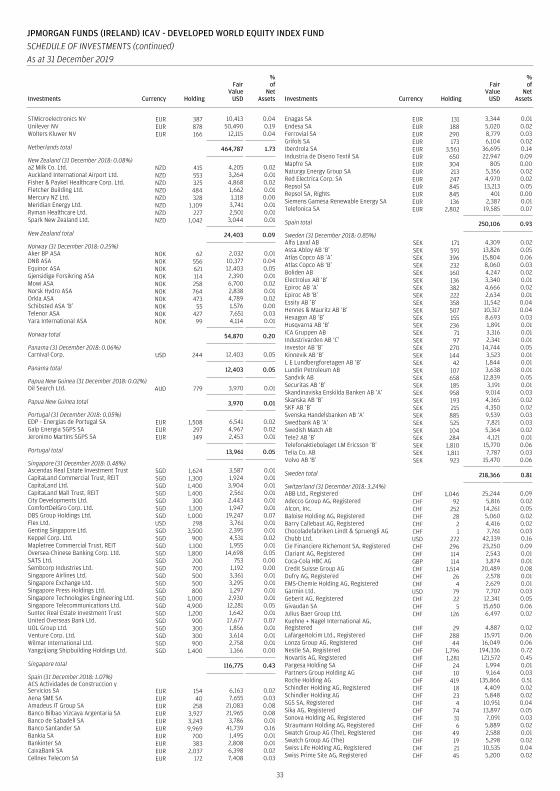
STMicroelectronics NV EUR 387 10,413 0.04Unilever NV EUR 878 50,490 0.19Wolters Kluwer NV EUR 166 12,115 0.04
Netherlands total 464,787 1.73
New Zealand (31 December 2018: 0.08%)a2 Milk Co. Ltd. NZD 415 4,205 0.02Auckland International Airport Ltd. NZD 553 3,264 0.01Fisher & Paykel Healthcare Corp. Ltd. NZD 325 4,868 0.02Fletcher Building Ltd. NZD 484 1,662 0.01Mercury NZ Ltd. NZD 328 1,118 0.00Meridian Energy Ltd. NZD 1,109 3,741 0.01Ryman Healthcare Ltd. NZD 227 2,501 0.01Spark New Zealand Ltd. NZD 1,042 3,044 0.01
New Zealand total 24,403 0.09
Norway (31 December 2018: 0.25%)Aker BP ASA NOK 62 2,032 0.01DNB ASA NOK 556 10,377 0.04Equinor ASA NOK 621 12,403 0.05Gjensidige Forsikring ASA NOK 114 2,390 0.01Mowi ASA NOK 258 6,700 0.02Norsk Hydro ASA NOK 764 2,838 0.01Orkla ASA NOK 473 4,789 0.02Schibsted ASA ‘B’ NOK 55 1,576 0.00Telenor ASA NOK 427 7,651 0.03Yara International ASA NOK 99 4,114 0.01
Norway total 54,870 0.20
Panama (31 December 2018: 0.06%)Carnival Corp. USD 244 12,403 0.05
Panama total 12,403 0.05
Papua New Guinea (31 December 2018: 0.02%)Oil Search Ltd. AUD 779 3,970 0.01
Papua New Guinea total 3,970 0.01
Portugal (31 December 2018: 0.05%)EDP - Energias de Portugal SA EUR 1,508 6,541 0.02Galp Energia SGPS SA EUR 297 4,967 0.02Jeronimo Martins SGPS SA EUR 149 2,453 0.01
Portugal total 13,961 0.05
Singapore (31 December 2018: 0.48%)Ascendas Real Estate Investment Trust SGD 1,624 3,587 0.01CapitaLand Commercial Trust, REIT SGD 1,300 1,924 0.01CapitaLand Ltd. SGD 1,400 3,904 0.01CapitaLand Mall Trust, REIT SGD 1,400 2,561 0.01City Developments Ltd. SGD 300 2,443 0.01ComfortDelGro Corp. Ltd. SGD 1,100 1,947 0.01DBS Group Holdings Ltd. SGD 1,000 19,247 0.07Flex Ltd. USD 298 3,761 0.01Genting Singapore Ltd. SGD 3,500 2,395 0.01Keppel Corp. Ltd. SGD 900 4,531 0.02Mapletree Commercial Trust, REIT SGD 1,100 1,955 0.01Oversea-Chinese Banking Corp. Ltd. SGD 1,800 14,698 0.05SATS Ltd. SGD 200 753 0.00Sembcorp Industries Ltd. SGD 700 1,192 0.00Singapore Airlines Ltd. SGD 500 3,361 0.01Singapore Exchange Ltd. SGD 500 3,295 0.01Singapore Press Holdings Ltd. SGD 800 1,297 0.01Singapore Technologies Engineering Ltd. SGD 1,000 2,930 0.01Singapore Telecommunications Ltd. SGD 4,900 12,281 0.05Suntec Real Estate Investment Trust SGD 1,200 1,642 0.01United Overseas Bank Ltd. SGD 900 17,677 0.07UOL Group Ltd. SGD 300 1,856 0.01Venture Corp. Ltd. SGD 300 3,614 0.01Wilmar International Ltd. SGD 900 2,758 0.01Yangzijiang Shipbuilding Holdings Ltd. SGD 1,400 1,166 0.00
Singapore total 116,775 0.43
Spain (31 December 2018: 1.07%)ACS Actividades de Construccion yServicios SA EUR 154 6,163 0.02Aena SME SA EUR 40 7,655 0.03Amadeus IT Group SA EUR 258 21,083 0.08Banco Bilbao Vizcaya Argentaria SA EUR 3,927 21,965 0.08Banco de Sabadell SA EUR 3,243 3,786 0.01Banco Santander SA EUR 9,969 41,739 0.16Bankia SA EUR 700 1,495 0.01Bankinter SA EUR 383 2,808 0.01CaixaBank SA EUR 2,037 6,398 0.02Cellnex Telecom SA EUR 172 7,408 0.03
Enagas SA EUR 131 3,344 0.01Endesa SA EUR 188 5,020 0.02Ferrovial SA EUR 290 8,779 0.03Grifols SA EUR 173 6,104 0.02Iberdrola SA EUR 3,561 36,695 0.14Industria de Diseno Textil SA EUR 650 22,947 0.09Mapfre SA EUR 304 805 0.00Naturgy Energy Group SA EUR 213 5,356 0.02Red Electrica Corp. SA EUR 247 4,970 0.02Repsol SA EUR 845 13,213 0.05Repsol SA, Rights EUR 845 401 0.00Siemens Gamesa Renewable Energy SA EUR 136 2,387 0.01Telefonica SA EUR 2,802 19,585 0.07
Spain total 250,106 0.93
Sweden (31 December 2018: 0.85%)Alfa Laval AB SEK 171 4,309 0.02Assa Abloy AB ‘B’ SEK 591 13,826 0.05Atlas Copco AB ‘A’ SEK 396 15,804 0.06Atlas Copco AB ‘B’ SEK 232 8,060 0.03Boliden AB SEK 160 4,247 0.02Electrolux AB ‘B’ SEK 136 3,340 0.01Epiroc AB ‘A’ SEK 382 4,666 0.02Epiroc AB ‘B’ SEK 222 2,634 0.01Essity AB ‘B’ SEK 358 11,542 0.04Hennes & Mauritz AB ‘B’ SEK 507 10,317 0.04Hexagon AB ‘B’ SEK 155 8,693 0.03Husqvarna AB ‘B’ SEK 236 1,891 0.01ICA Gruppen AB SEK 71 3,316 0.01Industrivarden AB ‘C’ SEK 97 2,341 0.01Investor AB ‘B’ SEK 270 14,744 0.05Kinnevik AB ‘B’ SEK 144 3,523 0.01L E Lundbergforetagen AB ‘B’ SEK 42 1,844 0.01Lundin Petroleum AB SEK 107 3,638 0.01Sandvik AB SEK 658 12,839 0.05Securitas AB ‘B’ SEK 185 3,191 0.01Skandinaviska Enskilda Banken AB ‘A’ SEK 958 9,014 0.03Skanska AB ‘B’ SEK 193 4,365 0.02SKF AB ‘B’ SEK 215 4,350 0.02Svenska Handelsbanken AB ‘A’ SEK 885 9,539 0.03Swedbank AB ‘A’ SEK 525 7,821 0.03Swedish Match AB SEK 104 5,364 0.02Tele2 AB ‘B’ SEK 284 4,121 0.01Telefonaktiebolaget LM Ericsson ‘B’ SEK 1,810 15,770 0.06Telia Co. AB SEK 1,811 7,787 0.03Volvo AB ‘B’ SEK 923 15,470 0.06
Sweden total 218,366 0.81
Switzerland (31 December 2018: 3.24%)ABB Ltd., Registered CHF 1,046 25,244 0.09Adecco Group AG, Registered CHF 92 5,816 0.02Alcon, Inc. CHF 252 14,261 0.05Baloise Holding AG, Registered CHF 28 5,060 0.02Barry Callebaut AG, Registered CHF 2 4,416 0.02Chocoladefabriken Lindt & Spruengli AG CHF 1 7,761 0.03Chubb Ltd. USD 272 42,339 0.16Cie Financiere Richemont SA, Registered CHF 296 23,250 0.09Clariant AG, Registered CHF 114 2,543 0.01Coca-Cola HBC AG GBP 114 3,874 0.01Credit Suisse Group AG CHF 1,514 20,489 0.08Dufry AG, Registered CHF 26 2,578 0.01EMS-Chemie Holding AG, Registered CHF 4 2,629 0.01Garmin Ltd. USD 79 7,707 0.03Geberit AG, Registered CHF 22 12,341 0.05Givaudan SA CHF 5 15,650 0.06Julius Baer Group Ltd. CHF 126 6,497 0.02Kuehne + Nagel International AG,Registered CHF 29 4,887 0.02LafargeHolcim Ltd., Registered CHF 288 15,971 0.06Lonza Group AG, Registered CHF 44 16,049 0.06Nestle SA, Registered CHF 1,796 194,336 0.72Novartis AG, Registered CHF 1,281 121,572 0.45Pargesa Holding SA CHF 24 1,994 0.01Partners Group Holding AG CHF 10 9,164 0.03Roche Holding AG CHF 419 135,866 0.51Schindler Holding AG, Registered CHF 18 4,409 0.02Schindler Holding AG CHF 23 5,848 0.02SGS SA, Registered CHF 4 10,951 0.04Sika AG, Registered CHF 74 13,897 0.05Sonova Holding AG, Registered CHF 31 7,091 0.03Straumann Holding AG, Registered CHF 6 5,889 0.02Swatch Group AG (The), Registered CHF 49 2,588 0.01Swatch Group AG (The) CHF 19 5,298 0.02Swiss Life Holding AG, Registered CHF 21 10,535 0.04Swiss Prime Site AG, Registered CHF 45 5,200 0.02
33
JPMORGAN FUNDS (IRELAND) ICAV - DEVELOPED WORLD EQUITY INDEX FUNDSCHEDULE OF INVESTMENTS (continued)As at 31 December 2019
Investments Currency Holding
FairValue
USD
%of
NetAssets Investments Currency Holding
FairValue
USD
%of
NetAssets
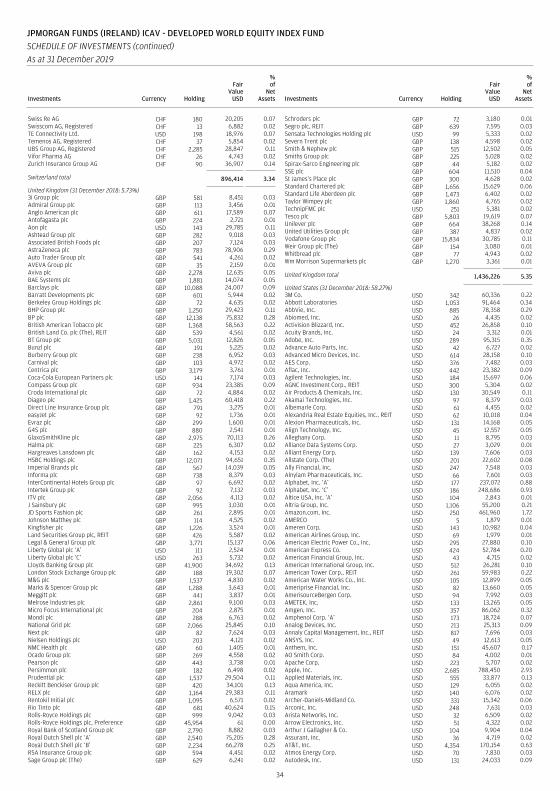
Swiss Re AG CHF 180 20,205 0.07Swisscom AG, Registered CHF 13 6,882 0.02TE Connectivity Ltd. USD 198 18,976 0.07Temenos AG, Registered CHF 37 5,854 0.02UBS Group AG, Registered CHF 2,285 28,847 0.11Vifor Pharma AG CHF 26 4,743 0.02Zurich Insurance Group AG CHF 90 36,907 0.14
Switzerland total 896,414 3.34
United Kingdom (31 December 2018: 5.73%)3i Group plc GBP 581 8,451 0.03Admiral Group plc GBP 113 3,456 0.01Anglo American plc GBP 611 17,589 0.07Antofagasta plc GBP 224 2,721 0.01Aon plc USD 143 29,785 0.11Ashtead Group plc GBP 282 9,018 0.03Associated British Foods plc GBP 207 7,124 0.03AstraZeneca plc GBP 783 78,906 0.29Auto Trader Group plc GBP 541 4,261 0.02AVEVA Group plc GBP 35 2,159 0.01Aviva plc GBP 2,278 12,635 0.05BAE Systems plc GBP 1,881 14,074 0.05Barclays plc GBP 10,088 24,007 0.09Barratt Developments plc GBP 601 5,944 0.02Berkeley Group Holdings plc GBP 72 4,635 0.02BHP Group plc GBP 1,250 29,423 0.11BP plc GBP 12,138 75,832 0.28British American Tobacco plc GBP 1,368 58,563 0.22British Land Co. plc (The), REIT GBP 539 4,561 0.02BT Group plc GBP 5,031 12,826 0.05Bunzl plc GBP 191 5,225 0.02Burberry Group plc GBP 238 6,952 0.03Carnival plc GBP 103 4,972 0.02Centrica plc GBP 3,179 3,761 0.01Coca-Cola European Partners plc USD 141 7,174 0.03Compass Group plc GBP 934 23,385 0.09Croda International plc GBP 72 4,884 0.02Diageo plc GBP 1,425 60,418 0.22Direct Line Insurance Group plc GBP 791 3,275 0.01easyJet plc GBP 92 1,736 0.01Evraz plc GBP 299 1,600 0.01G4S plc GBP 880 2,541 0.01GlaxoSmithKline plc GBP 2,975 70,113 0.26Halma plc GBP 225 6,307 0.02Hargreaves Lansdown plc GBP 162 4,153 0.02HSBC Holdings plc GBP 12,071 94,651 0.35Imperial Brands plc GBP 567 14,039 0.05Informa plc GBP 738 8,379 0.03InterContinental Hotels Group plc GBP 97 6,692 0.02Intertek Group plc GBP 92 7,132 0.03ITV plc GBP 2,056 4,113 0.02J Sainsbury plc GBP 995 3,030 0.01JD Sports Fashion plc GBP 261 2,895 0.01Johnson Matthey plc GBP 114 4,525 0.02Kingfisher plc GBP 1,226 3,524 0.01Land Securities Group plc, REIT GBP 426 5,587 0.02Legal & General Group plc GBP 3,771 15,137 0.06Liberty Global plc ‘A’ USD 111 2,524 0.01Liberty Global plc ‘C’ USD 263 5,732 0.02Lloyds Banking Group plc GBP 41,900 34,692 0.13London Stock Exchange Group plc GBP 188 19,302 0.07M&G plc GBP 1,537 4,830 0.02Marks & Spencer Group plc GBP 1,288 3,643 0.01Meggitt plc GBP 441 3,837 0.01Melrose Industries plc GBP 2,861 9,100 0.03Micro Focus International plc GBP 204 2,875 0.01Mondi plc GBP 288 6,763 0.02National Grid plc GBP 2,066 25,845 0.10Next plc GBP 82 7,624 0.03Nielsen Holdings plc USD 203 4,121 0.02NMC Health plc GBP 60 1,405 0.01Ocado Group plc GBP 269 4,558 0.02Pearson plc GBP 443 3,738 0.01Persimmon plc GBP 182 6,498 0.02Prudential plc GBP 1,537 29,504 0.11Reckitt Benckiser Group plc GBP 420 34,101 0.13RELX plc GBP 1,164 29,383 0.11Rentokil Initial plc GBP 1,095 6,571 0.02Rio Tinto plc GBP 681 40,624 0.15Rolls-Royce Holdings plc GBP 999 9,042 0.03Rolls-Royce Holdings plc, Preference GBP 45,954 61 0.00Royal Bank of Scotland Group plc GBP 2,790 8,882 0.03Royal Dutch Shell plc ‘A’ GBP 2,540 75,205 0.28Royal Dutch Shell plc ‘B’ GBP 2,234 66,278 0.25RSA Insurance Group plc GBP 594 4,451 0.02Sage Group plc (The) GBP 629 6,241 0.02
Schroders plc GBP 72 3,180 0.01Segro plc, REIT GBP 639 7,595 0.03Sensata Technologies Holding plc USD 99 5,333 0.02Severn Trent plc GBP 138 4,598 0.02Smith & Nephew plc GBP 515 12,502 0.05Smiths Group plc GBP 225 5,028 0.02Spirax-Sarco Engineering plc GBP 44 5,182 0.02SSE plc GBP 604 11,510 0.04St James’s Place plc GBP 300 4,628 0.02Standard Chartered plc GBP 1,656 15,629 0.06Standard Life Aberdeen plc GBP 1,473 6,402 0.02Taylor Wimpey plc GBP 1,860 4,765 0.02TechnipFMC plc USD 251 5,381 0.02Tesco plc GBP 5,803 19,619 0.07Unilever plc GBP 664 38,268 0.14United Utilities Group plc GBP 387 4,837 0.02Vodafone Group plc GBP 15,834 30,785 0.11Weir Group plc (The) GBP 154 3,080 0.01Whitbread plc GBP 77 4,943 0.02Wm Morrison Supermarkets plc GBP 1,270 3,361 0.01
United Kingdom total 1,436,226 5.35
United States (31 December 2018: 58.27%)3M Co. USD 342 60,336 0.22Abbott Laboratories USD 1,053 91,464 0.34AbbVie, Inc. USD 885 78,358 0.29Abiomed, Inc. USD 26 4,435 0.02Activision Blizzard, Inc. USD 452 26,858 0.10Acuity Brands, Inc. USD 24 3,312 0.01Adobe, Inc. USD 289 95,315 0.35Advance Auto Parts, Inc. USD 42 6,727 0.02Advanced Micro Devices, Inc. USD 614 28,158 0.10AES Corp. USD 376 7,482 0.03Aflac, Inc. USD 442 23,382 0.09Agilent Technologies, Inc. USD 184 15,697 0.06AGNC Investment Corp., REIT USD 300 5,304 0.02Air Products & Chemicals, Inc. USD 130 30,549 0.11Akamai Technologies, Inc. USD 97 8,379 0.03Albemarle Corp. USD 61 4,455 0.02Alexandria Real Estate Equities, Inc., REIT USD 62 10,018 0.04Alexion Pharmaceuticals, Inc. USD 131 14,168 0.05Align Technology, Inc. USD 45 12,557 0.05Alleghany Corp. USD 11 8,795 0.03Alliance Data Systems Corp. USD 27 3,029 0.01Alliant Energy Corp. USD 139 7,606 0.03Allstate Corp. (The) USD 201 22,602 0.08Ally Financial, Inc. USD 247 7,548 0.03Alnylam Pharmaceuticals, Inc. USD 66 7,601 0.03Alphabet, Inc. ‘A’ USD 177 237,072 0.88Alphabet, Inc. ‘C’ USD 186 248,686 0.93Altice USA, Inc. ‘A’ USD 104 2,843 0.01Altria Group, Inc. USD 1,106 55,200 0.21Amazon.com, Inc. USD 250 461,960 1.72AMERCO USD 5 1,879 0.01Ameren Corp. USD 143 10,982 0.04American Airlines Group, Inc. USD 69 1,979 0.01American Electric Power Co., Inc. USD 295 27,880 0.10American Express Co. USD 424 52,784 0.20American Financial Group, Inc. USD 43 4,715 0.02American International Group, Inc. USD 512 26,281 0.10American Tower Corp., REIT USD 261 59,983 0.22American Water Works Co., Inc. USD 105 12,899 0.05Ameriprise Financial, Inc. USD 82 13,660 0.05AmerisourceBergen Corp. USD 94 7,992 0.03AMETEK, Inc. USD 133 13,265 0.05Amgen, Inc. USD 357 86,062 0.32Amphenol Corp. ‘A’ USD 173 18,724 0.07Analog Devices, Inc. USD 213 25,313 0.09Annaly Capital Management, Inc., REIT USD 817 7,696 0.03ANSYS, Inc. USD 49 12,613 0.05Anthem, Inc. USD 151 45,607 0.17AO Smith Corp. USD 84 4,002 0.01Apache Corp. USD 223 5,707 0.02Apple, Inc. USD 2,685 788,450 2.93Applied Materials, Inc. USD 555 33,877 0.13Aqua America, Inc. USD 129 6,055 0.02Aramark USD 140 6,076 0.02Archer-Daniels-Midland Co. USD 331 15,342 0.06Arconic, Inc. USD 248 7,631 0.03Arista Networks, Inc. USD 32 6,509 0.02Arrow Electronics, Inc. USD 51 4,322 0.02Arthur J Gallagher & Co. USD 104 9,904 0.04Assurant, Inc. USD 36 4,719 0.02AT&T, Inc. USD 4,354 170,154 0.63Atmos Energy Corp. USD 70 7,830 0.03Autodesk, Inc. USD 131 24,033 0.09
34
JPMORGAN FUNDS (IRELAND) ICAV - DEVELOPED WORLD EQUITY INDEX FUNDSCHEDULE OF INVESTMENTS (continued)As at 31 December 2019
Investments Currency Holding
FairValue
USD
%of
NetAssets Investments Currency Holding
FairValue
USD
%of
NetAssets
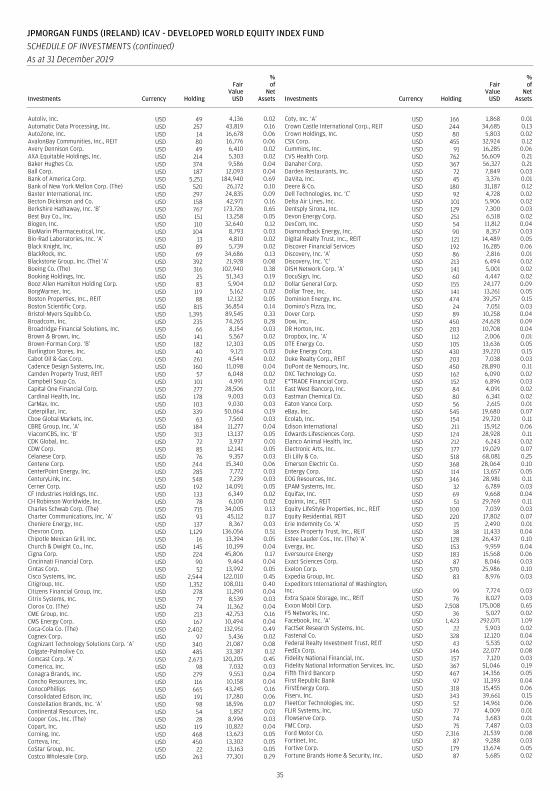
Autoliv, Inc. USD 49 4,136 0.02Automatic Data Processing, Inc. USD 257 43,819 0.16AutoZone, Inc. USD 14 16,678 0.06AvalonBay Communities, Inc., REIT USD 80 16,776 0.06Avery Dennison Corp. USD 49 6,410 0.02AXA Equitable Holdings, Inc. USD 214 5,303 0.02Baker Hughes Co. USD 374 9,586 0.04Ball Corp. USD 187 12,093 0.04Bank of America Corp. USD 5,251 184,940 0.69Bank of New York Mellon Corp. (The) USD 520 26,172 0.10Baxter International, Inc. USD 297 24,835 0.09Becton Dickinson and Co. USD 158 42,971 0.16Berkshire Hathaway, Inc. ‘B’ USD 767 173,726 0.65Best Buy Co., Inc. USD 151 13,258 0.05Biogen, Inc. USD 110 32,640 0.12BioMarin Pharmaceutical, Inc. USD 104 8,793 0.03Bio-Rad Laboratories, Inc. ‘A’ USD 13 4,810 0.02Black Knight, Inc. USD 89 5,739 0.02BlackRock, Inc. USD 69 34,686 0.13Blackstone Group, Inc. (The) ‘A’ USD 392 21,928 0.08Boeing Co. (The) USD 316 102,940 0.38Booking Holdings, Inc. USD 25 51,343 0.19Booz Allen Hamilton Holding Corp. USD 83 5,904 0.02BorgWarner, Inc. USD 119 5,162 0.02Boston Properties, Inc., REIT USD 88 12,132 0.05Boston Scientific Corp. USD 815 36,854 0.14Bristol-Myers Squibb Co. USD 1,395 89,545 0.33Broadcom, Inc. USD 235 74,265 0.28Broadridge Financial Solutions, Inc. USD 66 8,154 0.03Brown & Brown, Inc. USD 141 5,567 0.02Brown-Forman Corp. ‘B’ USD 182 12,303 0.05Burlington Stores, Inc. USD 40 9,121 0.03Cabot Oil & Gas Corp. USD 261 4,544 0.02Cadence Design Systems, Inc. USD 160 11,098 0.04Camden Property Trust, REIT USD 57 6,048 0.02Campbell Soup Co. USD 101 4,991 0.02Capital One Financial Corp. USD 277 28,506 0.11Cardinal Health, Inc. USD 178 9,003 0.03CarMax, Inc. USD 103 9,030 0.03Caterpillar, Inc. USD 339 50,064 0.19Cboe Global Markets, Inc. USD 63 7,560 0.03CBRE Group, Inc. ‘A’ USD 184 11,277 0.04ViacomCBS, Inc. ‘B’ USD 313 13,137 0.05CDK Global, Inc. USD 72 3,937 0.01CDW Corp. USD 85 12,141 0.05Celanese Corp. USD 76 9,357 0.03Centene Corp. USD 244 15,340 0.06CenterPoint Energy, Inc. USD 285 7,772 0.03CenturyLink, Inc. USD 548 7,239 0.03Cerner Corp. USD 192 14,091 0.05CF Industries Holdings, Inc. USD 133 6,349 0.02CH Robinson Worldwide, Inc. USD 78 6,100 0.02Charles Schwab Corp. (The) USD 715 34,005 0.13Charter Communications, Inc. ‘A’ USD 93 45,112 0.17Cheniere Energy, Inc. USD 137 8,367 0.03Chevron Corp. USD 1,129 136,056 0.51Chipotle Mexican Grill, Inc. USD 16 13,394 0.05Church & Dwight Co., Inc. USD 145 10,199 0.04Cigna Corp. USD 224 45,806 0.17Cincinnati Financial Corp. USD 90 9,464 0.04Cintas Corp. USD 52 13,992 0.05Cisco Systems, Inc. USD 2,544 122,010 0.45Citigroup, Inc. USD 1,352 108,011 0.40Citizens Financial Group, Inc. USD 278 11,290 0.04Citrix Systems, Inc. USD 77 8,539 0.03Clorox Co. (The) USD 74 11,362 0.04CME Group, Inc. USD 213 42,753 0.16CMS Energy Corp. USD 167 10,494 0.04Coca-Cola Co. (The) USD 2,402 132,951 0.49Cognex Corp. USD 97 5,436 0.02Cognizant Technology Solutions Corp. ‘A’ USD 340 21,087 0.08Colgate-Palmolive Co. USD 485 33,387 0.12Comcast Corp. ‘A’ USD 2,673 120,205 0.45Comerica, Inc. USD 98 7,032 0.03Conagra Brands, Inc. USD 279 9,553 0.04Concho Resources, Inc. USD 116 10,158 0.04ConocoPhillips USD 665 43,245 0.16Consolidated Edison, Inc. USD 191 17,280 0.06Constellation Brands, Inc. ‘A’ USD 98 18,596 0.07Continental Resources, Inc. USD 54 1,852 0.01Cooper Cos., Inc. (The) USD 28 8,996 0.03Copart, Inc. USD 119 10,822 0.04Corning, Inc. USD 468 13,623 0.05Corteva, Inc. USD 450 13,302 0.05CoStar Group, Inc. USD 22 13,163 0.05Costco Wholesale Corp. USD 263 77,301 0.29
Coty, Inc. ‘A’ USD 166 1,868 0.01Crown Castle International Corp., REIT USD 244 34,685 0.13Crown Holdings, Inc. USD 80 5,803 0.02CSX Corp. USD 455 32,924 0.12Cummins, Inc. USD 91 16,285 0.06CVS Health Corp. USD 762 56,609 0.21Danaher Corp. USD 367 56,327 0.21Darden Restaurants, Inc. USD 72 7,849 0.03DaVita, Inc. USD 45 3,376 0.01Deere & Co. USD 180 31,187 0.12Dell Technologies, Inc. ‘C’ USD 92 4,728 0.02Delta Air Lines, Inc. USD 101 5,906 0.02Dentsply Sirona, Inc. USD 129 7,300 0.03Devon Energy Corp. USD 251 6,518 0.02DexCom, Inc. USD 54 11,812 0.04Diamondback Energy, Inc. USD 90 8,357 0.03Digital Realty Trust, Inc., REIT USD 121 14,489 0.05Discover Financial Services USD 192 16,285 0.06Discovery, Inc. ‘A’ USD 86 2,816 0.01Discovery, Inc. ‘C’ USD 213 6,494 0.02DISH Network Corp. ‘A’ USD 141 5,001 0.02DocuSign, Inc. USD 60 4,447 0.02Dollar General Corp. USD 155 24,177 0.09Dollar Tree, Inc. USD 141 13,261 0.05Dominion Energy, Inc. USD 474 39,257 0.15Domino’s Pizza, Inc. USD 24 7,051 0.03Dover Corp. USD 89 10,258 0.04Dow, Inc. USD 450 24,628 0.09DR Horton, Inc. USD 203 10,708 0.04Dropbox, Inc. ‘A’ USD 112 2,006 0.01DTE Energy Co. USD 105 13,636 0.05Duke Energy Corp. USD 430 39,220 0.15Duke Realty Corp., REIT USD 203 7,038 0.03DuPont de Nemours, Inc. USD 450 28,890 0.11DXC Technology Co. USD 162 6,090 0.02E*TRADE Financial Corp. USD 152 6,896 0.03East West Bancorp, Inc. USD 84 4,091 0.02Eastman Chemical Co. USD 80 6,341 0.02Eaton Vance Corp. USD 56 2,615 0.01eBay, Inc. USD 545 19,680 0.07Ecolab, Inc. USD 154 29,720 0.11Edison International USD 211 15,912 0.06Edwards Lifesciences Corp. USD 124 28,928 0.11Elanco Animal Health, Inc. USD 212 6,243 0.02Electronic Arts, Inc. USD 177 19,029 0.07Eli Lilly & Co. USD 518 68,081 0.25Emerson Electric Co. USD 368 28,064 0.10Entergy Corp. USD 114 13,657 0.05EOG Resources, Inc. USD 346 28,981 0.11EPAM Systems, Inc. USD 32 6,789 0.03Equifax, Inc. USD 69 9,668 0.04Equinix, Inc., REIT USD 51 29,769 0.11Equity LifeStyle Properties, Inc., REIT USD 100 7,039 0.03Equity Residential, REIT USD 220 17,802 0.07Erie Indemnity Co. ‘A’ USD 15 2,490 0.01Essex Property Trust, Inc., REIT USD 38 11,433 0.04Estee Lauder Cos., Inc. (The) ‘A’ USD 128 26,437 0.10Evergy, Inc. USD 153 9,959 0.04Eversource Energy USD 183 15,568 0.06Exact Sciences Corp. USD 87 8,046 0.03Exelon Corp. USD 570 25,986 0.10Expedia Group, Inc. USD 83 8,976 0.03Expeditors International of Washington,Inc. USD 99 7,724 0.03Extra Space Storage, Inc., REIT USD 76 8,027 0.03Exxon Mobil Corp. USD 2,508 175,008 0.65F5 Networks, Inc. USD 36 5,027 0.02Facebook, Inc. ‘A’ USD 1,423 292,071 1.09FactSet Research Systems, Inc. USD 22 5,903 0.02Fastenal Co. USD 328 12,120 0.04Federal Realty Investment Trust, REIT USD 43 5,535 0.02FedEx Corp. USD 146 22,077 0.08Fidelity National Financial, Inc. USD 157 7,120 0.03Fidelity National Information Services, Inc. USD 367 51,046 0.19Fifth Third Bancorp USD 467 14,356 0.05First Republic Bank USD 97 11,393 0.04FirstEnergy Corp. USD 318 15,455 0.06Fiserv, Inc. USD 343 39,661 0.15FleetCor Technologies, Inc. USD 52 14,961 0.06FLIR Systems, Inc. USD 77 4,009 0.01Flowserve Corp. USD 74 3,683 0.01FMC Corp. USD 75 7,487 0.03Ford Motor Co. USD 2,316 21,539 0.08Fortinet, Inc. USD 87 9,288 0.03Fortive Corp. USD 179 13,674 0.05Fortune Brands Home & Security, Inc. USD 87 5,685 0.02
35
JPMORGAN FUNDS (IRELAND) ICAV - DEVELOPED WORLD EQUITY INDEX FUNDSCHEDULE OF INVESTMENTS (continued)As at 31 December 2019
Investments Currency Holding
FairValue
USD
%of
NetAssets Investments Currency Holding
FairValue
USD
%of
NetAssets
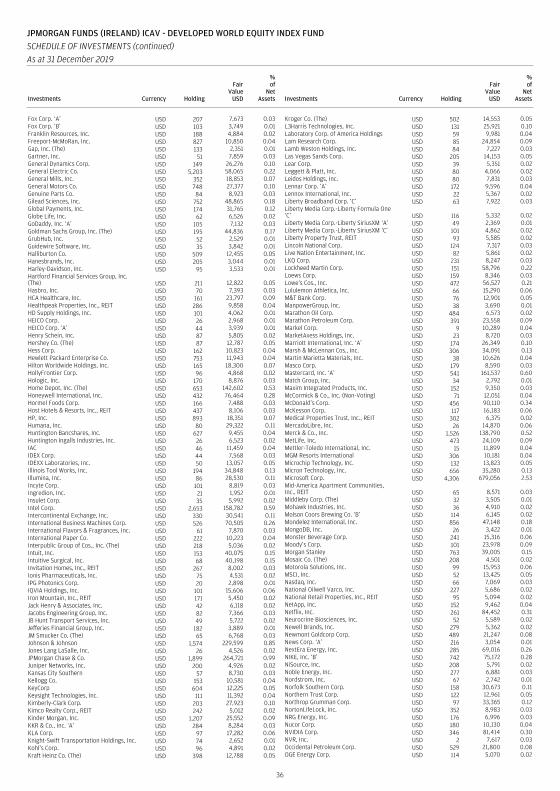
Fox Corp. ‘A’ USD 207 7,673 0.03Fox Corp. ‘B’ USD 103 3,749 0.01Franklin Resources, Inc. USD 188 4,884 0.02Freeport-McMoRan, Inc. USD 827 10,850 0.04Gap, Inc. (The) USD 133 2,351 0.01Gartner, Inc. USD 51 7,859 0.03General Dynamics Corp. USD 149 26,276 0.10General Electric Co. USD 5,203 58,065 0.22General Mills, Inc. USD 352 18,853 0.07General Motors Co. USD 748 27,377 0.10Genuine Parts Co. USD 84 8,923 0.03Gilead Sciences, Inc. USD 752 48,865 0.18Global Payments, Inc. USD 174 31,765 0.12Globe Life, Inc. USD 62 6,526 0.02GoDaddy, Inc. ‘A’ USD 105 7,132 0.03Goldman Sachs Group, Inc. (The) USD 195 44,836 0.17GrubHub, Inc. USD 52 2,529 0.01Guidewire Software, Inc. USD 35 3,842 0.01Halliburton Co. USD 509 12,455 0.05Hanesbrands, Inc. USD 205 3,044 0.01Harley-Davidson, Inc. USD 95 3,533 0.01Hartford Financial Services Group, Inc.(The) USD 211 12,822 0.05Hasbro, Inc. USD 70 7,393 0.03HCA Healthcare, Inc. USD 161 23,797 0.09Healthpeak Properties, Inc., REIT USD 286 9,858 0.04HD Supply Holdings, Inc. USD 101 4,062 0.01HEICO Corp. USD 26 2,968 0.01HEICO Corp. ‘A’ USD 44 3,939 0.01Henry Schein, Inc. USD 87 5,805 0.02Hershey Co. (The) USD 87 12,787 0.05Hess Corp. USD 162 10,823 0.04Hewlett Packard Enterprise Co. USD 753 11,943 0.04Hilton Worldwide Holdings, Inc. USD 165 18,300 0.07HollyFrontier Corp. USD 96 4,868 0.02Hologic, Inc. USD 170 8,876 0.03Home Depot, Inc. (The) USD 653 142,602 0.53Honeywell International, Inc. USD 432 76,464 0.28Hormel Foods Corp. USD 166 7,488 0.03Host Hotels & Resorts, Inc., REIT USD 437 8,106 0.03HP, Inc. USD 893 18,351 0.07Humana, Inc. USD 80 29,322 0.11Huntington Bancshares, Inc. USD 627 9,455 0.04Huntington Ingalls Industries, Inc. USD 26 6,523 0.02IAC USD 46 11,459 0.04IDEX Corp. USD 44 7,568 0.03IDEXX Laboratories, Inc. USD 50 13,057 0.05Illinois Tool Works, Inc. USD 194 34,848 0.13Illumina, Inc. USD 86 28,530 0.11Incyte Corp. USD 101 8,819 0.03Ingredion, Inc. USD 21 1,952 0.01Insulet Corp. USD 35 5,992 0.02Intel Corp. USD 2,653 158,782 0.59Intercontinental Exchange, Inc. USD 330 30,541 0.11International Business Machines Corp. USD 526 70,505 0.26International Flavors & Fragrances, Inc. USD 61 7,870 0.03International Paper Co. USD 222 10,223 0.04Interpublic Group of Cos., Inc. (The) USD 218 5,036 0.02Intuit, Inc. USD 153 40,075 0.15Intuitive Surgical, Inc. USD 68 40,198 0.15Invitation Homes, Inc., REIT USD 267 8,002 0.03Ionis Pharmaceuticals, Inc. USD 75 4,531 0.02IPG Photonics Corp. USD 20 2,898 0.01IQVIA Holdings, Inc. USD 101 15,606 0.06Iron Mountain, Inc., REIT USD 171 5,450 0.02Jack Henry & Associates, Inc. USD 42 6,118 0.02Jacobs Engineering Group, Inc. USD 82 7,366 0.03JB Hunt Transport Services, Inc. USD 49 5,722 0.02Jefferies Financial Group, Inc. USD 182 3,889 0.01JM Smucker Co. (The) USD 65 6,768 0.03Johnson & Johnson USD 1,574 229,599 0.85Jones Lang LaSalle, Inc. USD 26 4,526 0.02JPMorgan Chase & Co. USD 1,899 264,721 0.99Juniper Networks, Inc. USD 200 4,926 0.02Kansas City Southern USD 57 8,730 0.03Kellogg Co. USD 153 10,581 0.04KeyCorp USD 604 12,225 0.05Keysight Technologies, Inc. USD 111 11,392 0.04Kimberly-Clark Corp. USD 203 27,923 0.10Kimco Realty Corp., REIT USD 242 5,012 0.02Kinder Morgan, Inc. USD 1,207 25,552 0.09KKR & Co., Inc. ‘A’ USD 284 8,284 0.03KLA Corp. USD 97 17,282 0.06Knight-Swift Transportation Holdings, Inc. USD 74 2,652 0.01Kohl’s Corp. USD 96 4,891 0.02Kraft Heinz Co. (The) USD 398 12,788 0.05
Kroger Co. (The) USD 502 14,553 0.05L3Harris Technologies, Inc. USD 131 25,921 0.10Laboratory Corp. of America Holdings USD 59 9,981 0.04Lam Research Corp. USD 85 24,854 0.09Lamb Weston Holdings, Inc. USD 84 7,227 0.03Las Vegas Sands Corp. USD 205 14,153 0.05Lear Corp. USD 39 5,351 0.02Leggett & Platt, Inc. USD 80 4,066 0.02Leidos Holdings, Inc. USD 80 7,831 0.03Lennar Corp. ‘A’ USD 172 9,596 0.04Lennox International, Inc. USD 22 5,367 0.02Liberty Broadband Corp. ‘C’ USD 63 7,922 0.03Liberty Media Corp.-Liberty Formula One‘C’ USD 116 5,332 0.02Liberty Media Corp.-Liberty SiriusXM ‘A’ USD 49 2,369 0.01Liberty Media Corp.-Liberty SiriusXM ‘C’ USD 101 4,862 0.02Liberty Property Trust, REIT USD 93 5,585 0.02Lincoln National Corp. USD 124 7,317 0.03Live Nation Entertainment, Inc. USD 82 5,861 0.02LKQ Corp. USD 231 8,247 0.03Lockheed Martin Corp. USD 151 58,796 0.22Loews Corp. USD 159 8,346 0.03Lowe’s Cos., Inc. USD 472 56,527 0.21Lululemon Athletica, Inc. USD 66 15,290 0.06M&T Bank Corp. USD 76 12,901 0.05ManpowerGroup, Inc. USD 38 3,690 0.01Marathon Oil Corp. USD 484 6,573 0.02Marathon Petroleum Corp. USD 391 23,558 0.09Markel Corp. USD 9 10,289 0.04MarketAxess Holdings, Inc. USD 23 8,720 0.03Marriott International, Inc. ‘A’ USD 174 26,349 0.10Marsh & McLennan Cos., Inc. USD 306 34,091 0.13Martin Marietta Materials, Inc. USD 38 10,626 0.04Masco Corp. USD 179 8,590 0.03Mastercard, Inc. ‘A’ USD 541 161,537 0.60Match Group, Inc. USD 34 2,792 0.01Maxim Integrated Products, Inc. USD 152 9,350 0.03McCormick & Co., Inc. (Non-Voting) USD 71 12,051 0.04McDonald’s Corp. USD 456 90,110 0.34McKesson Corp. USD 117 16,183 0.06Medical Properties Trust, Inc., REIT USD 302 6,375 0.02MercadoLibre, Inc. USD 26 14,870 0.06Merck & Co., Inc. USD 1,526 138,790 0.52MetLife, Inc. USD 473 24,109 0.09Mettler-Toledo International, Inc. USD 15 11,899 0.04MGM Resorts International USD 306 10,181 0.04Microchip Technology, Inc. USD 132 13,823 0.05Micron Technology, Inc. USD 656 35,280 0.13Microsoft Corp. USD 4,306 679,056 2.53Mid-America Apartment Communities,Inc., REIT USD 65 8,571 0.03Middleby Corp. (The) USD 32 3,505 0.01Mohawk Industries, Inc. USD 36 4,910 0.02Molson Coors Brewing Co. ‘B’ USD 114 6,145 0.02Mondelez International, Inc. USD 856 47,148 0.18MongoDB, Inc. USD 26 3,422 0.01Monster Beverage Corp. USD 241 15,316 0.06Moody’s Corp. USD 101 23,978 0.09Morgan Stanley USD 763 39,005 0.15Mosaic Co. (The) USD 208 4,501 0.02Motorola Solutions, Inc. USD 99 15,953 0.06MSCI, Inc. USD 52 13,425 0.05Nasdaq, Inc. USD 66 7,069 0.03National Oilwell Varco, Inc. USD 227 5,686 0.02National Retail Properties, Inc., REIT USD 95 5,094 0.02NetApp, Inc. USD 152 9,462 0.04Netflix, Inc. USD 261 84,452 0.31Neurocrine Biosciences, Inc. USD 52 5,589 0.02Newell Brands, Inc. USD 279 5,362 0.02Newmont Goldcorp Corp. USD 489 21,247 0.08News Corp. ‘A’ USD 216 3,054 0.01NextEra Energy, Inc. USD 285 69,016 0.26NIKE, Inc. ‘B’ USD 742 75,172 0.28NiSource, Inc. USD 208 5,791 0.02Noble Energy, Inc. USD 277 6,881 0.03Nordstrom, Inc. USD 67 2,742 0.01Norfolk Southern Corp. USD 158 30,673 0.11Northern Trust Corp. USD 122 12,961 0.05Northrop Grumman Corp. USD 97 33,365 0.12NortonLifeLock, Inc. USD 352 8,983 0.03NRG Energy, Inc. USD 176 6,996 0.03Nucor Corp. USD 180 10,130 0.04NVIDIA Corp. USD 346 81,414 0.30NVR, Inc. USD 2 7,617 0.03Occidental Petroleum Corp. USD 529 21,800 0.08OGE Energy Corp. USD 114 5,070 0.02
36
JPMORGAN FUNDS (IRELAND) ICAV - DEVELOPED WORLD EQUITY INDEX FUNDSCHEDULE OF INVESTMENTS (continued)As at 31 December 2019
Investments Currency Holding
FairValue
USD
%of
NetAssets Investments Currency Holding
FairValue
USD
%of
NetAssets
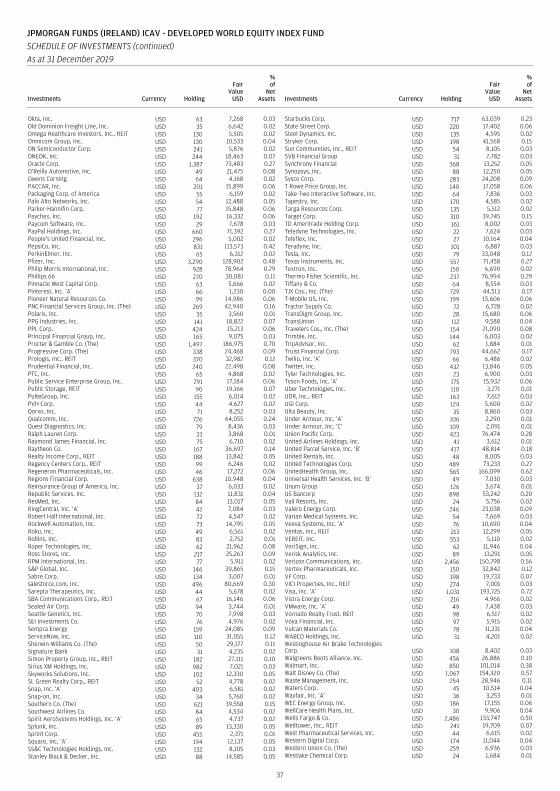
Okta, Inc. USD 63 7,268 0.03Old Dominion Freight Line, Inc. USD 35 6,642 0.02Omega Healthcare Investors, Inc., REIT USD 130 5,505 0.02Omnicom Group, Inc. USD 130 10,533 0.04ON Semiconductor Corp. USD 241 5,876 0.02ONEOK, Inc. USD 244 18,463 0.07Oracle Corp. USD 1,387 73,483 0.27O’Reilly Automotive, Inc. USD 49 21,475 0.08Owens Corning USD 64 4,168 0.02PACCAR, Inc. USD 201 15,899 0.06Packaging Corp. of America USD 55 6,159 0.02Palo Alto Networks, Inc. USD 54 12,488 0.05Parker-Hannifin Corp. USD 77 15,848 0.06Paychex, Inc. USD 192 16,332 0.06Paycom Software, Inc. USD 29 7,678 0.03PayPal Holdings, Inc. USD 660 71,392 0.27People’s United Financial, Inc. USD 296 5,002 0.02PepsiCo, Inc. USD 831 113,573 0.42PerkinElmer, Inc. USD 65 6,312 0.02Pfizer, Inc. USD 3,290 128,902 0.48Philip Morris International, Inc. USD 928 78,964 0.29Phillips 66 USD 270 30,081 0.11Pinnacle West Capital Corp. USD 63 5,666 0.02Pinterest, Inc. ‘A’ USD 66 1,230 0.00Pioneer Natural Resources Co. USD 99 14,986 0.06PNC Financial Services Group, Inc. (The) USD 269 42,940 0.16Polaris, Inc. USD 35 3,560 0.01PPG Industries, Inc. USD 141 18,822 0.07PPL Corp. USD 424 15,213 0.06Principal Financial Group, Inc. USD 165 9,075 0.03Procter & Gamble Co. (The) USD 1,497 186,975 0.70Progressive Corp. (The) USD 338 24,468 0.09Prologis, Inc., REIT USD 370 32,982 0.12Prudential Financial, Inc. USD 240 22,498 0.08PTC, Inc. USD 65 4,868 0.02Public Service Enterprise Group, Inc. USD 291 17,184 0.06Public Storage, REIT USD 90 19,166 0.07PulteGroup, Inc. USD 155 6,014 0.02PVH Corp. USD 44 4,627 0.02Qorvo, Inc. USD 71 8,252 0.03Qualcomm, Inc. USD 726 64,055 0.24Quest Diagnostics, Inc. USD 79 8,436 0.03Ralph Lauren Corp. USD 33 3,868 0.01Raymond James Financial, Inc. USD 75 6,710 0.02Raytheon Co. USD 167 36,697 0.14Realty Income Corp., REIT USD 188 13,842 0.05Regency Centers Corp., REIT USD 99 6,246 0.02Regeneron Pharmaceuticals, Inc. USD 46 17,272 0.06Regions Financial Corp. USD 638 10,948 0.04Reinsurance Group of America, Inc. USD 37 6,033 0.02Republic Services, Inc. USD 132 11,831 0.04ResMed, Inc. USD 84 13,017 0.05RingCentral, Inc. ‘A’ USD 42 7,084 0.03Robert Half International, Inc. USD 72 4,547 0.02Rockwell Automation, Inc. USD 73 14,795 0.05Roku, Inc. USD 49 6,561 0.02Rollins, Inc. USD 83 2,752 0.01Roper Technologies, Inc. USD 62 21,962 0.08Ross Stores, Inc. USD 217 25,263 0.09RPM International, Inc. USD 77 5,911 0.02S&P Global, Inc. USD 146 39,865 0.15Sabre Corp. USD 134 3,007 0.01salesforce.com, Inc. USD 496 80,669 0.30Sarepta Therapeutics, Inc. USD 44 5,678 0.02SBA Communications Corp., REIT USD 67 16,146 0.06Sealed Air Corp. USD 94 3,744 0.01Seattle Genetics, Inc. USD 70 7,998 0.03SEI Investments Co. USD 76 4,976 0.02Sempra Energy USD 159 24,085 0.09ServiceNow, Inc. USD 110 31,055 0.12Sherwin-Williams Co. (The) USD 50 29,177 0.11Signature Bank USD 31 4,235 0.02Simon Property Group, Inc., REIT USD 182 27,111 0.10Sirius XM Holdings, Inc. USD 982 7,021 0.03Skyworks Solutions, Inc. USD 102 12,330 0.05SL Green Realty Corp., REIT USD 52 4,778 0.02Snap, Inc. ‘A’ USD 403 6,581 0.02Snap-on, Inc. USD 34 5,760 0.02Southern Co. (The) USD 621 39,558 0.15Southwest Airlines Co. USD 84 4,534 0.02Spirit AeroSystems Holdings, Inc. ‘A’ USD 65 4,737 0.02Splunk, Inc. USD 89 13,330 0.05Sprint Corp. USD 455 2,371 0.01Square, Inc. ‘A’ USD 194 12,137 0.05SS&C Technologies Holdings, Inc. USD 132 8,105 0.03Stanley Black & Decker, Inc. USD 88 14,585 0.05
Starbucks Corp. USD 717 63,039 0.23State Street Corp. USD 220 17,402 0.06Steel Dynamics, Inc. USD 135 4,595 0.02Stryker Corp. USD 198 41,568 0.15Sun Communities, Inc., REIT USD 54 8,105 0.03SVB Financial Group USD 31 7,782 0.03Synchrony Financial USD 368 13,252 0.05Synopsys, Inc. USD 88 12,250 0.05Sysco Corp. USD 283 24,208 0.09T Rowe Price Group, Inc. USD 140 17,058 0.06Take-Two Interactive Software, Inc. USD 64 7,836 0.03Tapestry, Inc. USD 170 4,585 0.02Targa Resources Corp. USD 135 5,512 0.02Target Corp. USD 310 39,745 0.15TD Ameritrade Holding Corp. USD 161 8,002 0.03Teledyne Technologies, Inc. USD 22 7,624 0.03Teleflex, Inc. USD 27 10,164 0.04Teradyne, Inc. USD 101 6,887 0.03Tesla, Inc. USD 79 33,048 0.12Texas Instruments, Inc. USD 557 71,458 0.27Textron, Inc. USD 150 6,690 0.02Thermo Fisher Scientific, Inc. USD 237 76,994 0.29Tiffany & Co. USD 64 8,554 0.03TJX Cos., Inc. (The) USD 729 44,513 0.17T-Mobile US, Inc. USD 199 15,606 0.06Tractor Supply Co. USD 72 6,728 0.02TransDigm Group, Inc. USD 28 15,680 0.06TransUnion USD 112 9,588 0.04Travelers Cos., Inc. (The) USD 154 21,090 0.08Trimble, Inc. USD 144 6,003 0.02TripAdvisor, Inc. USD 62 1,884 0.01Truist Financial Corp. USD 793 44,662 0.17Twilio, Inc. ‘A’ USD 66 6,486 0.02Twitter, Inc. USD 432 13,846 0.05Tyler Technologies, Inc. USD 23 6,900 0.03Tyson Foods, Inc. ‘A’ USD 175 15,932 0.06Uber Technologies, Inc. USD 110 3,271 0.01UDR, Inc., REIT USD 163 7,612 0.03UGI Corp. USD 124 5,600 0.02Ulta Beauty, Inc. USD 35 8,860 0.03Under Armour, Inc. ‘A’ USD 106 2,290 0.01Under Armour, Inc. ‘C’ USD 109 2,091 0.01Union Pacific Corp. USD 423 76,474 0.28United Airlines Holdings, Inc. USD 41 3,612 0.01United Parcel Service, Inc. ‘B’ USD 417 48,814 0.18United Rentals, Inc. USD 48 8,005 0.03United Technologies Corp. USD 489 73,233 0.27UnitedHealth Group, Inc. USD 565 166,099 0.62Universal Health Services, Inc. ‘B’ USD 49 7,030 0.03Unum Group USD 126 3,674 0.01US Bancorp USD 898 53,242 0.20Vail Resorts, Inc. USD 24 5,756 0.02Valero Energy Corp. USD 246 23,038 0.09Varian Medical Systems, Inc. USD 54 7,669 0.03Veeva Systems, Inc. ‘A’ USD 76 10,690 0.04Ventas, Inc., REIT USD 213 12,299 0.05VEREIT, Inc. USD 553 5,110 0.02VeriSign, Inc. USD 62 11,946 0.04Verisk Analytics, Inc. USD 89 13,291 0.05Verizon Communications, Inc. USD 2,456 150,798 0.56Vertex Pharmaceuticals, Inc. USD 150 32,842 0.12VF Corp. USD 198 19,733 0.07VICI Properties, Inc., REIT USD 274 7,001 0.03Visa, Inc. ‘A’ USD 1,031 193,725 0.72Vistra Energy Corp. USD 216 4,966 0.02VMware, Inc. ‘A’ USD 49 7,438 0.03Vornado Realty Trust, REIT USD 98 6,517 0.02Voya Financial, Inc. USD 97 5,915 0.02Vulcan Materials Co. USD 78 11,231 0.04WABCO Holdings, Inc. USD 31 4,201 0.02Westinghouse Air Brake TechnologiesCorp. USD 108 8,402 0.03Walgreens Boots Alliance, Inc. USD 456 26,886 0.10Walmart, Inc. USD 850 101,014 0.38Walt Disney Co. (The) USD 1,067 154,320 0.57Waste Management, Inc. USD 254 28,946 0.11Waters Corp. USD 45 10,514 0.04Wayfair, Inc. ‘A’ USD 36 3,253 0.01WEC Energy Group, Inc. USD 186 17,155 0.06WellCare Health Plans, Inc. USD 30 9,906 0.04Wells Fargo & Co. USD 2,486 133,747 0.50Welltower, Inc., REIT USD 241 19,709 0.07West Pharmaceutical Services, Inc. USD 44 6,615 0.02Western Digital Corp. USD 174 11,044 0.04Western Union Co. (The) USD 259 6,936 0.03Westlake Chemical Corp. USD 24 1,684 0.01
37
JPMORGAN FUNDS (IRELAND) ICAV - DEVELOPED WORLD EQUITY INDEX FUNDSCHEDULE OF INVESTMENTS (continued)As at 31 December 2019
Investments Currency Holding
FairValue
USD
%of
NetAssets Investments Currency Holding
FairValue
USD
%of
NetAssets
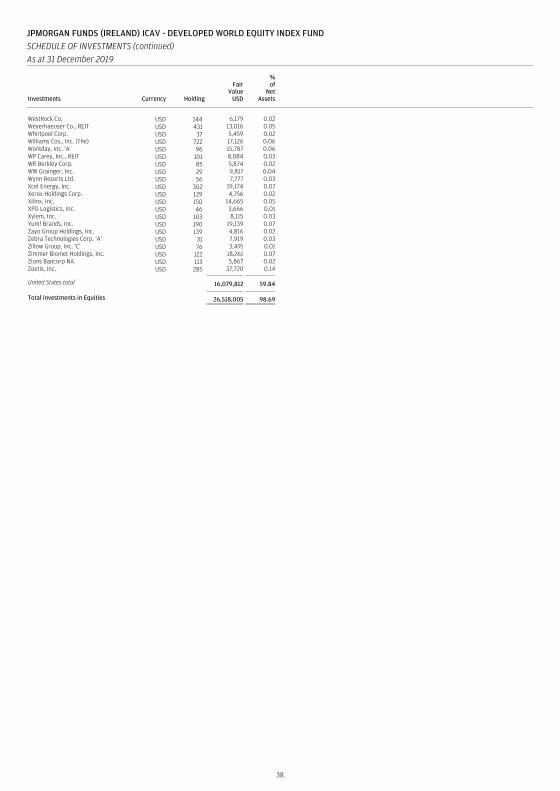
WestRock Co. USD 144 6,179 0.02Weyerhaeuser Co., REIT USD 431 13,016 0.05Whirlpool Corp. USD 37 5,459 0.02Williams Cos., Inc. (The) USD 722 17,126 0.06Workday, Inc. ‘A’ USD 96 15,787 0.06WP Carey, Inc., REIT USD 101 8,084 0.03WR Berkley Corp. USD 85 5,874 0.02WW Grainger, Inc. USD 29 9,817 0.04Wynn Resorts Ltd. USD 56 7,777 0.03Xcel Energy, Inc. USD 302 19,174 0.07Xerox Holdings Corp. USD 129 4,756 0.02Xilinx, Inc. USD 150 14,665 0.05XPO Logistics, Inc. USD 46 3,666 0.01Xylem, Inc. USD 103 8,115 0.03Yum! Brands, Inc. USD 190 19,139 0.07Zayo Group Holdings, Inc. USD 139 4,816 0.02Zebra Technologies Corp. ‘A’ USD 31 7,919 0.03Zillow Group, Inc. ‘C’ USD 76 3,491 0.01Zimmer Biomet Holdings, Inc. USD 122 18,261 0.07Zions Bancorp NA USD 113 5,867 0.02Zoetis, Inc. USD 285 37,720 0.14
United States total 16,079,812 59.84
Total investments in Equities 26,518,005 98.69
38
JPMORGAN FUNDS (IRELAND) ICAV - DEVELOPED WORLD EQUITY INDEX FUNDSCHEDULE OF INVESTMENTS (continued)As at 31 December 2019
Investments Currency Holding
FairValue
USD
%of
NetAssets Investments Currency
Quantity/Nominal
Value
FairValue
USD
%of
NetAssets
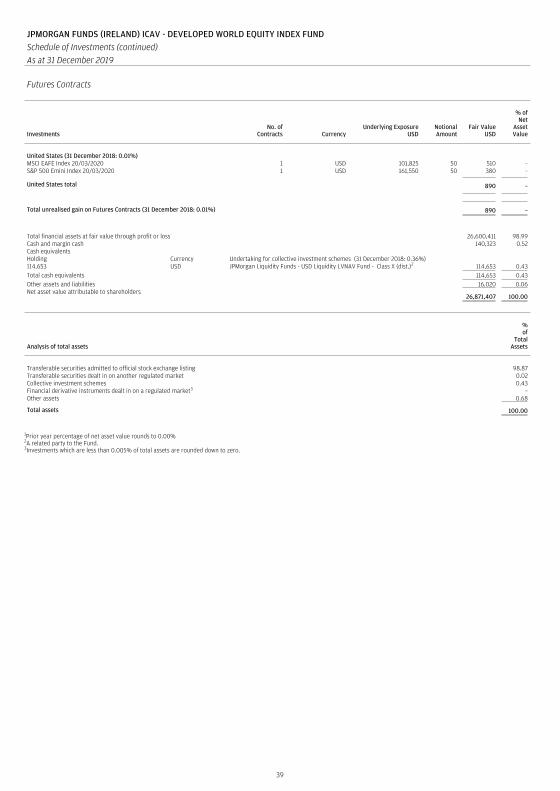
JPMORGAN FUNDS (IRELAND) ICAV - DEVELOPED WORLD EQUITY INDEX FUNDSchedule of Investments (continued)As at 31 December 2019
Futures Contracts
InvestmentsNo. of
Contracts CurrencyUnderlying Exposure
USDNotionalAmount
Fair ValueUSD
% ofNet
AssetValue
United States (31 December 2018: 0.01%)MSCI EAFE Index 20/03/2020 1 USD 101,825 50 510 –S&P 500 Emini Index 20/03/2020 1 USD 161,550 50 380 –
United States total 890 –
Total unrealised gain on Futures Contracts (31 December 2018: 0.01%) 890 –
Total financial assets at fair value through profit or loss 26,600,411 98.99Cash and margin cash 140,323 0.52Cash equivalentsHolding Currency Undertaking for collective investment schemes (31 December 2018: 0.36%)114,653 USD JPMorgan Liquidity Funds - USD Liquidity LVNAV Fund - Class X (dist.)2 114,653 0.43Total cash equivalents 114,653 0.43Other assets and liabilities 16,020 0.06Net asset value attributable to shareholders
26,871,407 100.00
Analysis of total assets
%of
TotalAssets
Transferable securities admitted to official stock exchange listing 98.87Transferable securities dealt in on another regulated market 0.02Collective investment schemes 0.43Financial derivative instruments dealt in on a regulated market3 –Other assets 0.68
Total assets 100.00
1Prior year percentage of net asset value rounds to 0.00%2A related party to the Fund.3Investments which are less than 0.005% of total assets are rounded down to zero.
39
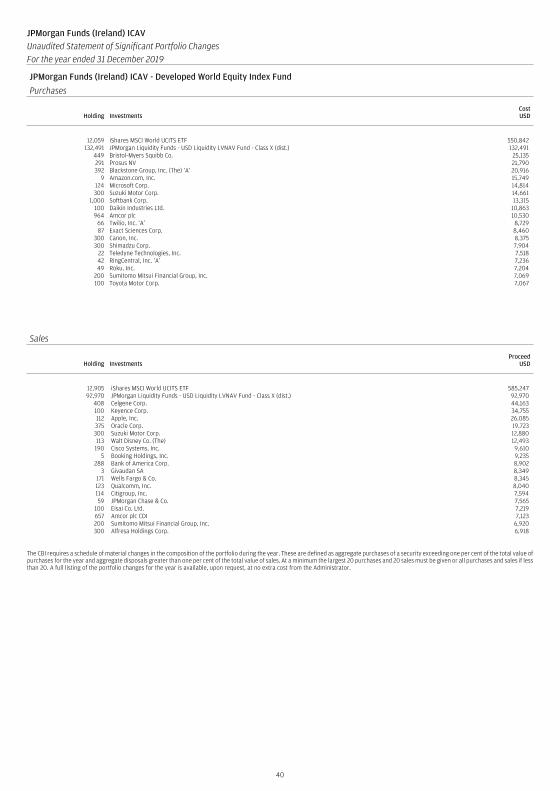
JPMorgan Funds (Ireland) ICAV - Developed World Equity Index Fund
Purchases
Holding InvestmentsCostUSD
12,059 iShares MSCI World UCITS ETF 550,842132,491 JPMorgan Liquidity Funds - USD Liquidity LVNAV Fund - Class X (dist.) 132,491
449 Bristol-Myers Squibb Co. 25,135291 Prosus NV 21,790392 Blackstone Group, Inc. (The) ‘A’ 20,916
9 Amazon.com, Inc. 15,749124 Microsoft Corp. 14,814300 Suzuki Motor Corp. 14,661
1,000 Softbank Corp. 13,315100 Daikin Industries Ltd. 10,863964 Amcor plc 10,530
66 Twilio, Inc. ‘A’ 8,72987 Exact Sciences Corp. 8,460
300 Canon, Inc. 8,375300 Shimadzu Corp. 7,904
22 Teledyne Technologies, Inc. 7,51842 RingCentral, Inc. ‘A’ 7,23649 Roku, Inc. 7,204
200 Sumitomo Mitsui Financial Group, Inc. 7,069100 Toyota Motor Corp. 7,067
Sales
Holding InvestmentsProceed
USD
12,905 iShares MSCI World UCITS ETF 585,24792,970 JPMorgan Liquidity Funds - USD Liquidity LVNAV Fund - Class X (dist.) 92,970
408 Celgene Corp. 44,163100 Keyence Corp. 34,755112 Apple, Inc. 26,085375 Oracle Corp. 19,723300 Suzuki Motor Corp. 12,880113 Walt Disney Co. (The) 12,493190 Cisco Systems, Inc. 9,610
5 Booking Holdings, Inc. 9,235288 Bank of America Corp. 8,902
3 Givaudan SA 8,349171 Wells Fargo & Co. 8,345123 Qualcomm, Inc. 8,040114 Citigroup, Inc. 7,59459 JPMorgan Chase & Co. 7,565
100 Eisai Co. Ltd. 7,219657 Amcor plc CDI 7,123200 Sumitomo Mitsui Financial Group, Inc. 6,920300 Alfresa Holdings Corp. 6,918
The CBI requires a schedule of material changes in the composition of the portfolio during the year. These are defined as aggregate purchases of a security exceeding one per cent of the total value ofpurchases for the year and aggregate disposals greater than one per cent of the total value of sales. At a minimum the largest 20 purchases and 20 sales must be given or all purchases and sales if lessthan 20. A full listing of the portfolio changes for the year is available, upon request, at no extra cost from the Administrator.
40
JPMorgan Funds (Ireland) ICAVUnaudited Statement of Significant Portfolio ChangesFor the year ended 31 December 2019
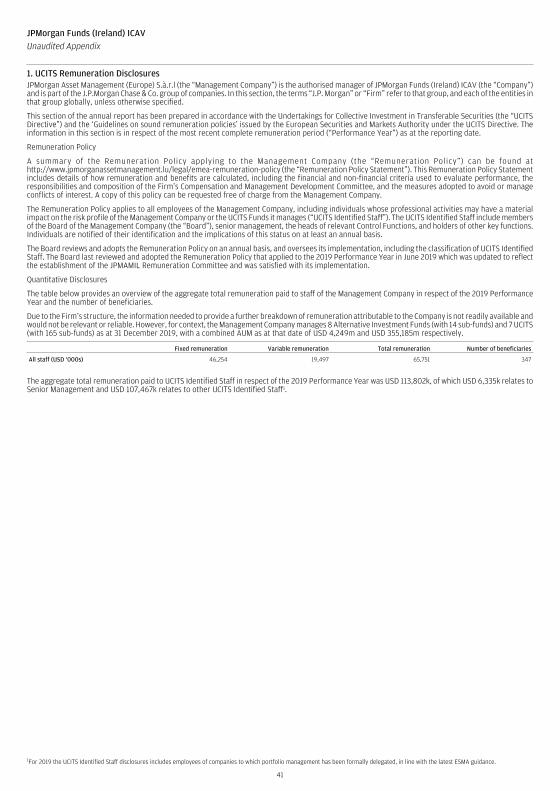
JPMorgan Asset Management (Europe) S.à.r.l (the “Management Company”) is the authorised manager of JPMorgan Funds (Ireland) ICAV (the “Company”)and is part of the J.P.Morgan Chase & Co. group of companies. In this section, the terms “J.P. Morgan” or “Firm” refer to that group, and each of the entities inthat group globally, unless otherwise specified.
This section of the annual report has been prepared in accordance with the Undertakings for Collective Investment in Transferable Securities (the “UCITSDirective”) and the ‘Guidelines on sound remuneration policies’ issued by the European Securities and Markets Authority under the UCITS Directive. Theinformation in this section is in respect of the most recent complete remuneration period (“Performance Year”) as at the reporting date.
Remuneration Policy
A summary of the Remuneration Policy applying to the Management Company (the “Remuneration Policy”) can be found athttp://www.jpmorganassetmanagement.lu/legal/emea-remuneration-policy (the “Remuneration Policy Statement”). This Remuneration Policy Statementincludes details of how remuneration and benefits are calculated, including the financial and non-financial criteria used to evaluate performance, theresponsibilities and composition of the Firm’s Compensation and Management Development Committee, and the measures adopted to avoid or manageconflicts of interest. A copy of this policy can be requested free of charge from the Management Company.
The Remuneration Policy applies to all employees of the Management Company, including individuals whose professional activities may have a materialimpact on the risk profile of the Management Company or the UCITS Funds it manages (“UCITS Identified Staff”). The UCITS Identified Staff include membersof the Board of the Management Company (the “Board”), senior management, the heads of relevant Control Functions, and holders of other key functions.Individuals are notified of their identification and the implications of this status on at least an annual basis.
The Board reviews and adopts the Remuneration Policy on an annual basis, and oversees its implementation, including the classification of UCITS IdentifiedStaff. The Board last reviewed and adopted the Remuneration Policy that applied to the 2019 Performance Year in June 2019 which was updated to reflectthe establishment of the JPMAMIL Remuneration Committee and was satisfied with its implementation.
Quantitative Disclosures
The table below provides an overview of the aggregate total remuneration paid to staff of the Management Company in respect of the 2019 PerformanceYear and the number of beneficiaries.
Due to the Firm’s structure, the information needed to provide a further breakdown of remuneration attributable to the Company is not readily available andwould not be relevant or reliable. However, for context, the Management Company manages 8 Alternative Investment Funds (with 14 sub-funds) and 7 UCITS(with 165 sub-funds) as at 31 December 2019, with a combined AUM as at that date of USD 4,249m and USD 355,185m respectively.
Fixed remuneration Variable remuneration Total remuneration Number of beneficiaries
All staff (USD ‘000s) 46,254 19,497 65,751 347
The aggregate total remuneration paid to UCITS Identified Staff in respect of the 2019 Performance Year was USD 113,802k, of which USD 6,335k relates toSenior Management and USD 107,467k relates to other UCITS Identified Staff1.
1For 2019 the UCITS Identified Staff disclosures includes employees of companies to which portfolio management has been formally delegated, in line with the latest ESMA guidance.
41
JPMorgan Funds (Ireland) ICAVUnaudited Appendix
1. UCITS Remuneration Disclosures
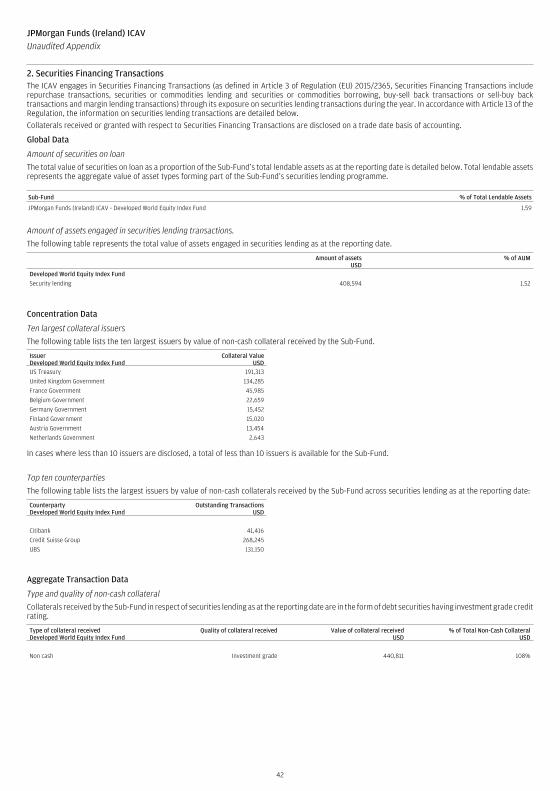
The ICAV engages in Securities Financing Transactions (as defined in Article 3 of Regulation (EU) 2015/2365, Securities Financing Transactions includerepurchase transactions, securities or commodities lending and securities or commodities borrowing, buy-sell back transactions or sell-buy backtransactions and margin lending transactions) through its exposure on securities lending transactions during the year. In accordance with Article 13 of theRegulation, the information on securities lending transactions are detailed below.
Collaterals received or granted with respect to Securities Financing Transactions are disclosed on a trade date basis of accounting.
Global Data
Amount of securities on loan
The total value of securities on loan as a proportion of the Sub-Fund’s total lendable assets as at the reporting date is detailed below. Total lendable assetsrepresents the aggregate value of asset types forming part of the Sub-Fund’s securities lending programme.
Sub-Fund % of Total Lendable Assets
JPMorgan Funds (Ireland) ICAV - Developed World Equity Index Fund 1.59
Amount of assets engaged in securities lending transactions.
The following table represents the total value of assets engaged in securities lending as at the reporting date.
Amount of assetsUSD
% of AUM
Developed World Equity Index Fund
Security lending 408,594 1.52
Concentration Data
Ten largest collateral issuers
The following table lists the ten largest issuers by value of non-cash collateral received by the Sub-Fund.
IssuerDeveloped World Equity Index Fund
Collateral ValueUSD
US Treasury 191,313
United Kingdom Government 134,285
France Government 45,985
Belgium Government 22,659
Germany Government 15,452
Finland Government 15,020
Austria Government 13,454
Netherlands Government 2,643
In cases where less than 10 issuers are disclosed, a total of less than 10 issuers is available for the Sub-Fund.
Top ten counterparties
The following table lists the largest issuers by value of non-cash collaterals received by the Sub-Fund across securities lending as at the reporting date:
CounterpartyDeveloped World Equity Index Fund
Outstanding TransactionsUSD
Citibank 41,416
Credit Suisse Group 268,245
UBS 131,150
Aggregate Transaction Data
Type and quality of non-cash collateral
Collaterals received by the Sub-Fund in respect of securities lending as at the reporting date are in the form of debt securities having investment grade creditrating.
Type of collateral receivedDeveloped World Equity Index Fund
Quality of collateral received Value of collateral receivedUSD
% of Total Non-Cash CollateralUSD
Non cash Investment grade 440,811 108%
42
JPMorgan Funds (Ireland) ICAVUnaudited Appendix
2. Securities Financing Transactions
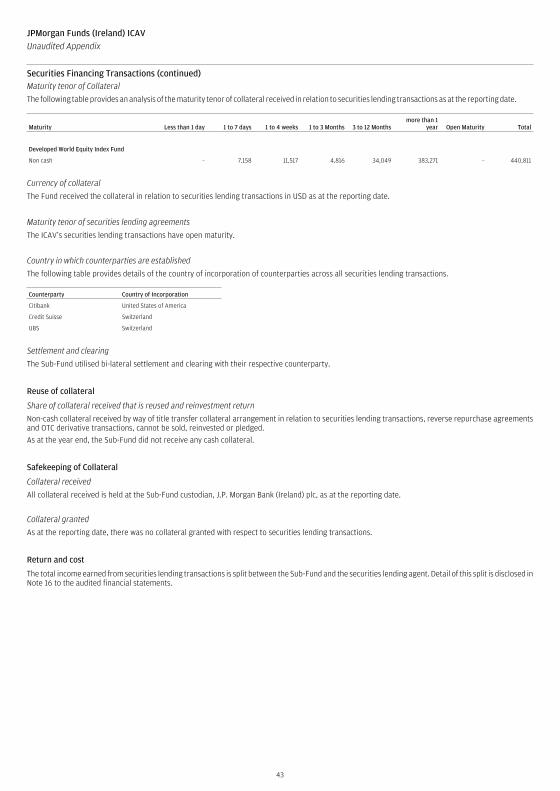
Maturity tenor of Collateral
The following table provides an analysis of the maturity tenor of collateral received in relation to securities lending transactions as at the reporting date.
Maturity Less than 1 day 1 to 7 days 1 to 4 weeks 1 to 3 Months 3 to 12 Monthsmore than 1
year Open Maturity Total
Developed World Equity Index Fund
Non cash – 7,158 11,517 4,816 34,049 383,271 – 440,811
Currency of collateral
The Fund received the collateral in relation to securities lending transactions in USD as at the reporting date.
Maturity tenor of securities lending agreements
The ICAV’s securities lending transactions have open maturity.
Country in which counterparties are established
The following table provides details of the country of incorporation of counterparties across all securities lending transactions.
Counterparty Country of Incorporation
Citibank United States of America
Credit Suisse Switzerland
UBS Switzerland
Settlement and clearing
The Sub-Fund utilised bi-lateral settlement and clearing with their respective counterparty.
Reuse of collateral
Share of collateral received that is reused and reinvestment return
Non-cash collateral received by way of title transfer collateral arrangement in relation to securities lending transactions, reverse repurchase agreementsand OTC derivative transactions, cannot be sold, reinvested or pledged.
As at the year end, the Sub-Fund did not receive any cash collateral.
Safekeeping of Collateral
Collateral received
All collateral received is held at the Sub-Fund custodian, J.P. Morgan Bank (Ireland) plc, as at the reporting date.
Collateral granted
As at the reporting date, there was no collateral granted with respect to securities lending transactions.
Return and cost
The total income earned from securities lending transactions is split between the Sub-Fund and the securities lending agent. Detail of this split is disclosed inNote 16 to the audited financial statements.
43
JPMorgan Funds (Ireland) ICAVUnaudited Appendix
Securities Financing Transactions (continued)
The ICAV may, on behalf of the Sub-Fund and subject to the conditions and within the limits laid down by the CBI, employ techniques and instruments relatingto transferable securities, including investments in FDI provided that such techniques and instruments are used for efficient portfolio management purposesor to provide protection against exchange risk or for direct investment purposes, where applicable. Such techniques and instruments are set out in theprospectus and may include futures (which may be used to manage cash flows on a short term basis by holding the future to gain exposure to an asset classpending direct investment) and forward currency contracts, (which may be used to manage currency risk).
Efficient portfolio management means investment techniques involving transactions that are entered into for one or more of the following specific aims: thereduction of risk, the reduction of cost, or the generation of additional capital or income for the Sub-Fund. New techniques and instruments may bedeveloped which may be suitable for use by the ICAV and the ICAV may, (subject to the conditions and limits laid down by the CBI) employ such techniquesand instruments subject to the investment objectives and policies being updated and shareholders being notified in advance. Where the ICAV intends to usethese instruments for direct investment purposes, full details are set out in the prospectus in the ICAV’s investment policy.
The forward currency contracts entered into are utilised to reduce foreign exchange risk and all other FDI’s are used for investment purposes. FDI’s whichthe Sub-Fund holds are disclosed in the Schedule of Investments of the Sub-Fund. Realised and unrealised gains and losses arising from these open FDI’s areincluded in the Statement of Comprehensive Income. Transaction costs on the purchase and sale of forward exchange contracts are included in the purchaseand sale price of the investment. These costs cannot be practically or reliably gathered as they are embedded in the cost of the investment and cannot beseparately verified or disclosed.
In addition to the investments in FDIs noted above, the Sub-Fund may employ other techniques and instruments relating to transferable securities andmoney market instruments subject to the UCITS Regulations and to conditions imposed by the CBI such as securities lending. The ICAV did not enter into anyrepurchase agreements or reverse repurchase agreements during the year.
44
JPMorgan Funds (Ireland) ICAVUnaudited Appendix
3. Efficient Portfolio Management

Language Disclaimer Annual

JPMorgan Asset Management (Europe) S.à r.l.Postal Address: 6, route de Trèves, L-2633 Senningerberg, Grand Duchy of LuxembourgTel No: (352) 34 101 Fax No: (352) 3410 8000E-mail: [email protected]
Internet: www.jpmorganassetmanagement.com
H102 04/20
For further information concerning JPMorgan Funds (Ireland) ICAV, please contact the Global Distributor:
GB