audited financial statements - scotiabank jamaica · report on the financial statements we have...
TRANSCRIPT
59Scotia Group Jamaica Limited 2013 Annual Report
Audited Financial StatementsScotia Group Jamaica Limited
Scotia Group Jamaica Limited 2013 Annual Report 60 Scotia Group Jamaica Limited 2013 Annual Report 60 Scotia Group Jamaica Limited 2013 Annual ReportScotia Group Jamaica Limited 2013 Annual Report60 Scotia Group Jamaica Limited 2013 Annual Report 60 Scotia Group Jamaica Limited 2013 Annual Report 60
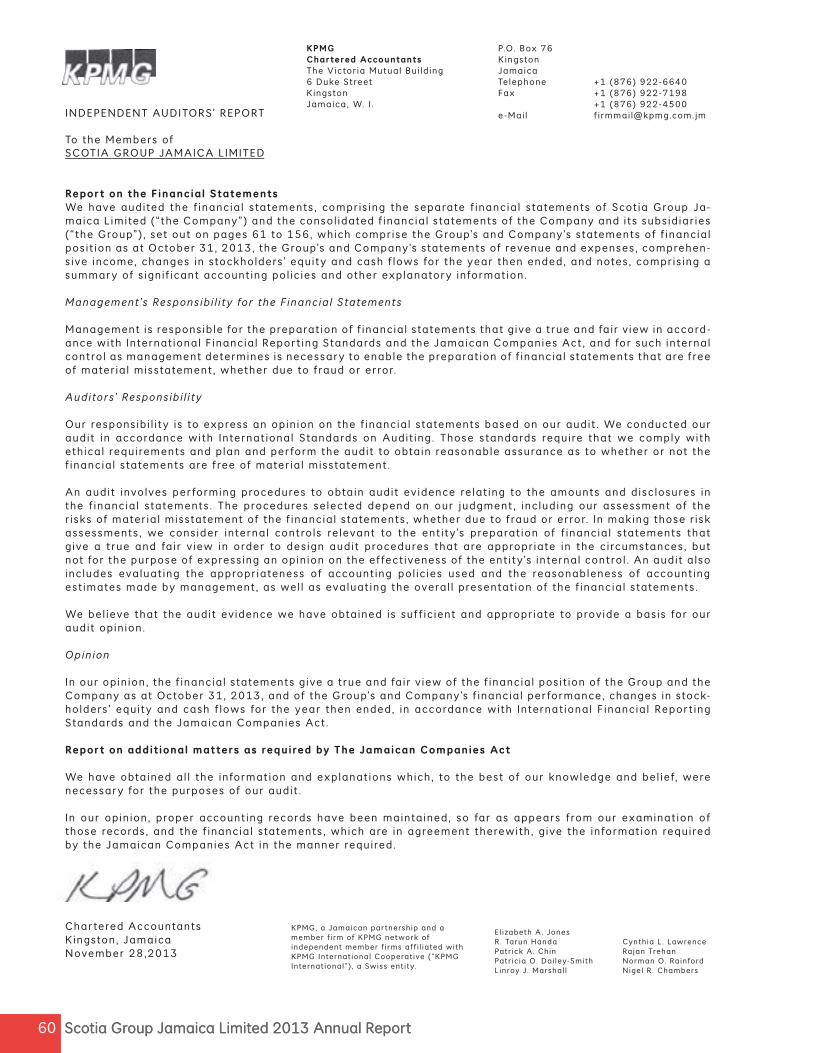
INDEPENDENT AUDITORS’ REPORT
To the Members ofSCOTIA GROUP JAMAICA LIMITED
Report on the Financial StatementsWe have audited the f inancia l statements , compris ing the separate f inancia l statements of Scot ia Group Ja-maica L imited (“the Company”) and the consol idated f inancial statements of the Company and i ts subsid iar ies (“the Group”) , set out on pages 61 to 156, which comprise the Group’s and Company’s statements of f inancia l posit ion as at October 31, 2013, the Group’s and Company’s statements of revenue and expenses, comprehen-s ive income, changes in stockholders ’ equity and cash f lows for the year then ended, and notes , compris ing a summary of s ignif icant account ing pol ic ies and other explanatory information.
Management ’s Responsib i l i ty for the F inancia l Statements
Management is responsib le for the preparat ion of f inancial statements that g ive a true and fair v iew in accord-ance with Internat ional F inancial Repor t ing Standards and the Jamaican Companies Act , and for such internal control as management determines is necessary to enable the preparat ion of f inancia l statements that are free of mater ia l misstatement , whether due to fraud or error.
Auditors ’ Responsib i l i ty
Our responsib i l i ty is to express an opin ion on the f inancia l statements based on our audit . We conducted our audit in accordance with Internat ional Standards on Audit ing. Those standards require that we comply with ethical requirements and plan and per form the audit to obtain reasonable assurance as to whether or not the f inancia l statements are free of mater ia l misstatement .
An audit involves per forming procedures to obtain audit ev idence re lat ing to the amounts and disc losures in the f inancia l statements . The procedures selected depend on our judgment , inc luding our assessment of the r isks of mater ia l misstatement of the f inancia l statements , whether due to fraud or error. In making those r isk assessments , we consider internal controls re levant to the ent i ty ’s preparat ion of f inancia l statements that g ive a true and fa ir v iew in order to design audit procedures that are appropr iate in the c i rcumstances, but not for the purpose of express ing an opin ion on the ef fect iveness of the ent i ty ’s internal control . An audit a lso includes evaluat ing the appropr iateness of account ing pol ic ies used and the reasonableness of account ing est imates made by management , as wel l as evaluat ing the overal l presentat ion of the f inancia l statements .
We bel ieve that the audit ev idence we have obtained is suf f ic ient and appropr iate to provide a basis for our audit opin ion.
Opinion
In our opin ion, the f inancia l statements g ive a true and fa ir v iew of the f inancia l posit ion of the Group and the Company as at October 31, 2013, and of the Group’s and Company’s f inancia l per formance, changes in stock-holders ’ equity and cash f lows for the year then ended, in accordance with Internat ional F inancial Repor t ing Standards and the Jamaican Companies Act .
Report on addit ional matters as required by The Jamaican Companies Act
We have obtained al l the information and explanat ions which, to the best of our knowledge and bel ief, were necessary for the purposes of our audit .
In our opin ion, proper account ing records have been maintained, so far as appears from our examinat ion of those records , and the f inancia l statements , which are in agreement therewith , g ive the information required by the Jamaican Companies Act in the manner required.
Char tered AccountantsKingston, JamaicaNovember 28,2013
KPMG, a Jamaican par tnership and a member f i rm of KPMG network of independent member f i rms af f i l iated with KPMG Internat ional C ooperat ive (“KPMG Internat ional”) , a Swiss ent i ty.
E l izabeth A. JonesR. Tarun HandaPatr ick A. ChinPatr ic ia O. Dai ley-SmithLinroy J. Marshal l
Cynthia L . LawrenceRajan TrehanNorman O. RainfordNigel R . Chambers
KPMG P.O. Box 76 Chartered Accountants K ingstonThe Victor ia Mutual Bui ld ing Jamaica6 Duke Street Telephone +1 (876) 922-6640Kingston Fax +1 (876) 922-7198Jamaica, W. I . +1 (876) 922-4500 e -Mai l f i rmmai [email protected]. jm
61Scotia Group Jamaica Limited 2013 Annual Report
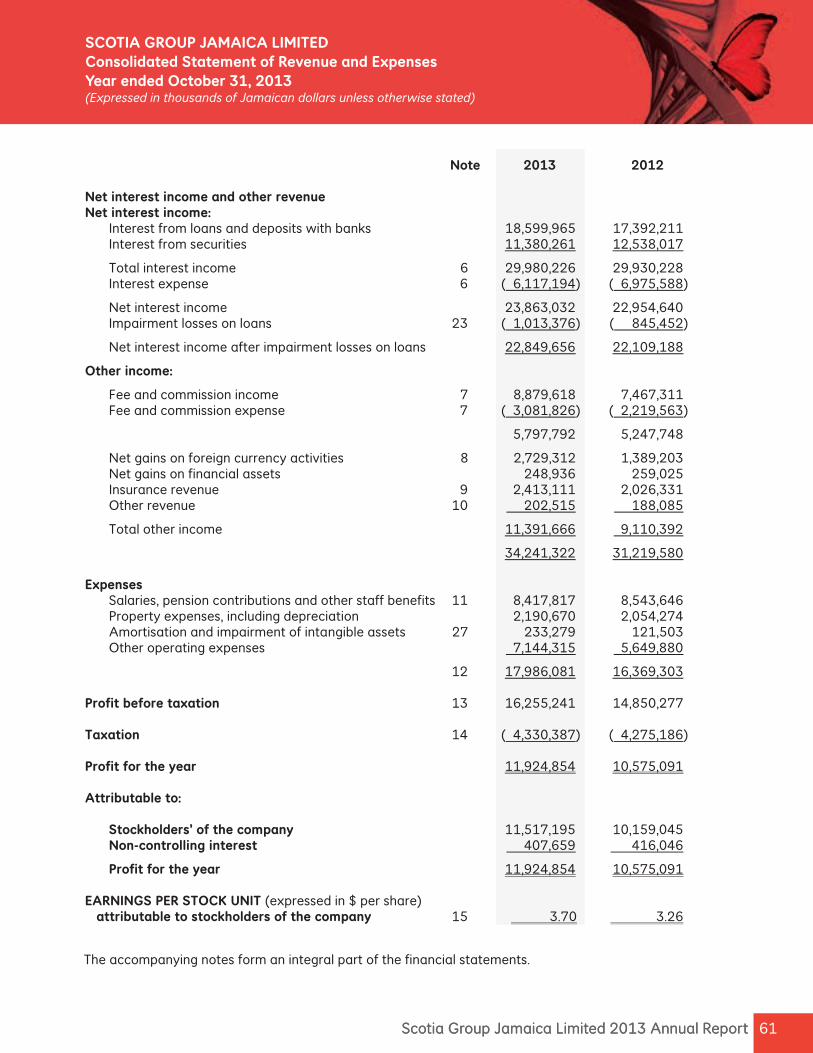
Note 2013 2012 Net interest income and other revenue Net interest income: Interest from loans and deposits with banks 18,599,965 17,392,211 Interest from securities 11,380,261 12,538,017
Total interest income 6 29,980,226 29,930,228 Interest expense 6 ( 6,117,194) ( 6,975,588)
Net interest income 23,863,032 22,954,640 Impairment losses on loans 23 ( 1,013,376) ( 845,452)
Net interest income after impairment losses on loans 22,849,656 22,109,188
Other income:
Fee and commission income 7 8,879,618 7,467,311 Fee and commission expense 7 ( 3,081,826) ( 2,219,563)
5,797,792 5,247,748
Net gains on foreign currency activities 8 2,729,312 1,389,203 Net gains on financial assets 248,936 259,025 Insurance revenue 9 2,413,111 2,026,331 Other revenue 10 202,515 188,085
Total other income 11,391,666 9,110,392
34,241,322 31,219,580 Expenses Salaries, pension contributions and other staff benefits 11 8,417,817 8,543,646 Property expenses, including depreciation 2,190,670 2,054,274 Amortisation and impairment of intangible assets 27 233,279 121,503 Other operating expenses 7,144,315 5,649,880
12 17,986,081 16,369,303 Profit before taxation 13 16,255,241 14,850,277 Taxation 14 ( 4,330,387) ( 4,275,186) Profit for the year 11,924,854 10,575,091 Attributable to: Stockholders’ of the company 11,517,195 10,159,045 Non-controlling interest 407,659 416,046
Profit for the year 11,924,854 10,575,091 EARNINGS PER STOCK UNIT (expressed in $ per share) attributable to stockholders of the company 15 3.70 3.26
61Scotia Group Jamaica Limited 2013 Annual Report
SCOTIA GROUP JAMAICA LIMITED Consolidated Statement of Revenue and ExpensesYear ended October 31, 2013(Expressed in thousands of Jamaican dollars unless otherwise stated)
The accompanying notes form an integral part of the financial statements.
Scotia Group Jamaica Limited 2013 Annual Report 62 Scotia Group Jamaica Limited 2013 Annual Report 62
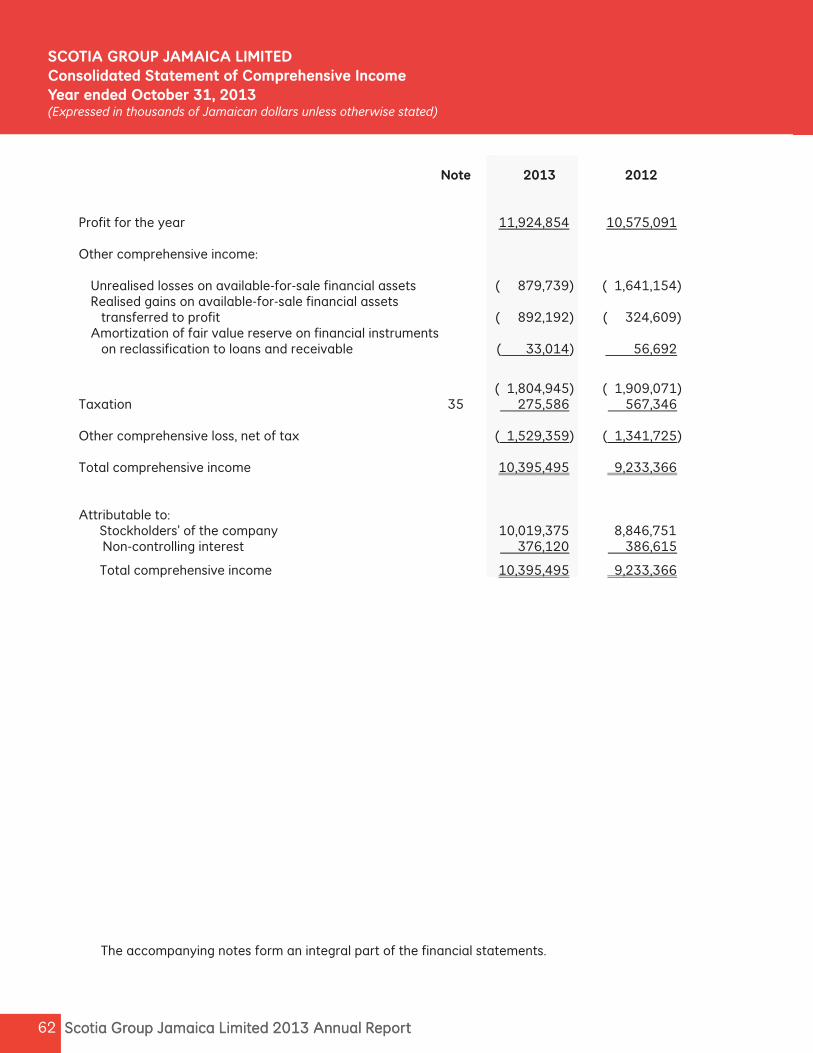
SCOTIA GROUP JAMAICA LIMITED Consolidated Statement of Comprehensive IncomeYear ended October 31, 2013(Expressed in thousands of Jamai an dollars unless otherwise stated)
Note 2013 2012 Profit for the year 11,924,854 10,575,091 Other comprehensive income: Unrealised losses on available-for-sale financial assets ( 879,739) ( 1,641,154) Realised gains on available-for-sale financial assets transferred to profit ( 892,192) ( 324,609) Amortization of fair value reserve on financial instruments on reclassification to loans and receivable ( 33,014) 56,692
( 1,804,945) ( 1,909,071) Taxation 35 275,586 567,346 Other comprehensive loss, net of tax ( 1,529,359) ( 1,341,725) Total comprehensive income 10,395,495 9,233,366 Attributable to: Stockholders’ of the company 10,019,375 8,846,751 Non-controlling interest 376,120 386,615
Total comprehensive income 10,395,495 9,233,366
The accompanying notes form an integral part of the financial statements.
63Scotia Group Jamaica Limited 2013 Annual Report
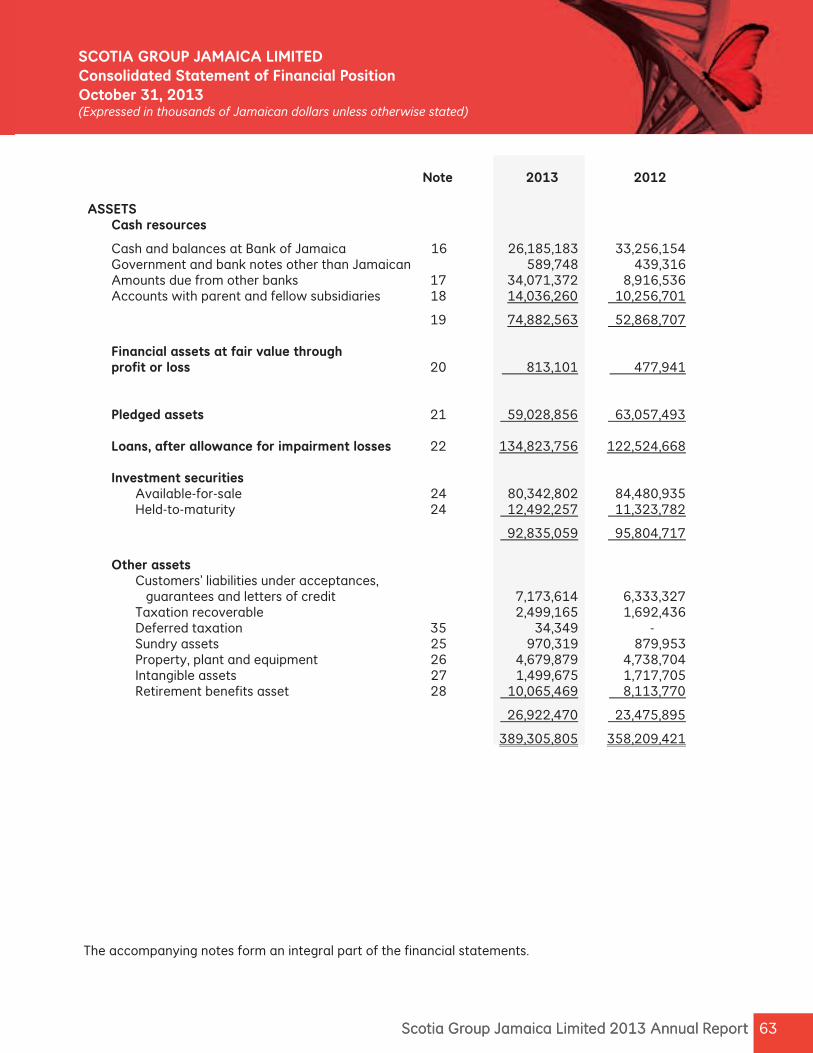
Note 2013 2012 ASSETS Cash resources
Cash and balances at Bank of Jamaica 16 26,185,183 33,256,154 Government and bank notes other than Jamaican 589,748 439,316 Amounts due from other banks 17 34,071,372 8,916,536 Accounts with parent and fellow subsidiaries 18 14,036,260 10,256,701
19 74,882,563 52,868,707
Financial assets at fair value through profit or loss 20 813,101 477,941 Pledged assets 21 59,028,856 63,057,493 Loans, after allowance for impairment losses 22 134,823,756 122,524,668 Investment securities Available-for-sale 24 80,342,802 84,480,935 Held-to-maturity 24 12,492,257 11,323,782
92,835,059 95,804,717 Other assets Customers’ liabilities under acceptances, guarantees and letters of credit 7,173,614 6,333,327 Taxation recoverable 2,499,165 1,692,436 Deferred taxation 35 34,349 - Sundry assets 25 970,319 879,953 Property, plant and equipment 26 4,679,879 4,738,704 Intangible assets 27 1,499,675 1,717,705 Retirement benefits asset 28 10,065,469 8,113,770
26,922,470 23,475,895
389,305,805 358,209,421
63Scotia Group Jamaica Limited 2013 Annual Report
SCOTIA GROUP JAMAICA LIMITED Consolidated Statement of Financial PositionOctober 31, 2013(Expressed in thousands of Jamai an dollars unless otherwise stated)
The accompanying notes form an integral part of the financial statements.
Scotia Group Jamaica Limited 2013 Annual Report 64
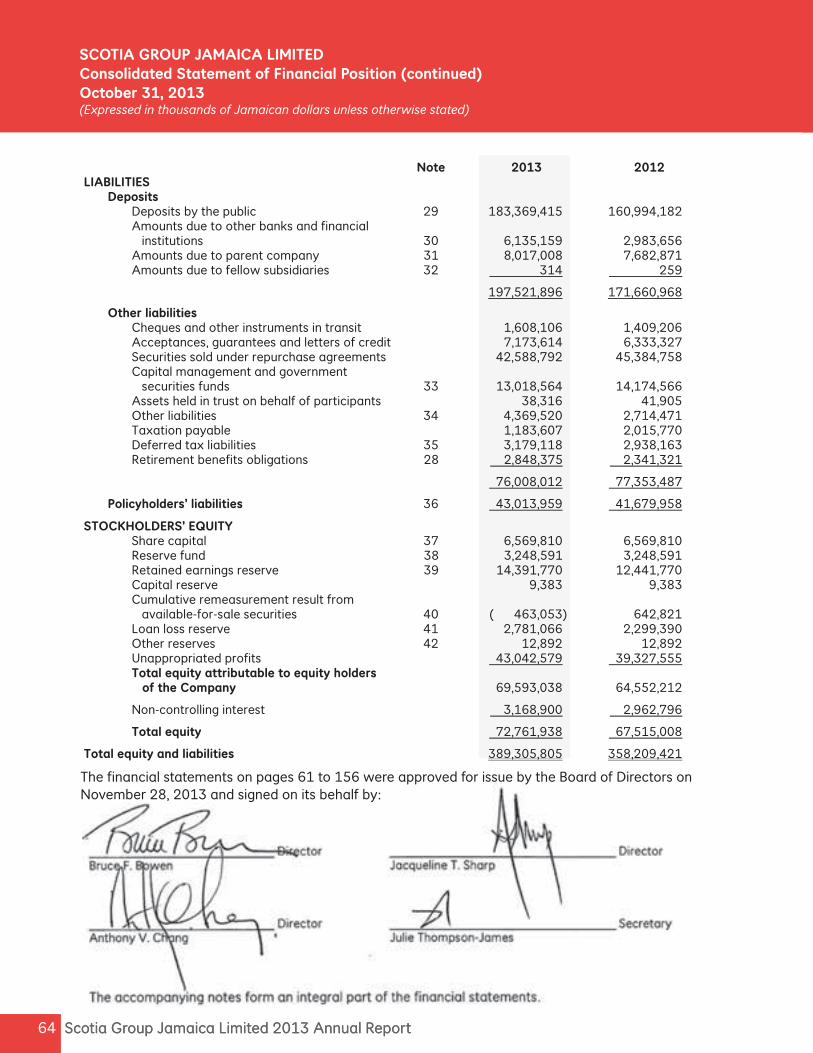
Note 2013 2012 LIABILITIES
Deposits Deposits by the public 29 183,369,415 160,994,182 Amounts due to other banks and financial institutions 30 6,135,159 2,983,656 Amounts due to parent company 31 8,017,008 7,682,871 Amounts due to fellow subsidiaries 32 314 259
197,521,896 171,660,968
Other liabilities Cheques and other instruments in transit 1,608,106 1,409,206 Acceptances, guarantees and letters of credit 7,173,614 6,333,327 Securities sold under repurchase agreements 42,588,792 45,384,758 Capital management and government securities funds 33 13,018,564 14,174,566 Assets held in trust on behalf of participants 38,316 41,905 Other liabilities 34 4,369,520 2,714,471 Taxation payable 1,183,607 2,015,770 Deferred tax liabilities 35 3,179,118 2,938,163 Retirement benefits obligations 28 2,848,375 2,341,321
76,008,012 77,353,487
Policyholders’ liabilities 36 43,013,959 41,679,958
STOCKHOLDERS’ EQUITY Share capital 37 6,569,810 6,569,810 Reserve fund 38 3,248,591 3,248,591 Retained earnings reserve 39 14,391,770 12,441,770 Capital reserve 9,383 9,383 Cumulative remeasurement result from available-for-sale securities 40 ( 463,053) 642,821 Loan loss reserve 41 2,781,066 2,299,390 Other reserves 42 12,892 12,892 Unappropriated profits 43,042,579 39,327,555 Total equity attributable to equity holders of the Company 69,593,038 64,552,212
Non-controlling interest 3,168,900 2,962,796
Total equity 72,761,938 67,515,008
Total equity and liabilities 389,305,805 358,209,421
Scotia Group Jamaica Limited 2013 Annual Report 64
SCOTIA GROUP JAMAICA LIMITED Consolidated Statement of Financial Position (continued)October 31, 2013(Expressed in thousands of Jamai an dollars unless otherwise stated)
The nancial statements on pages 61 to 156 were approved for issue by the Board of Directors on November 28, 2013 and signed on its behalf by:
65Scotia Group Jamaica Limited 2013 Annual Report 65Scotia Group Jamaica Limited 2013 Annual Report
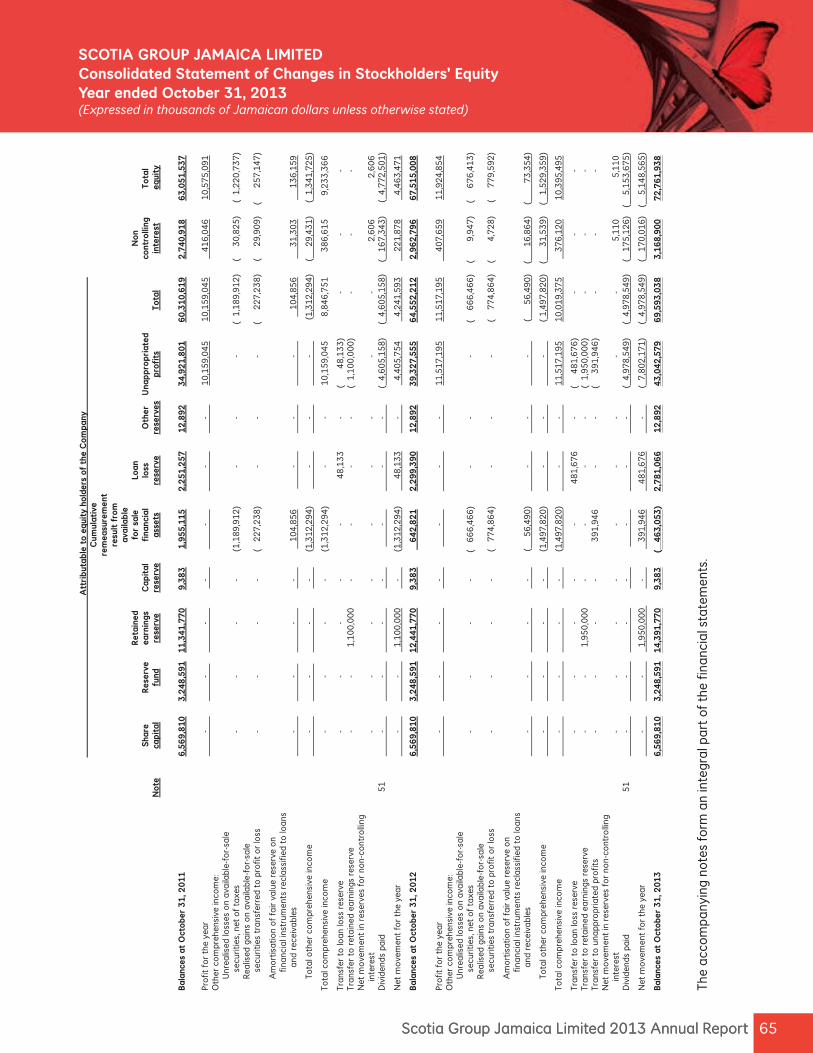
SCOTIA GROUP JAMAICA LIMITED Consolidated Statement of Changes in Stockholders’ EquityYear ended October 31, 2013(Expressed in thousands of Jamai an dollars unless otherwise stated)
The
acco
mpa
nyin
g no
tes
form
an
inte
gral
par
t of
the
fin
anci
al s
tate
men
ts.
Att
rib
utab
le t
o eq
uity
hol
ders
of
the
Com
pan
y
C
umul
ativ
e
rem
easu
rem
ent
re
sult
fro
m
av
aila
ble
Ret
aine
d
for
sale
Lo
an
N
on
Sh
are
Res
erve
ea
rnin
gs
Cap
ital
fi
nanc
ial
loss
O
ther
U
nap
pro
pri
ated
cont
rolli
ng
Tota
l
N
ote
cap
ital
fu
nd
rese
rve
rese
rve
asse
ts
rese
rve
rese
rves
p
rofi
ts
Tota
l in
tere
st
equi
ty
Bal
ance
s at
Oct
ober
31
, 20
11
6,5
69
,81
0
3,2
48
,59
1
11
,34
1,7
70
9
,38
3
1,9
55
,11
5
2,2
51
,25
7
12
,89
2
34
,92
1,8
01
6
0,3
10
,61
9
2,7
40
,91
8
63
,05
1,5
37
Pro
fit f
or
the
year
-
-
-
-
-
-
-
10
,15
9,0
45
1
0,1
59
,04
5
4
16
,04
6
10
,57
5,0
91
O
ther
co
mpr
ehen
sive
inco
me:
Unr
ealis
ed lo
sses
on
avai
labl
e-fo
r-sa
le
secu
ritie
s, n
et o
f ta
xes
-
-
-
-
(1
,18
9,9
12
) -
-
-
( 1
,18
9,9
12
) (
3
0,8
25
) (
1,2
20
,73
7)
R
ealis
ed g
ains
on
avai
labl
e-fo
r-sa
le
secu
ritie
s tr
ansf
erre
d to
pro
fit o
r lo
ss
-
-
-
-
(
22
7,2
38
) -
-
-
(
22
7,2
38
) (
2
9,9
09
) (
2
57
,14
7)
A
mo
rtis
atio
n o
f fa
ir va
lue
rese
rve
on
finan
cial
inst
rum
ents
rec
lass
ified
to
loan
s
a
nd r
ecei
vabl
es
-
-
-
-
1
04
,85
6
-
-
-
1
04
,85
6
3
1,3
03
13
6,1
59
To
tal o
ther
co
mpr
ehen
sive
inco
me
-
-
-
-
(1,3
12
,29
4)
-
-
-
(1,3
12
,29
4)
(
29
,43
1)
( 1
,34
1,7
25
)
Tota
l co
mpr
ehen
sive
inco
me
-
-
-
-
(1
,31
2,2
94
) -
-
1
0,1
59
,04
5
8,8
46
,75
1
38
6,6
15
9
,23
3,3
66
Tran
sfer
to
loan
loss
res
erve
-
-
-
-
-
4
8,1
33
-
(
4
8,1
33
) -
-
-
Tran
sfer
to
ret
aine
d ea
rnin
gs r
eser
ve
-
-
1
,10
0,0
00
-
-
-
-
(
1,1
00
,00
0)
-
-
-
N
et m
ove
men
t in
res
erve
s fo
r no
n-co
ntro
lling
inte
rest
-
-
-
-
-
-
-
-
-
2,6
06
2
,60
6
Div
iden
ds p
aid
5
1
-
-
-
-
-
-
-
(
4,6
05
,15
8)
( 4
,60
5,1
58
) (
16
7,3
43
) (
4,7
72
,50
1)
Net
mo
vem
ent
for
the
year
-
-
1,1
00
,00
0
-
(1,3
12
,29
4)
4
8,1
33
-
4,4
05
,75
4
4,2
41
,59
3
2
21
,87
8
4,4
63
,47
1
Bal
ance
s at
Oct
ober
31
, 20
12
6,5
69
,81
0
3,2
48
,59
1
12
,44
1,7
70
9
,38
3
6
42
,82
1
2,2
99
,39
0
12
,89
2
39
,32
7,5
55
6
4,5
52
,21
2
2,9
62
,79
6
67
,51
5,0
08
Pro
fit f
or
the
year
-
-
-
-
-
-
-
1
1,5
17
,19
5
11
,51
7,1
95
40
7,6
59
1
1,9
24
,85
4
Oth
er c
om
preh
ensi
ve in
com
e:
U
nrea
lised
loss
es o
n av
aila
ble-
for-
sale
se
curit
ies,
net
of
taxe
s
-
-
-
-
(
66
6,4
66
)
-
-
-
(
66
6,4
66
) (
9,9
47
) (
6
76
,41
3)
R
ealis
ed g
ains
on
avai
labl
e-fo
r-sa
le
secu
ritie
s tr
ansf
erre
d to
pro
fit o
r lo
ss
-
-
-
-
( 7
74
,86
4)
-
-
-
(
7
74
,86
4)
(
4
,72
8)
(
77
9,5
92
)
A
mo
rtis
atio
n o
f fa
ir va
lue
rese
rve
on
finan
cial
inst
rum
ents
rec
lass
ified
to
loan
s
a
nd r
ecei
vabl
es
-
-
-
-
(
56
,49
0)
-
-
-
(
5
6,4
90
) (
1
6,8
64
) (
73
,35
4)
To
tal o
ther
co
mpr
ehen
sive
inco
me
-
-
-
-
(1,4
97
,82
0)
-
-
-
(
1,4
97
,82
0)
(
31
,53
9)
( 1
,52
9,3
59
)
Tota
l co
mpr
ehen
sive
inco
me
-
-
-
-
(1,4
97
,82
0)
-
-
11
,51
7,1
95
1
0,0
19
,37
5
3
76
,12
0
10
,39
5,4
95
Tran
sfer
to
loan
loss
res
erve
-
-
-
-
-
4
81
,67
6
-
(
4
81
,67
6)
-
-
-
Tr
ansf
er t
o r
etai
ned
earn
ings
res
erve
-
-
1,9
50
,00
0
-
-
-
-
( 1
,95
0,0
00
) -
-
-
Tran
sfer
to
una
ppro
pria
ted
pro
fits
-
-
-
-
39
1,9
46
-
-
(
3
91
,94
6)
-
-
-
N
et m
ove
men
t in
res
erve
s fo
r no
n-co
ntro
lling
inte
rest
-
-
-
-
-
-
-
-
-
5,1
10
5
,11
0
Div
iden
ds p
aid
5
1
-
-
-
-
-
-
-
(
4,9
78
,54
9)
( 4
,97
8,5
49
) (
17
5,1
26
) (
5
,15
3,6
75
)
Net
mo
vem
ent
for
the
year
-
-
1,9
50
,00
0
-
3
91
,94
6
4
81
,67
6
-
(
7,8
02
,17
1)
( 4
,97
8,5
49
) (
17
0,0
16
) (
5
,14
8,5
65
)
Bal
ance
s at
Oct
ober
31
, 20
13
6,5
69
,81
0
3,2
48
,59
1
14
,39
1,7
70
9
,38
3
( 4
63
,05
3)
2,7
81
,06
6
12
,89
2
43
,04
2,5
79
6
9,5
93
,03
8
3,1
68
,90
0
72
,76
1,9
38
Scotia Group Jamaica Limited 2013 Annual Report 66
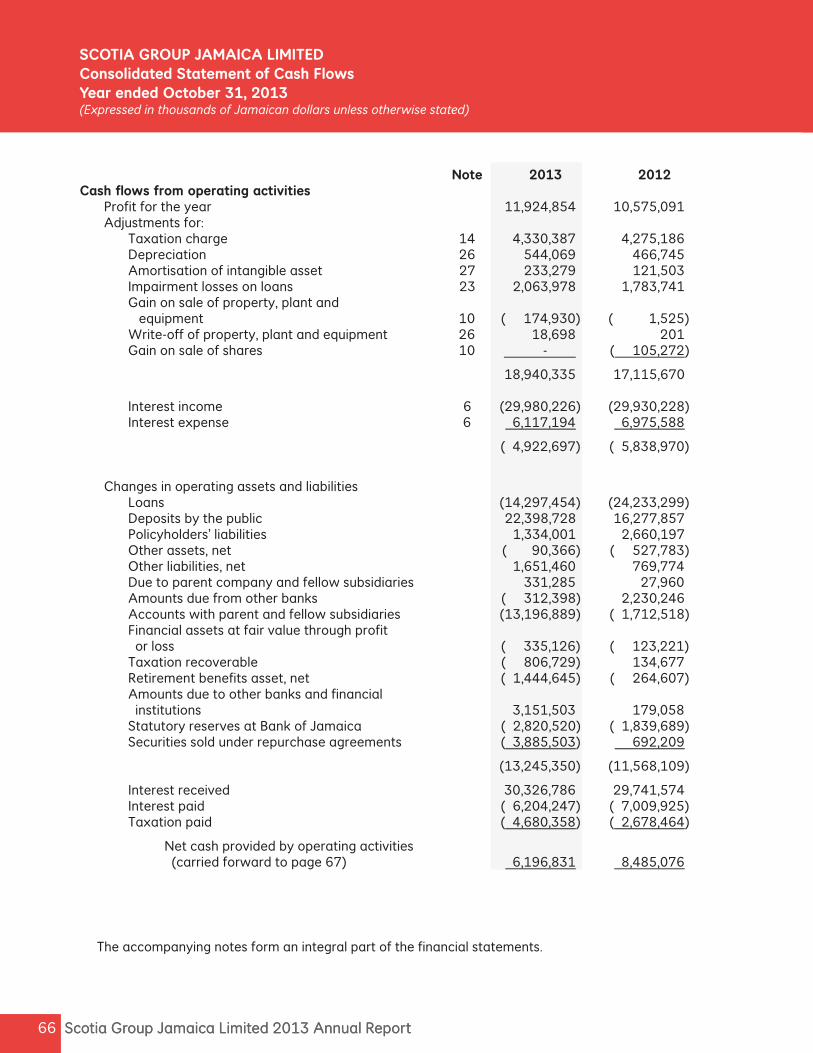
Note 2013 2012 Cash ows from operating activities Profit for the year 11,924,854 10,575,091 Adjustments for: Taxation charge 14 4,330,387 4,275,186 Depreciation 26 544,069 466,745 Amortisation of intangible asset 27 233,279 121,503 Impairment losses on loans 23 2,063,978 1,783,741 Gain on sale of property, plant and equipment 10 ( 174,930) ( 1,525) Write-off of property, plant and equipment 26 18,698 201 Gain on sale of shares 10 - ( 105,272)
18,940,335 17,115,670 Interest income 6 (29,980,226) (29,930,228) Interest expense 6 6,117,194 6,975,588
( 4,922,697) ( 5,838,970)
Changes in operating assets and liabilities Loans (14,297,454) (24,233,299) Deposits by the public 22,398,728 16,277,857 Policyholders’ liabilities 1,334,001 2,660,197 Other assets, net ( 90,366) ( 527,783) Other liabilities, net 1,651,460 769,774 Due to parent company and fellow subsidiaries 331,285 27,960 Amounts due from other banks ( 312,398) 2,230,246 Accounts with parent and fellow subsidiaries (13,196,889) ( 1,712,518) Financial assets at fair value through profit or loss ( 335,126) ( 123,221) Taxation recoverable ( 806,729) 134,677 Retirement benefits asset, net ( 1,444,645) ( 264,607) Amounts due to other banks and financial institutions 3,151,503 179,058 Statutory reserves at Bank of Jamaica ( 2,820,520) ( 1,839,689) Securities sold under repurchase agreements ( 3,885,503) 692,209
(13,245,350) (11,568,109)
Interest received 30,326,786 29,741,574 Interest paid ( 6,204,247) ( 7,009,925) Taxation paid ( 4,680,358) ( 2,678,464)
Net cash provided by operating activities (carried forward to page 67) 6,196,831 8,485,076
Scotia Group Jamaica Limited 2013 Annual Report 66
SCOTIA GROUP JAMAICA LIMITED Consolidated Statement of Cash FlowsYear ended October 31, 2013(Expressed in thousands of Jamai an dollars unless otherwise stated)
The accompanying notes form an integral part of the financial statements.
67Scotia Group Jamaica Limited 2013 Annual Report
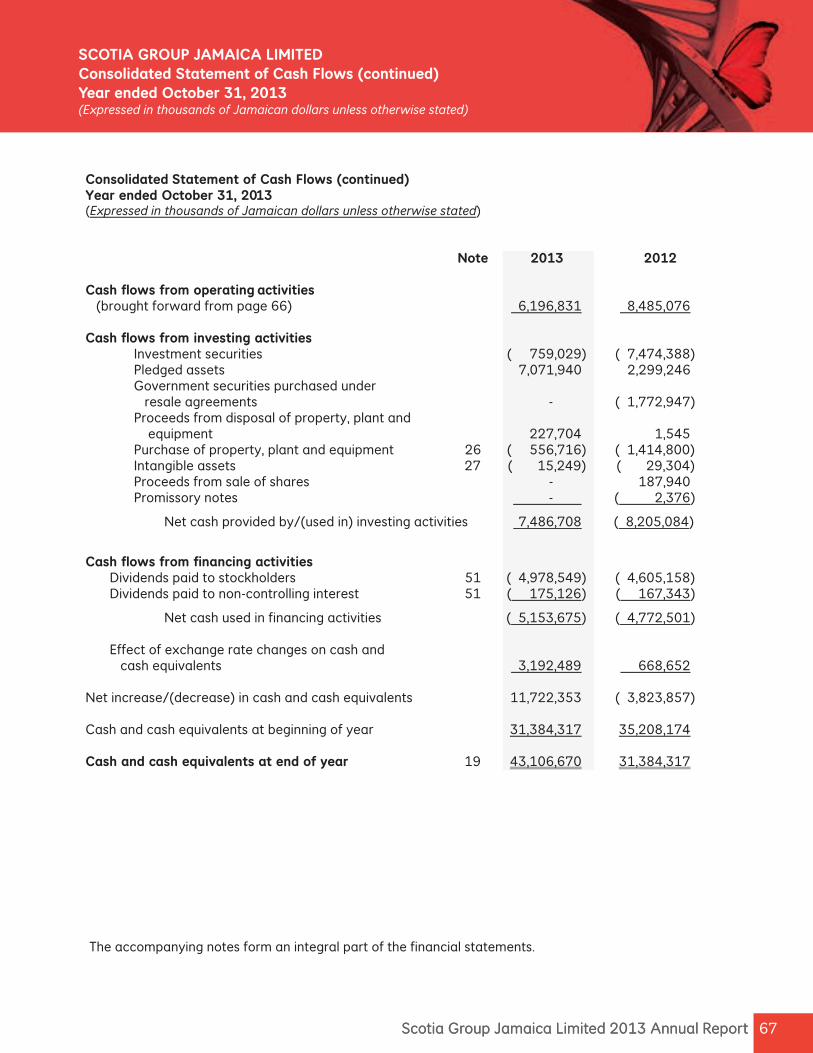
Consolidated Statement of Cash Flows (continued) Year ended October 31, 2013 (Expressed in thousands of Jamaican dollars unless otherwise stated) Note 2013 2012 Cash ows from operating activities (brought forward from page 66) 6,196,831 8,485,076 Cash ows from investing activities Investment securities ( 759,029) ( 7,474,388) Pledged assets 7,071,940 2,299,246 Government securities purchased under resale agreements - ( 1,772,947) Proceeds from disposal of property, plant and equipment 227,704 1,545 Purchase of property, plant and equipment 26 ( 556,716) ( 1,414,800) Intangible assets 27 ( 15,249) ( 29,304) Proceeds from sale of shares - 187,940 Promissory notes - ( 2,376)
Net cash provided by/(used in) investing activities 7,486,708 ( 8,205,084)
Cash ows from nancing activities Dividends paid to stockholders 51 ( 4,978,549) ( 4,605,158) Dividends paid to non-controlling interest 51 ( 175,126) ( 167,343)
Net cash used in financing activities ( 5,153,675) ( 4,772,501) Effect of exchange rate changes on cash and cash equivalents 3,192,489 668,652 Net increase/(decrease) in cash and cash equivalents 11,722,353 ( 3,823,857) Cash and cash equivalents at beginning of year 31,384,317 35,208,174 Cash and cash equivalents at end of year 19 43,106,670 31,384,317
67Scotia Group Jamaica Limited 2013 Annual Report
SCOTIA GROUP JAMAICA LIMITED Consolidated Statement of Cash Flows (continued)Year ended October 31, 2013(Expressed in thousands of Jamai an dollars unless otherwise stated)
The accompanying notes form an integral part of the financial statements.
Scotia Group Jamaica Limited 2013 Annual Report 68
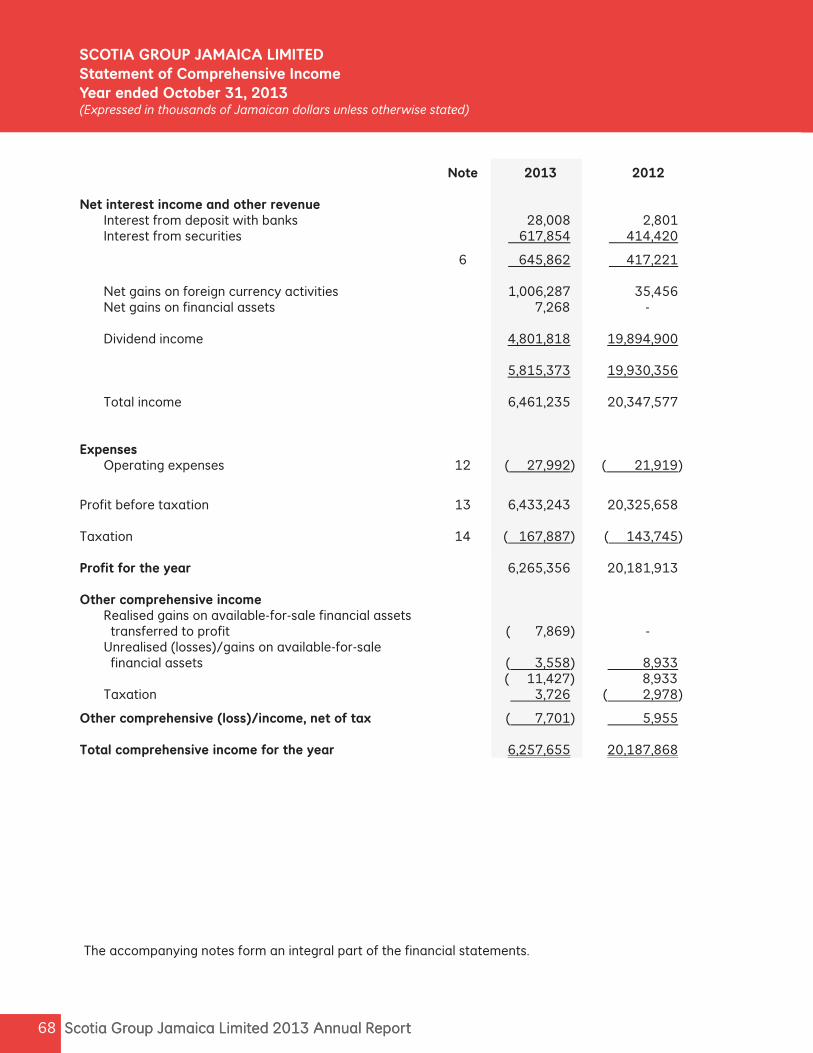
Note 2013 2012 Net interest income and other revenue Interest from deposit with banks 28,008 2,801 Interest from securities 617,854 414,420
6 645,862 417,221 Net gains on foreign currency activities 1,006,287 35,456 Net gains on financial assets 7,268 - Dividend income 4,801,818 19,894,900 5,815,373 19,930,356 Total income 6,461,235 20,347,577 Expenses Operating expenses 12 ( 27,992) ( 21,919)
Profit before taxation 13 6,433,243 20,325,658 Taxation 14 ( 167,887) ( 143,745) Profit for the year 6,265,356 20,181,913 Other comprehensive income
Realised gains on available-for-sale financial assets transferred to profit ( 7,869) - Unrealised (losses)/gains on available-for-sale financial assets ( 3,558) 8,933 ( 11,427) 8,933 Taxation 3,726 ( 2,978)
Other comprehensive (loss)/income, net of tax ( 7,701) 5,955
Total comprehensive income for the year 6,257,655 20,187,868
Scotia Group Jamaica Limited 2013 Annual Report 68
SCOTIA GROUP JAMAICA LIMITED Statement of Comprehensive IncomeYear ended October 31, 2013(Expressed in thousands of Jamai an dollars unless otherwise stated)
The accompanying notes form an integral part of the financial statements.
69Scotia Group Jamaica Limited 2013 Annual Report
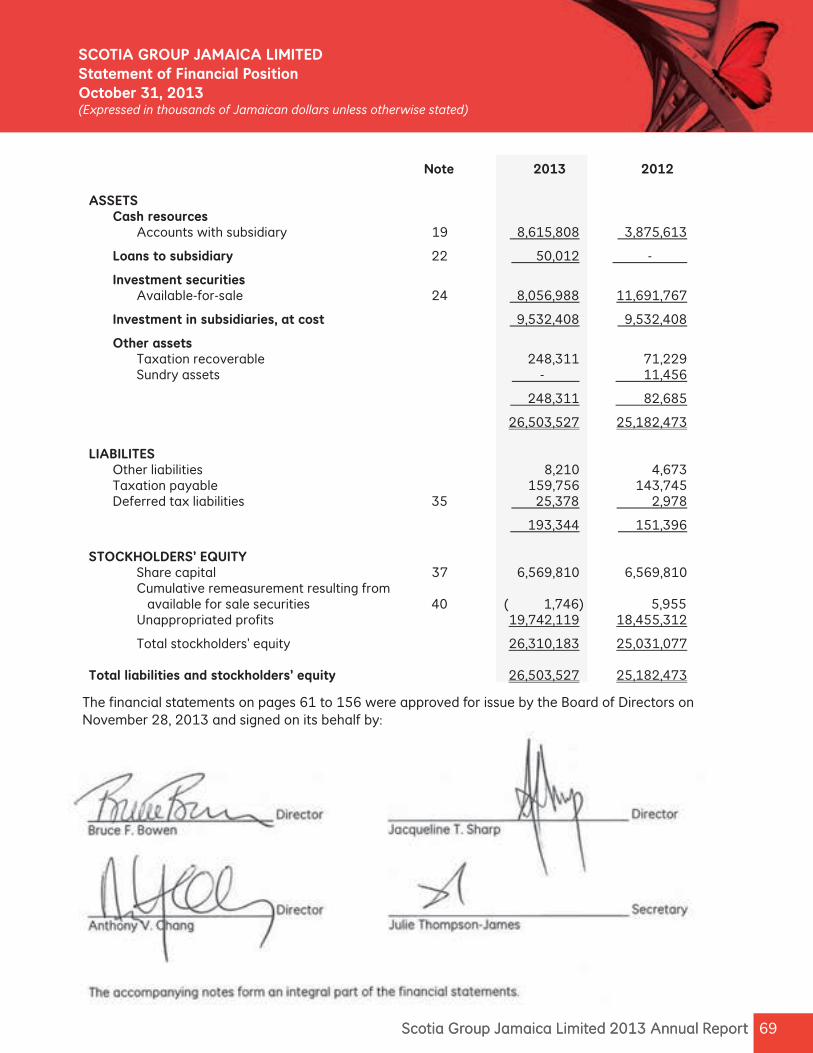
Note 2013 2012 ASSETS Cash resources Accounts with subsidiary 19 8,615,808 3,875,613
Loans to subsidiary 22 50,012 -
Investment securities Available-for-sale 24 8,056,988 11,691,767
Investment in subsidiaries, at cost 9,532,408 9,532,408
Other assets Taxation recoverable 248,311 71,229 Sundry assets - 11,456
248,311 82,685
26,503,527 25,182,473 LIABILITES Other liabilities 8,210 4,673 Taxation payable 159,756 143,745 Deferred tax liabilities 35 25,378 2,978
193,344 151,396 STOCKHOLDERS’ EQUITY Share capital 37 6,569,810 6,569,810 Cumulative remeasurement resulting from available for sale securities 40 ( 1,746) 5,955 Unappropriated profits 19,742,119 18,455,312
Total stockholders’ equity 26,310,183 25,031,077 Total liabilities and stockholders’ equity 26,503,527 25,182,473
69Scotia Group Jamaica Limited 2013 Annual Report
SCOTIA GROUP JAMAICA LIMITED Statement of Financial PositionOctober 31, 2013(Expressed in thousands of Jamai an dollars unless otherwise stated)
The nancial statements on pages 61 to 156 were approved for issue by the Board of Directors on November 28, 2013 and signed on its behalf by:
Scotia Group Jamaica Limited 2013 Annual Report 70 Scotia Group Jamaica Limited 2013 Annual Report 70
SCOTIA GROUP JAMAICA LIMITED Statement of Changes in Stockholders’ EquityYear ended October 31, 2013(Expressed in thousands of Jamai an dollars unless otherwise stated)
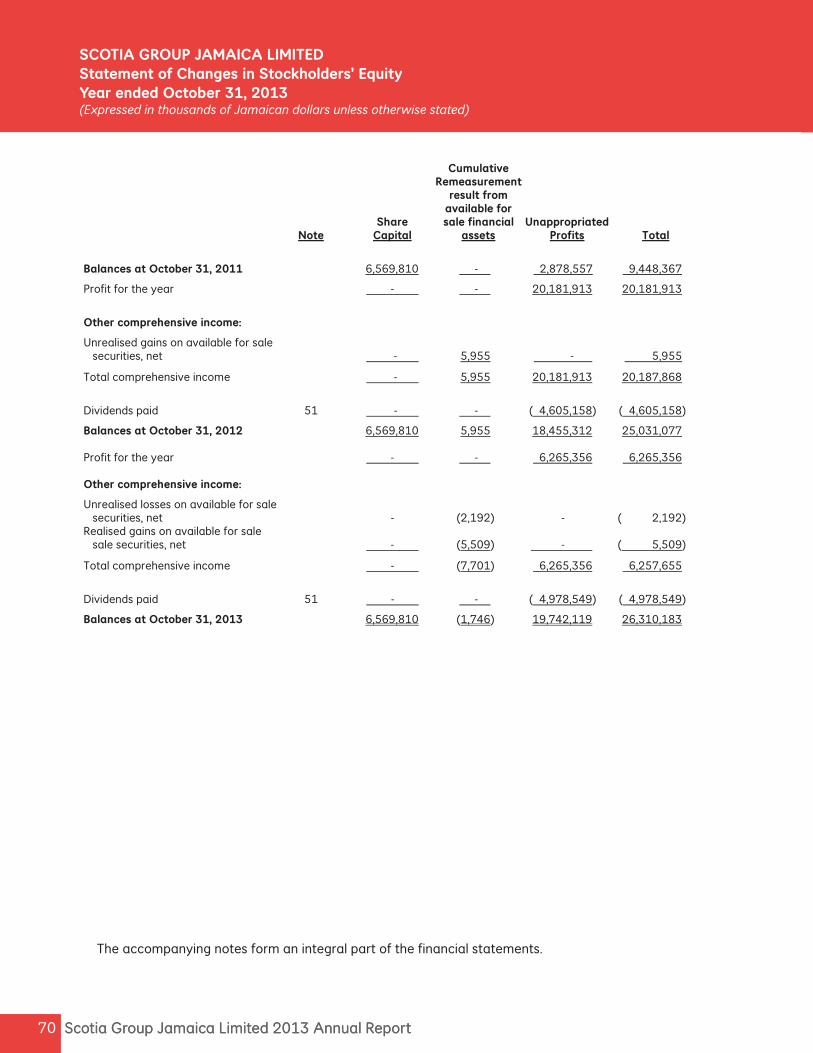
Cumulative Remeasurement result from available for Share sale financial Unappropriated Note Capital assets Profits Total
Balances at October 31, 2011 6,569,810 - 2,878,557 9,448,367
Profit for the year - - 20,181,913 20,181,913
Other comprehensive income:
Unrealised gains on available for sale securities, net - 5,955 - 5,955
Total comprehensive income - 5,955 20,181,913 20,187,868
Dividends paid 51 - - ( 4,605,158) ( 4,605,158)
Balances at October 31, 2012 6,569,810 5,955 18,455,312 25,031,077 Profit for the year - - 6,265,356 6,265,356 Other comprehensive income:
Unrealised losses on available for sale securities, net - (2,192) - ( 2,192) Realised gains on available for sale sale securities, net - (5,509) - ( 5,509)
Total comprehensive income - (7,701) 6,265,356 6,257,655
Dividends paid 51 - - ( 4,978,549) ( 4,978,549)
Balances at October 31, 2013 6,569,810 (1,746) 19,742,119 26,310,183
The accompanying notes form an integral part of the financial statements.
71Scotia Group Jamaica Limited 2013 Annual Report 71Scotia Group Jamaica Limited 2013 Annual Report
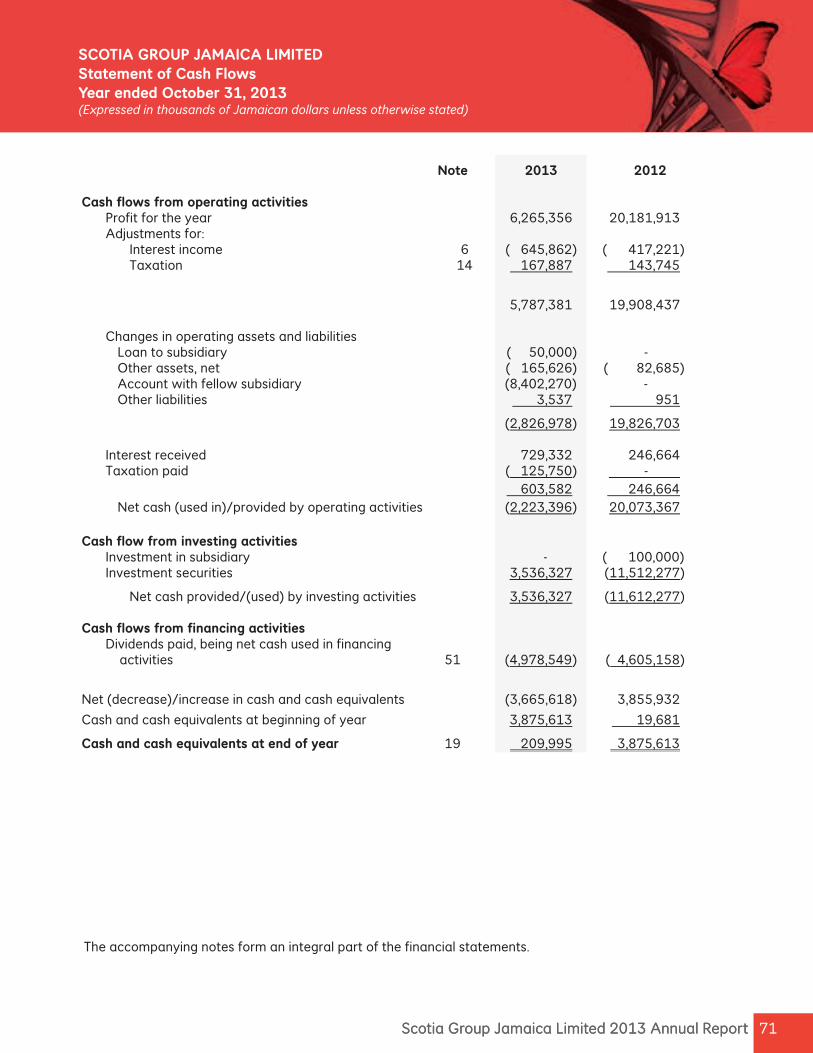
SCOTIA GROUP JAMAICA LIMITED Statement of Cash FlowsYear ended October 31, 2013(Expressed in thousands of Jamai an dollars unless otherwise stated)
The accompanying notes form an integral part of the financial statements.
Note 2013 2012 Cash flows from operating activities Profit for the year 6,265,356 20,181,913 Adjustments for: Interest income 6 ( 645,862) ( 417,221) Taxation 14 167,887 143,745
5,787,381 19,908,437
Changes in operating assets and liabilities Loan to subsidiary ( 50,000) - Other assets, net ( 165,626) ( 82,685) Account with fellow subsidiary (8,402,270) - Other liabilities 3,537 951
(2,826,978) 19,826,703 Interest received 729,332 246,664 Taxation paid ( 125,750) - 603,582 246,664 Net cash (used in)/provided by operating activities (2,223,396) 20,073,367 Cash flow from investing activities Investment in subsidiary - ( 100,000) Investment securities 3,536,327 (11,512,277)
Net cash provided/(used) by investing activities 3,536,327 (11,612,277) Cash flows from financing activities Dividends paid, being net cash used in financing activities 51 (4,978,549) ( 4,605,158)
Net (decrease)/increase in cash and cash equivalents (3,665,618) 3,855,932
Cash and cash equivalents at beginning of year 3,875,613 19,681
Cash and cash equivalents at end of year 19 209,995 3,875,613
Scotia Group Jamaica Limited 2013 Annual Report 72 Scotia Group Jamaica Limited 2013 Annual Report 72
SCOTIA GROUP JAMAICA LIMITED Notes to the Financial StatementsOctober 31, 2013(Expressed in thousands of Jamai an dollars unless otherwise stated)
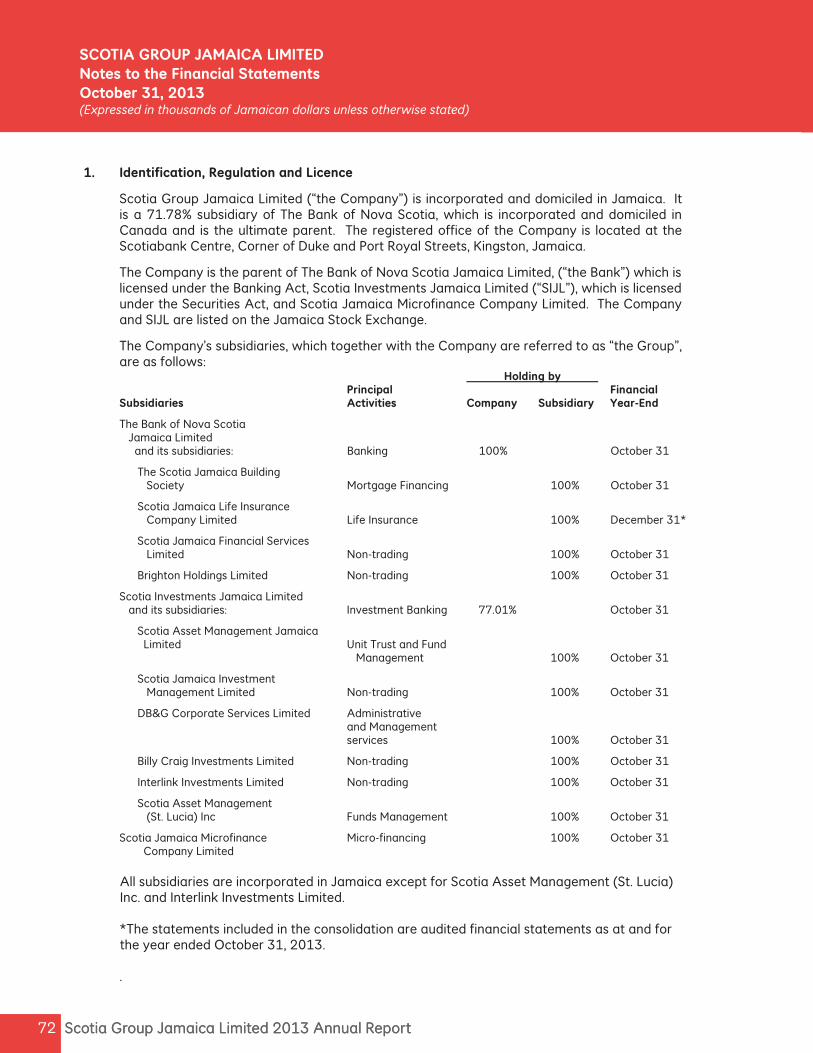
1. Identification, Regulation and Licence
Scotia Group Jamaica Limited (“the Company”) is incorporated and domiciled in Jamaica. It is a 71.78% subsidiary of The Bank of Nova Scotia, which is incorporated and domiciled in Canada and is the ultimate parent. The registered office of the Company is located at the Scotiabank Centre, Corner of Duke and Port Royal Streets, Kingston, Jamaica.
The Company is the parent of The Bank of Nova Scotia Jamaica Limited, (“the Bank”) which is licensed under the Banking Act, Scotia Investments Jamaica Limited (“SIJL”), which is licensed under the Securities Act, and Scotia Jamaica Microfinance Company Limited. The Company and SIJL are listed on the Jamaica Stock Exchange.
The Company’s subsidiaries, which together with the Company are referred to as “the Group”, are as follows:
Holding by Principal Financial Subsidiaries Activities Company Subsidiary Year-End
The Bank of Nova Scotia Jamaica Limited and its subsidiaries: Banking 100% October 31
The Scotia Jamaica Building Society Mortgage Financing 100% October 31
Scotia Jamaica Life Insurance Company Limited Life Insurance 100% December 31*
Scotia Jamaica Financial Services Limited Non-trading 100% October 31
Brighton Holdings Limited Non-trading 100% October 31
Scotia Investments Jamaica Limited and its subsidiaries: Investment Banking 77.01% October 31
Scotia Asset Management Jamaica Limited Unit Trust and Fund Management 100% October 31
Scotia Jamaica Investment Management Limited Non-trading 100% October 31
DB&G Corporate Services Limited Administrative and Management services 100% October 31
Billy Craig Investments Limited Non-trading 100% October 31
Interlink Investments Limited Non-trading 100% October 31
Scotia Asset Management (St. Lucia) Inc Funds Management 100% October 31
Scotia Jamaica Microfinance Micro-financing 100% October 31 Company Limited
All subsidiaries are incorporated in Jamaica except for Scotia Asset Management (St. Lucia) Inc. and Interlink Investments Limited. *The statements included in the consolidation are audited financial statements as at and for the year ended October 31, 2013. .
73Scotia Group Jamaica Limited 2013 Annual Report 73Scotia Group Jamaica Limited 2013 Annual Report
SCOTIA GROUP JAMAICA LIMITED Notes to the Financial StatementsOctober 31, 2013(Expressed in thousands of Jamai an dollars unless otherwise stated)
2. Summary of significant accounting policies
The principal accounting policies used in the preparation of these financial statements are set out below. They have been consistently applied for all the periods presented, unless otherwise stated.
(a) Basis of preparation
(i) Statement of compliance
These financial statements have been prepared in accordance with International Financial Reporting Standards (IFRS), as issued by the International Accounting Standards Board, and the Jamaican Companies Act.
New, revised and amended standards and interpretations that became effective during the year: Certain new, revised and amended standards and interpretations came into effect during the current financial year. The Group has assessed them and has adopted those which are relevant to its financial statements, viz:
IAS 1, Presentation of Financial Statements, has been amended, effective for annual reporting periods beginning on or after July 1, 2012, to require a reporting entity to present separately the items of other comprehensive income (OCI) that may be reclassified to profit or loss in the future from those that would never be reclassified to profit or loss. IAS 12, Income Taxes, has been amended, effective for annual reporting periods beginning on or after January 1, 2012, to require an entity to measure deferred taxes relating to an asset based on whether the entity expects to recover the carrying amount of the asset through use or sale. Based on the group’s current operations, adoption of the standards named above did not result in changes to the accounting policies or have a significant effect on the amount and disclosures in the financial statements. New revised and amended standards and interpretations that are not yet effective: At the date of authorisation of these financial statements, certain new, revised and amended standards and interpretations which were in issue were not effective at the reporting date and have not been early-adopted by the Group. The Group is assessing them and has determined that the following are relevant to its financial statements:
IAS 19, Employee Benefits, effective for annual periods beginning on or after January 1, 2013, requires the elimination of the corridor approach and recognition of all actuarial gains and losses in OCI as they occur. It also immediately recognises all past service costs and replaces interest cost and expected return on plan assets with a net interest amount that is calculated by applying the discount rate to the net defined benefit liability.
Scotia Group Jamaica Limited 2013 Annual Report 74 Scotia Group Jamaica Limited 2013 Annual Report 74
SCOTIA GROUP JAMAICA LIMITED Notes to the Financial StatementsOctober 31, 2013(Expressed in thousands of Jamai an dollars unless otherwise stated)
2. Summary of significant accounting policies (continued)
(a) Basis of preparation (continued)
(i) Statement of compliance (continued)
New revised and amended standards and interpretations that are not yet effective (continued):
Amendments to IAS 32, Financial Instruments: Presentation, which is effective for annual reporting periods beginning on or after January 1, 2014, clarifies those conditions needed to meet the criteria specified for offsetting financial assets and liabilities. It requires the entity to prove that there is a legally enforceable right to set off the recognised amounts. Conditions such as whether the set off is contingent on a future event and the nature and right of set-off and laws applicable to the relationships between the parties involved should be examined. Additionally, to meet the criteria, an entity should intend to either settle on a net basis or to realise the asset and settle the liability simultaneously.
IFRS 7, Disclosures – Offsetting financial assets and financial liabilities (effective for annual periods beginning on or after January 1, 2013). These amendments require an entity to disclose information about the rights to offset and provide users with information that is useful in evaluating the effect of netting arrangements on an entity’s financial position.
IFRS 9, Financial Instruments, is effective for annual reporting periods beginning on or after January 1, 2015. The standard retains but simplifies the mixed measurement model and establishes two primary measurement categories for financial assets: amortised cost and fair value. It eliminates the existing IAS 39 categories of held to maturity, available-for-sale and loans and receivables. For an investment in an equity instrument which is not held for trading, the standard permits an irrevocable election, on initial recognition, to present all fair value changes from the investment in other comprehensive income. The standard includes guidance on classification and measurement of financial liabilities designated as fair value through profit or loss and incorporates certain existing requirements of IAS 39 Financial Instruments: Recognition and Measurement on the recognition and de-recognition of financial assets and financial liabilities.
IFRS 10, Consolidated Financial Statements, which is effective for annual reporting periods beginning on or after 1 January 2013, introduces a new approach to determining which investees should be consolidated. It was issued as part of a suite of consolidation and related standards, also replacing existing requirements for joint ventures (now ‘joint arrangements’) and making limited amendments in relation to associates. IFRS 10 supersedes IAS 27 Consolidated and Separate Financial Statements, and SIC-12, Consolidation – Special Purpose Entities, and provides a single model to be applied in the control analysis for all investees, including entities that currently are SPEs in the scope of SIC-12. An investor controls an investee when (i) it is exposed, or has rights, to variable returns from its involvement with the investee, (ii) has the ability to affect those returns through its power over the investee and (iii) there is a link between power and returns.
75Scotia Group Jamaica Limited 2013 Annual Report 75Scotia Group Jamaica Limited 2013 Annual Report
SCOTIA GROUP JAMAICA LIMITED Notes to the Financial StatementsOctober 31, 2013(Expressed in thousands of Jamai an dollars unless otherwise stated)
2. Summary of signi cant accounting policies (continued)
(a) Basis of preparation (continued)
(i) Statement of compliance (continued) New, revised and amended standards and interpretations that are not yet effective (continued): IFRS 11, Joint Arrangements, which is effective for annual reporting periods beginning on or after January 1, 2013, identifies two main types of joint arrangements – joint operations and joint ventures:
(i) Joint operations refers to those cases in which although there is a separate vehicle created by the venturers, that separation is ineffective in certain ways. These joint arrangements are treated similarly to jointly controlled assets/operations under IAS 31.
(ii) Joint ventures refers to all other joint arrangements. They are required to be accounted for using the equity method (thus prohibiting the use of proportionate consolidation). The application of the equity method is subject to two exemptions carried forward from IAS 28 (2008) and IAS 31.
IFRS 12, Disclosure of Interest in Other Entities, which is effective for annual reporting periods beginning on or after January 1, 2013, contains disclosure requirements for entities that have interests in subsidiaries, joint arrangements (i.e. joint operations or joint ventures), associates and/or unconsolidated structured entities. The disclosure requirements encompass risk exposures for the sponsor of such an entity even if it no longer has any contractual involvement. These required disclosures aim to provide information to enable users to evaluate the nature of, and risks associated with, an entity’s interests in other entities and the effects of those interests on the entity’s financial position, financial performance and cash flows. The Group is required to: understand what a structured entity is in the context of its operations; apply judgement in assessing whether it is ‘involved’ with a structured entity, which has the potential to broaden the transactions and relationships to which the disclosures may apply, particularly for those who sponsor, or perhaps even transact business with, but do not consolidate, structured entities; and assess the level of disclosure that it believes will be meaningful to users of the financial statements.
IFRS 13, Fair Value Measurement, which is effective for annual reporting periods beginning on or after January 1, 2013, defines fair value, establishes a framework for measuring fair value and sets out disclosure requirements for fair value measurements. It explains how to measure fair value and is applicable to assets, liabilities and an entity’s own equity instruments that, under other IFRS, are required or permitted to be measured at fair value, or when disclosure of fair values is provided. It does not introduce new fair value measurements, nor does it eliminate the practicability exceptions to fair value measurements that currently exist in certain standards.
Scotia Group Jamaica Limited 2013 Annual Report 76 Scotia Group Jamaica Limited 2013 Annual Report 76
SCOTIA GROUP JAMAICA LIMITED Notes to the Financial StatementsOctober 31, 2013(Expressed in thousands of Jamai an dollars unless otherwise stated)
2. Summary of significant accounting policies (continued) (a) Basis of preparation (continued)
(i) Statement of compliance (continued) New, revised and amended standards and interpretations that are not yet effective (continued):
Improvements to IFRS 2009-2011 cycle contains amendments to certain standards and interpretations and are effective for accounting periods beginning on or after January 1, 2013. The main amendments applicable to the group are as follows:
IAS 1, Presentation of Financial Statements, has been amended to clarify that only one comparative period, which is the preceding period, is required for a complete set of financial statements. IAS 1 requires the presentation of an opening statement of financial position when an entity applies an accounting policy retrospectively or makes a restatement or reclassification. IAS 1 has been amended to clarify that (a) the opening statement of financial position is required only if a change in accounting policy, a restatement or a reclassification has a material effect upon the information in that statement of financial position; (b) except for the disclosures required under IAS 8, notes related to the opening statement of financial position are no longer required; and (c) the appropriate date for the opening statement of financial position is the beginning of the preceding period, rather than the beginning of the earliest comparative period presented.
IAS 16, Property, Plant and Equipment, has been amended to clarify that the definition of ‘property, plant and equipment’ in IAS 16 is now considered in determining whether spare parts, standby equipment and servicing equipment should be accounted for under the standard. If these items do not meet the definition, then they are accounted for using IAS 2, Inventories.
IAS 32, Financial Instruments: Presentation, has been amended to clarify that IAS 12 Income Taxes applies to the accounting for income taxes relating to distributions to holders of an equity instrument and transaction costs of an equity transaction.
IAS 34, Interim Financial Reporting, has been amended to require the disclosure of a measure of total assets and liabilities for a particular reporting segment. In addition, such disclosure is only required when the amount is regularly provided to the chief operating decision maker and there has been a material change from the amount disclosed in the last annual financial statements for that reportable segment.
The Group is assessing the impact the new, revised and amended standards and interpretations will have on its financial statements when they become effective.
77Scotia Group Jamaica Limited 2013 Annual Report 77Scotia Group Jamaica Limited 2013 Annual Report
SCOTIA GROUP JAMAICA LIMITED Notes to the Financial StatementsOctober 31, 2013(Expressed in thousands of Jamai an dollars unless otherwise stated)
2. Summary of significant accounting policies (continued)
(a) Basis of preparation (continued)
(ii) Basis of measurement The financial statements have been prepared on the historical cost basis, as modified for the revaluation of available-for-sale financial assets and financial assets at fair value through profit or loss.
(iii) Use of estimates and judgements The preparation of financial statements in conformity with IFRS and the Jamaican Companies Act requires the use of certain critical accounting estimates. It also requires management to exercise its judgement in the process of applying the Group’s accounting policies. The areas involving a higher degree of judgement or complexity, or areas where assumptions and estimates are significant to the financial statements, are disclosed in note 3.
(iv) Functional and presentation currency These financial statements are presented in Jamaican dollars, which is the
Company’s functional currency. Except where indicated to be otherwise, financial information presented is shown in thousands of Jamaican dollars.
(v) Comparative information Where necessary, comparative amounts have been reclassified to conform with
changes in the presentation in the current year. The changes made to the comparative amounts are not considered material.
(b) Basis of consolidation
The consolidated financial statements include the assets, liabilities and results of
operations of the Company and its subsidiaries presented as a single economic entity. Subsidiaries are all entities over which the Company has the power to govern the
financial and operating policies, generally accompanying a shareholding of more than one half of the voting rights. The existence and effect of potential voting rights that are currently exercisable or convertible are considered when assessing whether the Company controls another entity. Subsidiaries are consolidated from the date on which control is transferred to the Group. They are no longer consolidated from the date that control ceases.
Intra-group transactions, balances and unrealised gains on transactions between Group
companies are eliminated. Unrealised losses are also eliminated unless the transaction provides evidence of impairment of the asset transferred. Accounting policies of subsidiaries are consistent with those of the Group.
Scotia Group Jamaica Limited 2013 Annual Report 78 Scotia Group Jamaica Limited 2013 Annual Report 78
SCOTIA GROUP JAMAICA LIMITED Notes to the Financial StatementsOctober 31, 2013(Expressed in thousands of Jamai an dollars unless otherwise stated)
2. Summary of significant accounting policies (continued)
(b) Basis of consolidation (continued) The Group uses the acquisition method of accounting for business combinations. The
cost of acquisition is measured as the fair value of the assets given, equity instruments issued and liabilities incurred or assumed at the date of exchange. Identifiable assets acquired and liabilities and contingent liabilities assumed in a business combination are measured at their fair values at the acquisition date, irrespective of the extent of any non-controlling interest. The excess of the cost of acquisition over the fair value of the Group’s share of the identifiable net assets acquired is recorded as goodwill. If the cost of acquisition is less than the fair value of the net assets of the subsidiary acquired, the difference is recognized directly in the consolidated statement of revenue and expenses.
(c) Segment reporting
Operating segments are reported in a manner consistent with the internal reporting provided to the chief operating decision-maker. The chief operating decision-maker is the person or group that allocates resources to, and assesses the performance of the operating segments of an entity. The Group has determined the Board of Directors as its chief operating decision maker. All transactions between business segments are conducted on an arms length basis, with inter-segment revenue and costs eliminated on consolidation. Income and expenses directly associated with each segment are included in determining business segment performance.
(d) Foreign currency translation
Assets and liabilities denominated in foreign currencies are translated into Jamaican dollars at the exchange rates prevailing at the reporting date, being the mid-point between the weighted average buying and selling rates of Bank of Jamaica (the Central Bank) at that date. Transactions in foreign currencies are translated at the rates of exchange ruling at the dates of those transactions.
(e) Revenue recognition
(i) Interest income
Interest income is recognised in profit or loss for all interest earning instruments using the effective interest method. The effective interest rate is the rate that exactly discounts the estimated future cash receipts through the expected life of the financial asset or liability (or, where appropriate, a shorter period) to the carrying amount of the financial asset. The effective interest rate is established on initial recognition of the financial asset and is not revised subsequently. Interest income includes coupons earned on fixed income investments and accretion of discount on treasury bills and other discounted instruments, and amortization of premium on instruments bought at a premium.
79Scotia Group Jamaica Limited 2013 Annual Report 79Scotia Group Jamaica Limited 2013 Annual Report
SCOTIA GROUP JAMAICA LIMITED Notes to the Financial StatementsOctober 31, 2013(Expressed in thousands of Jamai an dollars unless otherwise stated)
2. Summary of significant accounting policies (continued)
(e) Revenue recognition (continued)
(i) Interest income (continued)
Where collection of interest income is considered doubtful, or payment is outstanding for more than 90 days, the banking regulations stipulate that interest should be taken into account on the cash basis. IFRS requires that when loans become doubtful of collection, they are written down to their recoverable amounts and interest income is thereafter recognised based on the rate of interest that was used to discount the future cash flows for the purpose of measuring the recoverable amount. The difference between the amounts recognized under the banking regulations and such amounts as would have been determined under IFRS is considered to be immaterial.
(ii) Fee and commission income
Fee and commission income are recognised on the accrual basis when service has been provided. Origination fees for loans are recognised in profit or loss immediately, as they are not considered material for deferral.
Portfolio and other management advisory and service fees are recognised based on the applicable service contracts. Asset management fees are recognised over the period the service is provided. The same principle is applied for financial planning and custody services that are continuously provided over an extended period of time. Fee and commission expenses relate mainly to transaction and service fees, which are expensed as the services are received.
(iii) Premium income
Gross premiums are recognized as revenue when due. The related actuarial liabilities are computed when premiums are recognized, resulting in benefits and expenses being matched with revenue. Unearned premiums are those proportions of premiums written in the current year that relate to periods of risk after the reporting date.
(iv) Dividend income Dividend income is recognized when the right to receive payment is established.
(f) Interest expense
Interest expense is recognised in profit or loss using the effective interest method. The
effective interest rate is the rate that exactly discounts the estimated future cash payments through the expected life of the financial liability (or, where appropriate, a shorter period) to the carrying amount of the financial liability.
Scotia Group Jamaica Limited 2013 Annual Report 80 Scotia Group Jamaica Limited 2013 Annual Report 80
SCOTIA GROUP JAMAICA LIMITED Notes to the Financial StatementsOctober 31, 2013(Expressed in thousands of Jamai an dollars unless otherwise stated)
2. Summary of significant accounting policies (continued)
(g) Claims Death claims net of reinsurance recoveries, are recorded in the profit or loss.
(h) Reinsurance contracts held
The Group enters into contracts with reinsurers under which it is compensated for losses on contracts it issues and which meet the classification requirements for insurance contracts. Reinsurance does not relieve the Group of its liability and reinsurance recoveries are recorded when collection is reasonably assured.
(i) Taxation
Taxation on the profit or loss for the year comprises current and deferred income taxes. Current and deferred income taxes are recognised as tax expense or benefit in profit or loss, except where they relate to a business combination, or items recognized in other comprehensive income. (i) Current income tax
Current income tax charges are based on the taxable profit for the year, which
differs from the profit before tax reported because it excludes items that are taxable or deductible in other years, and items that are never taxable or deductible. The current tax is calculated at tax rates that have been enacted at the reporting date.
(ii) Deferred income tax
Deferred tax liabilities are recognised for temporary differences between the carrying amounts of assets and liabilities and their amounts as measured for tax purposes, which will result in taxable amounts in future periods. Deferred tax assets are recognised for temporary differences which will result in deductible amounts in future periods, but only to the extent it is probable that sufficient taxable profits will be available against which these differences can be utilised. Deferred tax assets are reviewed at each reporting date to determine whether it is probable that the related tax benefit will be realised.
Deferred tax assets and liabilities are measured at the tax rates that are expected to apply in the period in which the asset will be realised or the liability will be settled based on enacted rates. Current and deferred tax assets and liabilities are offset when the legal right of set-off exists, and when they relate to income taxes levied by the same tax authority on either the same taxable entity, or different taxable entities which intend to settle current tax liabilities and assets on a net basis.
81Scotia Group Jamaica Limited 2013 Annual Report 81Scotia Group Jamaica Limited 2013 Annual Report
SCOTIA GROUP JAMAICA LIMITED Notes to the Financial StatementsOctober 31, 2013(Expressed in thousands of Jamai an dollars unless otherwise stated)
2. Summary of significant accounting policies (continued)
(j) Insurance contracts
(i) Classification
The Group issues contracts that transfer insurance risk or financial risk or both.
Insurance contracts are those contracts that transfer significant insurance risk. Such contracts may also transfer financial risk. The Group defines insurance risk as significant if an insured event could cause an insurer to pay significant additional benefits in a scenario that has a discernible effect on the economics of the transactions. As a general guideline, the Group defines as significant insurance risk the possibility of having to pay benefits, at the occurrence of an insured event, that are at least 10% more than the benefits payable if the insured event did not occur.
(ii) Recognition and measurement
These contracts insure human life events (for example death or permanent disability) over a long duration. The accounting treatment differs according to whether the contract bears investment options or not. Under contracts that do not bear investment options, premiums are recognised as income when they become payable by the contract holder and benefits are recorded as an expense when they are incurred.
Under contracts that bear an investment option, the investment portion of insurance premiums received are initially recognised directly as liabilities. These liabilities are increased by interest credited and are decreased by policy administration fees, mortality charges and any withdrawals or surrenders; the resulting liability is the policyholders’ fund. Income consists of fees deducted for mortality, policy administration, withdrawals and surrenders. Interest credited to the policy and benefit claims in excess of the cash surrender value incurred in the period are recorded as expenses in the statement of revenue and expenses.
Insurance contract liabilities are determined by an independent actuary using the Policy Premium Method of valuation as summarised in note 2(k). These liabilities are adjusted through profit or loss to reflect any changes in the valuation.
(k) Policyholders’ liabilities
(i) The policyholders’ liabilities have been calculated using the Policy Premium Method (PPM) of valuation. Under this method explicit allowance is made for all future benefits and expenses under the policies. The premiums, benefits and expenses for each policy are projected and the resultant future cash flows are discounted back to the valuation date to determine the reserves.
(ii) Annuities Annuities are immediate payouts of fixed and variable amounts for a guaranteed period and recognised on the date that they originate. Benefits are recognised as liabilities until the end of the guaranteed period.
Scotia Group Jamaica Limited 2013 Annual Report 82 Scotia Group Jamaica Limited 2013 Annual Report 82
SCOTIA GROUP JAMAICA LIMITED Notes to the Financial StatementsOctober 31, 2013(Expressed in thousands of Jamai an dollars unless otherwise stated)
2. Summary of significant accounting policies (continued)
(k) Policyholders’ liabilities (continued)
(ii) Annuities (continued)
These liabilities are increased by credited interest and are decreased by policy administration fees, period payment charges and any withdrawals. Income consists mainly of fees deducted for fund administration and interest credited is treated as an expense in profit or loss. The annuity fund is included as a part of policyholders’ liabilities [note 36(a)].
(l) Financial assets and liabilities
Financial assets comprise cash resources, financial assets at fair value through profit or loss, securities purchased under resale agreements, pledged assets, loans, investment securities, leases, and certain other assets. Financial liabilities comprise deposits, securities sold under repurchase agreements, promissory notes, capital management and government securities funds, assets held in trust on behalf of participants, certain other liabilities and policyholders’ liabilities.
(i) Recognition
The Group initially recognises loans and receivables and deposits on the date at which the Group becomes a party to the contractual provisions of the instrument, i.e., the date that they are originated. All other financial assets and liabilities (including assets and liabilities designated as at fair value through profit or loss) are initially recognized on the settlement date – the date on which the asset is delivered to or by the Group.
(ii) Derecognition
The Group derecognises a financial asset when the contractual rights to the cash flows from the asset expire, or it transfers the rights to receive the contractual cash flows on the financial asset in a transaction in which substantially all the risks and rewards of ownership of the financial asset are transferred. Any interest in the transferred financial assets that is created or retained by the Group is recognised as a separate asset or liability.
The Group derecognises a financial liability when its contractual obligations are discharged, cancelled or expired.
The Group enters into transactions whereby it transfers assets, but retains either all or a portion of the risks and rewards of the transferred assets. If all or substantially all risks and rewards are retained, then the transferred assets are not derecognised. Transfers of assets with retention of all or substantially all risks and rewards include, for example, securities lending and repurchase transactions.
83Scotia Group Jamaica Limited 2013 Annual Report 83Scotia Group Jamaica Limited 2013 Annual Report
SCOTIA GROUP JAMAICA LIMITED Notes to the Financial StatementsOctober 31, 2013(Expressed in thousands of Jamai an dollars unless otherwise stated)
2. Summary of significant accounting policies (continued) (l) Financial assets and liabilities (continued)
(iii) Measurement
On initial recognition, financial assets and liabilities are measured at fair value plus, in the case of a financial asset or liability not at fair value through profit or loss, transaction costs that are directly attributable to the acquisition or issue of the financial asset or financial liability.
The measurement of financial assets subsequent to initial recognition depends upon their classification as set out in note 2(m) below, namely: loans and receivables are measured at amortised cost; held-to-maturity investments are measured at amortised cost; investments in equity instruments that do not have a quoted market price in an active market and whose fair value cannot be reliably determined are measured at cost.
Other financial assets are measured at their fair values without any deduction for transaction costs that may be incurred on sale or other disposal.
Financial liabilities are measured at amortised cost, after initial recognition. (m) Financial assets
(i) Classification
The Group classifies its financial assets into the following categories: Management determines the classification of its investments at initial recognition.
(1) Financial assets at fair value through profit or loss
This category includes financial assets held for trading. A financial asset is classified in this category at inception if acquired principally for the purpose of selling in the short term or if so designated by management. These assets are measured at fair value and all related gains and losses are included in profit or loss.
(2) Loans and receivables
See details at note 2(p).
(3) Held-to-maturity
Held-to-maturity investments are non-derivative financial assets with fixed or determinable payments and fixed maturities that the Group’s management has the positive intention and ability to hold to maturity and which are not designated as at fair value through profit or loss or as available-for-sale. Were the Group to sell other than an insignificant amount of held-to-maturity assets, the entire category would be compromised and reclassified as available-for-sale and the Group would be prohibited from classifying investment securities as held-to-maturity for two financial years. Held-to-maturity investments are measured at amortised cost.
Scotia Group Jamaica Limited 2013 Annual Report 84 Scotia Group Jamaica Limited 2013 Annual Report 84
SCOTIA GROUP JAMAICA LIMITED Notes to the Financial StatementsOctober 31, 2013(Expressed in thousands of Jamai an dollars unless otherwise stated)
2. Summary of significant accounting policies (continued)
(m) Financial assets (continued)
(4) Available-for-sale
Available-for-sale investments are non-derivative investments that are designated as available-for-sale or are not classified in any of the other three categories of financial assets. They are intended to be held for an indefinite period of time, and may be sold in response to needs for liquidity or changes in interest rates, exchange rates or market prices. Available-for-sale investments are measured at fair value except for any unquoted equity securities whose fair value cannot be reliably measured, which are carried at cost. Interest income is recognized in profit or loss using the effective interest method. Dividend income is recognized in profit or loss when the Group becomes entitled to the dividend. Other unrealized gains and losses arising from changes in fair value of available-for-sale investments are recognized in other comprehensive income. On disposal or impairment of these investments, the unrealized gains or losses included in stockholders’ equity are transferred to profit or loss.
(ii) Identification and measurement of impairment
At each financial year end, the Group assesses whether there is objective evidence that financial assets not carried at fair value through profit or loss are impaired. Financial assets are impaired when objective evidence demonstrates that a loss event has occurred after the initial recognition of the asset, and that the loss event has an impact on the future cash flows of the asset that can be estimated reliably.
Objective evidence that financial assets (including equity securities) are impaired can include default or delinquency by a borrower, restructuring of a loan or advance by the Group on terms that the Group would not otherwise consider, indications that a borrower or issuer will enter bankruptcy, the disappearance of an active market for a security, or other observable data relating to a group of assets such as adverse changes in the payment status of borrowers or issuers in the Group, or economic conditions that correlate with defaults in the Group. In addition, for an investment in an equity security, a significant or prolonged decline in its fair value below its cost is objective evidence of impairment.
The Group considers evidence of impairment for loans and receivables and held-to-maturity investment securities at both a specific asset level and collectively. All individually significant loans and advances and held-to-maturity investment securities are assessed for specific impairment. All individually significant loans and advances and held-to-maturity investment securities found not to be specifically impaired are then collectively assessed for any impairment that has been incurred but not yet identified. Loans and receivables and held-to-maturity investment securities that are not individually significant are collectively assessed for impairment by grouping together loans and receivables and held-to-maturity investment securities with similar risk characteristics.

85Scotia Group Jamaica Limited 2013 Annual Report 85Scotia Group Jamaica Limited 2013 Annual Report
SCOTIA GROUP JAMAICA LIMITED Notes to the Financial StatementsOctober 31, 2013(Expressed in thousands of Jamai an dollars unless otherwise stated)
2. Summary of significant accounting policies (continued)
(m) Financial assets (continued)
(ii) Identification and measurement of impairment (continued)
In assessing collective impairment, management makes judgements as to current economic and credit conditions and their effect on default rates, loss rates and the expected timing of future recoveries, ensuring that assumptions remain appropriate. Impairment losses on assets carried at amortised cost are measured as the difference between the carrying amount of the financial asset and the present value of estimated future cash flows discounted at the asset’s original effective interest rate. Losses are recognised in profit or loss and reflected as an allowance against loans and advances. When a subsequent event causes the amount of impairment loss to decrease, the decrease in impairment loss is reversed through profit or loss. Impairment losses on available-for-sale securities are recognised by transferring the cumulative loss that has been recognised directly in equity to profit or loss. The cumulative loss that is removed from equity and recognised in profit or loss is the difference between the acquisition cost, net of any principal repayment and amortisation, and the current fair value, less any impairment loss previously recognised in profit or loss. If, in a subsequent period, the fair value of an impaired available-for-sale debt security increases and the increase can be objectively related to an event occurring after the impairment loss was recognised in profit or loss, the impairment loss is reversed, with the amount of the reversal recognised in profit or loss. However, any subsequent recovery in the fair value of an impaired available-for-sale equity security is recognised directly in other comprehensive income.
(n) Investment in subsidiaries
Investments by the Group in subsidiaries are stated at cost less impairment losses.
(o) Repurchase and reverse repurchase agreements
Securities sold under agreements to repurchase the asset at a fixed price on a future date (repurchase agreements) and securities purchased under agreements to resell the asset at a fixed price on a future date (reverse repurchase agreements) are treated as collateralised financing transactions. In the case of reverse repurchase agreements, the underlying asset is not recognized in the Group’s financial statements; in the case of repurchase agreements the underlying collateral is not derecognized but is segregated as pledged assets. The difference between the sale/purchase and repurchase/resale price is recognised as interest over the life of the agreements using the effective interest method.
Scotia Group Jamaica Limited 2013 Annual Report 86 Scotia Group Jamaica Limited 2013 Annual Report 86
SCOTIA GROUP JAMAICA LIMITED Notes to the Financial StatementsOctober 31, 2013(Expressed in thousands of Jamai an dollars unless otherwise stated)
2. Summary of significant accounting policies (continued)
(p) Loans and receivables and allowance for impairment losses
Loans and receivables are non-derivative financial assets with fixed or determinable payments that are not quoted in an active market, other than those that the Group intends to sell immediately or in the near term, and that, upon initial recognition, the Group designates as at fair value through profit or loss, or as available-for-sale.
Loans are initially recorded at the fair value of the consideration given, which is the cash disbursed to originate the loan, including any transaction costs, and are subsequently measured at amortised cost.
Loans are stated net of unearned income and allowance for impairment.
An allowance for loan impairment is established if there is objective evidence that the Group will not be able to collect all amounts due according to the original contractual terms of loans. The amount of the provision is the difference between the carrying amount and the recoverable amount, being the present value of expected cash flows, including amounts recoverable from guarantees and collateral, discounted at the original effective interest rate of the impaired loans. A loan is classified as impaired when, in management’s opinion, there has been a deterioration in credit quality to the extent that there is no longer reasonable assurance of timely collection of the full amount of principal and interest. As required by statutory regulations, if a payment on a loan is contractually 90 days in arrears, the loan will be classified as impaired, if not already classified as such. Any credit card loan that has a payment that is contractually 90 days in arrears is written-off.
When a loan is classified as impaired, recognition of interest in accordance with the terms of the original loan ceases, and interest is taken into account on the cash basis. This differs from IFRS which requires that interest on the impaired asset continues to be recognised through the unwinding of the discount that was applied to the estimated future cash flows. The difference is not considered material. Statutory and other regulatory loan loss provisions that exceed the amounts required under IFRS are included in a non-distributable loan loss reserve as an appropriation of profits.
(q) Acceptances and guarantees
The Group’s potential liability under acceptances and guarantees is reported as a liability in the statement of financial position. The Group has equal and offsetting claims against its customers in the event of a call on these commitments, which are reported as an asset.
(r) Intangible assets
(i) Intangible assets acquired separately
Intangible assets acquired separately are reported at cost less accumulated amortisation and accumulated impairment losses. Amortisation is charged on the straight-line basis over their estimated useful lives. The estimated useful life and amortisation method are reviewed at each reporting date, with the effect of any changes in estimate being accounted for on a prospective basis.
87Scotia Group Jamaica Limited 2013 Annual Report 87Scotia Group Jamaica Limited 2013 Annual Report
SCOTIA GROUP JAMAICA LIMITED Notes to the Financial StatementsOctober 31, 2013(Expressed in thousands of Jamai an dollars unless otherwise stated)
2. Summary of significant accounting policies (continued)
(r) Intangible assets (continued)
(ii) Intangible assets acquired in a business combination
Intangible assets acquired in a business combination are identified and recognised separately from goodwill where they satisfy the definition of an intangible asset and their fair values can be measured reliably. The cost of such intangible assets is their fair value at the acquisition date.
Subsequent to initial recognition, intangible assets acquired in a business combination are reported at cost less accumulated amortisation and accumulated impairment losses, on the same basis as intangible assets acquired separately.
(iii) Impairment of tangible and intangible assets excluding goodwill
At each reporting date, the Group reviews the carrying amounts of its tangible and intangible assets to determine whether there is any indication that those assets are impaired. If any such indication exists, the recoverable amount of the asset is estimated in order to determine the extent of the impairment loss (if any). Where it is not possible to estimate the recoverable amount of an individual asset, the Group estimates the recoverable amount of the cash-generating unit to which the asset belongs. Where a reasonable and consistent basis of allocation can be identified, corporate assets are also allocated to individual cash-generating units, or otherwise they are allocated to the smallest group of cash-generating units for which a reasonable and consistent allocation basis can be identified.
Intangible assets with indefinite useful lives are tested for impairment annually, and whenever there is an indication that the asset may be impaired. Recoverable amount is the higher of fair value less costs to sell and value in use. In assessing value in use, the estimated future cash flows are discounted to their present value using a pre-tax discount rate that reflects current market assessments of the time value of money and the risks specific to the asset for which the estimates of future cash flows have not been adjusted.
If the recoverable amount of an asset (or cash-generating unit) is estimated to be less than its carrying amount, the carrying amount of the asset (or cash-generating unit) is reduced to its recoverable amount. An impairment loss is recognised immediately in profit or loss, unless the relevant asset is carried at a revalued amount, in which case the impairment loss is treated as a revaluation decrease.
Scotia Group Jamaica Limited 2013 Annual Report 88 Scotia Group Jamaica Limited 2013 Annual Report 88
SCOTIA GROUP JAMAICA LIMITED Notes to the Financial StatementsOctober 31, 2013(Expressed in thousands of Jamai an dollars unless otherwise stated)
2. Summary of significant accounting policies (continued)
(r) Intangible assets (continued)
(iii) Impairment of tangible and intangible assets excluding goodwill (continued)
Where an impairment loss subsequently reverses, the carrying amount of the asset (or cash-generating unit) is increased to the revised estimate of its recoverable amount, so that the increased carrying amount does not exceed the carrying amount that would have been determined had no impairment loss been recognised for the asset (or cash-generating unit) in prior years. A reversal of an impairment loss is recognised immediately in profit or loss, unless the relevant asset is carried at a revalued amount, in which case the reversal of the impairment loss is treated as a revaluation increase.
(iv) Goodwill
Goodwill arising on the acquisition of a subsidiary or a jointly controlled entity represents the excess of the cost of acquisition over the Group’s interest in the net fair value of the identifiable assets, liabilities and contingent liabilities of the subsidiary or jointly controlled entity recognised at the date of acquisition. Goodwill is initially recognised as an asset at cost and is subsequently measured at cost less any accumulated impairment losses. For the purpose of impairment testing, goodwill is allocated to each of the Group’s cash-generating units expected to benefit from the synergies of the combination. Cash-generating units to which goodwill has been allocated are tested for impairment annually, or more frequently when there is an indication that the unit may be impaired. If the recoverable amount of the cash-generating unit is less than the carrying amount of the unit, the impairment loss is allocated first to reduce the carrying amount of any goodwill allocated to the unit and then to the other assets of the unit pro-rata on the basis of the carrying amount of each asset in the unit. An impairment loss recognised for goodwill is not reversed in a subsequent period.
On disposal of a subsidiary or a jointly controlled entity, the attributable amount of goodwill is included in the determination of the profit or loss on disposal.
(v) Customer relationships
This asset represents the present value of the benefit to the Group from customer lists, contracts, or customer relationships that can be identified separately and measured reliably. Customer relationships include those of SIJL, and stockbroking customer relationships with an estimated useful life of 15 years.
89Scotia Group Jamaica Limited 2013 Annual Report 89Scotia Group Jamaica Limited 2013 Annual Report
SCOTIA GROUP JAMAICA LIMITED Notes to the Financial StatementsOctober 31, 2013(Expressed in thousands of Jamai an dollars unless otherwise stated)
2. Summary of significant accounting policies (continued)
(r) Intangible assets (continued)
(vi) Contract-based intangible asset
Contract-based intangible assets represent the Group’s right to benefit from SIJL’s unit trust management contracts. This asset has an indefinite useful life and is therefore tested for impairment annually and whenever there is an indication that the asset may be impaired.
(vii) Licences
The asset represents the value of SIJL’s Jamaica Stock Exchange seat, which has an indefinite useful life. The asset is tested for impairment annually, and whenever there is an indication that the asset may be impaired.
(viii) Tax Shield
The asset represents the present value of tax saving on tax-free bonds held by SIJL recognised to the extent that it is probable that there will be sufficient taxable profits against which to utilise the benefit. The carrying amount of the tax asset is reviewed at each reporting date and reduced to the extent that the benefit is already realised, or it is no longer probable that sufficient taxable profits will be available to allow all or part of the asset to be recovered. The assets are measured at the tax rate that is expected to apply in the period in which the asset is realised, based on tax rates (and tax laws) that have been enacted by the reporting date.
(ix) Computer software
Costs associated with developing or maintaining computer software programs are recognised as an expense as incurred. Costs that are directly associated with acquiring identifiable and unique software products which are expected to generate economic benefits exceeding costs beyond one year, are recognised as intangible assets. However, such costs are expensed where they are considered to be immaterial.
(s) Leases
(i) As lessee
Leases of property, plant and equipment where the Group has substantially all the risks and rewards of ownership are classified as finance leases. Finance leases are recognised at the inception of the lease at the lower of the fair value of the leased asset and the present value of future minimum lease payments. Each lease payment is allocated between the liability and interest charges so as to produce a constant rate of charge on the lease obligation. The interest element of the lease payments is charged as an expense and included in profit or loss over the lease period.
Scotia Group Jamaica Limited 2013 Annual Report 90 Scotia Group Jamaica Limited 2013 Annual Report 90
SCOTIA GROUP JAMAICA LIMITED Notes to the Financial StatementsOctober 31, 2013(Expressed in thousands of Jamai an dollars unless otherwise stated)
2. Summary of significant accounting policies (continued)
(s) Leases (continued)
(i) As lessee (continued)
Leases where a significant portion of the risks and rewards of ownership are retained by the lessor are classified as operating leases. Payments under operating leases are charged to profit or loss on the straight-line basis over the period of the lease.
(ii) As lessor
When assets are leased out under a finance lease, the present value of the lease payments is recognised as a receivable. The difference between the gross receivable and the present value of the receivable is recognised as unearned finance income. Lease income is recognised over the term of the lease in a manner which reflects a constant periodic rate of return on the net investment in the lease. Assets leased out under operating leases are included in property, plant and equipment. They are depreciated over their expected useful lives on a basis consistent with similar owned assets. Rental income is recognised on the straight-line basis over the lease term.
(t) Property, plant and equipment Land is stated at historical cost. All other property, plant and equipment are stated at historical cost less accumulated depreciation and, if any, impairment losses. Cost includes expenditures that are directly attributable to the acquisition of the asset. Expenditure subsequent to acquisition is included in the asset’s carrying amount or is recognised as a separate asset, as appropriate, only when it is probable that future economic benefits associated with the expenditure will flow to the Group and the cost of the item can be measured reliably. All other expenditure is classified as repairs and renewals and charged as expense in profit or loss during the financial period in which it is incurred. Depreciation and amortisation are calculated on the straight-line method at rates that will write off the depreciable amount of the assets over their expected useful lives, as follows: Buildings 40 Years Furniture, fixtures and equipment 10 Years Computer equipment 4 Years Motor vehicles 5 Years Leasehold improvements Period of lease
91Scotia Group Jamaica Limited 2013 Annual Report 91Scotia Group Jamaica Limited 2013 Annual Report
SCOTIA GROUP JAMAICA LIMITED Notes to the Financial StatementsOctober 31, 2013(Expressed in thousands of Jamai an dollars unless otherwise stated)
2. Summary of significant accounting policies (continued)
(t) Property, plant and equipment (continued)
The depreciation methods, useful lives and residual values are reassessed at each reporting date.
Property, plant and equipment are reviewed periodically for impairment. Where the carrying amount of an asset is greater than its estimated recoverable amount, it is written down immediately to its recoverable amount.
Gains and losses on disposal of property, plant and equipment are determined by reference to their carrying amount and are taken into account in determining the profit or loss for the year.
(u) Employee benefits
Employee benefits are all forms of consideration given by the Group in exchange for service rendered by employees. These include current or short-term benefits such as salaries, bonuses, NIS contributions and vacation leave; non-monetary benefits such as medical care; post-employments benefits such as pensions; and other long-term employee benefits such as termination benefits.
Employee benefits that are earned as a result of past or current service are recognised in the following manner: Short-term employee benefits are recognised as a liability, net of payments made, and charged as expense. Post-employment benefits, termination benefits and equity compensation benefits are accounted for as described below. Other long-term benefits are not considered material and are expensed when incurred.
(i) Pension obligations
The Group operates both defined benefit and defined contribution pension plans. The assets of the plans are held in separate trustee-administered funds. The pension plans are funded by contributions from employees and by the relevant group companies, taking into account the recommendations of qualified actuaries. The asset or liability in respect of the defined benefit plan is the difference between the present value of the defined benefit obligation at the reporting date and the fair value of plan assets, adjusted for unrecognised actuarial gains/losses and past service cost. Where a pension asset arises, the amount recognised is limited to the net total of any cumulative unrecognised net actuarial losses and past service cost and the present value of any economic benefits available in the form of refunds from the plan or reduction in future contributions to the plan. The pension costs are assessed using the Projected Unit Credit Method. Under this method, the cost of providing pensions is charged as an expense in such a manner as to spread the regular cost over the service lives of the employees in accordance with the advice of the actuaries, who carry out a full valuation of the plan every year in accordance with IAS 19. The pension obligation is measured at the present value of the estimated future cash outflows using estimated discount rates based on market yields on Government securities which have terms to maturity approximating the terms of the related liability.
Scotia Group Jamaica Limited 2013 Annual Report 92 Scotia Group Jamaica Limited 2013 Annual Report 92
SCOTIA GROUP JAMAICA LIMITED Notes to the Financial StatementsOctober 31, 2013(Expressed in thousands of Jamai an dollars unless otherwise stated)
2. Summary of significant accounting policies (continued)
(u) Employee benefits (continued)
(i) Pension obligations (continued)
A portion of actuarial gains and losses is recognised in profit or loss if the net cumulative unrecognised actuarial gains or losses at the end of the previous reporting period exceeded 10 percent of the greater of the present value of the gross defined benefit obligation and the fair value of plan assets at that date. Any excess actuarial gains or losses are deferred and recognised in profit or loss over the average remaining service lives of the participating employees.
Contributions to the defined contribution plan are charged to the statement of revenue and expenses in the period to which it relates.
(ii) Termination benefits
Termination benefits are payable whenever an employee’s service is terminated before the normal retirement date or whenever an employee accepts voluntary redundancy in exchange for these benefits. The Group recognises termination benefits when it is demonstrably committed to either terminate the services of current employees according to a detailed formal plan without the possibility of withdrawal or to provide termination benefits as a result of an offer made to encourage voluntary redundancy. Benefits falling due more than twelve months after the financial year end are discounted to present value.
(iii) Other post-retirement obligations
The Group also provides supplementary health, dental and life insurance benefits to qualifying employees upon retirement. The entitlement to these benefits is usually based on the completion of a minimum service period and the employee remaining in service up to retirement age. The expected costs of these benefits are accrued over the period of employment, using an accounting methodology similar to that for defined benefit pension plans. These obligations are valued annually by qualified independent actuaries.
(iv) Equity compensation benefits
The Group has two Employee Share Ownership Plans (ESOPs) for eligible employees. In the case of the first, the Group provides a fixed benefit to each participant, which is linked to the number of years of service. This benefit is recorded in salaries and staff benefits in profit or loss.
The amount contributed to the ESOP trust (note 52) by the Group for acquiring shares and allocating them to employees is recognised as an employee expense at the time of making the contribution, as the effect of recognising it over the two-year period in which the employees become unconditionally entitled to the shares, is not considered material. Further, the effect of forfeitures is not considered material.
93Scotia Group Jamaica Limited 2013 Annual Report 93Scotia Group Jamaica Limited 2013 Annual Report
SCOTIA GROUP JAMAICA LIMITED Notes to the Financial StatementsOctober 31, 2013(Expressed in thousands of Jamai an dollars unless otherwise stated)
2. Summary of significant accounting policies (continued)
(u) Employee benefits (continued) (iv) Equity compensation benefits (continued)
The special purpose entity that operates the Plan has not been consolidated as the effect of doing so is not considered material.
In the case of the second, the Group provides a fixed benefit to eligible employees, after one full year of service. This benefit is recorded in salaries and staff benefits expense in profit or loss.
The amount contributed to the ESOP trust (note 52) by the Group for acquiring shares and allocating them to employees is recognised as an employee expense at the time of making the contribution. The special purpose entity that operates the Plan has been consolidated.
(v) Annual leave
Employee entitlements to annual leave are recognized when they accrue to employees. A provision is made for the estimated liability for annual leave as a result of services rendered by employees up to the year end.
(v) Borrowings
Borrowings are recognised initially at fair value, being their issue proceeds (fair value of consideration received) net of transaction costs incurred. Borrowings are subsequently stated at amortised cost. Any difference between proceeds, net of transaction costs, and the redemption value is recognised in the statement of revenue and expenses immediately, as they are not considered material for deferral.
(w) Share capital
(i) Classification
Ordinary shares are classified as equity when there is no obligation to transfer cash or other assets.
Preference share capital is classified as equity except where it is redeemable on a specific or determinable date or at the option of the shareholders and/or if dividend payments are not discretionary, in which case it is classified as a liability.
(ii) Share issue costs
Incremental costs directly attributable to the issue of new shares or to the acquisition of a business are shown in equity as a deduction, net of tax, from the proceeds.
(iii) Dividends
Dividends on ordinary shares are recognized in stockholder’s equity in the period in which they are approved by the Board of Directors, thereby becoming irrevocably payable.
Scotia Group Jamaica Limited 2013 Annual Report 94 Scotia Group Jamaica Limited 2013 Annual Report 94
SCOTIA GROUP JAMAICA LIMITED Notes to the Financial StatementsOctober 31, 2013(Expressed in thousands of Jamai an dollars unless otherwise stated)
2. Summary of significant accounting policies (continued)
(w) Share capital (continued)
(iii) Dividends (continued)
Dividend payments on preference shares classified as a liability are recognized in the statement of revenue and expenses as interest expense.
(x) Fiduciary activities
The Group commonly acts as trustee and in other fiduciary capacities that result in the holding or placing of assets on behalf of individuals, trusts, retirement benefit plans and other institutions. These assets, and income arising thereon, are excluded from these financial statements, as they are not assets or income of the Group.
(y) Cash and cash equivalents
For the purpose of the cash flow statement, cash and cash equivalents include notes and coins on hand, unrestricted balances held with Bank of Jamaica, amounts due from other banks, and highly liquid financial assets with original maturities of less than ninety days, which are readily convertible to known amounts of cash, and are subject to insignificant risk of changes in their fair value.
(z) Impairment of non-financial assets
The carrying amounts of the Group’s non-financial assets, are reviewed at each reporting date to determine whether there is any indication of impairment. If any such indication exists then the asset’s recoverable amount is estimated. The recoverable amount of goodwill is estimated at each reporting date. An impairment loss is recognised if the carrying amount of an asset or its cash-generating unit exceeds its recoverable amount. A cash-generating unit is the smallest identifiable asset group that generates cash flows that are largely independent from other assets and groups. Impairment losses are recognised in profit or loss.
Impairment
losses recognised in respect of cash-generating units are allocated first to reduce the carrying amount of any goodwill allocated to the units and then to reduce the carrying amount of the other assets in the unit (group of units) on a pro rata basis.
The recoverable amount of an asset or cash-generating unit is the greater of its value in use and its fair value less costs to sell. In assessing value in use, the estimated future cash flows are discounted to their present value using a pre-tax discount rate that reflects current market assessments of the time value of money and the risks specific to the asset.
95Scotia Group Jamaica Limited 2013 Annual Report 95Scotia Group Jamaica Limited 2013 Annual Report
SCOTIA GROUP JAMAICA LIMITED Notes to the Financial StatementsOctober 31, 2013(Expressed in thousands of Jamai an dollars unless otherwise stated)
2. Summary of significant accounting policies (continued)
(z) Impairment of non-financial assets (continued)
An impairment loss in respect of goodwill is not reversed. In respect of other assets, impairment losses recognised in prior periods are assessed at each reporting date for any indications that the loss has decreased or no longer exists. An impairment loss is reversed if there has been a change in the estimates used to determine the recoverable amount. An impairment loss is reversed only to the extent that the asset’s carrying amount does not exceed the carrying amount that would have been determined, net of depreciation or amortisation, if no impairment loss had been recognised.
3. Critical accounting estimates, and judgements made in applying accounting policies
The Group makes estimates, assumptions and judgements that affect the reported amounts of, and disclosures relating to, assets, liabilities, income and expenses reported in these financial statements. Amounts and disclosures based on these estimates assumptions and judgements may be different from actual outcomes, and these differences may be reported in the financial statements of the next financial year. Estimates and judgements are based on historical experience and other factors, including expectations of future events that are believed to be reasonable under the circumstances, and are continually evaluated. (i) Impairment losses on loans and advances
The Group reviews its loan portfolios to assess impairment at least on a quarterly basis. In determining whether an impairment loss should be recorded, the Group makes judgements as to whether there is any observable data indicating that there is a measurable decrease in the estimated future cash flows from a portfolio of loans before the decrease can be identified with an individual loan in that portfolio. This evidence may include observable data indicating that there has been an adverse change in the payment status of borrowers in a group, or national or local economic conditions that correlate with defaults on assets in the Group. Management uses estimates based on historical loss experience for assets with credit risk characteristics and objective evidence of impairment similar to those in the portfolio when estimating its future cash flows. The methodology and assumptions used for estimating both the amount and timing of future cash flows are reviewed regularly to reduce any differences between loss estimates and actual loss experience.
(ii) Income taxes
Estimates and judgements are required in determining the provision for income taxes. The tax liability or asset arising from certain transactions or events may be uncertain during the ordinary course of business. In cases of such uncertainty, the Group recognises liabilities for possible additional taxes based on its judgement. Where, on the basis of a subsequent determination, the final tax outcome in relation to such matters is different from the amount that was initially recognised, the difference will impact the current and deferred income tax provisions in the period in which such determination is made.
Scotia Group Jamaica Limited 2013 Annual Report 96 Scotia Group Jamaica Limited 2013 Annual Report 96
SCOTIA GROUP JAMAICA LIMITED Notes to the Financial StatementsOctober 31, 2013(Expressed in thousands of Jamai an dollars unless otherwise stated)
3. Critical accounting estimates, and judgements made in applying accounting policies (continued)
(iii) Estimate of future payments and premiums arising from long-term insurance contracts
The liabilities under long-term insurance contracts have been determined using the Policy Premium Method of valuation, which is outlined in note 2 (k). The process of calculating policy liabilities necessarily involves the use of estimates concerning such factors as mortality and morbidity rates, future investment yields and future expense levels. Consequently, these liabilities include reasonable provisions for adverse deviations from the estimates. Estimates are also made as to future investment income arising from the assets backing long-term insurance contracts. These estimates are based on current market returns as well as expectations about future economic and financial developments. These estimates are more fully described in note 36(c).
(iv) Pension and other post-employment benefits The cost of these benefits and the present value of the pension and the other post-
employment liabilities depend on a number of factors that are determined on an actuarial basis using a number of assumptions. The assumptions used in determining the net periodic cost/(income) for pension and other post-employment benefits include the expected long-term rate of return on the relevant plan assets, the discount rate and, in the case of the post-employment medical benefits, the expected rate of increase in medical costs. Any changes in these assumptions will impact the net periodic cost/(income) recorded for pension and post-employment benefits and may affect planned funding of the pension plans. The expected return on plan assets assumption is determined on a uniform basis, considering long-term historical returns, asset allocation and future estimates of long-term investments returns. The Group determines the appropriate discount rate at the end of each year; such rate represents the interest rate that should be used to determine the present value of estimated future cash outflows expected to be required to settle the pension and post-retirement benefit obligations. In determining the appropriate discount rate, the Group considers interest rate of high-quality corporate bonds that are denominated in the currency in which the benefits will be paid, and that have terms to maturity approximating the terms of the related pension liability. The expected rate of increase of medical costs has been determined by comparing the historical relationship of the actual medical cost increases with the rate of inflation. Past experience has shown that the actual medical costs have increased on average by the rate of inflation. Other key assumptions for the pension and other post-employment benefit cost and credit are based, in part, on current market conditions. Were the actual expected return on pension plan assets to differ by 1% from management’s estimates, there would be no material impact on the consolidated profit for the year. Similarly, were the actual discount rate used at the beginning of the fiscal year, to differ by 1% from management’s estimates the pension costs would increase by $4,357,000 or decrease by $4,599,000. Were the assumed medical inflation rate on the health plan to differ by 1% from management estimates, the health expense would increase by $176,000 or decrease by $131,000.
97Scotia Group Jamaica Limited 2013 Annual Report 97Scotia Group Jamaica Limited 2013 Annual Report
SCOTIA GROUP JAMAICA LIMITED Notes to the Financial StatementsOctober 31, 2013(Expressed in thousands of Jamai an dollars unless otherwise stated)
3. Critical accounting estimates, and judgements made in applying accounting policies (continued)
(v) Recognition and measurement of intangible assets
The recognition and measurement of intangible assets, other than goodwill, in a business combination, involve the utilization of valuation techniques. These intangibles may be market related, consumer related, contract based or technology based.
For significant amounts of intangibles arising from a business combination, the Group has utilized independent professional advisors to assist management in determining the recognition and measurement of these assets.
(vi) Valuation of financial instruments
Fair values of financial assets and financial liabilities that are traded in active markets are based on quoted market prices or dealer price quotations. For all other financial instruments, the Group determines fair values using valuation techniques. Valuation techniques include net present value and discounted cash flow models, comparison to similar instruments for which market observable prices exist and other valuation models. Assumptions and inputs used in valuation techniques include risk-free and benchmark interest rates, credit spreads and other premia used in estimating discount rates. Considerable judgment is required in interpreting market data to arrive at estimates of fair values. Consequently, the estimates arrived at may be significantly different from the actual price of the instrument in an arm’s length transaction.
4. Responsibilities of the appointed actuary and external auditors
The Board of Directors, pursuant to the Insurance Act, appoints the Actuary, whose responsibility is to carry out an annual valuation of the Group’s insurance policyholders’ liabilities in accordance with accepted actuarial practice and regulatory requirements and report thereon to the policyholders and stockholders. In performing the valuation, the Actuary makes assumptions as to the future rates of interest, asset defaults, mortality, morbidity, claims experience, policy termination, inflation, reinsurance recoveries, expenses and other contingencies, taking into consideration the circumstances of the Group and the insurance policies in force. An actuarial valuation is prepared annually.
The shareholders, pursuant to the Companies Act, appoint the external auditors. Their responsibility is to conduct an independent audit of the financial statements in accordance with International Standards on Auditing and report thereon to the stockholders. In carrying out their audit, the auditors make use of the work of the appointed Actuary and his report on the policyholders’ liabilities.
Scotia Group Jamaica Limited 2013 Annual Report 98 Scotia Group Jamaica Limited 2013 Annual Report 98
SCOTIA GROUP JAMAICA LIMITED Notes to the Financial StatementsOctober 31, 2013(Expressed in thousands of Jamai an dollars unless otherwise stated)
5. Segmental nancial information
The Group is organised into six main business segments:
(a) Retail Banking - incorporating personal banking services, personal deposit accounts, credit and debit cards, consumer loans and mortgages and microfinance;
(b) Corporate and Commercial Banking - incorporating non-personal direct debit facilities,
current accounts, deposits, overdrafts, loans and other credit facilities, and foreign currency activities;
(c) Treasury - incorporating the Group’s liquidity and investment management function,
management of correspondent bank relationships, as well as foreign currency activities;
(d) Investment Management Services — incorporating investments, unit trusts, pension and other fund management, brokerage and advisory services, and the administration of trust accounts;
(e) Insurance Services - incorporating the provision of life and medical insurance, individual
pension administration and annuities;
(f) Other operations of the Group – comprising the parent company and non-trading subsidiaries.
Transactions between the business segments are on normal commercial terms and conditions. Segment assets and liabilities comprise operating assets and liabilities, being the majority of items on the statement of financial position, but exclude items such as taxation, retirement benefits asset and obligation and borrowings. The Group’s operations are located mainly in Jamaica. The operations of subsidiaries located overseas represents less than 10% of the Group’s operating revenue and assets.
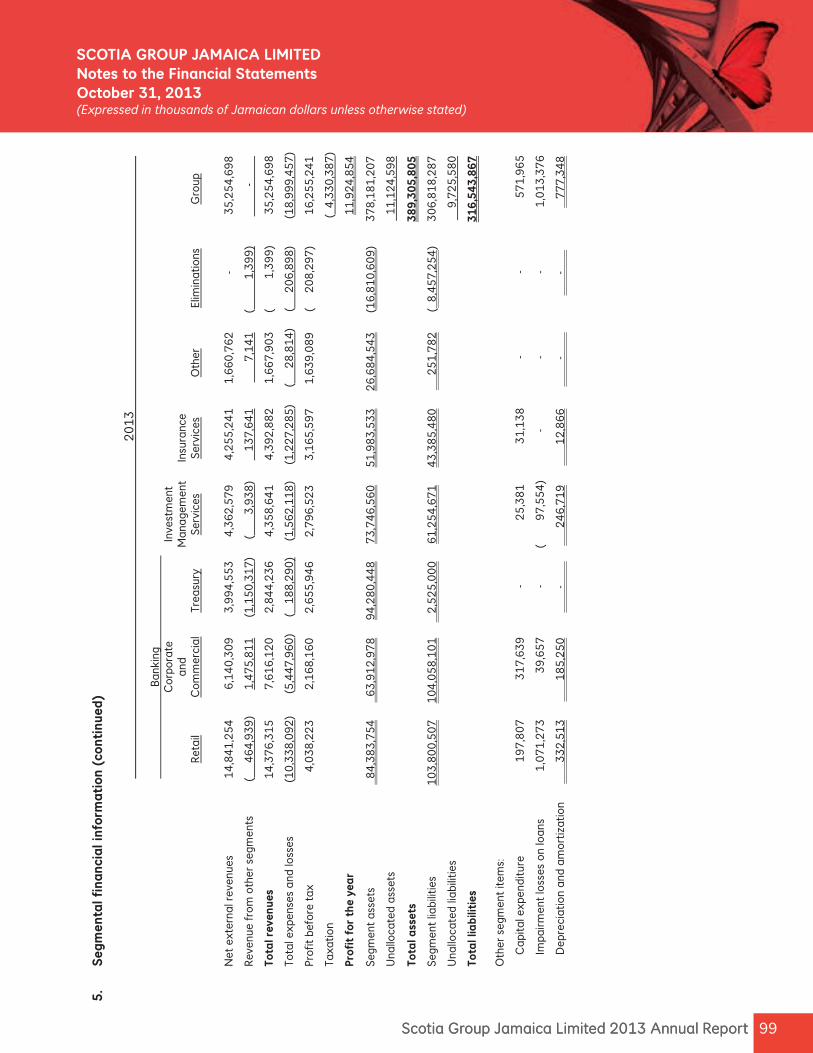
99Scotia Group Jamaica Limited 2013 Annual Report 99Scotia Group Jamaica Limited 2013 Annual Report
SCOTIA GROUP JAMAICA LIMITED Notes to the Financial StatementsOctober 31, 2013(Expressed in thousands of Jamai an dollars unless otherwise stated)
5.
Seg
men
tal f
ina
ncia
l inf
orm
ati
on (
cont
inue
d)
2
01
3
B
anki
ng
Cor
pora
te
In
vest
men
t
and
M
anag
emen
t In
sura
nce
Ret
ail
Com
mer
cial
Tr
easu
ry
Serv
ices
Se
rvic
es
Oth
er
Elim
inat
ions
G
roup
Net
ext
erna
l rev
enue
s 1
4,8
41
,25
4
6,1
40
,30
9
3,9
94
,55
3
4,3
62
,57
9
4,2
55
,24
1
1,6
60
,76
2
-
35
,25
4,6
98
R
even
ue f
rom
oth
er s
egm
ents
(
4
64
,93
9)
1,4
75
,81
1
(1,1
50
,31
7)
(
3
,93
8)
1
37
,64
1
7,1
41
(
1
,39
9)
-
To
tal r
even
ues
1
4,3
76
,31
5
7,6
16
,12
0
2,8
44
,23
6
4,3
58
,64
1
4,3
92
,88
2
1,6
67
,90
3
(
1,3
99
) 3
5,2
54
,69
8
To
tal e
xpen
ses
and
loss
es
(10
,33
8,0
92
) (5
,44
7,9
60
) (
18
8,2
90
) (1
,56
2,1
18
) (1
,22
7,2
85
) (
2
8,8
14
) (
2
06
,89
8)
(18
,99
9,4
57
)
Pr
ofit
befo
re t
ax
4,0
38
,22
3
2,1
68
,16
0
2,6
55
,94
6
2,7
96
,52
3
3,1
65
,59
7
1,6
39
,08
9
(
20
8,2
97
) 1
6,2
55
,24
1
Ta
xatio
n
( 4
,33
0,3
87
)
Pr
ofit
for
th
e ye
ar
1
1,9
24
,85
4
Se
gmen
t as
sets
8
4,3
83
,75
4
63
,91
2,9
78
9
4,2
80
,44
8
73
,74
6,5
60
5
1,9
83
,53
3
26
,68
4,5
43
(1
6,8
10
,60
9)
37
8,1
81
,20
7
U
nallo
cate
d as
sets
11
,12
4,5
98
Tota
l ass
ets
3
89
,30
5,8
05
Se
gmen
t lia
bilit
ies
10
3,8
00
,50
7
10
4,0
58
,10
1
2
,52
5,0
00
6
1,2
54
,67
1
43
,38
5,4
80
25
1,7
82
(
8,4
57
,25
4)
30
6,8
18
,28
7
U
nallo
cate
d lia
bilit
ies
9,7
25
,58
0
To
tal l
iab
iliti
es
3
16
,54
3,8
67
Oth
er s
egm
ent
item
s:
Cap
ital e
xpen
ditu
re
19
7,8
07
3
17
,63
9
-
25
,38
1
31
,13
8
-
-
57
1,9
65
Impa
irm
ent
loss
es o
n lo
ans
1,0
71
,27
3
39
,65
7
-
(
9
7,5
54
) -
-
-
1
,01
3,3
76
Dep
reci
atio
n an
d am
ortiz
atio
n
3
32
,51
3
1
85
,25
0
-
24
6,7
19
1
2,8
66
-
-
7
77
,34
8
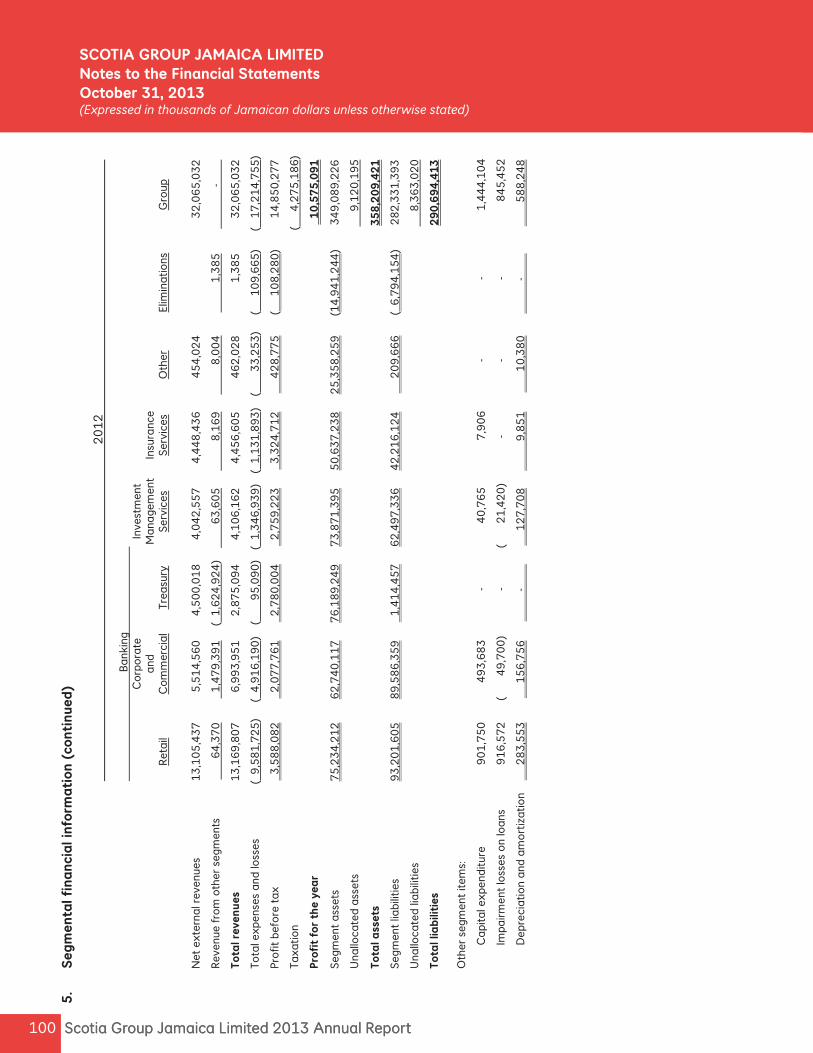
Scotia Group Jamaica Limited 2013 Annual Report 100 Scotia Group Jamaica Limited 2013 Annual Report 100
SCOTIA GROUP JAMAICA LIMITED Notes to the Financial StatementsOctober 31, 2013(Expressed in thousands of Jamai an dollars unless otherwise stated)
5.
Seg
men
tal f
ina
ncia
l inf
orm
ati
on (
cont
inue
d)
2
01
2
B
ank
ing
Co
rpo
rate
Inve
stm
ent
a
nd
M
ana
gem
ent
Insu
ranc
e
R
eta
il C
om
mer
cia
l Tr
easu
ry
Serv
ices
Se
rvic
es
Oth
er
Elim
ina
tio
ns
Gro
up
N
et e
xter
nal r
even
ues
13
,10
5,4
37
5
,51
4,5
60
4
,50
0,0
18
4
,04
2,5
57
4
,44
8,4
36
4
54
,02
4
3
2,0
65
,03
2
R
even
ue f
rom
oth
er s
egm
ents
6
4,3
70
1
,47
9,3
91
(
1,6
24
,92
4)
63
,60
5
8
,16
9
8
,00
4
1
,38
5
-
T
ota
l rev
enu
es
13
,16
9,8
07
6
,99
3,9
51
2
,87
5,0
94
4
,10
6,1
62
4
,45
6,6
05
4
62
,02
8
1,3
85
3
2,0
65
,03
2
To
tal e
xpen
ses
and
loss
es
( 9
,58
1,7
25
) (
4,9
16
,19
0)
(
9
5,0
90
) (
1,3
46
,93
9)
( 1
,13
1,8
93
) (
33
,25
3)
(
10
9,6
65
) (
17
,21
4,7
55
)
Pr
ofit
bef
ore
ta
x 3
,58
8,0
82
2
,07
7,7
61
2
,78
0,0
04
2
,75
9,2
23
3
,32
4,7
12
42
8,7
75
(
1
08
,28
0)
14
,85
0,2
77
Ta
xati
on
(
4
,27
5,1
86
)
P
rofi
t fo
r th
e ye
ar
1
0,5
75
,09
1
Se
gmen
t a
sset
s 7
5,2
34
,21
2
62
,74
0,1
17
7
6,1
89
,24
9
73
,87
1,3
95
5
0,6
37
,23
8
25
,35
8,2
59
(1
4,9
41
,24
4)
34
9,0
89
,22
6
U
nallo
cate
d a
sset
s
9
,12
0,1
95
Tota
l ass
ets
3
58
,20
9,4
21
Se
gmen
t lia
bilit
ies
93
,20
1,6
05
8
9,5
86
,35
9
1,4
14
,45
7
62
,49
7,3
36
4
2,2
16
,12
4
2
09
,66
6
( 6
,79
4,1
54
) 2
82
,33
1,3
93
U
nallo
cate
d li
abi
litie
s
8
,36
3,0
20
T
ota
l lia
bili
ties
29
0,6
94
,41
3
O
ther
seg
men
t ite
ms:
Ca
pita
l exp
end
itur
e 9
01
,75
0
49
3,6
83
-
4
0,7
65
7
,90
6
-
-
1,4
44
,10
4
Impa
irm
ent
loss
es o
n lo
ans
9
16
,57
2
(
4
9,7
00
) -
(
21
,42
0)
-
-
-
84
5,4
52
Dep
reci
ati
on
and
am
ort
iza
tio
n
28
3,5
53
1
56
,75
6
-
12
7,7
08
9,8
51
1
0,3
80
-
58
8,2
48
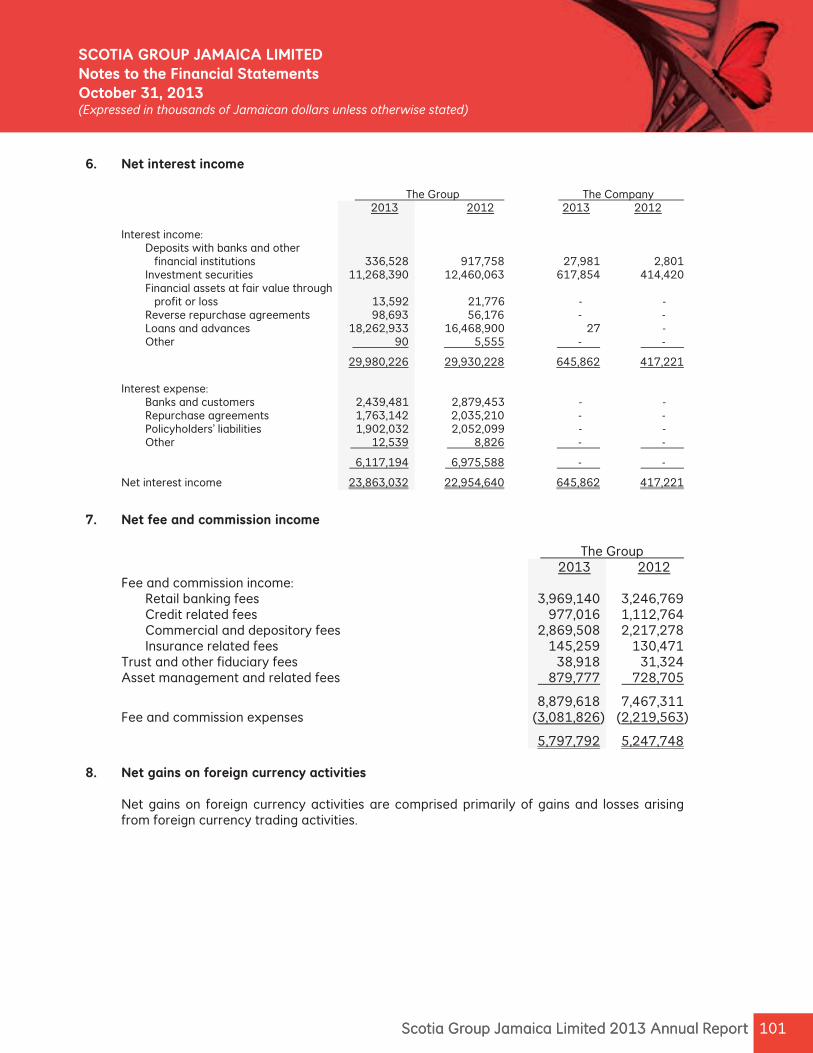
101Scotia Group Jamaica Limited 2013 Annual Report 101Scotia Group Jamaica Limited 2013 Annual Report
SCOTIA GROUP JAMAICA LIMITED Notes to the Financial StatementsOctober 31, 2013(Expressed in thousands of Jamai an dollars unless otherwise stated)
6. Net interest income The Group The Company 2013 2012 2013 2012 Interest income: Deposits with banks and other financial institutions 336,528 917,758 27,981 2,801 Investment securities 11,268,390 12,460,063 617,854 414,420 Financial assets at fair value through profit or loss 13,592 21,776 - - Reverse repurchase agreements 98,693 56,176 - - Loans and advances 18,262,933 16,468,900 27 - Other 90 5,555 - -
29,980,226 29,930,228 645,862 417,221
Interest expense: Banks and customers 2,439,481 2,879,453 - - Repurchase agreements 1,763,142 2,035,210 - - Policyholders’ liabilities 1,902,032 2,052,099 - - Other 12,539 8,826 - -
6,117,194 6,975,588 - -
Net interest income 23,863,032 22,954,640 645,862 417,221
7. Net fee and commission income The Group 2013 2012 Fee and commission income:
Retail banking fees 3,969,140 3,246,769 Credit related fees 977,016 1,112,764 Commercial and depository fees 2,869,508 2,217,278 Insurance related fees 145,259 130,471 Trust and other fiduciary fees 38,918 31,324 Asset management and related fees 879,777 728,705
8,879,618 7,467,311 Fee and commission expenses (3,081,826) (2,219,563)
5,797,792 5,247,748 8. Net gains on foreign currency activities Net gains on foreign currency activities are comprised primarily of gains and losses arising
from foreign currency trading activities.
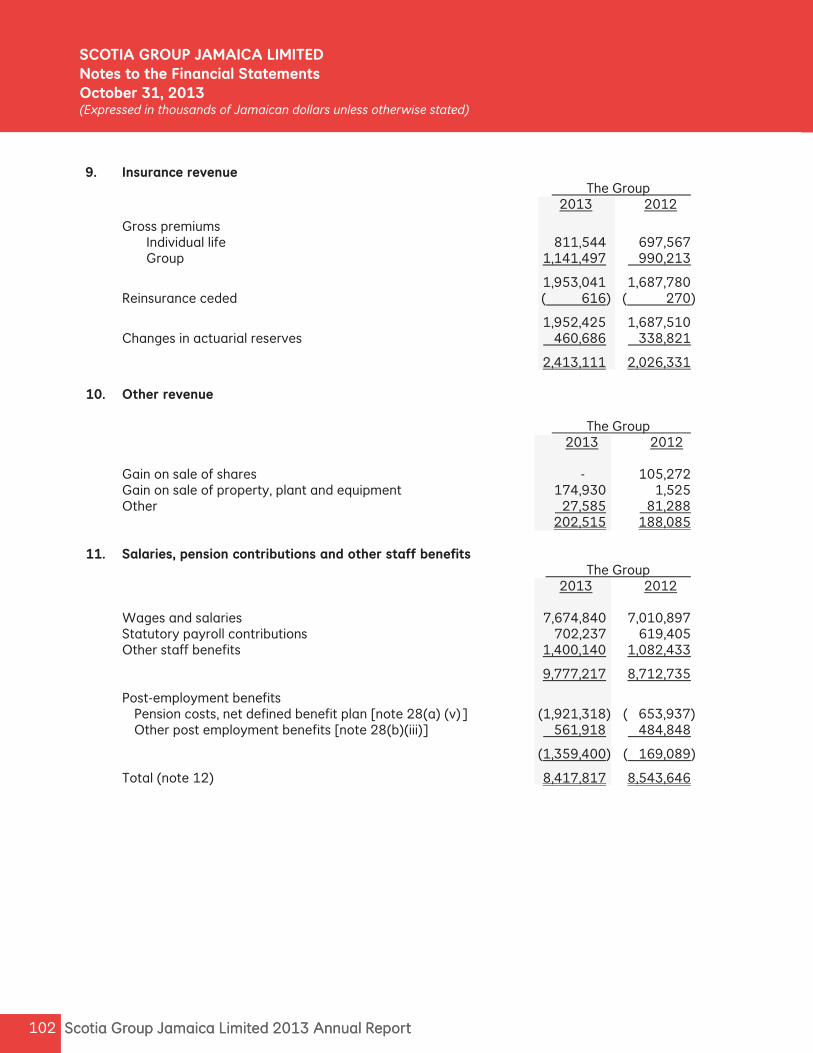
Scotia Group Jamaica Limited 2013 Annual Report 102 Scotia Group Jamaica Limited 2013 Annual Report 102
SCOTIA GROUP JAMAICA LIMITED Notes to the Financial StatementsOctober 31, 2013(Expressed in thousands of Jamai an dollars unless otherwise stated)
9. Insurance revenue The Group
2013 2012
Gross premiums Individual life 811,544 697,567 Group 1,141,497 990,213
1,953,041 1,687,780 Reinsurance ceded ( 616) ( 270)
1,952,425 1,687,510 Changes in actuarial reserves 460,686 338,821
2,413,111 2,026,331 10. Other revenue The Group
2013 2012 Gain on sale of shares - 105,272 Gain on sale of property, plant and equipment 174,930 1,525 Other 27,585 81,288 202,515 188,085 11. Salaries, pension contributions and other staff bene ts The Group 2013 2012 Wages and salaries 7,674,840 7,010,897 Statutory payroll contributions 702,237 619,405 Other staff bene ts 1,400,140 1,082,433
9,777,217 8,712,735
Post-employment bene ts Pension costs, net de ned bene t plan [note 28(a) (v)] (1,921,318) ( 653,937) Other post employment bene ts [note 28(b)(iii)] 561,918 484,848
(1,359,400) ( 169,089)
Total (note 12) 8,417,817 8,543,646
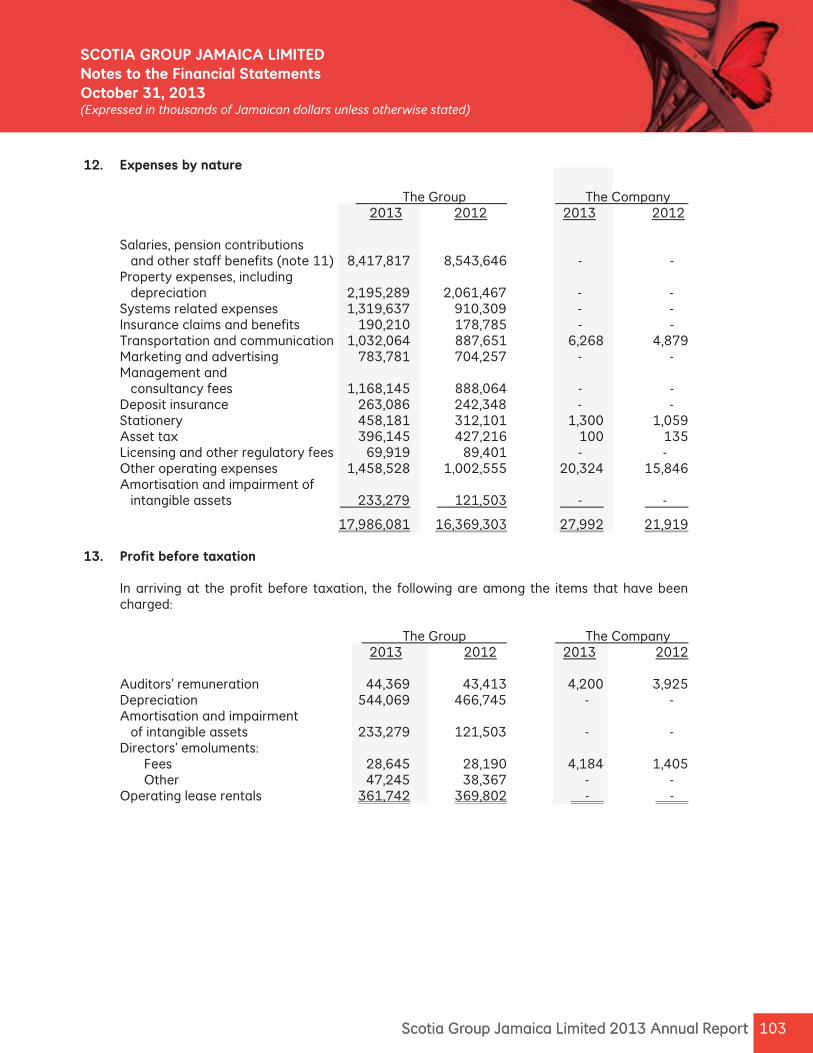
103Scotia Group Jamaica Limited 2013 Annual Report 103Scotia Group Jamaica Limited 2013 Annual Report
SCOTIA GROUP JAMAICA LIMITED Notes to the Financial StatementsOctober 31, 2013(Expressed in thousands of Jamai an dollars unless otherwise stated)
12. Expenses by nature The Group The Company 2013 2012 2013 2012 Salaries, pension contributions and other staff benefits (note 11) 8,417,817 8,543,646 - - Property expenses, including depreciation 2,195,289 2,061,467 - - Systems related expenses 1,319,637 910,309 - - Insurance claims and benefits 190,210 178,785 - - Transportation and communication 1,032,064 887,651 6,268 4,879 Marketing and advertising 783,781 704,257 - - Management and consultancy fees 1,168,145 888,064 - - Deposit insurance 263,086 242,348 - - Stationery 458,181 312,101 1,300 1,059 Asset tax 396,145 427,216 100 135 Licensing and other regulatory fees 69,919 89,401 - - Other operating expenses 1,458,528 1,002,555 20,324 15,846 Amortisation and impairment of intangible assets 233,279 121,503 - -
17,986,081 16,369,303 27,992 21,919 13. Profit before taxation In arriving at the profit before taxation, the following are among the items that have been
charged: The Group The Company 2013 2012 2013 2012 Auditors’ remuneration 44,369 43,413 4,200 3,925 Depreciation 544,069 466,745 - - Amortisation and impairment of intangible assets 233,279 121,503 - - Directors’ emoluments: Fees 28,645 28,190 4,184 1,405 Other 47,245 38,367 - - Operating lease rentals 361,742 369,802 - -
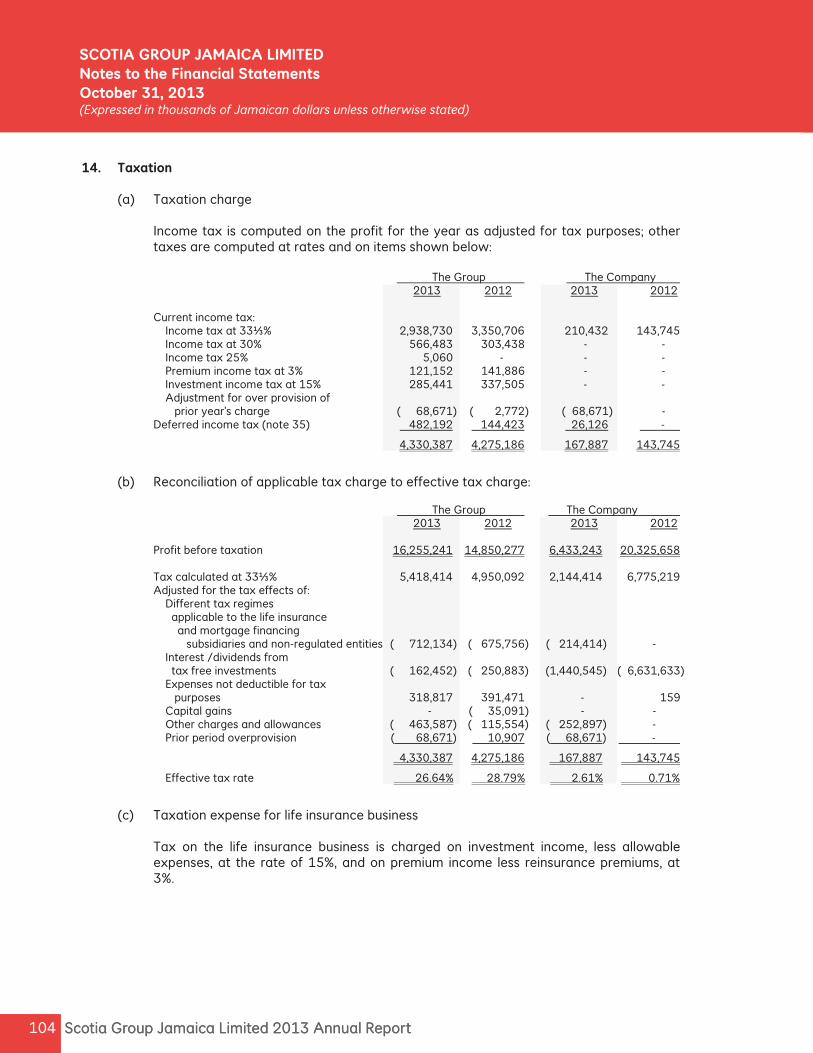
Scotia Group Jamaica Limited 2013 Annual Report 104 Scotia Group Jamaica Limited 2013 Annual Report 104
SCOTIA GROUP JAMAICA LIMITED Notes to the Financial StatementsOctober 31, 2013(Expressed in thousands of Jamai an dollars unless otherwise stated)
14. Taxation
(a) Taxation charge Income tax is computed on the profit for the year as adjusted for tax purposes; other
taxes are computed at rates and on items shown below:
The Group The Company 2013 2012 2013 2012 Current income tax:
Income tax at 33⅓% 2,938,730 3,350,706 210,432 143,745 Income tax at 30% 566,483 303,438 - - Income tax 25% 5,060 - - - Premium income tax at 3% 121,152 141,886 - - Investment income tax at 15% 285,441 337,505 - - Adjustment for over provision of prior year’s charge ( 68,671) ( 2,772) ( 68,671) - Deferred income tax (note 35) 482,192 144,423 26,126 -
4,330,387 4,275,186 167,887 143,745
(b) Reconciliation of applicable tax charge to effective tax charge:
The Group The Company 2013 2012 2013 2012 Profit before taxation 16,255,241 14,850,277 6,433,243 20,325,658 Tax calculated at 33⅓% 5,418,414 4,950,092 2,144,414 6,775,219 Adjusted for the tax effects of:
Different tax regimes applicable to the life insurance and mortgage financing subsidiaries and non-regulated entities ( 712,134) ( 675,756) ( 214,414) - Interest /dividends from tax free investments ( 162,452) ( 250,883) (1,440,545) ( 6,631,633) Expenses not deductible for tax purposes 318,817 391,471 - 159 Capital gains - ( 35,091) - - Other charges and allowances ( 463,587) ( 115,554) ( 252,897) - Prior period overprovision ( 68,671) 10,907 ( 68,671) -
4,330,387 4,275,186 167,887 143,745
Effective tax rate 26.64% 28.79% 2.61% 0.71%
(c) Taxation expense for life insurance business Tax on the life insurance business is charged on investment income, less allowable
expenses, at the rate of 15%, and on premium income less reinsurance premiums, at 3%.
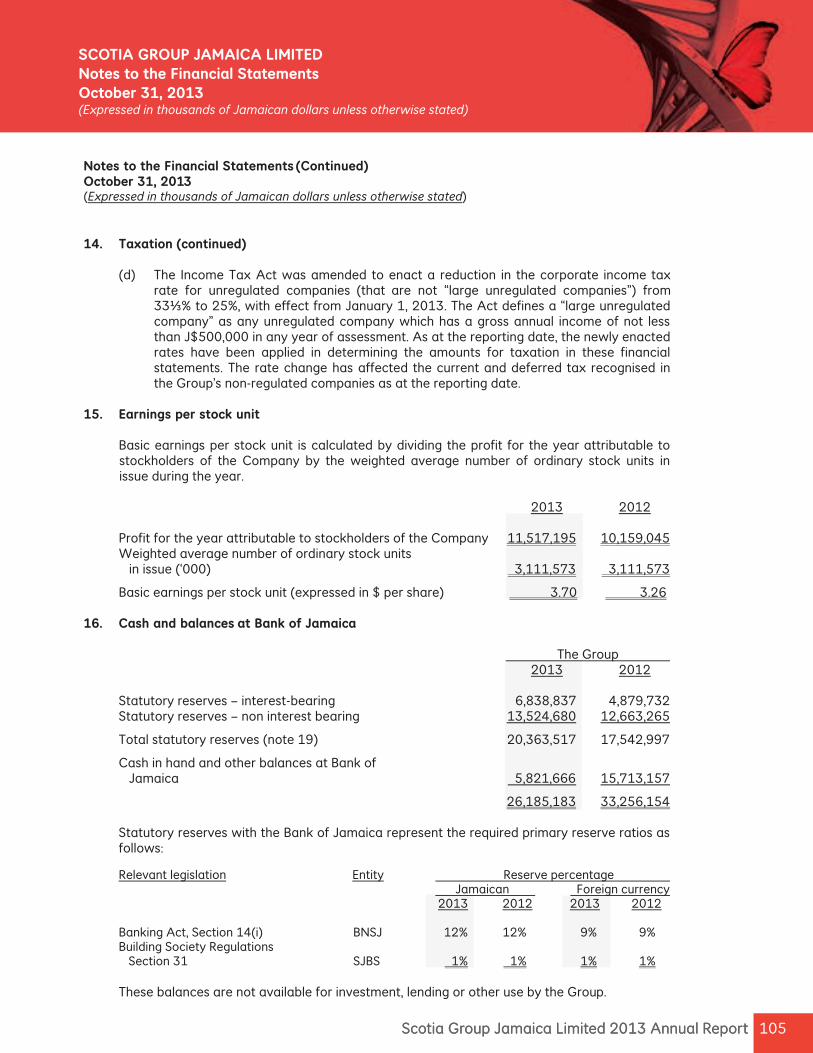
105Scotia Group Jamaica Limited 2013 Annual Report 105Scotia Group Jamaica Limited 2013 Annual Report
SCOTIA GROUP JAMAICA LIMITED Notes to the Financial StatementsOctober 31, 2013(Expressed in thousands of Jamai an dollars unless otherwise stated)
Notes to the Financial Statements (Continued) October 31, 2013 (Expressed in thousands of Jamaican dollars unless otherwise stated)
14. Taxation (continued)
(d) The Income Tax Act was amended to enact a reduction in the corporate income tax rate for unregulated companies (that are not “large unregulated companies”) from 33 % to 25%, with effect from January 1, 2013. The Act de nes a “large unregulated company” as any unregulated company which has a gross annual income of not less than J$500,000 in any year of assessment. As at the reporting date, the newly enacted rates have been applied in determining the amounts for taxation in these nancial statements. The rate change has affected the current and deferred tax recognised in the Group’s non-regulated companies as at the reporting date.
15. Earnings per stock unit Basic earnings per stock unit is calculated by dividing the pro t for the year attributable to
stockholders of the Company by the weighted average number of ordinary stock units in issue during the year.
2013 2012 Pro t for the year attributable to stockholders of the Company 11,517,195 10,159,045 Weighted average number of ordinary stock units in issue (‘000) 3,111,573 3,111,573
Basic earnings per stock unit (expressed in $ per share) 3.70 3.26 16. Cash and balances at Bank of Jamaica The Group 2013 2012 Statutory reserves – interest-bearing 6,838,837 4,879,732 Statutory reserves – non interest bearing 13,524,680 12,663,265
Total statutory reserves (note 19) 20,363,517 17,542,997
Cash in hand and other balances at Bank of Jamaica 5,821,666 15,713,157
26,185,183 33,256,154
Statutory reserves with the Bank of Jamaica represent the required primary reserve ratios as follows:
Relevant legislation Entity Reserve percentage Jamaican Foreign currency 2013 2012 2013 2012 Banking Act, Section 14(i) BNSJ 12% 12% 9% 9% Building Society Regulations Section 31 SJBS 1% 1% 1% 1%
These balances are not available for investment, lending or other use by the Group.
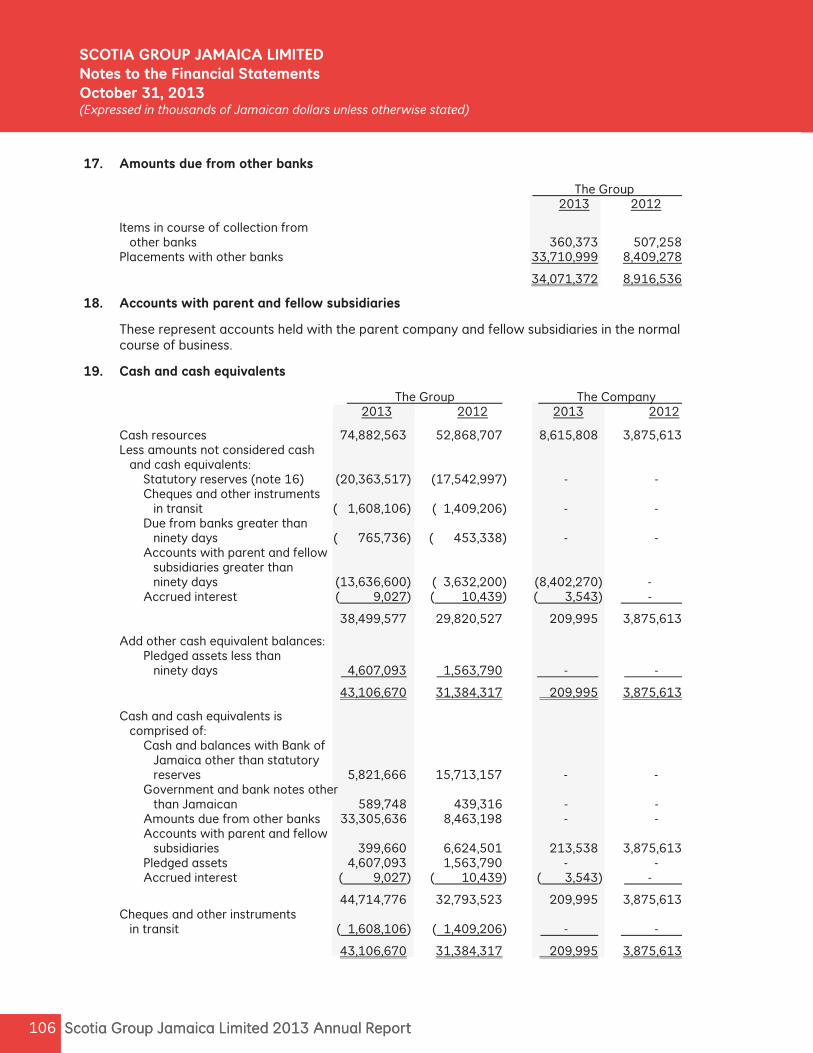
Scotia Group Jamaica Limited 2013 Annual Report 106 Scotia Group Jamaica Limited 2013 Annual Report 106
SCOTIA GROUP JAMAICA LIMITED Notes to the Financial StatementsOctober 31, 2013(Expressed in thousands of Jamai an dollars unless otherwise stated)
17. Amounts due from other banks
The Group 2013 2012
Items in course of collection from other banks 360,373 507,258 Placements with other banks 33,710,999 8,409,278
34,071,372 8,916,536
18. Accounts with parent and fellow subsidiaries
These represent accounts held with the parent company and fellow subsidiaries in the normal course of business.
19. Cash and cash equivalents
The Group The Company 2013 2012 2013 2012
Cash resources 74,882,563 52,868,707 8,615,808 3,875,613 Less amounts not considered cash and cash equivalents: Statutory reserves (note 16) (20,363,517) (17,542,997) - - Cheques and other instruments in transit ( 1,608,106) ( 1,409,206) - - Due from banks greater than ninety days ( 765,736) ( 453,338) - - Accounts with parent and fellow subsidiaries greater than ninety days (13,636,600) ( 3,632,200) (8,402,270) - Accrued interest ( 9,027) ( 10,439) ( 3,543) -
38,499,577 29,820,527 209,995 3,875,613
Add other cash equivalent balances: Pledged assets less than ninety days 4,607,093 1,563,790 - -
43,106,670 31,384,317 209,995 3,875,613
Cash and cash equivalents is comprised of: Cash and balances with Bank of Jamaica other than statutory reserves 5,821,666 15,713,157 - - Government and bank notes other than Jamaican 589,748 439,316 - - Amounts due from other banks 33,305,636 8,463,198 - - Accounts with parent and fellow subsidiaries 399,660 6,624,501 213,538 3,875,613 Pledged assets 4,607,093 1,563,790 - - Accrued interest ( 9,027) ( 10,439) ( 3,543) -
44,714,776 32,793,523 209,995 3,875,613 Cheques and other instruments in transit ( 1,608,106) ( 1,409,206) - -
43,106,670 31,384,317 209,995 3,875,613
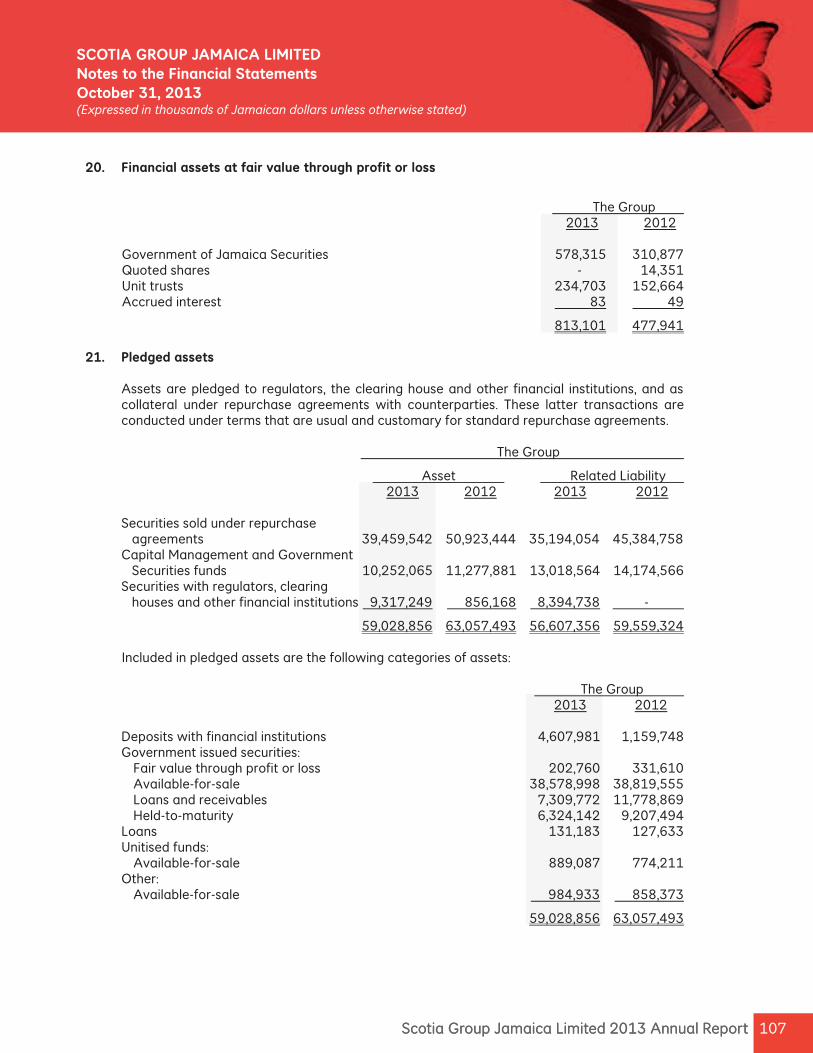
107Scotia Group Jamaica Limited 2013 Annual Report 107Scotia Group Jamaica Limited 2013 Annual Report
SCOTIA GROUP JAMAICA LIMITED Notes to the Financial StatementsOctober 31, 2013(Expressed in thousands of Jamai an dollars unless otherwise stated)
20. Financial assets at fair value through profit or loss
The Group 2013 2012
Government of Jamaica Securities 578,315 310,877 Quoted shares - 14,351 Unit trusts 234,703 152,664 Accrued interest 83 49
813,101 477,941
21. Pledged assets
Assets are pledged to regulators, the clearing house and other financial institutions, and as collateral under repurchase agreements with counterparties. These latter transactions are conducted under terms that are usual and customary for standard repurchase agreements.
The Group
Asset Related Liability 2013 2012 2013 2012
Securities sold under repurchase agreements 39,459,542 50,923,444 35,194,054 45,384,758 Capital Management and Government Securities funds 10,252,065 11,277,881 13,018,564 14,174,566 Securities with regulators, clearing houses and other financial institutions 9,317,249 856,168 8,394,738 -
59,028,856 63,057,493 56,607,356 59,559,324
Included in pledged assets are the following categories of assets:
The Group 2013 2012 Deposits with financial institutions 4,607,981 1,159,748 Government issued securities: Fair value through profit or loss 202,760 331,610 Available-for-sale 38,578,998 38,819,555 Loans and receivables 7,309,772 11,778,869 Held-to-maturity 6,324,142 9,207,494 Loans 131,183 127,633 Unitised funds: Available-for-sale 889,087 774,211 Other: Available-for-sale 984,933 858,373
59,028,856 63,057,493
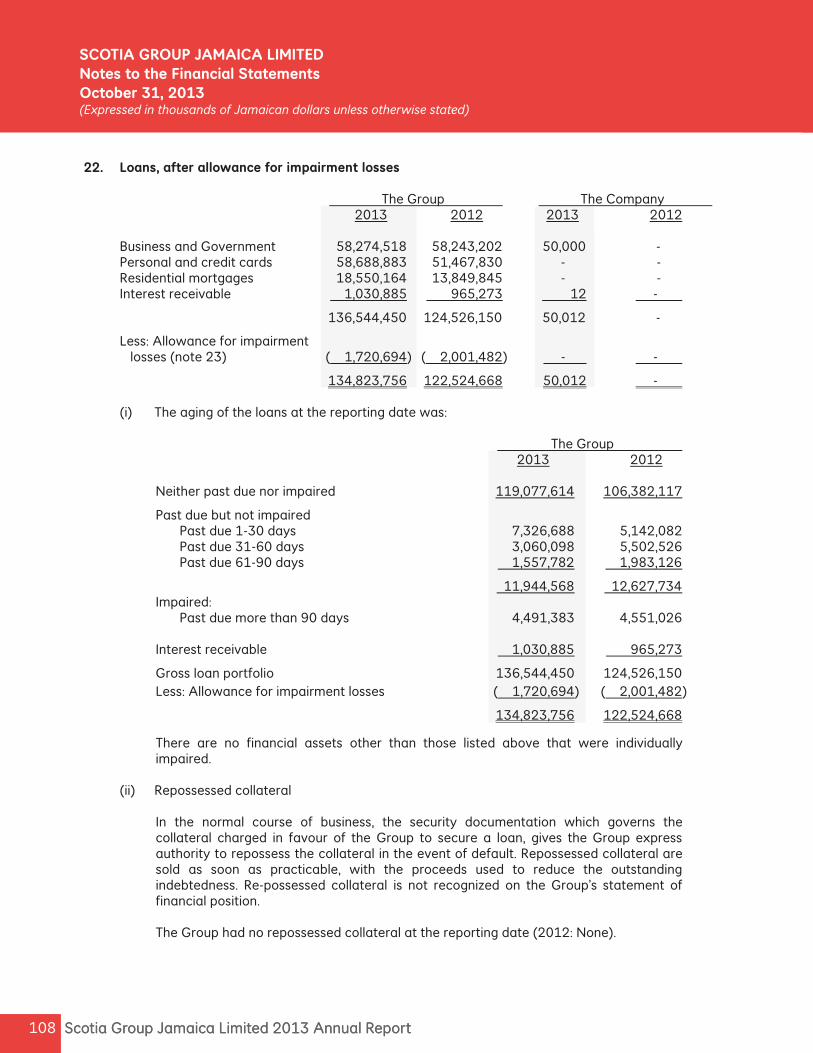
Scotia Group Jamaica Limited 2013 Annual Report 108 Scotia Group Jamaica Limited 2013 Annual Report 108
SCOTIA GROUP JAMAICA LIMITED Notes to the Financial StatementsOctober 31, 2013(Expressed in thousands of Jamai an dollars unless otherwise stated)
22. Loans, after allowance for impairment losses
The Group The Company 2013 2012 2013 2012 Business and Government 58,274,518 58,243,202 50,000 - Personal and credit cards 58,688,883 51,467,830 - - Residential mortgages 18,550,164 13,849,845 - - Interest receivable 1,030,885 965,273 12 -
136,544,450 124,526,150 50,012 - Less: Allowance for impairment losses (note 23) ( 1,720,694) ( 2,001,482) - -
134,823,756 122,524,668 50,012 -
(i) The aging of the loans at the reporting date was:
The Group 2013 2012
Neither past due nor impaired 119,077,614 106,382,117
Past due but not impaired Past due 1-30 days 7,326,688 5,142,082 Past due 31-60 days 3,060,098 5,502,526 Past due 61-90 days 1,557,782 1,983,126
11,944,568 12,627,734Impaired: Past due more than 90 days 4,491,383 4,551,026
Interest receivable 1,030,885 965,273
Gross loan portfolio 136,544,450 124,526,150 Less: Allowance for impairment losses ( 1,720,694) ( 2,001,482)
134,823,756 122,524,668
There are no financial assets other than those listed above that were individually impaired.
(ii) Repossessed collateral
In the normal course of business, the security documentation which governs the collateral charged in favour of the Group to secure a loan, gives the Group express authority to repossess the collateral in the event of default. Repossessed collateral are sold as soon as practicable, with the proceeds used to reduce the outstanding indebtedness. Re-possessed collateral is not recognized on the Group’s statement of financial position. The Group had no repossessed collateral at the reporting date (2012: None).
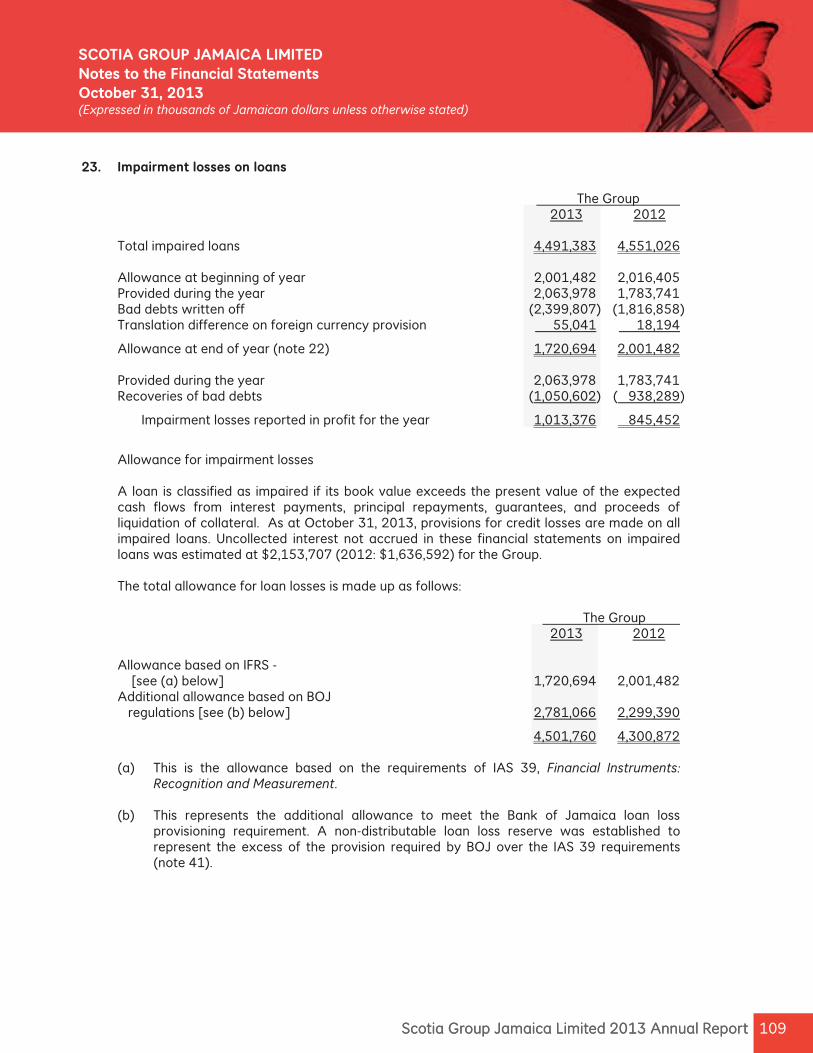
109Scotia Group Jamaica Limited 2013 Annual Report 109Scotia Group Jamaica Limited 2013 Annual Report
SCOTIA GROUP JAMAICA LIMITED Notes to the Financial StatementsOctober 31, 2013(Expressed in thousands of Jamai an dollars unless otherwise stated)
23. Impairment losses on loans
The Group 2013 2012 Total impaired loans 4,491,383 4,551,026 Allowance at beginning of year 2,001,482 2,016,405 Provided during the year 2,063,978 1,783,741 Bad debts written off (2,399,807) (1,816,858) Translation difference on foreign currency provision 55,041 18,194
Allowance at end of year (note 22) 1,720,694 2,001,482 Provided during the year 2,063,978 1,783,741 Recoveries of bad debts (1,050,602) ( 938,289)
Impairment losses reported in profit for the year 1,013,376 845,452
Allowance for impairment losses A loan is classified as impaired if its book value exceeds the present value of the expected cash flows from interest payments, principal repayments, guarantees, and proceeds of liquidation of collateral. As at October 31, 2013, provisions for credit losses are made on all impaired loans. Uncollected interest not accrued in these financial statements on impaired loans was estimated at $2,153,707 (2012: $1,636,592) for the Group. The total allowance for loan losses is made up as follows:
The Group 2013 2012 Allowance based on IFRS - [see (a) below] 1,720,694 2,001,482 Additional allowance based on BOJ regulations [see (b) below] 2,781,066 2,299,390
4,501,760 4,300,872
(a) This is the allowance based on the requirements of IAS 39, Financial Instruments: Recognition and Measurement.
(b) This represents the additional allowance to meet the Bank of Jamaica loan loss
provisioning requirement. A non-distributable loan loss reserve was established to represent the excess of the provision required by BOJ over the IAS 39 requirements (note 41).
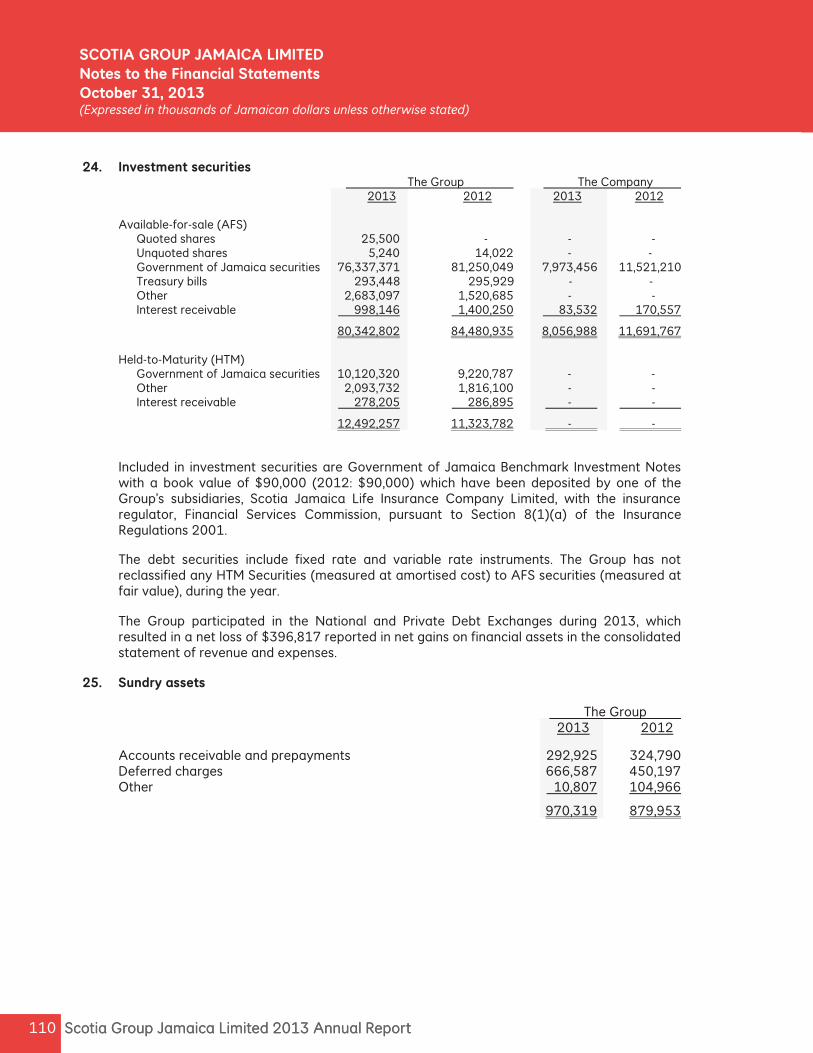
Scotia Group Jamaica Limited 2013 Annual Report 110 Scotia Group Jamaica Limited 2013 Annual Report 110
SCOTIA GROUP JAMAICA LIMITED Notes to the Financial StatementsOctober 31, 2013(Expressed in thousands of Jamai an dollars unless otherwise stated)
24. Investment securities The Group The Company 2013 2012 2013 2012 Available-for-sale (AFS)
Quoted shares 25,500 - - - Unquoted shares 5,240 14,022 - - Government of Jamaica securities 76,337,371 81,250,049 7,973,456 11,521,210 Treasury bills 293,448 295,929 - - Other 2,683,097 1,520,685 - - Interest receivable 998,146 1,400,250 83,532 170,557
80,342,802 84,480,935 8,056,988 11,691,767 Held-to-Maturity (HTM)
Government of Jamaica securities 10,120,320 9,220,787 - - Other 2,093,732 1,816,100 - - Interest receivable 278,205 286,895 - -
12,492,257 11,323,782 - - Included in investment securities are Government of Jamaica Benchmark Investment Notes with a book value of $90,000 (2012: $90,000) which have been deposited by one of the Group’s subsidiaries, Scotia Jamaica Life Insurance Company Limited, with the insurance regulator, Financial Services Commission, pursuant to Section 8(1)(a) of the Insurance Regulations 2001.
The debt securities include fixed rate and variable rate instruments. The Group has not reclassified any HTM Securities (measured at amortised cost) to AFS securities (measured at fair value), during the year. The Group participated in the National and Private Debt Exchanges during 2013, which resulted in a net loss of $396,817 reported in net gains on financial assets in the consolidated statement of revenue and expenses.
25. Sundry assets The Group 2013 2012
Accounts receivable and prepayments 292,925 324,790 Deferred charges 666,587 450,197 Other 10,807 104,966
970,319 879,953
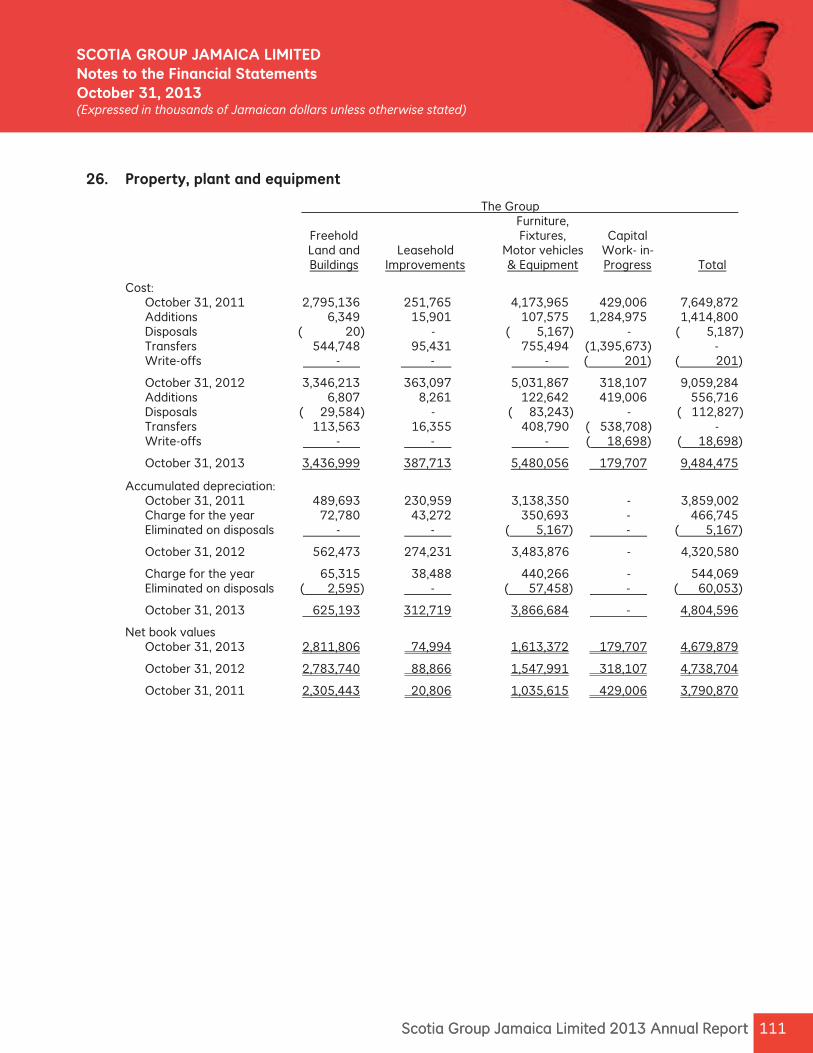
111Scotia Group Jamaica Limited 2013 Annual Report 111Scotia Group Jamaica Limited 2013 Annual Report
SCOTIA GROUP JAMAICA LIMITED Notes to the Financial StatementsOctober 31, 2013(Expressed in thousands of Jamai an dollars unless otherwise stated)
26. Property, plant and equipment
The Group Furniture, Freehold Fixtures, Capital Land and Leasehold Motor vehicles Work- in- Buildings Improvements & Equipment Progress Total
Cost: October 31, 2011 2,795,136 251,765 4,173,965 429,006 7,649,872 Additions 6,349 15,901 107,575 1,284,975 1,414,800 Disposals ( 20) - ( 5,167) - ( 5,187) Transfers 544,748 95,431 755,494 (1,395,673) - Write-offs - - - ( 201) ( 201)
October 31, 2012 3,346,213 363,097 5,031,867 318,107 9,059,284 Additions 6,807 8,261 122,642 419,006 556,716 Disposals ( 29,584) - ( 83,243) - ( 112,827) Transfers 113,563 16,355 408,790 ( 538,708) - Write-offs - - - ( 18,698) ( 18,698)
October 31, 2013 3,436,999 387,713 5,480,056 179,707 9,484,475
Accumulated depreciation: October 31, 2011 489,693 230,959 3,138,350 - 3,859,002 Charge for the year 72,780 43,272 350,693 - 466,745 Eliminated on disposals - - ( 5,167) - ( 5,167)
October 31, 2012 562,473 274,231 3,483,876 - 4,320,580
Charge for the year 65,315 38,488 440,266 - 544,069 Eliminated on disposals ( 2,595) - ( 57,458) - ( 60,053)
October 31, 2013 625,193 312,719 3,866,684 - 4,804,596
Net book values October 31, 2013 2,811,806 74,994 1,613,372 179,707 4,679,879
October 31, 2012 2,783,740 88,866 1,547,991 318,107 4,738,704
October 31, 2011 2,305,443 20,806 1,035,615 429,006 3,790,870
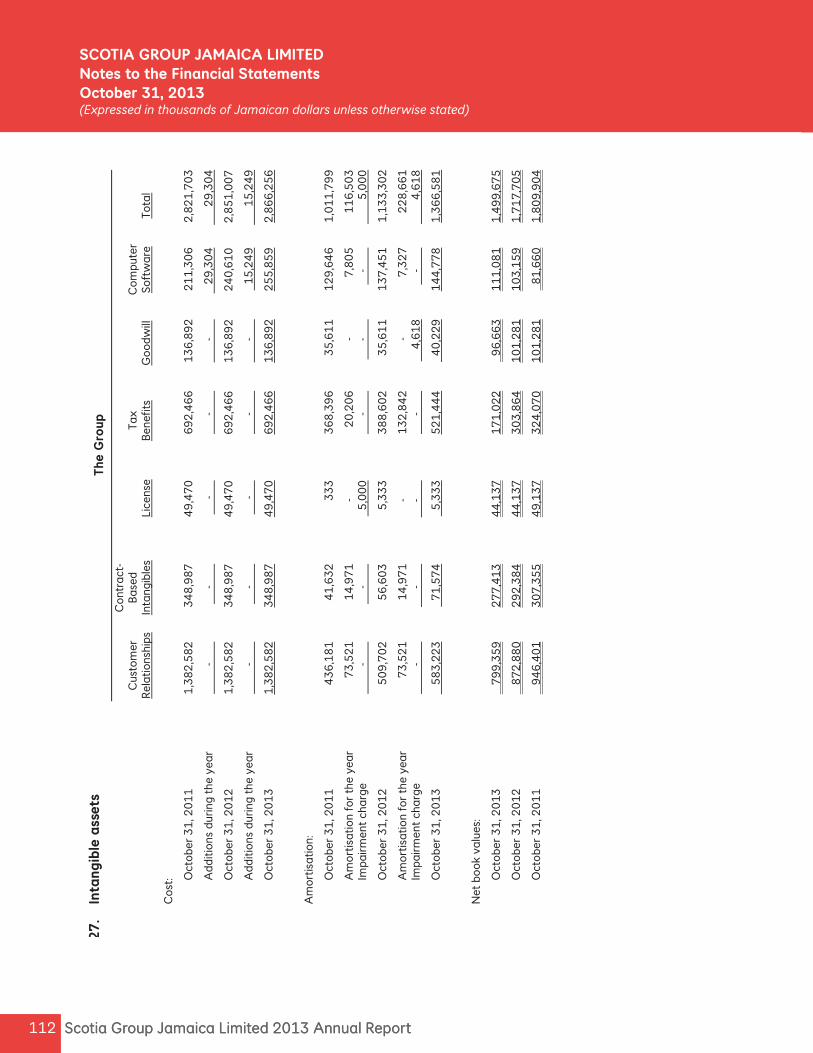
Scotia Group Jamaica Limited 2013 Annual Report 112 Scotia Group Jamaica Limited 2013 Annual Report 112
SCOTIA GROUP JAMAICA LIMITED Notes to the Financial StatementsOctober 31, 2013(Expressed in thousands of Jamai an dollars unless otherwise stated)
27
. In
tang
ible
ass
ets
The
Gro
up
Co
ntra
ct-
C
usto
mer
B
ase
d
Tax
Co
mpu
ter
Rel
atio
nshi
ps
Inta
ngib
les
Lice
nse
Ben
ets
G
oo
dw
ill
Soft
wa
re
Tota
l
Co
st:
O
cto
ber
31
, 20
11
1
,38
2,5
82
3
48
,98
7
49
,47
0
69
2,4
66
1
36
,89
2
21
1,3
06
2
,82
1,7
03
A
dd
itio
ns d
urin
g th
e ye
ar
-
-
-
-
-
2
9,3
04
2
9,3
04
O
cto
ber
31
, 20
12
1
,38
2,5
82
3
48
,98
7
49
,47
0
69
2,4
66
1
36
,89
2
24
0,6
10
2
,85
1,0
07
A
dd
itio
ns d
urin
g th
e ye
ar
-
-
-
-
-
15
,24
9
15
,24
9
O
cto
ber
31
, 20
13
1
,38
2,5
82
3
48
,98
7
49
,47
0
69
2,4
66
1
36
,89
2
25
5,8
59
2
,86
6,2
56
Am
ort
isa
tio
n:
O
cto
ber
31
, 20
11
43
6,1
81
4
1,6
32
33
3
36
8,3
96
3
5,6
11
1
29
,64
6
1,0
11
,79
9
A
mo
rtis
ati
on
for
the
yea
r 7
3,5
21
1
4,9
71
-
20
,20
6
-
7
,80
5
11
6,5
03
Impa
irm
ent
cha
rge
-
-
5,0
00
-
-
-
5
,00
0
O
cto
ber
31
, 20
12
50
9,7
02
56
,60
3
5,3
33
3
88
,60
2
35
,61
1
13
7,4
51
1
,13
3,3
02
A
mo
rtis
ati
on
for
the
yea
r 7
3,5
21
14
,97
1
-
1
32
,84
2
-
7
,32
7
22
8,6
61
Impa
irm
ent
cha
rge
-
-
-
-
4
,61
8
-
4
,61
8
O
cto
ber
31
, 20
13
58
3,2
23
7
1,5
74
5
,33
3
52
1,4
44
4
0,2
29
1
44
,77
8
1,3
66
,58
1
Net
bo
ok
valu
es:
O
cto
ber
31
, 20
13
79
9,3
59
2
77
,41
3
44
,13
7
17
1,0
22
9
6,6
63
1
11
,08
1
1,4
99
,67
5
O
cto
ber
31
, 20
12
87
2,8
80
2
92
,38
4
44
,13
7
30
3,8
64
1
01
,28
1
10
3,1
59
1
,71
7,7
05
O
cto
ber
31
, 20
11
94
6,4
01
3
07
,35
5
49
,13
7
32
4,0
70
1
01
,28
1
81
,66
0
1,8
09
,90
4
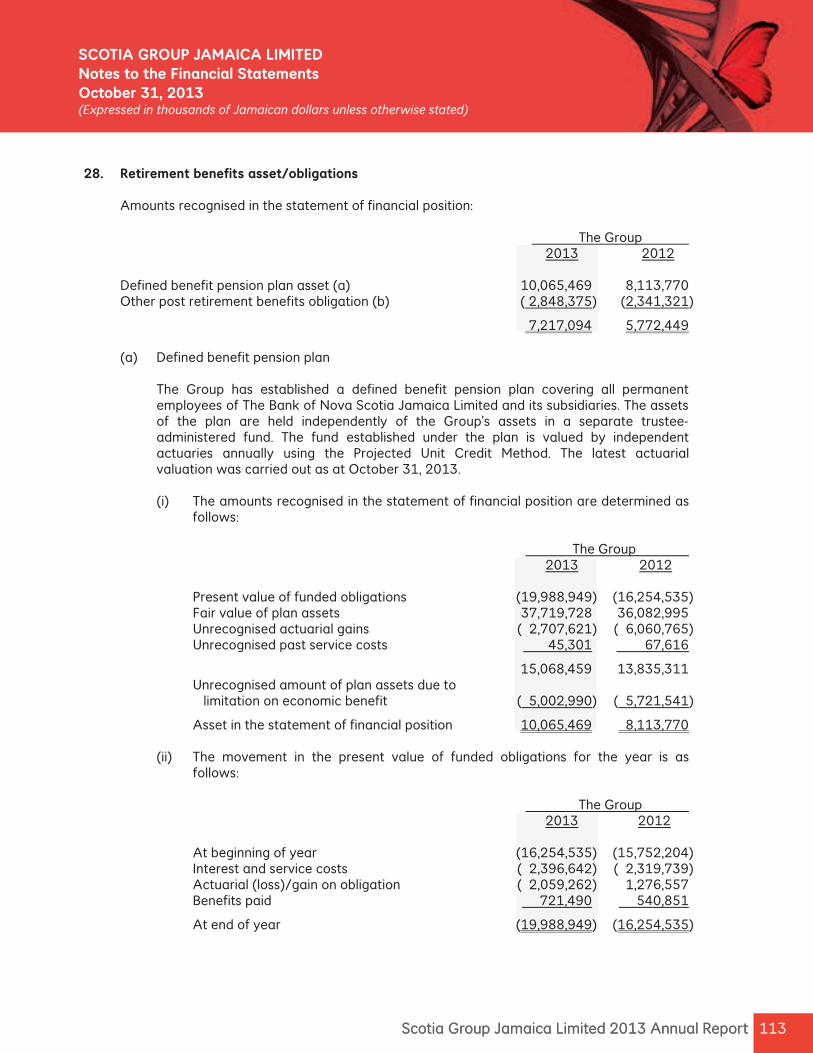
113Scotia Group Jamaica Limited 2013 Annual Report 113Scotia Group Jamaica Limited 2013 Annual Report
SCOTIA GROUP JAMAICA LIMITED Notes to the Financial StatementsOctober 31, 2013(Expressed in thousands of Jamai an dollars unless otherwise stated)
28. Retirement benefits asset/obligations Amounts recognised in the statement of financial position: The Group 2013 2012
Defined benefit pension plan asset (a) 10,065,469 8,113,770 Other post retirement benefits obligation (b) ( 2,848,375) (2,341,321)
7,217,094 5,772,449 (a) Defined benefit pension plan
The Group has established a defined benefit pension plan covering all permanent employees of The Bank of Nova Scotia Jamaica Limited and its subsidiaries. The assets of the plan are held independently of the Group’s assets in a separate trustee-administered fund. The fund established under the plan is valued by independent actuaries annually using the Projected Unit Credit Method. The latest actuarial valuation was carried out as at October 31, 2013. (i) The amounts recognised in the statement of financial position are determined as
follows: The Group 2013 2012
Present value of funded obligations (19,988,949) (16,254,535) Fair value of plan assets 37,719,728 36,082,995 Unrecognised actuarial gains ( 2,707,621) ( 6,060,765) Unrecognised past service costs 45,301 67,616
15,068,459 13,835,311 Unrecognised amount of plan assets due to limitation on economic benefit ( 5,002,990) ( 5,721,541)
Asset in the statement of financial position 10,065,469 8,113,770
(ii) The movement in the present value of funded obligations for the year is as follows:
The Group 2013 2012
At beginning of year (16,254,535) (15,752,204) Interest and service costs ( 2,396,642) ( 2,319,739) Actuarial (loss)/gain on obligation ( 2,059,262) 1,276,557 Benefits paid 721,490 540,851
At end of year (19,988,949) (16,254,535)

Scotia Group Jamaica Limited 2013 Annual Report 114 Scotia Group Jamaica Limited 2013 Annual Report 114
SCOTIA GROUP JAMAICA LIMITED Notes to the Financial StatementsOctober 31, 2013(Expressed in thousands of Jamai an dollars unless otherwise stated)
28. Retirement benefits asset/obligations (continued)
(a) Defined benefit pension plan (continued) (iii) The movement in fair value of plan assets for the year is as follows:
The Group 2013 2012
At beginning of year 36,082,995 34,780,109 Expected return on plan assets 3,061,101 2,948,374 Actuarial (loss)/gains on plan assets ( 1,156,103) ( 1,559,292) Contributions 453,225 454,655 Benefits paid ( 721,490) ( 540,851)
At end of year 37,719,728 36,082,995
(iv) Composition of plan assets:
The Group 2013 2012
Government stocks and bonds 29,522,263 28,887,275 Quoted equities 3,979,932 3,667,468 Reverse repurchase agreements 887,409 371,989 Certificates of deposits 230,063 447,643 Real estate 2,437,801 1,875,037 Net current assets 662,260 833,583
37,719,728 36,082,995
Pension plan assets include the Company’s ordinary shares at a carrying value of $1,170,234 (2012:$1,170,234).
(v) The amounts recognised in the statement of revenue and expenses are as
follows:
The Group 2013 2012
Current service cost, net of employee contributions 307,971 317,574 Interest cost 1,665,827 1,595,221 Expected return on plan assets (3,061,101) (2,948,373) Net actuarial gain recognised in year ( 137,779) ( 162,812) Past service cost – vested and non vested benefits 22,315 22,315 Income (recognised)/not recognised due to limit ( 718,551) 522,138
Included in staff costs (note 11) (1,921,318) ( 653,937)
The actual return on plan assets was $1,904,998 (2012: $1,389,082).
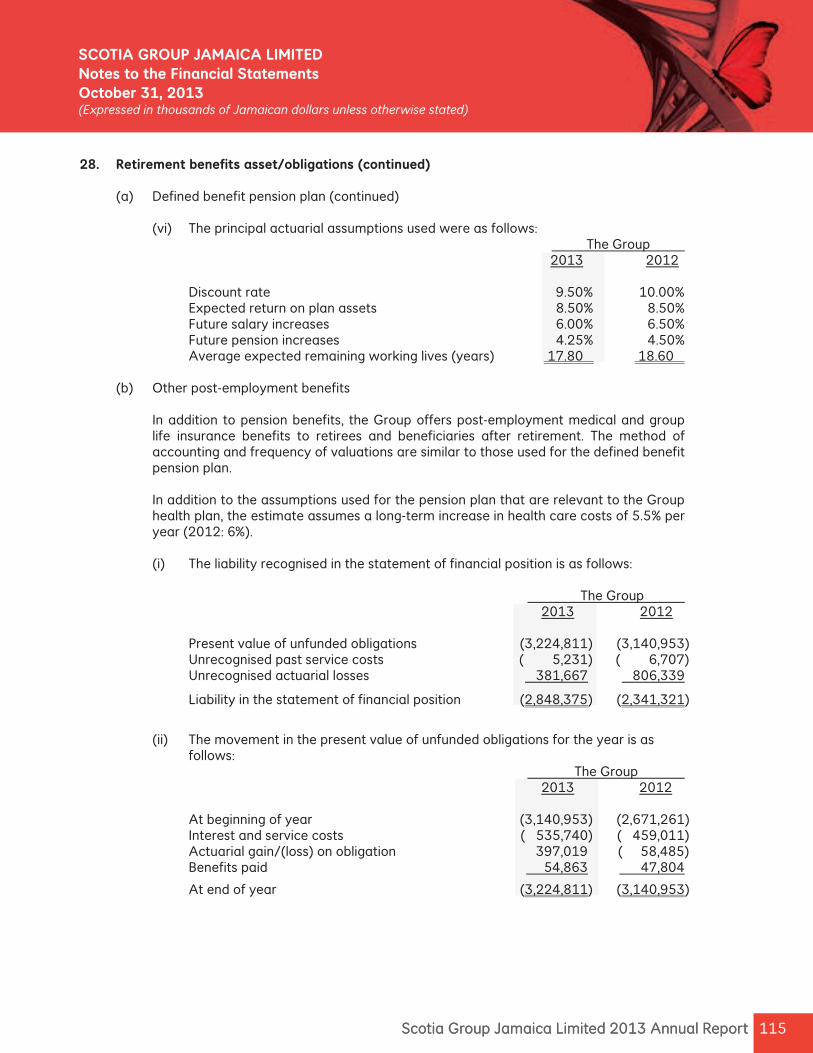
115Scotia Group Jamaica Limited 2013 Annual Report 115Scotia Group Jamaica Limited 2013 Annual Report
SCOTIA GROUP JAMAICA LIMITED Notes to the Financial StatementsOctober 31, 2013(Expressed in thousands of Jamai an dollars unless otherwise stated)
28. Retirement benefits asset/obligations (continued)
(a) Defined benefit pension plan (continued)
(vi) The principal actuarial assumptions used were as follows: The Group 2013 2012
Discount rate 9.50% 10.00% Expected return on plan assets 8.50% 8.50% Future salary increases 6.00% 6.50% Future pension increases 4.25% 4.50% Average expected remaining working lives (years) 17.80 18.60
(b) Other post-employment benefits In addition to pension benefits, the Group offers post-employment medical and group life insurance benefits to retirees and beneficiaries after retirement. The method of accounting and frequency of valuations are similar to those used for the defined benefit pension plan.
In addition to the assumptions used for the pension plan that are relevant to the Group health plan, the estimate assumes a long-term increase in health care costs of 5.5% per year (2012: 6%).
(i) The liability recognised in the statement of financial position is as follows:
The Group 2013 2012
Present value of unfunded obligations (3,224,811) (3,140,953) Unrecognised past service costs ( 5,231) ( 6,707) Unrecognised actuarial losses 381,667 806,339
Liability in the statement of financial position (2,848,375) (2,341,321)
(ii) The movement in the present value of unfunded obligations for the year is as
follows: The Group 2013 2012
At beginning of year (3,140,953) (2,671,261) Interest and service costs ( 535,740) ( 459,011) Actuarial gain/(loss) on obligation 397,019 ( 58,485) Benefits paid 54,863 47,804
At end of year (3,224,811) (3,140,953)
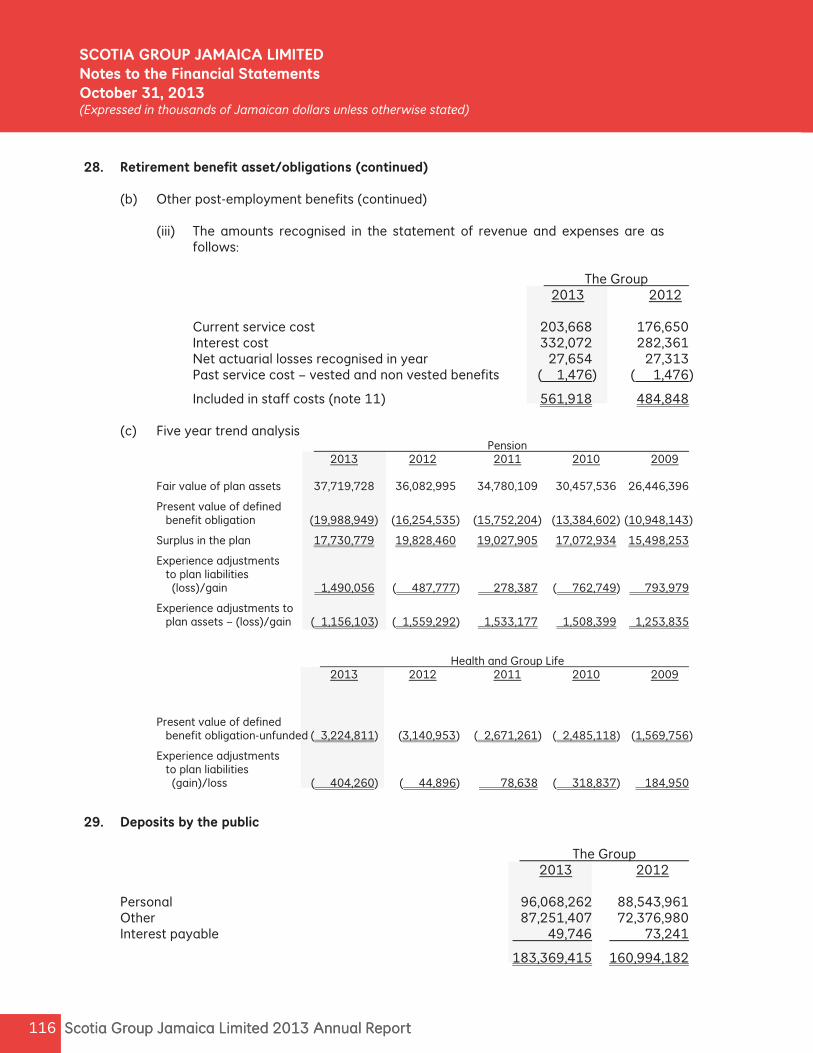
Scotia Group Jamaica Limited 2013 Annual Report 116 Scotia Group Jamaica Limited 2013 Annual Report 116
SCOTIA GROUP JAMAICA LIMITED Notes to the Financial StatementsOctober 31, 2013(Expressed in thousands of Jamai an dollars unless otherwise stated)
28. Retirement benefit asset/obligations (continued)
(b) Other post-employment benefits (continued) (iii) The amounts recognised in the statement of revenue and expenses are as
follows:
The Group 2013 2012
Current service cost 203,668 176,650 Interest cost 332,072 282,361 Net actuarial losses recognised in year 27,654 27,313 Past service cost – vested and non vested benefits ( 1,476) ( 1,476)
Included in staff costs (note 11) 561,918 484,848 (c) Five year trend analysis Pension 2013 2012 2011 2010 2009
Fair value of plan assets 37,719,728 36,082,995 34,780,109 30,457,536 26,446,396
Present value of defined benefit obligation (19,988,949) (16,254,535) (15,752,204) (13,384,602) (10,948,143)
Surplus in the plan 17,730,779 19,828,460 19,027,905 17,072,934 15,498,253
Experience adjustments to plan liabilities (loss)/gain 1,490,056 ( 487,777) 278,387 ( 762,749) 793,979
Experience adjustments to plan assets – (loss)/gain ( 1,156,103) ( 1,559,292) 1,533,177 1,508,399 1,253,835
Health and Group Life 2013 2012 2011 2010 2009
Present value of defined benefit obligation-unfunded ( 3,224,811) (3,140,953) ( 2,671,261) ( 2,485,118) (1,569,756)
Experience adjustments to plan liabilities (gain)/loss ( 404,260) ( 44,896) 78,638 ( 318,837) 184,950
29. Deposits by the public The Group 2013 2012
Personal 96,068,262 88,543,961 Other 87,251,407 72,376,980 Interest payable 49,746 73,241
183,369,415 160,994,182
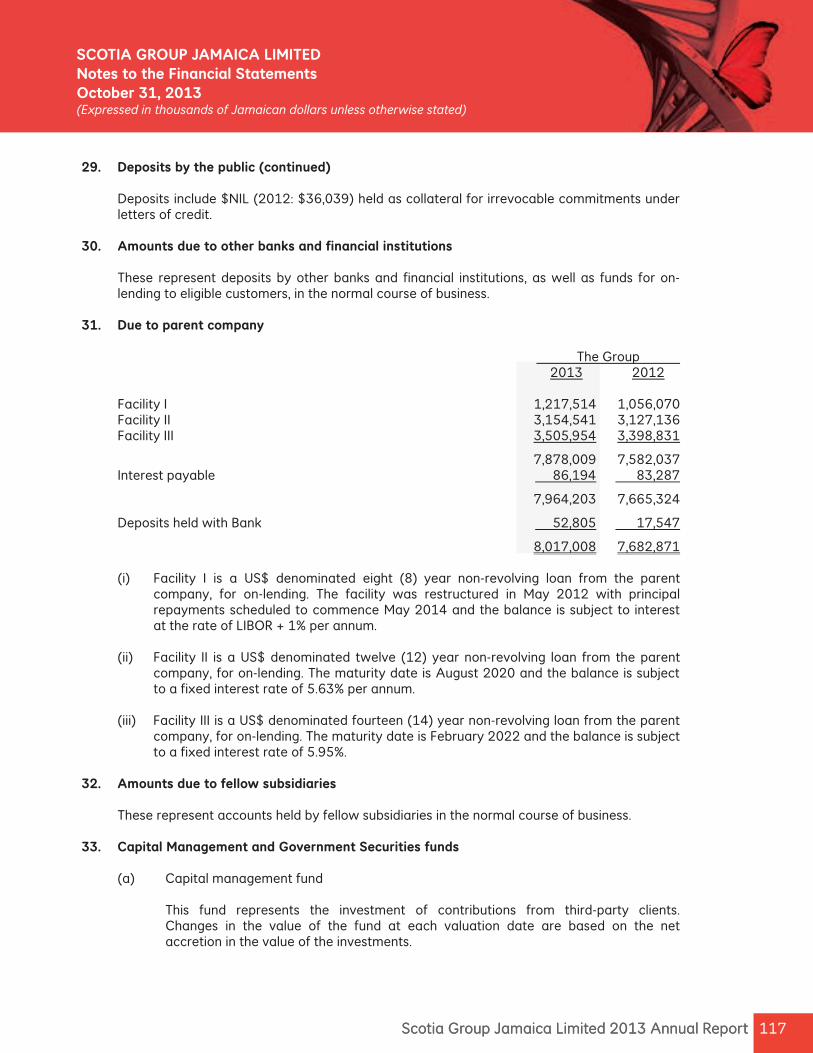
117Scotia Group Jamaica Limited 2013 Annual Report 117Scotia Group Jamaica Limited 2013 Annual Report
SCOTIA GROUP JAMAICA LIMITED Notes to the Financial StatementsOctober 31, 2013(Expressed in thousands of Jamai an dollars unless otherwise stated)
29. Deposits by the public (continued)
Deposits include $NIL (2012: $36,039) held as collateral for irrevocable commitments under letters of credit.
30. Amounts due to other banks and financial institutions
These represent deposits by other banks and financial institutions, as well as funds for on-lending to eligible customers, in the normal course of business.
31. Due to parent company The Group 2013 2012
Facility I 1,217,514 1,056,070 Facility II 3,154,541 3,127,136 Facility III 3,505,954 3,398,831
7,878,009 7,582,037 Interest payable 86,194 83,287
7,964,203 7,665,324
Deposits held with Bank 52,805 17,547
8,017,008 7,682,871
(i) Facility I is a US$ denominated eight (8) year non-revolving loan from the parent company, for on-lending. The facility was restructured in May 2012 with principal repayments scheduled to commence May 2014 and the balance is subject to interest at the rate of LIBOR + 1% per annum.
(ii) Facility II is a US$ denominated twelve (12) year non-revolving loan from the parent
company, for on-lending. The maturity date is August 2020 and the balance is subject to a fixed interest rate of 5.63% per annum.
(iii) Facility III is a US$ denominated fourteen (14) year non-revolving loan from the parent
company, for on-lending. The maturity date is February 2022 and the balance is subject to a fixed interest rate of 5.95%.
32. Amounts due to fellow subsidiaries
These represent accounts held by fellow subsidiaries in the normal course of business. 33. Capital Management and Government Securities funds (a) Capital management fund This fund represents the investment of contributions from third-party clients.
Changes in the value of the fund at each valuation date are based on the net accretion in the value of the investments.
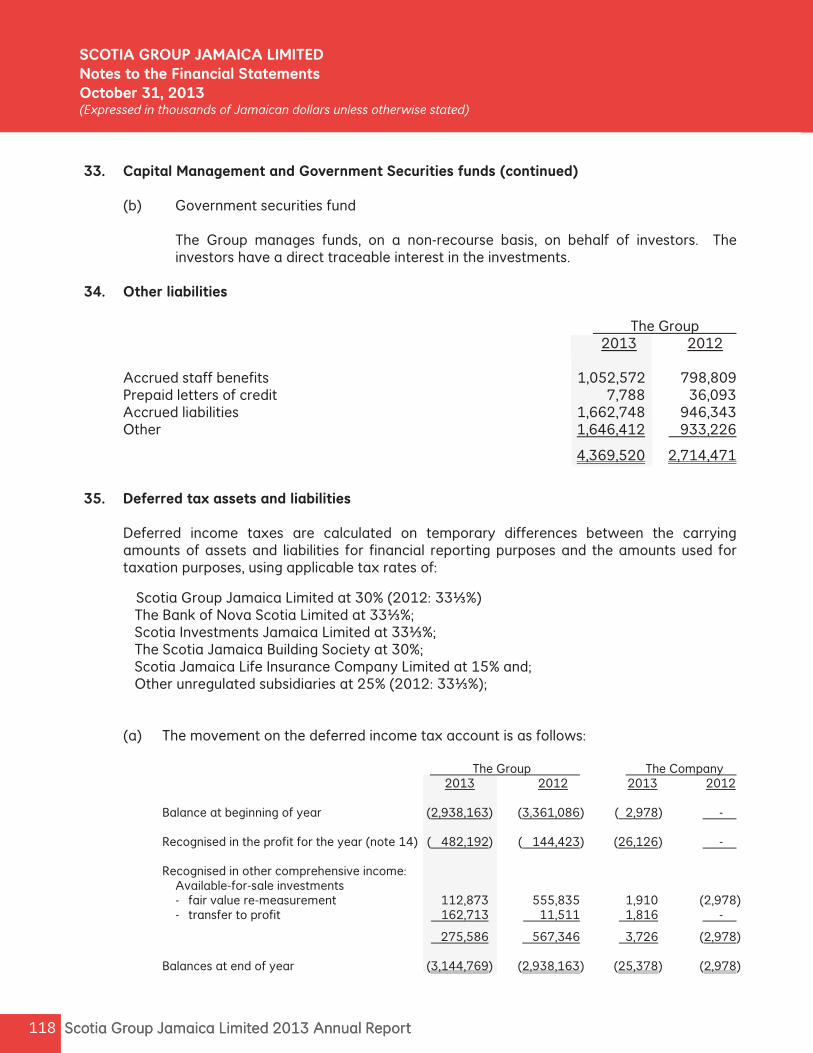
Scotia Group Jamaica Limited 2013 Annual Report 118 Scotia Group Jamaica Limited 2013 Annual Report 118
SCOTIA GROUP JAMAICA LIMITED Notes to the Financial StatementsOctober 31, 2013(Expressed in thousands of Jamai an dollars unless otherwise stated)
33. Capital Management and Government Securities funds (continued) (b) Government securities fund The Group manages funds, on a non-recourse basis, on behalf of investors. The
investors have a direct traceable interest in the investments. 34. Other liabilities The Group 2013 2012
Accrued staff benefits 1,052,572 798,809 Prepaid letters of credit 7,788 36,093 Accrued liabilities 1,662,748 946,343 Other 1,646,412 933,226
4,369,520 2,714,471
35. Deferred tax assets and liabilities Deferred income taxes are calculated on temporary differences between the carrying
amounts of assets and liabilities for financial reporting purposes and the amounts used for taxation purposes, using applicable tax rates of:
Scotia Group Jamaica Limited at 30% (2012: 33⅓%) The Bank of Nova Scotia Limited at 33⅓%; Scotia Investments Jamaica Limited at 33⅓%; The Scotia Jamaica Building Society at 30%;
Scotia Jamaica Life Insurance Company Limited at 15% and; Other unregulated subsidiaries at 25% (2012: 33⅓%);
(a) The movement on the deferred income tax account is as follows:
The Group The Company 2013 2012 2013 2012
Balance at beginning of year (2,938,163) (3,361,086) ( 2,978) - Recognised in the profit for the year (note 14) ( 482,192) ( 144,423) (26,126) - Recognised in other comprehensive income:
Available-for-sale investments - fair value re-measurement 112,873 555,835 1,910 (2,978) - transfer to profit 162,713 11,511 1,816 -
275,586 567,346 3,726 (2,978)
Balances at end of year (3,144,769) (2,938,163) (25,378) (2,978)
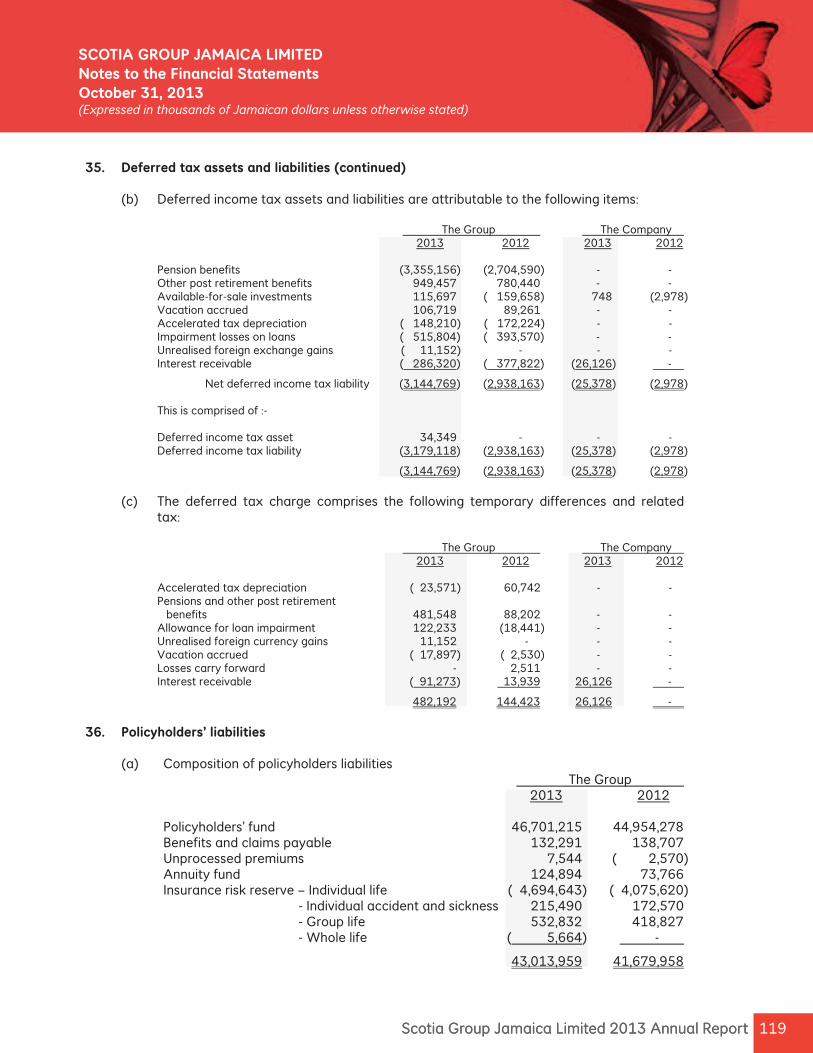
119Scotia Group Jamaica Limited 2013 Annual Report 119Scotia Group Jamaica Limited 2013 Annual Report
SCOTIA GROUP JAMAICA LIMITED Notes to the Financial StatementsOctober 31, 2013(Expressed in thousands of Jamai an dollars unless otherwise stated)
35. Deferred tax assets and liabilities (continued) (b) Deferred income tax assets and liabilities are attributable to the following items:
The Group The Company 2013 2012 2013 2012
Pension benefits (3,355,156) (2,704,590) - - Other post retirement benefits 949,457 780,440 - - Available-for-sale investments 115,697 ( 159,658) 748 (2,978) Vacation accrued 106,719 89,261 - - Accelerated tax depreciation ( 148,210) ( 172,224) - - Impairment losses on loans ( 515,804) ( 393,570) - - Unrealised foreign exchange gains ( 11,152) - - - Interest receivable ( 286,320) ( 377,822) (26,126) -
Net deferred income tax liability (3,144,769) (2,938,163) (25,378) (2,978)
This is comprised of :- Deferred income tax asset 34,349 - - - Deferred income tax liability (3,179,118) (2,938,163) (25,378) (2,978)
(3,144,769) (2,938,163) (25,378) (2,978) (c) The deferred tax charge comprises the following temporary differences and related
tax: The Group The Company 2013 2012 2013 2012
Accelerated tax depreciation ( 23,571) 60,742 - - Pensions and other post retirement benefits 481,548 88,202 - - Allowance for loan impairment 122,233 (18,441) - - Unrealised foreign currency gains 11,152 - - - Vacation accrued ( 17,897) ( 2,530) - - Losses carry forward - 2,511 - - Interest receivable ( 91,273) 13,939 26,126 -
482,192 144,423 26,126 - 36. Policyholders’ liabilities (a) Composition of policyholders liabilities The Group 2013 2012 Policyholders’ fund 46,701,215 44,954,278 Benefits and claims payable 132,291 138,707 Unprocessed premiums 7,544 ( 2,570) Annuity fund 124,894 73,766 Insurance risk reserve – Individual life ( 4,694,643) ( 4,075,620) - Individual accident and sickness 215,490 172,570 - Group life 532,832 418,827 - Whole life ( 5,664) -
43,013,959 41,679,958
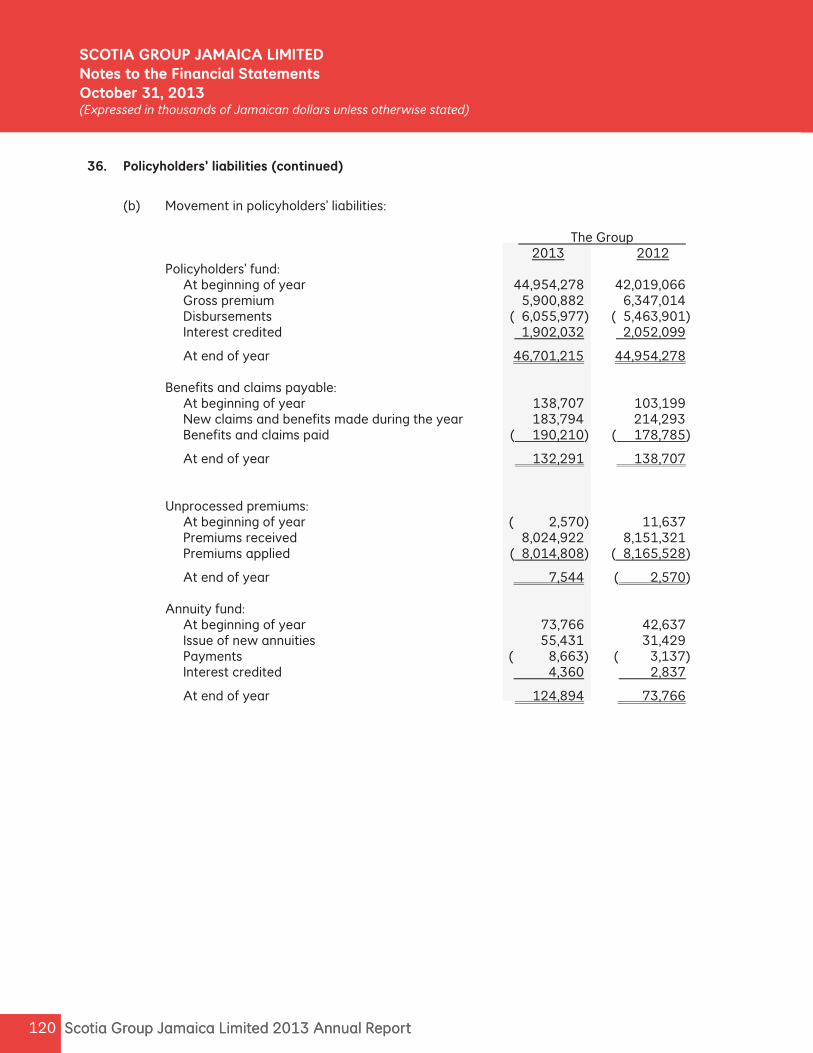
Scotia Group Jamaica Limited 2013 Annual Report 120
36. Policyholders’ liabilities (continued)
(b) Movement in policyholders’ liabilities: The Group 2013 2012 Policyholders’ fund: At beginning of year 44,954,278 42,019,066 Gross premium 5,900,882 6,347,014 Disbursements ( 6,055,977) ( 5,463,901) Interest credited 1,902,032 2,052,099
At end of year 46,701,215 44,954,278 Benefits and claims payable: At beginning of year 138,707 103,199 New claims and benefits made during the year 183,794 214,293 Benefits and claims paid ( 190,210) ( 178,785)
At end of year 132,291 138,707 Unprocessed premiums: At beginning of year ( 2,570) 11,637 Premiums received 8,024,922 8,151,321 Premiums applied ( 8,014,808) ( 8,165,528)
At end of year 7,544 ( 2,570) Annuity fund: At beginning of year 73,766 42,637 Issue of new annuities 55,431 31,429 Payments ( 8,663) ( 3,137) Interest credited 4,360 2,837
At end of year 124,894 73,766
Scotia Group Jamaica Limited 2013 Annual Report 120
SCOTIA GROUP JAMAICA LIMITED Notes to the Financial StatementsOctober 31, 2013(Expressed in thousands of Jamai an dollars unless otherwise stated)
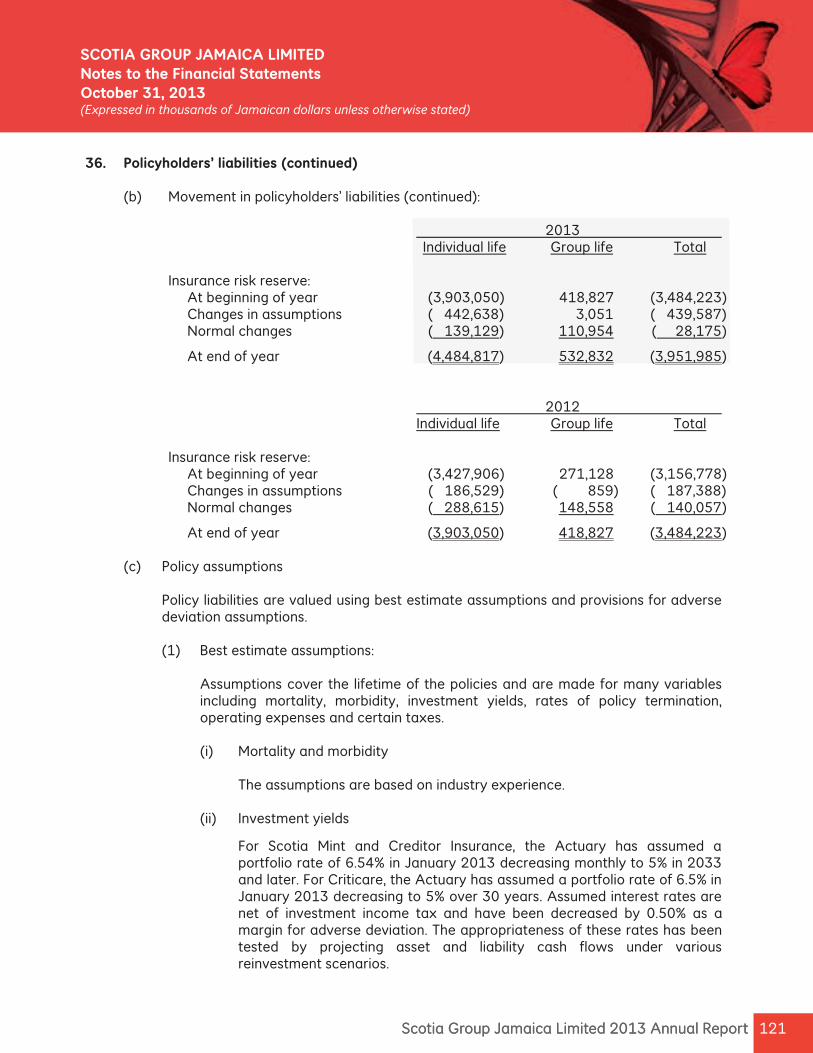
121Scotia Group Jamaica Limited 2013 Annual Report 121Scotia Group Jamaica Limited 2013 Annual Report
SCOTIA GROUP JAMAICA LIMITED Notes to the Financial StatementsOctober 31, 2013(Expressed in thousands of Jamai an dollars unless otherwise stated)
36. Policyholders’ liabilities (continued) (b) Movement in policyholders’ liabilities (continued): 2013 Individual life Group life Total Insurance risk reserve: At beginning of year (3,903,050) 418,827 (3,484,223) Changes in assumptions ( 442,638) 3,051 ( 439,587) Normal changes ( 139,129) 110,954 ( 28,175)
At end of year (4,484,817) 532,832 (3,951,985) 2012 Individual life Group life Total Insurance risk reserve: At beginning of year (3,427,906) 271,128 (3,156,778) Changes in assumptions ( 186,529) ( 859) ( 187,388) Normal changes ( 288,615) 148,558 ( 140,057)
At end of year (3,903,050) 418,827 (3,484,223)
(c) Policy assumptions
Policy liabilities are valued using best estimate assumptions and provisions for adverse deviation assumptions.
(1) Best estimate assumptions:
Assumptions cover the lifetime of the policies and are made for many variables including mortality, morbidity, investment yields, rates of policy termination, operating expenses and certain taxes.
(i) Mortality and morbidity
The assumptions are based on industry experience.
(ii) Investment yields
For Scotia Mint and Creditor Insurance, the Actuary has assumed a portfolio rate of 6.54% in January 2013 decreasing monthly to 5% in 2033 and later. For Criticare, the Actuary has assumed a portfolio rate of 6.5% in January 2013 decreasing to 5% over 30 years. Assumed interest rates are net of investment income tax and have been decreased by 0.50% as a margin for adverse deviation. The appropriateness of these rates has been tested by projecting asset and liability cash flows under various reinvestment scenarios.
Scotia Group Jamaica Limited 2013 Annual Report 122 Scotia Group Jamaica Limited 2013 Annual Report 122
SCOTIA GROUP JAMAICA LIMITED Notes to the Financial StatementsOctober 31, 2013(Expressed in thousands of Jamai an dollars unless otherwise stated)
36. Policyholders’ liabilities (continued)
(c) Policy assumptions (continued)
(1) Best estimate assumptions (continued): (iii) Persistency
Persistency assumptions are made in relation to the time since inception that a policy exists before it lapses or is surrendered. Lapses relate to termination of policies due to non-payment of premiums. Surrenders relate to voluntary termination of policies by the policyholders. Policy terminations are based on the Group’s experience adjusted for expected future conditions. Lapse and surrender rates are derived from the Group’s experience. A margin for adverse deviation is added by increasing or decreasing the lapse rates, whichever is adverse, by 25%. The main source of uncertainty derives from changes in policyholder behaviour as it relates to changes in economic conditions.
(iv) Policy expenses and inflation
Policy maintenance expenses are derived from the Group’s internal cost studies projected into the future with an allowance for inflation. Inflation is assumed to be 5% in January 2013, decreasing to 2% over 20 years. A margin for adverse deviation is added by increasing the maintenance expenses by 10% of the best estimate assumption.
(v) Partial withdrawal of policy funds
The Group’s contracts allow policyholders to withdraw a portion of the funds accumulated under the contract without surrendering the entire contract. Partial withdrawal rates are derived from the Group’s own experience. A margin for adverse deviation is added by increasing the partial withdrawal rates by 10% of the best-estimate assumption.
(vi) Taxation
It is assumed that current tax legislation and rates continue unaltered.
(2) Provision for adverse deviation assumptions
The basic assumptions made in establishing policy liabilities are best estimates for a range of possible outcomes. To recognise the uncertainty in establishing these best estimates, to allow for possible deterioration in experience and to provide greater comfort that the reserves are adequate to pay future benefits, a margin for adverse deviation is included in each assumption.

123Scotia Group Jamaica Limited 2013 Annual Report 123Scotia Group Jamaica Limited 2013 Annual Report
SCOTIA GROUP JAMAICA LIMITED Notes to the Financial StatementsOctober 31, 2013(Expressed in thousands of Jamai an dollars unless otherwise stated)
36. Policyholders’ liabilities (continued)
(c) Policy assumptions (continued)
(2) Provision for adverse deviation assumptions The impact of these margins is to increase reserves and so decrease the income that would be recognised on inception of the policy. The Canadian Institute of Actuaries prescribes a range of allowable margins. The Group uses assumptions at the conservative end of the range, taking into account the risk profiles of the business.
37. Share capital Number of Units ’000 Total $’000 2013 2012 2013 2012
Authorised: Ordinary shares of no par value 10,000,000 10,000,000 Issued and fully paid:
Ordinary stock units 3,111,573 3,111,573 6,569,810 6,569,810
The holders of the ordinary stock units are entitled to receive dividends as declared from time
to time and are entitled to one vote per share at meetings of the Company. 38. Reserve fund The Group 2013 2012
As at October 31 3,248,591 3,248,591
In accordance with the Banking Act 1992, certain companies in the Group are required to make transfers of a minimum of 15% of net profit until the amount in the fund is equal to 50% of the paid-up capital of the bank and thereafter 10% of the net profits until the reserve fund is equal to the respective paid-up capital.
The Building Society subsidiary is required to make transfers of a minimum of 10% of net profit, until the amount at the credit of the reserve fund is equal to the total of the amount paid up on its capital shares and the amount of its deferred shares.
39. Retained earnings reserve
The Banking Act 1992 permits transfers from the Bank’s net profit to retained earnings reserve, which constitutes a part of the capital base. Transfers to the retained earnings reserve are made at the discretion of the Board of Directors. Such transfers must be notified to the Bank of Jamaica and any reverse must be approved by the Bank of Jamaica.
40. Cumulative remeasurement result from available-for-sale securities
This represents the unrealised surplus or deficit on the revaluation of available-for-sale securities.
Scotia Group Jamaica Limited 2013 Annual Report 124 Scotia Group Jamaica Limited 2013 Annual Report 124
SCOTIA GROUP JAMAICA LIMITED Notes to the Financial StatementsOctober 31, 2013(Expressed in thousands of Jamai an dollars unless otherwise stated)
41. Loan loss reserve
This is a non-distributable loan loss reserve which represents the excess of the regulatory loan loss provision over the amount determined under IFRS requirements (note 23).
42. Other reserves
This represents reserves arising on consolidation of subsidiaries, net. 43. Related party transactions and balances
The Group is controlled by The Bank of Nova Scotia, a bank incorporated and domiciled in Canada, which owns 71.78% of the ordinary stock units. The remaining 28.22% of the stock units is widely held. Parties are considered to be related if one party has the ability to control or exercise significant influence over, or be controlled and significantly influenced by, the other party or both parties are subject to common control or significant influence. A number of banking transactions are entered into with related parties, including companies connected by virtue of common directorships, in the normal course of business. These include loans, deposits, investment management services and foreign currency transactions. Related party transactions with the parent company include the payment of dividends, management fees, guarantee fees, centralized computing and other service fees. The related party balance with the parent is the amount due to the parent company as set out in note 31. No provisions have been recognised in respect of loans made to related parties. Pursuant to Section 13(1)(d) and (i) of the Banking Act, connected companies include companies that have directors in common with the Company and/or its subsidiaries.
Related party credit facilities in excess of the limits set out in Section 13(1)(d) and (i), subject to the maximum of the limits in Section 13(1)(e) of the Banking Act, are supported by guarantees issued by the parent company. The amounts of related party transactions, outstanding balances at the year end, and related income and expenses for the year are as follows:
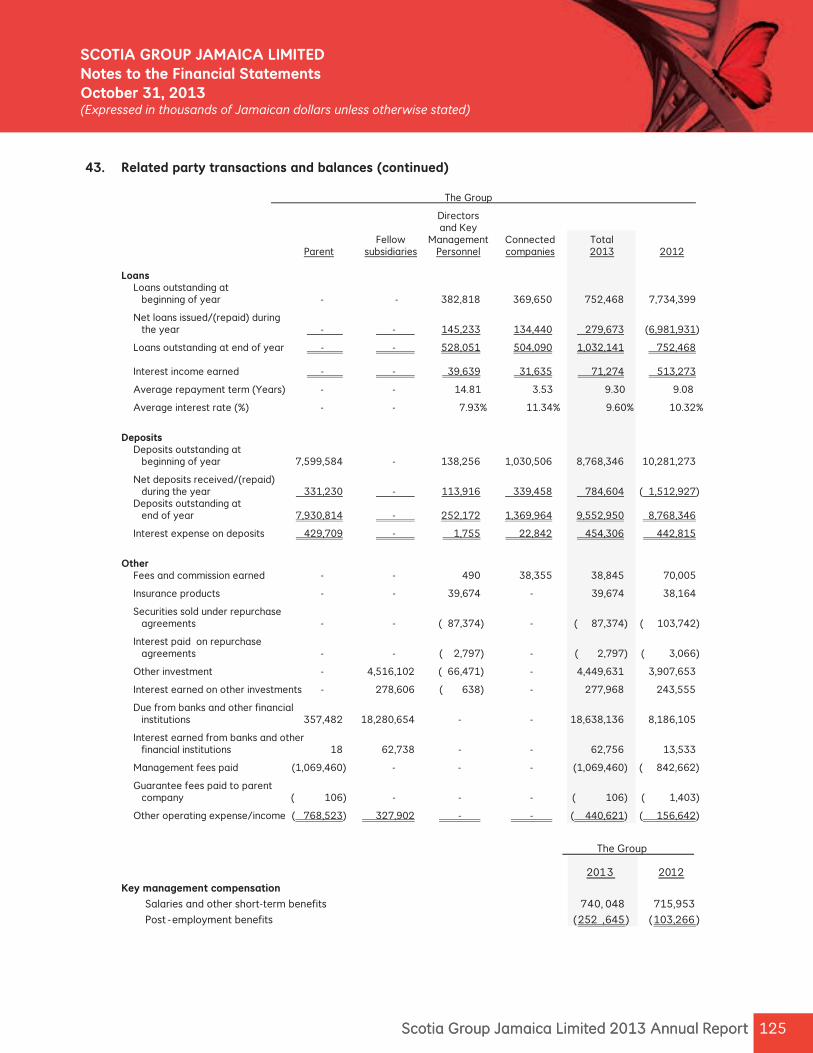
125Scotia Group Jamaica Limited 2013 Annual Report 125Scotia Group Jamaica Limited 2013 Annual Report
SCOTIA GROUP JAMAICA LIMITED Notes to the Financial StatementsOctober 31, 2013(Expressed in thousands of Jamai an dollars unless otherwise stated)
43. Related party transactions and balances (continued)
The Group
Directors and Key Fellow Management Connected Total Parent subsidiaries Personnel companies 2013 2012
Loans Loans outstanding at beginning of year - - 382,818 369,650 752,468 7,734,399
Net loans issued/(repaid) during the year - - 145,233 134,440 279,673 (6,981,931)
Loans outstanding at end of year - - 528,051 504,090 1,032,141 752,468
Interest income earned - - 39,639 31,635 71,274 513,273
Average repayment term (Years) - - 14.81 3.53 9.30 9.08
Average interest rate (%) - - 7.93% 11.34% 9.60% 10.32%
Deposits
Deposits outstanding at beginning of year 7,599,584 - 138,256 1,030,506 8,768,346 10,281,273
Net deposits received/(repaid) during the year 331,230 - 113,916 339,458 784,604 ( 1,512,927) Deposits outstanding at end of year 7,930,814 - 252,172 1,369,964 9,552,950 8,768,346
Interest expense on deposits 429,709 - 1,755 22,842 454,306 442,815
Other
Fees and commission earned - - 490 38,355 38,845 70,005
Insurance products - - 39,674 - 39,674 38,164
Securities sold under repurchase agreements - - ( 87,374) - ( 87,374) ( 103,742)
Interest paid on repurchase agreements - - ( 2,797) - ( 2,797) ( 3,066)
Other investment - 4,516,102 ( 66,471) - 4,449,631 3,907,653
Interest earned on other investments - 278,606 ( 638) - 277,968 243,555
Due from banks and other financial institutions 357,482 18,280,654 - - 18,638,136 8,186,105
Interest earned from banks and other financial institutions 18 62,738 - - 62,756 13,533
Management fees paid (1,069,460) - - - (1,069,460) ( 842,662)
Guarantee fees paid to parent company ( 106) - - - ( 106) ( 1,403)
Other operating expense/income ( 768,523) 327,902 -
- ( 440,621) ( 156,642)
The Group
2013 2012
Key management compensation
Salaries and other short-term benefits 740, 048 715,953
Post -employment benefits (252 ,645) (103,266)
Scotia Group Jamaica Limited 2013 Annual Report 126 Scotia Group Jamaica Limited 2013 Annual Report 126
SCOTIA GROUP JAMAICA LIMITED Notes to the Financial StatementsOctober 31, 2013(Expressed in thousands of Jamai an dollars unless otherwise stated)
44. Financial risk management
(a) Overview and risk management framework
By their nature, the Group’s activities are principally related to the use of financial instruments, which involves analysis, evaluation and management of some degree of risk or combination of risks. The Group manages risk through a framework of risk principles, organizational structures and risk measurement and monitoring processes that are closely aligned with the activities of its business units. The Group’s risk management policies are designed to identify and analyse these risks, to set appropriate risk limits and controls, and to monitor the risks and adherence to limits by means of reliable and up-to date information systems. The Group regularly reviews its risk management policies and systems to reflect changes in markets, products and emerging best practice. The Board of Directors is ultimately responsible for the establishment and oversight of the Board’s risk management framework. The Board has established committees for managing and monitoring risks; in addition, there are management committees established to manage risks. Three key committees for managing and monitoring risks are as follows:
(i) Board Audit Committee
The Board Audit Committee is comprised of independent directors. This committee oversees the integrity of the Group’s financial statements, compliance with legal and regulatory requirements, the performance of the Bank’s internal audit function and external auditors, as well as the system of internal controls over financial reporting. The Audit Committee reviews the quarterly and annual financial statements, examining significant issues regarding the financial results, accounting principles and policies, as well as management estimates and assumptions, for recommendation to the Board for approval. This committee is assisted in its oversight role by the Internal Audit Department, which undertakes reviews of risk management controls and procedures, the results of which are reported to the Audit Committee.
(ii) Executive and Enterprise Risk Committee
The Executive and Enterprise Risk Committee reviews and recommends to the Board for approval, the risk management policies, limits, procedures and standards. This involves review of the quarterly reports on the Group’s enterprise wide risk profile, including credit, market, operational and liquidity risks. This Committee also oversees the corporate strategy and profit plans for the Group, as well as develops and makes recommendations for improvement of the corporate governance policies and procedures.
127Scotia Group Jamaica Limited 2013 Annual Report 127Scotia Group Jamaica Limited 2013 Annual Report
SCOTIA GROUP JAMAICA LIMITED Notes to the Financial StatementsOctober 31, 2013(Expressed in thousands of Jamai an dollars unless otherwise stated)
44. Financial risk management (continued)
(a) Overview and risk management framework (continued)
(iii) Asset and Liability Committee
The Asset and Liability Committee (ALCO), a management committee, has the responsibility of ensuring that risks are managed within the limits established by the Board of Directors. The Committee meets at least once monthly to review risks, evaluate performance and provide strategic direction. The Committee reviews investment, loan and funding activities, and ensures that the existing policies comprehensively deal with the management and diversification of the Group’s investment and loan portfolios and that appropriate limits are being adhered to.
The Investment Advisory Committee performs a similar role to ALCO for Scotia Jamaica Life Insurance, where it provides a specialized focus due to the different nature of the insurance business.
The most important types of risk for the Group are credit risk, liquidity risk, market risk, insurance risk and operational risk. Market risk includes currency risk, interest rate risk and other price risk.
(b) Credit risk
(i) Credit Risk Management At a strategic level, the Group manages the levels of credit risk it undertakes by placing limits on the amount of risk accepted in relation to any one borrower or groups of borrowers, and industry segments. Credit risk limits are approved by the Board of Directors. The exposure to any one borrower, including banks and brokers, is further restricted by sub-limits covering on and off-balance sheet exposures. Actual exposures against limits are monitored daily. Operationally, exposure to credit risk is managed through regular analysis of the ability of borrowers and potential borrowers to meet interest and principal repayment obligations and by restructuring loans where appropriate. Exposure to credit risk is also managed in part by obtaining collateral and corporate and personal guarantees. In addition, the Group will seek additional collateral from the counterparty as soon as impairment indicators are observed for the relevant individual loans. The Group’s policy requires the review of individual financial assets that are above materiality thresholds annually or more regularly when individual circumstances require. Impairment allowances is consistent with the policies outlined in note 2(p).
Scotia Group Jamaica Limited 2013 Annual Report 128 Scotia Group Jamaica Limited 2013 Annual Report 128
SCOTIA GROUP JAMAICA LIMITED Notes to the Financial StatementsOctober 31, 2013(Expressed in thousands of Jamai an dollars unless otherwise stated)
44. Financial risk management (continued)
(b) Credit risk (continued)
(i) Credit Risk Management (continued)
The Group further manages its exposure to credit losses by entering into master netting arrangements with counterparties with which it undertakes a significant volume of transactions. Master netting arrangements do not generally result in an offset of assets and liabilities, as transactions are usually settled on a gross basis. However, the credit risk associated with favourable contracts is reduced by a master netting arrangement to the extent that if a default occurs, all amounts with the counterparty are terminated and settled on a net basis.
(ii) Credit-related commitments
The primary purpose of these instruments is to ensure that funds are available to customers as required. Guarantees and standby letters of credit, which represent irrevocable assurances that the Group will make payments in the event that a customer cannot meet its obligations to third parties, carry the same credit risk as loans. Commercial letters of credit, which are written undertakings by the Group on behalf of a customer authorising a third party to issue drafts on the Group up to a stipulated amount under specific terms and conditions, are collateralised by the underlying shipments of goods to which they relate and therefore carry less risk than direct borrowing. Commitments to extend credit represent unused portions of authorisations to extend credit in the form of loans, guarantees or letters of credit. With respect to credit risk on commitments to extend credit, the Group is potentially exposed to loss in an amount equal to the total unused commitments. However, the likely amount of loss is less than the total unused commitments, as most commitments to extend credit are contingent upon customers maintaining specific credit standards. The Group monitors the term to maturity of credit commitments because longer-term commitments generally have a greater degree of credit risk than shorter-term commitments.
(iii) Credit quality
Commercial loans: In measuring credit risk of commercial loans at the counterparty level, the Group assesses the probability of default of individual counterparties using internal rating tools. They have been developed internally and combine statistical analysis with credit officer judgment and are validated, where appropriate, by comparison with externally available data. The Group’s rating scale, which is shown below, reflects the range of default probabilities defined for each rating class:
129Scotia Group Jamaica Limited 2013 Annual Report 129Scotia Group Jamaica Limited 2013 Annual Report
SCOTIA GROUP JAMAICA LIMITED Notes to the Financial StatementsOctober 31, 2013(Expressed in thousands of Jamai an dollars unless otherwise stated)
44. Financial risk management (continued)
(b) Credit risk (continued)
(iii) Credit quality (continued)
Mapping of the Group’s internal ratings to external ratings of international rating agency, Standard and Poor’s.
The Group’s rating External rating : Standard & Poor’s equivalent.
Excellent AAA to AA+ Very Good AA to A+ Good A to A- Acceptable BBB+ to BB+ Higher Risk BB and under
Retail loans: Retail loans are risk-rated based on an internal scoring system which combines statistical analysis with credit officer judgment, and fall within the following categories:
Excellent Good Higher risk
The following table shows the percentage of the loan portfolio as at the reporting date relating to loans and credit commitments for each of the internal rating categories:
The Group Loans and credit commitments 2013 2012 (%) (%)
Excellent 24.2 22.3 Very Good 4.9 5.1 Good 20.1 19.1 Acceptable 6.8 5.7 Higher Risk 44.0 47.8
100.0 100.0
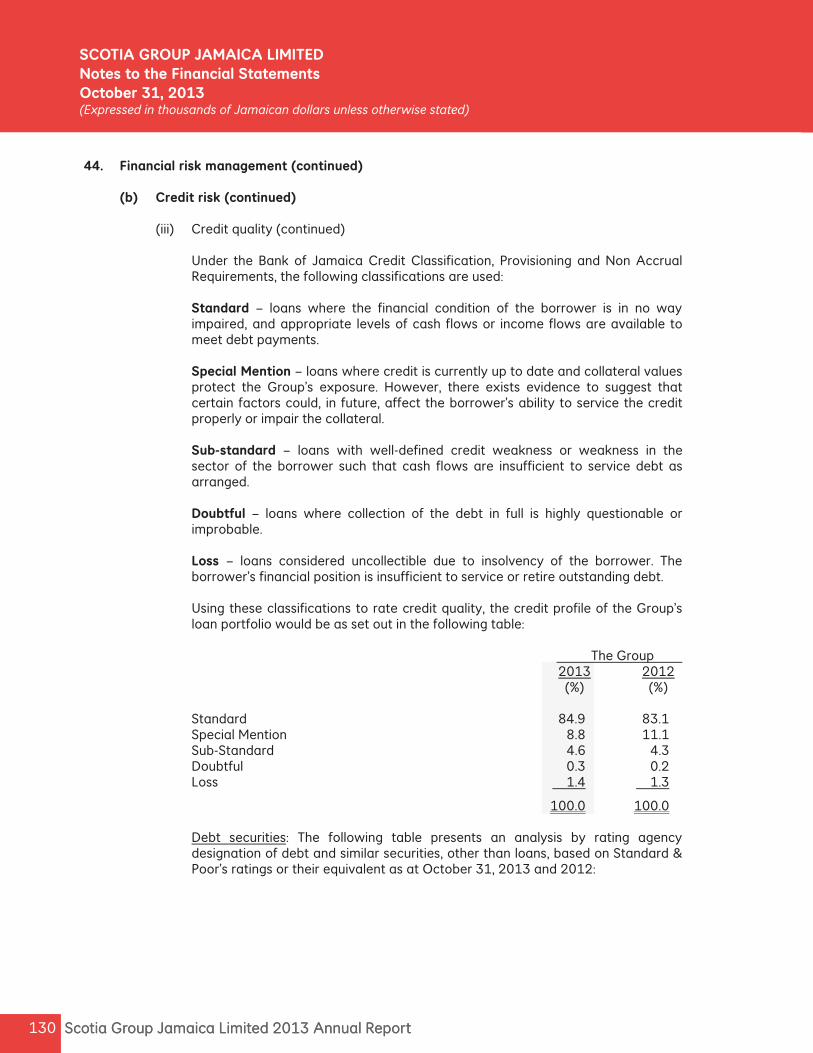
Scotia Group Jamaica Limited 2013 Annual Report 130 Scotia Group Jamaica Limited 2013 Annual Report 130
SCOTIA GROUP JAMAICA LIMITED Notes to the Financial StatementsOctober 31, 2013(Expressed in thousands of Jamai an dollars unless otherwise stated)
44. Financial risk management (continued)
(b) Credit risk (continued)
(iii) Credit quality (continued)
Under the Bank of Jamaica Credit Classification, Provisioning and Non Accrual Requirements, the following classifications are used: Standard – loans where the financial condition of the borrower is in no way impaired, and appropriate levels of cash flows or income flows are available to meet debt payments. Special Mention – loans where credit is currently up to date and collateral values protect the Group’s exposure. However, there exists evidence to suggest that certain factors could, in future, affect the borrower’s ability to service the credit properly or impair the collateral. Sub-standard – loans with well-defined credit weakness or weakness in the sector of the borrower such that cash flows are insufficient to service debt as arranged. Doubtful – loans where collection of the debt in full is highly questionable or improbable. Loss – loans considered uncollectible due to insolvency of the borrower. The borrower’s financial position is insufficient to service or retire outstanding debt. Using these classifications to rate credit quality, the credit profile of the Group’s loan portfolio would be as set out in the following table:
The Group 2013 2012 (%) (%)
Standard 84.9 83.1 Special Mention 8.8 11.1 Sub-Standard 4.6 4.3 Doubtful 0.3 0.2 Loss 1.4 1.3
100.0 100.0 Debt securities: The following table presents an analysis by rating agency designation of debt and similar securities, other than loans, based on Standard & Poor’s ratings or their equivalent as at October 31, 2013 and 2012:
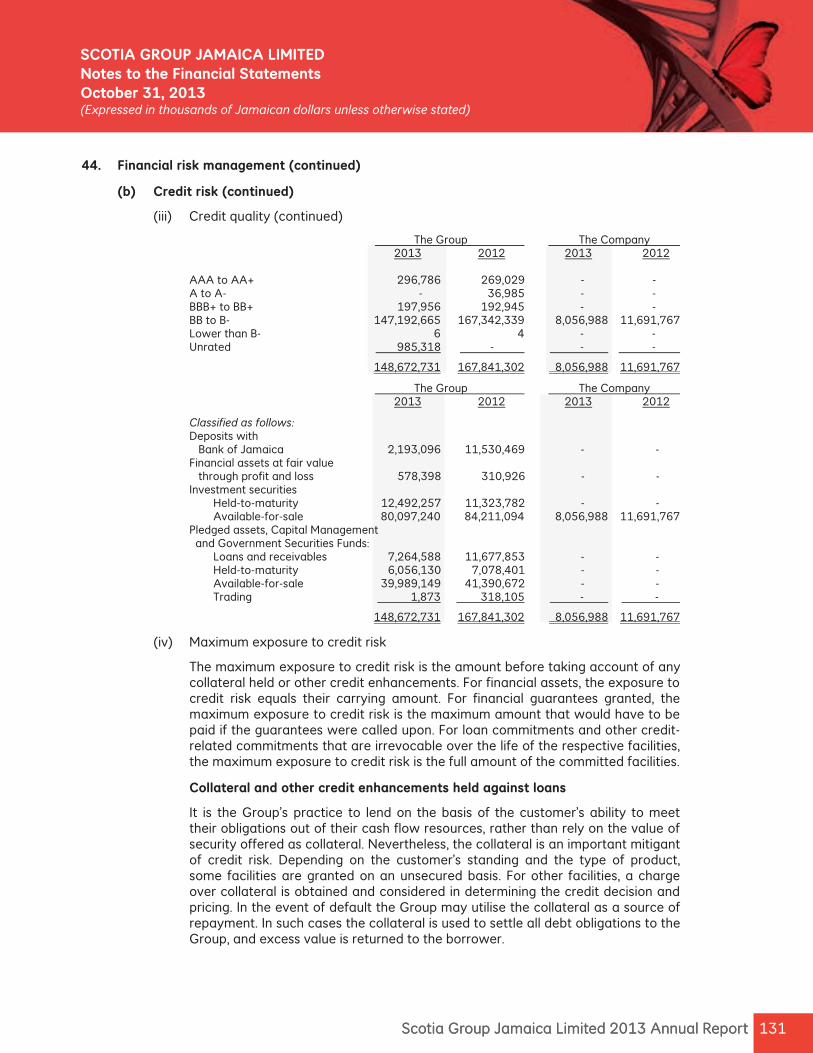
131Scotia Group Jamaica Limited 2013 Annual Report 131Scotia Group Jamaica Limited 2013 Annual Report
SCOTIA GROUP JAMAICA LIMITED Notes to the Financial StatementsOctober 31, 2013(Expressed in thousands of Jamai an dollars unless otherwise stated)
44. Financial risk management (continued)
(b) Credit risk (continued)
(iii) Credit quality (continued)
The Group The Company 2013 2012 2013 2012
AAA to AA+ 296,786 269,029 - - A to A- - 36,985 - - BBB+ to BB+ 197,956 192,945 - - BB to B- 147,192,665 167,342,339 8,056,988 11,691,767 Lower than B- 6 4 - - Unrated 985,318 - - -
148,672,731 167,841,302 8,056,988 11,691,767
The Group The Company 2013 2012 2013 2012
Classified as follows: Deposits with Bank of Jamaica 2,193,096 11,530,469 - - Financial assets at fair value through profit and loss 578,398 310,926 - - Investment securities Held-to-maturity 12,492,257 11,323,782 - - Available-for-sale 80,097,240 84,211,094 8,056,988 11,691,767 Pledged assets, Capital Management and Government Securities Funds: Loans and receivables 7,264,588 11,677,853 - - Held-to-maturity 6,056,130 7,078,401 - - Available-for-sale 39,989,149 41,390,672 - - Trading 1,873 318,105 - -
148,672,731 167,841,302 8,056,988 11,691,767
(iv) Maximum exposure to credit risk
The maximum exposure to credit risk is the amount before taking account of any collateral held or other credit enhancements. For financial assets, the exposure to credit risk equals their carrying amount. For financial guarantees granted, the maximum exposure to credit risk is the maximum amount that would have to be paid if the guarantees were called upon. For loan commitments and other credit-related commitments that are irrevocable over the life of the respective facilities, the maximum exposure to credit risk is the full amount of the committed facilities.
Collateral and other credit enhancements held against loans
It is the Group’s practice to lend on the basis of the customer’s ability to meet their obligations out of their cash flow resources, rather than rely on the value of security offered as collateral. Nevertheless, the collateral is an important mitigant of credit risk. Depending on the customer’s standing and the type of product, some facilities are granted on an unsecured basis. For other facilities, a charge over collateral is obtained and considered in determining the credit decision and pricing. In the event of default the Group may utilise the collateral as a source of repayment. In such cases the collateral is used to settle all debt obligations to the Group, and excess value is returned to the borrower.

Scotia Group Jamaica Limited 2013 Annual Report 132 Scotia Group Jamaica Limited 2013 Annual Report 132
SCOTIA GROUP JAMAICA LIMITED Notes to the Financial StatementsOctober 31, 2013(Expressed in thousands of Jamaican dollars unless otherwise stated)
44. Financial risk management (continued) (b) Credit risk (continued)
(iv) Maximum exposure to credit risk (continued) Collateral and other credit enhancements held against loans (continued) The Group holds collateral against credits to borrowers primarily in the form of cash, motor vehicles, real estate, charges over business assets such as premises, inventory and accounts receivable and charges over financial instruments such as debt securities and equities. Estimates of collateral value are assessed at the time of borrowing and are generally not updated except when credits to borrowers are individually assessed as impaired. The estimated value of the collateral with enforceable legal right pursuant to the agreements for outstanding loans and guarantees is $103,622,243 (2012:$100,805,123) for the Group.
(v) Concentration of exposure to credit risk
(1) Loans and customer liabilities under acceptances, guarantees and letters of credit
The following table summarises credit exposure for loans and customer liabilities under acceptances, guarantees and letters of credit at their carrying amounts, as categorised by the industry sectors. These credit facilities are well diversified across industry sectors, and are primarily extended to customers within Jamaica.
The Group Acceptances, Guarantees and Letters Total Total Loans of Credit 2013 2012
Agriculture, fishing and mining 922,471 35,296 957,767 864,704 Construction and real estate 1,395,850 199,544 1,595,394 1,275,117 Distribution 11,176,395 1,485,395 12,661,790 10,801,424 Financial institutions 5,367 1,210,820 1,216,187 1,567,965 Government and public entities 19,796,619 505,060 20,301,679 21,901,742 Manufacturing 4,853,010 195,509 5,048,519 5,588,673 Transportation, electricity, water and other 6,496,875 366,147 6,863,022 6,706,927 Personal 78,555,436 2,453,668 81,009,104 68,689,107 Professional and other services 5,864,858 588,938 6,453,796 6,479,955 Tourism and entertainment 6,446,684 133,237 6,579,921 6,018,590 Interest receivable 1,030,885 - 1,030,885 965,273
Total 136,544,450 7,173,614 143,718,064 130,859,477 Total impairment allowance (note 23) ( 1,720,694) ( 2,001,482)
141,997,370 128,857,995
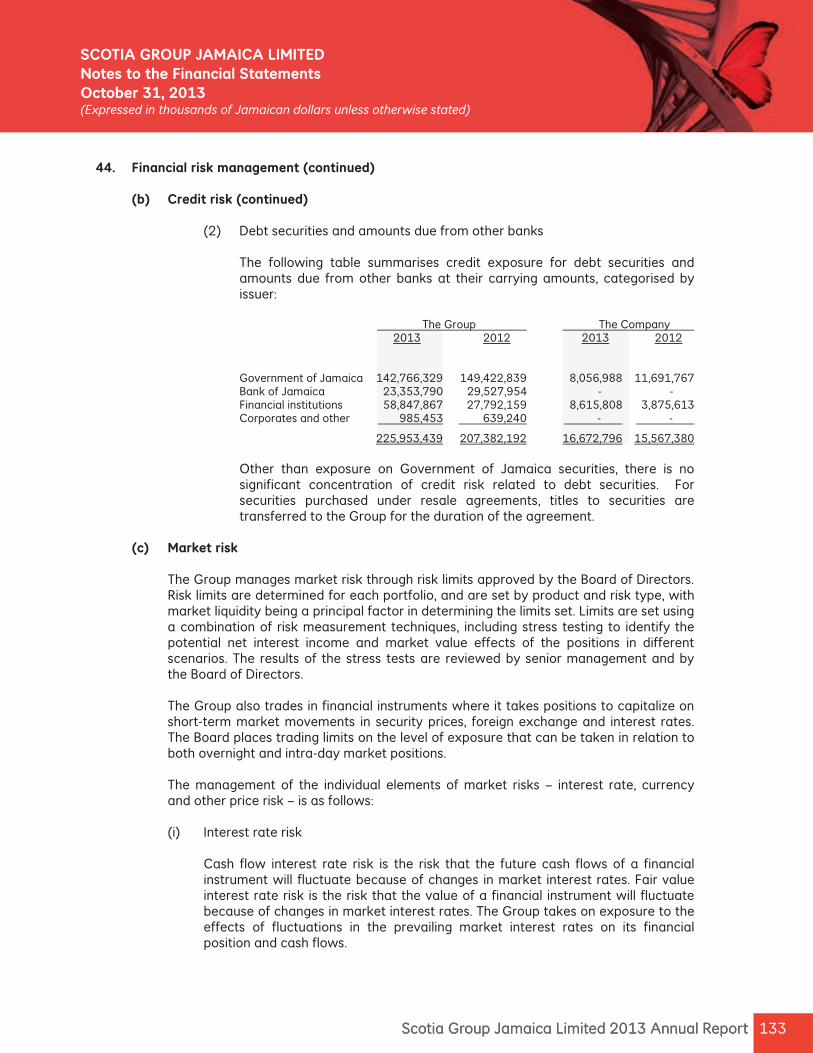
133Scotia Group Jamaica Limited 2013 Annual Report 133Scotia Group Jamaica Limited 2013 Annual Report
SCOTIA GROUP JAMAICA LIMITED Notes to the Financial StatementsOctober 31, 2013(Expressed in thousands of Jamai an dollars unless otherwise stated)
44. Financial risk management (continued)
(b) Credit risk (continued)
(2) Debt securities and amounts due from other banks
The following table summarises credit exposure for debt securities and amounts due from other banks at their carrying amounts, categorised by issuer:
The Group The Company
2013 2012 2013 2012
Government of Jamaica 142,766,329 149,422,839 8,056,988 11,691,767 Bank of Jamaica 23,353,790 29,527,954 - - Financial institutions 58,847,867 27,792,159 8,615,808 3,875,613 Corporates and other 985,453 639,240 - -
225,953,439 207,382,192 16,672,796 15,567,380
Other than exposure on Government of Jamaica securities, there is no significant concentration of credit risk related to debt securities. For securities purchased under resale agreements, titles to securities are transferred to the Group for the duration of the agreement.
(c) Market risk
The Group manages market risk through risk limits approved by the Board of Directors. Risk limits are determined for each portfolio, and are set by product and risk type, with market liquidity being a principal factor in determining the limits set. Limits are set using a combination of risk measurement techniques, including stress testing to identify the potential net interest income and market value effects of the positions in different scenarios. The results of the stress tests are reviewed by senior management and by the Board of Directors. The Group also trades in financial instruments where it takes positions to capitalize on short-term market movements in security prices, foreign exchange and interest rates. The Board places trading limits on the level of exposure that can be taken in relation to both overnight and intra-day market positions. The management of the individual elements of market risks – interest rate, currency and other price risk – is as follows: (i) Interest rate risk
Cash flow interest rate risk is the risk that the future cash flows of a financial instrument will fluctuate because of changes in market interest rates. Fair value interest rate risk is the risk that the value of a financial instrument will fluctuate because of changes in market interest rates. The Group takes on exposure to the effects of fluctuations in the prevailing market interest rates on its financial position and cash flows.
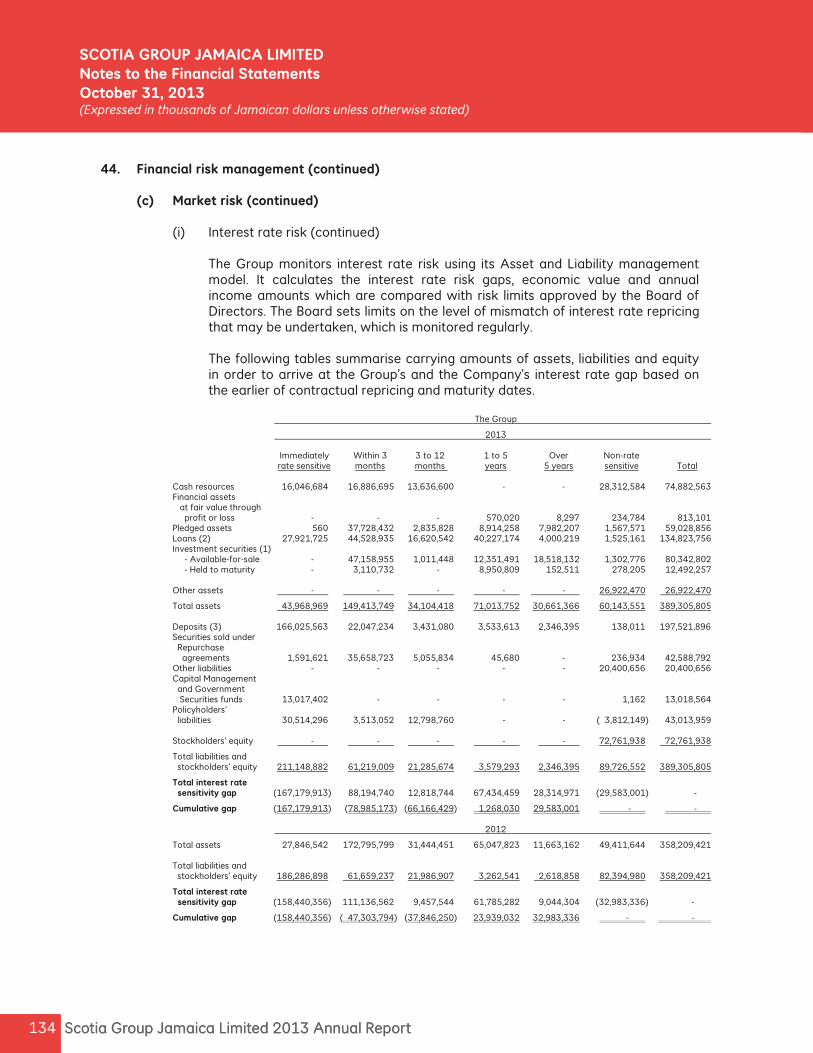
Scotia Group Jamaica Limited 2013 Annual Report 134 Scotia Group Jamaica Limited 2013 Annual Report 134
SCOTIA GROUP JAMAICA LIMITED Notes to the Financial StatementsOctober 31, 2013(Expressed in thousands of Jamai an dollars unless otherwise stated)
44. Financial risk management (continued)
(c) Market risk (continued)
(i) Interest rate risk (continued) The Group monitors interest rate risk using its Asset and Liability management model. It calculates the interest rate risk gaps, economic value and annual income amounts which are compared with risk limits approved by the Board of Directors. The Board sets limits on the level of mismatch of interest rate repricing that may be undertaken, which is monitored regularly. The following tables summarise carrying amounts of assets, liabilities and equity in order to arrive at the Group’s and the Company’s interest rate gap based on the earlier of contractual repricing and maturity dates.
The Group
2013 Immediately Within 3 3 to 12 1 to 5 Over Non-rate rate sensitive months months years 5 years sensitive Total Cash resources 16,046,684 16,886,695 13,636,600 - - 28,312,584 74,882,563
Financial assets at fair value through profit or loss - - - 570,020 8,297 234,784 813,101
Pledged assets 560 37,728,432 2,835,828 8,914,258 7,982,207 1,567,571 59,028,856 Loans (2) 27,921,725 44,528,935 16,620,542 40,227,174 4,000,219 1,525,161 134,823,756 Investment securities (1) - Available-for-sale - 47,158,955 1,011,448 12,351,491 18,518,132 1,302,776 80,342,802 - Held to maturity - 3,110,732 - 8,950,809 152,511 278,205 12,492,257 Other assets - - - - - 26,922,470 26,922,470
Total assets 43,968,969 149,413,749 34,104,418 71,013,752 30,661,366 60,143,551 389,305,805 Deposits (3) 166,025,563 22,047,234 3,431,080 3,533,613 2,346,395 138,011 197,521,896 Securities sold under Repurchase agreements 1,591,621 35,658,723 5,055,834 45,680 - 236,934 42,588,792 Other liabilities - - - - - 20,400,656 20,400,656 Capital Management and Government Securities funds 13,017,402 - - - - 1,162 13,018,564 Policyholders’ liabilities 30,514,296 3,513,052 12,798,760 - - ( 3,812,149) 43,013,959 Stockholders’ equity - - - - - 72,761,938 72,761,938
Total liabilities and stockholders’ equity 211,148,882 61,219,009 21,285,674 3,579,293 2,346,395 89,726,552 389,305,805
Total interest rate sensitivity gap (167,179,913) 88,194,740 12,818,744 67,434,459 28,314,971 (29,583,001) -
Cumulative gap (167,179,913) (78,985,173) (66,166,429) 1,268,030 29,583,001 - - 2012
Total assets 27,846,542 172,795,799 31,444,451 65,047,823 11,663,162 49,411,644 358,209,421 Total liabilities and stockholders’ equity 186,286,898 61,659,237 21,986,907 3,262,541 2,618,858 82,394,980 358,209,421
Total interest rate sensitivity gap (158,440,356) 111,136,562 9,457,544 61,785,282 9,044,304 (32,983,336) -
Cumulative gap (158,440,356) ( 47,303,794) (37,846,250) 23,939,032 32,983,336 - -
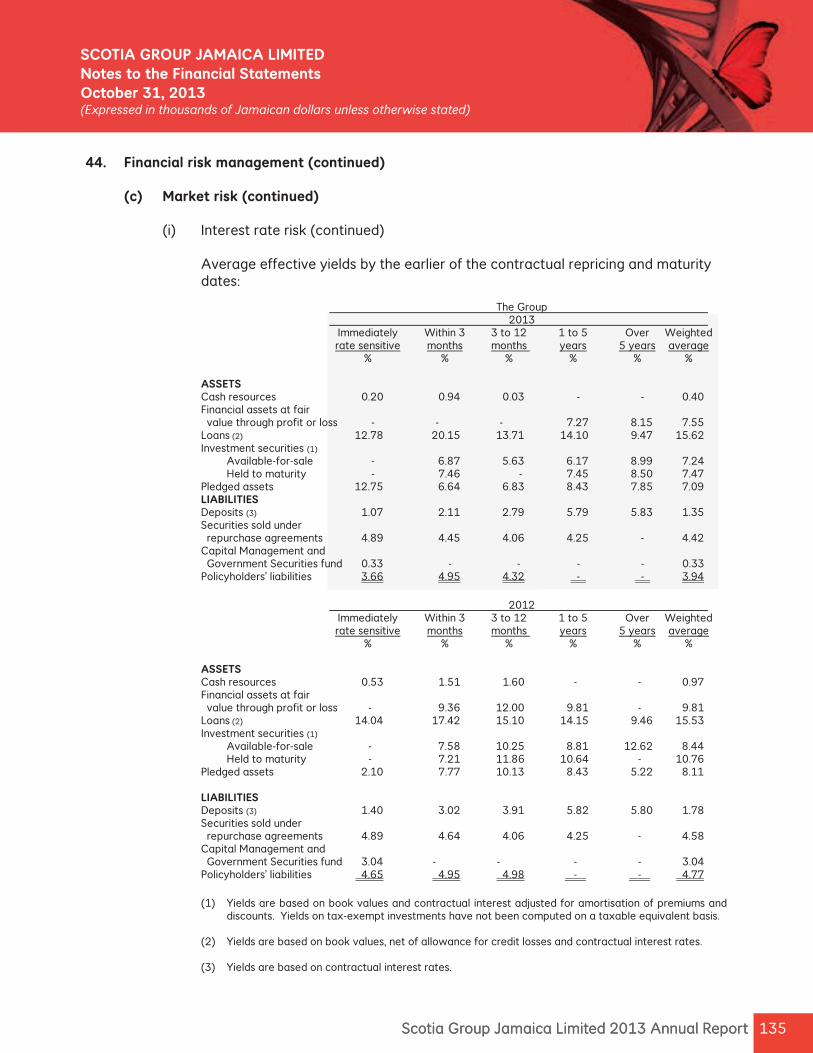
135Scotia Group Jamaica Limited 2013 Annual Report
44. Financial risk management (continued)
(c) Market risk (continued) (i) Interest rate risk (continued)
Average effective yields by the earlier of the contractual repricing and maturity
dates:
The Group 2013 Immediately Within 3 3 to 12 1 to 5 Over Weighted rate sensitive months months years 5 years average % % % % % %
ASSETS Cash resources 0.20 0.94 0.03 - - 0.40 Financial assets at fair value through profit or loss - - - 7.27 8.15 7.55 Loans (2) 12.78 20.15 13.71 14.10 9.47 15.62 Investment securities (1) Available-for-sale - 6.87 5.63 6.17 8.99 7.24 Held to maturity - 7.46 - 7.45 8.50 7.47 Pledged assets 12.75 6.64 6.83 8.43 7.85 7.09 LIABILITIES Deposits (3) 1.07 2.11 2.79 5.79 5.83 1.35 Securities sold under repurchase agreements 4.89 4.45 4.06 4.25 - 4.42 Capital Management and Government Securities fund 0.33 - - - - 0.33 Policyholders’ liabilities 3.66 4.95 4.32 - - 3.94
2012 Immediately Within 3 3 to 12 1 to 5 Over Weighted rate sensitive months months years 5 years average % % % % % %
ASSETS Cash resources 0.53 1.51 1.60 - - 0.97 Financial assets at fair value through profit or loss - 9.36 12.00 9.81 - 9.81 Loans (2) 14.04 17.42 15.10 14.15 9.46 15.53 Investment securities (1) Available-for-sale - 7.58 10.25 8.81 12.62 8.44 Held to maturity - 7.21 11.86 10.64 - 10.76 Pledged assets 2.10 7.77 10.13 8.43 5.22 8.11 LIABILITIES Deposits (3) 1.40 3.02 3.91 5.82 5.80 1.78 Securities sold under repurchase agreements 4.89 4.64 4.06 4.25 - 4.58 Capital Management and Government Securities fund 3.04 - - - - 3.04 Policyholders’ liabilities 4.65 4.95 4.98 - - 4.77
(1) Yields are based on book values and contractual interest adjusted for amortisation of premiums and
discounts. Yields on tax-exempt investments have not been computed on a taxable equivalent basis. (2) Yields are based on book values, net of allowance for credit losses and contractual interest rates. (3) Yields are based on contractual interest rates.
135Scotia Group Jamaica Limited 2013 Annual Report
SCOTIA GROUP JAMAICA LIMITED Notes to the Financial StatementsOctober 31, 2013(Expressed in thousands of Jamai an dollars unless otherwise stated)
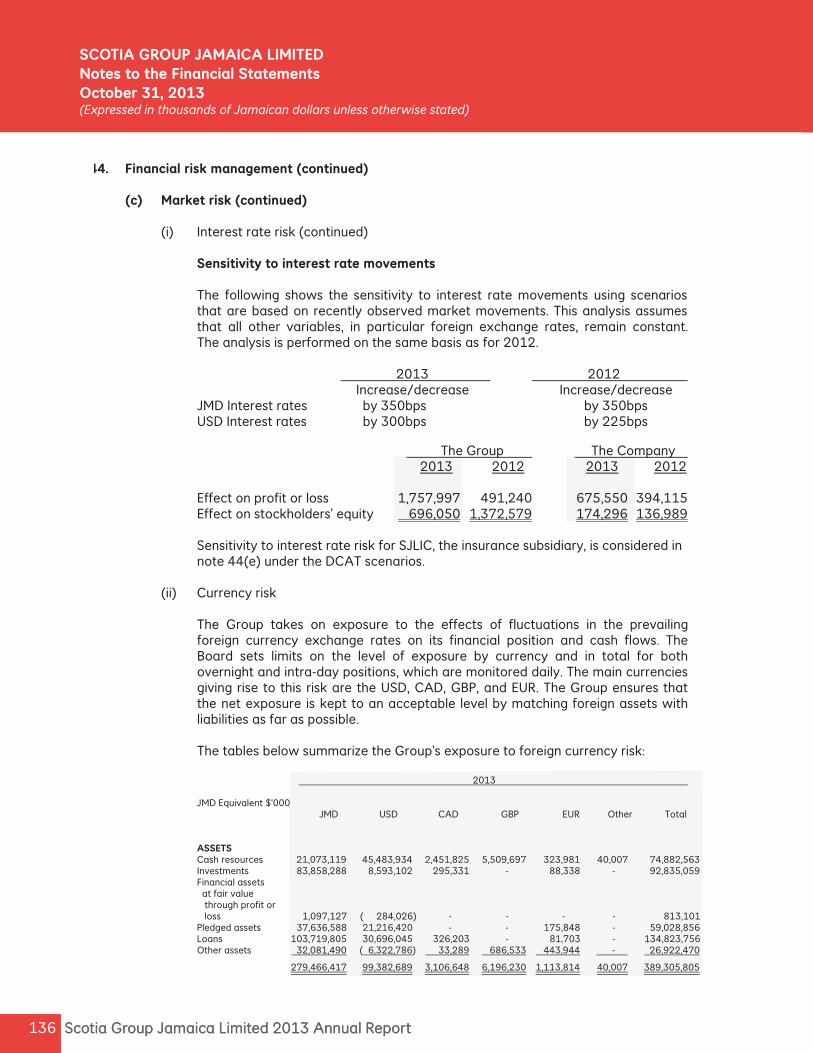
Scotia Group Jamaica Limited 2013 Annual Report 136 Scotia Group Jamaica Limited 2013 Annual Report 136
SCOTIA GROUP JAMAICA LIMITED Notes to the Financial StatementsOctober 31, 2013(Expressed in thousands of Jamai an dollars unless otherwise stated)
44. Financial risk management (continued)
(c) Market risk (continued) (i) Interest rate risk (continued)
Sensitivity to interest rate movements
The following shows the sensitivity to interest rate movements using scenarios that are based on recently observed market movements. This analysis assumes that all other variables, in particular foreign exchange rates, remain constant. The analysis is performed on the same basis as for 2012.
2013 2012 Increase/decrease Increase/decrease JMD Interest rates by 350bps by 350bps USD Interest rates by 300bps by 225bps
The Group The Company
2013 2012 2013 2012 Effect on profit or loss 1,757,997 491,240 675,550 394,115 Effect on stockholders’ equity 696,050 1,372,579 174,296 136,989 Sensitivity to interest rate risk for SJLIC, the insurance subsidiary, is considered in note 44(e) under the DCAT scenarios.
(ii) Currency risk
The Group takes on exposure to the effects of fluctuations in the prevailing foreign currency exchange rates on its financial position and cash flows. The Board sets limits on the level of exposure by currency and in total for both overnight and intra-day positions, which are monitored daily. The main currencies giving rise to this risk are the USD, CAD, GBP, and EUR. The Group ensures that the net exposure is kept to an acceptable level by matching foreign assets with liabilities as far as possible.
The tables below summarize the Group’s exposure to foreign currency risk:
2013
JMD Equivalent $‘000 JMD USD CAD GBP EUR Other Total
ASSETS Cash resources 21,073,119 45,483,934 2,451,825 5,509,697 323,981 40,007 74,882,563 Investments 83,858,288 8,593,102 295,331 - 88,338 - 92,835,059 Financial assets at fair value through profit or loss 1,097,127 ( 284,026) - - - - 813,101 Pledged assets 37,636,588 21,216,420 - - 175,848 - 59,028,856 Loans 103,719,805 30,696,045 326,203 - 81,703 - 134,823,756 Other assets 32,081,490 ( 6,322,786) 33,289 686,533 443,944 - 26,922,470
279,466,417 99,382,689 3,106,648 6,196,230 1,113,814 40,007 389,305,805
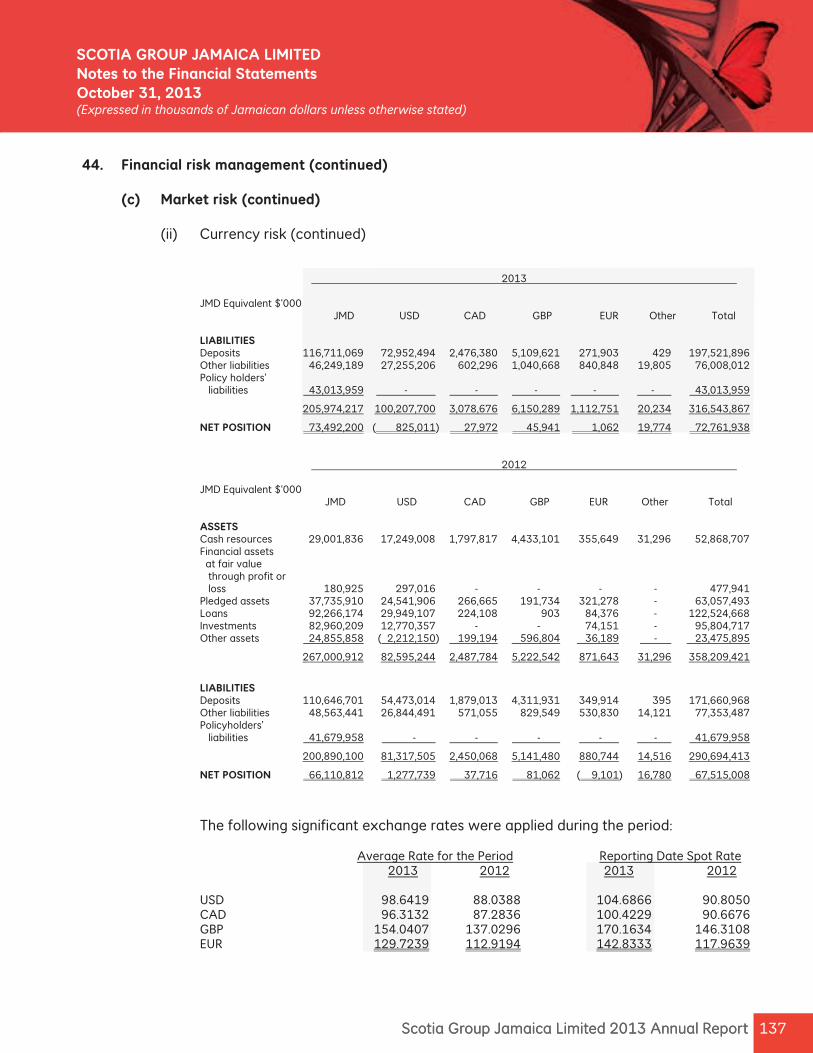
137Scotia Group Jamaica Limited 2013 Annual Report 137Scotia Group Jamaica Limited 2013 Annual Report
SCOTIA GROUP JAMAICA LIMITED Notes to the Financial StatementsOctober 31, 2013(Expressed in thousands of Jamai an dollars unless otherwise stated)
44. Financial risk management (continued)
(c) Market risk (continued)
(ii) Currency risk (continued)
2013
JMD Equivalent $‘000 JMD USD CAD GBP EUR Other Total
LIABILITIES Deposits 116,711,069 72,952,494 2,476,380 5,109,621 271,903 429 197,521,896 Other liabilities 46,249,189 27,255,206 602,296 1,040,668 840,848 19,805 76,008,012 Policy holders’ liabilities 43,013,959 - - - - - 43,013,959
205,974,217 100,207,700 3,078,676 6,150,289 1,112,751 20,234 316,543,867
NET POSITION 73,492,200 ( 825,011) 27,972 45,941 1,062 19,774 72,761,938 2012
JMD Equivalent $‘000 JMD USD CAD GBP EUR Other Total
ASSETS Cash resources 29,001,836 17,249,008 1,797,817 4,433,101 355,649 31,296 52,868,707 Financial assets at fair value through profit or loss 180,925 297,016 - - - - 477,941 Pledged assets 37,735,910 24,541,906 266,665 191,734 321,278 - 63,057,493 Loans 92,266,174 29,949,107 224,108 903 84,376 - 122,524,668 Investments 82,960,209 12,770,357 - - 74,151 - 95,804,717 Other assets 24,855,858 ( 2,212,150) 199,194 596,804 36,189 - 23,475,895
267,000,912 82,595,244 2,487,784 5,222,542 871,643 31,296 358,209,421
LIABILITIES Deposits 110,646,701 54,473,014 1,879,013 4,311,931 349,914 395 171,660,968 Other liabilities 48,563,441 26,844,491 571,055 829,549 530,830 14,121 77,353,487 Policyholders’ liabilities 41,679,958 - - - - - 41,679,958
200,890,100 81,317,505 2,450,068 5,141,480 880,744 14,516 290,694,413
NET POSITION 66,110,812 1,277,739 37,716 81,062 ( 9,101) 16,780 67,515,008
The following significant exchange rates were applied during the period:
Average Rate for the Period Reporting Date Spot Rate 2013 2012 2013 2012
USD 98.6419 88.0388 104.6866 90.8050 CAD 96.3132 87.2836 100.4229 90.6676 GBP 154.0407 137.0296 170.1634 146.3108 EUR 129.7239 112.9194 142.8333 117.9639
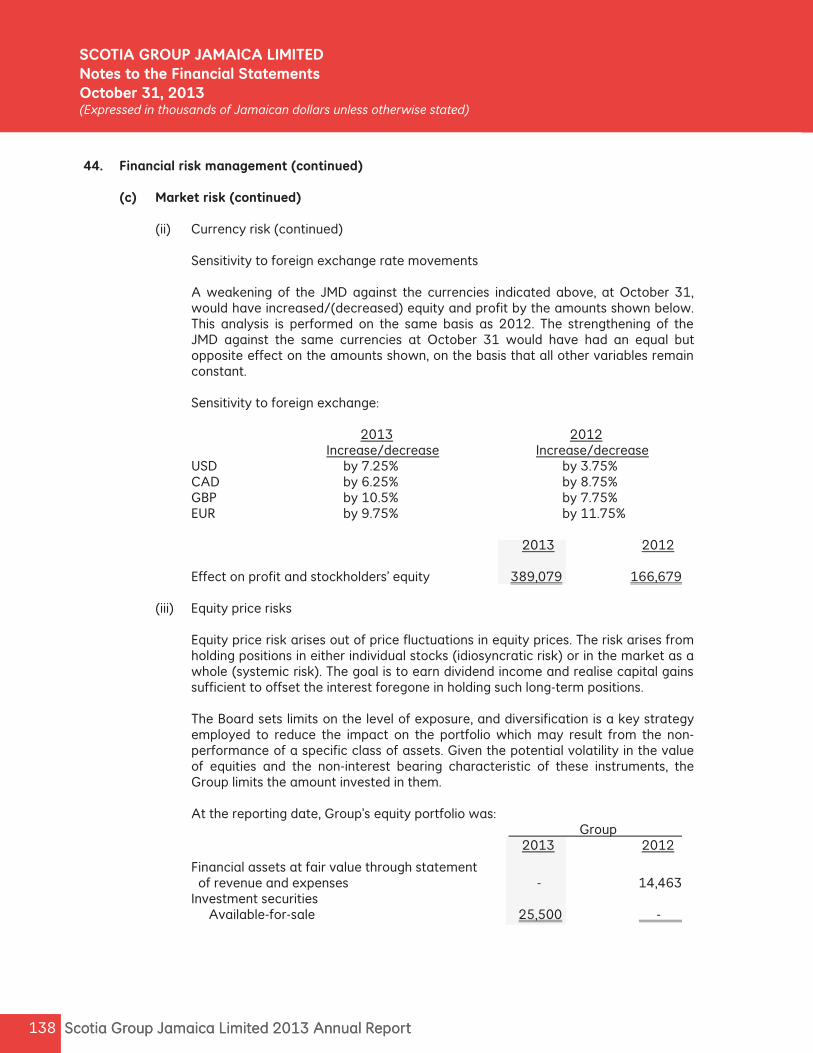
Scotia Group Jamaica Limited 2013 Annual Report 138 Scotia Group Jamaica Limited 2013 Annual Report 138
SCOTIA GROUP JAMAICA LIMITED Notes to the Financial StatementsOctober 31, 2013(Expressed in thousands of Jamai an dollars unless otherwise stated)
44. Financial risk management (continued)
(c) Market risk (continued)
(ii) Currency risk (continued) Sensitivity to foreign exchange rate movements A weakening of the JMD against the currencies indicated above, at October 31, would have increased/(decreased) equity and profit by the amounts shown below. This analysis is performed on the same basis as 2012. The strengthening of the JMD against the same currencies at October 31 would have had an equal but opposite effect on the amounts shown, on the basis that all other variables remain constant. Sensitivity to foreign exchange:
2013 2012
Increase/decrease Increase/decrease USD by 7.25% by 3.75% CAD by 6.25% by 8.75% GBP by 10.5% by 7.75% EUR by 9.75% by 11.75%
2013 2012
Effect on profit and stockholders’ equity 389,079 166,679
(iii) Equity price risks
Equity price risk arises out of price fluctuations in equity prices. The risk arises from holding positions in either individual stocks (idiosyncratic risk) or in the market as a whole (systemic risk). The goal is to earn dividend income and realise capital gains sufficient to offset the interest foregone in holding such long-term positions. The Board sets limits on the level of exposure, and diversification is a key strategy employed to reduce the impact on the portfolio which may result from the non-performance of a specific class of assets. Given the potential volatility in the value of equities and the non-interest bearing characteristic of these instruments, the Group limits the amount invested in them.
At the reporting date, Group’s equity portfolio was: Group
2013 2012
Financial assets at fair value through statement of revenue and expenses - 14,463 Investment securities Available-for-sale 25,500 -
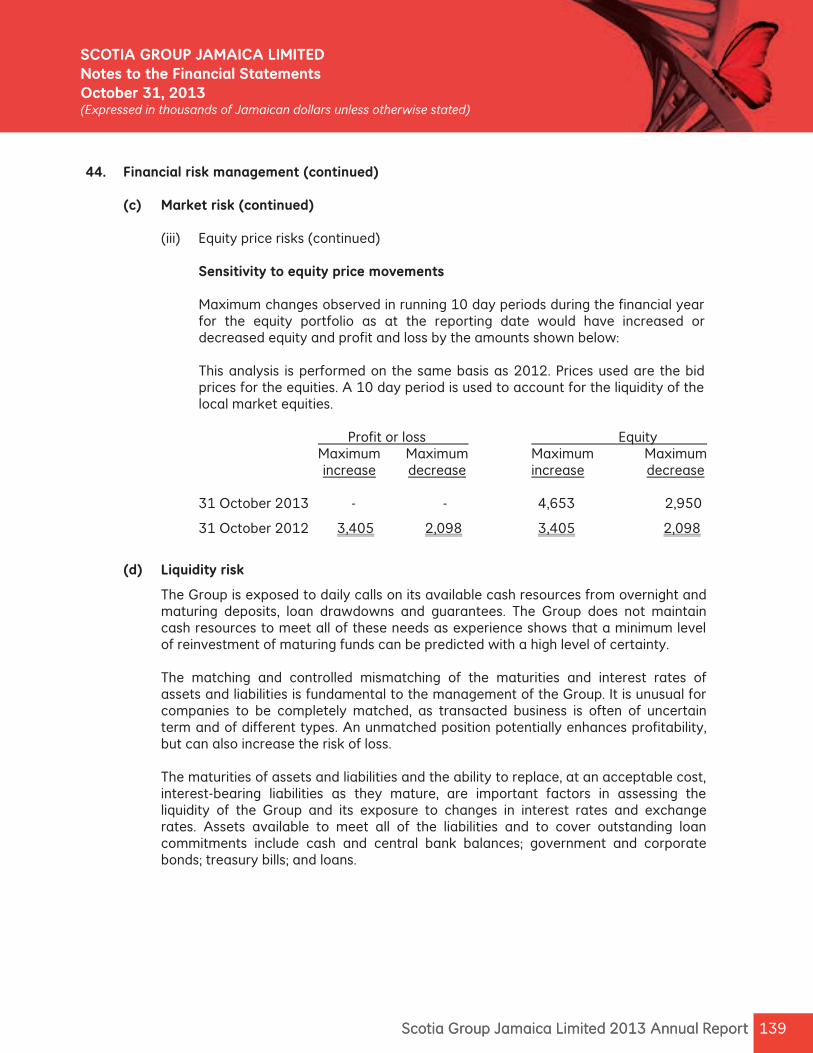
139Scotia Group Jamaica Limited 2013 Annual Report 139Scotia Group Jamaica Limited 2013 Annual Report
SCOTIA GROUP JAMAICA LIMITED Notes to the Financial StatementsOctober 31, 2013(Expressed in thousands of Jamai an dollars unless otherwise stated)
44. Financial risk management (continued)
(c) Market risk (continued)
(iii) Equity price risks (continued)
Sensitivity to equity price movements Maximum changes observed in running 10 day periods during the financial year for the equity portfolio as at the reporting date would have increased or decreased equity and profit and loss by the amounts shown below: This analysis is performed on the same basis as 2012. Prices used are the bid prices for the equities. A 10 day period is used to account for the liquidity of the local market equities.
Profit or loss Equity Maximum Maximum Maximum Maximum increase decrease increase decrease
31 October 2013 - - 4,653 2,950
31 October 2012 3,405 2,098 3,405 2,098
(d) Liquidity risk
The Group is exposed to daily calls on its available cash resources from overnight and maturing deposits, loan drawdowns and guarantees. The Group does not maintain cash resources to meet all of these needs as experience shows that a minimum level of reinvestment of maturing funds can be predicted with a high level of certainty.
The matching and controlled mismatching of the maturities and interest rates of assets and liabilities is fundamental to the management of the Group. It is unusual for companies to be completely matched, as transacted business is often of uncertain term and of different types. An unmatched position potentially enhances profitability, but can also increase the risk of loss. The maturities of assets and liabilities and the ability to replace, at an acceptable cost, interest-bearing liabilities as they mature, are important factors in assessing the liquidity of the Group and its exposure to changes in interest rates and exchange rates. Assets available to meet all of the liabilities and to cover outstanding loan commitments include cash and central bank balances; government and corporate bonds; treasury bills; and loans.
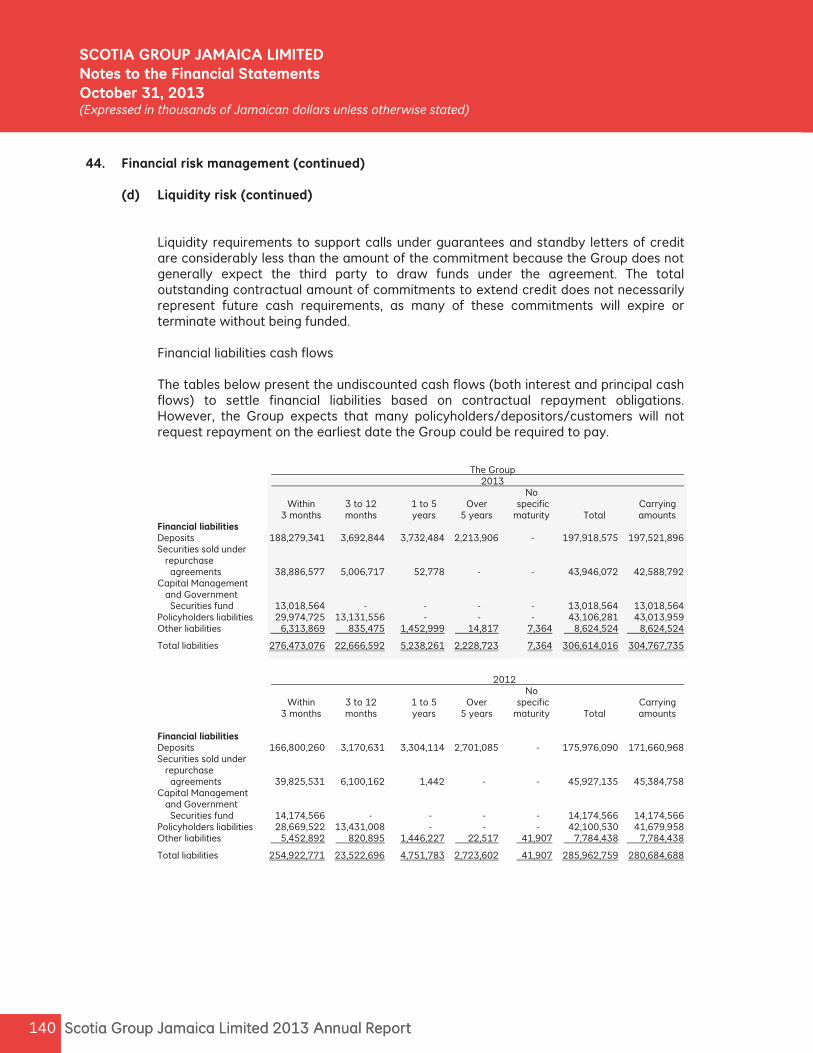
Scotia Group Jamaica Limited 2013 Annual Report 140
44. Financial risk management (continued)
(d) Liquidity risk (continued)
Liquidity requirements to support calls under guarantees and standby letters of credit are considerably less than the amount of the commitment because the Group does not generally expect the third party to draw funds under the agreement. The total outstanding contractual amount of commitments to extend credit does not necessarily represent future cash requirements, as many of these commitments will expire or terminate without being funded.
Financial liabilities cash flows The tables below present the undiscounted cash flows (both interest and principal cash flows) to settle financial liabilities based on contractual repayment obligations. However, the Group expects that many policyholders/depositors/customers will not request repayment on the earliest date the Group could be required to pay.
The Group 2013 No Within 3 to 12 1 to 5 Over specific Carrying 3 months months years 5 years maturity Total amounts
Financial liabilities Deposits 188,279,341 3,692,844 3,732,484 2,213,906 - 197,918,575 197,521,896 Securities sold under repurchase agreements 38,886,577 5,006,717 52,778 - - 43,946,072 42,588,792 Capital Management and Government Securities fund 13,018,564 - - - - 13,018,564 13,018,564 Policyholders liabilities 29,974,725 13,131,556 - - - 43,106,281 43,013,959 Other liabilities 6,313,869 835,475 1,452,999 14,817 7,364 8,624,524 8,624,524
Total liabilities 276,473,076 22,666,592 5,238,261 2,228,723 7,364 306,614,016 304,767,735
2012 No Within 3 to 12 1 to 5 Over specific Carrying 3 months months years 5 years maturity Total amounts
Financial liabilities Deposits 166,800,260 3,170,631 3,304,114 2,701,085 - 175,976,090 171,660,968 Securities sold under repurchase agreements 39,825,531 6,100,162 1,442 - - 45,927,135 45,384,758 Capital Management and Government Securities fund 14,174,566 - - - - 14,174,566 14,174,566 Policyholders liabilities 28,669,522 13,431,008 - - - 42,100,530 41,679,958 Other liabilities 5,452,892 820,895 1,446,227 22,517 41,907 7,784,438 7,784,438
Total liabilities 254,922,771 23,522,696 4,751,783 2,723,602 41,907 285,962,759 280,684,688
Scotia Group Jamaica Limited 2013 Annual Report 140
SCOTIA GROUP JAMAICA LIMITED Notes to the Financial StatementsOctober 31, 2013(Expressed in thousands of Jamai an dollars unless otherwise stated)
141Scotia Group Jamaica Limited 2013 Annual Report 141Scotia Group Jamaica Limited 2013 Annual Report
SCOTIA GROUP JAMAICA LIMITED Notes to the Financial StatementsOctober 31, 2013(Expressed in thousands of Jamai an dollars unless otherwise stated)
44. Financial risk management (continued)
(e) Insurance risk
The Group issues long term contracts that transfer insurance risk or financial risk or both. The risk under any one insurance contract is the possibility that the insured event occurs and the uncertainty of the amount of the resulting claim. By the very nature of an insurance contract, this risk is random and therefore unpredictable. For a portfolio of insurance contracts where the theory of probability is applied to pricing and provisioning, the principal risk that the company faces under its insurance contracts is that the actual claims and benefit payments exceed the carrying amount of the insurance liabilities. This could occur because the frequency or severity of claims and benefits is greater than estimated. Insurance events are random and the actual number and amount of claims and benefits will vary from year to year from the estimate established using statistical techniques. Experience shows that the larger the portfolio of similar insurance contracts, the smaller the relative variability about the expected outcome will be. In addition, a more diversified portfolio is less likely to be affected by a change in any subset of the portfolio. Two key matters affecting insurance risk are discussed below:
(i) Long-term insurance contracts
Long-term contracts are typically for a minimum period of 5 years and a maximum period which is determined by the remaining life of the insured. In addition to the estimated benefits which may be payable under the contract, the insurer has to assess the cash flows which may be attributable to the contract. The Group has developed its insurance underwriting strategy and reinsurance arrangements to diversify the type of insurance risks accepted and within each of these categories to achieve a sufficiently large population of risks to reduce the variability of the expected outcome. The Group’s underwriting strategy includes the use of a medical questionnaire with benefits limited to reflect the health condition of applications and retention limits on any single life insured.
(1) Frequency and severity of claims
For contracts where death is the insured risk, the most significant factors that could increase the overall frequency and severity of claims are epidemics and wide-ranging lifestyle changes such as in eating, smoking and exercise habits resulting in earlier or more claims than expected. The Group charges for mortality risks on a monthly basis for all insurance contracts and has the right to alter these charges to a certain extent based on mortality experience and hence minimize its exposure to mortality risk. Delays in implementing increases in charges and market or regulatory restraints over the extent of the increases may reduce its mitigating effect.
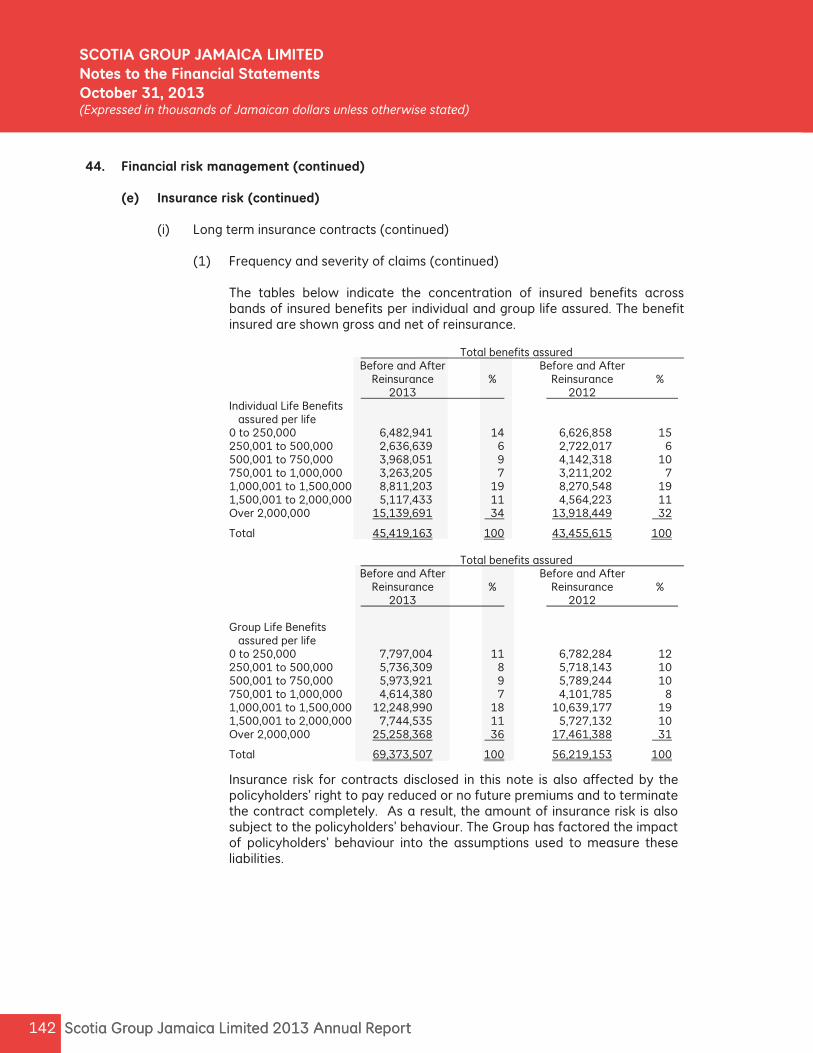
Scotia Group Jamaica Limited 2013 Annual Report 142 Scotia Group Jamaica Limited 2013 Annual Report 142
SCOTIA GROUP JAMAICA LIMITED Notes to the Financial StatementsOctober 31, 2013(Expressed in thousands of Jamai an dollars unless otherwise stated)
44. Financial risk management (continued)
(e) Insurance risk (continued)
(i) Long term insurance contracts (continued)
(1) Frequency and severity of claims (continued) The tables below indicate the concentration of insured benefits across
bands of insured benefits per individual and group life assured. The benefit insured are shown gross and net of reinsurance.
Total benefits assured Before and After Before and After Reinsurance % Reinsurance % 2013 2012
Individual Life Benefits assured per life 0 to 250,000 6,482,941 14 6,626,858 15 250,001 to 500,000 2,636,639 6 2,722,017 6 500,001 to 750,000 3,968,051 9 4,142,318 10 750,001 to 1,000,000 3,263,205 7 3,211,202 7 1,000,001 to 1,500,000 8,811,203 19 8,270,548 19 1,500,001 to 2,000,000 5,117,433 11 4,564,223 11 Over 2,000,000 15,139,691 34 13,918,449 32
Total 45,419,163 100 43,455,615 100
Total benefits assured Before and After Before and After Reinsurance % Reinsurance % 2013 2012
Group Life Benefits assured per life 0 to 250,000 7,797,004 11 6,782,284 12 250,001 to 500,000 5,736,309 8 5,718,143 10 500,001 to 750,000 5,973,921 9 5,789,244 10 750,001 to 1,000,000 4,614,380 7 4,101,785 8 1,000,001 to 1,500,000 12,248,990 18 10,639,177 19 1,500,001 to 2,000,000 7,744,535 11 5,727,132 10 Over 2,000,000 25,258,368 36 17,461,388 31
Total 69,373,507 100 56,219,153 100
Insurance risk for contracts disclosed in this note is also affected by the policyholders’ right to pay reduced or no future premiums and to terminate the contract completely. As a result, the amount of insurance risk is also subject to the policyholders’ behaviour. The Group has factored the impact of policyholders’ behaviour into the assumptions used to measure these liabilities.
143Scotia Group Jamaica Limited 2013 Annual Report 143Scotia Group Jamaica Limited 2013 Annual Report
SCOTIA GROUP JAMAICA LIMITED Notes to the Financial StatementsOctober 31, 2013(Expressed in thousands of Jamai an dollars unless otherwise stated)
44. Financial risk management (continued)
(e) Insurance risk (continued)
(i) Long term insurance contracts (continued)
(2) Sources of uncertainty in the estimation of future benefit payments and premiums
Uncertainty in the estimation of future benefit payments and premium receipts for long term insurance contracts arises from the unpredictability of long-term changes in overall levels of mortality and the variability in policyholder behaviour. Estimates are made as to the expected number of deaths for each of the years in which the Group is exposed to risk. The Group bases these estimates on standard industry and international mortality tables that reflect recent historical mortality experience, adjusted where appropriate to reflect the Group’s own experience.
(3) Process used in deriving assumptions
The assumptions for long term insurance contracts and the process used in deriving these assumptions have remained substantially unchanged since the previous year. For long-term contracts with fixed and guaranteed terms, estimates are made in two stages. Estimates of future deaths, voluntary terminations and partial withdrawal of policy funds, investment returns, crediting rates, inflation and administration expenses are made and form the assumptions used for calculating the liabilities at the inception of the contract. A margin for risk and uncertainty is added to these assumptions.
New estimates are made each year based on updated Group experience studies and economic forecasts. The valuation assumptions are altered to reflect these revised best estimates. The margins for risk and uncertainty may also be altered if the underlying level of uncertainty in the updated assumptions has changed. The financial impact of revisions to the valuation assumption or the related margins is recognised in the accounting period in which the change is made. See note 36(c) for detailed policy assumptions.
Scotia Group Jamaica Limited 2013 Annual Report 144 Scotia Group Jamaica Limited 2013 Annual Report 144
SCOTIA GROUP JAMAICA LIMITED Notes to the Financial StatementsOctober 31, 2013(Expressed in thousands of Jamai an dollars unless otherwise stated)
44. Financial risk management (continued)
(e) Insurance risk (continued)
(ii) Reinsurance Risk
Reinsurance risk is the risk that a reinsurer will default and not honour obligations arising from claims. To limit its exposure of potential loss on an insurance policy, the Group cedes certain levels of risk to a reinsurer. Reinsurance ceded does not discharge the Group’s liability as primary issuer. The Group also limits the probable loss in the event of a single catastrophic occurrence by reinsuring this type of risk with reinsurers. The Group manages reinsurance risk by selecting reinsurers which have established capability to meet their contractual obligations and which generally have favourable credit ratings as determined by a reputable rating agency.
Retention limits represent the level of risk retained by the insurer. Coverage in excess of these limits is ceded to reinsurers up to the treaty limit. The retention programs used by the Group are summarized below: Type of insurance contract Retention
Individual, group & creditor life maximum retention of $420 for a single catastrophe event; treaty limits apply Group creditor life contracts maximum retention of $15,000 per insured
(iii) Sensitivity analysis of actuarial liabilities
(1) Sensitivity arising from the valuation of life insurance contracts
The determination of actuarial liabilities is sensitive to a number of assumptions, and changes in these assumptions could have a significant effect on the valuation results.
In summary, the valuation of actuarial liabilities of life insurance contracts is
sensitive to: the economic scenario used in the Policy Premium Method (PPM) the investments allocated to back the liabilities the underlying assumptions used, and the margins for adverse deviations.
Under the Policy Premium Method (PPM) methodology, the Appointed Actuary is required to test the actuarial liability under several economic scenarios. The tests have been done and the results of the valuation provide adequately for liabilities derived from the worst of these different scenarios. The assumption for future investment yields has a significant impact on actuarial liabilities. The different scenarios tested under PPM reflect the impact of different yields.
145Scotia Group Jamaica Limited 2013 Annual Report
44. Financial risk management (continued)
(e) Insurance risk (continued)
(iii) Sensitivity analysis of actuarial liabilities (continued)
(1) Sensitivity arising from the valuation of life insurance contracts (continued)
The other assumptions which are most sensitive in determining the actuarial liabilities of the Group, are in descending order of impact:
operating expenses and taxes lapse mortality and morbidity
The following table presents the sensitivity of the liabilities to a change in assumptions:
2013 2012
Interest rates decrease by 1% 96,035 56,420 Interest rates increase by 1% ( 38,952) ( 32,987) Mortality increases by 10% 342,361 288,517 Mortality decreases by 10% (353,322) (297,565) Expenses increase by 10% 303,034 274,871 Expenses decrease by 10% (299,095) (271,223) Lapses and withdrawals increase by 10% 227,804 202,989 Lapses and withdrawals decrease by 10% (250,012) (223,388)
(2) Dynamic capital adequacy testing (DCAT)
DCAT is a technique used by the Group to assess the adequacy of its financial position and financial condition in the light of different future economic and policy experience scenarios. DCAT assesses the impact of the Group’s financial position and condition over the next 5 years under specific scenarios as required by the Insurance Regulations. The financial position of the Group is reflected by the amount of assets, liabilities and equity reported in the statement of financial position at a given date. The financial condition of the Group at a given date is its prospective ability to meet its future obligations, especially obligations to policyholders, those to whom it owes benefits and to its shareholders.
145Scotia Group Jamaica Limited 2013 Annual Report
SCOTIA GROUP JAMAICA LIMITED Notes to the Financial StatementsOctober 31, 2013(Expressed in thousands of Jamai an dollars unless otherwise stated)
Scotia Group Jamaica Limited 2013 Annual Report 146 Scotia Group Jamaica Limited 2013 Annual Report 146
SCOTIA GROUP JAMAICA LIMITED Notes to the Financial StatementsOctober 31, 2013(Expressed in thousands of Jamai an dollars unless otherwise stated)
44. Financial risk management (continued)
(e) Insurance risk (continued)
(iii) Sensitivity analysis of actuarial liabilities (continued)
(2) Dynamic capital adequacy testing (DCAT) (continued)
The purpose of the DCAT is:
to develop an understanding of the sensitivity of the total equity of the Group and future financial condition to changes in various experience factors and management policies; to alert management to material, plausible and imminent threats to the Group’s solvency; and to describe possible courses of action to address these threats.
A full DCAT report was completed for the Group during 2013, and the results were as follows:
Mortality and morbidity risks To test this scenario, existing mortality and morbidity rates were increased by 3% starting in 2013, for five years. The accumulated deterioration would be 15% by the end of the five-year DCAT period. The results for this scenario show relative insensitivity to the change in assumptions.
Low lapse rates The business was tested by applying a factor of 0.5 to existing lapse and surrender rates. Overall, this scenario produces a higher surplus and a lower MCCSR ratio over the 5-year period.
Higher lapse rates The business was tested by doubling existing lapses, surrenders and partial withdrawal rates. Under this scenario, the surplus decreases while the MCCSR increases.
Expense risks Higher unit maintenance expenses were tested by setting the annual inflation at 5% greater than current expenses, starting in 2013, for five years. Overall, this scenario produces a lower MCCSR ratio over the 5-year period.
Low interest rate An assumed decrease in the portfolio rate of 5% over a 5 year period was tested in this scenario. It is assumed that inflation ultimately decreases by 5.75%. Overall, this scenario produces a lower MCCSR over the five year period.
147Scotia Group Jamaica Limited 2013 Annual Report
44. Financial risk management (continued)
(e) Insurance risk (continued)
(iii) Sensitivity analysis of actuarial liabilities (continued)
(2) Dynamic capital adequacy testing (DCAT) (continued)
High interest rate This scenario assumed an increase of 5% over a 5 year period in the portfolio rate. It is also assumed that inflation increased by 3% over the same period. Overall, this scenario produces a lower MCCSR over the five year period.
High sales growth New business was projected to be 20% higher than existing sales per year over five years. The increased sales result in increased profits but the MCCSR ratio falls.
Low sales This scenario assumed sales were 20% less every year starting 2013. Fees are also lower than under the base scenario. Overall this scenario produces a reduced surplus and an improvement in the MCCSR.
Flat sales This scenario assumed sales were 20% less than existing sales starting in 2013. Overall this scenario produces adverse results for the next five years.
The DCAT conducted has not tested any correlation that may exist between assumptions. The following table represents the estimated sensitivity of each of the above scenarios for the next five years to net actuarial liabilities at the end of the projection period, which is 5 years after the relevant financial year end.
2013 2012 Surplus MCCSR Surplus MCCSR
Base 14,625,551 683% 11,037,680 926% Variable Mortality risks 13,781,915 691% 10,989,804 925% Low lapse rates 16,899,015 601% 11,233,676 900% Higher lapse rates 12,214,421 995% 10,005,092 1,087% Expense risks 13,467,471 667% 10,936,404 923% Low interest rate 11,133,667 577% 9,580,488 881% High Interest rate 13,835,363 614% 10,845,768 967% High sales growth 15,206,811 640% 11,066,396 897% Flat sales 13,330,815 719% 10,851,276 944%
147Scotia Group Jamaica Limited 2013 Annual Report
SCOTIA GROUP JAMAICA LIMITED Notes to the Financial StatementsOctober 31, 2013(Expressed in thousands of Jamai an dollars unless otherwise stated)
Scotia Group Jamaica Limited 2013 Annual Report 148 Scotia Group Jamaica Limited 2013 Annual Report 148
SCOTIA GROUP JAMAICA LIMITED Notes to the Financial StatementsOctober 31, 2013(Expressed in thousands of Jamai an dollars unless otherwise stated)
45. Fair value of financial instruments
Fair value is the amount for which an asset could be exchanged, or a liability settled, between knowledgeable, willing parties in an arms length transaction. Market price is used to determine fair value where an active market exists, as it is the best evidence of the fair value of a financial instrument.
For financial instruments for which no market price is available, the fair values presented have been estimated using present value or other estimation and valuation techniques based on market conditions existing at the balance sheet dates.
The values derived from applying these techniques are significantly affected by the underlying assumptions used concerning both the amounts and timing of future cash flows and the discount rates. The following methods and assumptions have been used:
(i) financial instruments classified as available-for-sale and held-to-maturity: fair value is estimated by reference to quoted market prices when available. If quoted market prices are not available, then fair values are estimated on the basis of pricing models or other recognised valuation techniques;
(ii) financial instruments classified as fair value through profit or loss: fair value is estimated by reference to quoted market prices when available.
If quoted market prices are not available, then fair values are estimated on the basis of pricing models or other recognised valuation techniques. Fair value is equal to the carrying amount of these investments;
(iii) the fair value of liquid assets and other assets maturing within one year is considered to approximate their carrying amount. This assumption is applied to liquid assets and the short-term elements of all other financial assets and liabilities;
(iv) the fair value of demand deposits and savings accounts with no specific maturity is considered to be the amount payable on demand at the reporting date; the fair value of fixed-term interest-bearing deposits is based on discounted cash flows using interest rates for new deposits.
(v) the fair value of variable rate financial instruments is considered to approximate their carrying amounts; and
(vi) the fair value of fixed rate loans is estimated by comparing market interest rates when the loans were granted with current market rates offered on similar loans. For match-funded loans the fair value is assumed to be equal to their carrying value, as gains and losses offset each other. Changes in the credit quality of loans within the portfolio are not taken into account in determining gross fair values as the impact of credit risk is recognised separately by deducting the amount of the provisions for credit losses from both the book and fair values.
(vii) The fair values of quoted equity investments are based on quoted market bid prices. Equity securities for which fair values cannot be measured reliably are recognized at cost less impairment.
149Scotia Group Jamaica Limited 2013 Annual Report 149Scotia Group Jamaica Limited 2013 Annual Report
SCOTIA GROUP JAMAICA LIMITED Notes to the Financial StatementsOctober 31, 2013(Expressed in thousands of Jamai an dollars unless otherwise stated)
45. Fair value of financial instruments (continued) The following tables present the fair value of financial instruments that are not carried at fair value based on the above-mentioned valuation methods and assumptions.
The Group Carrying Fair Carrying Fair Value Value Value Value 2013 2013 2012 2012
Financial assets Loans 134,823,756 136,990,112 122,524,668 124,950,291 Pledged assets 22,326,371 22,555,749 23,301,910 23,165,941 Investment securities: Held-to-maturity 12,492,257 12,303,220 11,323,782 11,430,323
Financial liability Deposits 197,521,896 197,501,586 171,660,968 171,644,819
The Company Carrying Fair Carrying Fair Value Value Value Value 2013 2013 2012 2012
Financial assets Loans 50,012 50,012 - -
Fair value hierarchy IFRS 7, Financial Instruments: Disclosures, specifies a hierarchy of valuation techniques based on whether the inputs to those valuation techniques are observable or unobservable. Observable inputs reflect market data obtained from independent sources, while unobservable inputs reflect the Group’s market assumptions. The table below provides a summary of financial instruments carried at fair value, by valuation method. The different levels have been defined as follows:
(i) Level 1 – fair value measured based on quoted prices (unadjusted) in active markets
for identical assets or liabilities. (ii) Level 2 – fair value measured based on inputs other than quoted prices included
within Level 1 that are observable for the asset or liability, either directly (that is, as prices) or indirectly (that is, derived from prices).
(iii) Level 3 – fair value measured based on inputs for the asset or liability that are not based on observable market data (unobservable inputs).
Scotia Group Jamaica Limited 2013 Annual Report 150
45. Fair value of financial instruments (continued) The Group 2013 Level 1 Level 2 Level 3 Total
Financial assets at fair value through profit or loss - Debt securities - 578,399 - 578,399 - Equity securities - 234,702 - 234,702
Available-for-sale securities - Debt securities - 80,312,062 - 80,312,062 - Equity securities 25,500 - 5,240 30,740
Pledged assets - Debt securities - 41,147,529 - 41,147,529 - Equity securities - 889,087 - 889,087
25,500 123,161,779 5,240 123,192,519
2012 Level 1 Level 2 Level 3 Total
Financial assets at fair value through profit or loss - Debt securities - 8,298 - 8,298 - Equity securities 14,351 455,292 - 469,643
Available-for-sale securities - Debt securities - 84,466,913 - 84,466,913 - Equity securities - - 14,022 14,022
Pledged assets - Debt securities - 39,981,362 - 39,981,362 - Equity securities - 774,221 - 774,221
14,351 125,686,086 14,022 125,714,459 46. Capital Risk Management
Capital risk is the risk that the Group fails to comply with mandated regulatory requirements, resulting in a breach of its minimum capital ratios and the possible suspension or loss of its licences. Regulators are primarily interested in protecting the rights of depositors and policyholders and they monitor closely to ensure that the Group is satisfactorily managing its affairs for the benefit of depositors and policyholders. At the same time, the regulators are also interested in ensuring that the Group maintains an appropriate solvency position to meet unforeseen liabilities arising from economic shocks or natural disasters.
The Group manages its capital resources according to the following objectives:
To comply with the capital requirements established by the regulatory authorities responsible for banking, insurance and other financial intermediaries; To safeguard its ability to continue as a going concern and meet future obligations to depositors, policyholders and stockholders; To provide adequate returns to stockholders by pricing investment, insurance and other contracts commensurate with the level of risk; and To maintain a strong capital base to support the future development of the Group’s operations.
Scotia Group Jamaica Limited 2013 Annual Report 150
SCOTIA GROUP JAMAICA LIMITED Notes to the Financial StatementsOctober 31, 2013(Expressed in thousands of Jamai an dollars unless otherwise stated)
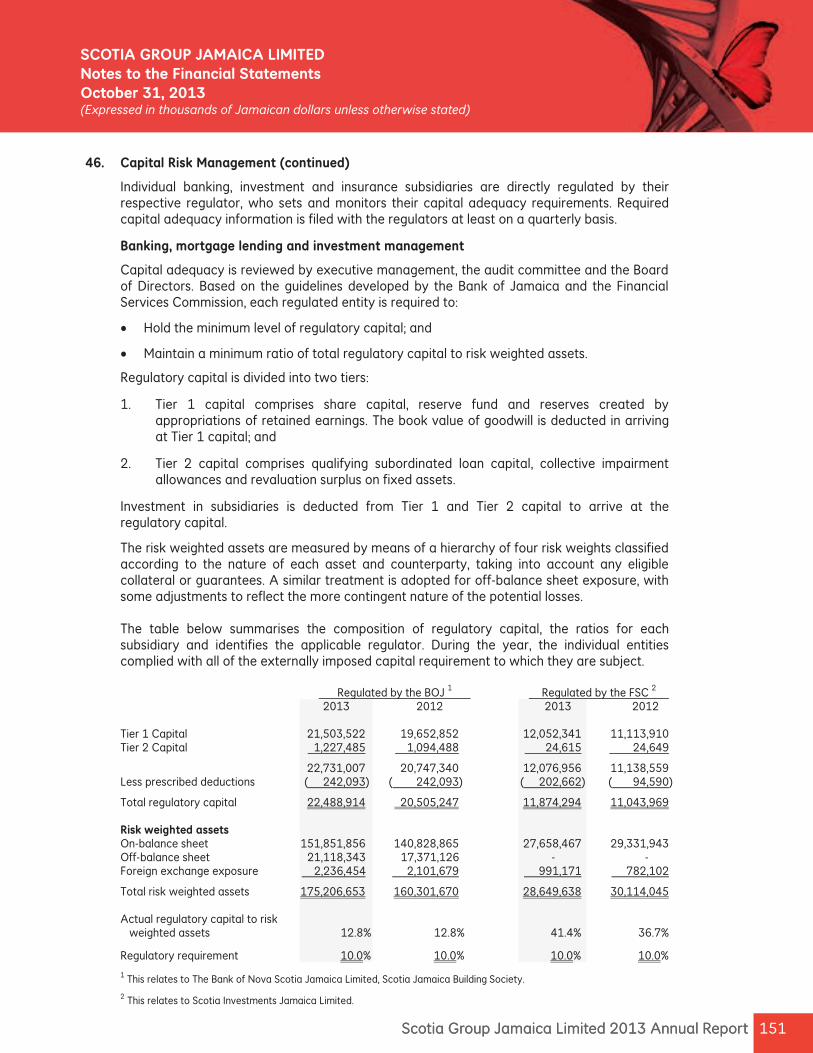
151Scotia Group Jamaica Limited 2013 Annual Report 151Scotia Group Jamaica Limited 2013 Annual Report
SCOTIA GROUP JAMAICA LIMITED Notes to the Financial StatementsOctober 31, 2013(Expressed in thousands of Jamai an dollars unless otherwise stated)
46. Capital Risk Management (continued)
Individual banking, investment and insurance subsidiaries are directly regulated by their respective regulator, who sets and monitors their capital adequacy requirements. Required capital adequacy information is filed with the regulators at least on a quarterly basis.
Banking, mortgage lending and investment management
Capital adequacy is reviewed by executive management, the audit committee and the Board of Directors. Based on the guidelines developed by the Bank of Jamaica and the Financial Services Commission, each regulated entity is required to:
Hold the minimum level of regulatory capital; and
Maintain a minimum ratio of total regulatory capital to risk weighted assets.
Regulatory capital is divided into two tiers:
1. Tier 1 capital comprises share capital, reserve fund and reserves created by appropriations of retained earnings. The book value of goodwill is deducted in arriving at Tier 1 capital; and
2. Tier 2 capital comprises qualifying subordinated loan capital, collective impairment allowances and revaluation surplus on fixed assets.
Investment in subsidiaries is deducted from Tier 1 and Tier 2 capital to arrive at the regulatory capital.
The risk weighted assets are measured by means of a hierarchy of four risk weights classified according to the nature of each asset and counterparty, taking into account any eligible collateral or guarantees. A similar treatment is adopted for off-balance sheet exposure, with some adjustments to reflect the more contingent nature of the potential losses.
The table below summarises the composition of regulatory capital, the ratios for each subsidiary and identifies the applicable regulator. During the year, the individual entities complied with all of the externally imposed capital requirement to which they are subject.
Regulated by the BOJ 1 Regulated by the FSC 2
2013 2012 2013 2012
Tier 1 Capital 21,503,522 19,652,852 12,052,341 11,113,910 Tier 2 Capital 1,227,485 1,094,488 24,615 24,649
22,731,007 20,747,340 12,076,956 11,138,559 Less prescribed deductions ( 242,093) ( 242,093) ( 202,662) ( 94,590)
Total regulatory capital 22,488,914 20,505,247 11,874,294 11,043,969
Risk weighted assets On-balance sheet 151,851,856 140,828,865 27,658,467 29,331,943 Off-balance sheet 21,118,343 17,371,126 - - Foreign exchange exposure 2,236,454 2,101,679 991,171 782,102
Total risk weighted assets 175,206,653 160,301,670 28,649,638 30,114,045 Actual regulatory capital to risk weighted assets 12.8% 12.8% 41.4% 36.7%
Regulatory requirement 10.0% 10.0% 10.0% 10.0% 1 This relates to The Bank of Nova Scotia Jamaica Limited, Scotia Jamaica Building Society.
2 This relates to Scotia Investments Jamaica Limited.
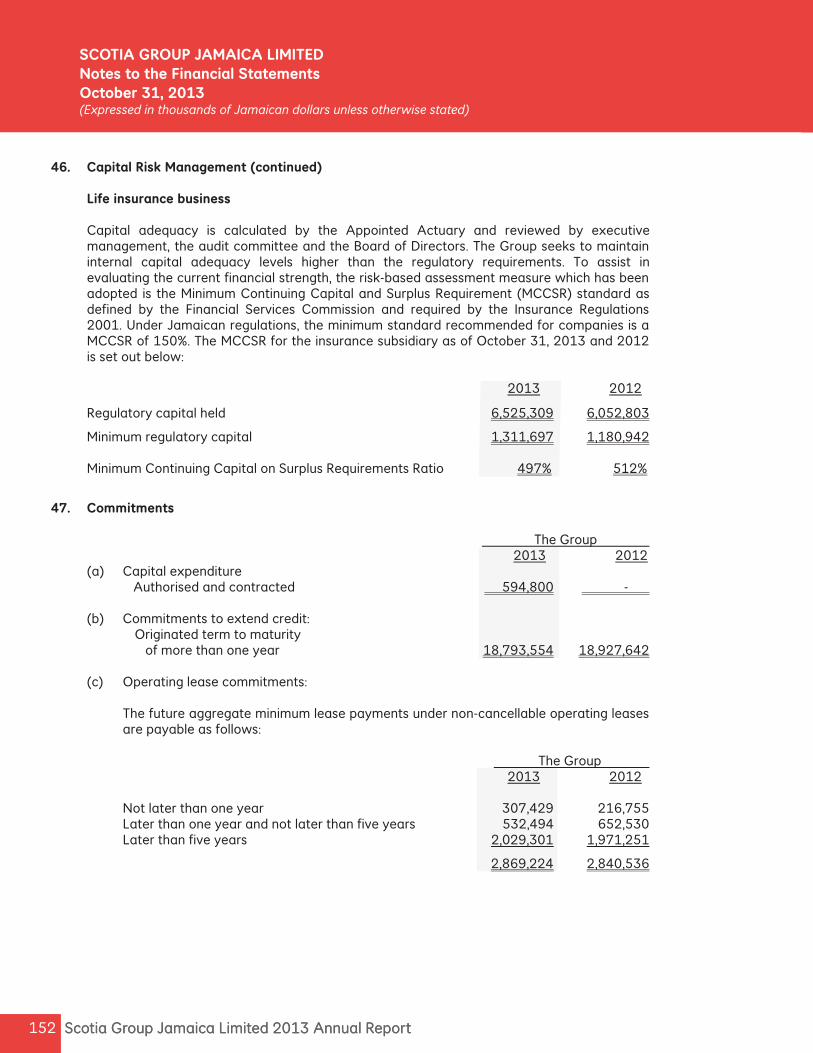
Scotia Group Jamaica Limited 2013 Annual Report 152 Scotia Group Jamaica Limited 2013 Annual Report 152
SCOTIA GROUP JAMAICA LIMITED Notes to the Financial StatementsOctober 31, 2013(Expressed in thousands of Jamai an dollars unless otherwise stated)
46. Capital Risk Management (continued)
Life insurance business
Capital adequacy is calculated by the Appointed Actuary and reviewed by executive management, the audit committee and the Board of Directors. The Group seeks to maintain internal capital adequacy levels higher than the regulatory requirements. To assist in evaluating the current financial strength, the risk-based assessment measure which has been adopted is the Minimum Continuing Capital and Surplus Requirement (MCCSR) standard as defined by the Financial Services Commission and required by the Insurance Regulations 2001. Under Jamaican regulations, the minimum standard recommended for companies is a MCCSR of 150%. The MCCSR for the insurance subsidiary as of October 31, 2013 and 2012 is set out below:
2013 2012
Regulatory capital held 6,525,309 6,052,803
Minimum regulatory capital 1,311,697 1,180,942
Minimum Continuing Capital on Surplus Requirements Ratio 497% 512%
47. Commitments The Group
2013 2012 (a) Capital expenditure
Authorised and contracted 594,800 -
(b) Commitments to extend credit: Originated term to maturity of more than one year 18,793,554 18,927,642
(c) Operating lease commitments:
The future aggregate minimum lease payments under non-cancellable operating leases are payable as follows:
The Group 2013 2012
Not later than one year 307,429 216,755 Later than one year and not later than five years 532,494 652,530 Later than five years 2,029,301 1,971,251
2,869,224 2,840,536

153Scotia Group Jamaica Limited 2013 Annual Report 153Scotia Group Jamaica Limited 2013 Annual Report
SCOTIA GROUP JAMAICA LIMITED Notes to the Financial StatementsOctober 31, 2013(Expressed in thousands of Jamai an dollars unless otherwise stated)
48. Reclassification of financial assets
On October 1, 2008 the company reclassified certain investments that were included in pledged assets from available-for-sale to loans and receivables in accordance with paragraph 50E of IAS 39. The standard requires that such reclassification be made at the fair value of the instruments at the date of reclassification. The prices of GOJ Global Bonds as at September 30, 2008 were used to determine the fair value used for the reclassification. The carrying value and fair value of these assets as at the reporting date are as follows:
The Group
2013 2012 Carrying Fair Carrying Fair value value value value
Securities: US$ GOJ Global Bonds 7,010,694 7,204,928 11,213,598 11,723,578 EURO GOJ Global Bonds 131,548 136,143 260,504 274,722 (a) Fair value losses, excluding deferred tax liabilities of $40,455 (2012: $65,465), were
recognized in equity in relation to the above investments reclassified in 2008.
(b) Fair value gains of $147,923 (2012: $416,986), exclusive of deferred taxation, would have been included in equity for the previous year had the investments not been reclassified. This amount was estimated on the basis of the bid-price of the securities as at October 31, 2013. This price is not necessarily what would have been obtained if an active market for the securities actually existed at that date.
(c) The weighted average effective interest rate of the investments at the date of
reclassification was 8.39%. The undiscounted cash flows to be recovered from the investments reclassified is $11,119,647.
49. Fiduciary activities
The Group provides custody, trustee, corporate administration, investment management and advisory services to third parties; this involves the Group making allocation and purchase and sale decisions in relation to a wide range of financial instruments. Those assets that are held in a fiduciary capacity are not included in these financial statements. At the reporting date, the Group had assets under administration amounting to approximately $119,394,240 (2012: $103,279,036).
50. Litigation and contingent liabilities
(a) The Group is subject to various claims, disputes and legal proceedings, in the normal course of business. Provision is made for such matters when, in the opinion of management and its legal counsel, it is probable that a payment will be made by the Group, and the amount can be reasonably estimated.
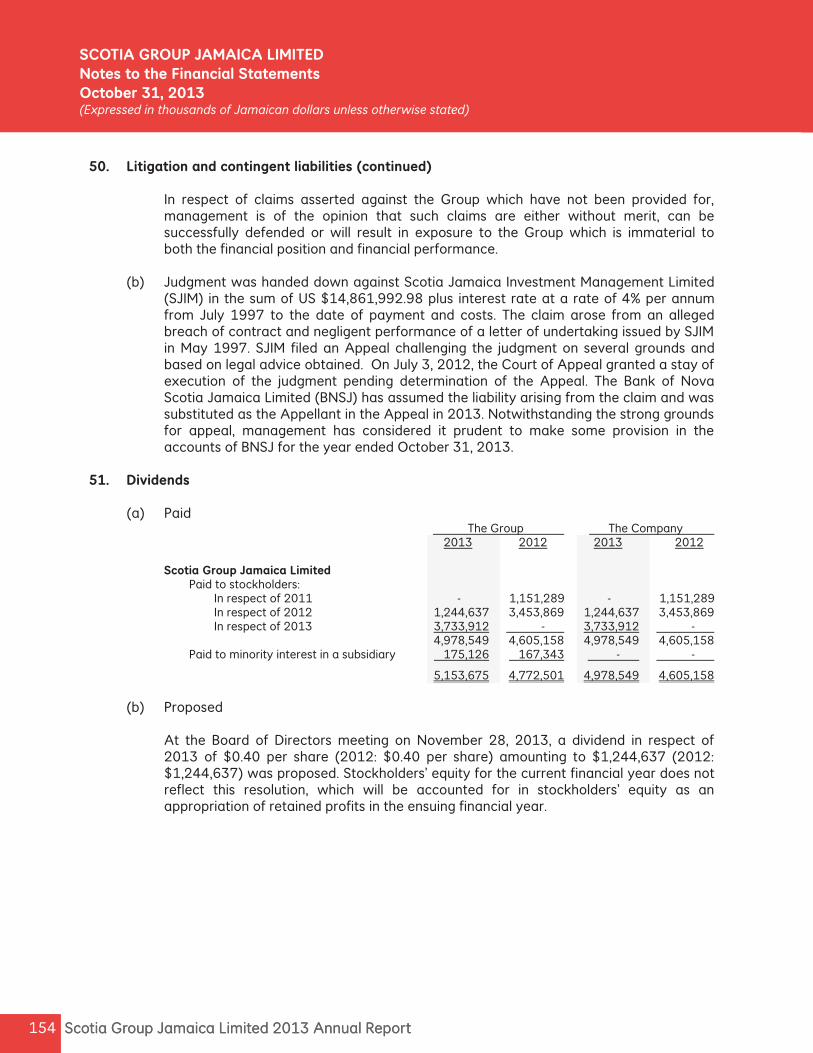
Scotia Group Jamaica Limited 2013 Annual Report 154 Scotia Group Jamaica Limited 2013 Annual Report 154
SCOTIA GROUP JAMAICA LIMITED Notes to the Financial StatementsOctober 31, 2013(Expressed in thousands of Jamai an dollars unless otherwise stated)
50. Litigation and contingent liabilities (continued)
In respect of claims asserted against the Group which have not been provided for, management is of the opinion that such claims are either without merit, can be successfully defended or will result in exposure to the Group which is immaterial to both the financial position and financial performance.
(b) Judgment was handed down against Scotia Jamaica Investment Management Limited (SJIM) in the sum of US $14,861,992.98 plus interest rate at a rate of 4% per annum from July 1997 to the date of payment and costs. The claim arose from an alleged breach of contract and negligent performance of a letter of undertaking issued by SJIM in May 1997. SJIM filed an Appeal challenging the judgment on several grounds and based on legal advice obtained. On July 3, 2012, the Court of Appeal granted a stay of execution of the judgment pending determination of the Appeal. The Bank of Nova Scotia Jamaica Limited (BNSJ) has assumed the liability arising from the claim and was substituted as the Appellant in the Appeal in 2013. Notwithstanding the strong grounds for appeal, management has considered it prudent to make some provision in the accounts of BNSJ for the year ended October 31, 2013.
51. Dividends
(a) Paid The Group The Company 2013 2012 2013 2012
Scotia Group Jamaica Limited Paid to stockholders: In respect of 2011 - 1,151,289 - 1,151,289 In respect of 2012 1,244,637 3,453,869 1,244,637 3,453,869 In respect of 2013 3,733,912 - 3,733,912 - 4,978,549 4,605,158 4,978,549 4,605,158 Paid to minority interest in a subsidiary 175,126 167,343 - -
5,153,675 4,772,501 4,978,549 4,605,158 (b) Proposed
At the Board of Directors meeting on November 28, 2013, a dividend in respect of 2013 of $0.40 per share (2012: $0.40 per share) amounting to $1,244,637 (2012: $1,244,637) was proposed. Stockholders’ equity for the current financial year does not reflect this resolution, which will be accounted for in stockholders’ equity as an appropriation of retained profits in the ensuing financial year.
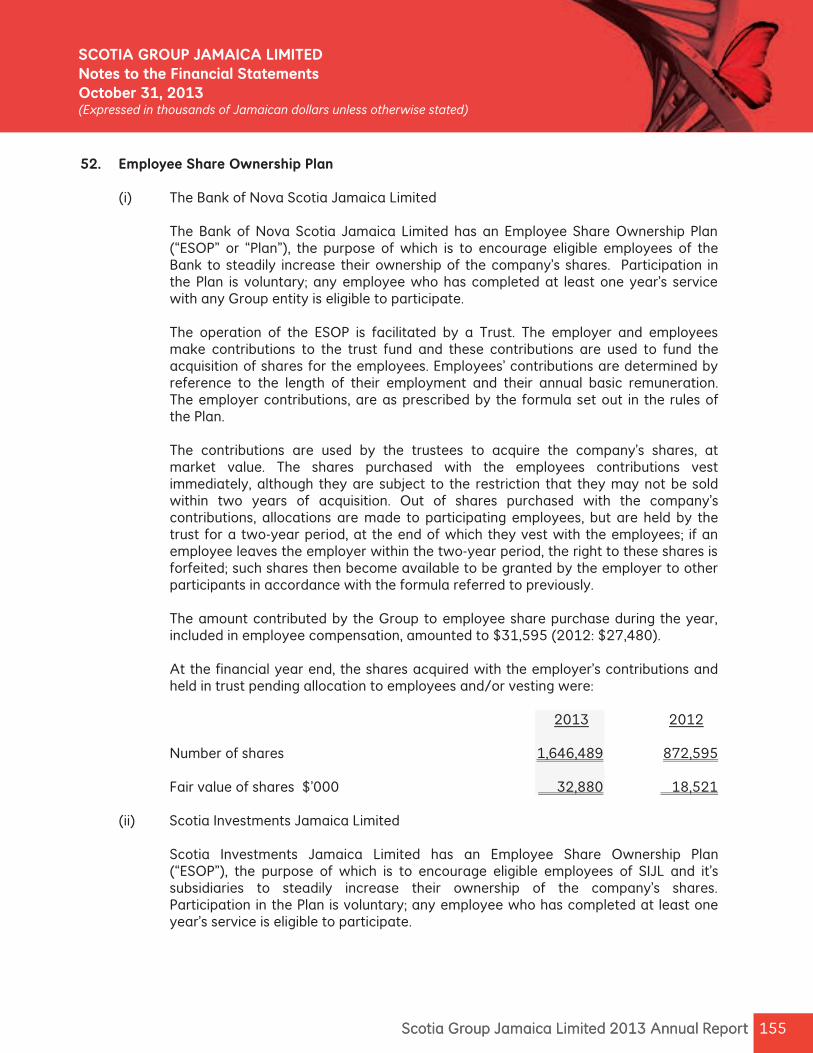
155Scotia Group Jamaica Limited 2013 Annual Report 155Scotia Group Jamaica Limited 2013 Annual Report
SCOTIA GROUP JAMAICA LIMITED Notes to the Financial StatementsOctober 31, 2013(Expressed in thousands of Jamai an dollars unless otherwise stated)
52. Employee Share Ownership Plan
(i) The Bank of Nova Scotia Jamaica Limited
The Bank of Nova Scotia Jamaica Limited has an Employee Share Ownership Plan (“ESOP” or “Plan”), the purpose of which is to encourage eligible employees of the Bank to steadily increase their ownership of the company’s shares. Participation in the Plan is voluntary; any employee who has completed at least one year’s service with any Group entity is eligible to participate.
The operation of the ESOP is facilitated by a Trust. The employer and employees make contributions to the trust fund and these contributions are used to fund the acquisition of shares for the employees. Employees’ contributions are determined by reference to the length of their employment and their annual basic remuneration. The employer contributions, are as prescribed by the formula set out in the rules of the Plan.
The contributions are used by the trustees to acquire the company’s shares, at market value. The shares purchased with the employees contributions vest immediately, although they are subject to the restriction that they may not be sold within two years of acquisition. Out of shares purchased with the company’s contributions, allocations are made to participating employees, but are held by the trust for a two-year period, at the end of which they vest with the employees; if an employee leaves the employer within the two-year period, the right to these shares is forfeited; such shares then become available to be granted by the employer to other participants in accordance with the formula referred to previously.
The amount contributed by the Group to employee share purchase during the year, included in employee compensation, amounted to $31,595 (2012: $27,480). At the financial year end, the shares acquired with the employer’s contributions and held in trust pending allocation to employees and/or vesting were:
2013 2012 Number of shares 1,646,489 872,595 Fair value of shares $’000 32,880 18,521
(ii) Scotia Investments Jamaica Limited
Scotia Investments Jamaica Limited has an Employee Share Ownership Plan (“ESOP”), the purpose of which is to encourage eligible employees of SIJL and it’s subsidiaries to steadily increase their ownership of the company’s shares. Participation in the Plan is voluntary; any employee who has completed at least one year’s service is eligible to participate.
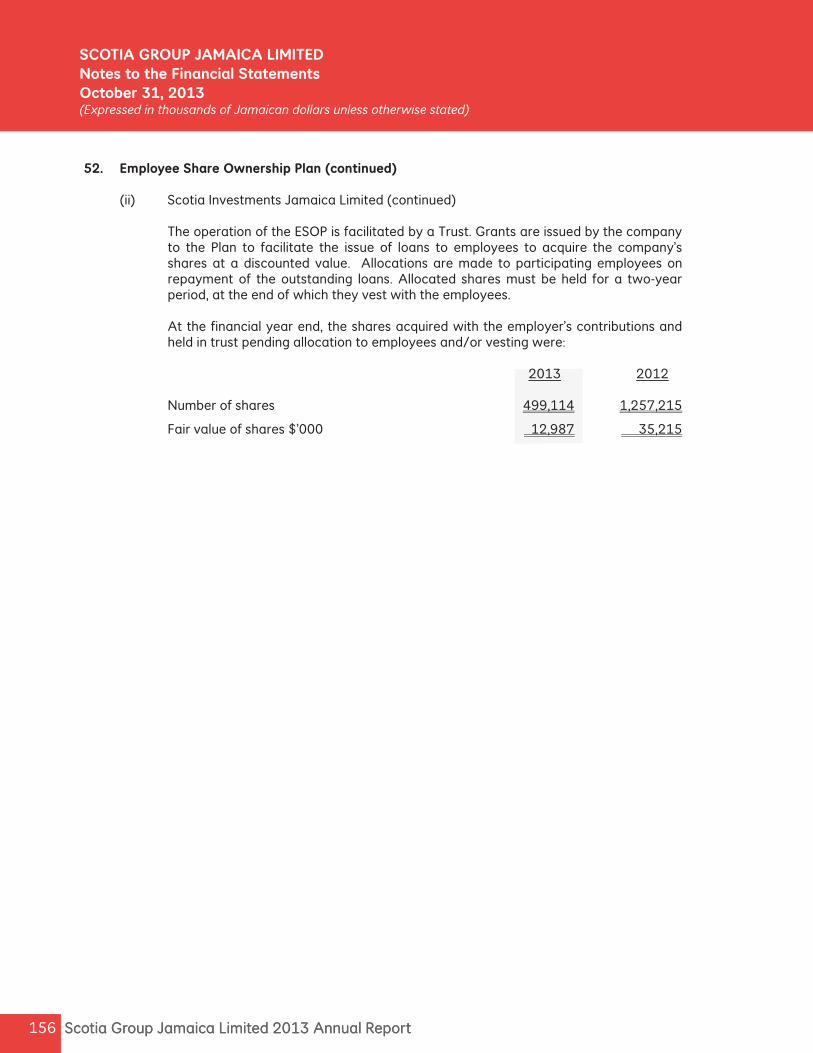
Scotia Group Jamaica Limited 2013 Annual Report 156
52. Employee Share Ownership Plan (continued)
(ii) Scotia Investments Jamaica Limited (continued)
The operation of the ESOP is facilitated by a Trust. Grants are issued by the company to the Plan to facilitate the issue of loans to employees to acquire the company’s shares at a discounted value. Allocations are made to participating employees on repayment of the outstanding loans. Allocated shares must be held for a two-year period, at the end of which they vest with the employees.
At the financial year end, the shares acquired with the employer’s contributions and held in trust pending allocation to employees and/or vesting were:
2013 2012 Number of shares 499,114 1,257,215
Fair value of shares $’000 12,987 35,215
Scotia Group Jamaica Limited 2013 Annual Report 156
SCOTIA GROUP JAMAICA LIMITED Notes to the Financial StatementsOctober 31, 2013(Expressed in thousands of Jamai an dollars unless otherwise stated)

157Scotia Group Jamaica Limited 2013 Annual Report
Economic Review - Scotia Group Jamaica Ltd.
The International Market
The rst half of the scal year was characterized by a slowdown in global growth as developed economies struggled to create enough jobs to maintain full employment. The beginning of the year was also marked by US political gridlock which resulted in automatic spending cuts and the expiration of tax cuts, which led to weaker than expected US growth in the rst half of the year. In response to sluggish growth, the leading global central banks launched an unprecedented volley of unconventional monetary policy which pushed interest rates to record lows.
The central banks of Japan, the United States, the United Kingdom and the Eurozone enacted or continued record asset purchase programmes to keep interest rates low and stimulate economic growth. In December 2012, the US Federal Reserve increased its asset purchase programme from US$40 billion to US$85 billion. Not to be outdone, the Japanese central bank, under new leadership, began the world’s most intense burst of monetary stimulus by unleashing the rst phase of a US$1.4 trillion stimulus
to run over two years. Meanwhile, the Bank of England maintained its record £375 billion asset purchase programme. The Eurozone central bank maintained its unlimited bond buying programme launched in September 2012, known as Outright Monetary Transactions, which allowed the central bank to intervene in European nancial markets to purchase bonds maturing between one and three years.
The second half of the scal year was characterized by escalating volatility and risk aversion. This began with an uprising in Egypt followed by rising geopolitical tensions in Syria which threatened to disrupt the supply of crude oil. In addition, the US Federal Reserve had hinted in June that it intended to taper its stimulus programme just six months after it had expanded the program. As a result, the benchmark US ten year treasury yields, which fell to a record low of 1.6% in May, jumped to 2.62% in June and peaked at 3.0% in early September.
The impact of rising rates was far reaching: the US housing market slowed as mortgage rates increased; investors ed emerging markets assets in droves, resulting in currency crisis in a number of countries led by India and Indonesia and to a lesser
extent Brazil, whose currencies experienced double digit declines; emerging market bonds plunged as investors pulled record amounts of cash from bond funds during June to July 2013. However the biggest threat to global nancial markets came from US political gridlock, which resulted in a 15 day partial shutdown of the US Government and the real threat of a US default. Since the partial shutdown, there has been a renewed emphasis by US lawmakers to nd a long-term scal and debt compromise. This
bodes well for the US and world economies if US lawmakers can reach a consensus.
The Jamaican Market
The New IMF AgreementThe nancial year commenced with the completion of a funding deal between the Government and the International Monetary Fund (IMF) being the main priority. Before a deal could be reached, the government had to undertake a set of prior actions which involved a National Debt Exchange (NDX) and a new budget in line with achieving a primary surplus of 7.5% of Gross Domestic Product (GDP).
Scotia Group Jamaica Limited 2013 Annual Report 158
The Jamaican Market
The New IMF Agreement (cont’d)In February 2013, the Government undertook the NDX to swap $860 billion worth of Government of Jamaica (GOJ) old bonds for new ones with longer maturities and lower coupon rates, a deal aimed at yielding savings of 1.25% of GDP or $17 billion in annual interest payments through to 2020. However, only 98.8% of bondholders participated in the offer, prompting the Government to embark upon a second debt exchange to make up the de cit from the rst debt exchange. Eight nancial institutions participated in this private offer, swapping $26 billion worth of local bonds.
As part of a wider tax reform programme and in line with its budgetary objectives, the Government implemented a $15.9 billion tax package in February. The administration was also successful in getting the majority of civil servants to forego wage increases for the next three years, a deal critical to attaining the wages to GDP ratio of no more than 9.0% of GDP by March 2016.
After successfully completing the prior actions, an agreement was nally reached on May 1, 2013 for
a new four year Extended Fund Facility (EFF) totaling SDR615.38 million or US$932.0 million. The new deal encompasses a set of reform measures and time bound scal consolidation aimed at sustainably reducing the country’s public debt
stock to no more than 96% of GDP by scal year 2019/20. The World Bank and the Inter-American Development Bank (IDB) also pledged support for the four year programme, each offering US$510 million in loans and grants to the Jamaican authorities.
Gross Domestic Products (GDP) Incoming data from the Statistical Institute of Jamaica (STATIN) re ected continued economic weakness on the domestic soil. Real GDP has now fallen for six consecutive quarters with output for Q2 of 2013 down by -0.1% when compared to the similar period of 2012. Previously, output contracted by -1.2% in Q4 of 2012 and -1.3% for Q1 of 2013. Both the Goods Producing and Services sectors fared weak with the former down for all quarters of the review period while the latter remained relatively at.
In the Goods Producing sector, Agriculture has been the chief decliner impacted by the lingering effects of hurricane Sandy in October 2012 and severe drought conditions in the rst half of 2013. Likewise, the Manufacturing sub-sector re ected lower levels of output. However, in the earlier stage of the year, Mining suffered from lower alumina capacity utilization but rebounded in Q3 of 2013. Notably, Construction rebounded posting gains for the rst half of 2013 due largely to increased civil engineering activities. As it relates to Services, Finance and Insurance remained the sole sub-sector to record positive growth in all quarters so far.
Fiscal Accounts The Planning Institute of Jamaica (PIOJ) reported that the local economy advanced by 0.6% for Q3 of calendar year 2013 when compared to the corresponding period of 2012. According to the Institute, growth was led predominantly by the Goods Producing industry which is estimated to have grown by 2.2% year-over-year due to higher output from three of the four sub-industries. Agriculture (+5.0%), Mining (+5.0%) and Construction (+2.5%) all recorded positive movement, while Manufacturing contracted by 0.8% year-over-year. The Services industry also recorded growth of 0.1% year-over-year as all sub-sectors increased with the exception of Electricity and Producers of Government Services, which fell by 3.5% year-over-year and 0.5% year-over-year respectively. This jump in Q3 real GDP if con rmed by STATIN, the nal arbiter on this measure, would
break six consecutive quarterly declines in domestic output.
The weak data for August led to a reversal in the previously recorded tax surplus, bringing the year-to-date shortfall in tax collections to $5.9 billion. Interestingly, growth in tax revenue for the ve month period slowed to 6.0% year-over-year from 11.7% for the four months to July and 4.7 percentage points lower than budget but marginally above the 5.3% for the comparable period a year ago. The current growth pace remains well below the 12.7% necessary to meet the primary balance goal of 7.5% of GDP.
Economic Review (cont’d)
- Scotia Group Jamaica Ltd.
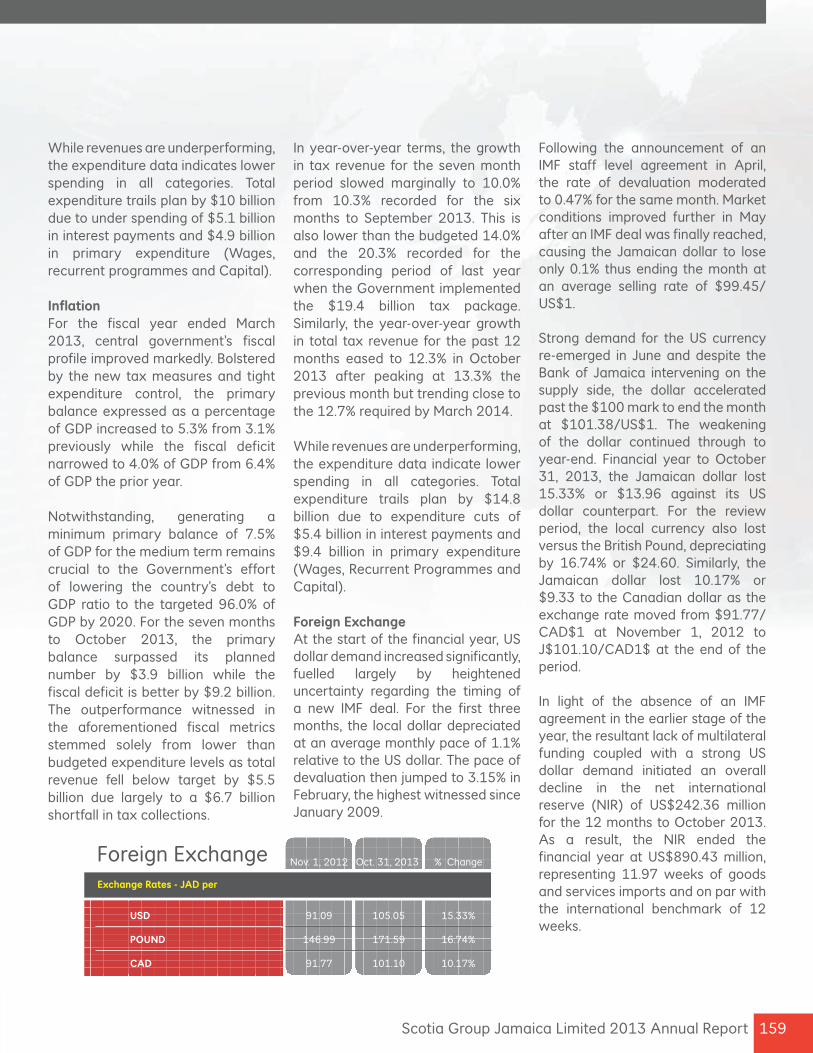
159Scotia Group Jamaica Limited 2013 Annual Report
While revenues are underperforming, the expenditure data indicates lower spending in all categories. Total expenditure trails plan by $10 billion due to under spending of $5.1 billion in interest payments and $4.9 billion in primary expenditure (Wages, recurrent programmes and Capital).
Infl ation For the fi scal year ended March 2013, central government’s fi scal profi le improved markedly. Bolstered by the new tax measures and tight expenditure control, the primary balance expressed as a percentage of GDP increased to 5.3% from 3.1% previously while the fi scal defi cit narrowed to 4.0% of GDP from 6.4% of GDP the prior year.
Notwithstanding, generating a minimum primary balance of 7.5% of GDP for the medium term remains crucial to the Government’s effort of lowering the country’s debt to GDP ratio to the targeted 96.0% of GDP by 2020. For the seven months to October 2013, the primary balance surpassed its planned number by $3.9 billion while the fi scal defi cit is better by $9.2 billion. The outperformance witnessed in the aforementioned fi scal metrics stemmed solely from lower than budgeted expenditure levels as total revenue fell below target by $5.5 billion due largely to a $6.7 billion shortfall in tax collections.
In year-over-year terms, the growth in tax revenue for the seven month period slowed marginally to 10.0% from 10.3% recorded for the six months to September 2013. This is also lower than the budgeted 14.0% and the 20.3% recorded for the corresponding period of last year when the Government implemented the $19.4 billion tax package. Similarly, the year-over-year growth in total tax revenue for the past 12 months eased to 12.3% in October 2013 after peaking at 13.3% the previous month but trending close to the 12.7% required by March 2014.
While revenues are underperforming, the expenditure data indicate lower spending in all categories. Total expenditure trails plan by $14.8 billion due to expenditure cuts of $5.4 billion in interest payments and $9.4 billion in primary expenditure (Wages, Recurrent Programmes and Capital).
Foreign ExchangeAt the start of the fi nancial year, US dollar demand increased signifi cantly, fuelled largely by heightened uncertainty regarding the timing of a new IMF deal. For the fi rst three months, the local dollar depreciated at an average monthly pace of 1.1% relative to the US dollar. The pace of devaluation then jumped to 3.15% in February, the highest witnessed since January 2009.
Following the announcement of an IMF staff level agreement in April, the rate of devaluation moderated to 0.47% for the same month. Market conditions improved further in May after an IMF deal was fi nally reached, causing the Jamaican dollar to lose only 0.1% thus ending the month at an average selling rate of $99.45/US$1.
Strong demand for the US currency re-emerged in June and despite the Bank of Jamaica intervening on the supply side, the dollar accelerated past the $100 mark to end the month at $101.38/US$1. The weakening of the dollar continued through to year-end. Financial year to October 31, 2013, the Jamaican dollar lost 15.33% or $13.96 against its US dollar counterpart. For the review period, the local currency also lost versus the British Pound, depreciating by 16.74% or $24.60. Similarly, the Jamaican dollar lost 10.17% or $9.33 to the Canadian dollar as the exchange rate moved from $91.77/CAD$1 at November 1, 2012 to J$101.10/CAD1$ at the end of the period.
In light of the absence of an IMF agreement in the earlier stage of the year, the resultant lack of multilateral funding coupled with a strong US dollar demand initiated an overall decline in the net international reserve (NIR) of US$242.36 million for the 12 months to October 2013. As a result, the NIR ended the fi nancial year at US$890.43 million, representing 11.97 weeks of goods and services imports and on par with the international benchmark of 12 weeks.

Scotia Group Jamaica Limited 2013 Annual Report 160
The Jamaican Market
Domestic Money Market Following the National Debt Exchange in February 2013, the Bank of Jamaica on February 25, 2013 reduced its policy rate by 50 basis points to a historical low of 5.75%. The rate held rm for the remainder of the year due to in ationary pressure coupled with tighter Jamaican dollar liquidity conditions. In contrast, market-determined interest rates ended the period at higher levels notwithstanding the record lows reached in February.
Driven by tight liquidity conditions due in part by the NDX and to a
large extent, policy measures of the Bank of Jamaica and the Ministry of Finance, the average rate on the 90-day tenor rose to 7.37%, 187 basis points above the low reached subsequent to the NDX and 0.99% higher than where it started the year. Similarly, average yield on the 180-day and 30-day declined to 5.75% for the former and 5.25% for the latter immediately following the NDX but rose steadily to end the review period at 7.84% and 6.28% respectively.
Global Bond Market Investors remained mostly on the sideline during the nancial year following the NDX and the signing of a new four year deal with the international monetary fund.
While the global bonds were not affected in the debt exchange, the low credit rating of CCC+ with a negative outlook kept investment interest lukewarm. Credit rating agency Standard & Poors upgraded Jamaica one notch to B- / Stable in September, which should be positive for the credit once global nancial markets settle down and the country continues to meet its scal targets.
Stock MarketDuring the year, the Jamaica Stock Exchange Main Index remained largely in the negative territory due in part to low demand amid ongoing uncertainties associated with the performance of the Jamaican economy. Further, the JSE Main Market experienced adverse effects due to the impact of the National Debt Exchange, which resulted in a sharp fall in the earnings of a number of key listed companies. As a result, the main JSE recorded declines in all three Indexes, with the All Jamaican Composite posting the steepest fall of 10.15%, followed by the JSE Select and the JSE Main, which sagged by 9.19% and 8.89% respectively.
Economic Review (cont’d)
- Scotia Group Jamaica Ltd.

161Scotia Group Jamaica Limited 2013 Annual Report
BLACK RIVER6 High StreetP. O. Box 27Black RiverSt. Elizabeth
Mrs. A. A. Rhule, Manager
BROWN’S TOWNMain StreetP. O. Box 35Brown’s Town St. Ann
Mr. P. O. Brown, Manager
CHRISTIANAMain StreetP. O. Box 11Christiana, Manchester
Miss A. E. Senior, Manager
CONSTANT SPRING132-132A Constant Spring RoadKingston 8
Miss M.A SeniorManager
CORPORATE & COMMERCIALBANKING CENTRE
Mr. D. M. Brown Snr. Relationship Manager
Mrs. R. M. DixonSenior Manager Credit Solutions
Mr. H. P. EbanksSnr. ManagerCredit Solutions
Miss M. A. Flake Snr. Relationship Manager
Mrs. N. G. Heywood Senior RelationshipManager
Miss A. M. JonesPortfolio Manager
Mrs. S. Lue-WhittinghamSnr. Relationship Manager
Mrs. G. A. Morrison Relationship Manager
Mr. M. S. A. NelsonSnr. ManagerCredit Solutions
Mr. K. E. Reese Snr. Relationship Manager
Miss. C. A. Rochester Relationship Manager
Mr. H. D. StephensSnr. Relationship Manager
Mr. A. ThompsonClient Relationship Manager
Mr. C. M. WisdomSnr. Manager Credit Solutions
Mr. C. WrightSnr. Relationship Manager
CROSS ROADS86 Slipe RoadP. O. Box 2Kingston 5
Mr. R. W. Bennett, Manager
FALMOUTHTrelawny WharfP. O. Box 27FalmouthTrelawny
Mr. K. ButlerManager
HAGLEY PARK ROAD128 Hagley Park RoadP. O. Box 5Kingston 11
Mrs. D. R. Brown Manager
Mr. V. L. Johnson Assistant Manager Business Banking
HALF-WAY-TREE80 Half-Way-Tree RoadP. O. Box 5Kingston 10
Mrs J. Carter-James Manager
Miss V. J. WilliamsAsst. ManagerBusiness Banking
Mrs C. CrearyAsst. ManagerPersonal Banking
Mr. D. BlackAsst. Manager Operations & Service
IRONSHORE SERVICE CENTREShops 2 & 3, Golden Triangle Shopping CentreIronshoreMontego Bay
Mr. K. L. Burton, Manager
JUNCTIONJunction P. O.St. Elizabeth
Miss J. D. ThompsonManager
KING STREET35-45 King StreetP. O. Box 511, Kingston
Mr. L. Reynolds, Manager
Mrs. A. Y. HowardAsst. ManagerBusiness Banking
Mrs. A. A. DouglasAsst. Manager Operations & Service
LIGUANEA125-127 Old Hope RoadP. O. Box 45Kingston 6
Mr. M. O. Lee, Manager
LINSTEAD42 King StreetP. O. Box 19Linstead St. Catherine
Mrs. M. G. Lee-Rutland Manager
LUCEAWillie Delisser BoulevardP. O. Box 63Lucea, Hanover
Mr. D. Bryan, Manager
MANDEVILLE 1A Caledonia RoadP. O. Box 106Mandeville, Manchester
Mrs. J. D. Billings - FrithActing Manager
Mr. Christopher SamuelsManager, Personal Banking
MAY PEN36 Main StreetP. O. Box 32May Pen Clarendon
Mr. E. A. Blake, Manager
MONTEGO BAY 6-7 Sam Sharpe SquareP.O. Box 311 Montego BaySt. James
Mr S. Thompson Manager
Dr. N. SmellieAsst. ManagerBusiness Banking
Mr. R. ClarkeAsst. ManagerPersonal Banking
Miss L. A. HosangAsst. ManagerOperations & Service
MORANT BAY23 Queen StreetP. O. Box 30 Morant Bay St. Thomas
Mr. L. V. Sutherland, Manager
NEGRILNegril Square Negril P. O. Westmoreland
Miss D. M. MortimerManager
Branches & Team LeadersThe Bank of Nova Scotia Jamaica Limited As at October 31, 2013

Scotia Group Jamaica Limited 2013 Annual Report 162
NEW KINGSTON2 Knutsford BoulevardP. O. Box 307Kingston 5
Miss A. Leonce, Manager
Mrs. E. KeppleAsst. ManagerBusiness Banking
Mr. L. A. LeachAsst. ManagerPersonal Banking
Mrs. J. M. Thompson Asst. Manager Operations & Service OCHO RIOSMain StreetP. O. Box 150Ocho RiosSt. Ann
Mr. F. O. Wright, Manager
Mrs. H. J. John Keith Assistant ManagerBusiness Banking
OLD HARBOUR4 South StreetP. O. Box 43Old HarbourSt. Catherine
Mr. D. O. Bucknor, Manager
OXFORD ROAD6 Oxford RoadP. O. Box 109Kingston 5
Mr. C. C. Wiggan, Manager
PORT ANTONIO3 Harbour StreetP. O. Box 79Port Antonio Portland
Mr. N. Scott, Manager
PORT MARIA 57 Warner StreetP. O. Box 6Port MariaSt. Mary
Mr. P. Wallace, Manager
PORTMORELot 2 Cookson Pen Bushy Park P.O. Box 14 Greater Portmore St Catherine
Mr. R. R. Reid, Manager
PREMIER 10 Constant Spring RoadP. O. Box 509Kingston 10
Miss P. N. BuchananManager
ST. ANN’S BAY18 Bravo StreetP. O. Box 2St. Ann’s Bay St. Ann
Mrs. M. Davidson, Manager
SANTA CRUZ77 Main StreetP. O. Box 20Santa CruzSt. Elizabeth
Miss D. A. Hyman, Manager
SAVANNA-LA-MAR19 Great George’s StreetP.O. Box 14Savanna-La-MarWestmoreland
Mr. C. A. Dawes, Manager
Miss C. MurrayAsst. ManagerBusiness Banking
SCOTIABANK CENTRECnr. Duke & Port Royal StreetsP. O. Box 59Kingston
Mr. S. A. Distant, Manager
Mrs. D. A. Maxwell Asst. ManagerBusiness Banking
Mrs. J. M. Badson-MignottManager, Operations
SPANISH TOWNShops 25 & 26Oasis Shopping Plaza6 March Pen Road Spanish Town
Mr. J. A. Clarke, Manager
UWI, MONA CAMPUSCnr. Ring Road & Shed LaneKingston 7
Mr. P. G. Mohan, Manager
WESTGATEWestgate Shopping CentreP.O. Box 11Montego BaySt. James
Mr. G. C. Graham, Manager
SUB BRANCHES
BARNETT STREET (Sub to Montego Bay)51 Barnett StreetMontego BaySt. James
CLAREMONT(Sub to St. Ann’s Bay)Claremont P.O.Claremont St. Ann
FRANKFIELD (Sub to Christiana)Frank eldClarendon
PARK CRESCENT (Sub to Mandeville)17 Park CrescentMandevilleManchester
Branches & Team LeadersThe Bank of Nova Scotia Jamaica Limited As at October 31, 2013.

163Scotia Group Jamaica Limited 2013 Annual Report
THE BANK OF NOVA SCOTIA JAMAICA LIMITED
Head Of ce: Scotiabank CentreCnr. Duke & Port Royal StreetsP.O. Box 709 Kingston, Jamaica
Board of DirectorsMs. S. D. Chrominska – Chairperson
A. V. Chang
Ms. B. A. Alexander
B. F. Bowen
J. M. Hall
J. M. Matalon, CD
Mrs. J. T Sharp
Dr. H. J. Thompson, CD
Senior Of cersMrs J. T. SharpPresident & CEO
Mrs. R. A. PillinerExecutive Vice-PresidentOperations & Shared Services
H. W. PowellExecutive Vice-PresidentRetail Banking
F. A. WilliamsExecutive Vice-President, Chief Financial Of cer & Chief Administration Of cer
SCOTIA JAMAICA LIFE INSURANCE COMPANY LIMITED
5th Floor, Scotiabank CentreCnr. Duke & Port Royal StreetsKingston, Jamaica
Board of DirectorsA. V. Chang - Chairman
N. A. Foster
H. W. Powell
H. A. Reid
Dr. A. E. Samuels-Harris
A. Mijares Ricci
P. B. Scott
Mrs. J. T. Sharp
O. Zimmerman
Senior Of cersH. A. ReidGeneral Manager Ms. M. ScottSenior Manager, Finance & Investments
Mrs. L. H. ForbesDirector Sales & Channel Delivery
Mrs. M. WilliamsDirector, Operations
THE SCOTIA JAMAICA BUILDING SOCIETY
95 Harbour StreetP.O. Box 8463Kingston, Jamaica
Board of DirectorsDr. H. J. Thompson, CD - Chairman
Ms. B. A. Alexander Deputy Chairperson
Dr. C. D. Archer
Dr. A. N. Law
H. W. Powell
Mrs. J. T. Sharp
D. Walters
Senior Of cersG. F. WhitelockeVice-President & General Manager Non-Branch Sales
D. WebbAssistant General ManagerBusiness Development & Director, Non-Branch Sales & Service
Ms. L. ThompsonManager, Financial Reporting
SCOTIA JAMAICA FINANCIAL SERVICES LIMITED
Scotiabank CentreCnr. Duke & Port Royal StreetsP.O. Box 709Kingston, Jamaica
Board of DirectorsH. W. Powell
Mrs. J. T Sharp
SCOTIA JAMAICA MICROFINANCE COMPANY LIMITED
12 Duke Street, Kingston,Jamaica, W.I.
Board of DirectorsH. W. Powell, ChairmanB. Callam
Mrs. J. T. Sharp
F. Williams
Ms. C. Logan
Mrs. M. Johnston
Senior Of cerMrs. Y. Anderson General Manager
SCOTIABANK JAMAICA FOUNDATION
Scotiabank CentreCnr. Duke & Port Royal StreetsP.O. Box 709Kingston, Jamaica
Board of DirectorsH. W. Powell - Chairman
Mrs. J. A. Grif ths Irving
M. D. McAnuff-Jones
Dr. R. Moodie
Mrs. R. A. Pilliner
Mrs. J. T. Sharp
Mrs. M. Todd
Mrs. R. Voordouw
Senior Of cerMrs. J. A. Grif ths-IrvingExecutive Director
BRIGHTON HOLDINGS LIMITED
Scotiabank CentreCnr. Duke & Port Royal StreetsKingston, Jamaica
Board of DirectorsH. W. Powell
Mrs. J. T. Sharp
SCOTIA INVESTMENTS JAMAICA LIMITED
Head Of ce: 7 Holborn RoadKingston 10, Jamaica
Board of DirectorsB. F. Bowen, Chairman
Ms. B. A. Alexander
A. V. Chang
Mrs. A. M. Fowler
J. M. Hall
Dr. A. N. Law
L. L. Mitchell
P. P. Martin
Ms. C. Welling
M. Schroder
Mrs. J. T. Sharp
Senior Of cersL. L. MitchellChief Executive Of cer
Miss Y. PandohieVice-President & Chief Financial Of cer
H. MillerChief Operating Of cer
SCOTIA ASSET MANAGEMENT JAMAICA LIMITED
1B Holborn Road, Kingston 10 Jamaica
Board of DirectorsMs. B. A. AlexanderChairperson
Mrs. K. Bilyk-Mitchell
Mrs. A. Fowler
L. L. Mitchell
Ms. A. Richards
Mrs. J. T. Sharp
Senior Of cerB. O. FrazerVice-President, Asset Management & General Manager
SCOTIA JAMAICA INVESTMENT MANAGEMENT LIMITED
Scotiabank CentreCnr. Duke & Port Royal StreetsP.O. Box 627 Kingston, Jamaica
Board of DirectorsB. F. Bowen
H. W. Powell
Subsidiaries, Board Members & Senior Of cers
Scotia Group Jamaica Limited 2013 Annual Report 164
SECRETARY
Julie Thompson-JamesVice-PresidentSenior Legal Counsel& Corporate Secretary
The Bank of Nova Scotia Jamaica LimitedExecutive Of cesScotiabank CentreCnr. Duke & Port Royal StreetsP.O. Box 709Kingston, Jamaica
AUDITORS
KPMG6 Duke StreetKingston, Jamaica
Telephone: (876) 922.6640Fax: (876) 922.7198 (876) 922.4500
REGISTERED OFFICE
Scotiabank CentreCnr. Duke & Port Royal StreetsP.O. Box 709Kingston, Jamaica
Telephone: (876) 922.1000Fax: (876) 922.6548Website:www.jamaica.scotiabank.comTelex: 2297SWIFT Bic Code: NOSCJMKN
Corporate Data

165Scotia Group Jamaica Limited 2013 Annual Report
EXECUTIVE OFFICERS
Mrs. Jacqueline SharpPresident & Chief Executive Of cer
Mrs. Rosemarie PillinerExecutive Vice-President, Operations & Shared Services
Mr. H. Wayne PowellExecutive Vice-President, Retail Banking
Mr. Frederick WilliamsExecutive Vice-President, Chief Financial Of cer & Chief Administration Of cer
Miss Monique FrenchSenior Vice-President, Credit Risk Management
Mr. Michael McAnuff-JonesSenior Vice-President, Human Resources
Mr. Lissant MitchellSenior Vice-President, Wealth & CEO, Scotia Investment Jamaica Limited
Mr. Hugh Reid Senior Vice-President, Scotia Group & President, Scotia Jamaica Life Insurance Company Limited
Mr. Norm Stevenson Senior Vice-PresidentCorporate & Commercial Banking
SENIOR MANAGEMENT OFFICERS
Audit
Mr. James BrownChief Auditor
Centralized Retail Collection Unit
Mr. Vincent Harvey Vice-President, Collections & Recovery
Compliance
Mr. George Roper, Vice-President, Compliance
Contact Centre
Mr. Reuben Canagaratnam, Vice-President
Mrs. Sheila Segree-White, General Manager
Corporate & Commercial Banking
Miss Marcette McLeggonVice-President, Credit Solutions
Miss Carlene LynVice-President, Commercial Banking
Corporate Human Resources
Miss Suzanne Donalds, Director HR Planning, Staf ng & Capability Development
Mrs. Hopelin HinesDirector, Total Rewards and Evaluations
Corporate & Legal
Mrs. Julie Thompson-JamesVice-President, Senior Legal Counsel & Company Secretary
Mrs. Shaun Lawson-LaingDirector, Legal Counsel & Assistant Company Secretary
Credit Risk Management
Mr. Bevan Callam, Vice-President
Miss Carol Logan, Assistant General Manager
Mr. Lennox Elvy, Director, Retail Risk
Customer Experience
Mrs. Rosemarie Voordouw, Director
Employee Consultations & Ombuds Services
Mrs. Claudine McCalla, Director
Finance
Miss Shirley Ramsaran Vice-President, Finance & Comptroller
Dr. Adrian Stokes Vice-PresidentBusiness Analytics & Strategy and Risk Management
Miss Carolyn Kean Director, Business Intelligence
Management Of cers (of the Group and its Subsidiaries) As at October 31, 2013

Scotia Group Jamaica Limited 2013 Annual Report 166
SENIOR MANAGEMENT OFFICERS (cont’d)
Government Affairs
Dr. Wayne HenryVice-President, Government Affairs
Marketing, Public & Corporate Affairs
Mrs. Monique ToddVice-President, Marketing, Public & Corporate Affairs
Mrs. Joylene A. Grif ths Irving Director, Corporate Social Responsibility& Executive Director, Scotiabank Jamaica Foundation
Mrs. Simone WalkerDirector, Marketing Programmes
Retail Banking & SME
Mrs. Patsy Latchman AtterburyVice-President, SME Banking
Mr. Carl BrightDistrict Vice-President, Metro East
Mr. Michael E. ShawDistrict Vice-President, Metro North
Mr. Dudley E. WaltersDistrict Vice-President, Metro West
Mr. Gladstone WhitelockeVice-President & General ManagerScotia Jamaica Building Society& Non-Branch Sales & Service
Mr. Dean Webb Assistant General Manager, SJBS Business Development & Non-Branch Sales & Service
Miss Pamela DouglasDirector, Professional Partnerships, SME
Shared Services
Mr. David M. Williams Vice-President, Operations, Shared Services
Mr. Donovan Hanson, Vice-President, Lending Services
Mrs. Saliann WrightVice President, Processing Support Centre
Mrs. Marcia Parker Robinson Director, Regional Strategic Sourcing, Caribbean
Mr. Cecil Rhoden, Director, Retail Risk Assessment
Mrs. Dorette BarrettDirector, Business Service Centre
Scotia Private Client Group
Mrs. Debra Lopez-SpenceCentre Director
Security & InvestigationsMr. Denver FraterRegional Director & Chief Security Of cer
Systems Support CentreMr. Adza Davis, Director, Systems Support Centre
Treasury
Mr. Gary-Vaughn White Vice-President, Treasury
Mr. Adrian Reynolds Director, Treasury & Foreign Exchange Trading
Management Of cers (of the Group and its Subsidiaries) As at October 31, 2013

167Scotia Group Jamaica Limited 2013 Annual Report
ALLOWANCE FOR IMPAIRMENT LOSSES: An allowance set aside which, in management’s opinion, is adequate to absorb all credit-related losses. It is decreased by write-offs, realized losses and recoveries; and increased by new provisions. It includes speci c and general allowances, and is deducted from the related asset category on the Group’s consolidated balance sheet.
ASSETS HELD IN TRUST: Consists of custodial and non-discretionary trust assets administered by the Group and its subsidiaries, which are bene cially owned by customers and are therefore not reported on the Group’s consolidated balance sheet. Services provided in respect of these assets are administrative in nature, such as security custody; trusteeship, stock transfer and personal trust services.
BOJ: The Bank of Jamaica, the regulator for Commercial Banks, Merchant Banks, and Building Societies in Jamaica.
BASIS POINT: A unit of measure de ned as one-hundredth of one per cent; 100bp equals 1%.
CAPITAL: Consists of common shareholders’ equity. Capital supports asset growth, provides against loan losses and protects the Group and its subsidiaries’ depositors.
CREDIT SPREAD RISK: The risk of loss due to changes in the market price of credit, or the credit-worthiness of a particular issuer.
EQUITY RISK: The risk of loss due to changes in the prices, and the volatility, of individual equity instruments and equity indices.
FAIR VALUE: The amount of consideration that would be agreed upon in an arm’s length transaction between knowledgeable, willing parties who are under no compulsion to act.
FOREIGN CURRENCY RISK: The risk of loss due to changes in spot and forward prices, and the volatility of currency exchange rates.
FOREIGN EXCHANGE CONTRACTS: Commitments to buy or sell a speci ed amount of foreign currency on a set date and at a predetermined rate of exchange.
FSC: The Financial Services Commission, the regulator for securities dealers, insurance companies, and pension funds in Jamaica.
FUNDS UNDER ADMINISTRATION & MANAGEMENT: The total market value of portfolios owned by customers, for whom the Group and its subsidiaries provides custody, trustee, corporate administration, investment management and advisory services, and are not reported on the Group’s consolidated balance sheet.
GAP ANALYSIS: Gap analysis is used to assess the interest rate sensitivity of the Group’s operations. Under gap analysis, interest rate sensitive assets, liabilities and off-balance sheet instruments are assigned to de ned time periods on the basis of expected re-pricing dates.
GENERAL PROVISIONS: Established against the loan portfolio in the Group and its subsidiaries when management’s assessment of economic trends suggests that losses may occur, but such losses cannot yet be speci cally identi ed on an individual item-by-item basis.
IFRS: International Financial Reporting Standards issued by the International Accounting Standards Board, the global accounting standards setting body, which have been adopted by the Institute of Chartered Accountants of Jamaica.
INTEREST RATE RISK : The risk of loss due to changes in the level, slope and curvature of the yield curve; the volatility of interest rates; and mortgage prepayment rates.
MARKED-TO-MARKET: The valuation of certain nancial instruments at market prices as of the balance
sheet date.
NET INTEREST MARGIN: Net interest income, expressed as a percentage of average total assets.
NON-PERFORMING (IMPAIRED) LOANS: Loans on which the Group and its subsidiaries no longer have reasonable assurance as to the timely collection of interest and principal, or where a contractual payment is past due for a prescribed period. Interest is not accrued on non-performing loans.
OPERATING LEVERAGE: Operating Leverage is de ned internally as the difference between the rate of revenue growth and the rate of expense growth.
Glossary
Scotia Group Jamaica Limited 2013 Annual Report 168
PRODUCTIVITY RATIO: Measures the ef ciency with which the Group and its subsidiaries incur expenses to generate revenue. It expresses non-interest expenses as a percentage of the sum of total income. A lower ratio indicates improved productivity.
REPOS: Repos is short for ‘obligations related to assets sold under repurchase agreements’ – a short-term transaction where the Group and its subsidiaries sells assets, normally Government bonds, to a client and simultaneously agrees to repurchase them on a speci ed date and at a speci ed price. It is a form of short-term funding.
RETURN ON EQUITY: Net income available to common shareholders, expressed as a percentage of average common shareholders’ equity.
REVERSE REPOS: Short for ‘assets purchased under resale agreements’ – a short-term transaction where the Group and its subsidiaries purchase assets, normally Government bonds, from a client and simultaneously agrees to resell them on a speci ed date and at a speci ed price. It is a form of short-term collateralized lending.
RISK-WEIGHTED ASSETS: Calculated using weights assigned by the regulators based on the degree of credit risk for each class of counterparty. Off-balance sheet instruments are converted to balance sheet equivalents, using speci ed conversion factors, before the appropriate risk weights are applied.
SENSITIVITY ANALYSIS: Sensitivity analysis assesses the effect of changes in interest rates on current earnings and on the economic value of shareholders’ equity related to non-trading portfolios.
STANDBY LETTERS OF CREDIT AND LETTERS OF GUARANTEE: Assurances given by the Group and its subsidiaries that it will make payments on behalf of clients to third-parties in the event that the customer defaults. The Group and its subsidiaries have recourse against its customers for any such advanced funds.
STRESS TESTING: Assessment of market risk under unlikely but possible events in abnormal markets. Stress testing examines the impact that abnormally large swings in market factors and periods of prolonged inactivity might have on trading portfolios. The stress testing program is designed to identify key risks and
ensure that the Group’s capital can absorb potential losses from abnormal events.
TIER 1, TIER 2 CAPITAL RATIOS: These are ratios of capital to risk-weighted assets, as stipulated by the Bank of Jamaica and the Financial Services Commission, based on guidelines developed under the auspices of the Bank for International Settlements (BIS). Tier 1 capital is de ned as follows:
(a) For entities regulated by the BOJ: Tier 1 capital consists primarily of common shareholders’ equity, and certain designated retained earnings which by statute may not be distributed or reduced without permission from the Bank of Jamaica.
(b) For entities regulated by the FSC: Tier 1 capital consists primarily of common shareholders’ equity and certain reserves designated by the Commission such as retained earnings and investment reserves. Deductions may also be applied for net investments in associates/subsidiaries, goodwill and other intangibles assets, among other things.
Tier 2 capital consists mainly of eligible general allowances. Together, Tier 1 and Tier 2 capital less certain deductions, comprise total qualifying capital.
VALUE AT RISK VaR : VaR is a method of measuring market risk based upon a common con dence interval and time horizon. It is a statistical estimate of expected potential loss that is derived by translating the riskiness of any nancial instrument into a common standard. The Group calculates VaR daily using a 99% con dence level, and a one-day holding period for its trading portfolios. This means that about once in every 100 days, the trading positions are expected to lose more than the VaR estimate.
YIELD CURVE: A graph showing the term structure of interest rates, plotting the yields of similar quality bonds by term to maturity.
PRODUCTIVITY RATIO: Measures the ef ciency with which the Group and its subsidiaries incur expenses to generate revenue. It expresses non-interest expenses as a percentage of the sum of total income. A lower ratio indicates improved productivity.
Glossary

169Scotia Group Jamaica Limited 2013 Annual Report
Notes

Scotia Group Jamaica Limited 2013 Annual Report 170
Notes

Re
sto
re Reuse Rec
ycl
e
Sc
o
tia G o es Gre
en
Paper materials produced from well-managed forest and tree farms,
chemical-free printing plates and soya-based inks were used in the
production of this Annual Report.
Designed and produced by: Marketing, Public & Corporate Affairs Department
Scotiabank Group (Jamaica)
