audited interim financial report for the six months …
TRANSCRIPT

ABN 68 091 049 357
AUDITED INTERIM FINANCIAL REPORT
FOR THE SIX MONTHS ENDED
31 DECEMBER 2010
2
TABLE OF CONTENTS
Page
CORPORATE DIRECTORY 3
DIRECTORS’ REPORT 4
CONSOLIDATED INCOME STATEMENT 7
CONSOLIDATED STATEMENT OF COMPREHENSIVE INCOME 8
CONSOLIDATED BALANCE SHEET 9
CONSOLIDATED STATEMENT OF CHANGES IN EQUITY 10
CONSOLIDATED STATEMENT OF CASH FLOWS 11
NOTES TO AND FORMING PART OF THE FINANCIAL STATEMENTS 12
AUDITORS INDEPENDENCE DECLARATION 19
INDEPENDENT AUDITOR’S REPORT 20
DIRECTORS’ DECLARATION 21

3
CORPORATE DIRECTORY
Directors
Terry Streeter (Chairman)
David Cooper
Robin Dunbar
Julian Hanna
David Southam (Appointed 15 November 2010)
Daniel Lougher
Richard Yeates
Company Secretary
Joseph Belladonna
Auditors
Crowe Horwath Perth Audit Partnership
256 St Georges Terrace
Perth WA 6000
Bankers
ANZ Banking Group Limited
77 St Georges Terrace
Perth WA 6000
Share Registry
Australia
Computershare Investor Services Pty Ltd
Level 2, 45 St Georges Terrace
Perth WA 6000
Canada
Computershare Investor Services INC
100 University Ave, Suite 800
Toronto Ontario M5J 2Y1
Stock Exchange
Australian Stock Exchange Limited &
Toronto Stock Exchange Group
Code : WSA
Solicitors
Allion Legal
Level 2, 50 Kings Park Road
West Perth WA 6005
Registered Office
Suite 3, Level 1
11 Ventnor Avenue
West Perth WA 6005
Phone (08) 9334 7777
Fax (08) 9486 7866
Treasury Advisers
Oakvale Capital Ltd
Level 3, 50 Colin Street
West Perth WA 6005

Western Areas NL & Controlled Entities ABN 68 091 049 357
4
INTERIM FINANCIAL REPORT
DIRECTORS’ REPORT
The directors submit the financial report of the consolidated entity for the six months ended 31 December 2010.
The consolidated financial statements are a general purpose financial report prepared in accordance with the Corporations Act 2001,
AASB 134 “Interim Financial Reporting”, Australian Accounting Interpretations and other authoritative pronouncements of the
Australian Accounting Standards Board. The report does not include full disclosures of the type normally included in an annual report.
It is recommended that this financial report be read in conjunction with the 30 June 2010 annual financial report and any other public
announcements made by Western Areas NL during the year in accordance with continuous disclosure requirements arising under the
Corporations Act 2001. The financial report covers Western Areas NL and its controlled entities (the “Consolidated Entity”). Western
Areas NL is a listed public company, incorporated and domiciled in Australia. The accounting policies adopted are consistent with those
of the previous financial year.
The effective date of this report is 14 February 2011.
All amounts in this discussion are expressed in Australian dollars unless otherwise identified.
Auditor’s Declaration
The lead auditor’s independence declaration under s 307C of the Corporations Act 2001 is set out on page 19 for the half-year ended
31 December 2010.
Forward Looking Statements
The following Directors report may contain forward-looking statements that involve numerous risks and uncertainties. Actual results of
the Company could differ materially from those discussed in such forward-looking statements as a result of the risks and uncertainties
inherent in the business.
The Company disclaims any intention or obligation to update or revise the forward looking statements whether as a result of new
information or change in business circumstance.
Directors
The names of the Company’s directors in office during the six months ended and until the date of this report are as below. Unless noted,
directors were in office for this entire period.
Terence Streeter Non Executive Chairman
David Cooper Non Executive Director
Robin Dunbar Non Executive Director
Richard J Yeates Non Executive Director
Julian Hanna Managing Director and Chief Executive Officer
David Southam Finance Director (Appointed 15 November 2010)
Daniel Lougher Director of Operations
Company Secretary
Joseph Belladonna

Western Areas NL & Controlled Entities ABN 68 091 049 357
5
REVIEW OF OPERATIONS
Mine production has increased significantly during the last two quarters with upward trends in both ore tonnes and grade. High
grade ore sources are now available from the completely developed T4 deposit and the large T5 deposit. Production from
Flying Fox increased to an average of 1,300 nickel tonnes in ore per month for the Sept and Dec quarters and should sustain
these levels in the coming year. Nickel sales were also strong in the half year and the majority of the backlog of concentrate
stockpiles has now been sold to BHP Billiton and Jinchuan.
At the Spotted Quoll mine, the Tim King pit is ahead of forecast with an average of 1,400 nickel tonnes in ore per month for
the first six months. First high grade ore was intersected in the open pit in the June Qtr and production for the half year has
been exceptional due to the high grade and additional ore in the north lode. Development for the Spotted Quoll underground
mine will commence early in the June 11 quarter. Current ore reserves at Spotted Quoll should support an 8 to 10 year mine
life.
Cash costs for the June and December quarters at the Forrestania Operations were well below guidance of US$2.50, at
US$1.86 /lb nickel in concentrate. This places Western Areas well into the lower quartile of nickel sulphide producers.
The exploration expenditure has been increased to advance exploration activity at our regional Sandstone project, additional
drilling for resource extensions (Flying Fox and Spotted Quoll) and exploration along the Forrestania tenements.
OPERATIONAL HIGHLIGHTS
1. Production from Flying Fox mine for the half year was 181,570 tonnes mined at 4.3% nickel for 7,822 tonnes
(17.2M lbs) contained nickel.
2. Production from the Tim King Pit at Spotted Quoll for the half year was 123,674 tonnes mined at 6.8% nickel for
8,439 tonnes (18.6M lbs) contained nickel.
3. 254,569 ore tonnes were milled to produce 12,654 tonnes (27.9M lbs) nickel in concentrate for the half year.
The average plant recovery was 89%.
4. Cash costs (before smelting/refining charges) for the half year were US$1.86/lb nickel, 26% below the long term
guidance target of US$2.50/lb nickel.
5. Stockpiles at 31 December 2010 contain an estimated 5,936 tonnes (13.1M lbs) nickel in ore and concentrate
which should contribute to ongoing strong sales.
6. At 31 December Western Areas had a total of A$167.7M cash plus nickel sales receivables compared with
A$82.1M at the end of June 2010.
7. Spotted Quoll Stage One underground mine feasibility confirmed a robust 8 year project with IRRs ranging from
41% (US$6/lb Ni) to 96% (US$10/lb Ni).
8. Drilling below Spotted Quoll indicates the high grade deposit may extend to at least twice the depth of the
planned Stage One underground mine.
9. $20M pa exploration program underway with drilling to test Flying Fox T6/T7/T8 deposits, plus new targets at
Forrestania and regional nickel projects.
10. The 2012 convertible bond was partly restructured to extend the maturity date & reduce the coupon rate. A bond
repayment account was established with $40m.
11. Western Areas welcomed David Southam as Finance Director in November.
Western Areas NL & Controlled Entities ABN 68 091 049 357
6
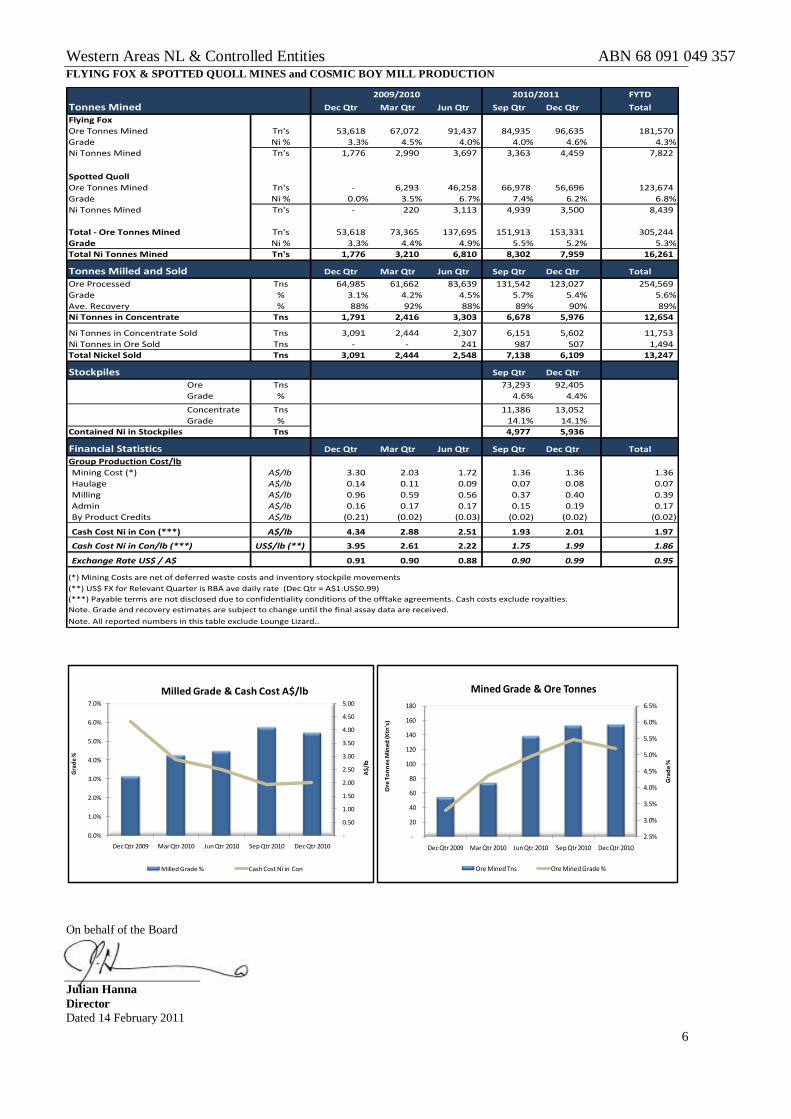
FLYING FOX & SPOTTED QUOLL MINES and COSMIC BOY MILL PRODUCTION
FYTD
Tonnes Mined Dec Qtr Mar Qtr Jun Qtr Sep Qtr Dec Qtr Total
Flying Fox
Ore Tonnes Mined Tn's 53,618 67,072 91,437 84,935 96,635 181,570
Grade Ni % 3.3% 4.5% 4.0% 4.0% 4.6% 4.3%
Ni Tonnes Mined Tn's 1,776 2,990 3,697 3,363 4,459 7,822
Spotted Quoll
Ore Tonnes Mined Tn's - 6,293 46,258 66,978 56,696 123,674
Grade Ni % 0.0% 3.5% 6.7% 7.4% 6.2% 6.8%
Ni Tonnes Mined Tn's - 220 3,113 4,939 3,500 8,439
Total - Ore Tonnes Mined Tn's 53,618 73,365 137,695 151,913 153,331 305,244
Grade Ni % 3.3% 4.4% 4.9% 5.5% 5.2% 5.3%
Total Ni Tonnes Mined Tn's 1,776 3,210 6,810 8,302 7,959 16,261
Tonnes Milled and Sold Dec Qtr Mar Qtr Jun Qtr Sep Qtr Dec Qtr Total
Ore Processed Tns 64,985 61,662 83,639 131,542 123,027 254,569
Grade % 3.1% 4.2% 4.5% 5.7% 5.4% 5.6%
Ave. Recovery % 88% 92% 88% 89% 90% 89%
Ni Tonnes in Concentrate Tns 1,791 2,416 3,303 6,678 5,976 12,654
Ni Tonnes in Concentrate Sold Tns 3,091 2,444 2,307 6,151 5,602 11,753
Ni Tonnes in Ore Sold Tns - - 241 987 507 1,494
Total Nickel Sold Tns 3,091 2,444 2,548 7,138 6,109 13,247
Stockpiles Sep Qtr Dec Qtr
Ore Tns 73,293 92,405
Grade % 4.6% 4.4%
Concentrate Tns 11,386 13,052
Grade % 14.1% 14.1%
Contained Ni in Stockpiles Tns 4,977 5,936
Financial Statistics Dec Qtr Mar Qtr Jun Qtr Sep Qtr Dec Qtr Total
Group Production Cost/lb
Mining Cost (*) A$/lb 3.30 2.03 1.72 1.36 1.36 1.36
Haulage A$/lb 0.14 0.11 0.09 0.07 0.08 0.07
Milling A$/lb 0.96 0.59 0.56 0.37 0.40 0.39
Admin A$/lb 0.16 0.17 0.17 0.15 0.19 0.17
By Product Credits A$/lb (0.21) (0.02) (0.03) (0.02) (0.02) (0.02)
Cash Cost Ni in Con (***) A$/lb 4.34 2.88 2.51 1.93 2.01 1.97
Cash Cost Ni in Con/lb (***) US$/lb (**) 3.95 2.61 2.22 1.75 1.99 1.86
Exchange Rate US$ / A$ 0.91 0.90 0.88 0.90 0.99 0.95
(***) Payable terms are not disclosed due to confidentiality conditions of the offtake agreements. Cash costs exclude royalties.
Note. Grade and recovery estimates are subject to change until the final assay data are received.
Note. All reported numbers in this table exclude Lounge Lizard..
(*) Mining Costs are net of deferred waste costs and inventory stockpile movements
(**) US$ FX for Relevant Quarter is RBA ave daily rate (Dec Qtr = A$1:US$0.99)
2009/2010 2010/2011
-
0.50
1.00
1.50
2.00
2.50
3.00
3.50
4.00
4.50
5.00
0.0%
1.0%
2.0%
3.0%
4.0%
5.0%
6.0%
7.0%
Dec Qtr 2009 Mar Qtr 2010 Jun Qtr 2010 Sep Qtr 2010 Dec Qtr 2010
A$/
lb
Gra
de
%
Milled Grade & Cash Cost A$/lb
Milled Grade % Cash Cost Ni in Con
2.5%
3.0%
3.5%
4.0%
4.5%
5.0%
5.5%
6.0%
6.5%
-
20
40
60
80
100
120
140
160
180
Dec Qtr 2009 Mar Qtr 2010 Jun Qtr 2010 Sep Qtr 2010 Dec Qtr 2010
Ore
To
nn
es
Min
ed
(Ktn
's)
Gra
de
%
Mined Grade & Ore Tonnes
Ore Mined Tns Ore Mined Grade %
On behalf of the Board
Julian Hanna
Director
Dated 14 February 2011
Western Areas NL & Controlled Entities ABN 68 091 049 357
7
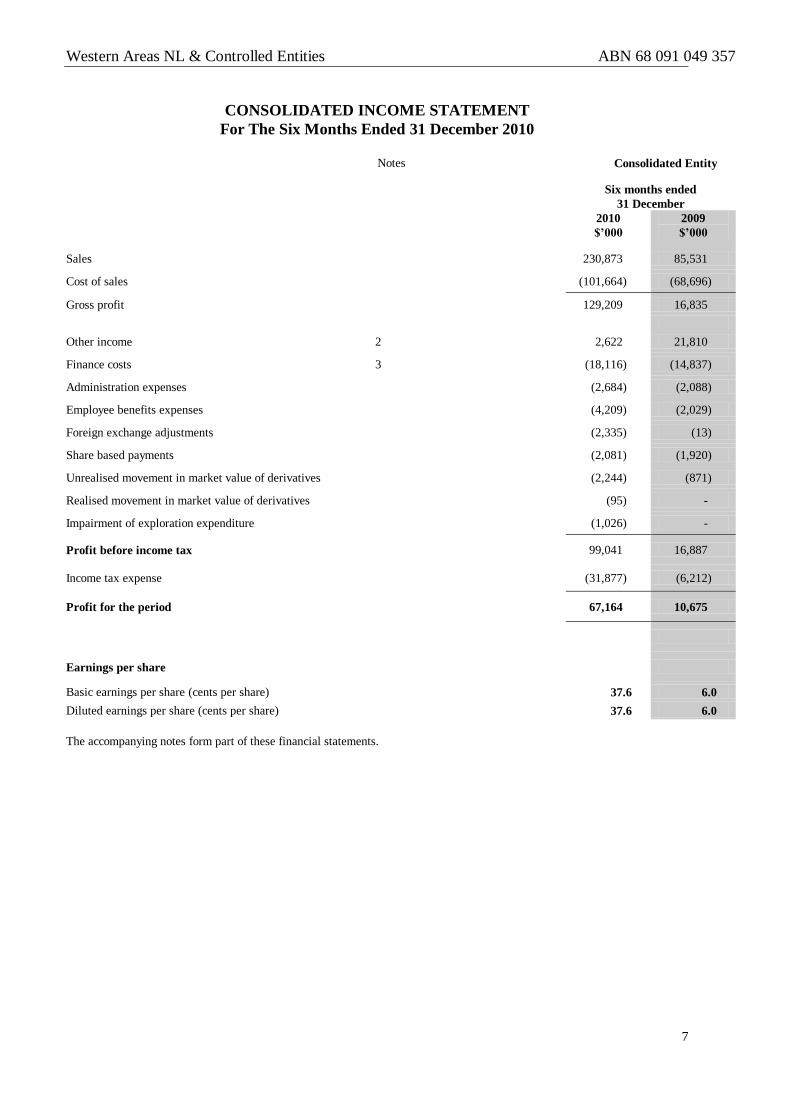
CONSOLIDATED INCOME STATEMENT
For The Six Months Ended 31 December 2010 Notes Consolidated Entity
Three months ended
31 December
Six months ended
31 December
2008
$’000
2007
$’000
2010
$’000
2009
$’000
Sales 996 230,873 85,531
Cost of sales (858) (101,664) (68,696)
Gross profit 138 129,209 16,835
Other income 2 597 2,622 21,810
Finance costs 3 (43) (18,116) (14,837)
Administration expenses (343) (2,684) (2,088)
Employee benefits expenses (919) (4,209) (2,029)
Foreign exchange adjustments (2,335) (13)
Share based payments (2,081) (1,920)
Unrealised movement in market value of derivatives (2,244) (871)
Realised movement in market value of derivatives (95) -
Impairment of exploration expenditure (1,026) -
Profit before income tax 99,041 16,887
Income tax expense (12,089) (31,877) (6,212)
Profit for the period 4,192 67,164 10,675
Earnings per share
Basic earnings per share (cents per share) 37.6 6.0
Diluted earnings per share (cents per share) 37.6 6.0
The accompanying notes form part of these financial statements.
Western Areas NL & Controlled Entities ABN 68 091 049 357
8
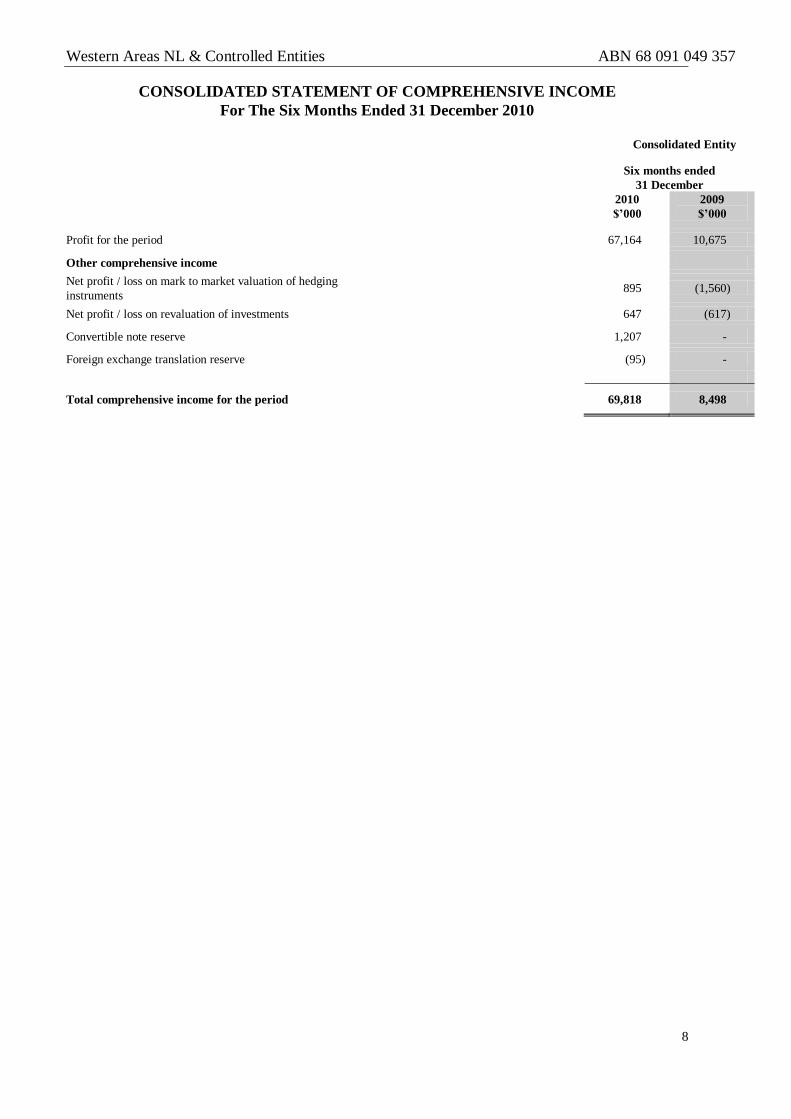
CONSOLIDATED STATEMENT OF COMPREHENSIVE INCOME
For The Six Months Ended 31 December 2010 Consolidated Entity
Three months ended
31 December
Six months ended
31 December
2008
$’000
2007
$’000
2010
$’000
2009
$’000
Profit for the period 996 67,164 10,675
Other comprehensive income (858)
Net profit / loss on mark to market valuation of hedging
instruments 138 895 (1,560)
Net profit / loss on revaluation of investments 647 (617)
Convertible note reserve 1,207 -
Foreign exchange translation reserve (95) -
Total comprehensive income for the period 4,192 69,818 8,498
Western Areas NL & Controlled Entities ABN 68 091 049 357
9
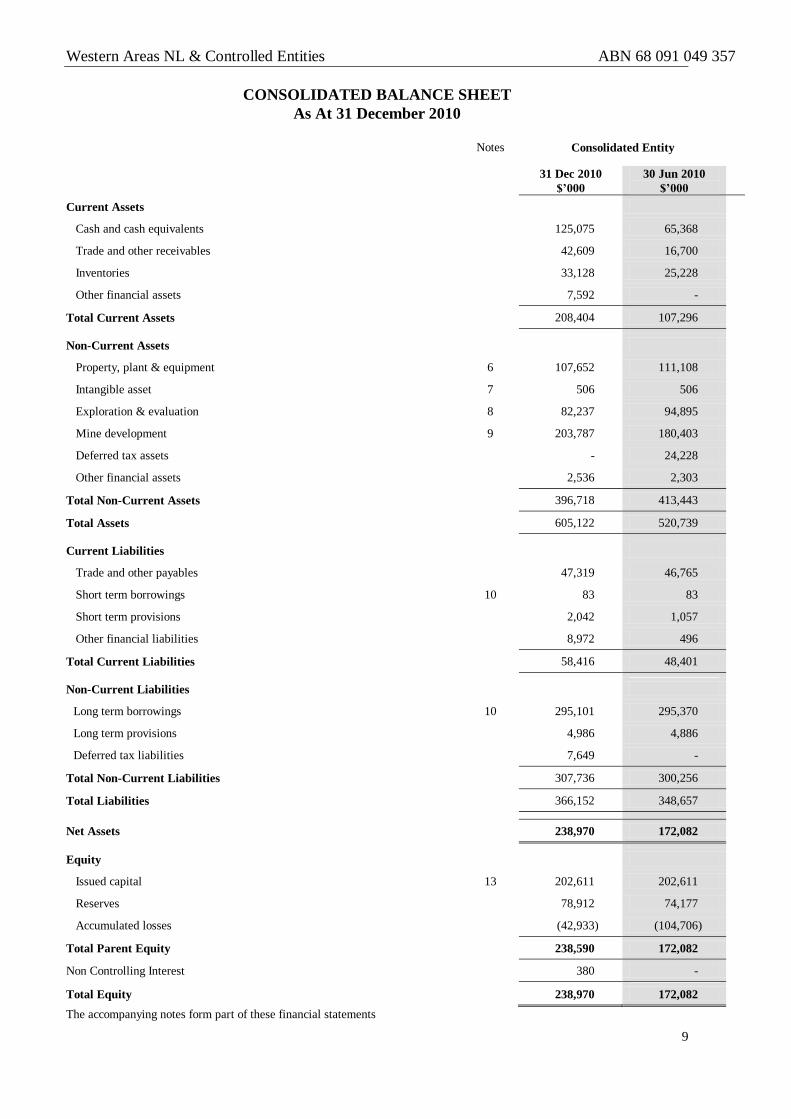
CONSOLIDATED BALANCE SHEET
As At 31 December 2010
Notes Consolidated Entity
31 Dec 2010
$’000
30 Jun 2010
$’000
Current Assets
Cash and cash equivalents 125,075 65,368
Trade and other receivables 42,609 16,700
Inventories 33,128 25,228
Other financial assets 7,592 -
Total Current Assets 208,404 107,296
Non-Current Assets
Property, plant & equipment 6 107,652 111,108
Intangible asset 7 506 506
Exploration & evaluation 8 82,237 94,895
Mine development 9 203,787 180,403
Deferred tax assets - 24,228
Other financial assets 2,536 2,303
Total Non-Current Assets 396,718 413,443
Total Assets 605,122 520,739
Current Liabilities
Trade and other payables 47,319 46,765
Short term borrowings 10 83 83
Short term provisions 2,042 1,057
Other financial liabilities 8,972 496
Total Current Liabilities 58,416 48,401
Non-Current Liabilities
Long term borrowings 10 295,101 295,370
Long term provisions 4,986 4,886
Deferred tax liabilities 7,649 -
Total Non-Current Liabilities 307,736 300,256
Total Liabilities 366,152 348,657
Net Assets 238,970 172,082
Equity
Issued capital 13 202,611 202,611
Reserves 78,912 74,177
Accumulated losses (42,933) (104,706)
Total Parent Equity 238,590 172,082
Non Controlling Interest 380 -
Total Equity 238,970 172,082
The accompanying notes form part of these financial statements
Western Areas NL & Controlled Entities ABN 68 091 049 357
10
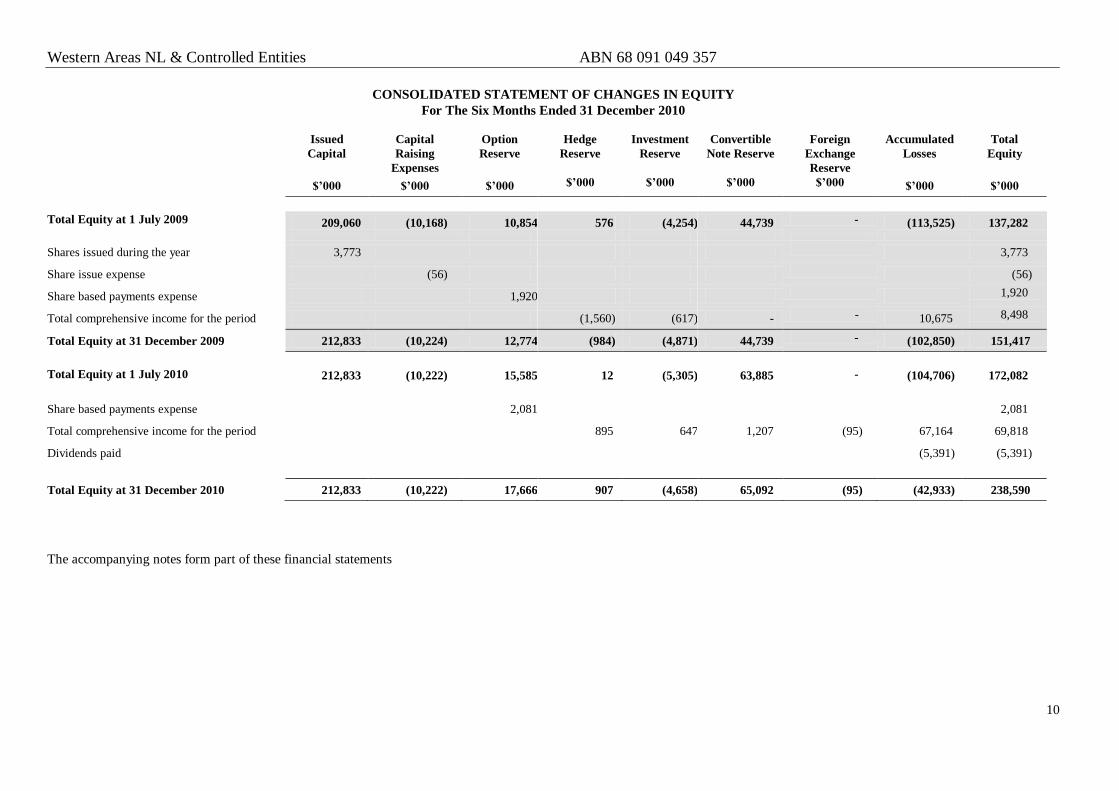
CONSOLIDATED STATEMENT OF CHANGES IN EQUITY
For The Six Months Ended 31 December 2010
The accompanying notes form part of these financial statements
Issued
Capital
Capital
Raising
Expenses
Option
Reserve
Hedge
Reserve
Investment
Reserve
Convertible
Note Reserve
Foreign
Exchange
Reserve
Accumulated
Losses
Total
Equity
$’000 $’000 $’000 $’000 $’000 $’000 $’000 $’000 $’000
Total Equity at 1 July 2009 209,060 (10,168) 10,854 576 (4,254) 44,739 - (113,525) 137,282
Shares issued during the year 3,773 3,773
Share issue expense (56) (56)
Share based payments expense 1,920 1,920
Total comprehensive income for the period (1,560) (617) - - 10,675 8,498
Total Equity at 31 December 2009 212,833 (10,224) 12,774 (984) (4,871) 44,739 - (102,850) 151,417
Total Equity at 1 July 2010 212,833 (10,222) 15,585 12 (5,305) 63,885 - (104,706) 172,082
Share based payments expense 2,081 2,081
Total comprehensive income for the period 895 647 1,207 (95) 67,164 69,818
Dividends paid (5,391) (5,391)
Total Equity at 31 December 2010 212,833 (10,222) 17,666 907 (4,658) 65,092 (95) (42,933) 238,590
Western Areas NL & Controlled Entities ABN 68 091 049 357
11
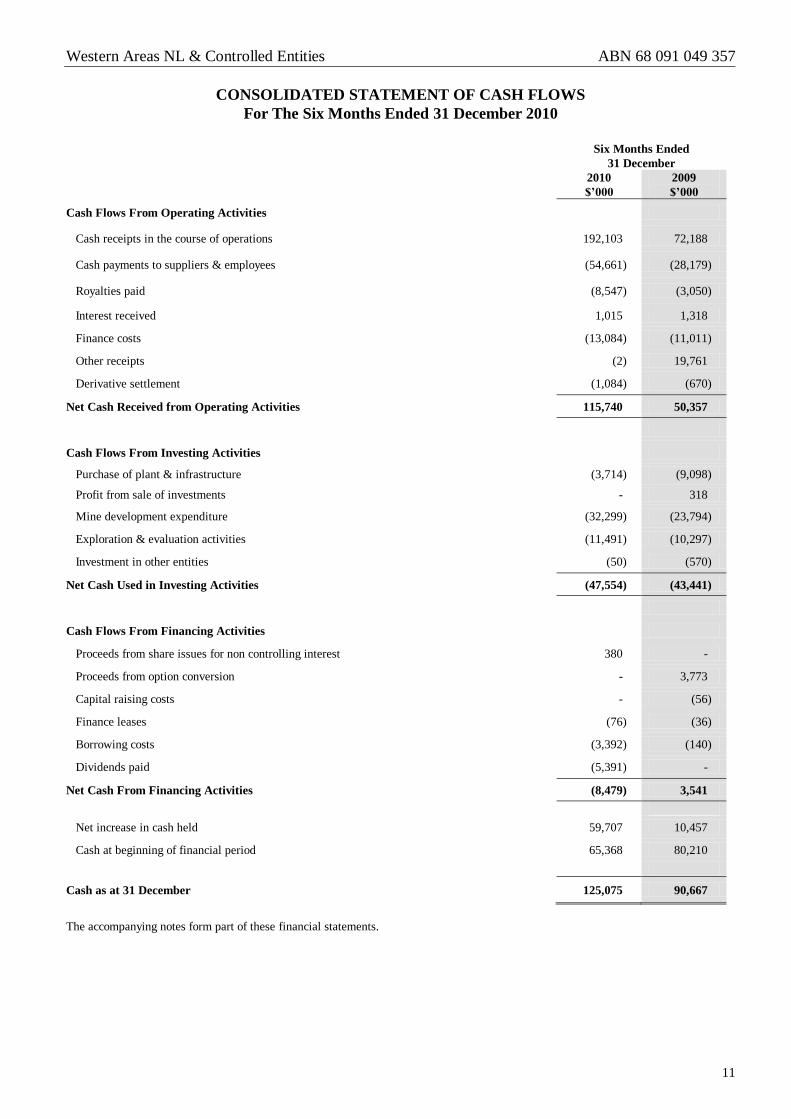
CONSOLIDATED STATEMENT OF CASH FLOWS
For The Six Months Ended 31 December 2010
Three Months Ended
31 December
Six Months Ended
31 December
2008
$’000
2007
$’000
2010
$’000
2009
$’000
Cash Flows From Operating Activities
Cash receipts in the course of operations
5,787 203 192,103 72,188
Cash payments to suppliers & employees
(7,616) (11,432) (54,661) (28,179)
Royalties paid
(499) - (8,547) (3,050)
Interest received 4,255 351 1,015 1,318
Finance costs (10,322) (1,439) (13,084) (11,011)
Other receipts 260 - (2) 19,761
Derivative settlement (15,961) - (1,084) (670)
Net Cash Received from Operating Activities (24,096) (12,317) 115,740 50,357
Cash Flows From Investing Activities
Purchase of plant & infrastructure (2,328) (6,724) (3,714) (9,098)
Profit from sale of investments - 318
Mine development expenditure (5,568) (12,448) (32,299) (23,794)
Exploration & evaluation activities (3,413) 383 (11,491) (10,297)
Investment in other entities - (3,209) (50) (570)
Net Cash Used in Investing Activities (11,309) (19,786) (47,554) (43,441)
Cash Flows From Financing Activities
Proceeds from share issues for non controlling interest - 59,312 380 -
Proceeds from option conversion 328 - - 3,773
Capital raising costs - 69,331 - (56)
Finance leases (45) (24) (76) (36)
Borrowing costs (158) (1,383) (3,392) (140)
Dividends paid - (2,954) (5,391) -
Net Cash From Financing Activities 125 50,600 (8,479) 3,541
Net increase in cash held (35,280) 18,497 59,707 10,457
Cash at beginning of financial period 212,643 4,153 65,368 80,210
Cash as at 31 December
177,363 22,650 125,075 90,667
The accompanying notes form part of these financial statements.
Western Areas NL & Controlled Entities ABN 68 091 049 357
12
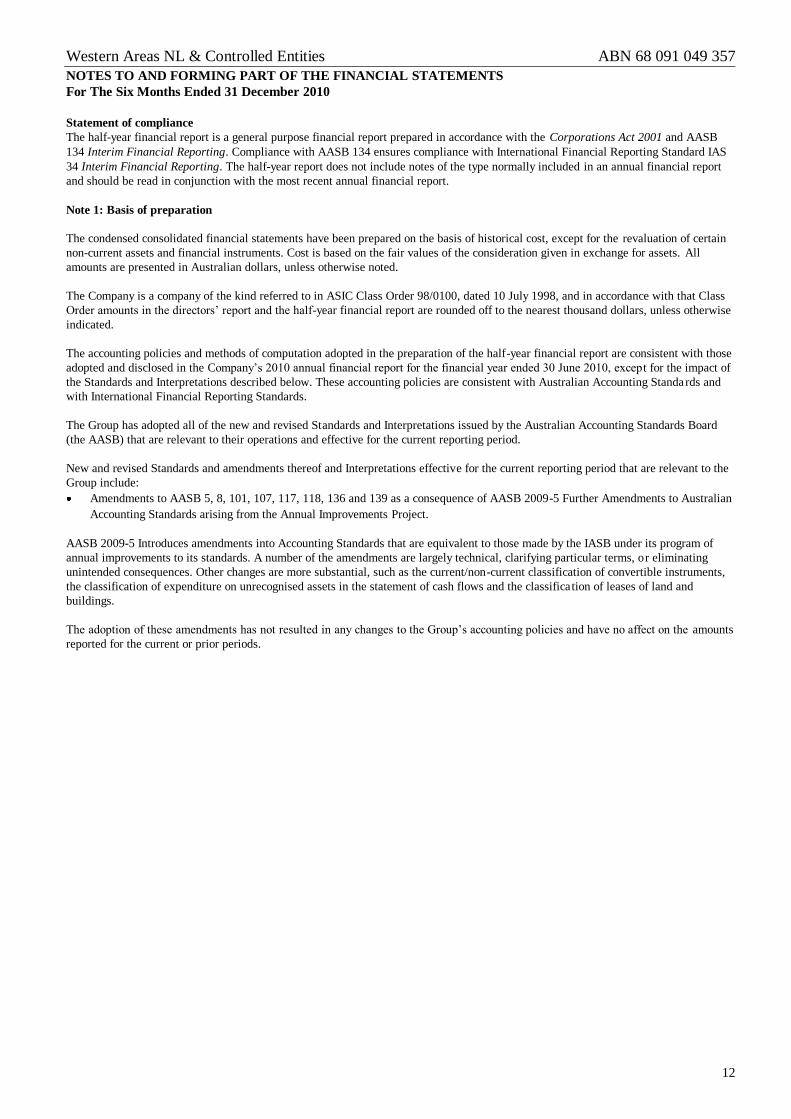
NOTES TO AND FORMING PART OF THE FINANCIAL STATEMENTS
For The Six Months Ended 31 December 2010
Statement of compliance
The half-year financial report is a general purpose financial report prepared in accordance with the Corporations Act 2001 and AASB
134 Interim Financial Reporting. Compliance with AASB 134 ensures compliance with International Financial Reporting Standard IAS
34 Interim Financial Reporting. The half-year report does not include notes of the type normally included in an annual financial report
and should be read in conjunction with the most recent annual financial report.
Note 1: Basis of preparation
The condensed consolidated financial statements have been prepared on the basis of historical cost, except for the revaluation of certain
non-current assets and financial instruments. Cost is based on the fair values of the consideration given in exchange for assets. All
amounts are presented in Australian dollars, unless otherwise noted.
The Company is a company of the kind referred to in ASIC Class Order 98/0100, dated 10 July 1998, and in accordance with that Class
Order amounts in the directors’ report and the half-year financial report are rounded off to the nearest thousand dollars, unless otherwise
indicated.
The accounting policies and methods of computation adopted in the preparation of the half-year financial report are consistent with those
adopted and disclosed in the Company’s 2010 annual financial report for the financial year ended 30 June 2010, except for the impact of
the Standards and Interpretations described below. These accounting policies are consistent with Australian Accounting Standards and
with International Financial Reporting Standards.
The Group has adopted all of the new and revised Standards and Interpretations issued by the Australian Accounting Standards Board
(the AASB) that are relevant to their operations and effective for the current reporting period.
New and revised Standards and amendments thereof and Interpretations effective for the current reporting period that are relevant to the
Group include:
Amendments to AASB 5, 8, 101, 107, 117, 118, 136 and 139 as a consequence of AASB 2009-5 Further Amendments to Australian
Accounting Standards arising from the Annual Improvements Project.
AASB 2009-5 Introduces amendments into Accounting Standards that are equivalent to those made by the IASB under its program of
annual improvements to its standards. A number of the amendments are largely technical, clarifying particular terms, or eliminating
unintended consequences. Other changes are more substantial, such as the current/non-current classification of convertible instruments,
the classification of expenditure on unrecognised assets in the statement of cash flows and the classification of leases of land and
buildings.
The adoption of these amendments has not resulted in any changes to the Group’s accounting policies and have no affect on the amounts
reported for the current or prior periods.
Western Areas NL & Controlled Entities ABN 68 091 049 357
13
NOTES TO AND FORMING PART OF THE FINANCIAL STATEMENTS
For The Six Months Ended 31 December 2010
Consolidated Entity
31 Dec 2010
$’000
31 Dec 2009
$’000
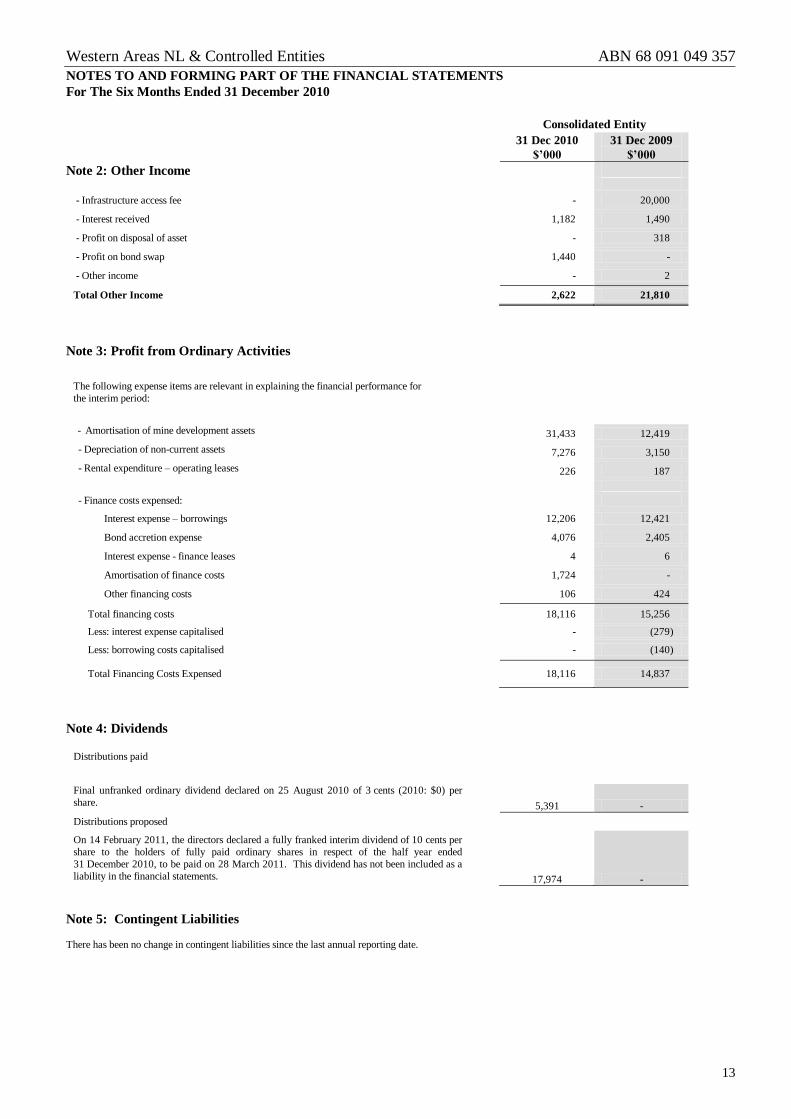
Note 2: Other Income
- Infrastructure access fee - 20,000
- Interest received 1,182 1,490
- Profit on disposal of asset - 318
- Profit on bond swap 1,440 -
- Other income - 2
Total Other Income 2,622 21,810
Note 3: Profit from Ordinary Activities
The following expense items are relevant in explaining the financial performance for
the interim period:
- Amortisation of mine development assets 31,433 12,419
- Depreciation of non-current assets 7,276 3,150
- Rental expenditure – operating leases 226 187
- Finance costs expensed:
Interest expense – borrowings 12,206 12,421
Bond accretion expense 4,076 2,405
Interest expense - finance leases 4 6
Amortisation of finance costs 1,724 -
Other financing costs 106 424
Total financing costs 18,116 15,256
Less: interest expense capitalised - (279)
Less: borrowing costs capitalised - (140)
Total Financing Costs Expensed 18,116 14,837
Note 4: Dividends
Distributions paid
Final unfranked ordinary dividend declared on 25 August 2010 of 3 cents (2010: $0) per
share.
5,391 -
Distributions proposed
On 14 February 2011, the directors declared a fully franked interim dividend of 10 cents per
share to the holders of fully paid ordinary shares in respect of the half year ended
31 December 2010, to be paid on 28 March 2011. This dividend has not been included as a
liability in the financial statements. 17,974 -
Note 5: Contingent Liabilities
There has been no change in contingent liabilities since the last annual reporting date.
Western Areas NL & Controlled Entities ABN 68 091 049 357
14
NOTES TO AND FORMING PART OF THE FINANCIAL STATEMENTS
For The Six Months Ended 31 December 2010
Consolidated Entity
31 Dec 2010
$’000
30 Jun 2010
$’000
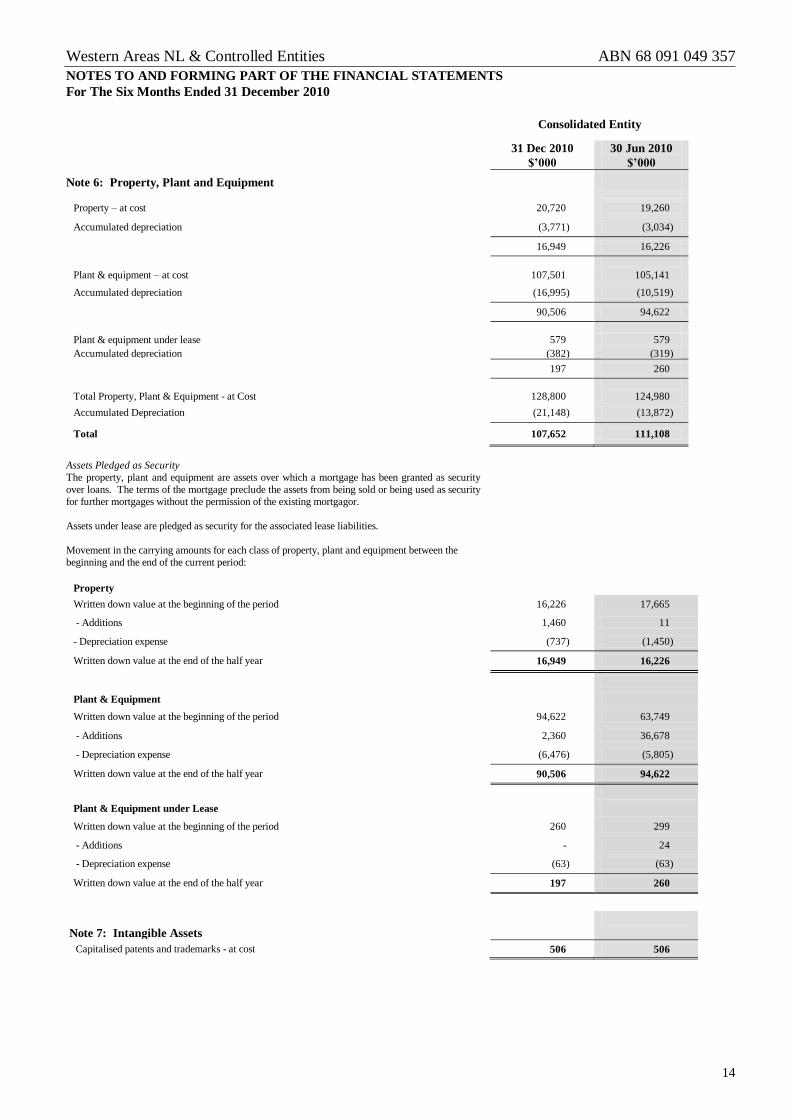
Note 6: Property, Plant and Equipment
Property – at cost 20,720 19,260
Accumulated depreciation (3,771) (3,034)
16,949 16,226
Plant & equipment – at cost 107,501 105,141
Accumulated depreciation (16,995) (10,519)
90,506 94,622
Plant & equipment under lease 579 579
Accumulated depreciation (382) (319)
197 260
Total Property, Plant & Equipment - at Cost 128,800 124,980
Accumulated Depreciation (21,148) (13,872)
Total 107,652 111,108
Assets Pledged as Security
The property, plant and equipment are assets over which a mortgage has been granted as security
over loans. The terms of the mortgage preclude the assets from being sold or being used as security
for further mortgages without the permission of the existing mortgagor.
Assets under lease are pledged as security for the associated lease liabilities.
Movement in the carrying amounts for each class of property, plant and equipment between the
beginning and the end of the current period:
Property
Written down value at the beginning of the period 16,226 17,665
- Additions 1,460 11
- Depreciation expense (737) (1,450)
Written down value at the end of the half year 16,949 16,226
Plant & Equipment
Written down value at the beginning of the period 94,622 63,749
- Additions 2,360 36,678
- Depreciation expense (6,476) (5,805)
Written down value at the end of the half year 90,506 94,622
Plant & Equipment under Lease
Written down value at the beginning of the period 260 299
- Additions - 24
- Depreciation expense (63) (63)
Written down value at the end of the half year 197 260
Note 7: Intangible Assets
Capitalised patents and trademarks - at cost 506 506

Western Areas NL & Controlled Entities ABN 68 091 049 357
15
NOTES TO AND FORMING PART OF THE FINANCIAL STATEMENTS
For The Six Months Ended 31 December 2010
Consolidated Entity
31 Dec 2010
$’000
30 Jun 2010
$’000
Note 8: Exploration & Evaluation
Exploration & Evaluation Expenditure
- At cost 119,412 110,044
- Transferred to mine development (21,000) -
- Impairment loss write off (16,175) (15,149)
Total Exploration and Evaluation 82,237 94,895
Movement in carrying amount:
Movement in the carrying amounts for exploration and evaluation expenditure between the
beginning and the end of the current interim period:
Exploration & Evaluation Expenditure
Written down value at the beginning of the period 94,895 80,059
- Expenditure incurred during the period 9,368 15,048
- Transferred to mine development (21,000) -
- Impairment loss (1,026) (212)
Written down value at the end of the period 82,237 94,895
Carry Forward Exploration & Evaluation Expenditure
The recovery of the costs of exploration and evaluation expenditure carried forward is
dependent upon the discovery of commercially viable mineral and other natural resource
deposits and their development and exploration or alternatively their sale.
Note 9: Mine Development
Development Expenditure
- Mine development 138,115 124,296
- Exploration transferred to mine development 21,000 -
- Deferred mining expenditure 145,170 125,172
- Capitalised restoration costs 4,307 4,307
- Capitalised interest 11,175 11,175
- Accumulated amortisation (115,980) (84,547)
Total Mine Development 203,787 180,403
Movement in carrying amount:
Movement in the carrying amounts for mine development expenditure between the beginning
and the end of the current interim period:

Western Areas NL & Controlled Entities ABN 68 091 049 357
16
NOTES TO AND FORMING PART OF THE FINANCIAL STATEMENTS
For The Six Months Ended 31 December 2010
Note 9: Mine Development (Cont)
Consolidated Entity
31 Dec 2010
$’000
30 Jun 2010
$’000
Development Expenditure
Written down value at the beginning of the period 180,403 141,511
- Additions 33,817 72,965
- Exploration expenditure transferred to mine development 21,000 -
- Increase in restoration cost provision - -
- Capitalised interest - 443
- Amortisation charge for the period (31,433) (34,516)
Written down value at the end of the period 203,787 180,403
Note 10: Borrowings
Current
Lease liability 83 83
83 83
Non-Current
Corporate loan facility borrowing cost (506) (720)
Convertible bonds 305,553 304,527
Convertible bond borrowing costs (9,974) (8,495)
Lease liability 28 58
295,101 295,370
The carrying values of assests secured under the corporate loan facility are as follows:
Mine development - $203.8M (2009: $180.4M)
Property, plant & equipment - $107.5M (2009: $110.9M)
(a) The lease liability is secured over the assets under the lease. The finance leases have an
average term of 4 years and an average implicit discount rate of 7.38%. Refer to note
6 for the carrying value of the assets under lease.

Western Areas NL & Controlled Entities ABN 68 091 049 357
17
NOTES TO AND FORMING PART OF THE FINANCIAL STATEMENTS
For The Six Months Ended 31 December 2010
Note 11: Subsequent Events
There are no events or circumstances that have arisen since the end of the six months that have significantly affected or may significantly affect the operation of
the Consolidated Entity, the results of those operations, or the state of affairs of the Consolidated Entity in the subsequent financial years.
Note 12: Statement of Operations by Segments
Identification of reportable segment
The group identifies its operating segments based on the internal reports that are reviewed and used by the board of directors (chief operating decision makers) in
assessing performance and determining the allocation of resources.
The Group operates primarily in nickel mining and exploration in Australia and exploration in Finland. The financial information in relation to the operations in
Finland is not reported separately to the chief operating decision maker and as a result, the financial information presented in the income statements and balance
sheet is the same as that presented to chief operating decision maker.
Basis of accounting for purposes of reporting by operating segments
Accounting policies adopted
Unless stated otherwise, all amounts reported to the Board of Directors as the chief operating decision maker is in accordance with accounting policies that are
consistent to those adopted in the annual financial statements of the Group.
Note 13: Contributed Equity
a) Issued capital
31 Dec 2010
$’000
30 June 2010
$’000
Ordinary shares fully paid 202,611 202,611
b) Movements in issued capital
31 December 2010
Number of
Shares
$’000
Balance at beginning of the financial period 179,735,899 202,611
- Issued via option conversions - -
- Transaction cost relating to share issue - -
Balance at end of the financial period 179,735,899 202,611
30 June 2010
Number of
Shares
$’000
Balance at beginning of the financial year 178,826,649 198,892
- Issued via option conversions 909,250 3,773
- Transaction cost relating to share issue - (54)
Balance at end of the financial year 179,735,899 202,611
Western Areas NL & Controlled Entities ABN 68 091 049 357
18
NOTES TO AND FORMING PART OF THE FINANCIAL STATEMENTS
For The Six Months Ended 31 December 2010
Note 13: Contributed Equity (Cont)
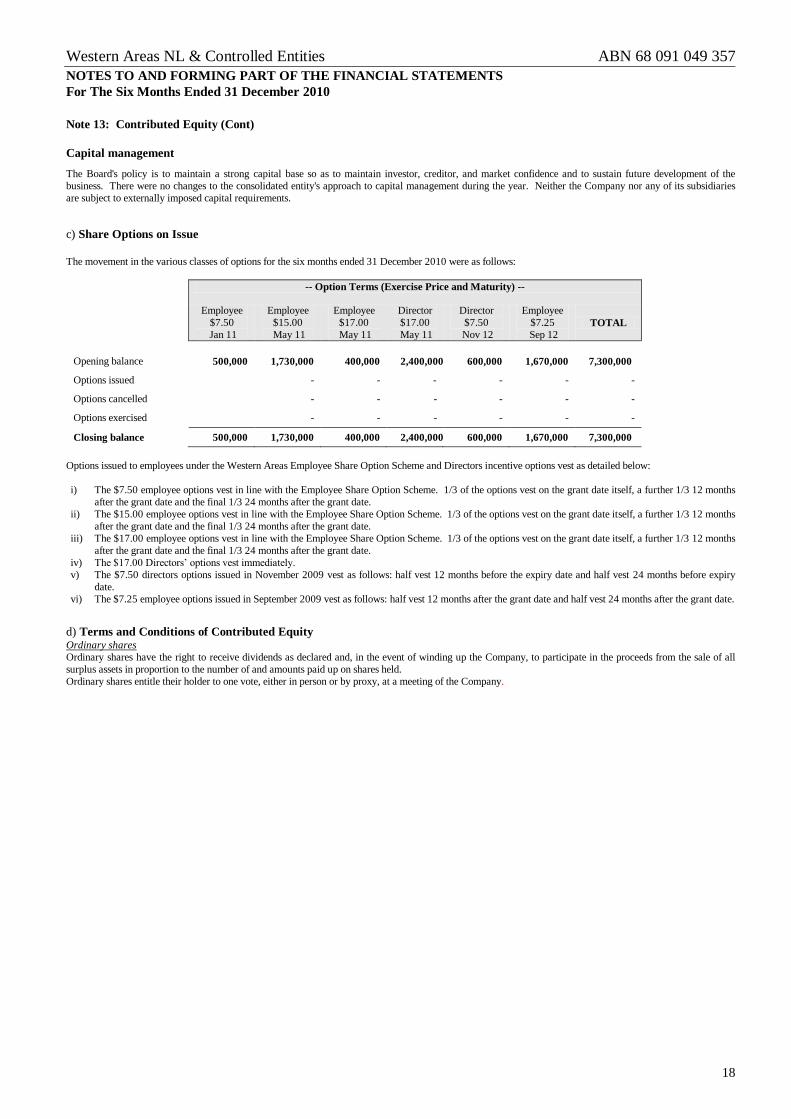
Capital management
The Board's policy is to maintain a strong capital base so as to maintain investor, creditor, and market confidence and to sustain future development of the
business. There were no changes to the consolidated entity's approach to capital management during the year. Neither the Company nor any of its subsidiaries
are subject to externally imposed capital requirements.
c) Share Options on Issue
The movement in the various classes of options for the six months ended 31 December 2010 were as follows:
-- Option Terms (Exercise Price and Maturity) --
Employee
$7.50
Jan 11
Employee
$15.00
May 11
Employee
$17.00
May 11
Director
$17.00
May 11
Director
$7.50
Nov 12
Employee
$7.25
Sep 12 TOTAL
Opening balance 500,000 1,730,000 400,000 2,400,000 600,000 1,670,000 7,300,000
Options issued - - - - - - -
Options cancelled - - - - - - -
Options exercised - - - - - - -
Closing balance 500,000 1,730,000 400,000 2,400,000 600,000 1,670,000 7,300,000
Options issued to employees under the Western Areas Employee Share Option Scheme and Directors incentive options vest as detailed below:
i) The $7.50 employee options vest in line with the Employee Share Option Scheme. 1/3 of the options vest on the grant date itself, a further 1/3 12 months
after the grant date and the final 1/3 24 months after the grant date.
ii) The $15.00 employee options vest in line with the Employee Share Option Scheme. 1/3 of the options vest on the grant date itself, a further 1/3 12 months
after the grant date and the final 1/3 24 months after the grant date.
iii) The $17.00 employee options vest in line with the Employee Share Option Scheme. 1/3 of the options vest on the grant date itself, a further 1/3 12 months
after the grant date and the final 1/3 24 months after the grant date.
iv) The $17.00 Directors’ options vest immediately.
v) The $7.50 directors options issued in November 2009 vest as follows: half vest 12 months before the expiry date and half vest 24 months before expiry
date.
vi) The $7.25 employee options issued in September 2009 vest as follows: half vest 12 months after the grant date and half vest 24 months after the grant date.
d) Terms and Conditions of Contributed Equity Ordinary shares
Ordinary shares have the right to receive dividends as declared and, in the event of winding up the Company, to participate in the proceeds from the sale of all
surplus assets in proportion to the number of and amounts paid up on shares held.
Ordinary shares entitle their holder to one vote, either in person or by proxy, at a meeting of the Company.
Western Areas NL & Controlled Entities ABN 68 091 049 357
19
AUDITORS INDEPENDENCE DECLARATION

Western Areas NL & Controlled Entities ABN 68 091 049 357
20
INDEPENDENT AUDITOR’S REPORT
Western Areas NL & Controlled Entities ABN 68 091 049 357
21
DIRECTORS’ DECLARATION
The directors of the Company declare that:
1) The financial statements and notes, as set out on pages 7 to 18:
(i) give a true and fair view of the economic entity’s financial position as at 31 December 2010 and of its performance
for the half year ended on that date; and
(ii) comply with Accounting Standard AASB 134 “Interim Financial Reporting” and Corporations Regulations 2001;
2) In the directors’ opinion there are reasonable grounds to believe that the Company will be able to pay its debts as and when
they become due and payable.
This declaration is made in accordance with a resolution of the Board of Directors.
On behalf of the Board
Julian Hanna
Director
Dated 14 February 2011