auditing procedures report - michigan · auditing procedures report issued under pa 2 of 1968, as...
TRANSCRIPT
Michigan Department of Treasury496 (02106)
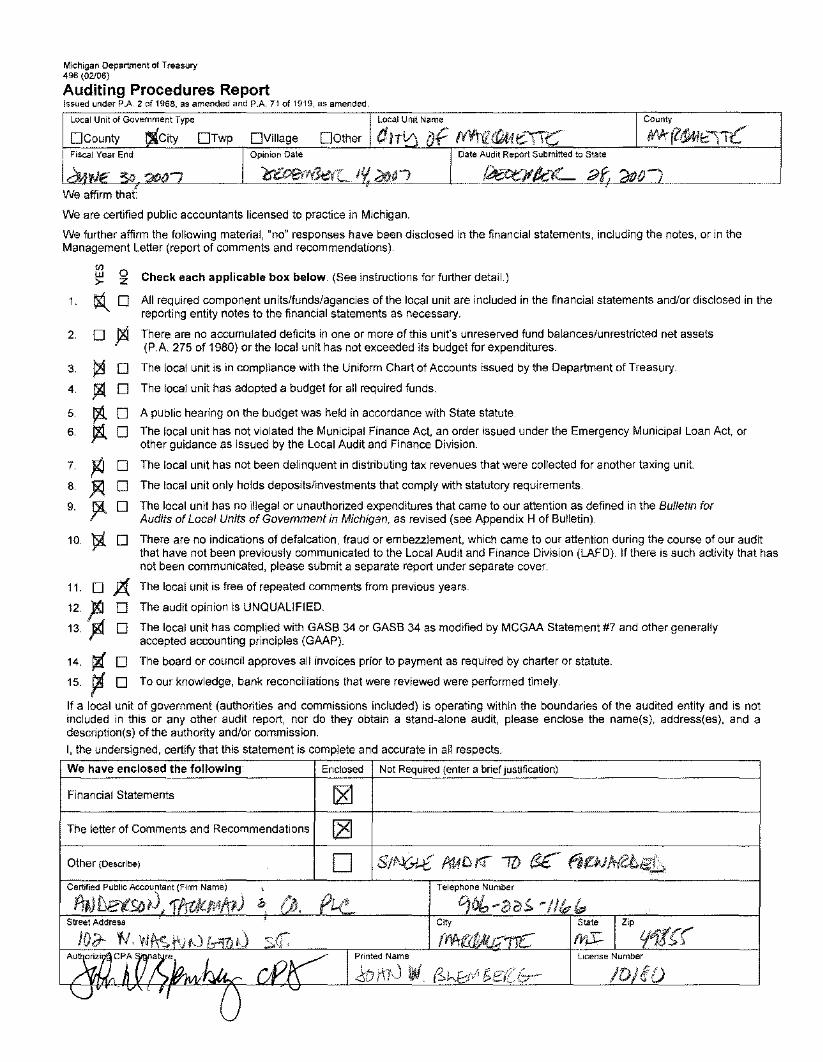
AUditing Procedures ReportIssued under PA 2 of 1968, as amended and PA 71 of 1919, as amended.
County
Date Audit Report Submitted to State
OOtherOpinion Date
City OTwp OViliageOCountyFiscal Year End
Local Unit of Government Type
We affirm that:
We are certified public accountants licensed to practice in Michigan.
We further affirm the following material, "no" responses have been disclosed in the financial statements, including the notes, or in theManagement Letter (report of comments and recommendations).
<J)0UJ
>- z1. ~ 0
2. 0 pg3. P'i 04. }ill 0
5. : 05. 0
7. ~ 08 )ifi 09. 91 0
10. ~ 0
11. 0 J2'{12.
~0
13. 0
14. Il!f 015. ~ 0
Check each applicable box below. (See instructions for further detail.)
All required component units/funds/agencies of the local unit are included in the financial statements and/or disclosed in thereporting entity notes to the financial statements as necessary.
There are no accumulated deficits in one or more of this unit's unreserved fund balances/unrestricted net assets(P.A. 275 of 1980) or the local unit has not exceeded its budget for expenditures.
The local unit is in compliance with the Uniform Chart of Accounts issued by the Department of Treasury.
The local unit has adopted a bUdget for all required funds.
A public hearing on the budget was heid in accordance with State statute.
The local unit has not violated the Municipal Finance Act, an order issued under the Emergency Municipal Loan Act, orother guidance as issued by the Local Audit and Finance Division.
The local unit has not been delinquent in distributing tax revenues that were collected for another taxing unit.
The local unit only holds deposits/investments that comply with statutory reqUirements.
The local unit has no illegal or unauthorized expenditures that came to our attention as defined in the Bulletin forAudits ofLocal Units of Government in Michigan, as revised (see Appendix H of Bulletin).
There are no indications of defalcation, fraud or embezzlement, which came to our attention during the course of our auditthat have not been previously communicated to the Local Audit and Finance Division (LAFD). If there is such activity that hasnot been communicated, please submit a separate report under separate cover.
The local unit is free of repeated comments from previous years.
The audit opinion is UNQUALIFIED.
The local unit has complied with GASB 34 or GASB 34 as modified by MCGAA Statement #7 and other generallyaccepted accounting principles (GAAP).
The board or council approves all invoices prior to payment as required by charter or statute.
To our knowledge, bank reconciliations that were reviewed were performed timely.
If a local unit of government (authorities and commissions included) is operating Within the boundaries of the audited entity and is notincluded in this or any other audit report, nor do they obtain a stand-alone audit, please enclose the name(s), address(es), and adescription(s) of the authority and/or commission.
I, the undersigned, certify that this statement is complete and accurate in all respects.
We have enclosed the following: Enclosed Not Required (enter a brief justification)
Financial Statements
The letter of Comments and Recommendations
License Number
Telephone Number
City
s/~DCertified Public Accountant (Firm Name)
1W!let'SbIJ r,;
Street Address
Other (Describe)

1
City of Marquette, Michigan Comprehensive Annual Financial Report
Fiscal Year Ended June 30, 2007

2
City of Marquette, Michigan
Comprehensive Annual Financial Statement
Fiscal Year Ended June 30, 2007
City Commission Tom Tourville, Mayor
Mike Coyne Joseph Lavey Beth Linna
John DePetro Don Potvin John Kivela
City Manager Judy Akkala
Prepared By
Finance and Accounting Department
Finance Director Gary Simpson
3
City of Marquette Comprehensive Annual Financial Report
Fiscal Year Ended June 30, 2007
INTRODUCTORY SECTION
Table of Contents.............................................................................................................................3 Transmittal Letter ..........................................................................................................................10 Certificate of Achievement for Excellence in Financial Reporting...............................................16 Organizational Chart......................................................................................................................17 Administrative Staff.......................................................................................................................18
FINANCIAL SECTION Independent Auditors’ Report .......................................................................................................19 Management’s Discussion and Analysis .......................................................................................21 SECTION 1 – BASIC FINANCIAL STATEMENTS:
Government-wide Financial Statements: Statement of Net Assets .......................................................................................................32
Statement of Activities .........................................................................................................33 Fund Financial Statements: Governmental Funds Balance Sheet ....................................................................................34
Reconciliation of the Balance Sheet of Governmental Funds to the Statement of Net Assets ............................................................................................35
Governmental Funds Statement of Revenues, Expenditures and Changes in Fund Balance....................................................................................................36
Reconciliation of the Statement of Revenues, Expenditures and Changes in Fund Balances of Governmental Funds to the Statement of Activities .............................37
Continued --

4
General Fund Statement of Revenues, Expenditures and Changes in Fund Balance – Budgetary Comparison Schedule ............................................................ 38 Major Special Revenue Funds Statement of Revenues, Expenditures and Changes in Fund Balance – Budget Comparison Schedule............................................... 39
Proprietary Funds Statement of Net Assets ......................................................................... 40
Proprietary Funds Statement of Revenues, Expenses and Changes in Net Assets.............. 41 Proprietary Funds Statement of Cash Flows ....................................................................... 42 Fiduciary Funds Statement of Fiduciary Net Assets ........................................................... 43 Fiduciary Funds Statement of Changes in Fiduciary Net Assets ........................................ 44 Component Units Combining Statement of Net Assets....................................................... 45 Component Units Combining Statement of Activities ........................................................ 46
Notes to Financial Statements .................................................................................................. 47 SECTION 2 – REQUIRED SUPPLEMENTARY INFORMATION: Municipal Employees Retirement System of Michigan:
Defined Benefit Pension Plan Analysis of Funding Information ........................................ 89 Fire-Police Retirement System:
Analysis of Funding Information......................................................................................... 90 Marquette Board of Light and Power:
Municipal Employees Retirement System of Michigan: Defined Benefit Pension Plan Analysis of Funding Information...................................... 91
SECTION 3 – MAJOR GOVERNMENTAL FUNDS: General Fund:
Comparative Balance Sheet ................................................................................................. 93 Statement of Revenues, Expenditures and Changes in
Fund Balance – Budget and Actual ..................................................................................... 94 Major Street and Trunkline Fund:
Comparative Balance Sheet ............................................................................................... 101 Statement of Revenues, Expenditures and Changes in
Fund Balance – Budget and Actual ................................................................................... 102
Continued --

Local Street Fund: Comparative Balance Sheet ...............................................................................................103
Statement of Revenues, Expenditures and Changes in Fund Balance – Budget and Actual....................................................................................104
Construction Fund:
Comparative Balance Sheet ...............................................................................................105 Statement of Revenues, Expenditures and Changes in Fund Balance – Budget and Actual ..............................................................................................................106
Forestland – Debt Service Fund: Comparative Balance Sheet ...............................................................................................107 Statement of Revenues, Expenditures and Changes in Fund Balance – Budget and Actual...............................................................................................................108 SECTION 4 – NONMAJOR GOVERNMENTAL FUNDS:
Non-major Governmental Funds: Combining Balance Sheet ..................................................................................................111 Combining Statement of Revenues, Expenditures and Changes in Fund Balance ............112
Non-major Special Revenue Funds:
Combining Balance Sheet ..................................................................................................113 Combining Statement of Revenues, Expenditures and Changes in Fund Balance ............114
Environmental Protection Fund:
Comparative Balance Sheet .............................................................................................115 Statement of Revenues, Expenditures and Changes in Fund Balance –
Budget and Actual............................................................................................................116
Criminal Justice Training Fund: Comparative Balance Sheet .............................................................................................117 Statement of Revenues, Expenditures and Changes in Fund Balance –
Budget and Actual............................................................................................................118 MSHDA Downtown Rental Fund:
Comparative Balance Sheet .............................................................................................119 Statement of Revenues, Expenditures and Changes in Fund Balance –
Budget and Actual............................................................................................................120
MSHDA Homeowner Repair Fund: Comparative Balance Sheet .............................................................................................121 Statement of Revenues, Expenditures and Changes in Fund Balance –
Budget and Actual............................................................................................................122
Continued --
5

Lakeview Arena Fund: Comparative Balance Sheet .............................................................................................123 Statement of Revenues, Expenditures and Changes in Fund Balance –
Budget and Actual............................................................................................................124 Non-major Debt Service Funds:
Combining Balance Sheet ..................................................................................................125 Combining Statement of Revenues, Expenditures and Changes in Fund Balance ............126
1998 Building Authority Municipal Service Center – Debt Service Fund:
Statement of Revenues, Expenditures and Changes in Fund Balance – Budget and Actual............................................................................................................127
1998 Building Authority Lakeview Arena – Debt Service Fund: Statement of Revenues, Expenditures and Changes in Fund Balance –
Budget and Actual............................................................................................................128
2003 Founders Landing – Debt Service Fund: Statement of Revenues, Expenditures and Changes in Fund Balance – Budget and Actual............................................................................................................129
2004 Spring Street – Debt Service Fund: Statement of Revenues, Expenditures and Changes in Fund Balance – Budget and Actual............................................................................................................130 Cemetery Fund – Permanent Fund:
Comparative Balance Sheet ............................................................................................131 Statement of Revenues, Expenditures and Changes in Fund Balance – Budget and Actual ...........................................................................................................132
SECTION 5 – ENTERPRISE FUNDS:
Non-major Enterprise Funds: Combining Statement of Net Assets ..................................................................................134 Combining Statement of Revenues, Expenses and Changes in Net Assets .......................135 Combining Statement of Cash Flows.................................................................................136 Marina Fund: Comparative Statement of Net Assets..............................................................................137 Statement of Revenues, Expenses and Changes in Net Assets – Budget and Actual ............................................................................................................138 Intermodal Transportation Terminal Fund: Comparative Statement of Net Assets..............................................................................139 Statement of Revenues, Expenses and Changes in Net Assets – Budget and Actual ............................................................................................................140
Continued --
6

Major Enterprise Funds: Water Supply and Sewage Disposal Fund:
Comparative Statement of Net Assets..............................................................................141 Statement of Revenues, Expenses and Changes in Net Assets – Budget and Actual ............................................................................................................142
Stormwater Utility Fund:
Comparative Statement of Net Assets..............................................................................144 Statement of Revenues, Expenses and Changes in Net Assets – Budget and Actual ............................................................................................................145
SECTION 6 – INTERNAL SERVICE FUNDS:
Combining Statement of Net Assets .......................................................................................147 Combining Statement of Revenues, Expenses and Changes in Net Assets............................148 Combining Statement of Cash Flows......................................................................................149
Motor Vehicle Equipment Fund:
Comparative Statement of Net Assets................................................................................150 Statement of Revenues, Expenses and Changes in Net Assets – Budget and Actual ........151
Municipal Service Center Fund:
Comparative Statement of Net Assets................................................................................152 Statement of Revenues, Expenses and Changes in Net Assets – Budget and Actual ........153
SECTION 7 - FIDUCIARY FUNDS:
Special Activities Private-Purpose Trust Fund: Comparative Statement of Fiduciary Net Assets ...............................................................155
Fire-Police Retirement System Pension Trust Fund:
Comparative Statement of Plan Net Assets........................................................................156 Agency Fund:
Comparative Balance Sheet ...............................................................................................157 Statement of Changes in Assets and Liabilities .................................................................158
SECTION 8 – CAPITAL ASSET SCHEDULES:
Schedule of Capital Assets Used in the Operation of Governmental Funds – By Source ..........................................................................................160 Schedule of Capital Assets Used in the Operation of Governmental Funds – By Function and Activity ..................................................................161 Schedule of Changes in Capital Assets Used in the Operation of Governmental Funds – By Function and Activity ..................................................................162
Continued --
7

SECTION 9 – LONG-TERM DEBT SCHEDULES: Schedule of Bonds, Notes Payable, and Capitalized Lease Obligations Payable – Enterprise Funds....................................................................................................164 Notes to Schedule of Bonds, Notes Payable, and Capitalized Lease Obligations Payable – Enterprise Funds....................................................................................................165 Schedule of Bonds Payable – Component Unit – Board of Light and Power, Electric Utility Fund...............................................................................................................166
SECTION 10 – COMPONENT UNITS:
Board of Light and Power Electric Utility: Comparative Statement of Net Assets................................................................................168 Statement of Revenues, Expenses and Changes in Net Assets ..........................................169 Statement of Cash Flows....................................................................................................170
Peter White Public Library: Statement of Net Assets .....................................................................................................171 Statement of Activities .......................................................................................................172 Governmental Funds Balance Sheet ..................................................................................173 Reconciliation of the Governmental Funds Balance Sheet to the Statement of Net Assets ...................................................................................................174 Governmental Funds Statement of Revenues, Expenditures and Changes in Fund Balance.................................................................................................175 Reconciliation of the Statement of Revenues, Expenditures and Changes in Fund Balances of Governmental Funds to the Statement of Activities ...........................176
Non-major Component Units:
Combining Statement of Net Assets ..................................................................................177 Combining Statement of Activities ....................................................................................178
Downtown Development Authority:
Statement of Net Assets .....................................................................................................179 Statement of Activities .......................................................................................................180
Governmental Funds Balance Sheet ..................................................................................181 Reconciliation of the Governmental Funds Balance Sheet to the Statement of Net Assets ...................................................................................................182 Governmental Funds Statement of Revenues, Expenditures and Changes in Fund Balance.................................................................................................183 Reconciliation of the Statement of Revenues, Expenditures and Changes in
Fund Balances of Governmental Funds to the Statement of Activities ...........................184
Marquette Housing Commission: Statement of Net Assets .....................................................................................................185
Statement of Activities .......................................................................................................186 Statement of Revenues, Expenses and Changes in Net Assets ..........................................187
Statement of Cash Flows....................................................................................................188
Continued --
8

9
STATISTICAL SECTION
SECTION 11 – STATISTICAL INFORMATION:
Net Assets by Component – Table 1.......................................................................................190
Changes in Net Assets – Table 2.............................................................................................191
Fund Balances, Governmental Funds – Table 3 .....................................................................193 Changes in Fund Balances, Governmental Funds – Table 4 ..................................................194
General Governmental Expenditures by Functions – Table 5 ................................................195
General Revenues by Sources – Table 6.................................................................................196
Assessed Value and Actual Value of Taxable Property – Table 7 .........................................197
Direct and Overlapping Property Tax Rates – Table 8 ..........................................................198
Principal Property Tax Payers – Table 9 ................................................................................199
Property Tax Levies and Collections – Table 10....................................................................200 Ratios of Outstanding Debt by Type – Table 11.....................................................................201
Ratios of General Bonded Debt Outstanding – Table 12........................................................202
Direct and Overlapping Governmental Activities Debt – Table 13........................................203
Legal Debt Margin Information – Table 14...........................................................................204
Pledged-Revenue Coverage – Table 15 ..................................................................................205
Demographic & Economic Statistics – Table 16 ....................................................................207
Principal Employers – Table 17..............................................................................................208 Full-Time Equivalent City Government Employees by Function/Program – Table 18 .........208 Operating Indicators by Function/Program – Table 19...........................................................210 Capital Assets Statistics by Function/Program – Table 20 .....................................................211


12
plenty of both summer and winter recreational activities. This past summer saw the continuation of Cruise Ships visiting the City as a regular stop on tours of the Great Lakes which will provide even greater opportunities to pump more money into the local economy. Also, through its Downtown Development Authority, the City continues to work with the downtown merchants and provide opportunities for attracting more visitors to Marquette’s downtown shopping district. Current projects include adding a linear park with an out-door ice skating rink in the downtown area and to continue to strongly support the festivals which bring in several thousands of visitors to the City each year. Marquette continues to provide a quality of life that is difficult to match anywhere in the country. Our leadership continues to guide the future of Marquette with a proactive, visionary approach and an appreciation for cooperation and teamwork. Nearly 160 community volunteers serve on the City’s 24 boards, committees, and commissions. The City will prosper and continue to be a “Superior Location” with open government leadership, a strong education system, an active business community and spirited citizen involvement. The major theme which guided projects and initiatives for FY 2007 was:
• Infrastructure Repairs, Replacements and Improvements
In accordance with this theme, the following was accomplished in FY 2007:
Stormwater Drainage Improvements - $206,508 Water/Sewer System Improvements – $3,793,971 Street/Road Reconstruction - $2,224,825
Key components of the City Commission Strategic Plan for FY 2007 were:
⇒ Develop our Master Plan to incorporate our vision concepts. ⇒ Maintain our leadership role in infrastructure development and improvements. ⇒ Continue to foster regionalism. #1) Develop our Master Plan to incorporate our vision concepts.
Develop a vision using the vision concepts collected from area residents, boards, committees, and commissions.
Other issues to be addressed are: Street Projects, Founders Landing Development, Iron Bay Business Park, Shoreline Erosion, Trail System (motorized and non motorized), and Pilings Re-use.
#2) Maintain our leadership role in infrastructure development and improvements. Undertake major and local street reconstruction projects. Work toward having overhead utilities converted to underground. Upgrade of the Wastewater Treatment Plant. Evaluate clearing the median of utilities, signs, and trees during major street
FY 2007 INITIATIVES
PLANNING FOR THE FUTURE

13
reconstruction and renovation projects. Conduct an over all evaluation of park facilities and uses for best utilization.
#3) Continue to foster regionalism.
Partner with others to complete a demographic assessment. Continue to address senior and recreation issues from a regional perspective.
Plans beyond FY 2007 will continue to emphasize the major themes of aggressive infrastructure improvement, technology enhancement, and maintenance of currently operating facilities with an even stronger emphasis on the waterfront and downtown areas.
Risk Management – The objective of risk management is to provide maximum quality protection to the City’s assets, employees and the public at the lowest possible cost. Various risk control techniques, including employee accident prevention training, have been implemented to minimize accident-related losses. The City is constantly evaluating its risk management practices seeking to improve its safety and loss control functions, insurance placement, and financing practices. As of July 1, 1997 the City of Marquette initiated a comprehensive risk management program with the Michigan Municipal Liability & Property Pool for general liability, public official’s errors and omissions, police professional liability, personal injury and broadcaster liability, and automotive liability insurance. The Michigan Municipal Liability Workmen’s Compensation Pool is used for employee injury claims. Both of these are risk sharing pools whereby member premiums are used to pay member claims in excess of deductibles and to purchase commercial excess insurance coverage. Cash Management – Pursuant to the cash management policy of the City, cash temporarily idle during the year was invested in those investments authorized by law and included certificates of deposit, demand savings accounts, and securities sold by the United States government or its agencies and State approved municipal trust funds. The City invests all funds’ cash, with maturities planned to coincide with cash needs utilizing the pooled cash concept whenever possible. Any cash available for longer term investing is reviewed by the Investment Advisory Board which meets quarterly. The Board of Light and Power Electric Utility Fund has separate cash management and investing practices apart from all other City funds. The operations of the Light and Power Utility are administered by an elected Board. The City of Marquette’s investment policy is to minimize credit and market risks while maintaining a competitive yield on its portfolio. Detailed information is presented in Footnote B, which classifies levels of risk for deposits and investments. Pension Benefits – The City provides retirement benefits to its employees through one of three different plans. The Pension Funded Ratio (PFR) of the Actuarial Accrued Liability measures the progress of the systems in accumulating benefits when due.
OTHER FINANCIAL INFORMATION

14
Qualified employees of the Fire and Police Departments are included in a single-employer public employee retirement system under the guidelines of Public Act 345 and is accounted for as a Pension Trust Fund. As of December 31, 2006, this plan had a PFR of 97%, down from the December 31, 2005 PFR of 100%. Qualified Senior and Middle Management employees are included in a defined contribution plan. This plan had no unfunded liabilities as of December 31, 2006. All other qualified employees are included in an agent multiple-employer public employee retirement system that acts as a common investment and administrative agent for all Michigan municipal employees. As of December 31, 2006, this plan had a PFR of 74%, down from the PFR of 77% of December 31, 2005.
Independent Audit – The City Charter requires an annual audit of the accounts, financial records, and transactions of all administrative departments of the City by an independent certified public accountant selected by the City Commission. This requirement has been completed and the independent auditor’s report has been included in this report. Awards – The Government Finance Officers Association of the United States and Canada (GFOA) awarded a Certificate of Achievement for Excellence in Financial Reporting to the City of Marquette, Michigan for its comprehensive annual financial report for the fiscal year ended June 30, 2005. This is the 20th consecutive year that the City has achieved this prestigious award. In order to be awarded a Certificate of Achievement, a government must publish an easily readable and efficiently organized comprehensive annual financial report. This report must satisfy both generally accepted accounting principles and applicable legal requirements. A Certificate of Achievement is valid for a period of one year only. We believe our current comprehensive annual financial report continues to meet the Certificate of Achievement Program’s requirements and we are submitting it to the GFOA to determine its eligibility for another certificate. Other awards recently presented to the City include: All American City designation for Marquette County, Cool City designation from the Governor, Governor’s Council on Physical Fitness, Health and Sports for Level 3 Promoting Active Communities, Tree City USA from the National Arbor Day Foundation for the past twenty-one consecutive years, Excellence in Storage from the Salt Institute for the last ten consecutive years, USEPA Region 5 Award of Excellence to the Marquette Area Wastewater Treatment Facility in 1996 and 2001, Eminent Conceptor Award and Grand Award from American Consulting Engineers Council for Excellence in Engineering for the Water Filtration Plant in 1998, Honor Award from American Academy of Environmental Engineers for Excellence in Engineering for the Water Filtration Plant in 1998, Public Awareness Award from Michigan Section AWWA in 1998, One of the best places to live and bike from Bike Magazine, named among The 100 Best Small Art Towns in America, and the Governor’s Award for the Arts and Culture Center in 2004.
OTHER INFORMATION


17
City of Marquette Organizational Chart
City Attorney
Information Systems
Assessing and Zoning
Human Resources and Utility Billing
Finance, Treasury, Accounting, Purchasing
City Clerk & Planner
Administrative Services
Harbor Master
Crossing Guards
Animal Control
Police and Parking Violataions
Fire and Inspections
Public Protection
Senior & Handicapped Services
Recreation Services
Marina
Arena
Cemetery
Parks & Recreation
Facility MaintenanceWater Distribution
and Sewers
Streets
Water & Wastewater
Engineering
Motor Vehicle Equipment
Sanitation
Public Works
City Manager
City Commission Boards & Commission
Citizens

18
CITY OF MARQUETTE, MICHIGAN ADMINISTRATIVE STAFF
City Manager
Judy Akkala
Assistant City Manager
Karl Zueger
City Attorney
Ron Keefe
Finance Director
Gary Simpson
City Assessor
Sue Maki
City Clerk
Dave Bleau
City Engineer
Keith Whittington
Assistant City Engineer Gregory Borzick
City Treasurer
Diane Giddens
Information Services Director
Alan Hawker
Police Chief
Philip Siegert
Fire Chief
Thomas Belt
Library Director
Pamela Christensen
Light and Power Utility Director
Kirby Juntila
Superintendent of Public Works
Scott Cambensy
Superintendent of Water and Wastewater
Curt Goodman
Human Resources Manager Susan Bohor
Arts and Center Coordinator Nikke Nason
City Planner/Zoning Administrator Dennis Stanchewicz
Parks and Recreation Director Hugh Leslie


20
Commission and the City Manager of the City of Marquette, Michigan In accordance with Government Auditing Standards, we have also issued our report dated December 14, 2007, on our consideration of the City of Marquette, Michigan’s internal control over financial reporting and our tests of its compliance with certain provision of laws, regulations, contracts and grant agreements and other matters. The purpose of that report is to describe the scope of our testing of internal control over financial reporting and compliance and the results of that testing, and not to provide an opinion on the internal control over financial reporting or on compliance. That report is an integral part of an audit performed in accordance with Government Auditing Standards and important for assessing the results of our audit. The management’s discussion and analysis and budgetary comparison information on pages 21 through 30 and pages 38 through 39, are not a required part of the basic financial statements but are supplementary information required by the accounting principles generally accepted in the United States of America. We have applied certain limited procedures, which consisted principally of inquiries of management regarding the methods of measurement and presentation of the required supplementary information. However, we did not audit the information and express no opinion on it. Our audit was conducted for the purpose of forming opinions on the financial statements that collectively comprise the City of Marquette, Michigan’s basic financial statements. The introductory section, combining and individual nonmajor fund financial statements, and statistical section are presented for the purposes of additional analysis and are not a required part of the basic financial statements. The combining and individual nonmajor fund financial statements have been subjected to the auditing procedures applied in the audit of the basic financial statements and, in our opinion, based on our audit and the report of the other auditors, are fairly stated in all material respects in relation to the basic financial statements taken as a whole. The introductory and statistical sections have not been subjected to the auditing procedures applied in the audit of the basic financial statements and, accordingly, we express no opinion on them. Anderson, Tackman & Company, PLC Certified Public Accountants December 14, 2007

21
City of Marquette, Michigan
MANAGEMENT’S DISCUSSION AND ANALYSIS (UNAUDITED)
Our discussion and analysis of the City of Marquette’s financial performance provides an overview of the City’s financial activities for the year ended June 30, 2007. Please read it in conjunction with the financial Statements, which begin on page 32. FINANCIAL HIGHLIGHTS
• Net assets for the City as a whole decreased by $(185,180) as a result of this year’s operations.
Net assets of our business-type activities decreased by $(3,001,125) or (7.59)%, and net assets of our governmental activities increased by $2,815,945, or 6.94%.
• During the year, the City had expenses for governmental activities that were $11,947,377 more than the $7,283,711 generated in program revenues and other program sources.
• The City’s business-type activities had expenses that were $1,528,011 more than the $7,229,848 generated in revenues and other sources.
• The general fund reported a net change in fund balance of $2,209,574. This is $2,538,057 higher than the forecasted decrease of $(328,483).
USING THIS ANNUAL REPORT This annual report consists of a series of financial Statements. The Statement of Net Assets and the Statement of Activities (on pages 32 and 33) provide information about the activities of the City as a whole and present a longer-term view of the City’s finances. Fund financial Statements start on page 34. For governmental activities, these Statements tell how these services were financed in the short term as well as what remains for the future spending. Fund financial Statements also report the City’s operations in more detail than the government-wide Statements by providing information about the City’s most significant funds. The remaining Statements provide financial information about activities for which the City acts solely as a trustee or agent for the benefit of those outside the government. Reporting the City as a Whole Our analysis of the City as a whole begins on page 23. One of the most important questions asked about the City’s finances is “Is the City as a whole better off or worse off as a result of the year’s activities?” The Statement of Net Assets and the Statement of Activities report information about the City as a whole and about its activities in a way that helps answer this question. These Statements include all assets and liabilities using the accrual basis of accounting, which is similar to the accounting used by most private-sector companies. All of the current year’s revenues and expenses are taken into account regardless of when cash is received or paid. These two Statements report the City’s net assets and changes in them. You can think of the City’s net assets - the difference between assets and liabilities - as one way to measure the City’s financial health, or financial position. Over time, increases or decreases in the City’s net assets are one indicator of whether its financial health is improving or deteriorating. You will need to consider other non-financial factors, however, such as changes in the City’s patron base and the condition of the City’s capital assets, to assess the overall financial health of the City. In the Statement of Net Assets and the Statement of Activities, we divide the City into three kinds of activities:
• Governmental activities – Most of the City’s basic services are reported here, including the police, fire, public works and parks departments, and general administration. Property taxes, charges for

22
services and State sources fund most of these activities. MANAGEMENT’S DISCUSSION AND ANALYSIS (UNAUDITED) (Continued)
• Business-type activities – The City charges a fee to customers to help it cover all or most of the cost
of certain services it provides. The City’s water and sewer system, stormwater, marina and transportation center activities are reported here.
• Component units – The City includes four separate legal entities in its report – the Board of Light and
Power, the Peter White Public Library, the Downtown Development Authority, and the Marquette Housing Commission. Although legally separate, these “component units” are important because the City is financially accountable for them.
Reporting the City’s Most Significant Funds Our analysis of the City’s major funds begins on page 28. The fund financial Statements begin on page 34 and provide detailed information on the most significant funds – not the City as a whole. Some funds are required to be established by State law and by bond covenants. However, the City Commission establishes many other funds to help it control and manage money for particular purposes or to show that it is meeting legal responsibilities for using taxes, grants, and other money. The City’s two kinds of funds - governmental and proprietary - use different accounting approaches.
• Governmental funds – Most of the City’s basic services are reported in governmental funds, which focus on how money flows into and out of those funds and the balances left at year-end that are available for spending. These funds are reported using an accounting method called modified accrual accounting, which measures cash and all other financial assets that can be readily converted into cash. The governmental fund Statements provide a detailed short-term view of the City’s general government operations and the basic services it provides. Governmental fund information helps you determine whether there are more or fewer financial resources that can be spent in the near future to finance the City’s programs. We describe the relationship (or differences) between governmental activities (reported in the Statement of Net Assets and Statement of Activities) and governmental funds in a reconciliation which follows the fund financial Statements.
• Proprietary funds – When the City charges customers for the services it provides – whether to
outside customers or to other units of the City – these services are generally reported in proprietary funds. Proprietary funds are reported in the same way that all activities are reported in the Statement of Net Assets and the Statement of Activities. In fact, the City’s enterprise funds (a component of proprietary funds) are the same as the business-type activities we report in the government-wide Statements but provide more detail and additional information, such as cash flows, for proprietary funds. We use internal service funds (the other component of proprietary funds) to report activities that provide supplies and services for the City’s other programs and activities – such as the Motor Vehicle Equipment Fund.
The City as Trustee The City is the trustee, or fiduciary, for its Fire-Police Retirement System pension plan. It is also responsible for other assets that – because of a trust arrangement – can be used only for the trust beneficiaries. All of the City’s fiduciary activities are reported in separate Statements of Fiduciary Net Assets and Changes in Fiduciary Net Assets on pages 43 and 44. We exclude these activities from the City’s other financial Statements because the City cannot use these assets to finance its operations. The City is responsible for ensuring that the assets reported in these funds are used for their intended purposes.
23
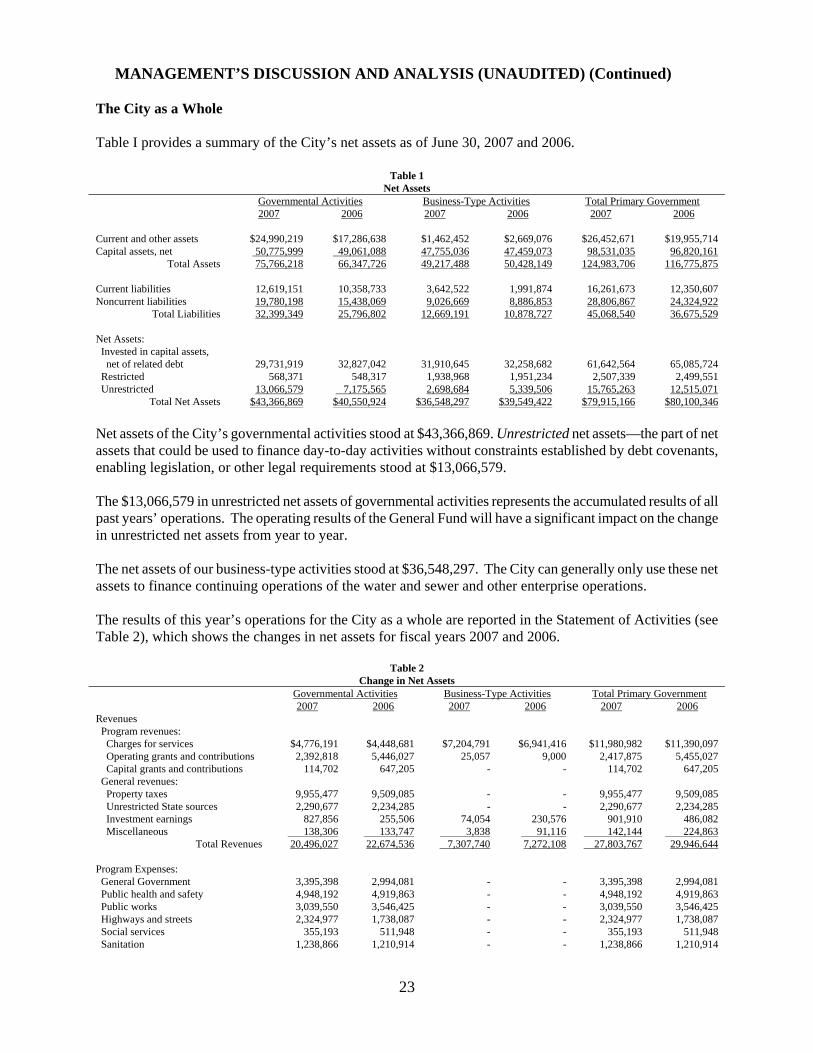
MANAGEMENT’S DISCUSSION AND ANALYSIS (UNAUDITED) (Continued) The City as a Whole Table I provides a summary of the City’s net assets as of June 30, 2007 and 2006.
Table 1 Net Assets
Governmental Activities Business-Type Activities Total Primary Government 2007 2006 2007 2006 2007 2006 Current and other assets
$24,990,219
$17,286,638
$1,462,452
$2,669,076
$26,452,671
$19,955,714
Capital assets, net 50,775,999 49,061,088 47,755,036 47,459,073 98,531,035 96,820,161 Total Assets 75,766,218 66,347,726 49,217,488 50,428,149 124,983,706 116,775,875
Current liabilities 12,619,151 10,358,733 3,642,522 1,991,874 16,261,673 12,350,607 Noncurrent liabilities 19,780,198 15,438,069 9,026,669 8,886,853 28,806,867 24,324,922
Total Liabilities 32,399,349 25,796,802 12,669,191 10,878,727 45,068,540 36,675,529 Net Assets: Invested in capital assets, net of related debt
29,731,919
32,827,042
31,910,645
32,258,682
61,642,564
65,085,724
Restricted 568,371 548,317 1,938,968 1,951,234 2,507,339 2,499,551 Unrestricted 13,066,579 7,175,565 2,698,684 5,339,506 15,765,263 12,515,071
Total Net Assets $43,366,869 $40,550,924 $36,548,297 $39,549,422 $79,915,166 $80,100,346 Net assets of the City’s governmental activities stood at $43,366,869. Unrestricted net assets—the part of net assets that could be used to finance day-to-day activities without constraints established by debt covenants, enabling legislation, or other legal requirements stood at $13,066,579. The $13,066,579 in unrestricted net assets of governmental activities represents the accumulated results of all past years’ operations. The operating results of the General Fund will have a significant impact on the change in unrestricted net assets from year to year. The net assets of our business-type activities stood at $36,548,297. The City can generally only use these net assets to finance continuing operations of the water and sewer and other enterprise operations. The results of this year’s operations for the City as a whole are reported in the Statement of Activities (see Table 2), which shows the changes in net assets for fiscal years 2007 and 2006.
Table 2 Change in Net Assets
Governmental Activities Business-Type Activities Total Primary Government 2007 2006 2007 2006 2007 2006 Revenues Program revenues: Charges for services $4,776,191 $4,448,681 $7,204,791 $6,941,416 $11,980,982 $11,390,097 Operating grants and contributions 2,392,818 5,446,027 25,057 9,000 2,417,875 5,455,027 Capital grants and contributions 114,702 647,205 - - 114,702 647,205 General revenues: Property taxes 9,955,477 9,509,085 - - 9,955,477 9,509,085 Unrestricted State sources 2,290,677 2,234,285 - - 2,290,677 2,234,285 Investment earnings 827,856 255,506 74,054 230,576 901,910 486,082 Miscellaneous 138,306 133,747 3,838 91,116 142,144 224,863
Total Revenues 20,496,027 22,674,536 7,307,740 7,272,108 27,803,767 29,946,644 Program Expenses: General Government 3,395,398 2,994,081 - - 3,395,398 2,994,081 Public health and safety 4,948,192 4,919,863 - - 4,948,192 4,919,863 Public works 3,039,550 3,546,425 - - 3,039,550 3,546,425 Highways and streets 2,324,977 1,738,087 - - 2,324,977 1,738,087 Social services 355,193 511,948 - - 355,193 511,948 Sanitation 1,238,866 1,210,914 - - 1,238,866 1,210,914
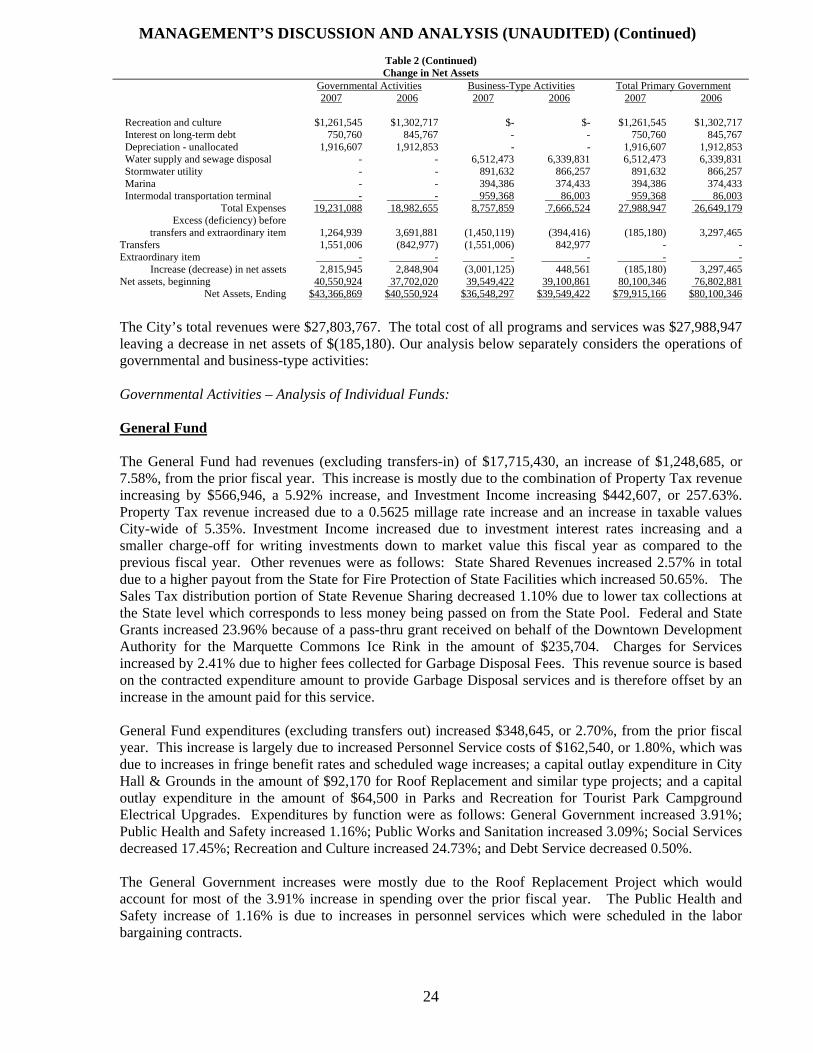
MANAGEMENT’S DISCUSSION AND ANALYSIS (UNAUDITED) (Continued)
Table 2 (Continued) Change in Net Assets
Governmental Activities Business-Type Activities Total Primary Government
2007 2006 2007 2006 2007 2006
Recreation and culture $1,261,545 $1,302,717 $- $- $1,261,545 $1,302,717 Interest on long-term debt 750,760 845,767 - - 750,760 845,767 Depreciation - unallocated 1,916,607 1,912,853 - - 1,916,607 1,912,853 Water supply and sewage disposal - - 6,512,473 6,339,831 6,512,473 6,339,831 Stormwater utility - - 891,632 866,257 891,632 866,257 Marina - - 394,386 374,433 394,386 374,433 Intermodal transportation terminal - - 959,368 86,003 959,368 86,003
Total Expenses 19,231,088 18,982,655 8,757,859 7,666,524 27,988,947 26,649,179
Excess (deficiency) before transfers and extraordinary item
1,264,939
3,691,881
(1,450,119)
(394,416)
(185,180)
3,297,465
Transfers 1,551,006 (842,977) (1,551,006) 842,977 - - Extraordinary item - - - - - -
Increase (decrease) in net assets 2,815,945 2,848,904 (3,001,125) 448,561 (185,180) 3,297,465 Net assets, beginning 40,550,924 37,702,020 39,549,422 39,100,861 80,100,346 76,802,881
Net Assets, Ending $43,366,869 $40,550,924 $36,548,297 $39,549,422 $79,915,166 $80,100,346 The City’s total revenues were $27,803,767. The total cost of all programs and services was $27,988,947 leaving a decrease in net assets of $(185,180). Our analysis below separately considers the operations of governmental and business-type activities: Governmental Activities – Analysis of Individual Funds: General Fund The General Fund had revenues (excluding transfers-in) of $17,715,430, an increase of $1,248,685, or 7.58%, from the prior fiscal year. This increase is mostly due to the combination of Property Tax revenue increasing by $566,946, a 5.92% increase, and Investment Income increasing $442,607, or 257.63%. Property Tax revenue increased due to a 0.5625 millage rate increase and an increase in taxable values City-wide of 5.35%. Investment Income increased due to investment interest rates increasing and a smaller charge-off for writing investments down to market value this fiscal year as compared to the previous fiscal year. Other revenues were as follows: State Shared Revenues increased 2.57% in total due to a higher payout from the State for Fire Protection of State Facilities which increased 50.65%. The Sales Tax distribution portion of State Revenue Sharing decreased 1.10% due to lower tax collections at the State level which corresponds to less money being passed on from the State Pool. Federal and State Grants increased 23.96% because of a pass-thru grant received on behalf of the Downtown Development Authority for the Marquette Commons Ice Rink in the amount of $235,704. Charges for Services increased by 2.41% due to higher fees collected for Garbage Disposal Fees. This revenue source is based on the contracted expenditure amount to provide Garbage Disposal services and is therefore offset by an increase in the amount paid for this service. General Fund expenditures (excluding transfers out) increased $348,645, or 2.70%, from the prior fiscal year. This increase is largely due to increased Personnel Service costs of $162,540, or 1.80%, which was due to increases in fringe benefit rates and scheduled wage increases; a capital outlay expenditure in City Hall & Grounds in the amount of $92,170 for Roof Replacement and similar type projects; and a capital outlay expenditure in the amount of $64,500 in Parks and Recreation for Tourist Park Campground Electrical Upgrades. Expenditures by function were as follows: General Government increased 3.91%; Public Health and Safety increased 1.16%; Public Works and Sanitation increased 3.09%; Social Services decreased 17.45%; Recreation and Culture increased 24.73%; and Debt Service decreased 0.50%. The General Government increases were mostly due to the Roof Replacement Project which would account for most of the 3.91% increase in spending over the prior fiscal year. The Public Health and Safety increase of 1.16% is due to increases in personnel services which were scheduled in the labor bargaining contracts.
24

MANAGEMENT’S DISCUSSION AND ANALYSIS (UNAUDITED) (Continued) The Public Works and Sanitation increase of 3.09% was in large part due to increased utility costs and office rental costs. Social Services decreased 17.45% mostly due to decreases in personnel services. Recreation and Culture increased 24.73% due to the Electrical Upgrades at Tourist Park Campground. Debt Service decreased 0.50% as per the debt service schedule. Net Other Financing Uses decreased 33.09% due to closing out the Intermodal Transportation Fund and decreased Transfers Out of 19.97%. The total Fund Balance increased $2,209,574, or 50.61%, from the previous fiscal year while the unreserved portion of the Fund Balance increased $2,353,801, or 61.00%, mostly due to timing issues with some capital outlay projects that won’t be completed until FY 2008 and the closing of the Intermodal Transportation Fund. Major and Local Street Funds The Major Street Fund had revenues decrease 67.02% and the Local Street Fund had revenues decrease 56.69% from the previous fiscal year. The Major Street Fund decreased due to a jurisdictional transfer with the Michigan Department of Transportation for Washington Street in the previous fiscal year. Excluding this money transfer, the Major Street Fund revenues increased 1.91% due to slight increases in both the funding for State Trunkline Maintenance and the Gas/Weight Tax State Shared Revenue. The Local Street Fund had a decrease due to a Federal Highway Administration grant to help offset some of the repairs necessitated by the 2003 Dead River flood that was received in the previous fiscal year. Excluding this grant, the Local Street Fund had a decrease in revenues of 15.62% due to a decrease in the amount received for Winter Maintenance from the State. All other revenue sources within these two funds remained stable from the previous fiscal year. The Major Street Fund had expenditure increases of 22.17% and the Local Street Fund had expenditures decrease 0.62% from the previous fiscal year. The Major Street increase is attributable to reconstruction of Washington Street. The Local Street decrease is negligible as all expenditure categories remained fairly stable as compared to the previous fiscal year. Net Other Financing Sources increased 53.99% for the Major Street Fund and increased 334.47% for the Local Street Fund. The Major Street Fund increase is due to a lower Transfer-Out to the Construction Fund and the Local Street Fund increase is due to a higher Transfer-In from the General Fund. In the previous fiscal year, the Local Street Fund Transfer-In from the General Fund was reduced due to receiving the Federal Highway Administration grant. These two funds traditionally do not carry a Fund Balance. This fiscal year and in the prior fiscal year, the Major Street Fund shows a Fund Balance to carry over monies received from the State to cover the Washington Street Reconstruction project. It is anticipated this Fund Balance will return to $0 upon completion of the project during the next fiscal year. Lakeview Arena Fund The Lakeview Arena Fund had revenues increase $93,014, or 15.11%, as compared to the previous fiscal year. This increase is due to receiving more revenue ($90,431, or 27.23% more) for ice time. Expenditures in the Lakeview Arena Fund decreased $82,379 or 9.39% from the previous fiscal year. This decrease was due in large part to a decrease in Personnel Services ($80,528, or 20.08%). Other Financing Sources for the Lakeview Arena Fund decreased $175,393, or 67.04% from the previous fiscal year. This is due to the Transfer-In from the General Fund being lower this year as a result of the higher
25

MANAGEMENT’S DISCUSSION AND ANALYSIS (UNAUDITED) (Continued) operational revenues and lower expenditures in the Lakeview Arena Fund. The Fund Balance remained the same at $43,119 from the previous fiscal year. Construction Fund Capital construction projects that have funding sources of more than one City accounting fund are accounted for in this single fund. In prior years, projects with multiple accounting fund sources were accounted for in each particular fund thereby making tracking of these projects a difficult process. For this fiscal year, total project expenditures were $3,436,183 of which $1,693,174 (49.27% of expenditures) was funded by transfers-in from other City funds while the remainder was funded from Bond Proceeds. Major Projects were High Street, Park Street, Founders Landing Development, Washington Street, and Hampton Street. Debt Service Fund The Debt Service Fund is used for the payments on the outstanding bonds for the Municipal Service Center, the Lakeview Arena, Founders Landing Development, Spring Street Reconstruction, Forestland Development, and 2007 Street Improvements. The Municipal Service Center has $3,820,000 in outstanding principal remaining, the Lakeview Arena has $125,000 in outstanding principal remaining, Founders Landing Development has $3,500,000 in outstanding principal remaining, Spring Street Reconstruction has $994,481 in outstanding principal remaining, Forestland Development has $5,135,000 in outstanding principal remaining, and 2007 Street Improvements has $5,475,000 in outstanding principal remaining. Total outstanding principal in this fund is $19,049,481. The Municipal Service Center is funded by charges to various user City departments while the other outstanding bonds are funded by a transfer from the General Fund. Other Governmental Activity Funds The three funds, Environmental Protection; Criminal Justice Training; and Michigan State Housing Development Authority grant (MSHDA) round out the Governmental Activity area. Environmental Protection had no real activity other than to close out the fund. Criminal Justice Training had revenues of $8,012 and expenditures of $8,270 leaving a fund balance of $15,393. MSHDA had combined revenues of $86,027 and combined expenditures of $10,607 leaving a combined fund balance of $45,392. Table 3 presents the cost of each of the six largest programs – General Government, Public Health and Safety, Public Works, Highways and Streets, Sanitation, and Recreation and Culture – as well as each program’s net cost (total cost less revenues generated by the activities). The net cost shows the financial burden that each program placed on the City’s operation.
Table 3 Governmental Activities
Total Cost of Services
Net Cost of Services
General government $3,395,398 $1,819,963Public health and safety 4,948,192 4,638,151Public works 3,039,550 1,748,354Highways and streets 2,324,977 621,974Sanitation 1,238,866 (16,755)Recreation and culture 1,261,545 349,529
26

MANAGEMENT’S DISCUSSION AND ANALYSIS (UNAUDITED) (Continued) Business-type Activities – Analysis of Individual Funds: Water and Sewer Fund The combined Water and Sewer Fund had operating revenues of $6,062,948, an increase of $223,341, or 3.82%, from the previous fiscal year. This increase is due to a 3.0% per unit increase in both water and sewer commodity rates and increased usage. Operating expenses increased $186,398, or 3.09%, from the previous fiscal year. The increase was due to higher charges for depreciation and payment-in-lieu-of taxes. Net Non-Operating Expenses increased $1,408,903, or 2,484.27% due to a higher transfer-out to the Construction Fund. Net Assets decreased $1,501,425, or 4.78%, from the previous fiscal year. Stormwater Fund The Stormwater Fund had operating revenues of $867,963, an increase of $158,104, or 22.27%, from the previous fiscal year. This increase is due to a 30% increase in the user rate fee. Operating expenses increased $36,760, or 4.59%, from the previous fiscal year due to higher contractual and depreciation charges. Net Non-Operating Expenses decreased $15,399, or 36.99%, from the previous fiscal year due to the receipt of a grant. Net Assets decreased $145,289, or 2.97%, from the previous fiscal year.
Marina Fund The Marina Fund had operating revenues of $284,838, an increase of $3,542, or 1.26%, from the previous fiscal year. This is due to an increase in Sales of Supplies. Operating Expenses increased $21,270, or 6.04%, from the previous fiscal year. This increase was due to higher Supply expenses. Net Non-Operating Expenses decreased $6,186, or 58.82%, from the previous fiscal year due lower bond interest expense and higher investment income. Net Assets decreased $65,212, or 3.36%, from the previous fiscal year. Intermodal Transportation Fund The Intermodal Transportation Fund had operating revenues of $26,631, a decrease of $8,900, or 25.04%, from the previous fiscal year. The decrease was due to the major tenant of the building moving to a new location and the building sold, therefore the fund was closed out. Operating Expenses decreased $38,836, or 45.16%, from the previous fiscal year. This is due to the aforementioned tenant vacating the premises.
27
28
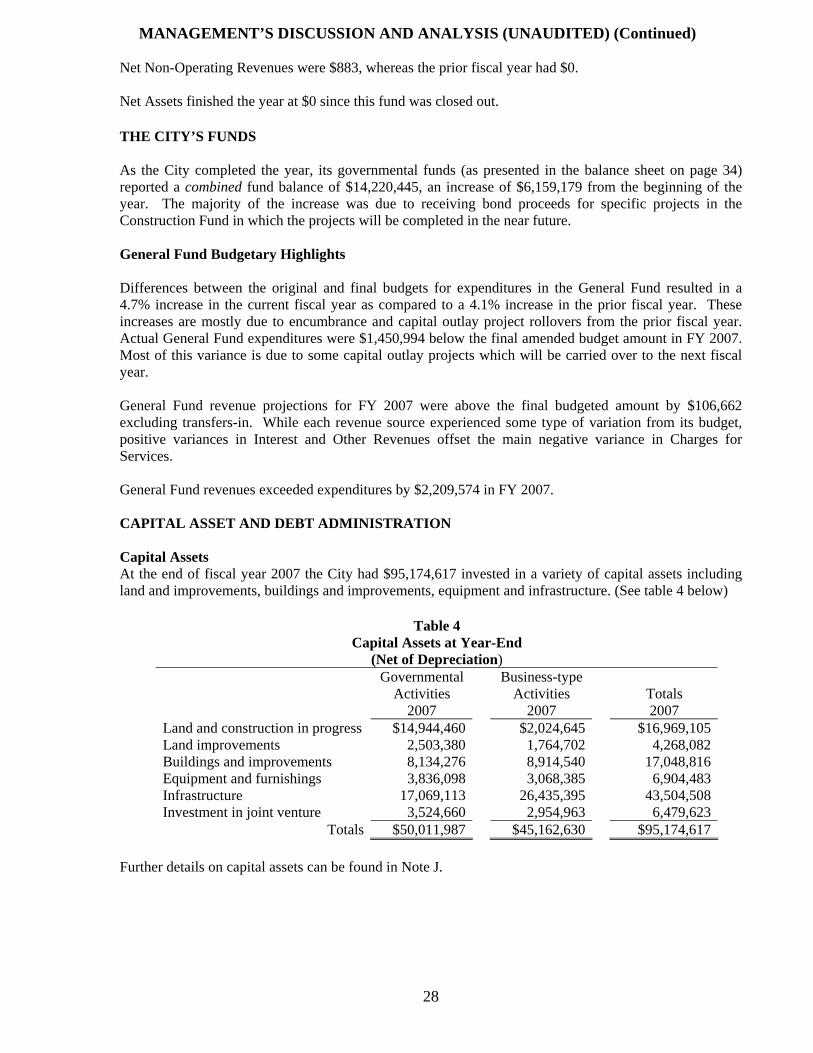
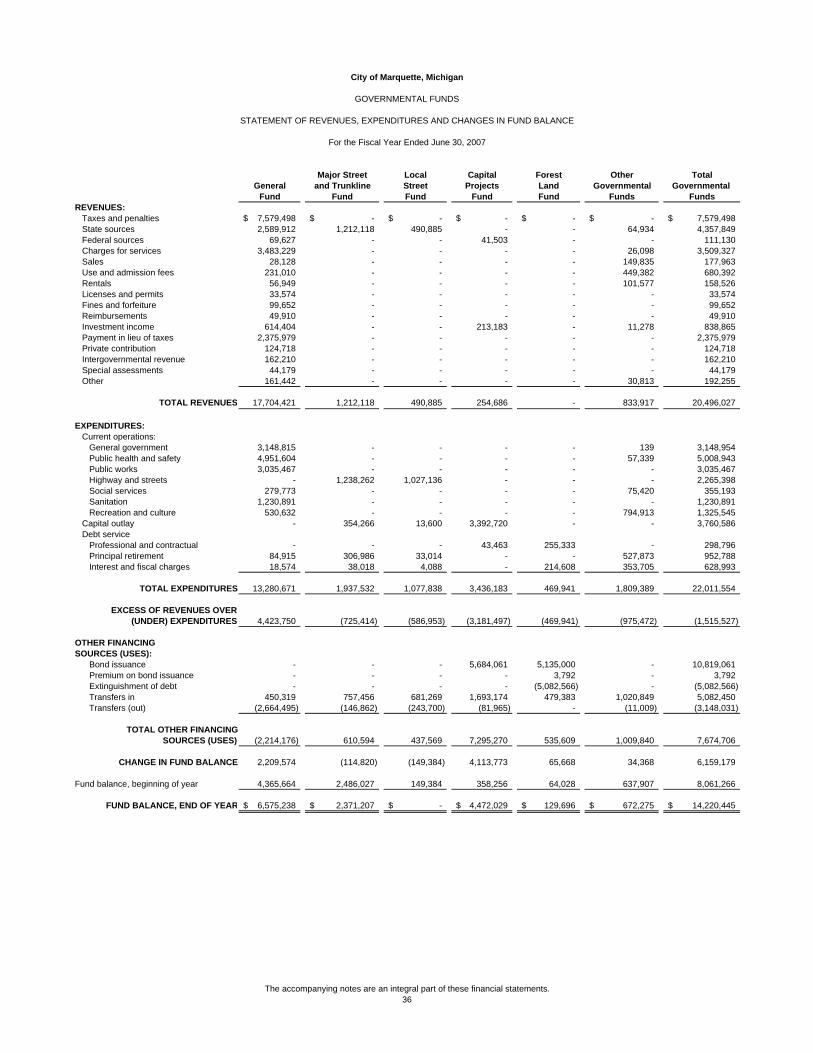
MANAGEMENT’S DISCUSSION AND ANALYSIS (UNAUDITED) (Continued) Net Non-Operating Revenues were $883, whereas the prior fiscal year had $0. Net Assets finished the year at $0 since this fund was closed out. THE CITY’S FUNDS As the City completed the year, its governmental funds (as presented in the balance sheet on page 34) reported a combined fund balance of $14,220,445, an increase of $6,159,179 from the beginning of the year. The majority of the increase was due to receiving bond proceeds for specific projects in the Construction Fund in which the projects will be completed in the near future. General Fund Budgetary Highlights Differences between the original and final budgets for expenditures in the General Fund resulted in a 4.7% increase in the current fiscal year as compared to a 4.1% increase in the prior fiscal year. These increases are mostly due to encumbrance and capital outlay project rollovers from the prior fiscal year. Actual General Fund expenditures were $1,450,994 below the final amended budget amount in FY 2007. Most of this variance is due to some capital outlay projects which will be carried over to the next fiscal year. General Fund revenue projections for FY 2007 were above the final budgeted amount by $106,662 excluding transfers-in. While each revenue source experienced some type of variation from its budget, positive variances in Interest and Other Revenues offset the main negative variance in Charges for Services. General Fund revenues exceeded expenditures by $2,209,574 in FY 2007. CAPITAL ASSET AND DEBT ADMINISTRATION Capital Assets At the end of fiscal year 2007 the City had $95,174,617 invested in a variety of capital assets including land and improvements, buildings and improvements, equipment and infrastructure. (See table 4 below)
Table 4 Capital Assets at Year-End
(Net of Depreciation) Governmental
Activities 2007
Business-type Activities
2007
Totals 2007
Land and construction in progress $14,944,460 $2,024,645 $16,969,105Land improvements 2,503,380 1,764,702 4,268,082Buildings and improvements 8,134,276 8,914,540 17,048,816Equipment and furnishings 3,836,098 3,068,385 6,904,483Infrastructure 17,069,113 26,435,395 43,504,508Investment in joint venture 3,524,660 2,954,963 6,479,623
Totals $50,011,987 $45,162,630 $95,174,617 Further details on capital assets can be found in Note J.

MANAGEMENT’S DISCUSSION AND ANALYSIS (UNAUDITED) (Continued) Debt At year-end, the City had $30,818,819 in bonds, notes and capital lease obligations outstanding as depicted in Table 5 below.
Table 5 Outstanding Debt at Year-End
Governmental Activities
2007
Business-type Activities
2007
Totals 2007
General obligation bonds $19,040,148 $- $19,040,148Revenue bonds - 7,020,000 7,020,000Contracts and notes payable 1,239,920 3,277,019 4,516,939Capital lease obligations - 241,732 241,732
Totals $20,280,068 $10,538,751 $30,818,819 Further details on long-term debt can be found in Note F. ECONOMIC FACTORS AND NEXT YEAR’S BUDGETS The City’s elected and appointed officials consider many factors when setting the fiscal year 2008 budget. One of those factors is the economy. The State of Michigan has suffered from an economic downturn over the past several years which has forced the State to deal with its own budgetary shortfalls. These shortfalls tend to trickle down to the local units of government by way of Revenue Sharing payments being reduced by the State. While the State has promised not to cut back any further on State Revenue Sharing payments, they are also saying that this major source of revenue to the local units is not likely to increase in the foreseeable future. We will continue to monitor the situation as this has and will continue to greatly impact the City’s General Fund budget over the next several years. State Revenue Sharing represents approximately 15% of General Fund revenues. Property Taxes are another big factor in the City’s General Fund budget. Property Taxes are calculated on taxable value. Taxable value growth is capped, by State constitution, at the lower of the rate of inflation or 5%. In the year when property sells, the taxable value is then allowed to be adjusted to reflect actual increases in taxable value and then the capping process starts all over again. It is projected this capping process is costing the City approximately $1,000,000 per year by not being able to fully realize the true increases in taxable value. Variations in interest rates over the last several years has both benefited and harmed the City’s budget. On the benefit side, the City has been able to refund some current bonds and also issue new bonds at favorable interest rates. On the harmful side, the General Fund had become accustomed to collecting a property tax equivalent of almost 2 mills from investment interest. The current property tax equivalent has dropped to below 1 mill. Recent months have seen investment interest rates beginning to nudge upward which will provide a little relief on the revenue side of things if this trend continues. On the expenditure side, the City is dealing with sizable increases in health insurance costs for health insurance provided to its employee’s. Recent years have seen increases of as high as 25% in this cost. Several strategies have been formed along with several committees in order to deal with this situation. For fiscal year 2008, much needed relief was given in this area as the City’s health insurance carrier held the line on premium increases. Hopefully, though not likely, this trend will continue.
29

30
premium increases. Hopefully, though not likely, this trend will continue.
MANAGEMENT’S DISCUSSION AND ANALYSIS (UNAUDITED) (Continued) Large fluctuations in gasoline and natural gas costs are also on the list of things to carefully monitor. The latter is extremely harmful as the City is located in a cold weather region and is a large user of natural gas for heating City facilities. This will have a large negative impact on current and future budgets as the City struggles to balance its budget and continue to provide the current level of services. Overall, the prospect of declining major revenues and increasing expenditures in the General Fund will make for a challenging budget process. City’s management is now and will continue to be challenged to stabilize and/or increase current revenue sources and find new ones and to contain expenditures in order to provide our citizens with a balanced budget and still provide the level of services that are demanded. CONTACTING THE CITY’S FINANCIAL MANAGEMENT This financial report is designed to provide our citizens, taxpayers, customers, and investors and creditors with a general overview of the City’s finances and to show the City’s accountability for the money it receives. If you have questions about this report or need additional financial information, contact the City Finance Office at City of Marquette, 300 West Baraga, Marquette, Michigan, 49855. Additional information about the City may also be found on the City’s website at www.mqtcty.org.

City of Marquette, Michigan
BASIC FINANCIAL STATEMENTS
The Basic Financial Statements provide an overview of the City’s financial position and the result of the current year’s operations and cash flows. These Basic Financial Statements indicate the classes and funds displayed in subsequent sections of the report and present comprehensive data for assets, liabilities, revenues, transfers, expenses or expenditures and cash flows of City funds.

City of Marquette, Michigan
STATEMENT OF NET ASSETS
June 30, 2007
Primary GovernmentGovernmental Business Type Component
Activities Activities Total UnitsASSETS
Current Assets:Cash and cash equivalents 6,719,861$ -$ 6,719,861$ 8,284,246$ Investments 3,790,590 - 3,790,590 1,736,842 Receivables (net) 13,023,751 1,298,947 14,322,698 4,630,289 Primary government internal balances 1,172,334 - 1,172,334 - Inventory 117,442 151,917 269,359 3,267,425 Prepaid expenses and other assets 124,753 11,588 136,341 130,614 Other current assets 41,488 - 41,488 -
TOTAL CURRENT ASSETS 24,990,219 1,462,452 26,452,671 18,049,416
Non-current assets:Restricted assets 764,012 2,457,113 3,221,125 5,102,483 Long-term receivables - - - - Unamortized bond issue costs - 135,293 135,293 24,161 Investment in UPPPA - - - 2,090,698 Capital assets:
Investment in joint venture 3,524,660 2,954,966 6,479,626 - Land and construction in progress 14,950,348 2,024,645 16,974,993 114,704 Other capital assets 71,215,142 57,370,147 128,585,289 143,089,096 Accumulated depreciation (39,678,163) (17,187,128) (56,865,291) (92,550,702)
Total Capital Assets 50,011,987 45,162,630 95,174,617 50,653,098
TOTAL NON-CURRENT ASSETS 50,775,999 47,755,036 98,531,035 57,870,440
TOTAL ASSETS 75,766,218 49,217,488 124,983,706 75,919,856
LIABILITIES:Current Liabilities:
Accounts payable 1,686,227 913,053 2,599,280 1,631,285 Accrued liabilities 233,849 43,753 277,602 350,443 Primary government internal balances - 1,172,334 1,172,334 - Unearned revenue 8,463,534 23,971 8,487,505 1,554,448 Compensated absences 792,675 158,070 950,745 883,933 Current portion of bonds payable 1,284,546 325,000 1,609,546 668,571 Current potion of notes and contracts payable 153,017 166,289 319,306 - Current portion of capital lease obligations - 120,866 120,866 - Other current liabilities 5,303 9,186 14,489 1,451,975 Current maturities on revenue bonds - 710,000 710,000 2,790,000 Revenue bond accrued interest payable - - - 101,520
TOTAL CURRENT LIABILITIES 12,619,151 3,642,522 16,261,673 9,432,175
Non-current Liabilities:Compensated absences 937,693 - 937,693 93,980 Bonds payable 17,755,602 5,985,000 23,740,602 6,089,750 Long-term contracts and notes payable 1,086,903 3,110,730 4,197,633 1,725,633 Capital lease obligations - 120,866 120,866 - Premium on refunding - 47,832 47,832 - Deferred amounts on refunding - (237,759) (237,759) - Other - - - 577,483
TOTAL NON-CURRENT LIABILITIES 19,780,198 9,026,669 28,806,867 8,486,846
TOTAL LIABILITIES 32,399,349 12,669,191 45,068,540 17,919,021
NET ASSETSInvested in capital assets net of related debt 29,731,919 31,910,645 61,642,564 42,851,792 Restricted for:
Debt Service - 1,938,968 1,938,968 60,705 Perpetual Care - Nonexpendable 568,371 - 568,371 - Other activities - - - 3,151,765
Unrestricted 13,066,579 2,698,684 15,765,263 11,936,573
TOTAL NET ASSETS 43,366,869$ 36,548,297$ 79,915,166$ 58,000,835$
The accompanying notes are an integral part of these financial statements.32

City of Marquette, Michigan
STATEMENT OF ACTIVITIES
For the Fiscal Year Ended June 30, 2007
Program Revenues Net (Expense) Revenue and Changes in Net AssetPrimary Government
Operating Capital BusinessCharges for Grants and Grants and Governmental Type Component
Function / Programs Expenses Services Contributions Contributions Activities Activities Total Units
Primary Government:Governmental Activities:
General government 3,395,398$ 1,206,989$ 368,446$ -$ (1,819,963)$ -$ (1,819,963)$ -$ Public health and safety 4,948,192 202,071 84,970 23,000 (4,638,151) - (4,638,151) - Public works 3,039,550 1,205,514 - 85,682 (1,748,354) - (1,748,354) - Highway and streets 2,324,977 - 1,703,003 - (621,974) - (621,974) - Social services 355,193 - 236,399 - (118,794) - (118,794) - Sanitation 1,238,866 1,255,621 - - 16,755 - 16,755 - Recreation and culture 1,261,545 905,996 - 6,020 (349,529) - (349,529) - Interest on long-term debt 750,760 - - - (750,760) - (750,760) - Depreciation - unallocated 1,916,607 - - - (1,916,607) - (1,916,607) -
Total Governmental Activities 19,231,088 4,776,191 2,392,818 114,702 (11,947,377) - (11,947,377) -
Business Type Activities:Water supply and sewage disposal 6,512,473 6,025,359 - - - (487,114) (487,114) - Stormwater utility 891,632 867,963 25,057 - - 1,388 1,388 - Marina 394,386 284,838 - - - (109,548) (109,548) - Intermodal transportation terminal 959,368 26,631 - - - (932,737) (932,737) -
Total Business Type Activities 8,757,859 7,204,791 25,057 - - (1,528,011) (1,528,011) -
TOTAL PRIMARY GOVERNMENT 27,988,947$ 11,980,982$ 2,417,875$ 114,702$ (11,947,377) (1,528,011) (13,475,388) -
Component Units:Board of Light and Power 25,207,081 23,911,978 - 210,438 - - - (1,084,665) Public Library 2,314,894 256,058 457,501 - - - - (1,601,335) Downtown Development Authority 406,832 104,886 55,000 261,893 - - - 14,947 Marquette Housing Commission 1,800,511 483,587 874,608 550,980 108,664
TOTAL COMPONENT UNITS 29,729,318$ 24,756,509$ 1,387,109$ 1,023,311$ - - - (2,562,389)
General Revenues:Taxes:
Property taxes 7,579,498 - 7,579,498 1,435,611 Payment in lieu of taxes 2,375,979 - 2,375,979 -
Unrestricted State sources 2,290,677 - 2,290,677 - Interest and investment earnings 827,856 74,054 901,910 1,061,092 Miscellaneous 138,306 3,838 142,144 350,284 Extraordinary item - - - 1,725,000
Transfers 1,551,006 (1,551,006) - -
TOTAL GENERAL REVENUES AND TRANSFERS 14,763,322 (1,473,114) 13,290,208 4,571,987
CHANGE IN NET ASSETS 2,815,945 (3,001,125) (185,180) 2,009,598
Net assets, beginning of year 40,550,924 39,549,422 80,100,346 55,991,237
NET ASSETS, END OF YEAR 43,366,869$ 36,548,297$ 79,915,166$ 58,000,835$
The accompanying notes are an integral part of these financial statements.33

City of Marquette, Michigan
GOVERNMENTAL FUNDS
BALANCE SHEET
June 30, 2007
Major Street Local Capital Forest Other Total General and Trunkline Street Projects Land Governmental Governmental
Fund Fund Fund Fund Fund Funds FundsASSETS
Cash and cash equivalents 760,352$ 2,371,207$ -$ 3,814,058$ -$ 98,473$ 7,044,090$ Investments 3,260,231 - - - - 530,359 3,790,590 Taxes receivable, net 8,227,502 - - - - - 8,227,502 Special assessments receivable 239,217 - - - - - 239,217 Accounts receivable, net 194,149 - - 344,525 35,000 63,008 636,682 Due from other authorities 3,396,303 - - - - - 3,396,303 Due from component units 117,442 - - - - - 117,442 Due from other funds 157,493 - - 1,693,175 298,078 84,737 2,233,483 Due from other governments 299,489 166,293 55,785 - - - 521,567 Inventory 93,630 - - - - - 93,630 Prepaid expenditures 38,176 - - - - 692 38,868
TOTAL ASSETS 16,783,984$ 2,537,500$ 55,785$ 5,851,758$ 333,078$ 777,269$ 26,339,374$
LIABILITIES AND FUND BALANCE
LIABILITIES:Cash overdraft -$ -$ -$ -$ 203,382$ 89,201$ 292,583 Accounts payable 206,423 4,194 5,439 1,379,729 - 15,793 1,611,578 Accrued compensated absences 687,782 - - - - - 687,782 Due to other funds 845,704 162,099 50,346 - - - 1,058,149 Due to State 108 - - - - - 108 Due to other local units 5,195 - - - - - 5,195 Deferred revenue 8,463,534 - - - - - 8,463,534
TOTAL LIABILITIES 10,208,746 166,293 55,785 1,379,729 203,382 104,994 12,118,929
FUND BALANCE:Reserved for:
Capital outlay - - - - - 40,036 40,036 Encumbrances 231,113 - - - - - 231,113 Debt Service - - - - 129,696 - 129,696 Other prepaids and inventories 131,806 - - - - 568,371 700,177
Unreserved, reported in:General Fund 6,212,319 - - - - - 6,212,319 Special Revenue Funds - 2,371,207 - - - 63,868 2,435,075 Capital Projects Funds - - - 4,472,029 - - 4,472,029
TOTAL FUND BALANCE 6,575,238 2,371,207 - 4,472,029 129,696 672,275 14,220,445
TOTAL LIABILITIES ANDFUND BALANCE 16,783,984$ 2,537,500$ 55,785$ 5,851,758$ 333,078$ 777,269$ 26,339,374$
The accompanying notes are an integral part of these financial statements.34
City of Marquette, Michigan
RECONCILIATION OF THE BALANCE SHEET OF GOVERNMENTAL FUNDSTO THE STATEMENT OF NET ASSETS
June 30, 2007
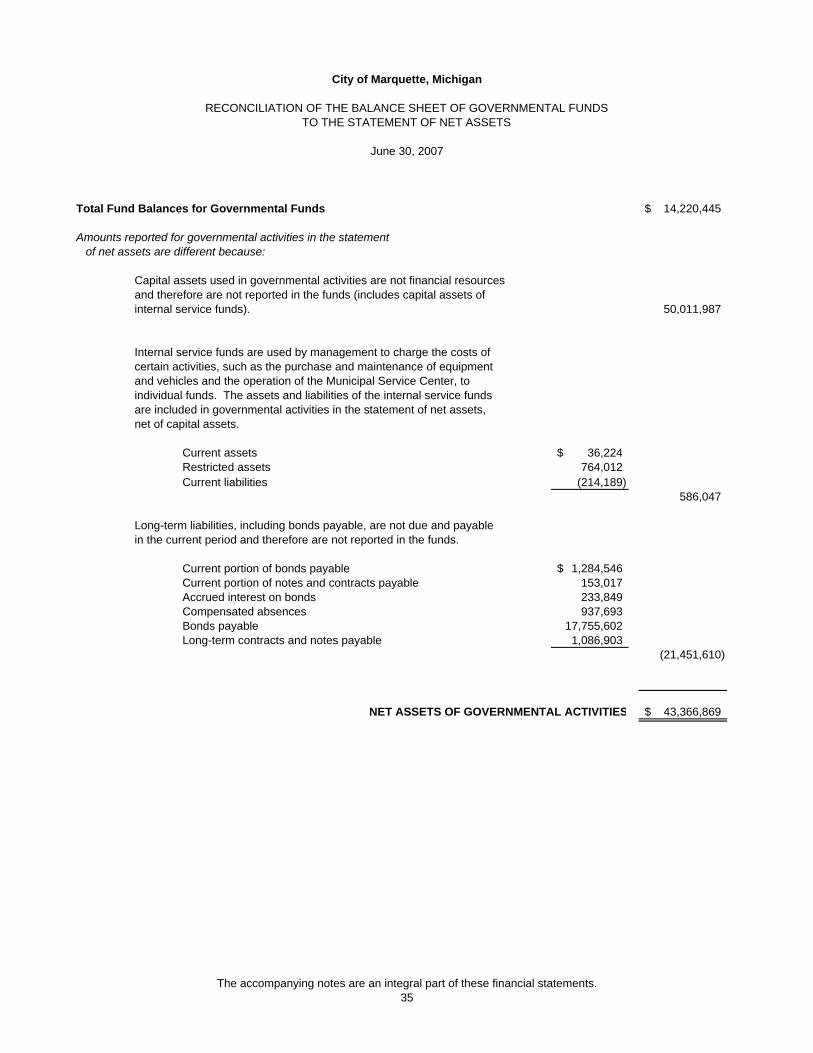
Total Fund Balances for Governmental Funds 14,220,445$
Amounts reported for governmental activities in the statementof net assets are different because:
Capital assets used in governmental activities are not financial resourcesand therefore are not reported in the funds (includes capital assets ofinternal service funds). 50,011,987
Internal service funds are used by management to charge the costs ofcertain activities, such as the purchase and maintenance of equipmentand vehicles and the operation of the Municipal Service Center, toindividual funds. The assets and liabilities of the internal service fundsare included in governmental activities in the statement of net assets,net of capital assets.
Current assets 36,224$ Restricted assets 764,012 Current liabilities (214,189)
586,047
Long-term liabilities, including bonds payable, are not due and payablein the current period and therefore are not reported in the funds.
Current portion of bonds payable 1,284,546$ Current portion of notes and contracts payable 153,017 Accrued interest on bonds 233,849 Compensated absences 937,693 Bonds payable 17,755,602 Long-term contracts and notes payable 1,086,903
(21,451,610)
NET ASSETS OF GOVERNMENTAL ACTIVITIES 43,366,869$
The accompanying notes are an integral part of these financial statements.35
City of Marquette, Michigan
GOVERNMENTAL FUNDS
STATEMENT OF REVENUES, EXPENDITURES AND CHANGES IN FUND BALANCE
For the Fiscal Year Ended June 30, 2007
Major Street Local Capital Forest Other TotalGeneral and Trunkline Street Projects Land Governmental Governmental
Fund Fund Fund Fund Fund Funds FundsREVENUES:
Taxes and penalties 7,579,498$ -$ -$ -$ -$ -$ 7,579,498$ State sources 2,589,912 1,212,118 490,885 - - 64,934 4,357,849 Federal sources 69,627 - - 41,503 - - 111,130 Charges for services 3,483,229 - - - - 26,098 3,509,327 Sales 28,128 - - - - 149,835 177,963 Use and admission fees 231,010 - - - - 449,382 680,392 Rentals 56,949 - - - - 101,577 158,526 Licenses and permits 33,574 - - - - - 33,574 Fines and forfeiture 99,652 - - - - - 99,652 Reimbursements 49,910 - - - - - 49,910 Investment income 614,404 - - 213,183 - 11,278 838,865 Payment in lieu of taxes 2,375,979 - - - - - 2,375,979 Private contribution 124,718 - - - - - 124,718 Intergovernmental revenue 162,210 - - - - - 162,210 Special assessments 44,179 - - - - - 44,179 Other 161,442 - - - - 30,813 192,255
TOTAL REVENUES 17,704,421 1,212,118 490,885 254,686 - 833,917 20,496,027
EXPENDITURES:Current operations:
General government 3,148,815 - - - - 139 3,148,954 Public health and safety 4,951,604 - - - - 57,339 5,008,943 Public works 3,035,467 - - - - - 3,035,467 Highway and streets - 1,238,262 1,027,136 - - - 2,265,398 Social services 279,773 - - - - 75,420 355,193 Sanitation 1,230,891 - - - - - 1,230,891 Recreation and culture 530,632 - - - - 794,913 1,325,545
Capital outlay - 354,266 13,600 3,392,720 - - 3,760,586 Debt service
Professional and contractual - - - 43,463 255,333 - 298,796 Principal retirement 84,915 306,986 33,014 - - 527,873 952,788 Interest and fiscal charges 18,574 38,018 4,088 - 214,608 353,705 628,993
TOTAL EXPENDITURES 13,280,671 1,937,532 1,077,838 3,436,183 469,941 1,809,389 22,011,554
EXCESS OF REVENUES OVER(UNDER) EXPENDITURES 4,423,750 (725,414) (586,953) (3,181,497) (469,941) (975,472) (1,515,527)
OTHER FINANCINGSOURCES (USES):
Bond issuance - - - 5,684,061 5,135,000 - 10,819,061 Premium on bond issuance - - - - 3,792 - 3,792 Extinguishment of debt - - - - (5,082,566) - (5,082,566) Transfers in 450,319 757,456 681,269 1,693,174 479,383 1,020,849 5,082,450 Transfers (out) (2,664,495) (146,862) (243,700) (81,965) - (11,009) (3,148,031)
TOTAL OTHER FINANCINGSOURCES (USES) (2,214,176) 610,594 437,569 7,295,270 535,609 1,009,840 7,674,706
CHANGE IN FUND BALANCE 2,209,574 (114,820) (149,384) 4,113,773 65,668 34,368 6,159,179
Fund balance, beginning of year 4,365,664 2,486,027 149,384 358,256 64,028 637,907 8,061,266
FUND BALANCE, END OF YEAR 6,575,238$ 2,371,207$ -$ 4,472,029$ 129,696$ 672,275$ 14,220,445$
The accompanying notes are an integral part of these financial statements.36

City of Marquette, Michigan
RECONCILIATION OF THE STATEMENT OF REVENUES, EXPENDITURES AND CHANGES INFUND BALANCES OF GOVERNMENTAL FUNDS TO THE STATEMENT OF ACTIVITIES
For the Fiscal Year Ended June 30, 2007
Net Change in Fund Balances - Total Governmental Funds 6,159,179$
Amounts reported for governmental activities in the statementof activities are different because:
Governmental funds report capital outlays as expenditures. However, inthe statement of activities, the cost of those assets is allocated over their estimated useful lives as depreciation expense. This is the amountby which capital outlays exceeded depreciation in the current period.Includes Internal Service Funds depreciation expense of $776,415.
Capital outlays 3,930,376$ Depreciation expense (2,693,710) Net book value of disposed assets (38,459)
1,198,207
Repayment of bond principal is an expenditure in the governmental funds,but the repayment reduces long-term liabilities in the statement of net assets. 952,788
Proceeds from debt issues are an other financing source in the fund, but adebt issue increases long-term liabilities in the statement of net assets. (10,819,061)
Defeasance of debt issues are an other financing use in the funds, but a defeasance decreases long-term liabilities in the statement of net assets. 5,000,000
In the statement of activities, interest is accrued on outstanding bonds, whereas in governmental funds, an interest expenditure is reported when due. (42,994)
Some expenses reported in the statement of activities, such as compensatedabsences, do not require the use of current financial resources and thereforeare not reported as expenditures in governmental funds. 39,396
Internal service funds are used by management to charge costs of certainactivities, such as the purchase and maintenance of equipment and vehiclesand the operation of the Municipal Service Center, to individual funds. The netrevenue of the Internal Service Funds is reported with governmental activitiesnet of depreciation expense.
Change in net assets (447,985) Depreciation expense 776,415
328,430
CHANGE IN NET ASSETS OF GOVERNMENTAL ACTIVITIES 2,815,945$
The accompanying notes are an integral part of these financial statements.37
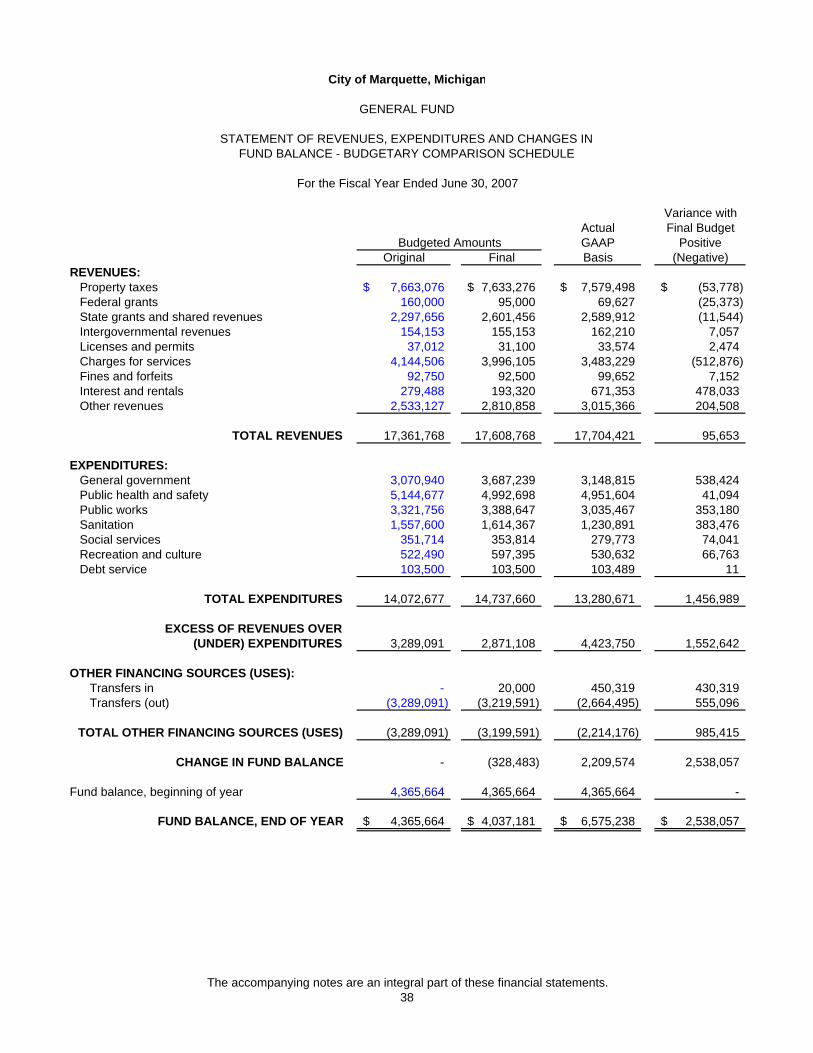
City of Marquette, Michigan
GENERAL FUND
STATEMENT OF REVENUES, EXPENDITURES AND CHANGES INFUND BALANCE - BUDGETARY COMPARISON SCHEDULE
For the Fiscal Year Ended June 30, 2007
Variance withActual Final Budget
Budgeted Amounts GAAP PositiveOriginal Final Basis (Negative)
REVENUES:Property taxes 7,663,076$ 7,633,276$ 7,579,498$ (53,778)$ Federal grants 160,000 95,000 69,627 (25,373) State grants and shared revenues 2,297,656 2,601,456 2,589,912 (11,544) Intergovernmental revenues 154,153 155,153 162,210 7,057 Licenses and permits 37,012 31,100 33,574 2,474 Charges for services 4,144,506 3,996,105 3,483,229 (512,876) Fines and forfeits 92,750 92,500 99,652 7,152 Interest and rentals 279,488 193,320 671,353 478,033 Other revenues 2,533,127 2,810,858 3,015,366 204,508
TOTAL REVENUES 17,361,768 17,608,768 17,704,421 95,653
EXPENDITURES:General government 3,070,940 3,687,239 3,148,815 538,424 Public health and safety 5,144,677 4,992,698 4,951,604 41,094 Public works 3,321,756 3,388,647 3,035,467 353,180 Sanitation 1,557,600 1,614,367 1,230,891 383,476 Social services 351,714 353,814 279,773 74,041 Recreation and culture 522,490 597,395 530,632 66,763 Debt service 103,500 103,500 103,489 11
TOTAL EXPENDITURES 14,072,677 14,737,660 13,280,671 1,456,989
EXCESS OF REVENUES OVER(UNDER) EXPENDITURES 3,289,091 2,871,108 4,423,750 1,552,642
OTHER FINANCING SOURCES (USES):Transfers in - 20,000 450,319 430,319 Transfers (out) (3,289,091) (3,219,591) (2,664,495) 555,096
TOTAL OTHER FINANCING SOURCES (USES) (3,289,091) (3,199,591) (2,214,176) 985,415
CHANGE IN FUND BALANCE - (328,483) 2,209,574 2,538,057
Fund balance, beginning of year 4,365,664 4,365,664 4,365,664 -
FUND BALANCE, END OF YEAR 4,365,664$ 4,037,181$ 6,575,238$ 2,538,057$
The accompanying notes are an integral part of these financial statements.38
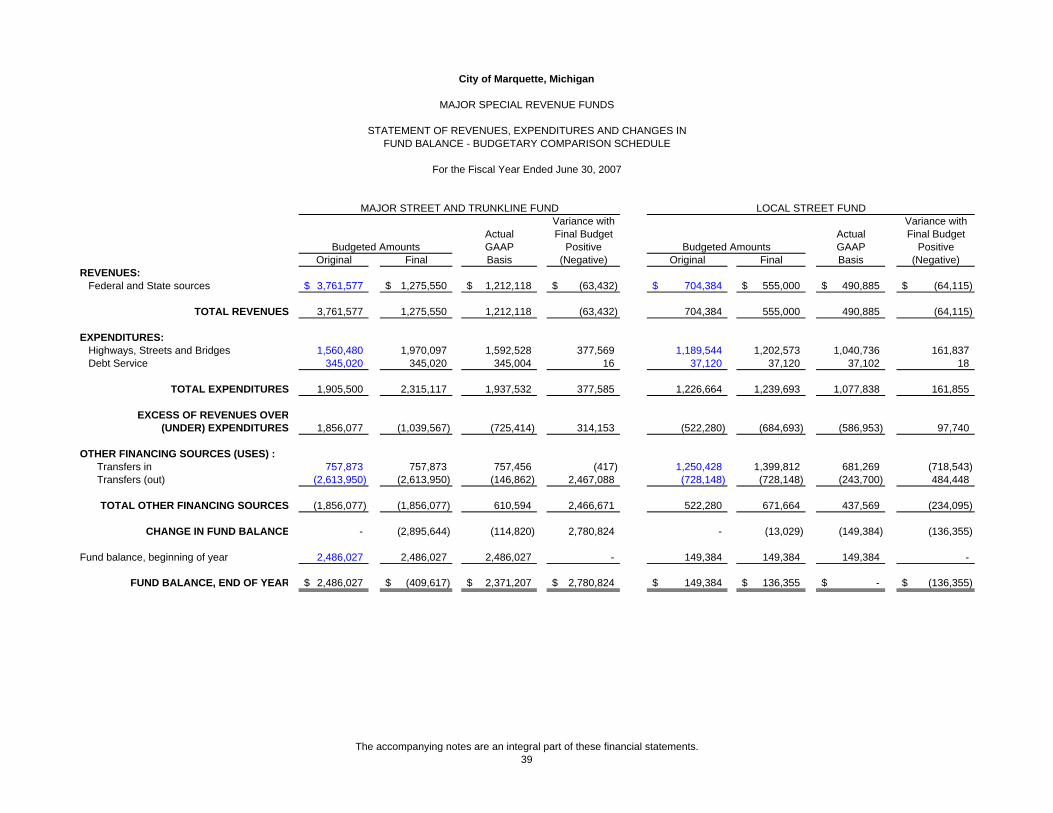
City of Marquette, Michigan
MAJOR SPECIAL REVENUE FUNDS
STATEMENT OF REVENUES, EXPENDITURES AND CHANGES INFUND BALANCE - BUDGETARY COMPARISON SCHEDULE
For the Fiscal Year Ended June 30, 2007
MAJOR STREET AND TRUNKLINE FUND LOCAL STREET FUNDVariance with Variance with
Actual Final Budget Actual Final BudgetBudgeted Amounts GAAP Positive Budgeted Amounts GAAP Positive
Original Final Basis (Negative) Original Final Basis (Negative)REVENUES:
Federal and State sources 3,761,577$ 1,275,550$ 1,212,118$ (63,432)$ 704,384$ 555,000$ 490,885$ (64,115)$
TOTAL REVENUES 3,761,577 1,275,550 1,212,118 (63,432) 704,384 555,000 490,885 (64,115)
EXPENDITURES:Highways, Streets and Bridges 1,560,480 1,970,097 1,592,528 377,569 1,189,544 1,202,573 1,040,736 161,837 Debt Service 345,020 345,020 345,004 16 37,120 37,120 37,102 18
TOTAL EXPENDITURES 1,905,500 2,315,117 1,937,532 377,585 1,226,664 1,239,693 1,077,838 161,855
EXCESS OF REVENUES OVER(UNDER) EXPENDITURES 1,856,077 (1,039,567) (725,414) 314,153 (522,280) (684,693) (586,953) 97,740
OTHER FINANCING SOURCES (USES) :Transfers in 757,873 757,873 757,456 (417) 1,250,428 1,399,812 681,269 (718,543) Transfers (out) (2,613,950) (2,613,950) (146,862) 2,467,088 (728,148) (728,148) (243,700) 484,448
TOTAL OTHER FINANCING SOURCES (1,856,077) (1,856,077) 610,594 2,466,671 522,280 671,664 437,569 (234,095)
CHANGE IN FUND BALANCE - (2,895,644) (114,820) 2,780,824 - (13,029) (149,384) (136,355)
Fund balance, beginning of year 2,486,027 2,486,027 2,486,027 - 149,384 149,384 149,384 -
FUND BALANCE, END OF YEAR 2,486,027$ (409,617)$ 2,371,207$ 2,780,824$ 149,384$ 136,355$ -$ (136,355)$
The accompanying notes are an integral part of these financial statements.39

City of Marquette, Michigan
PROPRIETARY FUNDS
STATEMENT OF NET ASSETS
June 30, 2007
Business- Type Activities Governmental Enterprise Funds Activities
Water Supply Stormwater Non-major Internal and Sewage Utility Enterprise Service
Disposal Fund Fund Funds Total Funds
ASSETSCurrent Assets:
Cash and cash equivalents 100,000$ -$ -$ 100,000$ -$ Special assessments receivable 23,971 - - 23,971 - Accounts receivable, net 1,202,690 71,205 1,081 1,274,976 942 Due from local units - - - - 1,538 Inventory 134,956 - 16,961 151,917 31,123 Prepaid expenses 4,206 179 319 4,704 2,621 Delinquent utility bills on taxes 6,884 - - 6,884 - Unamortized bond issuance costs 97,618 31,510 6,165 135,293 -
TOTAL CURRENT ASSETS 1,570,325 102,894 24,526 1,697,745 36,224
Non-current Assets:Restricted Assets:
Bond reserve fund 50,065 259,675 50,159 359,899 - Replacement and maintenance fund 390,000 - - 390,000 659,119 Bond and interest redemption fund 35,888 - 309,916 345,804 - Water filtration reserve 1,114,774 - - 1,114,774 - Bond escrow fund 49,918 38,648 - 88,566 - Vacation, sick leave and benefit reserve 151,559 6,511 - 158,070 104,893
Total Restricted Assets 1,792,204 304,834 360,075 2,457,113 764,012
Land and land improvements - - - - 251,454 Property, plant, and equipment 46,774,100 6,821,450 3,774,597 57,370,147 15,677,197 Accumulated depreciation (14,107,570) (1,505,180) (1,574,378) (17,187,128) (9,187,632) Construction in progress 1,970,614 54,031 - 2,024,645 - Other non-current assets 2,954,966 - - 2,954,966 -
TOTAL NON-CURRENT ASSETS 39,384,314 5,675,135 2,560,294 47,619,743 7,505,031
TOTAL ASSETS 40,954,639 5,778,029 2,584,820 49,317,488 7,541,255
LIABILITIESCurrent Liabilities:
Cash overdraft 464,288 53,249 35,217 552,754 31,648$ Accounts payable 197,647 1,523 11,129 210,299 74,648 Accrued compensated absences 151,559 6,511 - 158,070 104,893 Due to other funds 1,129,938 150,140 142,256 1,422,334 3,000 Customer deposits payable (75) - 9,261 9,186 - Accrued interest payable 35,267 5,386 3,100 43,753 - Current portion of long-term debt 287,155 255,000 70,000 612,155 - Deferred revenue 23,971 - - 23,971 - Current liabilities payable from restricted assets 710,000 - - 710,000 -
TOTAL CURRENT LIABILITIES 2,999,750 471,809 270,963 3,742,522 214,189
Non-current Liabilities:Bonds payable 4,960,000 565,000 460,000 5,985,000 - Notes payable 70,730 - - 70,730 - Loan payable 3,040,000 - - 3,040,000 - Capital lease obligations 120,866 - - 120,866 - Premium on refunding 47,832 - - 47,832 - Deferred amounts on refunding (214,306) - (23,453) (237,759) -
TOTAL NON-CURRENT LIABILITIES 8,025,122 565,000 436,547 9,026,669 -
TOTAL LIABILITIES 11,024,872 1,036,809 707,510 12,769,191 214,189
NET ASSETSInvested in capital assets net of related debt 25,690,125 4,550,301 1,670,219 31,910,645 6,741,019 Net Assets:
Restricted for debt service 1,640,645 298,323 - 1,938,968 - Unrestricted 2,598,997 (107,404) 207,091 2,698,684 586,047
TOTAL NET ASSETS 29,929,767$ 4,741,220$ 1,877,310$ 36,548,297$ 7,327,066$
The accompanying notes are an integral part of these financial statements.40

City of Marquette, Michigan
PROPRIETARY FUNDS
STATEMENT OF REVENUES, EXPENSES AND CHANGES IN NET ASSETS
For the Fiscal Year Ended June 30, 2007
Business- Type Activities Governmental Enterprise Funds Activities
Water Supply Stormwater Non-major Internal and Sewage Utility Enterprise Service
Disposal Fund Fund Funds Total Funds
OPERATING REVENUES:Water sales 3,502,418$ -$ -$ 3,502,418$ -$ Sewage disposal 2,443,732 - - 2,443,732 - Charges for services - 867,963 27,305 895,268 2,680,276 Other operating revenue 116,798 - 284,164 400,962 45,011
TOTAL OPERATING REVENUES 6,062,948 867,963 311,469 7,242,380 2,725,287
OPERATING EXPENSES:General and administrative 966,029 - 262,140 1,228,169 985,679 Water treatment and distribution 1,396,103 - - 1,396,103 - Sanitary sewer operation and booster stations 1,914,118 - - 1,914,118 - Stormwater - 566,128 - 566,128 - Payments in lieu of taxes 853,413 - - 853,413 - Depreciation 1,082,520 272,254 158,163 1,512,937 776,415 Vehicle operating expenses - - - - 1,110,356
TOTAL OPERATING EXPENSES 6,212,183 838,382 420,303 7,470,868 2,872,450
OPERATING INCOME (LOSS) (149,235) 29,581 (108,834) (228,488) (147,163)
NON-OPERATING REVENUES (EXPENSES):Investment income 54,289 1,963 17,802 74,054 46,547 Other financing sources 3,838 - - 3,838 - Interest expense (300,290) (53,250) (21,250) (374,790) - Sale of capital assets - - 415,642 415,642 36,044 State and Federal grants - 25,057 - 25,057 - Loss on sale of capital assets - - (1,327,843) (1,327,843) - Operating income from Marquette Area
Wastewater Treatment Facility (37,589) - - (37,589) -
TOTAL NON-OPERATING REVENUES (EXPENSES) (279,752) (26,230) (915,649) (1,221,631) 82,591
INCOME (LOSS) BEFORE TRANSFERS (428,987) 3,351 (1,024,483) (1,450,119) (64,572)
Transfers (out) (1,072,438) (148,640) (329,928) (1,551,006) (383,413)
CHANGE IN NET ASSETS (1,501,425) (145,289) (1,354,411) (3,001,125) (447,985)
Net assets, beginning of year 31,431,192 4,886,509 3,231,721 39,549,422 7,775,051
NET ASSETS, END OF YEAR 29,929,767$ 4,741,220$ 1,877,310$ 36,548,297$ 7,327,066$
The accompanying notes are an integral part of these financial statements.41
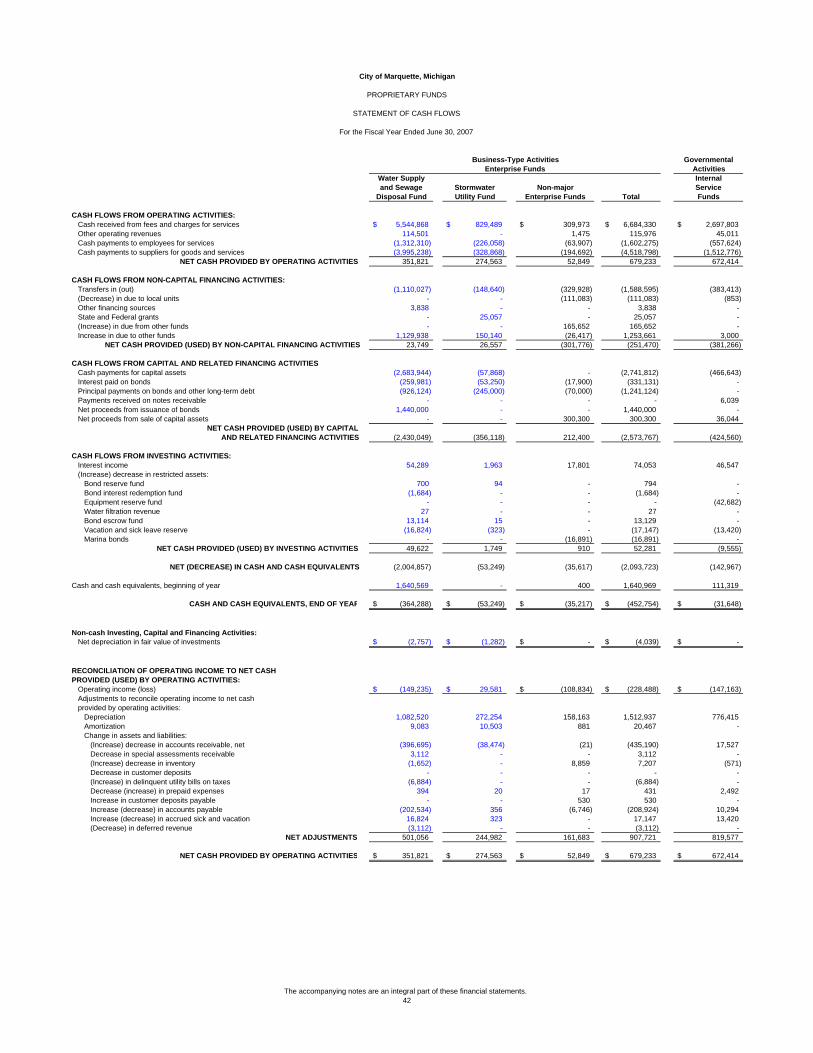
R
City of Marquette, Michigan
PROPRIETARY FUNDS
STATEMENT OF CASH FLOWS
For the Fiscal Year Ended June 30, 2007
Business-Type Activities GovernmentalEnterprise Funds Activities
Water Supply Internaland Sewage Stormwater Non-major Service
Disposal Fund Utility Fund Enterprise Funds Total Funds
CASH FLOWS FROM OPERATING ACTIVITIES:Cash received from fees and charges for services 5,544,868$ 829,489$ 309,973$ 6,684,330$ 2,697,803$ Other operating revenues 114,501 - 1,475 115,976 45,011 Cash payments to employees for services (1,312,310) (226,058) (63,907) (1,602,275) (557,624) Cash payments to suppliers for goods and services (3,995,238) (328,868) (194,692) (4,518,798) (1,512,776)
NET CASH PROVIDED BY OPERATING ACTIVITIES 351,821 274,563 52,849 679,233 672,414
CASH FLOWS FROM NON-CAPITAL FINANCING ACTIVITIES:Transfers in (out) (1,110,027) (148,640) (329,928) (1,588,595) (383,413) (Decrease) in due to local units - - (111,083) (111,083) (853) Other financing sources 3,838 - - 3,838 - State and Federal grants - 25,057 - 25,057 - (Increase) in due from other funds - - 165,652 165,652 - Increase in due to other funds 1,129,938 150,140 (26,417) 1,253,661 3,000
NET CASH PROVIDED (USED) BY NON-CAPITAL FINANCING ACTIVITIES 23,749 26,557 (301,776) (251,470) (381,266)
CASH FLOWS FROM CAPITAL AND RELATED FINANCING ACTIVITIESCash payments for capital assets (2,683,944) (57,868) - (2,741,812) (466,643) Interest paid on bonds (259,981) (53,250) (17,900) (331,131) - Principal payments on bonds and other long-term debt (926,124) (245,000) (70,000) (1,241,124) - Payments received on notes receivable - - - - 6,039 Net proceeds from issuance of bonds 1,440,000 - - 1,440,000 - Net proceeds from sale of capital assets - - 300,300 300,300 36,044
NET CASH PROVIDED (USED) BY CAPITALAND RELATED FINANCING ACTIVITIES (2,430,049) (356,118) 212,400 (2,573,767) (424,560)
CASH FLOWS FROM INVESTING ACTIVITIES:Interest income 54,289 1,963 17,801 74,053 46,547 (Increase) decrease in restricted assets:
Bond reserve fund 700 94 - 794 - Bond interest redemption fund (1,684) - - (1,684) - Equipment reserve fund - - - - (42,682) Water filtration revenue 27 - - 27 - Bond escrow fund 13,114 15 - 13,129 - Vacation and sick leave reserve (16,824) (323) - (17,147) (13,420) Marina bonds - - (16,891) (16,891) -
NET CASH PROVIDED (USED) BY INVESTING ACTIVITIES 49,622 1,749 910 52,281 (9,555)
NET (DECREASE) IN CASH AND CASH EQUIVALENTS (2,004,857) (53,249) (35,617) (2,093,723) (142,967)
Cash and cash equivalents, beginning of year 1,640,569 - 400 1,640,969 111,319
CASH AND CASH EQUIVALENTS, END OF YEA (364,288)$ (53,249)$ (35,217)$ (452,754)$ (31,648)$
Non-cash Investing, Capital and Financing Activities:Net depreciation in fair value of investments (2,757)$ (1,282)$ -$ (4,039)$ -$
RECONCILIATION OF OPERATING INCOME TO NET CASHPROVIDED (USED) BY OPERATING ACTIVITIES:
Operating income (loss) (149,235)$ 29,581$ (108,834)$ (228,488)$ (147,163)$ Adjustments to reconcile operating income to net cashprovided by operating activities:
Depreciation 1,082,520 272,254 158,163 1,512,937 776,415 Amortization 9,083 10,503 881 20,467 - Change in assets and liabilities:
(Increase) decrease in accounts receivable, net (396,695) (38,474) (21) (435,190) 17,527 Decrease in special assessments receivable 3,112 - - 3,112 - (Increase) decrease in inventory (1,652) - 8,859 7,207 (571) Decrease in customer deposits - - - - - (Increase) in delinquent utility bills on taxes (6,884) - - (6,884) - Decrease (increase) in prepaid expenses 394 20 17 431 2,492 Increase in customer deposits payable - - 530 530 - Increase (decrease) in accounts payable (202,534) 356 (6,746) (208,924) 10,294 Increase (decrease) in accrued sick and vacation 16,824 323 - 17,147 13,420 (Decrease) in deferred revenue (3,112) - - (3,112) -
NET ADJUSTMENTS 501,056 244,982 161,683 907,721 819,577
NET CASH PROVIDED BY OPERATING ACTIVITIES 351,821$ 274,563$ 52,849$ 679,233$ 672,414$
The accompanying notes are an integral part of these financial statements.42

City of Marquette, Michigan
FIDUCIARY FUNDS
STATEMENT OF FIDUCIARY NET ASSETS
June 30, 2007
Private- PensionPurpose Trust Agency
Trust Funds Funds Funds
ASSETSCash and equivalents 592,861$ 2,027,201$ 1,576,229$ Investments:
United States Government Securities - 5,698,322 - Domestic Corporation Bonds - 2,540,674 - Common, Pooled Fund - 17,435,867 - Government National Mortgage Association - 1,056 -
Taxes receivable - - 23 Accrued interest receivable - 113,639 37,592 Due from other governments - - 1,912 Due from other funds - - 250,000
TOTAL ASSETS 592,861 27,816,759 1,865,756$
LIABILITIESAccounts payable 3,375 - -$ Contract retainage payable - - 267,840 Accrued wages and related liabilities - - 1,192,780 Due to other governments - - 8,146 Due to State - - 8,143 Due to local units - - 384,805 Other liabilities - - 4,042
TOTAL LIABILITIES 3,375 - 1,865,756$
NET ASSETSHeld in trust for pension benefits - 27,816,759 Held in trust for individuals,
organizations, and other governments 589,486 -
TOTAL NET ASSETS 589,486$ 27,816,759$
The accompanying notes are an integral part of these financial statements.43

City of Marquette, Michigan
FIDUCIARY FUNDS
STATEMENT OF CHANGES IN FIDUCIARY NET ASSETS
For the Fiscal Year Ended June 30, 2007
Private- Pension Purpose Trust
Trust Funds FundsADDITIONS:
Contributions:Employer -$ 470,128$ Employee - 153,710 Gifts, bequests and endowments 162,054 -
Total Contributions 162,054 623,838
Investment Income:Net appreciation in fair value of investments - 2,482,369 Interest and dividends - 817,543 Investment expense - (216,406)
Net Investment Income (Loss) - 3,083,506
TOTAL ADDITIONS (DEDUCTIONS) 162,054 3,707,344
DEDUCTIONS:Benefits and annuity withdrawals - 1,405,353 Administrative expenses - 11,452 Payments in accordance with trust agreements 66,950 -
TOTAL DEDUCTIONS 66,950 1,416,805
CHANGE IN NET ASSETS 95,104 2,290,539
Net assets, beginning of year 494,382 25,526,220
NET ASSETS, END OF YEAR 589,486$ 27,816,759$
The accompanying notes are an integral part of these financial statements.44

City of Marquette, Michigan
COMPONENT UNITS
COMBINING STATEMENT OF NET ASSETS
June 30, 2007
Board of Light Peter White Non-majorand Power Public Library Component Units Total
ASSETSCurrent Assets:
Cash and cash equivalents 6,914,362$ 43,920$ 1,325,964$ 8,284,246$ Investments - 1,256,851 479,991 1,736,842 Receivables, net 3,010,340 1,114,777 505,172 4,630,289 Inventory 3,256,163 - 11,262 3,267,425 Prepaid expenses and other assets 97,224 - 33,390 130,614
TOTAL CURRENT ASSETS 13,278,089 2,415,548 2,355,779 18,049,416
Non-current Assets:Restricted Assets 5,102,483 - - 5,102,483 Unamortized bond issuance costs 24,161 - - 24,161 Investment in UPPPA 2,090,698 - - 2,090,698 Capital assets:
Land - 114,704 - 114,704 Other capital assets 117,733,051 11,080,564 14,275,481 143,089,096 Accumulated depreciation (79,375,376) (5,162,534) (8,012,792) (92,550,702)
Total Capital Assets 38,357,675 6,032,734 6,262,689 50,653,098
TOTAL NON-CURRENT ASSETS 45,575,017 6,032,734 6,262,689 57,870,440
TOTAL ASSETS 58,853,106 8,448,282 8,618,468 75,919,856
LIABILITIESCurrent Liabilities:
Accounts payable 1,152,550 16,651 462,084 1,631,285 Accrued liabilities 125,799 - 224,644 350,443 Unearned revenue - 1,112,370 442,078 1,554,448 Compensated absences 883,933 - - 883,933 Customer deposits payable 1,411,975 - - 1,411,975 Current portion of bonds payable - 490,000 178,571 668,571 Other current liabilities 40,000 - - 40,000 Current Liabilities (payable from restricted assets):
Current maturities on revenue bonds 2,790,000 - - 2,790,000 Revenue bond accrued interest payable 101,520 - - 101,520
Total Current Liabilities (payable from restricted assets) 2,891,520 - - 2,891,520
TOTAL CURRENT LIABILITIES 6,505,777 1,619,021 1,307,377 9,432,175
Non-current Liabilities:Compensated absences - 93,980 - 93,980 Bonds payable 2,679,750 2,910,000 500,000 6,089,750 Notes payable 739,820 - 985,813 1,725,633 Other 547,441 - 30,042 577,483
TOTAL NON-CURRENT LIABILITIES 3,967,011 3,003,980 1,515,855 8,486,846
TOTAL LIABILITIES 10,472,788 4,623,001 2,823,232 17,919,021
NET ASSETSInvested in capital assets net of related debt 35,677,925 2,632,734 4,541,133 42,851,792 Restricted: -
Debt Service 60,705 - 60,705 Other activities 2,210,963 852,421 88,381 3,151,765
Unrestricted 10,491,430 279,421 1,165,722 11,936,573
TOTAL NET ASSETS 48,380,318$ 3,825,281$ 5,795,236$ 58,000,835$
The accompanying notes are an integral part of these financial statements.45

City of Marquette, Michigan
COMPONENT UNITS
COMBINING STATEMENT OF ACTIVITIES
For the Fiscal Year Ended June 30, 2007
Program Revenues Net (Expense) Revenue and Changes in Net Assets
Operating Capital Peter White Non-majorCharges for Grants and Grants and Board of Power Public Component
Function / Programs Expenses Services Contributions Contributions and Light Library Units Total
Board of Light and PowerOperations 25,207,081$ 23,911,978$ -$ 210,438$ (1,084,665)$ -$ -$ (1,084,665)
Peter White Public LibraryRecreation and culture 2,314,894 256,058 457,501 - - (1,601,335) - (1,601,335)
Non-major Component UnitsOperations 2,207,343 588,473 929,608 812,873 - - 123,611 123,611
TOTAL COMPONENT UNITS 29,729,318$ 24,756,509$ 1,387,109$ 1,023,311$ (1,084,665) (1,601,335) 123,611 (2,562,389)
General Revenues:Property taxes - 1,052,105 383,506 1,435,611 Interest and investment earnings 848,866 167,938 44,288 1,061,092 Miscellaneous 30,599 172,564 147,121 350,284 Extraordinary item 1,725,000 - - 1,725,000
TOTAL GENERAL REVENUES 2,604,465 1,392,607 574,915 4,571,987
CHANGE IN NET ASSETS 1,519,800 (208,728) 698,526 2,009,598
Net assets, beginning of year 46,860,518 4,034,009 5,096,710 55,991,237
NET ASSETS, END OF YEAR 48,380,318$ 3,825,281$ 5,795,236$ 58,000,835$
The accompanying notes are an integral part of these financial statements.46

47
City of Marquette, Michigan
NOTES TO FINANCIAL STATEMENTS NOTE A – SUMMARY OF SIGNIFICANT ACCOUNTING POLICIES: The City of Marquette, Michigan was incorporated February 27, 1871, under the provision of Act 279, PS 1909, as amended (Home Rule City Act). The City operates under a Commissioner – Manager form of government and the services provided to the citizens include: legislative, executive, elections, general services, public safety and fire protection, inspection, public works, sanitation, parking systems, social services, parks and recreation, cultural, conservation of natural resources, planning and other functions. In addition, the City operates four enterprise funds and two internal service funds, which provide water and sewer services, marina services, stormwater management, transportation acquisition and maintenance, transportation rental and building rental. The financial statements of the City have been prepared in accordance with generally accepted accounting principles (GAAP) as applied to governmental units. The Governmental Accounting Standards Board (GASB) is responsible for establishing GAAP for state and local governments through its pronouncements (Statements and Interpretations). Governments are also required to follow the pronouncements of the Financial Accounting Standards Board (FASB) issued through November 30, 1989 (when applicable) that do not conflict with or contradict GASB pronouncements. The more significant of these accounting policies established in GAAP and used by the City are described below. (1) REPORTING ENTITY The City’s financial statements present the City (the primary government) and its component units. In evaluating the City as a reporting entity, management has addressed all potential component units (traditionally separate reporting units) for which the City may or may not be financially accountable and, as such, be includable within the City’s financial statements. In accordance with GASB Statement #14, the City (the primary government) is financially accountable if it appoints a voting majority of the organization’s governing board and (1) it is able to impose its will on the organization or (2) there is a potential for the organization to provide specific financial benefit to or impose specific financial burden on the City. Additionally, the primary government is required to consider other organizations for which the nature and significance of their relationship with the primary government are such that exclusion would cause the reporting entity’s financial statements to be misleading or incomplete. Blended component units, although legally separate entities, are, in substance, part of the government’s operations, therefore data from these units are combined with data of the primary government. Each discretely presented component unit, on the other hand, is reported in a separate column in the combined financial statements to emphasize it is legally separate from the government. Each blended and discretely presented component unit has a June 30 year-end. Fire and Police Retirement System – The City of Marquette is the administrator of a single-employer public employee retirement system established and administered by the City to provide

48
NOTE A – SUMMARY OF SIGNIFICANT ACCOUNTING POLICIES (Continued): pension benefits for the Fire and Police Department employees. The Fire and Police Retirement System is considered part of the City of Marquette financial reporting entity and is included in the City’s financial report as a pension trust fund. BLENDED COMPONENT UNITS City of Marquette Building Authority – The City of Marquette Building Authority’s governing body consists of the City Manager, Finance Director and City Attorney which are appointed by the governing board of the reporting entity. Although it is legally separate from the City, the Authority is reported as if it were part of the primary government because its sole purpose is to finance and construct the City’s public buildings. The reporting entity has guaranteed the debt issues of the Authority. DISCRETELY PRESENTED COMPONENT UNITS Proprietary Fund Type City of Marquette Board of Light and Power – The Board of Light and Power’s operating results are held accountable to the government’s governing body. The rates for user charges and debt issuance authorizations are approved by the government’s governing body. The reporting entity has the responsibility to fund deficits and operating deficiencies. Prior to 1993-94, this entity had been blended with and included in the City’s reporting entity as an enterprise fund. A complete financial statement of the component unit can be obtained directly from the administrative office.
City of Marquette Board of Light and Power 2200 Wright Street Marquette, MI 49855
Marquette Housing Commission – The Marquette Housing Commission was created to provide low-income housing for the City residents. The Marquette Housing Commission’s governing board is appointed by the City Mayor with the confirmation of the commission; however, the City does not provide any financial assistance to the Housing Commission. The State of Michigan’s Department of Treasury, Local Audit Division, requires and has concluded that the Housing Commission is to be presented as a discretely presented component unit. A complete financial statement of the component unit can be obtained directly from the administrative office.
Marquette Housing Commission 316 Pine Street Marquette, MI 49855

49
NOTE A – SUMMARY OF SIGNIFICANT ACCOUNTING POLICIES (Continued): Governmental Fund Type City of Marquette Downtown Development Authority – The Downtown Development Authority’s governing board is appointed by the City’s Mayor with the confirmation of the Commission and includes the City Manager of the reporting entity. The reporting entity has the responsibility to fund deficits and operating deficiencies, as well as a guarantee for any debt the Authority issues. Separate financial statements for the City of Marquette Downtown Development Authority are not developed; however, information can be obtained from the City’s Finance Department upon request, located at 300 West Baraga Avenue, Marquette, Michigan 49855. Peter White Public Library – The Peter White Public Library’s governing body is appointed by the City’s Mayor with the confirmation of the Commission. The reporting entity has the responsibility to fund deficits and operating deficiencies. Separately issued financial statements of the Peter White Public Library component unit can be obtained from the City’s Finance Department located at 300 West Baraga Avenue, Marquette, Michigan 49855.
GASB Statement #14 requires reasonable separation between the Primary Government (including its blended component units) and its discretely presented component units, both in the financial statements and in the related notes and required supplementary information. Because the discretely presented component units, although legally separate, have been and are operated as if each is part of the primary government, there are limited instances where special note reference or separation will be required. If no separate note reference or categorization is made, the user should assume that information presented is equally applicable. JOINT VENTURES As defined in GASB Statement #14, a joint venture is a legal entity or other organization that results from a contractual arrangement (or interlocal agreement) and that is owned, operated or governed by two or more participants as a separate and specific activity subject to joint control in which the participants retain (a) an ongoing financial interest or (b) an ongoing financial responsibility. The City participates in the following joint ventures: Marquette Area Wastewater Treatment Facility – The Marquette Area Wastewater Treatment Facility’s governing board includes joint representation as appointed by the participating governments’ governing bodies. As enumerated in Footnote D, the facility is being accounted for as an equity investment within the reporting entity. Marquette County Solid Waste Management Authority – The Marquette County Solid Waste Management Authority’s governing board includes joint representation as appointed by the participating governments’ governing bodies. The reporting entity’s representation consists of two of seven members and does not constitute enough representation to exert significant influence over the Authority’s operations. The Authority selects the management staff, sets user charges and budgets, and controls all aspects of its operations and developments. The reporting entity provided its

50
NOTE A – SUMMARY OF SIGNIFICANT ACCOUNTING POLICIES (Continued): proportionate share of the initial funding and has guaranteed its proportional share of the Authority’s outstanding debt. (2) BASIC FINANCIAL STATEMENTS – GOVERNMENT-WIDE FINANCIAL STATEMENTS: The City’s basic financial statements include both government-wide (reporting the City as a whole) and fund financial statements (reporting the City’s major funds). Both the government-wide and fund financial statements categorize primary activities as either governmental or business-type. The City’s public health and safety, public works, highways and streets, sanitation, social services, recreation and culture, and general government services are classified as governmental activities. The City’s water, sewer, stormwater, transportation center, and marina services are classified as business-type activities. In the government-wide Statement of Net Assets, both the governmental and business-type activities columns are presented on a consolidated basis by column and are reported on a full accrual, economic resource basis, which recognizes all long-term assets and receivables as well as long-term debt and obligations. The City’s net assets are reported in three parts – invested in capital assets, net of related debt; restricted net assets; and unrestricted net assets. The City first utilizes restricted resources to finance qualifying activities. The government-wide Statement of Activities reports both the gross and net cost of each of the City’s functions and business-type activities. The functions are also supported by general government revenues (property, sales and use taxes, certain intergovernmental revenues, fines, permits and charges, etc.) The Statement of Activities reduces gross expenses (including depreciation) by related program revenues, operating and capital grants. Program revenues must be directly associated with the function or a business-type activity. Operating grants include operating-specific and discretionary (either operating or capital) grants while the capital grants column reflects capital-specific grants. The net costs (by function or business-type activity) are normally covered by general revenue. The City allocates indirect costs through an administrative service fee that is charged by the General Fund to the other operating funds to recover the direct costs of General Fund services provided (finance, personnel, purchasing, legal, technology, etc.) The government-wide focus is more on the sustainability of the City as an entity and the change in the City’s net assets resulting from the current year’s activities. As a general rule the effect of interfund activity has been eliminated from the government-wide financial statements. Exceptions to this general rule are payments-in-lieu of taxes where the amounts are reasonable equivalent in value to the interfund services provided and other charges between the government’s water and sewer function and various other functions of the government. Elimination of these charges would distort the direct costs and program revenues reported for the various functions concerned.
51
NOTE A – SUMMARY OF SIGNIFICANT ACCOUNTING POLICIES (Continued): (3) BASIC FINANCIAL STATEMENTS – FUND FINANCIAL STATEMENTS: The financial transactions of the City are reported in individual funds in the fund financial statements. Each fund is accounted for by providing a separate set of self-balancing accounts that comprises its assets, liabilities, reserves, fund equity, revenues and expenditures/expenses. The various funds are reported by generic classification within the financial statements. The following fund types are used by the City: Governmental Funds: The focus of the governmental funds’ measurement (in the fund statements) is upon determination of financial position (sources, uses, and balances of financial resources) rather than upon net income. The following is a description of the governmental funds of the City:
General Fund – The General Fund is the general operating fund and, accordingly, it is used to account for all financial resources except those required to be accounted for in another fund.
Special Revenue Funds – Special Revenue Funds are used to account for the proceeds of specific revenue sources that are legally restricted to expenditures for specific purposes.
Debt Service Funds – Debt Service Funds are used to account for the accumulation of resources for, and the payment of, general long-term debt principal, interest, and related costs. Capital Projects Funds – Capital Projects Funds are used to account for financial resources to be used for the acquisition or construction of major capital facilities (other than those financed by business-type/proprietary funds). Component Units – Component units are used to account for the discretely presented component units which follow governmental fund accounting guidelines.
Proprietary Funds The focus of proprietary fund measurement is upon determination of operating income, changes in net assets, financial position, and cash flows. The generally accepted accounting principles applicable are those similar to businesses in the private sector. The following is a description of the proprietary funds of the City:
Enterprise Funds – Enterprise Funds are used to account for operations (a) that are financed and operated in a manner similar to private business enterprises – where the intent of the governing body is that the cost (expenses, including depreciation) of providing goods or services to the general public on a continuing basis be financed or recovered primarily through user charges; or (b) where the governing body has decided that periodic determination of revenues earned, expenses incurred, and/or net income is appropriate for capital maintenance, public policy, management control, accountability, or other purposes. Internal Service Funds – Internal Service Funds are used to finance, administer and account for the financing of equipment and building purchases and maintenance services provided by one

52
NOTE A – SUMMARY OF SIGNIFICANT ACCOUNTING POLICIES (Continued):
department or agency to other departments or agencies of the governmental unit or to other governmental units on a cost reimbursement basis.
Component Units – Component units are used to account for the discretely presented component units which follow proprietary fund accounting guidelines.
Fiduciary Funds Fiduciary funds are used to report assets held in a trustee or agency capacity for others and therefore are not available to support City programs. The reporting focus is on net assets and changes in net assets and are reported using accounting principles similar to proprietary funds. The emphasis in fund financial statements is on the major funds in either the governmental or business-type activities categories. Nonmajor funds by category are summarized into a single column. GASB Statement No. 34 sets forth minimum criteria (percentage of the assets, liabilities, revenues or expenditures/expenses of either fund category or the governmental and enterprise combined) for the determination of major funds. The City reports the following major governmental funds:
The General Fund is the City’s primary operating fund. It accounts for all financial resources of the general government, except those required to be accounted for in another fund. The Major Street and Trunkline Fund accounts for the receipt of allocated state shared gas and weight taxes. The expenditure of these funds is restricted to Federal and State trunklines and certain “mile” roads designated as major under contractual agreement with the State of Michigan. The Local Street Fund accounts for the allocated state shared gas and weight taxes for remaining City roads. The Capital Projects Fund accounts for the development, improvement and rehabilitation of City infrastructure. The Forest Land Fund accounts for the annual debt payments on the Forest Land property purchase.
The City reports the following major proprietary funds:
The Water Supply and Sewage Disposal Fund accounts for the activities related to water treatment and distribution, sanitary sewer operation and booster stations, and billing for services. The Stormwater Utility Fund accounts for the management of stormwater related activities including billing, maintenance and construction.
The City’s internal service funds are presented in the proprietary funds financial statements. Because the principal users of the internal services are the City’s governmental activities, the financial

53
NOTE A – SUMMARY OF SIGNIFICANT ACCOUNTING POLICIES (Continued): statement of the internal service fund is consolidated into the governmental column when presented in the government-wide financial statements. To the extent possible, the cost of these services is reported in the appropriate functional activity (general government, public works, etc.) The City’s fiduciary funds are presented in the fiduciary fund financial statements by type (pension, private purpose and agency). Since by definition these assets are being held for the benefit of a third party (other local governments, private parties, pension participants, etc.) and cannot be used to address activities or obligations of the City, these funds are not incorporated into the government-wide statements. The Special Activities Private-Purpose Trust Fund is used to account for the contributions from private sources restricted for special projects. The Fire-Police Retirement System Fund is used to account for the accumulation of resources to be used for the retirement annuity payments at appropriate amounts and times in the future. The Agency Fund is used to record the collection and payment of property taxes billed and collected by the City on behalf of the County, the School Districts, and the Intermediate School District. (4) BASIS OF ACCOUNTING Basis of accounting refers to the point at which revenues or expenditures/expenses are recognized in the accounts and reported in the financial statements. It relates to the timing of the measurements made regardless of the measurement focus applied. Accrual Both governmental and business-type activities in the government-wide financial statements and the proprietary and fiduciary fund financial statements are presented on the accrual basis of accounting. Revenues are recognized when earned and expenses are recognized when incurred, regardless of the timing of related cash flows. Property taxes are recognized as revenues in the year for which they are levied. Grants and similar items are recognized as revenues as soon as all eligibility requirements imposed by the provider have been met. Proprietary funds distinguish operating revenues and expenses from nonoperating items. Operating revenues and expenses generally result from providing services and producing and delivering goods in connection with a proprietary fund’s principal ongoing operations. The principal operating revenues of the enterprise funds and of the government’s internal service funds are charges to customers for sales and services. Operating expenses for enterprise funds and internal service funds include the cost of sales and services, administrative expenses, and depreciation on capital assets. All revenues and expenses not meeting this definition are reported as nonoperating revenues and expenses. All enterprise funds, private-purpose trust funds, and pension trust funds apply Financial Accounting Standards Board (FASB) pronouncements and Accounting Principles Board (APB) opinions issued on or before November 30, 1989, unless those pronouncements conflict with or contradict GASB pronouncements, in which case, GASB prevails. Their revenues are recognized when they are earned, and their expenses are recognized when they are incurred. Unbilled electric, water, and sewer services are accrued as revenue in the Component Unit and Water Supply and Sewage Disposal
54
NOTE A – SUMMARY OF SIGNIFICANT ACCOUNTING POLICIES (Continued): Funds based upon estimated consumption at year-end. Modified Accrual The governmental funds financial statements are presented on the modified accrual basis of accounting. Under the modified basis of accounting, revenues are recorded when they are both measurable and available. “Available” means collectible within the current period or within 60 days of the end of the current fiscal period. Expenditures are generally recognized under the modified accrual basis of accounting when the related liability is incurred. However, debt service expenditures, compensated absences, and claims and judgments are recorded only when payment is due. The revenues susceptible to accrual are property taxes, franchise fees, licenses, charges for services, interest income and intergovernmental revenues. Sales taxes collected and held by the State at year-end on behalf of the government are also recognized as revenue. All other governmental fund revenues are recognized when received. (5) FINANCIAL STATEMENT AMOUNTS Budgets and Budgetary Accounting – The City follows these procedures in establishing the budgetary data reflected in the financial statements: 1. On the third Monday in April, the City Manager submits to the City Commission a
proposed operating budget for the ensuing fiscal year commencing July 1 in accordance with Section 8.2 of the City Charter. The operating budget includes proposed expenditures and the means of financing them.
2. Prior to its adoption, a public hearing is conducted at City Hall to obtain taxpayer
comments. 3. No later than the third Monday in May, the budget is adopted by the City Commission in
accordance with the provisions of Section 8.6 of the City Charter. 4. The City Commission adopts the budget by functional categories as presented in the basic
financial statements. Any transfers of appropriation between functions must be approved by the City Commission. All unexpended appropriations lapse at fiscal year-end.
5. Formal budgetary integration is employed as a management control device for the
General Fund, all Special Revenue Funds, Debt Service Funds and Capital Project Funds. Informational budget summaries only are adopted for the Enterprise and Internal Service Funds. Such funds are not covered under the State of Michigan’s Public Act 621 nor the City’s General Appropriations Act.
6. The City Commission has the authority to amend the budget when it becomes apparent
that deviations in the original budget will occur and the amount of the deviation can be determined. Once originally adopted, the budget was formally amended two times during the fiscal year.

55
NOTE A – SUMMARY OF SIGNIFICANT ACCOUNTING POLICIES (Continued): 7. The legally adopted budgets for the General Fund, Special Revenue Funds, Debt Service
Funds and Capital Project Funds and the informational summaries for the Enterprise and Internal Service Funds are adopted on a basis consistent with generally accepted accounting principles (GAAP).
Cash Equivalents – For the purposes of balance sheet classification and the statement of cash flows, the City considers all highly liquid investments with a maturity of three months or less, when purchased, to be cash equivalents. Restricted assets which contain cash equivalents are included in analyzing the effect on cash and cash equivalents in the Statement of Cash Flows. Inventory – Inventory is valued at cost using both the first-in, first-out (FIFO) method and the average cost method. The costs of governmental fund type inventories are recorded as expenditures when consumed rather than when purchased. Prepaid Items – Certain payments to vendors reflect costs applicable to future accounting periods and are recorded as prepaid items in both government-wide and fund financial statements. Capital Assets – Capital assets, which include property, plant, equipment and infrastructure assets (e.g. streets, bridges, and sidewalks), are reported in the applicable governmental or business-type activities columns in the government-wide financial statements. Capital assets are defined by the City as assets with an initial, individual cost of more than $5,000 and an estimated useful life in excess of two years. All capital assets are valued at historical cost or estimated historical cost if actual historical cost is not available. Donated capital assets are valued at their fair value on the date donated. The cost of construction in progress includes interest costs incurred during the construction period. The amount of capitalized interest is determined using the weighted average amount of accumulated expenditures multiplied by the interest rate for the obligation incurred specifically to finance the construction of the asset. Depreciation on all exhaustible capital assets is charged as an expense against their operations in government-wide statements and proprietary financial statements. Accumulated depreciation is reported on government-wide and proprietary statement of net assets. Depreciation has been provided over the estimated useful lives using the straight-line method. The estimated useful lives are as f llows: o
L and improvements
20 years B uilding, structures and improvements
50 years
E quipment
5-35 years W ater and Sewage System
25-75 years
E lectric System – Component Unit
5-80 years S tormwater System
25 years
Infrastructure
20-50 years

56
NOTE A – SUMMARY OF SIGNIFICANT ACCOUNTING POLICIES (Continued): The cost of normal maintenance and repairs is charged to operations as incurred. Renewals and betterments are capitalized and depreciated over the remaining useful lives of the related properties. A portion of the depreciation provision for the electric component unit is being charged to the cost of fuel for those vehicles which groom and work the coal pile. Long-Term Liabilities – In the government-wide financial statements and proprietary fund types in the fund financial statements, long-term debt and other long-term obligations are reported as liabilities in the applicable governmental activities and business-type activities or proprietary fund type statement of net assets. Bond premiums and discounts, as well as issuance costs, are deferred and amortized over the life of the bonds using straight line amortization. Bonds payable are reported net of the applicable bond premium or discount. Bond issuance costs are reported as deferred charges and amortized over the term of the related debt. In the fund financial statements, governmental fund types recognize bond premiums and discounts, as well as bond issuance costs, during the current period. The face amount of debt issued is reported as other financing sources. Premiums received on debt issuance are reported as other financing sources and bond discounts are reported as other financing uses. Issuance costs, whether or not withheld from the actual debt received, are reported as debt service. Estimates – The preparation of financial statements in conformity with generally accepted accounting principles requires the use of estimates and assumptions that affect the reporting of certain assets, liabilities, revenues, and expenditures. Actual results may differ from estimated amounts. Property Taxes – Property taxes attach as an enforceable lien on property as of January 1. Taxes are levied no later than the third Monday in May and payable on July 1. Taxes receivable are recorded when levied, as the legal right to receive exists. However, such revenues are not normally received until after the 60 day period following the fiscal year-end. Accordingly, deferred revenue is being recognized for such amounts. The City bills and collects its own property taxes and also the taxes for the local school district, the Intermediate School District, and the County. Collections of local school taxes, Intermediate School District taxes, and County taxes, and their remittance are accounted for in the Agency Fund. Worker’s Compensation – The City’s policy is to pay worker’s compensation premiums as incurred. Any additional premiums or refunds resulting from experience adjustments are recorded in the year made or received, respectively. Comparative Data – Comparative data for the prior year has been presented in the accompanying financial statements in order to provide an understanding of the changes in the City’s financial position and operations.

57
NOTE A – SUMMARY OF SIGNIFICANT ACCOUNTING POLICIES (Continued): Compensated Absences – The City accrues accumulated unpaid vacation, sick leave, and benefit days and associated employee-related costs when earned (or estimated to be earned) by the employee. A liability for these amounts is reported in the governmental funds only if they have matured, for example, as a result of employee resignations and retirements. The non-current portion (the amount estimated to be used in subsequent fiscal years) for governmental funds is maintained separately and represents a reconciling item between the fund and government-wide presentations. Interfund Activity – Interfund activity is reported as loans, services provided, reimbursements or transfers. Loans are reported as interfund receivables and payables as appropriate and are subject to elimination upon consolidation. Services provided, deemed to be at market or near market rates, are treated as revenues and expenditures/expenses. Reimbursements occur when one fund incurs a cost, charges the appropriate benefiting fund and reduces its related cost as a result of the reimbursement. All other interfund transactions are treated as transfers. Transfers between governmental or proprietary funds are netted as part of the reconciliation to the government-wide financial statements. NOTE B – DEPOSITS AND INVESTMENTS: Cash Equivalents The following is a reconciliation of cash and investments for both the unrestricted and restricted assets for the primary government and its component units from the Statement of Net Assets:
Primary Government
Component
Units Fiduciary
Funds
Total Unrestricted:
Cash and cash eq uivalents $6,267,107 $8,284,246 $4,196,291 $18,747,644
In vestments 3,790,590 1,736,842 25,675,919 31,203,351
10,057,697 10,021,088 29,872,210 49,950,995 Restricted: Cash and cash eq uivalents 919,115 5,102,483 - 6,021,598
I nvestments 2,302,010 - - 2,302,010 3,221,125 5,102,483 - 8,323,608
TOTALS $13,278,822 $15,123,571 $29,872,210 $58,274,603
Custodial Credit Risk – Deposits Custodial credit risk is the risk that in the event of a bank failure, the City’s deposits may not be returned to it. State law does not require and the City does not have a deposit policy for custodial credit risk. The carrying amounts of the primary government, component unit and fiduciary funds deposits with financial institutions was $20,965,629 and the bank balance was $12,579,312. The bank balance is categorized as follows:
A mount insured by the FDIC or uncollateralized with securities held by the City in its name $1,077,256
Amount collateralized with securities held by the pledging financial institutions trust department in the City’s name: Collateralized and uninsured
11,502,056
$12,579,312

58
NOTE B – DEPOSITS AND INVESTMENTS (Continued): Investments As of June 30, 2007 the City had the following investments.
Investment Type Investment Maturities (In years) Fair Less More
Investment Type Value than 1 1-5 6-10 than 10 PRIMARY GOVERNMENT: Unrestricted Investments:
U.S. Government Agencies $3,790,590 $3,790,590 $- $- $-
Restricted Investments: U.S. Government Agencies 2,302,010 2,302,010 - - -
TOTAL INVESTMENTS $6,092,600 $6,092,600 $- $- $-
COMPONENT UNITS: U.S. Treasury Notes $- $- $- $- $- U.S. Government Agencies 369,320 349,370 19,950 - - Mutual Bond Funds 462,267 421,598 40,669 - - Mutual Equity Funds 425,264 425,264 - - - Time Deposits 479,991 384,173 95,818 - -
TOTAL INVESTMENTS $1,736,842 $1,580,405 $156,437 $- $-
FIDUCIARY FUNDS: U.S. Government Agencies $5,698,322 $1,491,020 $2,240,712 $1,724,638 $241,952 Domestic Corporation Bonds 2,540,674 1,400,320 637,760 240,145 262,449 Common, Pooled Fund 17,435,867 17,435,867 - - - Government National Mortgage Association
1,056 - -
521
535
TOTAL INVESTMENTS $25,675,919 $20,327,207 $2,878,472 $1,965,304 $504,936
Interest Rate Risk Interest rate risk is the risk that changes in interest rates will adversely affect the fair value of the City’s investments. The City does not have a formal investment policy that limits investment maturities as a means of managing its exposure to fair value losses arising from increasing interest rates. Credit Risk Michigan statutes (Act 196, PA 1997) authorize the City to invest in bonds, other direct obligations and repurchase agreements of the United States, certificates of deposits, savings accounts, deposit accounts or receipts of a bank which is a member of the FDIC and authorized to operate in this state, commercial paper rated at the time of purchase within the two highest classifications established by not less than two standard rating services and matures within 270 days from date of purchase, bankers’ acceptances of the United States banks, obligations of the State of Michigan and its political subdivisions, external investment pools, and certain mutual funds. Michigan law prohibits security in the form of collateral, surety bond, or another form for the deposit of public money.

59
NOTE B – DEPOSITS AND INVESTMENTS (Continued): Michigan statute (Act 314, PA 1965, as amended) authorizes the pension trust to invest in, with certain restrictions, stocks and mutual funds up to 60% of the system’s assets; investments in the general or separate account of life insurance companies; fixed income securities; investments in leased property; direct investments in property; investments in real estate loans; investments in small business or venture capital firms in Michigan; surplus funds pooled accounts; and bank or trust company collective investment funds. The City has no investment policy that would further limit its investment choices. The City’s investments in Mutual Bond Funds are rated from A1 to AAA by Moody’s. Ratings are not required for the City’s investment in U.S. Government Agencies or equity-type funds. The City’s investments are in accordance with statutory authority. Concentration of Credit Risk The City places no limit on the amount the City may invest in any one issuer. There were no investments subject to concentration of credit risk disclosure. NOTE C – RESTRICTED ASSETS – PROPRIETARY FUNDS AND COMPONENT UNIT: The enterprise fund has certain cash investment balances classified as restricted assets since their use is limited by applicable bond indentures and ordinances. The major provisions of the ordinances covering the bond indentures of the component unit (Board of Light and Power) and the Water Supply and Sewage Disposal Fund are as follows: 1. Rates – The component unit fund only shall charge and collect rates necessary to provide
net revenues sufficient to cover annual debt service not less than 1.3 times. 2. Receiving Fund – All system revenues will be paid into this fund, including interest
income, to the extent interest income is not retained in the construction or bond reserve funds.
3. Operation and Maintenance Fund – Monthly transfers must be made from the
Receiving Fund, which is used for initial deposit of all receipts, to the Operation and Maintenance Fund (included under current assets) to cover payment of next month’s estimated operating expenses.
4. Bond Reserve Fund – Monthly transfers must be made to the Bond Reserve Fund in an
amount equal to the maximum annual principal and interest on the revenue bonds. 5. Replacement/Maintenance Fund – Monthly transfers are to be made as necessary, up to
required levels, to make major repairs and replacements to the systems. 6. Bond and Interest Redemption – Transfers will be made from the Receiving Fund in
amounts sufficient to pay the current bond and interest maturities.

60
NOTE C – RESTRICTED ASSETS – PROPRIETARY FUNDS AND COMPONENT UNIT (Continued): 7. Bond Escrow Fund – Transfers were made to the Bond Escrow Fund to provide for the
normal retirement, including interest, of the capitalized leases, and revenue bond issues. Transfers will be made to the Bond and Interest Redemption Fund as the obligations become due.
8. Vacation, Sick Leave and Benefit Days Reserve – Transfers will be made to the vacation
and sick leave reserve to provide funding for accrued vacation, sick leave, and benefit day liabilities to be paid to employees upon retirement or termination.
9. Tax Payment Fund – Transfers will be made to the Tax Payment Fund in amounts
sufficient to make payments in lieu of taxes to the City of Marquette. Transfers into this fund are subordinate to payments of the above listed funds.
10. Plant Replacement – Risk Retention Fund – Transfers will be made, as the Board
determines necessary to the fund, to finance major system repairs or replacements and provide for potential claims not covered by existing insurance policies. Transfers to this fund are subordinate to transfers to the tax payment fund noted above.
11. Plant Improvement Fund – Transfers will be made to the Plant Improvement Fund as
the Board deems necessary for improvements, enlargements and extensions of the system. Transfers to this fund are subordinate to transfers to the Plant Replacement Fund.
12. Transfers from the Water Supply and Sewage Disposal Fund may be made to the General
Fund up to 40% of the surplus remaining at the end of the preceding fiscal year. 13. The balance of revenues remaining after the above requirements are met shall, at the
option of the governing agency, be transferred to the Bond Reserve Fund for the purpose of calling bonds.
The City Charter allows the transfer to the General Fund of 50% of the preceding year’s net income of public utilities. The amount of net income not transferred to the General Fund must be held in a reserve account for future capital outlay. Expenditures shall be charged to the reserve account. The composition of restricted asset accounts for the respective primary government enterprise and internal service funds and the respective component units are as follows:
Water Supply And Sewage
Disposal Fund
Marina Fund
Stormwater Utility Fund
Motor
Vehicle Equipment
Fund
Municipal
Service Center Fund
Primary Government
Total
Component Units
C ash and cash equivalents $769,063 $- $45,159 $659,119 $7,442 $1,480,783 $5,102,483 Investments 1,023,141 360,075 259,675 97,451 - 1,740,342 -
TOTALS $1,792,204 $360,075 $304,834 $756,570 $7,442 $3,221,125 $5,102,483

61
NOTE D – JOINT VENTURE – INVESTMENT IN WASTEWATER PLANT: The City has entered into a contract with the adjacent Townships of Chocolay and Marquette through the County of Marquette to construct and operate a wastewater plant known as the Marquette Area Wastewater Treatment Facility. Under the original agreement the City owned 79.8% of the facility, the Township of Marquette owned 5.5%, and the Township of Chocolay owned 14.7%. The cost of construction amounted to approximately $12,000,000 and was financed by Federal and State grants for 80% of the cost and $2,500,000 general obligation bonds issued by Marquette County. The full faith and credit of the City (refer to Note E) and the two Townships have been pledged. The total investment in the Facility at June 30, 2006 by the City is $2,954,906, including local contributions and its proportionate share of the net equity of the facility. In the Spring of 1993, the City of Marquette and Chocolay Township each sold 2.25% of capacity to Marquette Township. The new ownership percentages are; the City of Marquette owns 77.55%, Chocolay Township owns 12.45%, and Marquette Township owns 10.00%. The City utilizes the equity method of accounting for the activity in its investment in the Facility. Under the equity method, the investment is adjusted for any additional capital investments made and its proportionate share of the Facility’s results of operations. As required by Governmental Accounting Standards Board Statement # 14, the City’s equity interest is shown as an asset in the Water Supply and Sewage Disposal Fund. The separately issued audited financial statements can be obtained at the City’s Finance Department located at 300 West Baraga Avenue, Marquette, Michigan 49855. A summary of condensed financial information of the Facility, in the aggregate, is as follows:
A ssets $11,311,357 L iabilities 5,825,724 E quity 5,485,633 R evenues 1,236,181 E xpenses 1,667,346 O ther income 838,023 L oss from operations (431,165) C ity’s share of net gain 504,747 City’s share of capital investments 615,506
NOTE E – CAPITALIZED LEASE OBLIGATIONS: The City has a lease obligation with the County of Marquette as a result of the construction of the pumping station and sanitary sewers in conjunction with the construction of the Marquette Area Wastewater Treatment Facility. Accordingly, the City’s lease obligation corresponds to its share of the interest and principal payments required to retire the bond issue.

62
NOTE E – CAPITALIZED LEASE OBLIGATIONS (Continued): On July 28, 1998, the County of Marquette issued $1,485,000 Marquette County Refunding Bonds Unlimited Tax Series 1998 to refund in part the Marquette County Wastewater Treatment Bonds, Series 1978. This refunding bond issue changed the City’s lease obligation with the County of Marquette from 76.2% to 75.5% of the total debt resulting in a cumulative net savings of $60,257 for the City. The advance refunding also resulted in a difference between the reacquisition price and the net carrying amount of the old debt of $47,336. This difference, reported in the accompanying financial statements as deferred amounts on refunding, is being charged to operations through the year 2008 using the effective-interest method. The carrying amount of the City’s portion of the project at June 30, 2007 is $241,732. The City will finance debt requirements with the revenues of the water and sewer system. Data relating to the above agreement is summarized below:
Pump Station and Sanitary Sewers Interest Rate 4.3 – 4.4% Terms of principal maturities
December 1, 1998 to December 1, 2008
Annual maturities on the Water Supply and Sewage Disposal Fund capitalized lease obligations are as follows:
Refunded July 28, 1998 Capitalized Lease
Obligations Principal and interest maturities:
Year Ending June 30:
2008 $128,783 2009 123,525 Minimum lease payments 252,308 Less: Amount representing interest at the City’s ncremental borrowing rate of interest i
(10,576)
PRESENT VALUE OF
MINIMUM LEASE PAYMENTS
$241,732

63
NOTE F – LONG – TERM DEBT: The following is a summary of long-term debt transactions of the primary government and all
component units for the year ended June 30, 2007: Balance
June 30, 2006
Additions
Deductions
Balance
June 30, 2007
B USINESS-TYPE ACTIVITIES:
Water Supply and Sewage Disposal Fund: Lakeshore Park Place Note $112,277 $- $20,258 $92,019 State Act 94 Clean Water Assistance Loan 3,330,000 - 145,000 3,185,000 4.3-4.4%, 1998 Refunded Capitalized Lease Obligations 362,598 - 120,866 241,732 2.0% Revenue Bonds, Series 2004A 70,000 - 70,000 - 2.0%-4.1% Refunding Revenue Bonds 4,800,000 - 570,000 4,230,000 3.875-4.0% Water Supply and Sewage Disposal System Revenue Bonds, Series 2006
-
1,440,000
-
1,440,000
Accrued Compensated Absences 134,735 16,824 - 151,559 Marina Fund: 2.0% Revenue Bonds, Series 2004A 600,000 - 70,000 530,000 Stormwater Utility Fund:
4.1-5.0%, Revenue Bonds, Series 1995 1,065,000 - 245,000 820,000
TOTAL BUSINESS-TYPE ACTIVITIES $10,474,610 $1,456,824 $1,241,124 $10,690,310
G OVERNMENTAL ACTIVITIES:
Lakeshore Park Place Note $112,318 $- $20,266 $92,052
GEMS Installment Note 200,086 - 46,699 153,387 State Infrastructure Bank Note 1,077,354 - 82,873 994,481 2003 General Obligation Bonds 3,650,000 - 150,000 3,500,000 2005 General Obligation Bonds 5,000,000 - 5,000,000 -
2006 Limited Tax General Obligation Street Improvement Bonds - 5,475,000 - 5,475,000
2007 Limited Tax General Obligation Bonds - 5,135,000 - 5,135,000
Department of Transportation Bonds 1,075,000 - 340,000 735,000
1998 Building Authority Refunding Bonds 4,005,000 - 185,000 3,820,000
1998 Building Authority Bonds - Lakeview Arena 235,000 - 110,000 125,000
Marquette County Solid Waste Landfill Authority Bonds, Series 1988 (Revised July 30, 1994)
59,037
-
17,950
41,087
2007 High Street Bonds - 209,061 - 209,061
Accrued Compensated Absences 977,089 - 39,396 937,693
TOTAL GOVERNMENTAL ACTIVITIES
$16,390,884 $10,819,061 $5,992,184 $21,217,761
COMPONENT UNITS:
Board of Light and Power Electric Utility
4.8 - 5.125% Revenue Bonds, Series 1993 $8,143,825 $- $2,695,000 $5,448,825
Peter White Public Library
1997 General Obligation Bonds - Library Improvement 3,315,000 - 3,095,000 220,000
1998 Building Authority Bonds – Library 470,000 - 225,000 245,000 2006 General Obligation Unlimited Tax Refunding Bonds – Library Improvement
-
2,935,000
-
2,935,000
Accrued compensated absences 77,310 16,670 - 93,980 Downtown Development Authority:
Note payable - tractor 6,039 - 6,039 - 2001 Tax Increment Bonds 214,286 - 71,429 142,857 2005 Tax Increment Bonds 642,857 - 107,143 535,714 Marquette Housing Commission: Bonds and notes 118,021 939,046 14,082 1,042,985 Accrued compensated absences 66,755 4,484 - 71,239
TOTAL COMPONENT UNITS $13,054,093 $ 3,895,200 $6,213,693 $10,735,600
64
NOTE F – LONG – TERM DEBT (Continued): Internal service funds predominantly serve the government funds. Accordingly, long-term liabilities for them are included as part of the above totals for governmental activities. At year-end, $104,893 of internal service funds compensated absences is included in the above amounts. Also, for the governmental activities, compensated absences are generally liquidated by the general fund. The City’s component units (Board of Light and Power and Peter White Library), the Marina, Water Supply and Sewage Disposal Fund revenue bonds, general obligation bonds, and capital lease obligations outstanding are recorded in the respective Component Unit and Enterprise Fund. The Component Units’ debt and the Enterprise Fund debt are expected to be repaid from proprietary revenues. As of June 30, 2000, the City had a secured credit agreement with maximum borrowings of $750,000 and an interest rate of 4.88% per annum for the purpose of making certain street and utility improvements along Lakeshore Boulevard in conjunction with the Lakeshore Park Place special assessment project. At June 30, 2000, the amount initially borrowed was $399,926 of which $199,926 was recorded in the Water Supply and Sewage Disposal Fund and $200,000 was recorded as Governmental Activities long-term debt. The note will be paid off in ten consecutive and equal annual principal and interest payments on the outstanding principal amounts due each year, beginning August 5, 2001. On April 1, 1996, the City of Marquette, Michigan issued $6,435,000 Water Supply and Sewage Disposal System Revenue Bonds, Series 1996. The Water Supply and Sewage Disposal System Revenue Bonds were issued for the purpose of financing the cost of expanding and making certain improvements to the water supply and filtration system of the City in accordance with a resolution adopted by the City Commission of the City on March 11, 1996, pursuant to Act 94, Public Acts of Michigan, 1933, as amended. On November 1, 1995, the City of Marquette, Michigan, issued $2,740,000 Stormwater Revenue Bonds. The Stormwater Revenue Bonds were issued for the purpose of acquiring and constructing certain stormwater utility improvements in the City in accordance with a resolution adopted by the City Commission of the City, on August 28, 1995 pursuant to Act 94, Public Acts of Michigan, 1934, as amended. On April 8, 2002, the City issued $367,859 of GEMS Installment Notes for the purpose of purchasing computer equipment and software to be used for the City’s general finance operations. The notes will be paid off in eight annual principal installments beginning April 1, 2004 and ending on April 1, 2010. Interest shall be payable semi-annually beginning October 1, 2002 at a rate equal to 4.60% per annum. On December 17, 1992, the City of Marquette, Michigan, through the Michigan Municipal Bond Authority, issued $1,790,000 Michigan Transportation Fund Bond, Series 1992. The Michigan Transportation Bonds were issued for the purpose of making certain street improvements in the City in accordance with a resolution adopted by the City Commission of the City, on November 3, 1992, pursuant to the provisions of Act 175, Public Acts of Michigan, 1952, as amended. The Department

65
NOTE F – LONG – TERM DEBT (Continued): of Transportation bonds are for the purpose of constructing roadway improvements and were used in part for the downtown renovation/construction project and in part for match purposes on a Small Cities Grant Project. The bonds will be paid by the General Fund through a transfer of monies to the Major and Local Street Funds. On June 24, 1999, the City issued $2,480,000 in Michigan Transportation Fund Refunding Bonds, Series 1999 with interest rates ranging from 3.5% to 4.75% to advance refund $2,820,000 of outstanding “Michigan Transportation Fund Bonds, Series 1986" dated September 25, 1986 (the “1986 Prior Bonds”); the “Michigan Transportation Fund Bonds, Series 1989" dated August 10, 1989 (the “1989 Prior Bonds”); and the “Michigan Transportation Fund Bonds, Series 1999" 7.1%, maturing in the years 1999 through 2009. There were no net proceeds (after payment of $200,000 in underwriting fees, insurance, and other issuance costs). As a result, the 1986, 1989, and 1992 issue bonds maturing in fiscal years 1999 through 2009 are considered to be defeased and the liability for those bonds has been removed from Governmental Activities long-term debt balance. The proceeds of the new bonds were placed in an irrevocable trust to provide for all future debt service payments on the old bonds. Accordingly, the trust account assets and the liability for the defeased bonds are not included in the City’s financial statements. On June 30, 2007, $730,000 of bonds outstanding are considered defeased. In August of 1991, the City of Marquette, Michigan, through the Michigan Municipal Bond Authority, issued $5,200,000 Building Authority Bonds. The City of Marquette Building Authority Municipal Obligations were issued pursuant to Act No. 31, of the Public Acts of 1948, as amended (ΑAct 31") for the construction of a Municipal Service Center. The Municipal Service Center houses administrative offices and employee work areas for the departments of Engineering, Public Works,Water Supply and Sewage Disposal, Parks & Recreation, and Motor Pool, provides storage and warehousing for supplies and materials, and equipment storage and maintenance areas, contains a fuel depot and provides parking areas and outside materials storage. The principal of and interest on the City of Marquette Building Authority Municipal Obligations have been paid off, and were secured by a statutory lien upon, cash rental payments to be paid by the City of Marquette to the City of Marquette Building Authority pursuant to a Contract of Lease between the parties for the Municipal Service Center constructed with the proceeds of the City of Marquette Building Authority Municipal Obligations. The full faith and credit of the City of Marquette has been pledged for the payment of the cash rental under the Contract of Lease. The City of Marquette has agreed to levy ad valor taxes each year to the extent necessary for the payment of such cash rentals, subject to applicable constitutional, statutory and charter limitations. On June 16, 1998, the City issued $4,945,000 in Building Authority Refunding Bonds, Series 1998 with interest rates ranging from 3.8% to 5.125% to advance refund $4,455,000 of outstanding Building Authority Bonds, Series 1991 with interest rates ranging from 6.00% to 6.875% maturing in fiscal years 2002 through 2021. The 1998 Issue net proceeds of $4,790,820 (after payment of $154,180 in underwriting fees, insurance, and other issuance costs) were used to purchase U.S. government securities. Those securities were deposited in an irrevocable trust with an escrow agent to provide for all future debt service interest and principal payments on the 1991 Issue refunded bonds. As a result, the 1991 Issue bonds maturing in fiscal years 2002 through 2021 are considered to be defeased and the liability for those bonds has been removed from the Governmental Activities long-term balance.

66
NOTE F – LONG -TERM DEBT (Continued): Also, the irrevocable trust account assets and the liability for the defeased bonds are not included in the City’s financial statements. On June 30, 2007, $3,695,000 of bonds outstanding are considered defeased. The 1998 Building Authority Bonds - Lakeview Arena were issued for the purpose of defraying the cost of renovating, constructing, furnishing and equipping improvements to the existing Lakeview Arena. The bonds were issued pursuant to the provisions of Act 31 of P.A. 1948, as amended. The Bond’s principal and interest are payable from lease payments required to be paid by the City to the Building Authority pursuant to the Contract of Lease between the City and the Authority. On November 3, 1988, the City of Marquette authorized the sale of Marquette County Solid Waste Landfill Authority Bonds, Series 1988, in the amount of $2,675,000 to pay for part of the cost of acquiring, constructing, and establishing a sanitary landfill and a solid waste management system. The City’s proportionate share of the bonds is 31 percent or $798,250. The City’s portion of the bond’s principal and interest are payable from General Fund tax levies. In July of 1993, the Authority advance refunded a portion of this issue maturing in fiscal years 1997-2009 with the 1993B Issue, Refunding Bonds. On December 27, 1997, the City of Marquette, Michigan, issued $4,500,000 General Obligation Unlimited Tax Library Improvement Bonds for the purpose of defraying a portion of the cost of expanding and renovating the Peter White Public Library located in the City of Marquette. The bonds were issued pursuant to the provisions of Act 227, Public Acts of Michigan, 1985, as amended. The full faith and credit of the City of Marquette are pledged for the payment of the principal and of the interest on the bonds when due. On October 3, 2006 the City advance refunded a portion of this issue maturing in fiscal years 2009-2018 with the General Obligation Unlimited Tax Library Improvement Bonds, Series 2006. On October 3, 2006, the City issued $2,935,000 in General Obligation Unlimited Tax Refunding Bonds, Series 2006 with an interest rate of 4.0% to advance refund $2,885,000 of outstanding General Obligation Unlimited Tax Library Improvement Bonds, Series 1997 maturing in fiscal years 2009 through 2018. The 2006 issue net proceeds of $2,896,462 (after payment of $81,939 in underwriting fees, insurance, and other issuance costs plus an additional $43,401 reoffering premium) were used to purchase U.S. government securities. Those securities were deposited in an irrevocable trust with an escrow agent to provide for all callable future debt service payments on the 1997 General Obligation Unlimited Tax Library Improvement Bonds. As a result, the 1997 General Obligation Unlimited Tax Library Improvement Bonds are considered to be defeased and the liability for those has been removed from the Governmental Activities long-term debt balance. On June 30, 2007, $220,000 remains outstanding on the 1997 General Obligation Unlimited Tax Library Improvement Bonds as this amount was not included in the bond refunding.

67
NOTE F – LONG -TERM DEBT (Continued): The advance refunding resulted in a difference between the reacquisition price and the net carrying amount of the old debt of $50,000. This difference has been charged to operations as a component of interest expense in the Statement of Activities. The transaction was undertaken to reduce the total debt service payments and accordingly resulted in an economic gain of $106,085. On June 16, 1998, the City of Marquette Building Authority, issued $2,000,000 Building Authority Bonds (Peter White Public Library) Series 1998 for the purpose of defraying the cost of renovating, constructing, furnishing and equipping improvements to the existing Peter White Public Library. The bonds were issued pursuant to the provisions of Act 31 of P.A. 1948, as amended. The bond’s principal and interest are payable from lease payments required to be paid by the City of Marquette to the Building Authority pursuant to the Contract of Lease between the City and the Authority. When all of the Building Authority Bonds have been retired the Authority shall convey all rights, title, and interest to the City of Marquette. Pursuant to Section 162.2 of Act 197, Public Acts of Michigan, as amended on October 11, 2001, the Marquette Downtown Development Authority (DDA) issued Tax Increment Bonds in the amount of $500,000 at a 4.6% interest rate designated as Tax Increment Bonds, Series 2001, to finance a portion of the costs of certain public improvements within the downtown district. The principal and interest payable on the bonds shall be repaid solely from tax increment revenues received by the DDA. On July 25, 2003, the City issued $1,243,100 of State Infrastructure Bank Notes for the purpose of financing transportation infrastructure improvements through the County Road (CR) 550 Flood Repair and Spring Street Reconstruction project. The notes will be paid off in 15 annual principal installments beginning July 25, 2004 and ending July 25, 2019, plus interest at the rate of zero percent. On December 23 2003, the City issued $3,935,000 in General Obligation Limited Tax Bonds with interest rates ranging from 2.0% to 4.55%. The Bonds were issued pursuant to the resolution duly adopted by the City on November 24, 2003 for the purpose of reimbursing the City for certain costs relating to the acquisition of waterfront property for the City’s park system, and paying the costs of designing, engineering, acquiring, preparing, constructing and equipping various park improvements. On March 29, 2007, the City issued $5,135,000 in General Obligation Unlimited Tax Refunding Bonds, Series 2007 with interest rates varying from 5.25% to 5.5% to advance refund $5,000,000 of outstanding General Obligation Limited Tax Bonds, Series 2005 maturing in fiscal years 2008 through 2025. The 2027 issue net proceeds of $4,996,644 (after payment of $142,148 in underwriting fees, insurance, and other issuance costs plus an additional $3,792 reoffering premium) were used to purchase U.S. government securities. Those securities were deposited in an irrevocable trust with an escrow agent to provide for all callable future debt service payments on the 2005 General Obligation Unlimited Refunding Bonds. As a result, the 2005 General Obligation Unlimited Tax Refunding Bonds are considered to be defeased and the liability for those has been removed from the Governmental Activities long-term debt balance.

68
NOTE F – LONG -TERM DEBT (Continued): The advance refunding resulted in a difference between the reacquisition price and the net carrying amount of the old debt of $135,000. This difference has been charged to operations as a component of interest expense in the Statement of Activities. The transaction was undertaken to reduce the total debt service payments and accordingly resulted in an economic gain of $458,550. On March 9, 2004, the City issued $3,470,000 of State of Michigan Act 94 Clean Water Assistance Loan for the purpose of rehabilitation of the Hawley Street, Pine Street, Lake Street, and Baraga Avenue sewage pump stations. The loan will be paid off in annual principal and interest payments over 20 years with an interest rate of 2.125%. On November 4, 2003, the City issued $5,990,000 in Water and Sewer Refunding Revenue Bonds with an interest rate ranging from 2.0% to 4.1% to advance refund $5,820,000 of outstanding 1996, 1977 and 1989 Water and Sewer Revenue Bonds with interest rates ranging 3.85% to 7.0%. The net proceeds of $5,946,012 (after payment of $122,927 in underwriting fees, insurance, and other issuance costs plus an additional $11,484 in Prior Issue Debt Service fund monies and a $67,455 reoffering premium) were used to purchase U.S. government securities. Those securities were deposited in an irrevocable trust with an escrow agent to provide for all callable future debt service payments on the 1996, 1977 and 1989 Water and Sewer Revenue bonds. As a result, the 1996, 1977 and 1989 Water and Sewer Revenue bonds are considered to be defeased and the liability for those bonds has been removed from the government-wide statement of net assets. On June 30, 2006, $4,765,000 of bonds outstanding are considered defeased. The advance refunding resulted in a difference between the reacquisition price and the net carrying amount of the old debt of $170,000. This difference, reported in the accompanying financial statements as a deduction from bonds payable, is being charged to operations through the year 2016 using the effective-interest method. On February 18, 2004, the City issued $140,000 in Water and Sewer Refunding Revenue Bonds, Series 2004A with an average interest rate of 2.0 percent to advance refund $125,000 of outstanding Water and Sewer Revenue Bonds, Series 1986 with an interest rate ranging 6.1% to 9.5%. The net proceeds of $125,365 (after payment of $14,821 in underwriting fees, insurance, and other issuance costs) were used to purchase U.S. government securities. Those securities were deposited in an irrevocable trust with an escrow agent to provide for all future callable debt service payments on the Water and Sewer Revenue Bonds, Series 1986. As a result, the 1986 Series bonds are considered to be defeased and the liability for those bonds has been removed from the government-wide statement of net assets. On June 30, 2006, all of bonds outstanding are considered defeased. The advance refunding resulted in a difference between the reacquisition price and the net carrying amount of the old debt of $15,000. This difference, reported in the accompanying financial statements as a deduction from bonds payable, is being charged to operations through the year 2016 using the effective-interest method.

69
NOTE F – LONG -TERM DEBT (Continued): On February 18, 2004, the City issued $690,000 in Marina Refunding Revenue Bonds, Series 2004A with an average interest rate of 2.0 percent to advance refund $655,000 of outstanding Marina Revenue Bonds, Series 1994 with an interest rate ranging 4.75% to 5.8%. The net proceeds of $669,508 (after payment of $18,512 in underwriting fees, insurance, and other issuance costs) were used to purchase U.S. government securities. Those securities were deposited in an irrevocable trust with an escrow agent to provide for all future callable debt service payments on the Marina Revenue Bonds, Series 1994. As a result, the 1994 Series bonds are considered to be defeased and the liability for those bonds has been removed from the government-wide statement of net assets. On June 30, 2006, $595,000 of bonds outstanding are considered defeased. The advance refunding resulted in a difference between the reacquisition price and the net carrying amount of the old debt of $35,000. This difference has been charged to operations as a component of interest expense in the Statement of Activities. The transaction was undertaken to reduce the total debt service payments and accordingly resulted in an economic gain of $458,550. On May 26, 2005, the City issued $5,000,000 in General Obligation Limited Tax Bonds with interest rates ranging from 3.27% to 4.70%. The Bonds were issued pursuant to the resolution duly adopted by the City on January 31, 2005 for the purpose of paying all or part of the cost of acquiring, improving and equipping real property within and without the City for use for authorized purposes. On October 31, 2006, the City issued $5,475,000 in Limited Tax General Obligation Bonds, Series 2006, at an interest rate of 4.0%. The Bonds were issued for the purpose of paying all or part of the cost of making major and local street improvements throughout the City. The Bonds are issued pursuant to the provisions of Act 34, Public Acts of Michigan, 2001, as amended, and a resolution of the City. The City has pledged its limited tax, full faith and credit as a security for the payment of the principal and interest on the Bonds. On December 20, 2006, the City issued $1,440,000 in Water Supply and Sewage Disposal System Revenue Bonds, Series 2006 at interest rates of varying from 3.875% to 4.0%. The Bonds were issued for the purpose of the acquisition, construction and installation of water filtration membranes and related equipment and piping in the City. The Bonds were issued pursuant to the provisions of Act 94 of the Michigan Public Acts of 1933, as amended, and Ordinances No. 514, 499 and 538 of the City. The Bonds are payable solely from the net revenues of the City’s water supply and sewage disposal system and any addition or supplement thereto including earnings on investments as described in the Ordinances and in Section 3 of Act 94. Pursuant to Section 16(2) of Act 197, Public Acts of Michigan, 1975, as amended, on April 29, 2005 the Marquette Downtown Development Authority (DDA) issued Tax Increment Bonds in the amount of $750,000 at a 3.65% interest rate designated as Tax Increment Bonds, Series 2005, to finance a portion of the costs of certain public improvements within the downtown district. The principal and interest payable on the bonds shall be repaid solely from tax increment revenues received by the DDA.

NOTE F – LONG -TERM DEBT (Continued): Annual maturities on Component Unit debt are as follows:
Maturities
Board of Light
& Power Revenue Bonds Series 1001 A
1997
G.O. Bonds Library
Improvement
2006 G.O U.T. Refunding
Bonds- Library
1998 Building Authority
Bonds - Library
DDA
2001 Tax Increment
Bonds
DDA
2005 Tax Increment
Bonds
Marquette Housing
Commission Notes & Bonds
Year Ending June 30:
2008 $2,790,000 $220,000 $25,000 $245,000 $71,429 $107,143 $57,172 2009 2,700,000 - 245,000 - 71,428 107,143 63,489 2010 - - 250,000 - - 107,143 66,251 2011 - - 260,000 - - 107,143 69,137 2012 - 275,000 - - 107,142 72,153 2013-2017 - - 1,535,000 - - - 332,773 2018-2020 - - 345,000 - - - 382,010 Discount (41,175) - - - - - -
Principal 5,448,825 220,000 2,935,000 245,000 142,857 535,714 1,042,985 Interest 204,104 5,060 736,100 11,148 5,816 59,661 374,478
TOTAL $5,652,929 $225,060 $3,671,100 $256,148 $148,673 $594,375 $1,417,463
On October 11, 2001 the Board of Light and Power issued Revenue Bonds in the amount of $21,815,150 with interest rates ranging from 4.8 – 5.125% to finance the costs of improvements to its physical plant. The principal and interest payable on the bonds shall be repaid solely from revenues generated by the system. Annual maturities on the Business-Type Activities debts are as follows:
Stormwater Marina Utility Fund Water Supply and Sewage Disposal Fund Fund State Act 94 12/01/98
Year 11/01/95 Lakeshore Clean Water Capitalized 11/04/03 12/20/2006 2/18/04 Ending Revenue Park Place Assistance Lease Revenue Revenue Revenue June 30, Bonds Note Loan Obligations Bonds Bonds Bonds
2008 $255,000 $21,289 $145,000 $120,866 $590,000 $120,000 $70,0002009 275,000 22,343 150,000 120,866 480,000 125,000 75,0002010 290,000 23,448 155,000 - 410,000 130,000 70,0002011 - 24,939 155,000 - 410,000 135,000 75,0002012 - - 160,000 - 430,000 140,000 75,000
2013 - - 165,000 - 450,000 145,000 80,0002014 - - 165,000 - 470,000 150,000 85,0002015 - - 170,000 - 485,000 160,000 -2016 - - 175,000 - 505,000 165,000 -2017 - - 180,000 - - 170,000 -
2018 - - 180,000 - - - -2019 - - 185,000 - - - -2020 - - 190,000 - - - -2021 - - 195,000 - - - -2022 - - 200,000 - - - -
2023 - - 200,000 - - - -2024 - - 205,000 - - - -2025 - - 210,000 - - - -
Principal 820,000 92,019 3,185,000 241,732 4,230,000 1,440,000 530,000Interest 63,250 11,615 716,975 10,576 808,640 305,381 68,075
$883,250 $103,634 $3,901,975 $253,308 $5,038,640 $1,745,381 $598,075
70

NOTE F - LONG-TERM DEBT (Continued):
Annual maturities on the Governmental Activities are as follows:
1998 Building MarquetteState 2006 LTGO 1998 Building Authority County
Year Lakeshore GEMS Infrastructure 2003 General 2007 General Street Transportation Authority Bonds, Sanitary LanEnding Park Place Installment Bank Obligation Obligation Improvement Bond Fund Bonds, Lakeview Authority BoJune 30, Note Note Note Bonds Bonds Bonds Loans Payable Refunding Arena Series 198
2008 $ 21,297 $ 48,847 $ 82,873 $ 170,000 $ 150,000 $ 275,000 $ 355,000 $ 190,000 $ 125,000 $ 12009 22,351 51,095 82,873 175,000 175,000 285,000 185,000 205,000 - 22010 23,457 53,445 82,873 175,000 190,000 295,000 195,000 210,000 -2011 24,947 - 82,873 155,000 200,000 305,000 - 225,000 -2012 - - 82,873 190,000 210,000 320,000 - 235,000 -2013 - - 82,873 190,000 225,000 330,000 - 245,000 -2014 - - 82,873 200,000 240,000 345,000 - 260,000 -2015 - - 82,873 210,000 250,000 360,000 - 275,000 -2016 - - 82,873 220,000 270,000 375,000 - 285,000 -2017 - - 82,873 230,000 285,000 390,000 - 300,000 -2018 - - 82,873 235,000 300,000 405,000 - 320,000 -2019 - - 82,878 245,000 320,000 420,000 - 335,000 -2020 - - - 260,000 340,000 440,000 - 355,000 -2021 - - - 270,000 355,000 455,000 - 380,000 -2022 - - - 280,000 375,000 475,000 - - -2023 - - - 295,000 395,000 - - -2024 - - - - 415,000 - - -2025 - - - - 440,000 - - -
Principal 92,052 153,387 994,481 3,500,000 5,135,000 5,475,000 735,000 3,820,000 125,000 4Interest 11,619 14,342 - 1,382,822 2,966,020 44,314 44,314 1,611,561 5,688
Total $ 103,671 $ 167,729 $ 994,481 $ 4,882,822 $ 8,101,020 $ 5,519,314 $ 779,314 $ 5,431,561 $ 130,688 $ 4
71

72
NOTE F – LONG -TERM DEBT (Continued): Annual principal and interest requirements on indebtedness are as follows:
Governmental Activities Business Type Activities Component Units Principal Interest Principal Interest Principal Interest 2008 $1,437,563 $891,529 $1,322,155 $342,842 $3,515,744 $352,387 2009 1,202,860 809,907 1,248,209 295,780 3,187,060 223,498 2010 1,433,836 760,580 1,078,448 251,975 423,394 154,174 2011 992,820 709,978 799,939 218,403 436,280 137,177 2012 1,037,873 669,385 805,000 190,487 454,295 119,551 2013-2017 5,899,365 2,654,696 3,720,000 513,169 1,867,773 355,970 2018-2022 6,730,751 1,230,995 950,000 136,850 685,835 53,610 2023-2027 1,545,000 129,483 615,000 35,009 - -
Totals $20,280,068 $7,856,553 $10,538,751 $1,984,515 $10,570,381 $1,396,367
NOTE G – INTERFUND BALANCES: The amounts of interfund receivables and payables are as follows:
Fund
Interfund
Receivable
Fund
Interfund Payable
PRIMARY GOVERNMENT:
General $157,492
M ajor Street
$15,237
N onmajor enterprise (Marina) 142,255 Subtotal 157,492
Subtotal 157,492
L ocal Street 193,354 General 514,169 N onmajor Special Revenues 84,737 Water/Sewer 57,500 F orestland Debt Service 298,078
Stormwater 1,500
I nternal Service 3,000
Subtotal 576,169
Subtotal 576,169 Capital Projects 1,693,175 General 81,535 Major Street 146,862 Local Street 243,700 Stormwater 148,640 Water/Sewer 1,072,438
Subtotal 1,693,175 Subtotal 1,693,175 T rust and Agency 250,000 G eneral 250,000
Subtotal 250,000 Subtotal 250,000 PRIMARY GOVERNMENT AND COMPONENT UNIT:
Internal Service
1,538
Marquette Area Wastewater Management Authority
1,538
Capital Projects
344,526
Downtown Development Authority Component Unit –
344,526
Subtotal 346,064 Subtotal 346,064 TOTAL REPORTING ENTITY $3,022,900
TOTAL REPORTING ENTITY $3,022,900

73
NOTE H – INTERFUND TRANSFERS IN AND TRANSFERS OUT: All internal balances resulted from the time lag between the dates that (1) interfund goods and services are provided or reimbursable expenditures occur, (2) transactions are recorded in the accounting system, and (3) payments between funds are made. The interfund transfers for the year are as follows:
Fund
Transfers In
Fund
Transfers Out
PRIMARY GOVERNMENT:
General $450,319 Capital Projects $81,965
Nonmajor Enterprise 357,345 N onmajor Governmental 11,009
Subtotal 450,319 Subtotal 450,319
Major Street 757,456
General 2,664,495
Local Street 681,269
Nonmajor Governmental 1,116,819 Capital Projects 81,534
Nonmajor Enterprise 27,417 Subtotal 2,664,495 Subtotal 2,664,495
Capital Projects 1,611,640
Major Street 146,862
L ocal Street 243,700 Major Enterprise 1,221,078
Subtotal 1,611,640 Subtotal 1,611,640
Debt Service 383,413 I nternal Service 383,413 TOTAL REPORTING ENTITY $5,109,867
TOTAL REPORTING ENTITY $5,109,867
Transfers are used to (1) move revenues from the fund that statute or budget requires to collect them to the fund that statute or budget requires to expend them, (2) move receipts restricted to debt service from the funds collecting the receipts to the debt service fund as debt service payments become due, and (3) use unrestricted revenues collected in the general fund to finance various programs accounted for in other funds in accordance with budgetary authorizations. NOTE I – ADVANCES TO/FROM COMPONENT UNITS: The advance to Downtown Development Authority in the amount of $29,158 was written off. NOTE J – CAPITAL ASSETS: A summary of changes in governmental activities capital assets including internal service funds capital assets is as follows:
Balance at Balance at June 30, 2006 Additions Disposals June 30, 2007
GOVERNMENTAL ACTIVITIES: Investment in joint venture $3,524,660 $- $- $3,524,660Construction in progress 4,271,067 2,484,222 (3,268,286) 3,487,003Land 11,157,766 299,691 - 11,457,457
Total Capital Assets, not being depreciated 18,953,493 2,783,913 (3,268,286) 18,469,120

74
NOTE J – CAPITAL ASSETS (Continued): Balance at Balance at
June 30, 2006 Additions Disposals June 30, 2007 Land improvements $6,910,388 $64,000 $- $6,974,388Buildings 4,971,467 416,232 - 5,387,699Building improvements 11,870,920 74,084 (19,000) 11,926,004Furniture and equipment 11,835,727 518,217 (756,826) 11,597,118Infrastructure 31,526,962 3,808,859 - 35,335,821
Total Capital Assets, being depreciated 67,115,464 4,881,392 (775,826) 71,221,030
Less Accumulated Depreciation: Land improvements (4,234,835) (236,173) - (4,471,008) Buildings (2,820,443) (84,429) - (2,904,872) Building improvements (5,843,682) (430,873) - (6,274,555) Furniture and equipment (7,750,131) (747,567) 736,678 (7,761,020) Infrastructure (17,072,040) (1,194,668) - (18,266,708)
Total Accumulated Depreciation (37,721,131) (2,693,710) 736,678 (39,678,163)
Governmental ActivitiesCapital Assets, net
$48,347,826
$4,971,595
$(3,307,434)
$50,011,987
Depreciation expense for the governmental activities was charged to the following functions and activities of the primary government:
Governmental Activity: Depreciation – unallocated $1,916,607 Internal Service Funds charged to above activities 777,103
Total Depreciation Expense – Governmental Activities $2,693,710 A summary of changes in business-type activities capital assets is as follows:
Balance at Balance at June 30, 2006 Additions Disposals June 30, 2007
BUSINESS-TYPE ACTIVITIES: Investment in joint venture $2,992,555 $- $(37,592) $2,954,963 Land 102,500 - (102,500) -Construction in progress - 2,024,645 - 2,024,645
Total Capital Assets, not being depreciated 3,095,055 2,024,645 (140,092) 4,979,608 Land improvements 3,128,861 - - 3,128,861Buildings and building improvements 15,436,309 - (1,939,625) 13,496,684Furniture and equipment 4,122,415 242,880 - 4,365,295Infrastructure 35,905,021 474,290 - 36,379,311
Total Capital Assets, being depreciated 58,592,606 717,170 (1,939,625) 57,370,151 Less Accumulated Depreciation: Land improvements (1,243,589) (120,570) - (1,364,159)Buildings and building improvements (5,080,539) (331,228) 829,623 (4,582,144)Furniture and equipment (1,067,391) (229,519) - (1,296,910)Infrastructure (9,112,296) (831,620) - (9,943,916)
Total Accumulated Depreciation (16,503,815) (1,512,937) 829,623 (17,187,129)
Business-Type Activities Capital Assets, net
$45,183,846 1,228,878
(1,250,094)
$45,162,630

75
NOTE J – CAPITAL ASSETS (Continued): Depreciation expense for the business-type activities was charged to the following functions and activities of the primary government:
Business-Type Activities: Water Supply and Sewage Disposal $1,082,520 Stormwater Utility 272,254 Marina 135,135 Intermodal Transportation Terminal 23,028
Total Depreciation Expense – Business-Type Activities $1,512,937 A summary of component unit’s capital assets is as follows:
Board of Peter White Downtown Marquette Total Light and Public Development Housing Component
Power Library Authority Commission Units COMPONENT UNITS: Land $1,123,073 $114,704 $- $187,180 $1,424,957Construction in progress - - - 177,327 177,327
Total Capital Assets, not being depreciated
1,123,073 114,704
-
364,507
1,602,284
Land improvements - - 2,883,186 940,011 3,823,197Buildings and improvements 11,171,291 8,848,096 - 9,328,020 29,347,407Furniture and equipment 105,438,687 2,232,468 92,371 667,386 108,430,912
Total Capital Assets, being depreciated
116,609,978 11,080,564
2,975,557
10,935,417
141,601,516
Less Accumulated Depreciation: Land improvements - - (265,533) - (265,533)Buildings and improvements - (3,270,327) - - (3,270,327)Furniture and equipment - (1,892,207) (74,296) - (1,966,503)Unallocated (79,375,376) - - (7,672,963) (87,048,339)
Total Accumulated Depreciation (79,375,376) (5,162,534) (339,829) (7,672,963) (92,550,702)
Component Units Capital Assets, net
$38,357,675
$6,032,734
$2,635,728
$3,626,961
$50,653,098
Depreciation expense for the component units was charged to the following functions:
Component Units: Board of Light and Power $3,095,911 Peter White Public Library 488,912 Downtown Development Authority 73,890 Marquette Housing Commission 389,424
Total Depreciation Expense – Component Units $4,048,137

76
NOTE K – UNEARNED REVENUES: Unearned revenues are those where asset recognition criteria have been met, but for which revenue recognition criteria have not been met.
1. The General Fund has reported unearned revenue of $8,463,534. Of this amount, $8,211,900 relates to the 2007 tax levy assessed May 1, 2007 and payable July 1, 2007, $12,417 relates to delinquent taxes receivable not collected within sixty days after year-end, and $239,217 relates to the special assessment receivable which are not available resources within the next year.
2. The Enterprise Funds have reported unearned revenue of $23,971. This amount, $23,971
represents the portion of special assessment receivables which are not available resources within the next year.
3. The Component Units have reported unearned revenue of $1,554,448. This amount
$1,554,448 relates to their portion of the 2007 tax levy. NOTE L – DEFINED BENEFIT PENSION PLAN – MUNICIPAL EMPLOYEES RETIREMENT SYSTEM OF MICHIGAN: Plan Description The City contributes to the Municipal Employees Retirement System of Michigan (System), an agent multiple-employer public employee retirement system that acts as a common investment and administrative agent for all Michigan municipal employees. The System issues a publicly available financial report that includes financial statements and required supplementary information for the system. That report may be obtained by writing to MERS at 1134 Municipal Way, Lansing, MI 48917-9755. The qualified employees of the Fire Department and Police Department of the City are included in a separate self-administered plan. The employees of the Marquette Board of Light and Power are included in a separate plan. All other full-time employees of the City and the Marquette Area Wastewater Treatment Facility are eligible to participate in the System. Benefits vest after six years for senior management and after ten years for all others. City employees who retire at or after the age of 60 with 10 years of credited service are entitled to an annual retirement benefit, payable monthly for life, annual benefits are determined by negotiated contractual benefits within statute guidelines. The System also provides death and disability benefits. These benefit provisions and all other requirements are established by State statute and City ordinance. Active employees with ten or more years of service, who become disabled, receive an amount equal to the same as would be received under the normal retirement requirements, except that the reduction for retirement before age 60 is not applied. If the disability is from service connected causes, the amount of retirement allowance shall be computed as if the member had acquired exactly 10 years of credited service, if the actually acquired credited service is less than 10 years.
77
NOTE L – DEFINED BENEFIT PENSION PLAN – MUNICIPAL EMPLOYEES RETIREMENT SYSTEM OF MICHIGAN (Continued): If an employee dies, the beneficiary receives a retirement allowance computed in the same manner as a service retirement allowance, but reduced to reflect an Option II (100% joint and survivor) election. An employee’s surviving spouse will receive a retirement allowance equal to 85% of the deceased member’s or deceased vested former member’s accrued retirement allowance computed in the same manner as a service retirement allowance, based on service and final average compensation at time of death. Funding Policy City employees are required to contribute five percent of their annual compensation to the System. The City pays the contribution for senior management. The City is required to contribute the remaining amounts necessary to fund the System, using the actuarial basis specified by statute. Annual Pension Cost For the year ended June 30, 2007, the City’s annual pension cost of $700,844 for the plan was equal to the City’s required and actual contribution. The annual required contribution was determined as part of an actuarial valuation at December 31, 2004, using the entry age normal cost method. Significant actuarial assumptions used in the valuation include (a) a rate of return on the investment of present and future assets of 8%, (b) projected salary increases of 4.5% a year compounded annually, attributable to inflation, and (c) additional projected salary increases of 0.0% to 4.16% per year, depending on age, attributable to seniority/merit. The actuarial value of assets was determined using techniques that smooth the effects of short-term volatility in the market value of investments over a five year period. The unfunded actuarial accrued liability is being amortized as a level percent of projected payroll on an open basis over a period of 30 years. Trend Information Trend information gives an indication of the progress made in accumulating sufficient assets to pay benefits when due. Three year trend information is stated below and ten year trend information may be found on page 88.
Fiscal Year Ending June 30
Valuation Date December 31
Annual Pension Cost (APC)
Percentage of APC Contributed
Net Pension Obligation
2005 2002 $545,201 100% 0 2006 2003 625,812 100% 0 2007 2004 700,844 100% 0
NOTE M – DEFINED BENEFIT PENSION PLAN - FIRE-POLICE RETIREMENT SYSTEM: Separately Issued Plan Financial Report The separately issued audited financial statements of the Plan can be obtained at the City’s Finance Department located at 300 West Baraga Avenue, Marquette, Michigan 49855.

78
NOTE M – DEFINED BENEFIT PENSION PLAN – FIRE-POLICE RETIREMENT SYSTEM (Continued): Summary of Significant Accounting Policies Basis of Accounting - The City of Marquette Fire - Police Retirement System financial statements are prepared using the accrual basis of accounting. Plan member contributions are recognized in the period in which the contributions are due. Employer contributions to the plan are recognized when due and the employer has made a formal commitment to provide the contributions. Benefits and refunds are recognized when due and payable in accordance with the terms of the plan. Method Used to Value Investments - Investments are reported at fair value. Short-term investments are reported at cost, which approximates fair value. Securities traded on a national exchange are valued at the last reported sales price at current exchange rates. Mortgages are valued on the basis of future principal and interest payments, and are discounted at prevailing interest rates for similar instruments. The fair value of real estate investments is based on independent appraisals. Investments that do not have an established market are reported at estimated fair value. Plan Description The City of Marquette is the administrator of a single-employer public employee retirement system (“System”) established and administered by the City of Marquette to provide pension benefits for the Fire and Police Department employees. The Fire and Police System is considered part of the City of Marquette’s financial reporting entity and is included in the City’s financial report as a pension trust fund. The City’s payroll for employees covered by the System for the year ended June 30, 2007 was $2,706,518; the City’s total payroll was $8,614,355. Current membership in the Plan comprises the following as of December 31, 2006, the latest actuarial valuation date:
Group Retirees and beneficiaries currently receiving benefits 55 V ested terminated members 2 A ctive employees: Fire 25 Police 33
TOTAL 115 The qualifying full-time employees of the Fire Department and Police Department are eligible to participate in the System. Benefits vest after ten years of service. Employees who retire at or after the age of 50 with 25 or more years of credited service or age 60 with 10 or more years of service, are entitled to annual retirement benefits, payable monthly for life, in an amount equal to a minimum of $600 a month, or 2.5 percent (3.0 percent for Fire members) of a three year average final compensation times the first twenty-five years of service plus 1.5 percent (1.0 percent for Fire members) of average final compensation times years of service in excess of twenty-five years. The System also provides death and disability benefits.
79
NOTE M – DEFINED BENEFIT PENSION PLAN – FIRE-POLICE RETIREMENT SYSTEM (Continued): Non-duty disability benefits are payable upon the total and permanent disability of a member with 5 or more years of service. Benefits up to age 55 are paid equaling 1.5% of the average final compensation times the years of service. Benefits after the age of 55 are the same as benefits received from service retirement. Disability benefits from the total or permanent disability of a member in the line of duty are payable, up to the age of 55, (age 50 for Fire members) at 50% of the average final compensation. Benefits after the age of 55 are the same as benefits from service retirement with service credit from date of disability to age 55, except for fire members whose full retirement is the equivalent of 25 years of service that the member would have had if not disabled. If an active employee dies in the line of duty, the beneficiary will receive the same amount that was paid by worker’s compensation. If an active employee with 20 or more years of service (10 years required for fire members) dies not in the line of duty, the surviving spouse, if any, will receive an amount equal to the accrued straight life pension actuarially reduced in accordance with option I election. Contributions Covered employees are required by statute to contribute 5 percent of their salary to the System. If an employee leaves covered employment or dies before being eligible for retirement, the total accumulated employee contributions plus related investment earnings may be refunded to the employee or designated beneficiary. Benefit and contribution provisions are established by State statute and City ordinance. The City’s funding policy provides for periodic employer contributions at actuarially determined rates that, expressed as percentages of annual covered payroll, are designed to accumulate sufficient assets to pay benefits when due. The normal cost and amortization payment for the year ended June 30, 2006 were determined using an entry age actuarial funding method. Unfunded actuarial accrued liabilities were amortized as a level percent of payroll over an open period of 21 years for police and 20 years for fire. During the year ended June 30, 2007, 2006 and 2005, contributions totaling $242,030, $265,196 and $136,351, respectively, were made in accordance with contribution requirements determined by an actuarial valuation of the System. Trend Information Trend information gives an indication of the progress made in accumulating sufficient assets to pay benefits when due. Three year trend information is stated below and ten year trend information may be found on page 89.

80
NOTE M – DEFINED BENEFIT PENSION PLAN – FIRE-POLICE RETIREMENT SYSTEM (Continued):
Fiscal Year Ending June 30
Annual Required Contribution
Percentage Contributed
Net Pension Obligation
2004 $74,278 100% 0 2005 $207,854 100% 0 2006 $470,018 100% 0
Concentrations of Investments The Plan does hold any individual investments that represent 5.0% or more of the Plan’s net assets. NOTE N – DEFINED BENEFIT PENSION PLAN BOARD OF LIGHT AND POWER – COMPONENT UNIT: Separately Issued Plan Financial Report The separately issued audited financial statements of the Plan can be obtained at the City’s Finance Department located at 300 West Baraga Avenue, Marquette, Michigan 49855. During the fiscal year ended June 30, 2005, the Board of Light and Power was effectively split from other City departments for pension benefit purposes. The following disclosures are related to the specifics of the “new” plan for the Board of Light and Power employees as excerpted from the audit report of the Board of Light and Power. Plan Description The Board of Light and Power (Board) contributed to the Municipal Employees Retirement System of Michigan (System), an agent multiple-employer public employee retirement system that acts as common investment and administrative agent for all Michigan municipal employees. The System issues a publicly available financial report that includes financial statements and required supplementary information for the system. That report may be obtained by writing to MERS at 1134 Municipal Way, Lansing, MI 48917-9755.
All employee benefits, except for the executive director, vest after ten years of service. The executive director’s benefits vest at eight years of service. Current Board bargaining and nonbargaining active employees who retire at or after the age of 60 with 10 years of credited service are entitled to an annual retirement benefit payable monthly in an amount equal to the sum of 2.25 percent of a members 5 year final average compensation times the number of years service credited until age 65. At age 65, or upon receipt of social security benefits, the benefit payable for life is equal to the sum of 1.7 percent times the 5 year final average compensation times the number of years of service credit. Board employees who have retired prior to July 1, 1992, at or after the age of 60 with 10 years of credited service are entitled to an annual retirement benefit payable monthly for life, in an amount

81
NOTE N – DEFINED BENEFIT PENSION PLAN BOARD OF LIGHT AND POWER - COMPONENT UNIT (Continued): equal to the sum of 1.2 percent times the first $4,200 of a members 5 year final average compensation, plus 1.7 percent times the portion of final average compensation over $4,200. The executive director and the management group who retire at or after the age of 60 with 10 years of credited service are entitled to an annual retirement benefit payable monthly in an amount equal to the sum of 2.5 and 2.25, respectfully, percent of a member’s 5 year final average compensation times the number of years of service credit. The System provides for early retirement benefits for all active employees at age 55 with 15 years of service at a reduced retirement benefit and with 25 years of service at age 55 without reduced benefits and age 50 with 25 years of service at a reduced benefit. The System also provides death and disability benefits. The benefit provisions and all other requirements are established by State statute and Board ordinance. Active employees with ten or more years of service, who become disabled receive an amount equal to the same as would be received under the normal retirement requirements, except that the reduction for retirement before age 60 is not applied. If the disability is from service connected causes, the amount of retirement allowance shall be computed as if the member had acquired exactly 10 years of credited service, if the actually acquired credited service is less than 10 years. If an active employee dies, the beneficiary receives a retirement allowance computed in the same manner as a service retirement allowance, but reduced to reflect Option II (100% joint and survivor) election. An employee’s surviving spouse will receive a retirement allowance equal to 85% of the deceased members or deceased vested former members accrued retirement allowance computed in the same manner as a service retirement allowance, based on service and final average compensation at time of death. Funding Policy Board employees are required to contribute percentages ranging form 4.7% - 4.8% of their annual salary to the System, except for the executive director’s contribution which is paid by the Board. The Board is required to contribute the remaining amounts necessary to fund the System, using the actuarial basis specified by statute. Annual Pension Cost For the year ended June 30, 2007, the Board’s annual pension cost was $475,320. The Board’s actual contributions for 2007 were $445,391. The annual required contribution was determined as part of an actuarial valuation at December 31, 2003, using the entry age normal cost method. Significant actuarial assumptions used in the valuation include (a) a rate of return on the investment of present and future assets of 8 percent a year compounded annually, (b) projected salary increases of 4.5 percent a year compounded annually, attributable to inflation, and (c) additional projected salary increases ranging from 0.5% to 4.90% per year, depending on age, attributable to seniority/merit. The unfunded actuarial accrued liability is being amortized as a level percent of projected payroll on an open basis over a period of 30 years.

82
NOTE N – DEFINED BENEFIT PENSION PLAN BOARD OF LIGHT AND POWER - COMPONENT UNIT (Continued): Trend Information Trend information gives an indication of the progress made in accumulating sufficient assets to pay benefits when due. Three year trend information is stated below and ten year trend information may be found on page 90.
Fiscal Year Ending June 30
Valuation Date December 31
Annual Pension Cost (APC)
Percentage of APC Contributed
Net Pension Obligation
2005 2002 $352,968 99% 0 2006 2003 441,780 92% 0 2007 2004 475,320 94% 0
NOTE O – DEFINED CONTRIBUTION PENSION PLAN: The City of Marquette provides pension benefits to Senior Management Division 15 and Middle Management Division 10 employees through a defined contribution pension plan. In a defined contribution plan, benefits depend solely on amounts contributed to the plan plus investment earnings. The City established the MERS Benefit Program DC in the form of the ICMA Retirement Corporation Governmental Money Purchase Plan and Trust, as amended by and as authorized by Section 19A of the Municipal Employees’ Retirement System of Michigan Plan Document. The ICMA Retirement Corporation is the Plan Administrator and the City has agreed to the commingled investment of assets of the Plan within the ICMA Retirement Trust. At June 30, 2007, there were 7 plan members. Plan members are required to contribute 3% of covered earnings and the City is required to contribute 13% or 9% of covered earnings for the Senior Management Division and Middle Management Division, respectively. In accordance with these requirements, the City contributed $47,769 during the current year and employees contributed $12,640. The employees under the Plan are immediately vested. NOTE P – DEFERRED COMPENSATION PLAN: The City of Marquette offers its employees deferred compensation plans created in accordance with the Internal Revenue Code, Section 457. The plans are available to all Board of Light and Power employees and to all other City employees, and permit them to defer a portion of their current earnings until the employee’s termination, retirement, death or unforeseeable emergency. Due to changes in the Internal Revenue Code, the Plan’s assets are considered to be property of the Plan’s participants and are no longer subject to the City’s general creditors. Therefore in accordance with the provisions of GASB Statement No. 32, Plan balances and activities are not reflected in these financial statements. The Plan’s participants have the right to designate how the funds will be invested. Accordingly, the City has no liability for losses under the Plan. The Plan’s assets are held in trust for the exclusive benefit of the Plan’s participants and their beneficiaries.

83
NOTE P – DEFERRED COMPENSATION PLAN (Continued): The City’s plans are administered by the Nationwide Retirement Solutions (formerly known as PEBSCO), the International City Manager’s Association (ICMA), American Express Financial Advisors, Inc., and the Variable Annuity Life Insurance Company (VALIC). Nationwide and ICMA, as plan administrators, agree to hold harmless and indemnify the City, its appointed and elected officers and participating employees from any loss resulting from Nationwide or ICMA or their respective agents’ failure to perform their duties and services pursuant to the ICMA and Nationwide programs. The Component Unit’s (Board of Light and Power’s) plans are administered by the ICMA and Nationwide. ICMA and Nationwide, as plan administrators, agree to hold harmless and indemnify the Board, its appointed and elected officers and participating employees from any loss resulting from ICMA or Nationwide or their agents’ failure to perform their duties and services pursuant to the ICMA and Nationwide programs. NOTE Q – LONG TERM RECEIVABLES: Internal Service Fund: In November of 1999, the City entered into an agreement with the Downtown Development Authority (DDA), whereby the City would finance the purchase of a municipal sidewalk tractor. The financing agreement calls for payments over a seven-year period, with quarterly installments of $3,076, including interest at 5% per annum. The balance of this long-term receivable recorded in the Motor Vehicle Equipment Fund was $0 at June 30, 2007. There are no more remaining principal payments to be received as of June 30, 2007. NOTE R – ACCUMULATED COMPENSATED ABSENCES: Sick Leave – Employees earn sick leave at the rate of one (1) day per month, not to exceed 12 days per year. Upon retirement or termination, employees in good standing after at least ten (10) years of service, shall be paid one-half such sick leave accumulated at that time up to a maximum accrual of 1,800 hours at their current rate of pay. Certain bargaining unit employees who were hired before January 1, 1975, shall be paid one-half of all sick leave hours accumulated at the time of retirement or termination. Management employees whose accrued sick leave balances were greater than 1,800 hours for the pay period of June 9, 1997 through June 22, 1997, have their sick leave balance capped at the higher hours for payout purposes at the time of retirement or termination. Management employees hired after June 30, 1998 have their accrued sick leave balance capped at 1,000 hours for payout purposes at the time of retirement or termination. Vacation Leave – Employees earn vacation leave at various schedules dependent upon their length of employment. Upon retirement or termination, employees are paid for such vacation accumulated at that time up to a maximum accrual of 400 hours. Certain supervisory employees are paid for such vacation accumulated at that time up to a maximum accrual of 408 hours. Management employees whose accrued vacation balances were greater than 400 hours for the pay period of June 9, 1997 through June 22, 1997 have their vacation balance capped at the higher hours for payout purposes

84
NOTE R – ACCUMULATED COMPENSATED ABSENCES (Continued): at the time of retirement or termination. Management employees hired after June 30, 1998 have a maximum accrual of 200 vacation hours for payout purposes at the time of retirement or termination. Fire and Police employees are paid for all accrued vacation hours accumulated at the time of retirement or termination up to certain capped levels. Benefit Day Leave – Effective December 11, 2000, all new hired Department Heads and Middle Managers earn benefit leave dependent upon their length of employment. Current Department Heads and Middle Managers at that time had the option of remaining under the regular Vacation and Sick Leave or electing the Benefit Leave. If the Benefit Leave was elected, their accumulated vacation and sick leave was converted to benefit leave. Vacation leave was converted on a one for one basis while sick leave was converted on a two for one basis. By December 31 of every year, these employees have the option of being paid for accumulated benefit leave not to exceed 5% of their annual base pay, provided they maintain a minimum of 232.5 benefit hours. These employees have their benefit leave capped at 1,100 hours for payout purposes at the time of retirement or termination. The liabilities for accumulated, unpaid vacation, sick and benefit leave at June 30, 2007 are as follows:
Benefit Leave And Vacation
Sick
Total
PRIMARY GOVERNMENT:
Current portion $926,773 $23,972 $950,745 Long-term portion 484,996 452,697 937,693
TOTAL $1,411,769 $476,669 $1,888,438 COMPONENT UNITS:
Current portion $465,361 $418,572 $883,933 Long-term portion 50,693 43,287 93,980
TOTAL $516,054 $461,859 $977,913 NOTE S – BUDGETARY NONCOMPLIANCE: Excesses of expenditures over appropriations in the individual government funds are as follows:
Environmental Protection Fund: Public health and safety $49,069
Budget amendments are required by State law when it appears that the actual and probable revenues from taxes and other sources in a fund are less than the estimated revenues, including an available fund balance upon which appropriations from the fund were based, which would prevent expenditures from exceeding available revenues for that current fiscal year.

85
NOTE T – CONTINGENCIES: There exists certain lawsuits pending in which the City is involved. The City attorney estimates that the potential claims against the City not covered by insurance resulting from such litigation would not materially affect the financial statements of the City. NOTE U – JOINT VENTURE - MARQUETTE COUNTY SOLID WASTE MANAGEMENT AUTHORITY: In June of 1988, the City of Marquette joined with 19 other municipalities to create the Marquette County Solid Waste Management Authority (Authority). The Authority was created pursuant to Act 233 of 1955 to plan for, acquire, construct, finance, operate, maintain, repair and dispose of, whether by sale, lease or otherwise, an Act 641 landfill, including all improvements, appurtenances, easements, accessory facilities and structures, equipment, and other property part of or incidental to the landfill sufficient to satisfy the requirements of, and function as, a solid waste disposal area under Act 641 and to establish and administer procedures providing for the separation, recycling, recovery, conversion of solid waste to energy and for the disposition of such energy output and disposal at the site of Non-toxic Type II and Type III Solid Waste, to fund all of the above activities, and to charge and collect fees in connection with the operation of the landfill and to provide for the reimbursement with receipt of bond proceeds to the City of Marquette and Sands Township of their respective costs and expenses incurred in connection with the establishment and administration of the Solid Waste Authority and the System Facility. As required by Governmental Accounting Standards Board Statement #14, the City’s investment in this joint venture is recorded as an asset. The audited financial statements for the Marquette County Solid Waste Management Authority can be obtained at P.O. Box 936, Marquette, MI 49855. The Authority is governed by a Board of Trustees consisting of one (1) member (who shall be the chairperson of the Board of Trustees) designated by the Sands Township Supervisor on behalf of the Sands Township, two (2) members designated by the Marquette City Commission; three (3) members designated by the Marquette County Board of Commissioners, and one resident of the City of Marquette appointed by the other six Authority Board members. All decisions of the Board are made by majority vote, consisting of at least four of its members. The City’s share of assets, liabilities and fund equity is approximately 31 percent. Summary financial information as of and for the fiscal year ended June 30, 2007, the latest available report, is as follows:
T otal Assets $13,425,691 T otal Liabilities 1,989,798 T otal Net Assets 11,435,893 T otal Operating Revenues 2,374,922 T otal Operating Expenses 2,817,324 Total Joint Venture’s Outstanding Debt 515,000

86
NOTE U – JOINT VENTURE - MARQUETTE COUNTY SOLID WASTE MANAGEMENT AUTHORITY (Continued): The City has pledged its full faith and credit for the Marquette County Solid Waste Management Authority Bonds, 1993B Issue, Refunding Bonds. These bonds are payable from the net revenues of the Authority, as well as by each member of the Authority to the extent of their pro rata share of the principal and interest requirements on the bonds. The obligation to pay a proportionate share of the principal and interest is a general obligation of each constituent municipality. Each member is authorized and obligated to levy a tax without limitation as to rate or amount for the prompt payment of its respective shares of the obligation. The City has elected to pay its share of the debt through tax levies. The proportionate share of the debt service for the City will be included in the General Fund debt service expenditures in future years. The City’s proportionate share, as based on a 1990 census, is approximately 31% as of June 30, 2007. NOTE V – RISK MANAGEMENT: The City of Marquette is exposed to various risks of loss related to property, loss, torts, errors and omissions, and employee injuries (workmen’s compensation). As of July 1, 1997 the City participates in the Michigan Municipal League Property and Liability Pool for claims relating to other liability and property claims and participates in the Michigan Municipal Workers Compensation Pool for employee injury claims. The Michigan Municipal League risk pool programs operate as common risk-sharing\management programs for local units of government in Michigan. Member premiums are used to purchase commercial excess insurance coverage and to pay member claims in excess of deductible amounts. The City’s maximum deductible for property and liability coverage is $75,000 per occurrence, subject to $250,000 aggregate per policy year. Settled claims resulting from these risks have not exceeded commercial insurance coverage in any of the past three fiscal years. The City purchases commercial health care insurance from Blue Cross/Blue Shield of Michigan for all employees, including retired employees. NOTE W – OTHER POST EMPLOYMENT BENEFITS: The City of Marquette offers group benefit health insurance coverage under various collective bargaining agreements covering substantially all employees and former employees of the City. The amount paid for former City employees for the fiscal year ended June 30, 2007 was $238,403. There were 130 participants eligible to receive benefits and 49 are participating. This benefit is accounted for on the “pay-as-you-go” method, whereby the City is reporting the amounts paid as expenditures in the year the amount is paid for the benefit provided. The amount paid for the component unit (Board of Light and Power) employees for the year ended June 30, 2007 was $948,633. There were 87 participant’s eligible and receiving benefits.

87
NOTE X – SINGLE AUDIT: The City’s audited financial statements report a total amount of federal expenditures that is more than the Single Audit threshold of $500,000. The City, therefore, is required to have an audit in accordance with OMB Circular A-133 for the fiscal year ended June 30, 2007. NOTE Y – EXTRAORDINARY ITEM – Component Unit: On May 15, 2003, the Marquette Board of Light and Power’s hydro properties experienced a flood event caused by the failure of a dike at the Silver Lake dam. There was significant erosion along the Dead River and the earthen embankment to the south of the #3 (Tourist Park) dam abutment was washed away. Numerous board facilities were affected by the water and debris including the hydro unit #2 Hydro Plant basement, the roads to #2 Hydro Plant and Penstock, the #3 Hydro Plant and substation, the riverbanks, and other facilities. The Board filed claims against several other parties as a result of the flood event. As of June 30, 2007, the Board has entered into settlement agreements with the involved parties with proceeds due to the Board of $1,725,000. All parties in this matter have dropped their lawsuits as a result of the agreements. Accordingly, the Board has recorded a receivable and the related extraordinary revenue for this amount for the fiscal year ended June 30, 2007. NOTE Z – CONSTRUCTION IN PROGRESS: The City of Marquette has active construction projects as of June 30, 2007. The projects include street construction and reconstruction in areas where the sanitary sewer system is being repaired, and other various street reconstruction and street improvement projects throughout the City. At year end, the City’s total construction in progress expenditures in the governmental funds totaled $3,487,003 with anticipated future expenditures on these projects amounting to $4,827,391. The reconstruction of streets due to the sanitary sewer repair is being financed with the issue of the 2007 High Street Bonds, and a portion of the various street repairs are being financed with the issue of the 2006 Limited Tax General Obligation Bonds. Construction in progress projects reported in the business-type activities include various sanitary sewer repairs, and the construction of conservation buffers. At year end, the City’s total construction in progress expenditures in the business-type activities funds totaled $2,024,645 with anticipated future expenditures on these projects amounting to $655,908. A portion of the various sewer repairs are being financed with the issue of the 2006 Water Supply and Sewage System Revenue Bonds, and the conservation buffers are being financed through a grant from the State of Michigan.

Required Supplementary Information
88

City of Marquette, Michigan
MUNICIPAL EMPLOYEES RETIREMENT SYSTEM OF MICHIGAN
DEFINED BENEFIT PENSION PLAN ANALYSIS OF FUNDING INFORMATION
SCHEDULE OF FUNDING P OGRESS R
Actuarial Valuation
Date December 31
(a) Actuarial Value of Assets
(b)
Entry Age Actuarial Accrued Liability
(b-a)
Unfunded Accrued Liability (UAL)
(a/b) Funded Ratio
(c) Annual Covered Payroll
[(b-a)/c] UAL as a
Percentage of Covered Payroll
1997
$13,630,932
$15,461,563
$1,830,631
88%
$4,800,223
38% 1998
15,257,550
16,216,678
959,128
94
5,031,270
1 9
1999
16,969,765
17,430,314
460,549
97
4,909,541 9
2000
18,722,203
20,136,439
1,414,236
93
4,803,572
2 9 2001
20,056,537
23,113,321
3,056,784
87
5,039,800
61
2002
20,799,934
24,588,188
3,788,254
85
5,227,706
72 2003
22,629,322
25,997,838
3,368,516
87
5,393,986
62
2004
24,187,555
28,468,133
4,280,578
85
5,426,755
79 2005 2006
25,645,477 26,951,096
33,158,414 36,475,540
7,512,937 9,524,444
77 74
5,435,528 5,264,612
159 183
SCHEDULE OF EMPLOYER CONTRIBUTIONS
Fiscal Year Ending
June 30
Valuation Date December 31
Annual Pension Cost (APC)
Percentage of APC Contributed
Net Pension Obligation
1998
1995
$153,696
100.0%
$0 1999
1996
295,912
100.0%
0
2000
1997
424,066
100.0%
0 2001
1998
381,485
100.0%
0
2002
1999
399,053
100.0%
0 2003
2000
456,453
100.0%
0
2004
2001
521,245
100.0%
0 2005
2002
545,201
100.0%
0
2006 2003 625,812 100.0% 0 2007 2004 700,844 100.0% 0
NOTES TO THE REQUIRED SCHEDULES
The required contribution was determined using the entry age normal actuarial cost method. The actuarial assumptions included (a) a rate of return on the investment of present and future assets of 8.0% per year, compounded annually, (b) projected salary increases of 4.5% per year, compounded annually, attributable to inflation, and (c) additional projected salary increases ranging from 0.00% to 4.16% per year, depending on age, attributable to seniority/merit. The actuarial value of assets was determined using techniques that smooth the effects of short-term volatility in the market value of investments over a five year period. The unfunded actuarial accrued liability is being amortized as a level percent of projected payroll on an open basis over a period of 30 years.
89

City of Marquette, Michigan
FIRE - POLICE RETIREMENT SYSTEM
ANALYSIS OF FUNDING INFORMATION
SCHEDULE OF FUNDING P OGRESS R
Actuarial Valuation
Date December 31
(a) Actuarial Value of Assets
(b) Entry Age Actuarial Accrued Liability
(b-a)
Unfunded (Over funded)
Accrued Liability (UAL)
(a/b) Funded Ratio
(c) Annual Covered Payroll
[(b-a)/c] UAL as a
Percentage of Covered Payroll
1997
$19,918,405
$16,102,478
$(3,815,927)
124%
$2,234,522
170% 1998
22,301,497
17,189,981
(5,111,516)
130
2,248,447
227%
1999
24,690,249
18,070,456
(6,619,793)
137
2,381,956
277% 2000
26,681,186
18,922,286
(7,758,900)
141
2,477,522
313%
2001
27,995,675
20,310,485
(7,685,190)
138
2,595,193
296% 2002
27,832,278
22,046,809
(5,785,469)
126
2,669,333
216%
2003
27,564,327
23,337,401
(4,226,926)
118
2,717,024
156% 2004
27,258,447
24,686,419
(2,572,028)
110
2,888,945
89%
2005 26,904,310 26,794,398 (109,912) 100 2,782,910 4% 2006 27,011,210 27,763,814 752,604 97 2,798,271 27%
SCHEDULE OF EMPLOYER CONTRIBUTIONS
Fiscal Year Ending
June 30
Annual Pension Cost (APC)
Percentage of APC Contributed
Net Pension Obligation
1997
$206,674@
100.0%
$0 1998
220,008@
100.0%
0
1999
202,247@
100.0%
0 2000
-
-
0
2001
-
-
0 2002
-
-
0
2003
-
-
0 2004
-
-
0
2005 207,854@
100.0%
0 2006 365,370@ 100.0% 0
@ In each the employer contributes exactly the actual dollar amount recommended by the actuary plus 5.0% of the actual pay during the fiscal year of both the fire chief and police chief.
NOTES TO THE REQUIRED SCHEDULES
The required contribution was determined using the entry age actuarial cost method. The actuarial assumptions included (a) a rate of return on the investment of present and future assets of 7.0% per year, compounded annually, (b) projected salary increases of 4.5% per year, compounded annually, attributable to inflation, (c) additional projected salary increases ranging from 0.00% to 3.50% per year, depending on age, attributable to seniority/merit, and (d) the assumption that benefits will not increase after retirement. The actuarial value of assets was determined using techniques that smooth the effects of short-term volatility in the market value of investments over a five year period. The unfunded actuarial accrued liability is being amortized as a level percent of projected payroll on an open basis. The amortization period on December 31, 2005 was 21 years for police and 20 years for fire.
90

City of Marquette, Michigan
MARQUETTE BOARD OF LIGHT AND POWER
MUNICIPAL EMPLOYEES RETIREMENT SYSTEM OF MICHIGAN DEFINED BENEFIT PENSION PLAN
ANALYSIS OF FUNDING INFORMATION
SCHEDULE OF FUNDING P OGRESS R
Actuarial Valuation
Date December 31
(a) Actuarial Value of Assets
(b)
Entry Age Actuarial Accrued Liability
(b-a)
Unfunded Accrued Liability (UAL)
(a/b) Funded Ratio
(c) Annual Covered Payroll
[(b-a)/c] UAL as a
Percentage of Covered Payroll
1997
$14,996,905
$14,042,518
$(954,386)
107%
$3,295,592
0% 1998
16,434,707
14,847,465
(1,587,241)
111
3,545,675
0
1999
18,484,644
17,553,732
(930,912)
105
3,431,413
0 2000
20,201,860
21,432,284
1,230,424
94
3,585,217
34
2001
21,249,595
22,508,331
1,258,736
94
3,720,528
34 2002
21,204,453
23,824,315
2,619,862
89
3,577,979
73
2003
21,931,156
26,001,957
4,070,801
84
3,911,098
104 2004
22,438,510
27,151,787
4,713,277
83
3,599,278
131
2005 22,841,639 28,767,850 5,926,211 79 3,522,833 168 2006 23,664,055 30,133,912 6,469,857 79 3,467,875 187
SCHEDULE OF EMPLOYER CONTRIBUTIONS
Fiscal Year Ending
June 30
Valuation Date December 31
Annual Required
Contribution (ARC)
Percentage of ARC
Contributed
Net Pension Obligation
1998
1995
$277,303
63.1%
$102,306 1999
1996
249,208
61.0%
98,199
2000
1997
213,168
225.0%
0 2001
1998
229,444
164.0%
0
2002
1999
277,151
100%
0 2003
2000
276,564
100%
0
2004
2001
271,728
100%
0 2005
2002
352,968
100%
0
2006 2003 441,780 100% 0 2007 2004 475,320 100% 0
NOTES TO THE REQUIRED SCHEDULES
Commencing with the 1993 actuarial valuation, the required contribution was determined using the entry age normal actuarial cost method. The actuarial assumptions included (a) a rate of return on the investment of present and future assets of 8.0% per year, compounded annually, (b) projected salary increases of 4.5% per year, compounded annually, attributable to inflation, and (c) additional projected salary increases ranging from 0.00% to 4.16% per year, depending on age, attributable to seniority/merit. The actuarial value of assets was determined using techniques that smooth the effects of short-term volatility in the market value of investments over a five year period. The unfunded actuarial accrued liability is being amortized as a level percent of projected payroll on an open basis over a period of 30 years.
91
City of Marquette, Michigan
MAJOR GOVERNMENTAL FUNDS
INDIVIDUAL FUND STATEMENTS AND SCHEDULES
GENERAL FUND The function of the General Fund is to record all revenues and expenditures of the City which are not accounted for in other funds. The General Fund receives revenue from many sources which are used to finance a wide range of City activities. The major activities financed by the General Fund are Fire and Police Protection, Public Works, Parks and Recreation, City Administration and most public services. The modified accrual basis of accounting is used in recording General Fund transactions. SPECIAL REVENUE FUNDS The function of the Special Revenue Funds is to record revenue and expenditures for specific functions or activities within restrictions imposed by City Charter, ordinances, resolutions and/or Federal and State statutes. MAJOR STREET AND TRUNKLINE FUND AND LOCAL STREET FUND Michigan's Act 51 of 1993, as amended, allocates gasoline and weight taxes to build and maintain roads, roadsides and storm sewers and to remove snow from and to control traffic along roads. These tax monies may be transferred between funds only as permitted by law. Other revenues include general taxes transferred from the General Fund. Within the City, Federal and State trunklines and certain "mile" roads are maintained by the City under contractual agreement with the State of Michigan and are subject to reimbursement to the City. The remaining mile roads and certain other roads are designated as MAJOR STREETS, maintained on a priority basis by the City, and the remaining roads are designated as LOCAL STREETS. CAPITAL PROJECTS FUNDS The function of Capital Projects Funds is to account for the acquisition and construction of major capital facilities other than those financed by Proprietary Funds. The modified accrual basis of accounting is used in recording Capital Projects Fund transactions. This fund records the development, improvement, and rehabilitation of City infrastructure. Operating transfers have financed the current projects. DEBT SERVICE FUNDS The function of the Debt Service Funds is to account for the accumulation of resources and payment of general obligation principal and interest from the governmental resources. The modified accrual basis of accounting is used in recording Debt Service Fund transactions. FOREST LAND DEBT SERVICE FUND This fund was established in 2005 to account for the annual payments on the Forest Land property purchase. These bonds were originally issued for $5,000,000 for the purpose of financing property to be used for a recreation trail network and possible development. In 2007, these bonds were refunded by issuing $5,135,000 in General Obligation Unlimited Tax Refunding Bonds, thus defeasing the original 2005 issue.
92
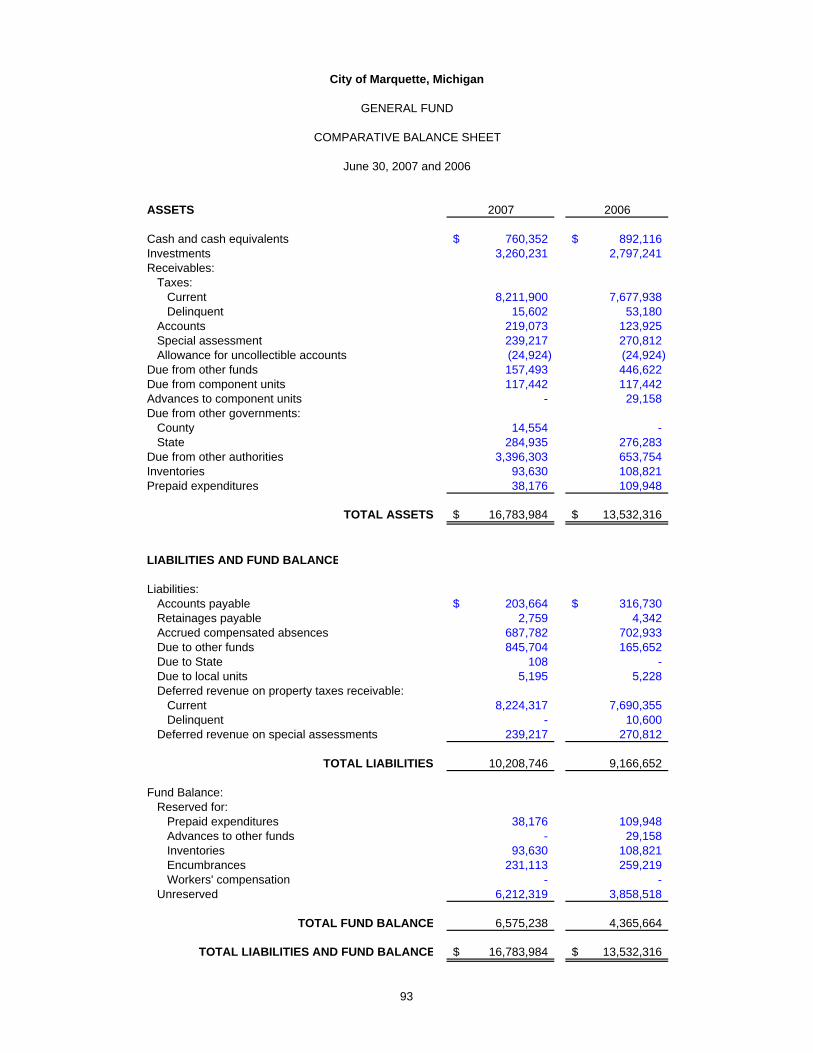
City of Marquette, Michigan
GENERAL FUND
COMPARATIVE BALANCE SHEET
June 30, 2007 and 2006
ASSETS 2007 2006
Cash and cash equivalents 760,352$ 892,116$ Investments 3,260,231 2,797,241 Receivables:
Taxes:Current 8,211,900 7,677,938 Delinquent 15,602 53,180
Accounts 219,073 123,925 Special assessment 239,217 270,812 Allowance for uncollectible accounts (24,924) (24,924)
Due from other funds 157,493 446,622 Due from component units 117,442 117,442 Advances to component units - 29,158 Due from other governments:
County 14,554 - State 284,935 276,283
Due from other authorities 3,396,303 653,754 Inventories 93,630 108,821 Prepaid expenditures 38,176 109,948
TOTAL ASSETS 16,783,984$ 13,532,316$
LIABILITIES AND FUND BALANCE
Liabilities:Accounts payable 203,664$ 316,730$ Retainages payable 2,759 4,342 Accrued compensated absences 687,782 702,933 Due to other funds 845,704 165,652 Due to State 108 - Due to local units 5,195 5,228 Deferred revenue on property taxes receivable:
Current 8,224,317 7,690,355 Delinquent - 10,600
Deferred revenue on special assessments 239,217 270,812
TOTAL LIABILITIES 10,208,746 9,166,652
Fund Balance:Reserved for:
Prepaid expenditures 38,176 109,948 Advances to other funds - 29,158 Inventories 93,630 108,821 Encumbrances 231,113 259,219 Workers' compensation - -
Unreserved 6,212,319 3,858,518
TOTAL FUND BALANCE 6,575,238 4,365,664
TOTAL LIABILITIES AND FUND BALANCE 16,783,984$ 13,532,316$
93
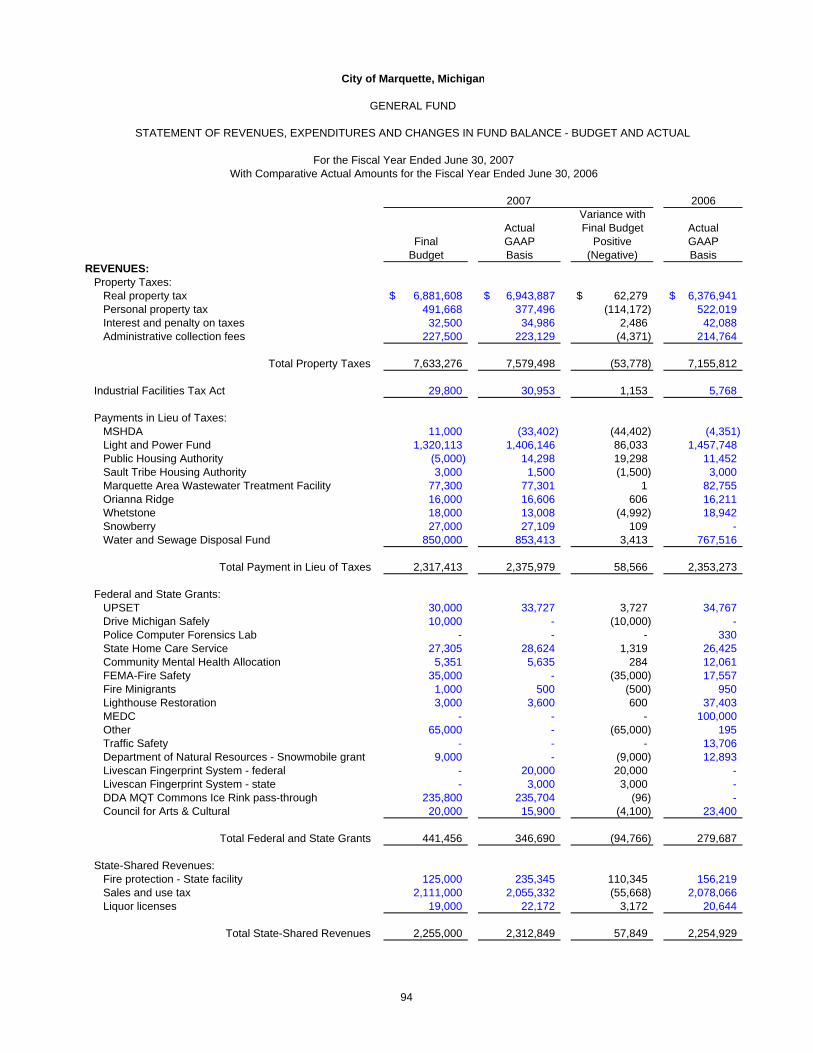
City of Marquette, Michigan
GENERAL FUND
STATEMENT OF REVENUES, EXPENDITURES AND CHANGES IN FUND BALANCE - BUDGET AND ACTUAL
For the Fiscal Year Ended June 30, 2007With Comparative Actual Amounts for the Fiscal Year Ended June 30, 2006
2007 2006Variance with
Actual Final Budget ActualFinal GAAP Positive GAAP
Budget Basis (Negative) BasisREVENUES:
Property Taxes: Real property tax 6,881,608$ 6,943,887$ 62,279$ 6,376,941$ Personal property tax 491,668 377,496 (114,172) 522,019 Interest and penalty on taxes 32,500 34,986 2,486 42,088 Administrative collection fees 227,500 223,129 (4,371) 214,764
Total Property Taxes 7,633,276 7,579,498 (53,778) 7,155,812
Industrial Facilities Tax Act 29,800 30,953 1,153 5,768
Payments in Lieu of Taxes: MSHDA 11,000 (33,402) (44,402) (4,351) Light and Power Fund 1,320,113 1,406,146 86,033 1,457,748 Public Housing Authority (5,000) 14,298 19,298 11,452 Sault Tribe Housing Authority 3,000 1,500 (1,500) 3,000 Marquette Area Wastewater Treatment Facility 77,300 77,301 1 82,755
Orianna Ridge 16,000 16,606 606 16,211 Whetstone 18,000 13,008 (4,992) 18,942 Snowberry 27,000 27,109 109 -
Water and Sewage Disposal Fund 850,000 853,413 3,413 767,516
Total Payment in Lieu of Taxes 2,317,413 2,375,979 58,566 2,353,273
Federal and State Grants: UPSET 30,000 33,727 3,727 34,767
Drive Michigan Safely 10,000 - (10,000) - Police Computer Forensics Lab - - - 330
State Home Care Service 27,305 28,624 1,319 26,425 Community Mental Health Allocation 5,351 5,635 284 12,061 FEMA-Fire Safety 35,000 - (35,000) 17,557 Fire Minigrants 1,000 500 (500) 950 Lighthouse Restoration 3,000 3,600 600 37,403 MEDC - - - 100,000 Other 65,000 - (65,000) 195 Traffic Safety - - - 13,706 Department of Natural Resources - Snowmobile grant 9,000 - (9,000) 12,893 Livescan Fingerprint System - federal - 20,000 20,000 - Livescan Fingerprint System - state - 3,000 3,000 - DDA MQT Commons Ice Rink pass-through 235,800 235,704 (96) - Council for Arts & Cultural 20,000 15,900 (4,100) 23,400
Total Federal and State Grants 441,456 346,690 (94,766) 279,687
State-Shared Revenues: Fire protection - State facility 125,000 235,345 110,345 156,219 Sales and use tax 2,111,000 2,055,332 (55,668) 2,078,066 Liquor licenses 19,000 22,172 3,172 20,644
Total State-Shared Revenues 2,255,000 2,312,849 57,849 2,254,929
94

City of Marquette, Michigan
GENERAL FUND
STATEMENT OF REVENUES, EXPENDITURES AND CHANGES IN FUND BALANCE - BUDGET AND ACTUAL
For the Fiscal Year Ended June 30, 2007With Comparative Actual Amounts for the Fiscal Year Ended June 30, 2006
2007 2006Variance with
Actual Final Budget ActualFinal GAAP Positive GAAP
Budget Basis (Negative) Basis
Intergovernmental Revenues:NMPSA 9,800$ 10,168$ 368$ 11,280$
MCCOA allocation - senior services 106,013 113,724 7,711 91,275 MCCOA allocation - match 29,340 28,318 (1,022) 30,934 Tribal Revenue Sharing 10,000 10,000 - 10,000
Total Intergovernmental Revenues 155,153 162,210 7,057 143,489
Licenses and Permits: Business licenses and permits 5,000 5,001 1 3,002 Non-business licenses and permits 26,100 28,573 2,473 25,248
Total Licenses and Permits 31,100 33,574 2,474 28,250
Charges for Services: Fees 249,352 304,851 55,499 332,706 Garbage transfer and disposal fees 1,600,000 1,255,621 (344,379) 1,193,368 Cemetery foundations and grave openings 36,500 36,969 469 38,764 Services to other funds 2,110,253 1,885,788 (224,465) 1,836,347
Total Charges for Services 3,996,105 3,483,229 (512,876) 3,401,185
Sales: Cemetery lot use 20,500 20,975 475 21,210 Travel trailer facility concessions and other 7,500 7,153 (347) 6,907
Total Sales 28,000 28,128 128 28,117
Use and Admission Fees: Community Center use 17,000 19,052 2,052 18,805 Travel trailer facility use 120,168 124,302 4,134 120,631 Ball fields 11,500 8,004 (3,496) 5,921 Skiing use/passes - 148 148 82 Parking fees 14,000 15,908 1,908 14,455 Art center and theater 57,308 63,596 6,288 53,931
Total Use and Admission Fees 219,976 231,010 11,034 213,825
Fines and forfeits 92,500 99,652 7,152 95,917
95

City of Marquette, Michigan
GENERAL FUND
STATEMENT OF REVENUES, EXPENDITURES AND CHANGES IN FUND BALANCE - BUDGET AND ACTUAL
For the Fiscal Year Ended June 30, 2007With Comparative Actual Amounts for the Fiscal Year Ended June 30, 2006
2007 2006Variance with
Actual Final Budget ActualFinal GAAP Positive GAAP
Budget Basis (Negative) Basis
Rentals: Land and building rental 20,900$ 24,345$ 3,445$ 28,990$ Parking rentals - lots 4,420 4,770 350 4,470 Equipment rent 13,000 27,834 14,834 9,578
Total Rentals 38,320 56,949 18,629 43,038
Special Assessments: Interest 22,378 12,949 (9,429) 22,353 Assessments levied 49,561 31,230 (18,331) 67,460
Total Special Assessments 71,939 44,179 (27,760) 89,813
Sale of capital assets - - - 908
Contributions from private sources 86,200 124,718 38,518 107,630
Investment income 155,000 614,404 459,404 171,797
Reimbursements 9,700 49,910 40,210 53,771
Other Revenue 47,830 130,489 82,659 39,536
TOTAL REVENUES 17,608,768 17,704,421 95,653 16,466,745
EXPENDITURES:
GENERAL GOVERNMENT: Central Administration: Personnel services 995,822 948,292 47,530 1,105,853 Supplies 36,868 32,946 3,922 32,131 Other services and charges 904,749 641,064 263,685 484,297
Capital Outlay 5,995 5,995 - - Total Central Administration 1,943,434 1,628,297 315,137 1,622,281
Assessor: Personnel services 168,340 168,299 41 166,487 Supplies 6,000 5,580 420 6,017 Other services and charges 15,000 12,848 2,152 16,669
Total Assessor 189,340 186,727 2,613 189,173
Clerk: Personnel services 360,300 344,154 16,146 252,624 Supplies 9,250 7,319 1,931 12,503 Other services and charges 67,300 60,031 7,269 72,273
Total Clerk 436,850 411,504 25,346 337,400
96

City of Marquette, Michigan
GENERAL FUND
STATEMENT OF REVENUES, EXPENDITURES AND CHANGES IN FUND BALANCE - BUDGET AND ACTUAL
For the Fiscal Year Ended June 30, 2007With Comparative Actual Amounts for the Fiscal Year Ended June 30, 2006
2007 2006Variance with
Actual Final Budget ActualFinal GAAP Positive GAAP
Budget Basis (Negative) Basis
Information Systems: Personnel services 270,564$ 250,198$ 20,366$ 191,578$ Supplies 15,300 15,268 32 23,878 Other services and charges 170,800 109,157 61,643 116,495 Capital outlay 20,604 8,144 12,460 43,668
Total Information Systems 477,268 382,767 94,501 375,619
City Hall and Grounds: Personnel services 56,034 57,212 (1,178) 54,546 Supplies 15,000 12,002 2,998 9,230 Other services and charges 94,050 80,866 13,184 86,459 Capital outlay 155,000 92,170 62,830 -
Total City Hall and Grounds 320,084 242,250 77,834 150,235
Cemetery: Personnel services 115,063 116,113 (1,050) 105,119 Supplies 6,100 7,421 (1,321) 4,517 Other services and charges 49,100 45,705 3,395 45,001
Total Cemetery 170,263 169,239 1,024 154,637
Other General Government: Insurance and Bonds: Other services and charges 150,000 128,031 21,969 136,236 Other - - - 64,774
Total Other General Government 150,000 128,031 21,969 201,010
TOTAL GENERAL GOVERNMENT 3,687,239 3,148,815 538,424 3,030,355
PUBLIC HEALTH AND SAFETY: Police Department: Personnel services 2,722,892 2,702,453 20,439 2,686,482 Supplies 44,000 45,088 (1,088) 63,194 Other services and charges 209,195 201,948 7,247 186,977 Capital outlay - 22,835 (22,835) 6,810
Total Police Department 2,976,087 2,972,324 3,763 2,943,463
Fire Department: Personnel services 1,776,444 1,789,189 (12,745) 1,752,514 Supplies 31,385 27,167 4,218 48,062 Other services and charges 172,782 162,924 9,858 150,981 Capital outlay 36,000 - 36,000 -
Total Fire Department 2,016,611 1,979,280 37,331 1,951,557
TOTAL PUBLIC HEALTH AND SAFETY 4,992,698 4,951,604 41,094 4,895,020
97

City of Marquette, Michigan
GENERAL FUND
STATEMENT OF REVENUES, EXPENDITURES AND CHANGES IN FUND BALANCE - BUDGET AND ACTUAL
For the Fiscal Year Ended June 30, 2007With Comparative Actual Amounts for the Fiscal Year Ended June 30, 2006
2007 2006Variance with
Actual Final Budget ActualFinal GAAP Positive GAAP
Budget Basis (Negative) Basis
PUBLIC WORKS: Public Works Maintenance: Personnel services 1,740,012$ 1,558,280$ 181,732$ 1,556,074$ Supplies 101,707 102,820 (1,113) 97,313 Other services and charges 615,867 647,537 (31,670) 537,089 Capital outlay 159,545 5,511 154,034 20,400
Total Public Works Maintenance 2,617,131 2,314,148 302,983 2,210,876
City Engineer: Personnel services 671,987 618,127 53,860 640,081 Supplies 11,000 9,389 1,611 10,691 Other services and charges 74,600 80,340 (5,740) 79,186
Capital outlay 13,929 13,463 466 5,497 Total City Engineer 771,516 721,319 50,197 735,455
TOTAL PUBLIC WORKS 3,388,647 3,035,467 353,180 2,946,331
SANITATION: Sanitation Services: Personnel services 114,100 111,340 2,760 107,629 Supplies 600 442 158 420 Other services and charges 1,499,667 1,119,109 380,558 1,083,910
TOTAL SANITATION SERVICES 1,614,367 1,230,891 383,476 1,191,959
SOCIAL SERVICES: Community Mental Health Allocation: Personnel services 35,200 14,848 20,352 4,977 Supplies 2,410 416 1,994 300 Other services and charges 820 704 116 316
Total Community Mental Health Allocation 38,430 15,968 22,462 5,593
State Home Care Service: Personnel services 55,298 40,500 14,798 28,235 Supplies 1,200 1,266 (66) 561 Other services and charges 2,260 1,590 670 1,307
Total State Home Care Service 58,758 43,356 15,402 30,103
MCCOA - Allocation to Senior Services: Personnel services 192,591 178,914 13,677 93,565 Supplies 2,375 3,235 (860) 1,289 Other charges and services 6,810 4,772 2,038 2,410
Total MCCOA - Allocation to Senior Services 201,776 186,921 14,855 97,264
98
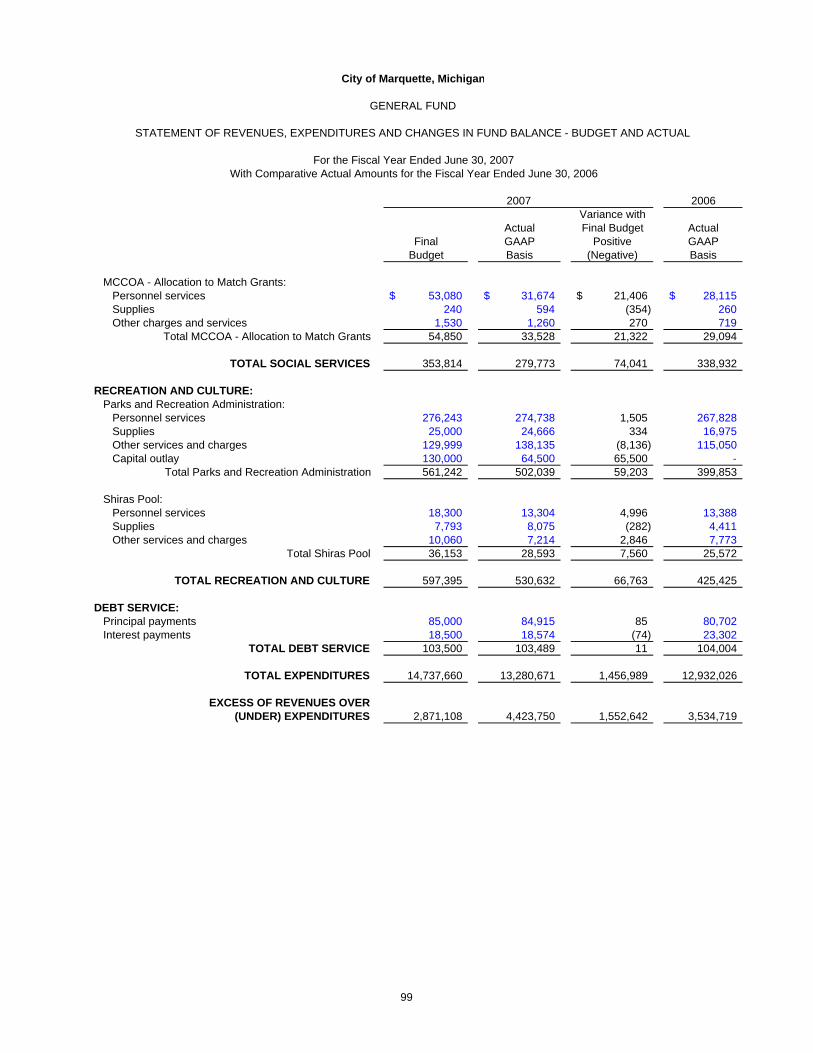
City of Marquette, Michigan
GENERAL FUND
STATEMENT OF REVENUES, EXPENDITURES AND CHANGES IN FUND BALANCE - BUDGET AND ACTUAL
For the Fiscal Year Ended June 30, 2007With Comparative Actual Amounts for the Fiscal Year Ended June 30, 2006
2007 2006Variance with
Actual Final Budget ActualFinal GAAP Positive GAAP
Budget Basis (Negative) Basis
MCCOA - Allocation to Match Grants: Personnel services 53,080$ 31,674$ 21,406$ 28,115$ Supplies 240 594 (354) 260 Other charges and services 1,530 1,260 270 719
Total MCCOA - Allocation to Match Grants 54,850 33,528 21,322 29,094
TOTAL SOCIAL SERVICES 353,814 279,773 74,041 338,932
RECREATION AND CULTURE: Parks and Recreation Administration: Personnel services 276,243 274,738 1,505 267,828 Supplies 25,000 24,666 334 16,975 Other services and charges 129,999 138,135 (8,136) 115,050 Capital outlay 130,000 64,500 65,500 -
Total Parks and Recreation Administration 561,242 502,039 59,203 399,853
Shiras Pool: Personnel services 18,300 13,304 4,996 13,388 Supplies 7,793 8,075 (282) 4,411 Other services and charges 10,060 7,214 2,846 7,773
Total Shiras Pool 36,153 28,593 7,560 25,572
TOTAL RECREATION AND CULTURE 597,395 530,632 66,763 425,425
DEBT SERVICE: Principal payments 85,000 84,915 85 80,702 Interest payments 18,500 18,574 (74) 23,302
TOTAL DEBT SERVICE 103,500 103,489 11 104,004
TOTAL EXPENDITURES 14,737,660 13,280,671 1,456,989 12,932,026
EXCESS OF REVENUES OVER(UNDER) EXPENDITURES 2,871,108 4,423,750 1,552,642 3,534,719
99
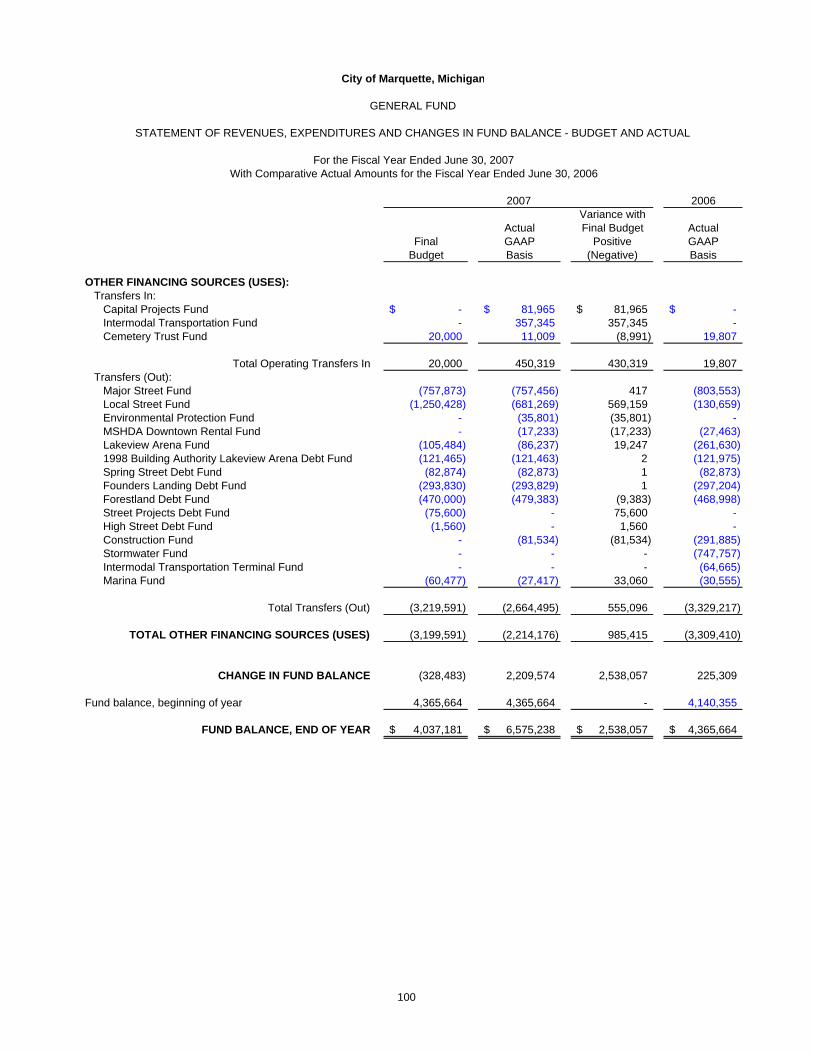
City of Marquette, Michigan
GENERAL FUND
STATEMENT OF REVENUES, EXPENDITURES AND CHANGES IN FUND BALANCE - BUDGET AND ACTUAL
For the Fiscal Year Ended June 30, 2007With Comparative Actual Amounts for the Fiscal Year Ended June 30, 2006
2007 2006Variance with
Actual Final Budget ActualFinal GAAP Positive GAAP
Budget Basis (Negative) Basis
OTHER FINANCING SOURCES (USES):Transfers In: Capital Projects Fund -$ 81,965$ 81,965$ -$ Intermodal Transportation Fund - 357,345 357,345 - Cemetery Trust Fund 20,000 11,009 (8,991) 19,807
Total Operating Transfers In 20,000 450,319 430,319 19,807 Transfers (Out): Major Street Fund (757,873) (757,456) 417 (803,553) Local Street Fund (1,250,428) (681,269) 569,159 (130,659) Environmental Protection Fund - (35,801) (35,801) - MSHDA Downtown Rental Fund - (17,233) (17,233) (27,463) Lakeview Arena Fund (105,484) (86,237) 19,247 (261,630) 1998 Building Authority Lakeview Arena Debt Fund (121,465) (121,463) 2 (121,975)
Spring Street Debt Fund (82,874) (82,873) 1 (82,873) Founders Landing Debt Fund (293,830) (293,829) 1 (297,204) Forestland Debt Fund (470,000) (479,383) (9,383) (468,998) Street Projects Debt Fund (75,600) - 75,600 - High Street Debt Fund (1,560) - 1,560 -
Construction Fund - (81,534) (81,534) (291,885) Stormwater Fund - - - (747,757) Intermodal Transportation Terminal Fund - - - (64,665) Marina Fund (60,477) (27,417) 33,060 (30,555)
Total Transfers (Out) (3,219,591) (2,664,495) 555,096 (3,329,217)
TOTAL OTHER FINANCING SOURCES (USES) (3,199,591) (2,214,176) 985,415 (3,309,410)
CHANGE IN FUND BALANCE (328,483) 2,209,574 2,538,057 225,309
Fund balance, beginning of year 4,365,664 4,365,664 - 4,140,355
FUND BALANCE, END OF YEAR 4,037,181$ 6,575,238$ 2,538,057$ 4,365,664$
100
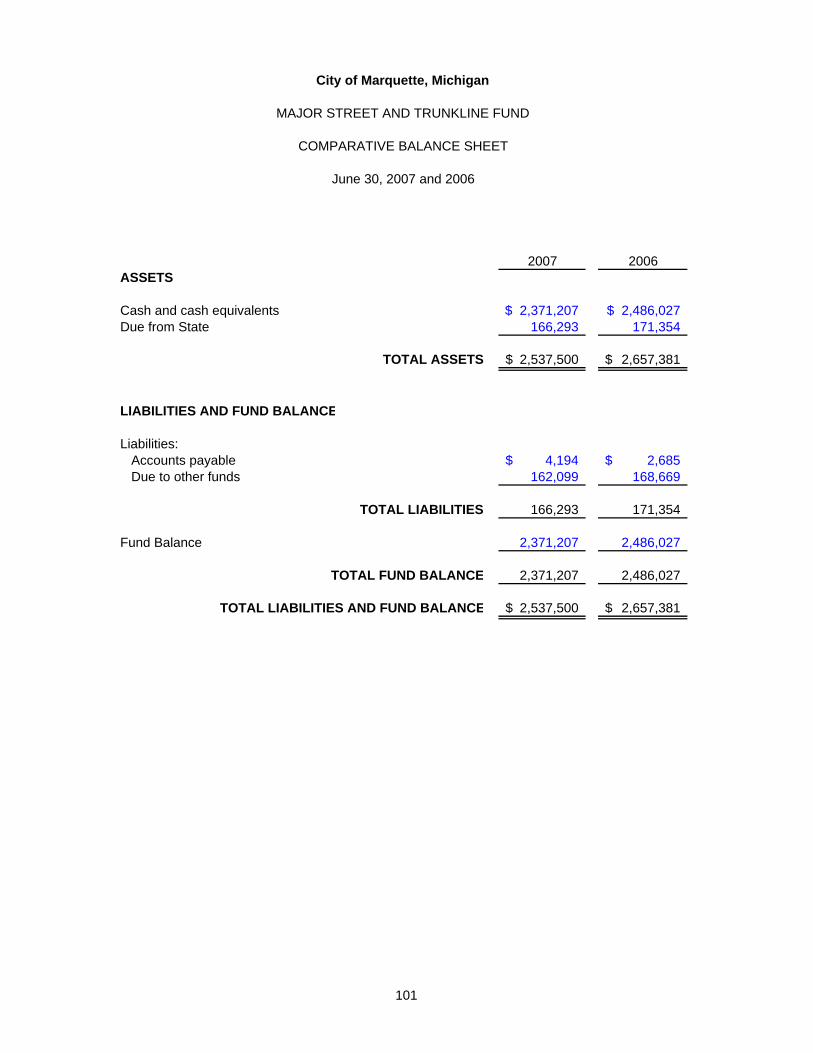
E
City of Marquette, Michigan
MAJOR STREET AND TRUNKLINE FUND
COMPARATIVE BALANCE SHEET
June 30, 2007 and 2006
2007 2006ASSETS
Cash and cash equivalents 2,371,207$ 2,486,027$ Due from State 166,293 171,354
TOTAL ASSETS 2,537,500$ 2,657,381$
LIABILITIES AND FUND BALANCE
Liabilities: Accounts payable 4,194$ 2,685$ Due to other funds 162,099 168,669
TOTAL LIABILITIES 166,293 171,354
Fund Balance 2,371,207 2,486,027
TOTAL FUND BALANCE 2,371,207 2,486,027
TOTAL LIABILITIES AND FUND BALANC 2,537,500$ 2,657,381$
101

City of Marquette, Michigan
MAJOR STREET AND TRUNKLINE FUND
STATEMENT OF REVENUES, EXPENDITURES AND CHANGES INFUND BALANCE - BUDGET AND ACTUAL
For the Fiscal Year Ended June 30, 2007With Comparative Actual Amounts for the Fiscal Year Ended June 30, 2006
2007 2006Variance with
Actual Final Budget ActualFinal GAAP Positive GAAP
Budget Basis (Negative) BasisREVENUES:
Federal sources -$ -$ -$ 2,486,027$ State sources 1,275,550 1,212,118 (63,432) 1,189,406
TOTAL REVENUES 1,275,550 1,212,118 (63,432) 3,675,433
EXPENDITURES:Highways, Streets and Bridges:
Routine maintenance 469,524 435,803 33,721 437,571 Winter maintenance 575,986 388,819 187,167 449,841 State trunkline 95,910 73,003 22,907 53,516 Administration 340,880 340,637 243 259,632
Total Highways, Streets and Bridges 1,482,300 1,238,262 244,038 1,200,560
Capital Outlay - Construction:Construction 487,797 354,266 133,531 40,384
Total Capital Outlay - Construction 487,797 354,266 133,531 40,384
Debt Service:Principal retirement 307,000 306,986 14 293,443 Interest and fiscal charges 38,020 38,018 2 51,532
Total Debt Service 345,020 345,004 16 344,975
TOTAL EXPENDITURES 2,315,117 1,937,532 377,585 1,585,919
EXCESS OF REVENUES OVER(UNDER) EXPENDITURES (1,039,567) (725,414) 314,153 2,089,514
OTHER FINANCING SOURCES (USES):Transfers in:
General Fund 757,873 757,456 (417) 803,554 Transfers (out):
Debt Service Fund (85,950) - 85,950 - Construction Fund (2,528,000) (146,862) 2,381,138 (407,041)
TOTAL OTHER FINANCING SOURCES (USES) (1,856,077) 610,594 2,466,671 396,513
CHANGE IN FUND BALANCE (2,895,644) (114,820) 2,780,824 2,486,027
Fund balance, beginning of year 2,486,027 2,486,027 - -
FUND BALANCE, END OF YEAR (409,617)$ 2,371,207$ 2,780,824$ 2,486,027$
102

E
City of Marquette, Michigan
LOCAL STREET FUND
COMPARATIVE BALANCE SHEET
June 30, 2007 and 2006
2007 2006ASSETS
Cash and cash equivalents -$ 149,384$ Due from State 55,785 56,459
TOTAL ASSETS 55,785$ 205,843$
LIABILITIES AND FUND BALANCE
Liabilities: Accounts payable 5,439$ 852$ Due to other funds 50,346 55,607
TOTAL LIABILITIES 55,785 56,459
Fund Balance - 149,384
TOTAL FUND BALANCE - 149,384
TOTAL LIABILITIES AND FUND BALANC 55,785$ 205,843$
103
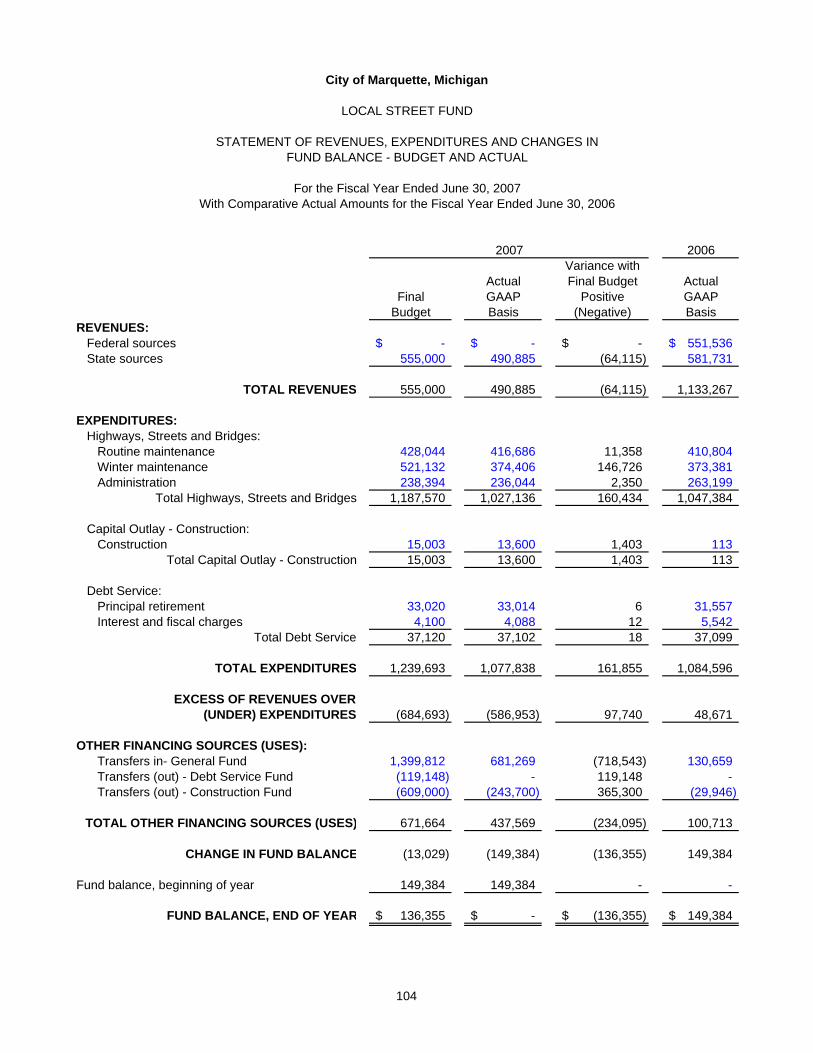
City of Marquette, Michigan
LOCAL STREET FUND
STATEMENT OF REVENUES, EXPENDITURES AND CHANGES INFUND BALANCE - BUDGET AND ACTUAL
For the Fiscal Year Ended June 30, 2007With Comparative Actual Amounts for the Fiscal Year Ended June 30, 2006
2007 2006Variance with
Actual Final Budget ActualFinal GAAP Positive GAAP
Budget Basis (Negative) BasisREVENUES:
Federal sources -$ -$ -$ 551,536$ State sources 555,000 490,885 (64,115) 581,731
TOTAL REVENUES 555,000 490,885 (64,115) 1,133,267
EXPENDITURES:Highways, Streets and Bridges:
Routine maintenance 428,044 416,686 11,358 410,804 Winter maintenance 521,132 374,406 146,726 373,381 Administration 238,394 236,044 2,350 263,199
Total Highways, Streets and Bridges 1,187,570 1,027,136 160,434 1,047,384
Capital Outlay - Construction:Construction 15,003 13,600 1,403 113
Total Capital Outlay - Construction 15,003 13,600 1,403 113
Debt Service:Principal retirement 33,020 33,014 6 31,557 Interest and fiscal charges 4,100 4,088 12 5,542
Total Debt Service 37,120 37,102 18 37,099
TOTAL EXPENDITURES 1,239,693 1,077,838 161,855 1,084,596
EXCESS OF REVENUES OVER(UNDER) EXPENDITURES (684,693) (586,953) 97,740 48,671
OTHER FINANCING SOURCES (USES):Transfers in- General Fund 1,399,812 681,269 (718,543) 130,659 Transfers (out) - Debt Service Fund (119,148) - 119,148 - Transfers (out) - Construction Fund (609,000) (243,700) 365,300 (29,946)
TOTAL OTHER FINANCING SOURCES (USES) 671,664 437,569 (234,095) 100,713
CHANGE IN FUND BALANCE (13,029) (149,384) (136,355) 149,384
Fund balance, beginning of year 149,384 149,384 - -
FUND BALANCE, END OF YEAR 136,355$ -$ (136,355)$ 149,384$
104

E
City of Marquette, Michigan
CONSTRUCTION FUND
COMPARATIVE BALANCE SHEET
June 30, 2007 and 2006
2007 2006ASSETS
Cash and cash equivalents 3,814,058$ 56,404$ Accounts receivable 344,525 344,526 Due from other funds 1,693,175 -
TOTAL ASSETS 5,851,758$ 400,930$
LIABILITIES AND FUND BALANCE
Liabilities:Accounts payable 1,379,729$ 42,674$
TOTAL LIABILITIES 1,379,729 42,674
Fund Balance 4,472,029 358,256
TOTAL FUND BALANCE 4,472,029 358,256
TOTAL LIABILITIES AND FUND BALANC 5,851,758$ 400,930$
105

City of Marquette, Michigan
CONSTRUCTION FUND
STATEMENT OF REVENUES, EXPENDITURES AND CHANGES INFUND BALANCE - BUDGET AND ACTUAL
For the Fiscal Year Ended June 30, 2007With Comparative Actual Amounts for the Fiscal Year Ended June 30, 2006
2007 2006Variance with
Actual Final Budget ActualFinal GAAP Positive GAAP
Budget Basis (Negative) BasisREVENUES: State and Federal sources -$ 41,503$ 41,503$ 547,762$ Investment income - 213,183 213,183 63,416
TOTAL REVENUES - 254,686 254,686 611,178
EXPENDITURES:Capital Outlay:
Public works 911,080 384,781 526,299 1,282,772 Highways, streets and bridges 14,363,723 3,007,939 11,355,784 512,031
Other - Bond Issuance Costs - 43,463 (43,463) -
TOTAL EXPENDITURES 15,274,803 3,436,183 11,838,620 1,794,803
EXCESS OF REVENUES OVER(UNDER) EXPENDITURES (15,274,803) (3,181,497) 12,093,306 (1,183,625)
OTHER FINANCING SOURCES (USES): Issuance of debt 7,779,803 5,684,061 (2,095,742) - Transfers in:
General Fund - 81,534 81,534 291,885 Major Street Fund 2,528,000 146,862 (2,381,138) 407,041 Local Street Fund 609,000 243,700 (365,300) 29,946 Stormwater Utiltiy Fund 15,000 148,640 133,640 - Water & Sewer Fund 4,343,000 1,072,438 (3,270,562) -
Transfers (out):General Fund - (81,965) (81,965) -
TOTAL OTHER FINANCING SOURCES 15,274,803 7,295,270 (7,979,533) 728,872
CHANGE IN FUND BALANCE - 4,113,773 4,113,773 (454,753)
Fund balance, beginning of year 358,256 358,256 - 813,009
FUND BALANCE, END OF YEAR 358,256$ 4,472,029$ 4,113,773$ 358,256$
106

City of Marquette, Michigan
FORESTLAND - DEBT SERVICE FUND
COMPARATIVE BALANCE SHEET
June 30, 2007 and 2006
2007 2006ASSETS
Cash and cash equivalents -$ 64,028$ Accounts receivable 35,000 - Due from other funds 298,078 -
TOTAL ASSETS 333,078$ 64,028$
LIABILITIES AND FUND BALANCE
Liabilities:Cash overdraft 203,382$ -$
TOTAL LIABILITIES 203,382 -
Fund Balance: Reserved for Debt Service 129,696 64,028
TOTAL FUND BALANCE 129,696 64,028
TOTAL LIABILITIES AND FUND BALANCE 333,078$ 64,028$
107

City of Marquette, Michigan
FORESTLAND - DEBT SERVICE FUND
STATEMENT OF REVENUES, EXPENDITURES AND CHANGES INFUND BALANCE - BUDGET AND ACTUAL
For the Fiscal Year Ended June 30, 2007With Comparative Actual Amounts for the Fiscal Year Ended June 30, 2006
2007 2006Variance with
Actual Final Budget ActualFinal GAAP Positive GAAP
Budget Basis (Negative) BasisREVENUES:
Investment income -$ -$ -$ -$ Other - - - -
TOTAL REVENUES - - - -
EXPENDITURES:Debt Service:
Professional and contractual - 255,333 (255,333) 209,984 Principal 231,000 - 231,000 - Interest and fiscal charges 239,000 214,608 24,392 194,986
TOTAL EXPENDITURES 470,000 469,941 59 404,970
EXCESS OF REVENUES OVER(UNDER) EXPENDITURES (470,000) (469,941) 59 (404,970)
OTHER FINANCING SOURCES (USES):Bond Issuance - 5,135,000 5,135,000 - Premium on Bond Issuance - 3,792 3,792 - Payment to refunded bond escrow agent - (5,082,566) (5,082,566) - Transfers in:
General Fund 470,000 479,383 9,383 468,998
TOTAL OTHER FINANCING SOURCES 470,000 535,609 65,609 468,998
CHANGES IN FUND BALANCE - 65,668 65,668 64,028
Fund balance, beginning of year 64,028 64,028 - -
FUND BALANCE, END OF YEAR 64,028$ 129,696$ 65,668$ 64,028$
108

City of Marquette, Michigan
NONMAJOR GOVERNMENTAL FUNDS
COMBINING AND INDIVIDUAL FUND STATEMENTS AND SCHEDULES SPECIAL REVENUE FUNDS The function of the Special Revenue Funds is to record revenue and expenditures for specific functions or activities within restrictions imposed by City Charter, ordinances, resolutions and/or Federal and State statues. The modified accrual basis of accounting is used in recording Special Revenue Fund transactions. ENVIRONMENTAL PROTECTION FUND: To account for the State of Michigan Site Reclamation Grant to be used for the environmental clean-up of City owned property at the corner of Washington and McClellan. CRIMINAL JUSTICE TRAINING FUND: To account for the funds received from the State of Michigan for the purpose of ongoing training in the police department. MSHDA DOWNTOWN RENTAL FUND: To account for the expenditures and revenues associated with the Michigan State Housing Development Authority Downtown Rental grant. MSHDA HOMEOWNER REPAIR FUND: To account for the expenditures and revenues associated with the Michigan State Housing Development Authority Downtown Homeowner grant. LAKEVIEW ARENA FUND: To record revenues and expenditures associated with the operation of the Lakeview Arena facility.
DEBT SERVICE FUNDS The function of the Debt Service Funds is to account for the accumulation of resources and payment of general obligation principal and interest from the governmental resources. The modified accrual basis of accounting is used in recording Debt Service Fund transactions. 1998 BUILDING AUTHORITY MUNICIPAL CENTER DEBT SERVICE FUND: This fund was established in 1999 to account for the retirement of the 1998 Building Authority Refunding Bonds. These bonds, totaling $4,535,000, were issued to advance refund a portion of the 1991 Building Authority Bonds.
109

110
1998 BUILDING AUTHORITY LAKEVIEW ARENA DEBT SERVICE FUND: This fund was established in 1999 to account for the retirement of the 1998 Building Authority Bonds – Lakeview Arena. These bonds, totaling $1,000,000, were issued for the purpose of defraying the cost of renovating, constructing, furnishing, and equipping improvements to the existing Lakeview Arena building. 2003 FOUNDERS LANDING DEBT SERVICE FUND: This fund was established in 2004 to account for the retirement of the 2003 General Obligation Bonds. These bonds, totaling $3,935,000, were issued for the purpose of reimbursing the City for certain costs relating to the acquisition of waterfront property for the City’s park system, and paying the costs of designing, engineering, acquiring, preparing, constructing and equipping various park improvements. 2004 SPRING STREET DEBT SERVICE FUND: This fund was established in 2004 to account for the annual payments on the State Infrastructure Bank Note. This note was originally issued for $1,243,100 for the purpose of financing transportation infrastructure improvements through the County Road (CR) 550 Flood Repair and Spring Street Reconstruction project. PERMANENT FUNDS The function of Permanent Funds is to account for funds where only the interest earnings may be used. The principal cannot be spent. The accrual basis of accounting is used in recording Permanent Fund transactions. CEMETERY FUND: This fund is used to account for monies received for care of cemetery lots. The principal amount must be maintained intact and invested. Interest earnings are used to offset the City’s cost of the cemetery maintenance.
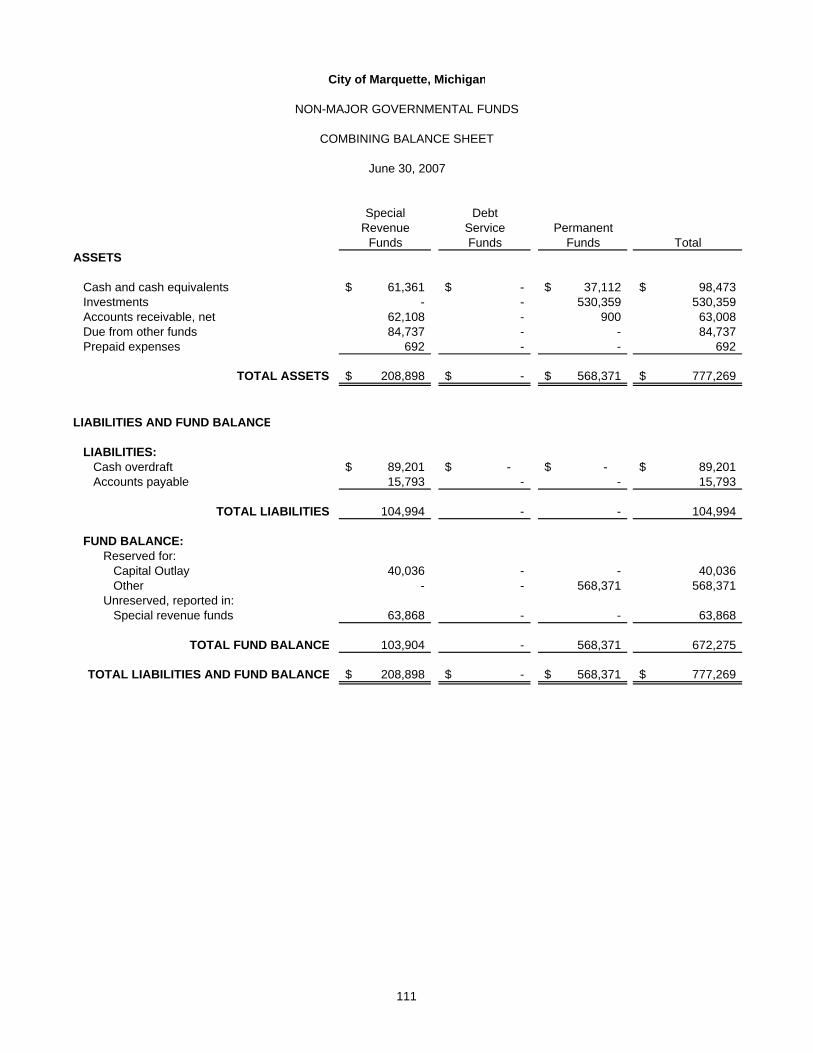
City of Marquette, Michigan
NON-MAJOR GOVERNMENTAL FUNDS
COMBINING BALANCE SHEET
June 30, 2007
Special DebtRevenue Service Permanent
Funds Funds Funds TotalASSETS
Cash and cash equivalents 61,361$ -$ 37,112$ 98,473$ Investments - - 530,359 530,359 Accounts receivable, net 62,108 - 900 63,008 Due from other funds 84,737 - - 84,737 Prepaid expenses 692 - - 692
TOTAL ASSETS 208,898$ -$ 568,371$ 777,269$
LIABILITIES AND FUND BALANCE
LIABILITIES:Cash overdraft 89,201$ -$ -$ 89,201$ Accounts payable 15,793 - - 15,793
TOTAL LIABILITIES 104,994 - - 104,994
FUND BALANCE:Reserved for:
Capital Outlay 40,036 - - 40,036 Other - - 568,371 568,371
Unreserved, reported in:Special revenue funds 63,868 - - 63,868
TOTAL FUND BALANCE 103,904 - 568,371 672,275
TOTAL LIABILITIES AND FUND BALANCE 208,898$ -$ 568,371$ 777,269$
111

City of Marquette, Michigan
NON-MAJOR GOVERNMENTAL FUNDS
COMBINING STATEMENT OF REVENUES, EXPENDITURES AND CHANGES IN FUND BALANCE
For the Fiscal Year Ended June 30, 2007
Special DebtRevenue Service Permanent
Funds Funds Funds TotalREVENUES:
State and Federal sources 64,934$ -$ -$ 64,934$ Charges for services 5,905 - 20,193 26,098 Sales 149,835 - - 149,835 Admission and usage 449,382 - - 449,382 Rentals 101,577 - - 101,577 Investment income 269 - 11,009 11,278 Other 30,813 - - 30,813
TOTAL REVENUES 802,715 - 31,202 833,917
EXPENDITURES:Current operations:
General government - - 139 139 Public health and safety 57,339 - - 57,339 Community development 75,420 - - 75,420 Recreation and culture 794,913 - - 794,913
Debt serviceRetirement of principal - 527,873 - 527,873 Interest and fiscal charges - 353,705 - 353,705
TOTAL EXPENDITURES 927,672 881,578 139 1,809,389
EXCESS OF REVENUES OVER(UNDER) EXPENDITURES (124,957) (881,578) 31,063 (975,472)
OTHER FINANCING SOURCES (USES):Transfers in 139,271 881,578 - 1,020,849 Transfers (out) - - (11,009) (11,009)
TOTAL OTHER FINANCING SOURCES (USES) 139,271 881,578 (11,009) 1,009,840
CHANGE IN FUND BALANCE 14,314 - 20,054 34,368
Fund balance, beginning of year 89,590 - 548,317 637,907
FUND BALANCE, END OF YEAR 103,904$ -$ 568,371$ 672,275$
112

City of Marquette, Michigan
NON-MAJOR SPECIAL REVENUE FUNDS
COMBINING BALANCE SHEET
June 30, 2007
Criminal MSHDA MSHDAEnvironmental Justice Downtown Homeowner Lakeview
Protection Training Rental Repair ArenaFund Fund Fund Fund Fund Total
ASSETS
Cash and cash equivalents -$ 15,969$ 45,392$ -$ -$ 61,361$ Accounts receivable, net - - - - 62,108 62,108 Due from other funds - - - - 84,737 84,737 Prepaid expenses - - - - 692 692
TOTAL ASSETS -$ 15,969$ 45,392$ -$ 147,537$ 208,898$
LIABILITIES AND FUND BALANCE
LIABILITIES:Cash overdraft -$ -$ -$ -$ 89,201$ 89,201$ Accounts payable - 576 - - 15,217 15,793
TOTAL LIABILITIES - 576 - - 104,418 104,994
FUND BALANCE:Reserved for:
Capital Outlay - - - - 40,036 40,036 Unreserved - 15,393 45,392 - 3,083 63,868
TOTAL FUND BALANCE - 15,393 45,392 - 43,119 103,904
TOTAL LIABILITIES AND FUND BALANCE -$ 15,969$ 45,392$ -$ 147,537$ 208,898$
113

City of Marquette, Michigan
NON-MAJOR SPECIAL REVENUE FUNDS
COMBINING STATEMENT OF REVENUES, EXPENDITURES AND CHANGES IN FUND BALANCE
For the Fiscal Year Ended June 30, 2007
Criminal MSHDA MSHDAEnvironmental Justice Downtown Homeowner Lakeview
Protection Training Rental Repair ArenaFund Fund Fund Fund Fund Total
REVENUES:Federal and State sources -$ 7,743$ 57,191$ -$ -$ 64,934$ Charges for services - - - - 5,905 5,905 Sales - - - - 149,835 149,835 Admission and usage - - - - 449,382 449,382 Rentals - - 101,577 101,577 Investment income - 269 - - - 269 Other - - 28,836 - 1,977 30,813
TOTAL REVENUES - 8,012 86,027 - 708,676 802,715
EXPENDITURES:Current operations:
Public health and safety - 8,270 - - - 8,270 Community development - - 75,420 - - 75,420 Recreation and culture - - - - 794,913 794,913 Other 49,069 - - - - 49,069
TOTAL EXPENDITURES 49,069 8,270 75,420 - 794,913 927,672
EXCESS OF REVENUES OVER(UNDER) EXPENDITURES (49,069) (258) 10,607 - (86,237) (124,957)
OTHER FINANCING SOURCES (USES):Transfers in (out) 35,801 - 17,245 (12) 86,237 139,271
TOTAL OTHER FINANCING SOURCES (USES) 35,801 - 17,245 (12) 86,237 139,271
CHANGES IN FUND BALANCE (13,268) (258) 27,852 (12) - 14,314
Fund balance, beginning of year 13,268 15,651 17,540 12 43,119 89,590
FUND BALANCE, END OF YEAR -$ 15,393$ 45,392$ -$ 43,119$ 103,904$
114

E
City of Marquette, Michigan
ENVIRONMENTAL PROTECTION FUND
COMPARATIVE BALANCE SHEET
June 30, 2007 and 2006
2007 2006
ASSETS
Cash and cash equivalents -$ 14,084$ Due from State - 52,857
TOTAL ASSETS -$ 66,941$
LIABILITIES AND FUND BALANCE
Liabilities: Due to other funds -$ 53,673$
TOTAL LIABILITIES - 53,673
Fund Balance - 13,268
TOTAL LIABILITIES AND FUND BALANC -$ 66,941$
115
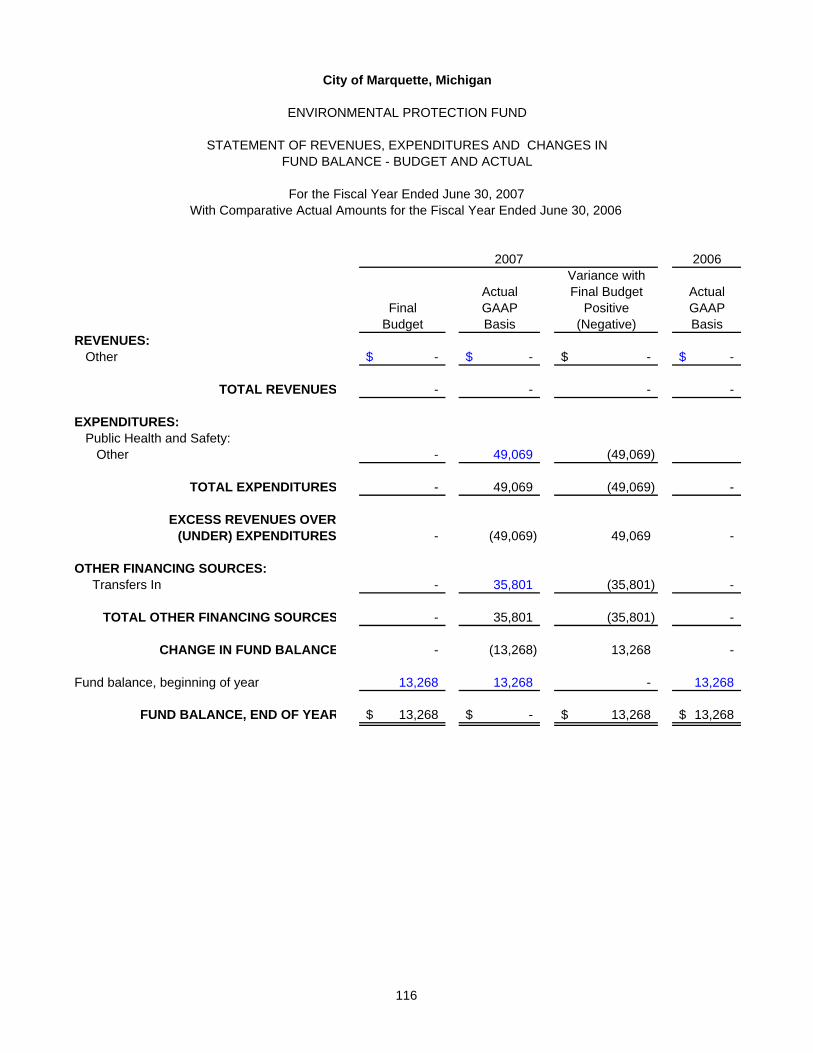
E
R
City of Marquette, Michigan
ENVIRONMENTAL PROTECTION FUND
STATEMENT OF REVENUES, EXPENDITURES AND CHANGES INFUND BALANCE - BUDGET AND ACTUAL
For the Fiscal Year Ended June 30, 2007With Comparative Actual Amounts for the Fiscal Year Ended June 30, 2006
2007 2006Variance with
Actual Final Budget ActualFinal GAAP Positive GAAP
Budget Basis (Negative) BasisREVENUES:
Other -$ -$ -$ -$
TOTAL REVENUES - - - -
EXPENDITURES:Public Health and Safety:
Other - 49,069 (49,069)
TOTAL EXPENDITURES - 49,069 (49,069) -
EXCESS REVENUES OVER(UNDER) EXPENDITURES - (49,069) 49,069 -
OTHER FINANCING SOURCES: Transfers In - 35,801 (35,801) -
TOTAL OTHER FINANCING SOURCES - 35,801 (35,801) -
CHANGE IN FUND BALANC - (13,268) 13,268 -
Fund balance, beginning of year 13,268 13,268 - 13,268
FUND BALANCE, END OF YEA 13,268$ -$ 13,268$ 13,268$
116

E
City of Marquette, Michigan
CRIMINAL JUSTICE TRAINING FUND
COMPARATIVE BALANCE SHEET
June 30, 2007 and 2006
2007 2006
ASSETS
Cash and cash equivalents 15,969$ 15,909$
TOTAL ASSETS 15,969$ 15,909$
LIABILITIES AND FUND BALANCE
Liabilities: Accounts payable 576$ 258$
TOTAL LIABILITIES 576 258
Fund Balance 15,393 15,651
TOTAL LIABILITIES AND FUND BALANC 15,969$ 15,909$
117
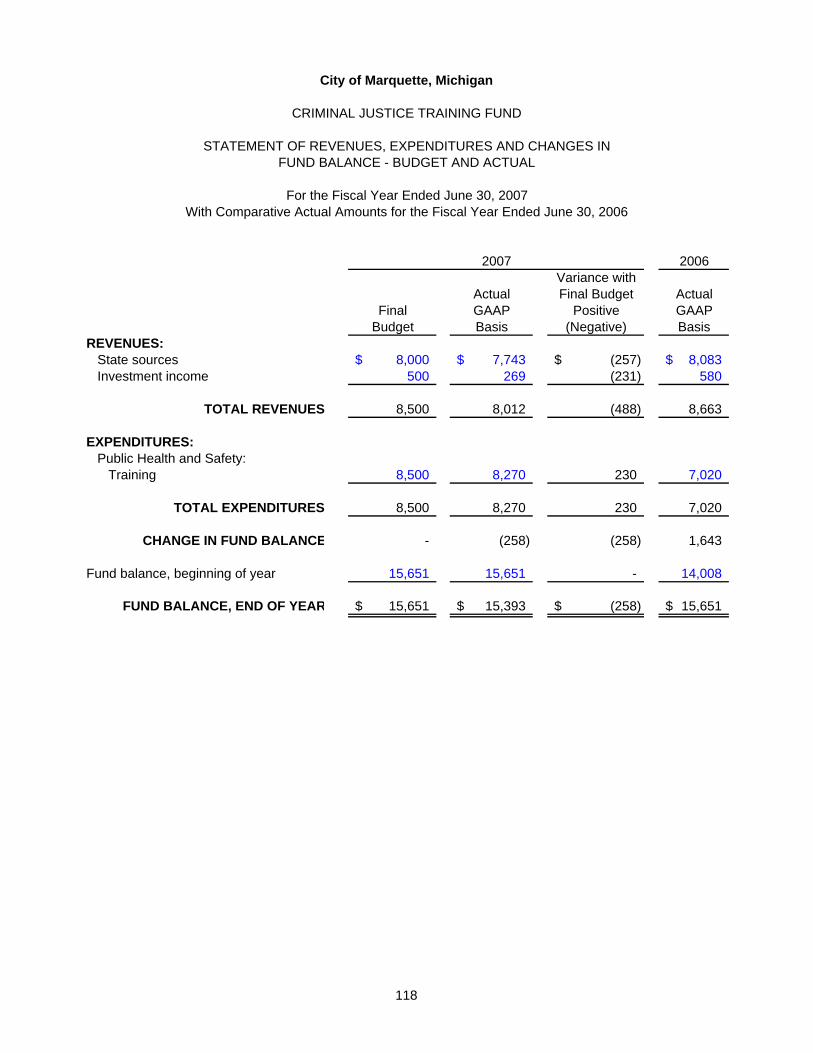
City of Marquette, Michigan
CRIMINAL JUSTICE TRAINING FUND
STATEMENT OF REVENUES, EXPENDITURES AND CHANGES INFUND BALANCE - BUDGET AND ACTUAL
For the Fiscal Year Ended June 30, 2007With Comparative Actual Amounts for the Fiscal Year Ended June 30, 2006
2007 2006Variance with
Actual Final Budget ActualFinal GAAP Positive GAAP
Budget Basis (Negative) BasisREVENUES:
State sources 8,000$ 7,743$ (257)$ 8,083$ Investment income 500 269 (231) 580
TOTAL REVENUES 8,500 8,012 (488) 8,663
EXPENDITURES:Public Health and Safety:
Training 8,500 8,270 230 7,020
TOTAL EXPENDITURES 8,500 8,270 230 7,020
CHANGE IN FUND BALANCE - (258) (258) 1,643
Fund balance, beginning of year 15,651 15,651 - 14,008
FUND BALANCE, END OF YEAR 15,651$ 15,393$ (258)$ 15,651$
118

E
City of Marquette, Michigan
MSHDA DOWNTOWN RENTAL FUND
COMPARATIVE BALANCE SHEET
June 30, 2007 and 2006
ASSETS 2007 2006
Cash and cash equivalents 45,392$ -$ Due from other governments - 17,711 Prepaid expenses - 8
TOTAL ASSETS 45,392$ 17,719$
LIABILITIES AND FUND BALANCE
Liabilities:Accounts payable -$ 179$
TOTAL LIABILITIES - 179
Fund Balance: Unreserved 45,392 17,540
TOTAL FUND BALANCE 45,392 17,540
TOTAL LIABILITIES AND FUND BALANC 45,392$ 17,719$
119

E
R
City of Marquette, Michigan
MSHDA DOWNTOWN RENTAL FUND
STATEMENT OF REVENUES, EXPENDITURES AND CHANGES INFUND BALANCE - BUDGET AND ACTUAL
For the Fiscal Year Ended June 30, 2007With Comparative Actual Amounts for the Fiscal Year Ended June 30, 2006
2007 2006Variance with
Actual Final Budget ActualFinal GAAP Positive GAAP
Budget Basis (Negative) BasisREVENUES:
Federal sources 53,638$ 57,191$ 3,553$ 84,302$ Other 22,878 28,836 5,958 54,303
TOTAL REVENUES 76,516 86,027 9,511 138,605
EXPENDITURES:Community Development:
Salaries and wages 12,800 13,300 (500) 26,699 Fringe benefits 5,650 2,514 3,136 14,636 Other services and charges 73,395 59,606 13,789 111,626
TOTAL EXPENDITURES 91,845 75,420 16,425 152,961
EXCESS OF REVENUES OVER(UNDER) EXPENDITURES (15,329) 10,607 25,936 (14,356)
OTHER FINANCING SOURCES: Transfers In 17,245 17,245 27,463
TOTAL OTHER FINANCING (USES) - 17,245 17,245 27,463
CHANGE IN FUND BALANC (15,329) 27,852 43,181 13,107
Fund balance, beginning of year 17,540 17,540 - 4,433
FUND BALANCE, END OF YEA 2,211$ 45,392$ 43,181$ 17,540$
120

E
City of Marquette, Michigan
MSHDA HOMEOWNER REPAIR FUND
COMPARATIVE BALANCE SHEET
June 30, 2007 and 2006
ASSETS 2007 2006
Cash -$ 12$
TOTAL ASSETS -$ 12$
LIABILITIES AND FUND BALANCE
Liabilities:Accounts payable -$ -$
TOTAL LIABILITIES - -
Fund Balance: Unreserved - 12
TOTAL FUND BALANCE - 12
TOTAL LIABILITIES AND FUND BALANC -$ 12$
121

E
R
City of Marquette, Michigan
MSHDA HOMEOWNER REPAIR FUND
STATEMENT OF REVENUES, EXPENDITURES AND CHANGES INFUND BALANCE - BUDGET AND ACTUAL
For the Fiscal Year Ended June 30, 2007With Comparative Actual Amounts for the Fiscal Year Ended June 30, 2006
2007 2006Variance with
Actual Final Budget ActualFinal GAAP Positive GAAP
Budget Basis (Negative) BasisREVENUES:
State sources -$ -$ -$ 7,070$ Other - - - 12,997
TOTAL REVENUES - - - 20,067
EXPENDITURES:Community Development:
Other services and charges - - - 20,055
TOTAL EXPENDITURES - - - 20,055
EXCESS OF REVENUES OVER(UNDER) EXPENDITURES - - - 12
OTHER FINANCING (USES):Transfers (Out) - MSHDA Downtown Rental Fund - (12) (12) -
TOTAL OTHER FINANCING SOURCES - (12) (12) -
CHANGE IN FUND BALANC - (12) (12) 12
Fund balance, beginning of year 12 12 - -
FUND BALANCE, END OF YEA 12$ -$ (12)$ 12$
122

E
City of Marquette, Michigan
LAKEVIEW ARENA FUND
COMPARATIVE BALANCE SHEET
June 30, 2007 and 2006
2007 2006ASSETS
Cash and cash equivalents -$ 46,894$ Accounts receivable 62,108 5,152 Due from other funds 84,737 - Prepaid expenses 692 2,659
TOTAL ASSETS 147,537$ 54,705$
LIABILITIES AND FUND BALANCE
Liabilities:Cash overdraft 89,201$ -$ Accounts payable 15,217 11,586
TOTAL LIABILITIES 104,418 11,586
Fund Balance: Reserved for capital outlay 40,036 35,036 Unreserved 3,083 8,083
TOTAL FUND BALANCE 43,119 43,119
TOTAL LIABILITIES AND FUND BALANC 147,537$ 54,705$
123
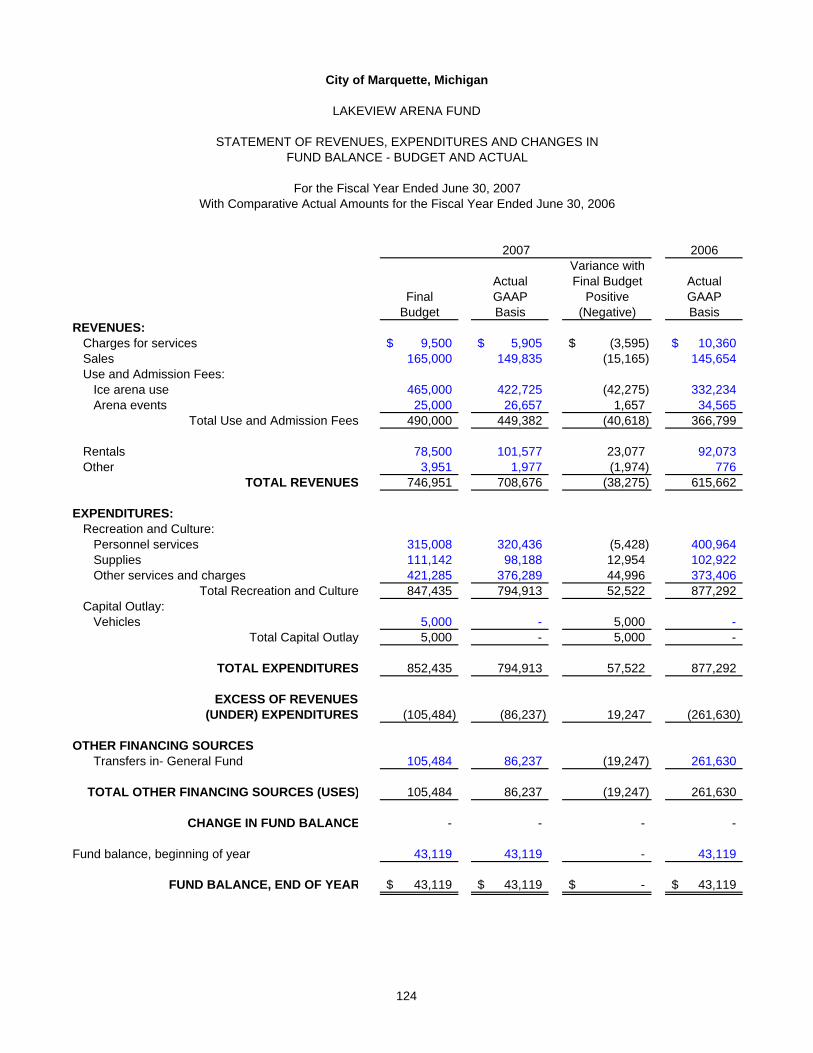
E
R
City of Marquette, Michigan
LAKEVIEW ARENA FUND
STATEMENT OF REVENUES, EXPENDITURES AND CHANGES INFUND BALANCE - BUDGET AND ACTUAL
For the Fiscal Year Ended June 30, 2007With Comparative Actual Amounts for the Fiscal Year Ended June 30, 2006
2007 2006Variance with
Actual Final Budget ActualFinal GAAP Positive GAAP
Budget Basis (Negative) BasisREVENUES:
Charges for services 9,500$ 5,905$ (3,595)$ 10,360$ Sales 165,000 149,835 (15,165) 145,654 Use and Admission Fees:
Ice arena use 465,000 422,725 (42,275) 332,234 Arena events 25,000 26,657 1,657 34,565
Total Use and Admission Fees 490,000 449,382 (40,618) 366,799
Rentals 78,500 101,577 23,077 92,073 Other 3,951 1,977 (1,974) 776
TOTAL REVENUES 746,951 708,676 (38,275) 615,662
EXPENDITURES:Recreation and Culture:
Personnel services 315,008 320,436 (5,428) 400,964 Supplies 111,142 98,188 12,954 102,922 Other services and charges 421,285 376,289 44,996 373,406
Total Recreation and Culture 847,435 794,913 52,522 877,292 Capital Outlay:
Vehicles 5,000 - 5,000 - Total Capital Outlay 5,000 - 5,000 -
TOTAL EXPENDITURES 852,435 794,913 57,522 877,292
EXCESS OF REVENUES(UNDER) EXPENDITURES (105,484) (86,237) 19,247 (261,630)
OTHER FINANCING SOURCES Transfers in- General Fund 105,484 86,237 (19,247) 261,630
TOTAL OTHER FINANCING SOURCES (USES) 105,484 86,237 (19,247) 261,630
CHANGE IN FUND BALANC - - - -
Fund balance, beginning of year 43,119 43,119 - 43,119
FUND BALANCE, END OF YEA 43,119$ 43,119$ -$ 43,119$
124

City of Marquette, Michigan
NON-MAJOR DEBT SERVICE FUNDS
COMBINING BALANCE SHEET
June 30, 2007
1998 1998 2003 2004Municipal Lakeview Founders Spring
Center Arena Landing StreetFund Fund Fund Fund Total
ASSETS
Cash and cash equivalents -$ -$ -$ -$ -$ Accounts receivable - - - - - Due from other funds - - - - -
TOTAL ASSETS -$ -$ -$ -$ -$
LIABILITIES AND FUND BALANCE
LIABILITIES:Cash overdraft -$ -$ -$ -$ -$
TOTAL LIABILITIES - - - - -
FUND BALANCE:Reserved for:
Retirement of debt - - - - -
TOTAL FUND BALANCE - - - - -
TOTAL LIABILITIES AND FUND BALANCE -$ -$ -$ -$ -$
125
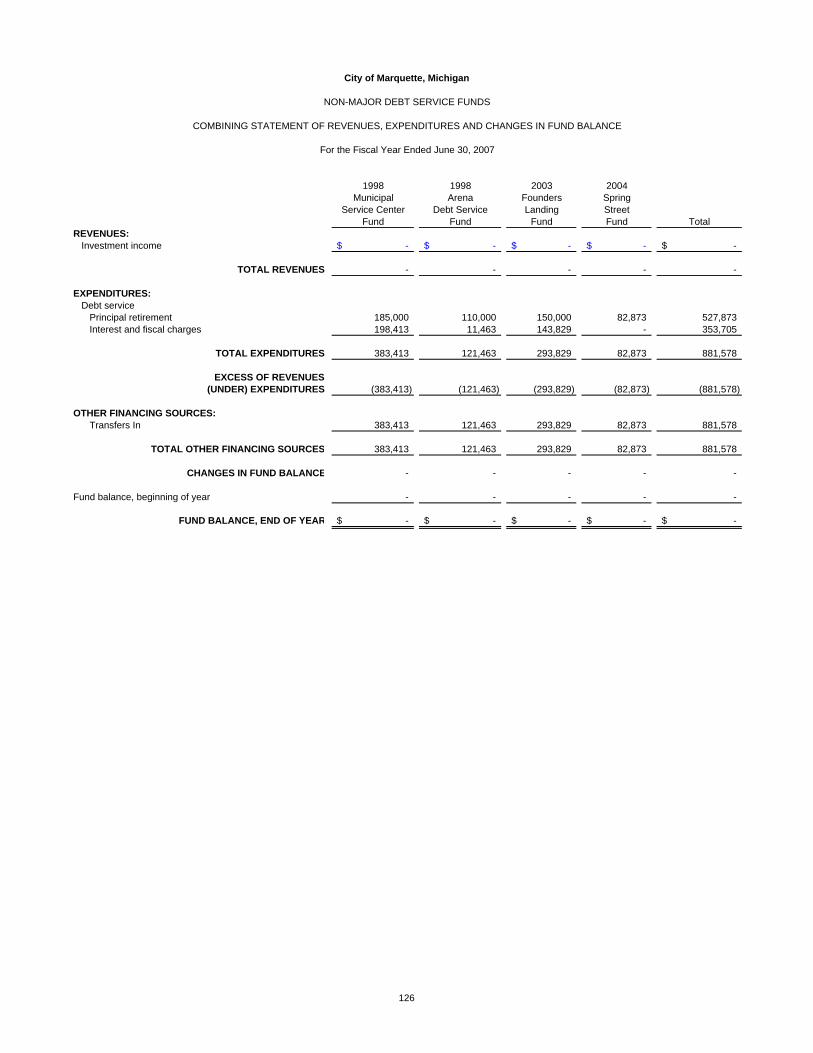
City of Marquette, Michigan
NON-MAJOR DEBT SERVICE FUNDS
COMBINING STATEMENT OF REVENUES, EXPENDITURES AND CHANGES IN FUND BALANCE
For the Fiscal Year Ended June 30, 2007
1998 1998 2003 2004Municipal Arena Founders Spring
Service Center Debt Service Landing StreetFund Fund Fund Fund Total
REVENUES:Investment income -$ -$ -$ -$ -$
TOTAL REVENUES - - - - -
EXPENDITURES:Debt service
Principal retirement 185,000 110,000 150,000 82,873 527,873 Interest and fiscal charges 198,413 11,463 143,829 - 353,705
TOTAL EXPENDITURES 383,413 121,463 293,829 82,873 881,578
EXCESS OF REVENUES(UNDER) EXPENDITURES (383,413) (121,463) (293,829) (82,873) (881,578)
OTHER FINANCING SOURCES:Transfers In 383,413 121,463 293,829 82,873 881,578
TOTAL OTHER FINANCING SOURCES 383,413 121,463 293,829 82,873 881,578
CHANGES IN FUND BALANCE - - - - -
Fund balance, beginning of year - - - - -
FUND BALANCE, END OF YEAR -$ -$ -$ -$ -$
126

City of Marquette, Michigan
1998 BUILDING AUTHORITY MUNICIPAL SERVICE CENTER - DEBT SERVICE FUND
STATEMENT OF REVENUES, EXPENDITURES AND CHANGES INFUND BALANCE - BUDGET AND ACTUAL
For the Fiscal Year Ended June 30, 2007With Comparative Actual Amounts for the Fiscal Year Ended June 30, 2006
2007 2006Variance with
Actual Final Budget ActualFinal GAAP Positive GAAP
Budget Basis (Negative) BasisREVENUES:
Investment income -$ -$ -$ -$ Other - - - -
TOTAL REVENUES - - - -
EXPENDITURES:Debt Service:
Principal 185,000 185,000 - 175,000 Interest and fiscal charges 198,420 198,413 7 206,113
TOTAL EXPENDITURES 383,420 383,413 7 381,113
EXCESS OF REVENUES (UNDER) EXPENDITURES (383,420) (383,413) 7 (381,113)
OTHER FINANCING SOURCES:Transfers in:
Municipal Service Center Fund 383,420 383,413 (7) 381,113
TOTAL OTHER FINANCING SOURCES 383,420 383,413 (7) 381,113
CHANGES IN FUND BALANCE - - - -
Fund balance, beginning of year - - - -
FUND BALANCE, END OF YEAR -$ -$ -$ -$
127

City of Marquette, Michigan
1998 BUILDING AUTHORITY LAKEVIEW ARENA - DEBT SERVICE FUND
STATEMENT OF REVENUES, EXPENDITURES AND CHANGES INFUND BALANCE - BUDGET AND ACTUAL
For the Fiscal Year Ended June 30, 2007With Comparative Actual Amounts for the Fiscal Year Ended June 30, 2006
2007 2006Variance with
Actual Final Budget ActualFinal GAAP Positive GAAP
Budget Basis (Negative) BasisREVENUES:
Investment income -$ -$ -$ -$ Other - - - -
TOTAL REVENUES - - - -
EXPENDITURES:Debt Service:
Principal 110,000 110,000 - 105,000 Interest and fiscal charges 11,465 11,463 2 16,975
TOTAL EXPENDITURES 121,465 121,463 2 121,975
EXCESS OF REVENUES (UNDER) EXPENDITURES (121,465) (121,463) 2 (121,975)
OTHER FINANCING SOURCES:Transfers in:
General Fund 121,465 121,463 (2) 121,975
TOTAL OTHER FINANCING SOURCES 121,465 121,463 (2) 121,975
CHANGES IN FUND BALANCE - - - -
Fund balance, beginning of year - - - -
FUND BALANCE, END OF YEAR -$ -$ -$ -$
128

City of Marquette, Michigan
2003 FOUNDERS LANDING - DEBT SERVICE FUND
STATEMENT OF REVENUES, EXPENDITURES AND CHANGES INFUND BALANCE - BUDGET AND ACTUAL
For the Fiscal Year Ended June 30, 2007With Comparative Actual Amounts for the Fiscal Year Ended June 30, 2006
2007 2006Variance with
Actual Final Budget ActualFinal GAAP Positive GAAP
Budget Basis (Negative) BasisREVENUES:
Investment income -$ -$ -$ -$ Other - - - -
TOTAL REVENUES - - - -
EXPENDITURES:Debt Service:
Principal 150,000 150,000 - 150,000 Interest and fiscal charges 143,830 143,829 1 147,204
TOTAL EXPENDITURES 293,830 293,829 1 297,204
EXCESS OF REVENUES OVER(UNDER) EXPENDITURES (293,830) (293,829) 1 (297,204)
OTHER FINANCING SOURCES:Transfers in:
General Fund 293,830 293,829 (1) 297,204
TOTAL OTHER FINANCING SOURCES 293,830 293,829 (1) 297,204
CHANGES IN FUND BALANCE - - - -
Fund balance, beginning of year - - - -
FUND BALANCE, END OF YEAR -$ -$ -$ -$
129

City of Marquette, Michigan
2004 SPRING STREET - DEBT SERVICE FUND
STATEMENT OF REVENUES, EXPENDITURES AND CHANGES INFUND BALANCE - BUDGET AND ACTUAL
For the Fiscal Year Ended June 30, 2007With Comparative Actual Amounts for the Fiscal Year Ended June 30, 2006
2007 2006Variance with
Actual Final Budget ActualFinal GAAP Positive GAAP
Budget Basis (Negative) BasisREVENUES:
Investment income -$ -$ -$ -$ Other - - - -
TOTAL REVENUES - - - -
EXPENDITURES:Debt Service:
Principal 82,874 82,873 1 82,873
TOTAL EXPENDITURES 82,874 82,873 1 82,873
EXCESS OF REVENUES OVER(UNDER) EXPENDITURES (82,874) (82,873) 1 (82,873)
OTHER FINANCING SOURCES:Transfers in:
General Fund 82,874 82,873 (1) 82,873
TOTAL OTHER FINANCING SOURCES 82,874 82,873 (1) 82,873
CHANGES IN FUND BALANCE - - - -
Fund balance, beginning of year - - - -
FUND BALANCE, END OF YEAR -$ -$ -$ -$
130

City of Marquette, Michigan
CEMETERY FUND
COMPARATIVE BALANCE SHEET
June 30, 2007 and 2006
2007 2006ASSETS
Cash and cash equivalents 37,112$ 27,857$ Investments 530,359 520,035 Accounts receivable 900 425
TOTAL ASSETS 568,371$ 548,317$
FUND BALANCE
Reserved for Cemetery 568,371$ 548,317$
TOTAL FUND BALANCE 568,371$ 548,317$
131
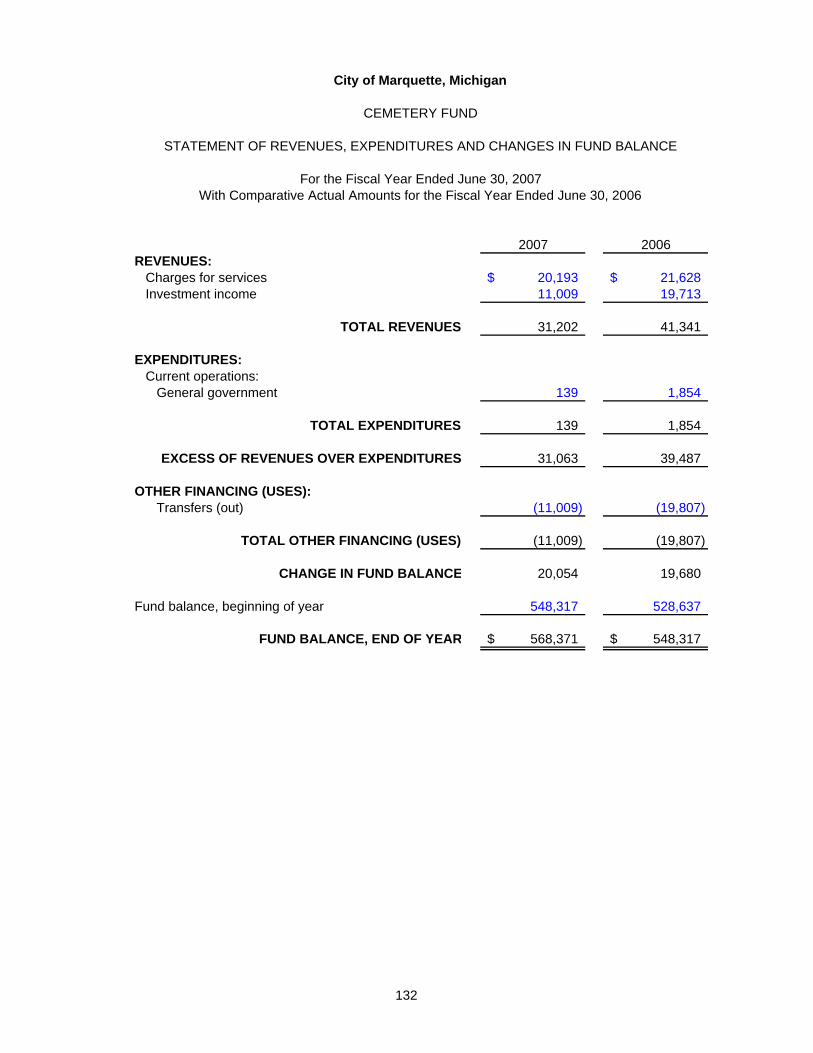
E
City of Marquette, Michigan
CEMETERY FUND
STATEMENT OF REVENUES, EXPENDITURES AND CHANGES IN FUND BALANCE
For the Fiscal Year Ended June 30, 2007With Comparative Actual Amounts for the Fiscal Year Ended June 30, 2006
2007 2006REVENUES:
Charges for services 20,193$ 21,628$ Investment income 11,009 19,713
TOTAL REVENUES 31,202 41,341
EXPENDITURES:Current operations:
General government 139 1,854
TOTAL EXPENDITURES 139 1,854
EXCESS OF REVENUES OVER EXPENDITURES 31,063 39,487
OTHER FINANCING (USES):Transfers (out) (11,009) (19,807)
TOTAL OTHER FINANCING (USES) (11,009) (19,807)
CHANGE IN FUND BALANC 20,054 19,680
Fund balance, beginning of year 548,317 528,637
FUND BALANCE, END OF YEAR 568,371$ 548,317$
132
City of Marquette, Michigan
ENTERPRISE FUNDS
COMBINING AND INDIVIDUAL FUND STATEMENTS AND SCHEDULES
The function of the Enterprise Funds is to record the financing, acquisition, operation and maintenance of City activities that are predominantly self-supporting from user charges. The accrual basis of accounting is used in recording Enterprise Fund transactions. The Nonmajor Enterprise Funds of the City are the Marina and Intermodal Transportation Funds. The Major Enterprise Funds of the City are the Water Supply and Sewage Disposal, and Stormwater Utility Funds. MARINA FUND: To account for activity at the City operated marinas. INTERMODAL TRANSPORTATION TERMINAL FUND: To account for operation of the City owned transportation terminal used by the County-wide Mass Transit Bus System. WATER SUPPLY AND SEWAGE DISPOSAL FUND: To account for water and sewer usage. STORMWATER UTILITY FUND: To account for the management of stormwater related activities including billing, maintenance and construction.
133

City of Marquette, Michigan
NON-MAJOR ENTERPRISE FUNDS
COMBINING STATEMENT OF NET ASSETS
June 30, 2007
IntermodalTransportation
Marina TerminalFund Fund Total
ASSETSCurrent Assets:
Accounts receivable 1,081$ -$ 1,081$ Unamortized bond issue costs 6,165 - 6,165 Inventory 16,961 - 16,961 Prepaid expenses 319 - 319
TOTAL CURRENT ASSETS 24,526 - 24,526
Non-current Assets:Restricted Assets:
Bond Reserve Fund 50,159 - 50,159 Bond and Interest Redemption Fund 309,916 - 309,916
Total Restricted Assets 360,075 - 360,075
Property, plant, and equipment 3,774,597 - 3,774,597 Accumulated depreciation (1,574,378) - (1,574,378)
TOTAL NON-CURRENT ASSETS 2,560,294 - 2,560,294
TOTAL ASSETS 2,584,820 - 2,584,820
LIABILITIESCurrent Liabilities:
Cash overdraft 35,217 - 35,217 Accounts payable 11,129 - 11,129 Due to other funds 142,256 - 142,256 Customer deposits payable 9,261 - 9,261 Current portion of long-term debt 70,000 - 70,000 Accrued interest payable 3,100 - 3,100
TOTAL CURRENT LIABILITIES 270,963 - 270,963
Non-current Liabilities:Bonds payable 460,000 - 460,000 Deferred amounts on refunding (23,453) - (23,453)
TOTAL NON-CURRENT LIABILITIES 436,547 - 436,547
TOTAL LIABILITIES 707,510 - 707,510
NET ASSETSInvested in capital assets net of related debt 1,670,219 - 1,670,219 Unrestricted 207,091 - 207,091
TOTAL NET ASSETS 1,877,310$ -$ 1,877,310$
134

City of Marquette, Michigan
NON-MAJOR ENTERPRISE FUNDS
COMBINING STATEMENT OF REVENUES, EXPENSES, AND CHANGES IN NET ASSETS
For the Fiscal Year Ended June 30, 2007
IntermodalTransportation
Marina TerminalFund Fund Total
OPERATING REVENUES:Charges for services 674$ 26,631$ 27,305$ Other 284,164 - 284,164
TOTAL OPERATING REVENUES 284,838 26,631 311,469
OPERATING EXPENSES:General and administrative 238,001 24,139 262,140 Depreciation 135,135 23,028 158,163
TOTAL OPERATING EXPENSES 373,136 47,167 420,303
OPERATING (LOSS) (88,298) (20,536) (108,834)
NON-OPERATING REVENUES (EXPENSES):Investment income 16,919 883 17,802 Interest expense (21,250) - (21,250)
TOTAL NON-OPERATING REVENUES (EXPENSES) (4,331) 883 (3,448)
NET (LOSS) BEFORE TRANSFERS IN (OUT)AND OTHER FINANCING SOURCES (USES) (92,629) (19,653) (112,282)
TRANSFERS IN (OUT)AND OTHER FINANCING SOURCES (USES)Sale of fixed assets - 415,642 415,642 Loss on sale of MarqTran Bldg - (1,327,843) (1,327,843) Transfers in (out) 27,417 (357,345) (329,928)
TOTAL TRANSFERS IN (OUT)AND OTHER FINANCING SOURCES (USES) 27,417 (1,269,546) (1,242,129)
CHANGE IN NET ASSETS (65,212) (1,289,199) (1,354,411)
Net assets, beginning of year 1,942,522 1,289,199 3,231,721
NET ASSETS, END OF YEAR 1,877,310$ -$ 1,877,310$
135
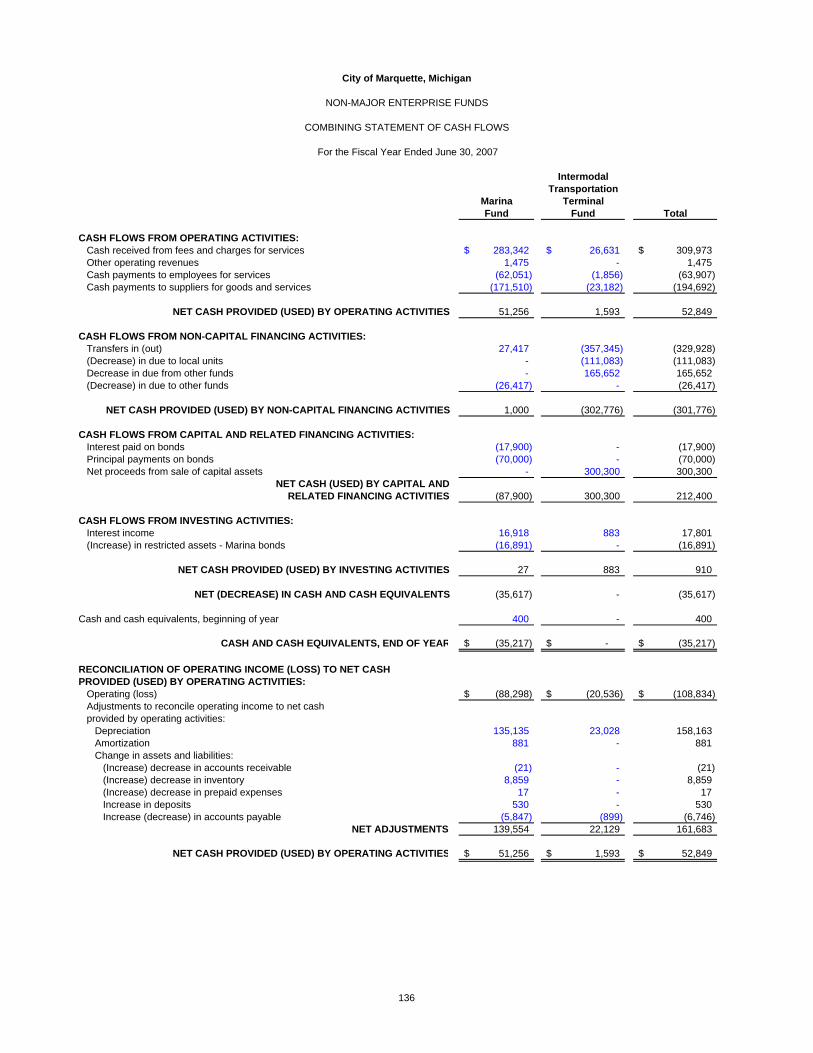
City of Marquette, Michigan
NON-MAJOR ENTERPRISE FUNDS
COMBINING STATEMENT OF CASH FLOWS
For the Fiscal Year Ended June 30, 2007
IntermodalTransportation
Marina TerminalFund Fund Total
CASH FLOWS FROM OPERATING ACTIVITIES:Cash received from fees and charges for services 283,342$ 26,631$ 309,973$ Other operating revenues 1,475 - 1,475 Cash payments to employees for services (62,051) (1,856) (63,907) Cash payments to suppliers for goods and services (171,510) (23,182) (194,692)
NET CASH PROVIDED (USED) BY OPERATING ACTIVITIES 51,256 1,593 52,849
CASH FLOWS FROM NON-CAPITAL FINANCING ACTIVITIES:Transfers in (out) 27,417 (357,345) (329,928) (Decrease) in due to local units - (111,083) (111,083) Decrease in due from other funds - 165,652 165,652 (Decrease) in due to other funds (26,417) - (26,417)
NET CASH PROVIDED (USED) BY NON-CAPITAL FINANCING ACTIVITIES 1,000 (302,776) (301,776)
CASH FLOWS FROM CAPITAL AND RELATED FINANCING ACTIVITIES:Interest paid on bonds (17,900) - (17,900) Principal payments on bonds (70,000) - (70,000) Net proceeds from sale of capital assets - 300,300 300,300
NET CASH (USED) BY CAPITAL ANDRELATED FINANCING ACTIVITIES (87,900) 300,300 212,400
CASH FLOWS FROM INVESTING ACTIVITIES:Interest income 16,918 883 17,801 (Increase) in restricted assets - Marina bonds (16,891) - (16,891)
NET CASH PROVIDED (USED) BY INVESTING ACTIVITIES 27 883 910
NET (DECREASE) IN CASH AND CASH EQUIVALENTS (35,617) - (35,617)
Cash and cash equivalents, beginning of year 400 - 400
CASH AND CASH EQUIVALENTS, END OF YEAR (35,217)$ -$ (35,217)$
RECONCILIATION OF OPERATING INCOME (LOSS) TO NET CASHPROVIDED (USED) BY OPERATING ACTIVITIES:
Operating (loss) (88,298)$ (20,536)$ (108,834)$ Adjustments to reconcile operating income to net cashprovided by operating activities:
Depreciation 135,135 23,028 158,163 Amortization 881 - 881 Change in assets and liabilities:
(Increase) decrease in accounts receivable (21) - (21) (Increase) decrease in inventory 8,859 - 8,859 (Increase) decrease in prepaid expenses 17 - 17 Increase in deposits 530 - 530 Increase (decrease) in accounts payable (5,847) (899) (6,746)
NET ADJUSTMENTS 139,554 22,129 161,683
NET CASH PROVIDED (USED) BY OPERATING ACTIVITIES 51,256$ 1,593$ 52,849$
136

City of Marquette, Michigan
MARINA FUND
COMPARATIVE STATEMENT OF NET ASSETS
June 30, 2007 and 2006
2007 2006ASSETS
Current Assets:Cash and cash equivalents -$ 400$ Accounts receivable 1,081 1,060 Unamortized bond issue costs 6,165 7,046 Inventory 16,961 25,820 Prepaid expense 319 336
TOTAL CURRENT ASSETS 24,526 34,662
Non-current Assets:Restricted Assets:
Bond Reserve Fund 50,159 103,268 Bond and Interest Redemption Fund 309,916 239,916
Total Restricted Assets 360,075 343,184
Property, plant and equipment 3,774,597 3,774,597 Allowance for depreciation (1,574,378) (1,439,243)
TOTAL NON-CURRENT ASSETS 2,560,294 2,678,538
TOTAL ASSETS 2,584,820 2,713,200
LIABILITIESCurrent Liabilities:
Cash overdraft 35,217 - Accounts payable 11,129 16,977 Due to other funds 142,256 168,673 Customer deposits payable 9,261 8,731 Current portion of long-term debt 70,000 70,000 Accrued interest 3,100 3,100
TOTAL CURRENT LIABILITIES 270,963 267,481 Non-current Liabilities:
Bonds payable 460,000 530,000 Deferred amount on refunding (23,453) (26,803)
TOTAL NON-CURRENT LIABILITIES 436,547 503,197
TOTAL LIABILITIES 707,510 770,678
NET ASSETSInvested in capital assets net of related debt 1,670,219 1,735,354 Unrestricted 207,091 207,168
TOTAL NET ASSETS 1,877,310$ 1,942,522$
137

City of Marquette, Michigan
MARINA FUND
STATEMENT OF REVENUES, EXPENSES AND CHANGES IN NET ASSETS - BUDGET AND ACTUAL
For the Fiscal Year Ended June 30, 2007With Comparative Actual Amounts for the Fiscal Year Ended June 30, 2006
2007 2006Variance with
Actual Final Budget ActualFinal GAAP Positive GAAP
Budget Basis (Negative) BasisOPERATING REVENUES:
Services 775$ 674$ (101)$ 688$ Sales of supplies 80,000 105,331 25,331 98,349 Use and admission fees 26,000 30,497 4,497 33,875 Rentals 150,934 146,861 (4,073) 146,683 Other 800 1,475 675 1,701
TOTAL OPERATING REVENUES 258,509 284,838 26,329 281,296
OPERATING EXPENSES: Administrative and General Expenses:
Personnel services 55,457 62,051 (6,594) 63,518 Professional services 25,524 26,282 (758) 23,224 Supplies 11,851 17,035 (5,184) 1,756 Utilities 14,700 13,399 1,301 12,706 Cost of sales 93,658 89,583 4,075 91,430 Other services and charges 43,447 28,770 14,677 21,401 Amortization 930 881 49 920 Provision for depreciation 130,000 135,135 (5,135) 136,911
TOTAL OPERATING EXPENSES 375,567 373,136 2,431 351,866
OPERATING (LOSS) (117,058) (88,298) 28,760 (70,570)
NON-OPERATING REVENUES (EXPENSES):Investment income 2,000 16,919 14,919 12,050 Interest expense (17,900) (21,250) (3,350) (22,567)
TOTAL NON-OPERATING REVENUES (EXPENSES) (15,900) (4,331) 11,569 (10,517)
(LOSS) BEFORE TRANSFERS (132,958) (92,629) 40,329 (81,087)
Transfers in 60,477 27,417 (33,060) 30,555
CHANGE IN NET ASSETS (72,481) (65,212) 7,269 (50,532)
Net assets, beginning of year 1,942,522 1,942,522 - 1,993,054
NET ASSETS, END OF YEAR 1,870,041$ 1,877,310$ 7,269$ 1,942,522$
138

City of Marquette, Michigan
INTERMODAL TRANSPORTATION TERMINAL FUND
COMPARATIVE STATEMENT OF NET ASSETS
June 30, 2007 and 2006
2007 2006
ASSETSCurrent Assets:
Due from other funds -$ $165,652
TOTAL CURRENT ASSETS - 165,652 Non-current Assets:
Land - 102,500 Property, plant and equipment - 1,939,625 Allowance for depreciation - (806,596)
TOTAL NON-CURRENT ASSETS - 1,235,529
TOTAL ASSETS - 1,401,181
LIABILITIESCurrent Liabilities:
Accounts payable - 899 Due to local units - 111,083
TOTAL CURRENT LIABILITIES - 111,982
TOTAL LIABILITIES - 111,982
NET ASSETSInvested in capital assets - 1,235,529 Unrestricted - 53,670
TOTAL NET ASSETS -$ 1,289,199$
139
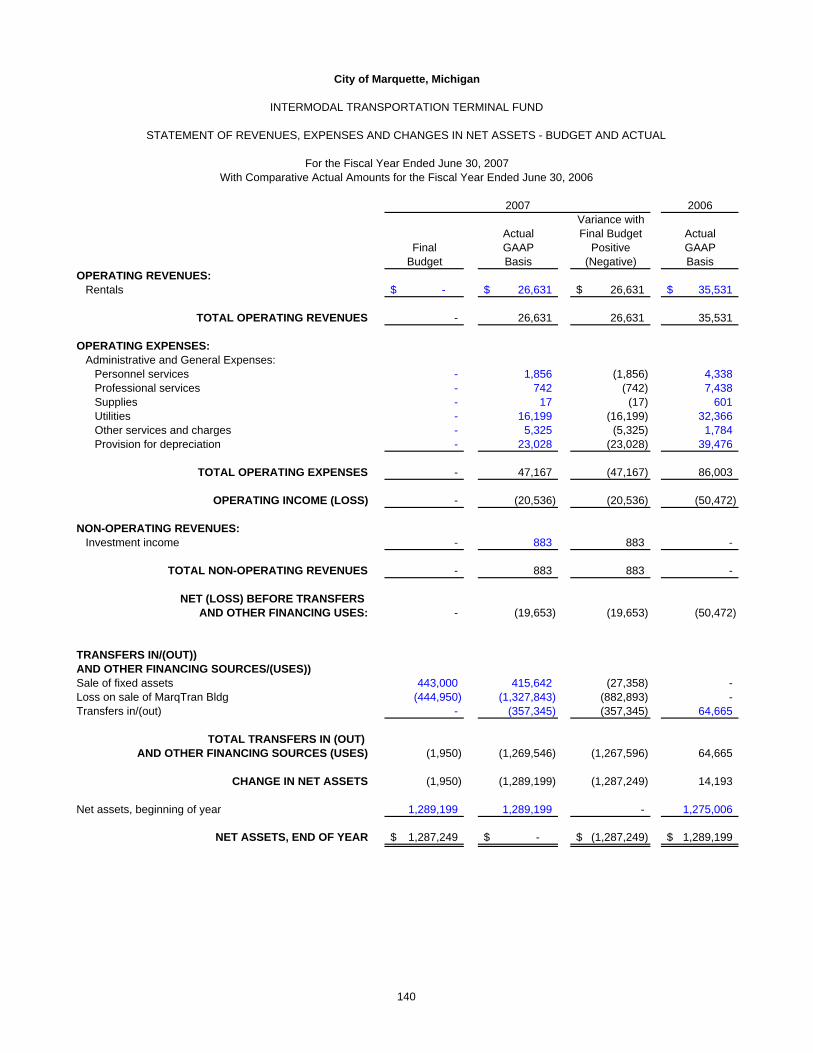
City of Marquette, Michigan
INTERMODAL TRANSPORTATION TERMINAL FUND
STATEMENT OF REVENUES, EXPENSES AND CHANGES IN NET ASSETS - BUDGET AND ACTUAL
For the Fiscal Year Ended June 30, 2007With Comparative Actual Amounts for the Fiscal Year Ended June 30, 2006
2007 2006Variance with
Actual Final Budget ActualFinal GAAP Positive GAAP
Budget Basis (Negative) BasisOPERATING REVENUES:
Rentals -$ 26,631$ 26,631$ 35,531$
TOTAL OPERATING REVENUES - 26,631 26,631 35,531
OPERATING EXPENSES: Administrative and General Expenses:
Personnel services - 1,856 (1,856) 4,338 Professional services - 742 (742) 7,438 Supplies - 17 (17) 601 Utilities - 16,199 (16,199) 32,366 Other services and charges - 5,325 (5,325) 1,784 Provision for depreciation - 23,028 (23,028) 39,476
TOTAL OPERATING EXPENSES - 47,167 (47,167) 86,003
OPERATING INCOME (LOSS) - (20,536) (20,536) (50,472)
NON-OPERATING REVENUES:Investment income - 883 883 -
TOTAL NON-OPERATING REVENUES - 883 883 -
NET (LOSS) BEFORE TRANSFERS AND OTHER FINANCING USES: - (19,653) (19,653) (50,472)
TRANSFERS IN/(OUT)) AND OTHER FINANCING SOURCES/(USES))Sale of fixed assets 443,000 415,642 (27,358) - Loss on sale of MarqTran Bldg (444,950) (1,327,843) (882,893) - Transfers in/(out) - (357,345) (357,345) 64,665
TOTAL TRANSFERS IN (OUT) AND OTHER FINANCING SOURCES (USES) (1,950) (1,269,546) (1,267,596) 64,665
CHANGE IN NET ASSETS (1,950) (1,289,199) (1,287,249) 14,193
Net assets, beginning of year 1,289,199 1,289,199 - 1,275,006
NET ASSETS, END OF YEAR 1,287,249$ -$ (1,287,249)$ 1,289,199$
140

City of Marquette, Michigan
WATER SUPPLY AND SEWAGE DISPOSAL FUND
COMPARATIVE STATEMENT OF NET ASSETS
June 30, 2007 and 2006
2007 2006ASSETS
Current Assets:Cash and cash equivalents 100,000$ 1,640,569$ Delinquent utility bills on taxes 6,884 - Accounts receivable - net 1,202,690 805,995 Special assessments receivable 23,971 27,083 Unamortized bond issuance cost 97,618 90,828 Inventory 134,956 133,304 Prepaid expenses 4,206 4,600
TOTAL CURRENT ASSETS 1,570,325 2,702,379
Non-current Assets:Restricted Assets:
Bond Reserve Fund 50,065 50,765 Replacement Maintenance Fund 390,000 390,000 Bond and Interest Redemption Fund 35,888 34,204 Water Filtration Reserve 1,114,774 1,114,801 Bond Escrow Fund 49,918 63,032 Vacation, Sick Leave and Benefit Days Reserve 151,559 134,735
Total Restricted Assets 1,792,204 1,787,537
Property, plant and equipment 46,774,100 46,060,770 Allowance for depreciation (14,107,570) (13,025,050) Construction in progress 1,970,614 - Investment in Wastewater Facility 2,954,966 2,992,555
TOTAL NON-CURRENT ASSETS 39,384,314 37,815,812
TOTAL ASSETS 40,954,639 40,518,191
LIABILITIESCurrent Liabilities:
Cash overdraft 464,288 - Accounts payable 197,647 400,181 Accrued compensated absences 151,559 134,735 Due to other funds 1,129,938 - Customer deposits payable (75) (75) Current portion of notes payable 21,289 20,286 Current portion of loan payable 145,000 145,000 Current portion of capitalized lease payable 120,866 120,866 Accrued interest payable 35,267 35,267 Deferred revenue - special assessment 23,971 27,083 Current portion of bonds payable from restricted assets 710,000 640,000
TOTAL CURRENT LIABILITIES 2,999,750 1,523,343
Non-current Liabilities:Bonds payable 4,960,000 4,230,000 Notes payable 70,730 91,991 Loan payable 3,040,000 3,185,000 Capitalized leases payable 120,866 241,732 Premium on refunding 47,832 53,146 Deferred amounts on refunding (214,306) (238,213)
TOTAL NON-CURRENT LIABILITIES 8,025,122 7,563,656
TOTAL LIABILITIES 11,024,872 9,086,999
NET ASSETSInvested in capital assets net of related debt 25,690,125 24,723,443 Net Assets:
Restricted for debt service 1,640,645 1,652,802 Unrestricted 2,598,997 5,054,947
TOTAL NET ASSETS 29,929,767$ 31,431,192$
141

City of Marquette, Michigan
WATER SUPPLY AND SEWAGE DISPOSAL FUND
STATEMENT OF REVENUES, EXPENSES AND CHANGES IN NET ASSETS - BUDGET AND ACTUAL
For the Fiscal Year Ended June 30, 2007With Comparative Actual Amounts for the Fiscal Year Ended June 30, 2006
2007 2006Variance with
Actual Final Budget ActualFinal GAAP Positive GAAP
Budget Basis (Negative) Basis
OPERATING REVENUES: Water: Metered sales 2,034,250$ 2,079,954$ 45,704$ 1,943,660$ Sales to public authorities 62,470 63,368 898 60,259 Non-tax customers 1,347,240 1,316,718 (30,522) 1,170,793 City departments 37,595 42,378 4,783 35,916 Rentals 2,000 2,297 297 2,034 Miscellaneous income 99,250 101,653 2,403 225,698 Sewage Disposal: Metered sales 1,615,040 1,632,438 17,398 1,562,749 Sales to public authorities 44,187 41,749 (2,438) 39,796 Non-tax customers 718,168 755,564 37,396 771,261 City departments 15,038 13,981 (1,057) 13,209 Miscellaneous income 9,000 12,848 3,848 14,232
TOTAL OPERATING REVENUES 5,984,238 6,062,948 78,710 5,839,607
OPERATING EXPENSES: Administrative and General: Salaries and wages 104,583 145,782 (41,199) 124,018 Fringe benefits 328,091 297,109 30,982 303,407 Supplies 28,350 30,339 (1,989) 19,208 Professional and contractual 354,816 383,740 (28,924) 415,596 Communications 2,000 2,124 (124) 1,833 Insurance and bonds 60,000 54,949 5,051 52,902 Utilities 635 635 - 675 Maintenance 1,000 450 550 979 Rental 25,000 26,413 (1,413) 26,011 Miscellaneous 2,620 854 1,766 1,668
Uncollectible accounts 45,000 - 45,000 69,137 Provision for depreciation 805,000 1,082,520 (277,520) 992,976 Employee safety expense 500 596 (96) 88 Schooling 3,500 4,781 (1,281) 411 Payment in lieu of taxes 853,413 853,413 - 767,516 Amortization 12,320 9,083 3,237 12,314 Capital outlay - 9,174 (9,174) -
Total Administrative and General 2,626,828 2,901,962 (275,134) 2,788,739
Water Treatment and Distribution: Personnel services 659,275 648,338 10,937 636,604 Operating supplies 154,261 149,818 4,443 130,128 Professional and contractual 165,291 163,042 2,249 137,552 Communications 1,800 1,368 432 1,794 Utilities 196,500 187,791 8,709 185,827 Maintenance 10,600 4,360 6,240 750 Rental 257,500 240,757 16,743 239,522 Security upgrades - - - 6,163 Schooling 3,000 629 2,371 1,061
Total Water Treatment and Distribution 1,448,227 1,396,103 52,124 1,339,401
142
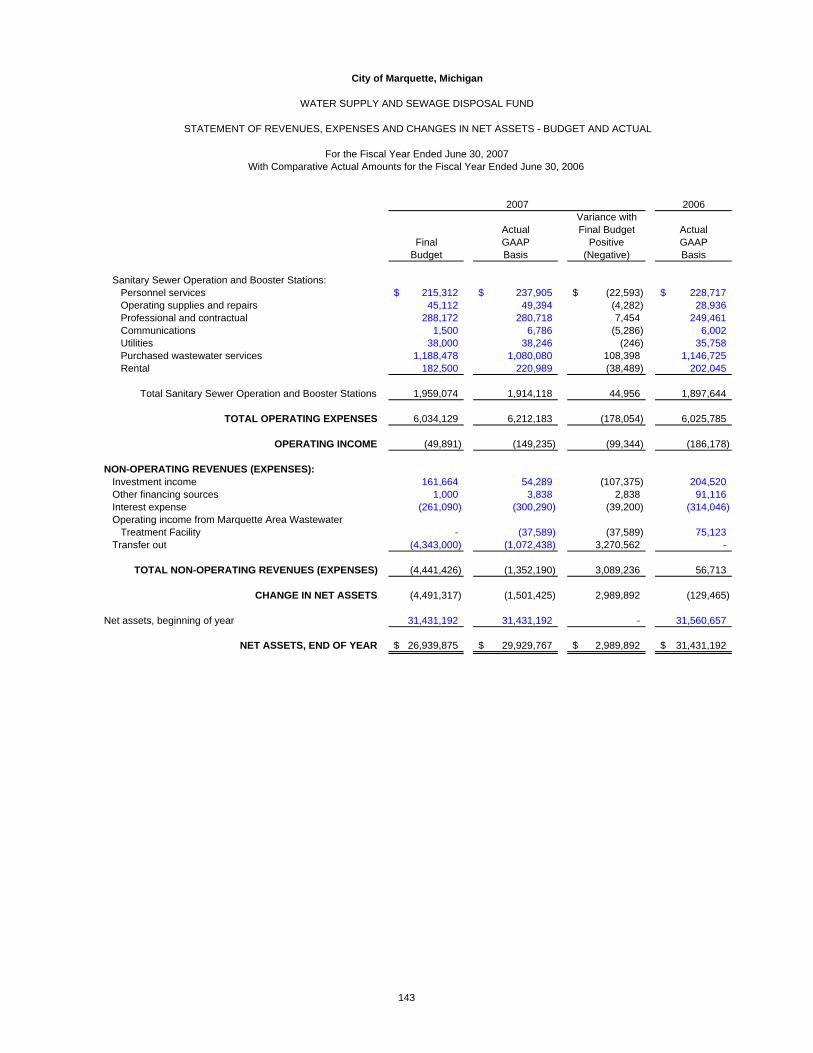
City of Marquette, Michigan
WATER SUPPLY AND SEWAGE DISPOSAL FUND
STATEMENT OF REVENUES, EXPENSES AND CHANGES IN NET ASSETS - BUDGET AND ACTUAL
For the Fiscal Year Ended June 30, 2007With Comparative Actual Amounts for the Fiscal Year Ended June 30, 2006
2007 2006Variance with
Actual Final Budget ActualFinal GAAP Positive GAAP
Budget Basis (Negative) Basis
Sanitary Sewer Operation and Booster Stations: Personnel services 215,312$ 237,905$ (22,593)$ 228,717$ Operating supplies and repairs 45,112 49,394 (4,282) 28,936 Professional and contractual 288,172 280,718 7,454 249,461 Communications 1,500 6,786 (5,286) 6,002 Utilities 38,000 38,246 (246) 35,758 Purchased wastewater services 1,188,478 1,080,080 108,398 1,146,725 Rental 182,500 220,989 (38,489) 202,045
Total Sanitary Sewer Operation and Booster Stations 1,959,074 1,914,118 44,956 1,897,644
TOTAL OPERATING EXPENSES 6,034,129 6,212,183 (178,054) 6,025,785
OPERATING INCOME (49,891) (149,235) (99,344) (186,178)
NON-OPERATING REVENUES (EXPENSES): Investment income 161,664 54,289 (107,375) 204,520 Other financing sources 1,000 3,838 2,838 91,116 Interest expense (261,090) (300,290) (39,200) (314,046) Operating income from Marquette Area Wastewater Treatment Facility - (37,589) (37,589) 75,123 Transfer out (4,343,000) (1,072,438) 3,270,562 -
TOTAL NON-OPERATING REVENUES (EXPENSES) (4,441,426) (1,352,190) 3,089,236 56,713
CHANGE IN NET ASSETS (4,491,317) (1,501,425) 2,989,892 (129,465)
Net assets, beginning of year 31,431,192 31,431,192 - 31,560,657
NET ASSETS, END OF YEAR 26,939,875$ 29,929,767$ 2,989,892$ 31,431,192$
143

City of Marquette, Michigan
STORMWATER UTILITY FUND
COMPARATIVE STATEMENT OF NET ASSETS
June 30, 2007 and 2006
2007 2006ASSETSCurrent Assets:
Accounts receivable 565,200$ 526,726$ Allowance for uncollectible accounts (493,995) (493,995) Unamortized bond issuance cost 31,510 42,014 Prepaid expense 179 199
TOTAL CURRENT ASSETS 102,894 74,944
Non-current Assets:Restricted Assets:
Bond Reserve Fund 259,675 259,769 Bond Escrow Fund 38,648 38,663 Vacation, Sick Leave, and Benefit Days Reserve 6,511 6,188
Total Restricted Assets 304,834 304,620
Property, plant and equipment 6,821,450 6,817,613 Allowance for depreciation (1,505,180) (1,232,927) Construction work in progress 54,031 -
TOTAL NON-CURRENT ASSETS 5,675,135 5,889,306
TOTAL ASSETS 5,778,029 5,964,250
LIABILITIESCurrent Liabilities: Cash overdraft 53,249 -
Accounts payable 1,523 1,167 Accrued compensated absences 6,511 6,188 Due to other funds 150,140 - Accrued interest payable 5,386 5,386 Current portion of long-term debt 255,000 245,000
TOTAL CURRENT LIABILITIES 471,809 257,741
Non-current Liabilities:Bonds payable 565,000 820,000
TOTAL NON-CURRENT LIABILITIES 565,000 820,000
TOTAL LIABILITIES 1,036,809 1,077,741
NET ASSETSInvested in capital assets net of related debt 4,550,301 4,519,686 Net Assets:
Restricted for debt service 298,323 298,432 Unrestricted (107,404) 68,391
TOTAL NET ASSETS 4,741,220$ 4,886,509$
144

City of Marquette, Michigan
STORMWATER UTILITY FUND
STATEMENT OF CHANGES IN REVENUES, EXPENSES AND CHANGES IN NET ASSETS - BUDGET AND ACTUAL
For the Fiscal Year Ended June 30, 2007With Comparative Actual Amounts for the Fiscal Year Ended June 30, 2006
2007 2006Variance with
Actual Final Budget ActualFinal GAAP Positive GAAP
Budget Basis (Negative) BasisOPERATING REVENUES: General customers 447,580$ 442,750$ (4,830)$ 325,245$ Public authorities 26,653 26,440 (213) 19,401 Non-tax customers 151,788 165,157 13,369 119,345 City departments 245,900 231,860 (14,040) 244,961 Other charges for service 1,000 1,756 756 907
TOTAL OPERATING REVENUES 872,921 867,963 (4,958) 709,859
OPERATING EXPENSES: Routine Maintenance and Administration: Salaries and wages 155,100 148,338 6,762 143,239 Fringe benefits 73,710 78,043 (4,333) 72,987 Office supplies 970 190 780 1,015 Maintenance supplies 14,500 13,952 548 11,808 Professional and contractual 181,284 180,649 635 88,501 Rental vehicles 94,000 125,982 (31,982) 117,158 Utilities 450 450 - 480 Amortization 8,405 10,503 (2,098) 8,403 Uncollectible accounts 32,250 - 32,250 95,930 Capital outlay - 7,721 (7,721) - Provision for depreciation 150,000 272,254 (122,254) 241,606 Miscellaneous 500 300 200 20,495
TOTAL OPERATING EXPENSES 711,169 838,382 (127,213) 801,622
OPERATING INCOME (LOSS) 161,752 29,581 (132,171) (91,763)
NON-OPERATING REVENUES (EXPENSES): Investment income 20,000 1,963 (18,037) 14,006 Interest expense (53,250) (53,250) - (64,635) State and Federal grants - 25,057 25,057 9,000
TOTAL NON-OPERATING REVENUES (EXPENSES) (33,250) (26,230) 7,020 (41,629)
INCOME (LOSS) BEFORE TRANSFERS 128,502 3,351 (125,151) (133,392)
Transfers in/(out) (15,000) (148,640) (133,640) 747,757
CHANGE IN NET ASSETS 113,502 (145,289) (258,791) 614,365
Net assets, beginning of year 4,886,509 4,886,509 - 4,272,144
NET ASSETS, END OF YEAR 5,000,011$ 4,741,220$ (258,791)$ 4,886,509$
145

City of Marquette, Michigan
INTERNAL SERVICE FUNDS COMBINING AND INDIVIDUAL FUND STATEMENTS AND SCHEDULES
The function of the Internal Service Funds is to account for funds that are used to finance, administer and account for the financing of goods and services provided by one department or agency to other departments or agencies of the governmental unit or to other governmental units on a cost reimbursement basis. MOTOR VEHICLE EQUIPMENT FUND: To operate as a self-supporting fund, which will be responsible for the maintenance and purchasing of vehicles and equipment utilized in various departments of the City. MUNICIPAL SERVICE CENTER FUND: To accumulate the expenses and revenues associated with the operation of the Municipal Service Center. Building space is rented to various funds based on a square foot occupancy rate.
146

City of Marquette, Michigan
ALL INTERNAL SERVICE FUNDS
COMBINING STATEMENT OF NET ASSETS
June 30, 2007
Motor MunicipalVehicle Service
Equipment CenterFund Fund Total
ASSETSCurrent Assets:
Cash and cash equivalents -$ 255,339$ 255,339$ Accounts receivable, net 942 - 942 Due from local units 1,538 - 1,538 Inventory 31,123 - 31,123 Prepaid expenses 2,393 228 2,621
TOTAL CURRENT ASSETS 35,996 255,567 291,563
Non-current Assets:Restricted Assets:
Replacement and maintenance fund 659,119 - 659,119 Vacation, sick leave and benefit reserve 97,451 7,442 104,893
Total Restricted Assets 756,570 7,442 764,012
Land and land improvements - 251,454 251,454 Property, plant, and equipment 8,811,392 6,865,805 15,677,197 Accumulated depreciation (6,217,167) (2,970,465) (9,187,632)
TOTAL NON-CURRENT ASSETS 3,350,795 4,154,236 7,505,031
TOTAL ASSETS 3,386,791 4,409,803 7,796,594
LIABILITIESCurrent Liabilities:
Cash overdraft 286,987 - 286,987 Accounts payable 62,703 11,945 74,648 Due to other funds 1,500 1,500 3,000 Accrued compensated absences 97,451 7,442 104,893
TOTAL CURRENT LIABILITIES 448,641 20,887 469,528
TOTAL LIABILITIES 448,641 20,887 469,528
NET ASSETSInvested in capital assets net of related debt 2,594,225 4,146,794 6,741,019 Net Assets:
Unrestricted 343,925 242,122 586,047
TOTAL NET ASSETS 2,938,150$ 4,388,916$ 7,327,066$
147

City of Marquette, Michigan
ALL INTERNAL SERVICE FUNDS
COMBINING STATEMENT OF REVENUES, EXPENSES, AND CHANGES IN NET ASSETS
For the Fiscal Year Ended June 30, 2007
Motor MunicipalVehicle Service
Equipment CenterFund Fund Total
OPERATING REVENUES:Charges for services 1,864,276$ 816,000$ 2,680,276$ Other 41,340 3,671 45,011
TOTAL OPERATING REVENUES 1,905,616 819,671 2,725,287
OPERATING EXPENSES:General and administrative 686,169 299,510 985,679 Depreciation 556,914 219,501 776,415 Vehicle operating expenses 1,110,356 - 1,110,356
TOTAL OPERATING EXPENSES 2,353,439 519,011 2,872,450
OPERATING INCOME (LOSS) (447,823) 300,660 (147,163)
NON-OPERATING REVENUES:Investment income 42,795 3,752 46,547 Gain on sale of capital assets 36,044 - 36,044
TOTAL NON-OPERATING REVENUES 78,839 3,752 82,591
INCOME (LOSS) BEFORE TRANSFERS (368,984) 304,412 (64,572)
Transfers (out) - (383,413) (383,413)
CHANGE IN NET ASSETS (368,984) (79,001) (447,985)
Net assets, beginning of year 3,307,134 4,467,917 7,775,051
NET ASSETS, END OF YEAR 2,938,150$ 4,388,916$ 7,327,066$
148
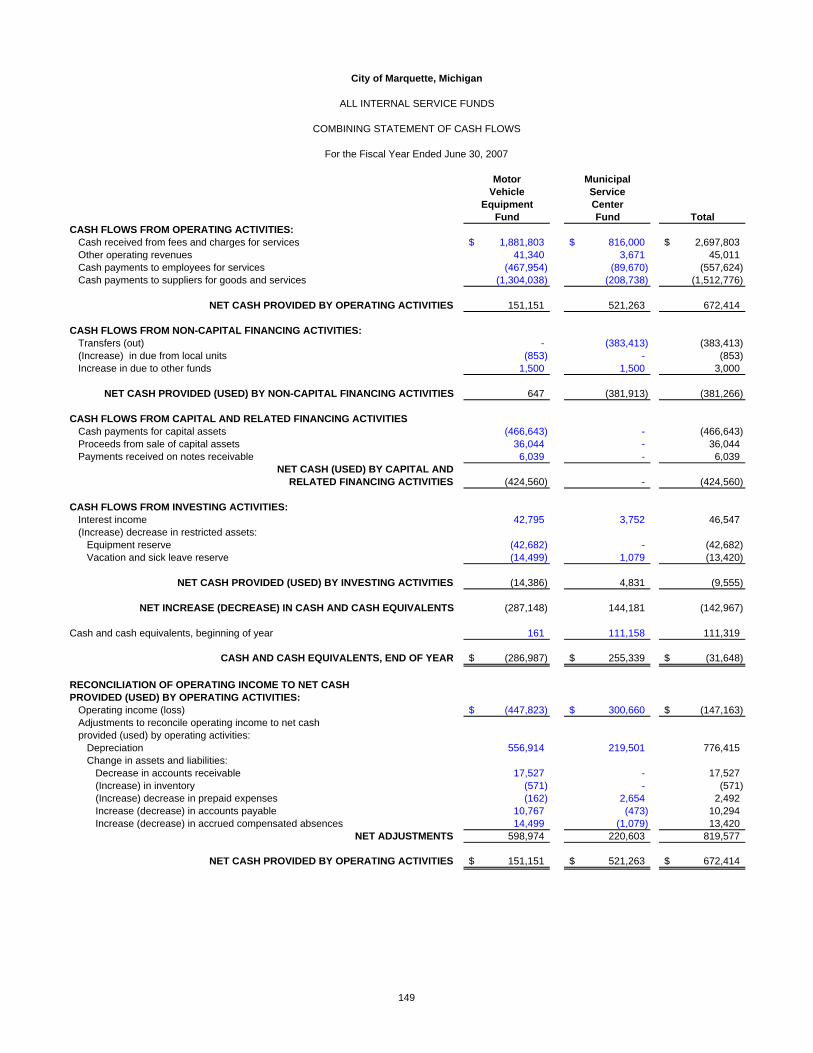
City of Marquette, Michigan
ALL INTERNAL SERVICE FUNDS
COMBINING STATEMENT OF CASH FLOWS
For the Fiscal Year Ended June 30, 2007
Motor MunicipalVehicle Service
Equipment CenterFund Fund Total
CASH FLOWS FROM OPERATING ACTIVITIES:Cash received from fees and charges for services 1,881,803$ 816,000$ 2,697,803$ Other operating revenues 41,340 3,671 45,011 Cash payments to employees for services (467,954) (89,670) (557,624) Cash payments to suppliers for goods and services (1,304,038) (208,738) (1,512,776)
NET CASH PROVIDED BY OPERATING ACTIVITIES 151,151 521,263 672,414
CASH FLOWS FROM NON-CAPITAL FINANCING ACTIVITIES:Transfers (out) - (383,413) (383,413) (Increase) in due from local units (853) - (853) Increase in due to other funds 1,500 1,500 3,000
NET CASH PROVIDED (USED) BY NON-CAPITAL FINANCING ACTIVITIES 647 (381,913) (381,266)
CASH FLOWS FROM CAPITAL AND RELATED FINANCING ACTIVITIESCash payments for capital assets (466,643) - (466,643) Proceeds from sale of capital assets 36,044 - 36,044 Payments received on notes receivable 6,039 - 6,039
NET CASH (USED) BY CAPITAL AND RELATED FINANCING ACTIVITIES (424,560) - (424,560)
CASH FLOWS FROM INVESTING ACTIVITIES:Interest income 42,795 3,752 46,547 (Increase) decrease in restricted assets:
Equipment reserve (42,682) - (42,682) Vacation and sick leave reserve (14,499) 1,079 (13,420)
NET CASH PROVIDED (USED) BY INVESTING ACTIVITIES (14,386) 4,831 (9,555)
NET INCREASE (DECREASE) IN CASH AND CASH EQUIVALENTS (287,148) 144,181 (142,967)
Cash and cash equivalents, beginning of year 161 111,158 111,319
CASH AND CASH EQUIVALENTS, END OF YEAR (286,987)$ 255,339$ (31,648)$
RECONCILIATION OF OPERATING INCOME TO NET CASHPROVIDED (USED) BY OPERATING ACTIVITIES:
Operating income (loss) (447,823)$ 300,660$ (147,163)$ Adjustments to reconcile operating income to net cashprovided (used) by operating activities:
Depreciation 556,914 219,501 776,415 Change in assets and liabilities:
Decrease in accounts receivable 17,527 - 17,527 (Increase) in inventory (571) - (571) (Increase) decrease in prepaid expenses (162) 2,654 2,492 Increase (decrease) in accounts payable 10,767 (473) 10,294 Increase (decrease) in accrued compensated absences 14,499 (1,079) 13,420
NET ADJUSTMENTS 598,974 220,603 819,577
NET CASH PROVIDED BY OPERATING ACTIVITIES 151,151$ 521,263$ 672,414$
149
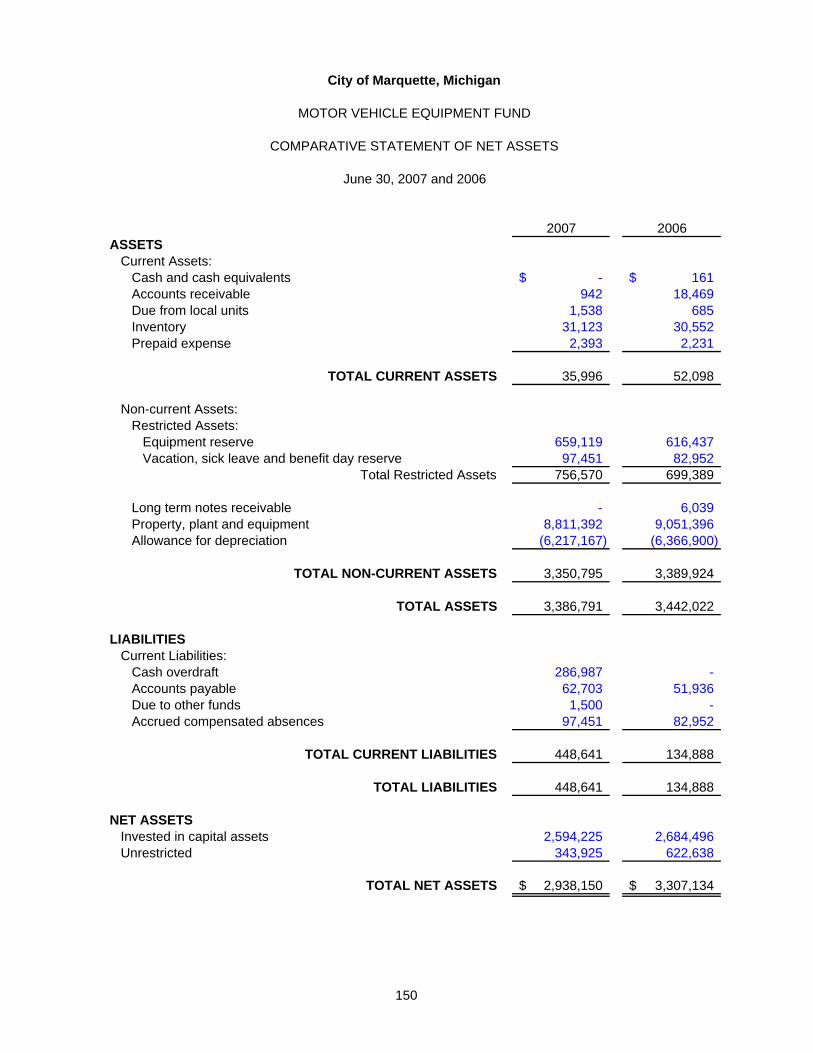
City of Marquette, Michigan
MOTOR VEHICLE EQUIPMENT FUND
COMPARATIVE STATEMENT OF NET ASSETS
June 30, 2007 and 2006
2007 2006ASSETS
Current Assets:Cash and cash equivalents -$ 161$ Accounts receivable 942 18,469 Due from local units 1,538 685 Inventory 31,123 30,552 Prepaid expense 2,393 2,231
TOTAL CURRENT ASSETS 35,996 52,098
Non-current Assets:Restricted Assets:
Equipment reserve 659,119 616,437 Vacation, sick leave and benefit day reserve 97,451 82,952
Total Restricted Assets 756,570 699,389
Long term notes receivable - 6,039 Property, plant and equipment 8,811,392 9,051,396 Allowance for depreciation (6,217,167) (6,366,900)
TOTAL NON-CURRENT ASSETS 3,350,795 3,389,924
TOTAL ASSETS 3,386,791 3,442,022
LIABILITIESCurrent Liabilities:
Cash overdraft 286,987 - Accounts payable 62,703 51,936 Due to other funds 1,500 - Accrued compensated absences 97,451 82,952
TOTAL CURRENT LIABILITIES 448,641 134,888
TOTAL LIABILITIES 448,641 134,888
NET ASSETSInvested in capital assets 2,594,225 2,684,496 Unrestricted 343,925 622,638
TOTAL NET ASSETS 2,938,150$ 3,307,134$
150

City of Marquette, Michigan
MOTOR VEHICLE EQUIPMENT FUND
STATEMENT OF REVENUES, EXPENSES AND CHANGES IN NET ASSETS - BUDGET AND ACTUAL
For the Fiscal Year Ended June 30, 2007With Comparative Actual Amounts for the Fiscal Year Ended June 30, 2006
2007 2006Variance with
Actual Final Budget ActualFinal GAAP Positive GAAP
Budget Basis (Negative) BasisOPERATING REVENUES:
Rentals 2,017,100$ 1,864,276$ (152,824)$ 1,813,900$ Other 14,000 41,340 27,340 31,280
TOTAL OPERATING REVENUES 2,031,100 1,905,616 (125,484) 1,845,180
OPERATING EXPENSES: Vehicle Operating Expenses:
Personnel services 515,054 482,453 32,601 521,369 Repairs and maintenance 235,355 289,043 (53,688) 245,130 Fuel 240,000 228,870 11,130 211,026 Supplies 27,639 30,404 (2,765) 23,059 Vehicle insurance 75,000 67,596 7,404 66,780 Rentals 12,000 11,990 10 10,021
Total Vehicle Operating Expenses 1,105,048 1,110,356 (5,308) 1,077,385
Administrative and General Expenses:Rentals 611,000 611,000 - 480,000 Professional services 66,824 66,836 (12) 61,856 Supplies 1,300 1,794 (494) 1,395 Other services and charges 7,500 6,539 961 4,951 Provision for depreciation 452,000 556,914 (104,914) 573,996
Total Administrative and General Expenses 1,138,624 1,243,083 (104,459) 1,122,198
TOTAL OPERATING EXPENSES 2,243,672 2,353,439 (109,767) 2,199,583
OPERATING INCOME (LOSS) (212,572) (447,823) (235,251) (354,403)
NON-OPERATING REVENUES (EXPENSES):Investment income 28,000 42,795 14,795 37,939 Gain (loss) on sale of capital assets - 36,044 36,044 14,019
TOTAL NON-OPERATING REVENUES (EXPENSES) 28,000 78,839 50,839 51,958
CHANGE IN NET ASSETS (184,572) (368,984) (184,412) (302,445)
Net assets, beginning of year 3,307,134 3,307,134 - 3,609,579
NET ASSETS, END OF YEAR 3,122,562$ 2,938,150$ (184,412)$ 3,307,134$
151

City of Marquette, Michigan
MUNICIPAL SERVICE CENTER FUND
COMPARATIVE STATEMENT OF NET ASSETS
June 30, 2007 and 2006
2007 2006ASSETS
Current Assets:Cash and cash equivalents 255,339$ 111,158$ Prepaid expense 228 2,882
TOTAL CURRENT ASSETS 255,567 114,040
Non-current Assets:Restricted Assets:
Vacation, Sick Leave and Benefit Day Reserve 7,442 8,521 Total Restricted Assets 7,442 8,521
Land 245,566 245,566 Land improvements 5,888 5,888 Property, plant and equipment 6,865,805 6,865,805 Allowance for depreciation (2,970,465) (2,750,964)
TOTAL NON-CURRENT ASSETS 4,154,236 4,374,816
TOTAL ASSETS 4,409,803 4,488,856
LIABILITIESCurrent Liabilities:
Accounts payable 11,945 12,418 Due to other funds 1,500 - Accrued compensated absences 7,442 8,521
TOTAL CURRENT LIABILITIES 20,887 20,939
TOTAL LIABILITIES 20,887 20,939
NET ASSETSInvested in capital assets 4,146,794 4,366,295 Unrestricted 242,122 101,622
TOTAL NET ASSETS 4,388,916$ 4,467,917$
152

City of Marquette, Michigan
MUNICIPAL SERVICE CENTER FUND
STATEMENT OF REVENUES, EXPENSES AND CHANGES IN NET ASSETS - BUDGET AND ACTUAL
For the Fiscal Year Ended June 30, 2007With Comparative Actual Amounts for the Fiscal Year Ended June 30, 2006
2007 2006Variance with
Actual Final Budget ActualFinal GAAP Positive GAAP
Budget Basis (Negative) BasisOPERATING REVENUES:
Rentals 816,000$ 816,000$ -$ 640,080$ Other 4,000 3,671 (329) 4,155
TOTAL OPERATING REVENUES 820,000 819,671 (329) 644,235
OPERATING EXPENSES: Administrative and General Expenses:
Personnel services 79,720 88,591 (8,871) 84,640 Professional services 61,756 56,306 5,450 50,179 Supplies 28,500 21,927 6,573 21,700 Utilities 101,000 84,213 16,787 80,470 Other services and charges 53,096 48,473 4,623 33,331 Provision for depreciation 200,000 219,501 (19,501) 219,501
TOTAL OPERATING EXPENSES 524,072 519,011 5,061 489,821
OPERATING INCOME (LOSS) 295,928 300,660 4,732 154,414
NON-OPERATING REVENUES (EXPENSES):Investment income 10,000 3,752 (6,248) 6,535
TOTAL NON-OPERATING REVENUES (EXPENSES) 10,000 3,752 (6,248) 6,535
INCOME (LOSS) BEFORE TRANSFERS 305,928 304,412 (1,516) 160,949
Transfers (out) (383,420) (383,413) 7 (381,113)
CHANGE IN NET ASSETS (77,492) (79,001) (1,509) (220,164)
Net assets, beginning of year 4,467,917 4,467,917 - 4,688,081
NET ASSETS, END OF YEAR 4,390,425$ 4,388,916$ (1,509)$ 4,467,917$
153

City of Marquette, Michigan
FIDUCIARY FUNDS
INDIVIDUAL FUND STATEMENTS The function of Fiduciary funds is to account for assets held by the City in a trustee capacity or as an agent for individuals, private organizations, other governments, or other funds. These include (a) private-purpose trust funds, (b) pension trust funds, and (c) agency funds. SPECIAL ACTIVITIES PRIVATE-PURPOSE TRUST FUND: This fund is used to account for the contributions from private sources restricted for special projects. The City is holding these monies in a trustee capacity. PENSION TRUST FUND: The Fire-Police Retirement System Fund is used to account for the accumulation of resources to be used for retirement annuity payments at appropriate amounts and times in the future. Resources are contributed by employees at fixed rates and by the City at amounts determined by an annual actuarial valuation. AGENCY FUND: This fund is used to record the collection and payment of property taxes billed and collected by the City on behalf of the County, the School Districts, and the Intermediate School District. It is also used as a payroll clearing account type, which receives reimbursing payments from other funds. The accrual basis of accounting is used in recording Fiduciary Fund transactions.
154

City of Marquette, Michigan
SPECIAL ACTIVITIES PRIVATE-PURPOSE TRUST FUND
COMPARATIVE STATEMENT OF FIDUCIARY NET ASSETS
June 30, 2007 and 2006
ASSETS 2007 2006
Cash and cash equivalents 592,861$ 494,661$
TOTAL ASSETS 592,861 494,661
LIABILITIES
Accounts payable 3,375 279
TOTAL LIABILITIES 3,375 279
NET ASSETS Waterfront Property 5,025 4,949 Neck of Presque Isle Park 1,669 1,644 L.G. Kaufman Ski Hill 12,670 12,477 Insurance Program 10,478 10,318 MUSTFAA Insurance 74,453 69,417 Senior Citizens Trust 11,878 12,968 Senior Citizens Grants 21,667 21,666
Sister Cities Artists Exchange 5,215 5,136 Finland Sister City 3,216 2,351 Japan Sister City Campaign 1,434 3,323
Arts Exchange - Doors Project 21 3,238 McCarty's Cove 180 177 Presque Isle Walking Path 16,146 15,900 Heritage Tree 4,013 2,929 Harlow Park Playground Equipment 252 248 Tourist Park Development 34,008 33,490 Mobile Fire Safety House 5,453 5,370 Softball Insurance Fees 352 355 Fire Belltower Paver Bricks 977 962 Fire Belltower Other 1,164 1,146 Seized Property 14,310 21,931
Federal Forfeiture 47,412 - Drug Dog 2,539 4,673 Disaster Contingency 5,487 5,403 Potter's Field 655 641 Hiebel Memorial 960 1,834 D.A.R.E. Program 1,060 2,667 City Gift Program - 19,155 Sanitation Fee for Land Purchase and Development 287,680 214,954 Fuel Surcharge 18,832 15,060
Skateboard Park Donations 280 -
TOTAL NET ASSETS 589,486$ 494,382$
155
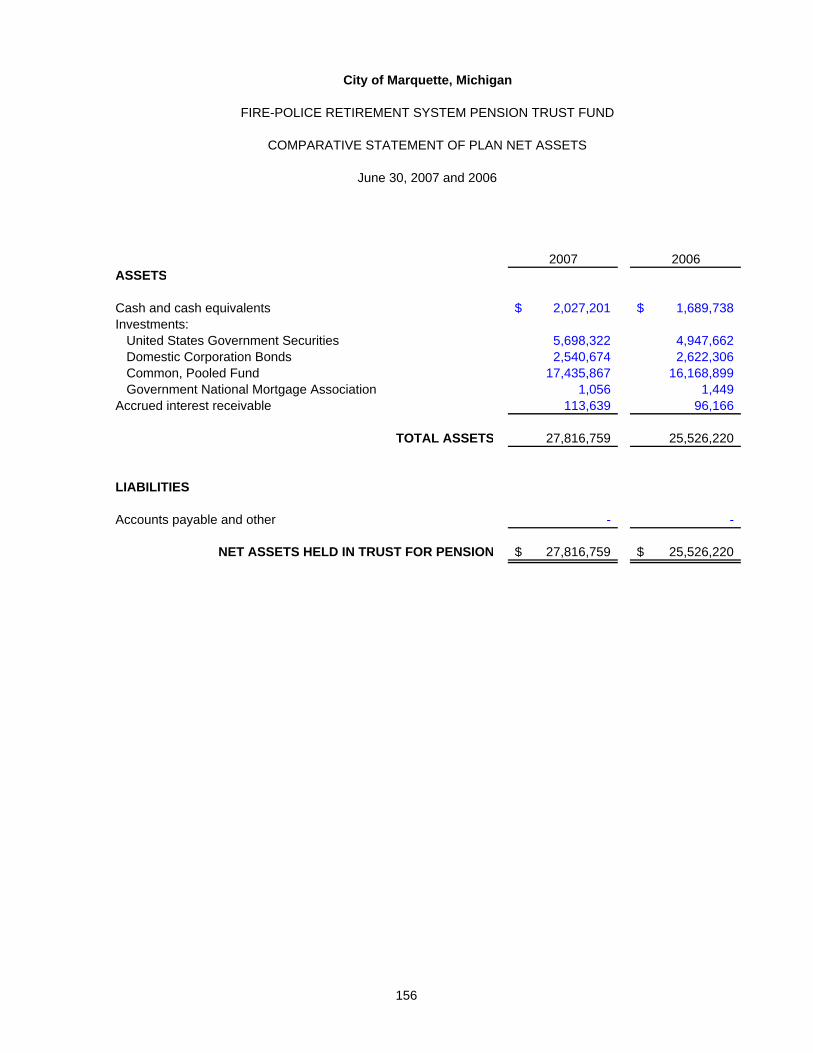
S
City of Marquette, Michigan
FIRE-POLICE RETIREMENT SYSTEM PENSION TRUST FUND
COMPARATIVE STATEMENT OF PLAN NET ASSETS
June 30, 2007 and 2006
2007 2006ASSETS
Cash and cash equivalents 2,027,201$ 1,689,738$ Investments:
United States Government Securities 5,698,322 4,947,662 Domestic Corporation Bonds 2,540,674 2,622,306 Common, Pooled Fund 17,435,867 16,168,899 Government National Mortgage Association 1,056 1,449
Accrued interest receivable 113,639 96,166
TOTAL ASSET 27,816,759 25,526,220
LIABILITIES
Accounts payable and other - -
NET ASSETS HELD IN TRUST FOR PENSION 27,816,759$ 25,526,220$
156

City of Marquette, Michigan
AGENCY FUND
COMPARATIVE BALANCE SHEET
June 30, 2007 and 2006
2007 2006ASSETS
Cash and cash equivalents 1,576,229$ 1,554,552$ Accounts receivable - 1,254 Taxes receivable - current 23 - Taxes receivable - delinquent personal 37,592 132,248 Due from other governments 1,912 - Due from other funds 250,000 -
TOTAL ASSETS 1,865,756$ 1,688,054$
LIABILITIES
Liabilities: Contract retainage payable 267,840$ 98,099$ Accrued wages and related liabilities 1,192,780 973,224 Due to other governments 8,146 43,764 Due to State 8,143 34,286 Due to local units 384,805 535,354 Other liabilities 4,042 3,327
TOTAL LIABILITIES 1,865,756$ 1,688,054$
157

City of Marquette, Michigan
AGENCY FUND
STATEMENT OF CHANGES IN ASSETS AND LIABILITIES
For the Fiscal Year Ended June 30, 2007
Balance BalanceJune 30, 2006 Additions Deductions June 30, 2007
ASSETS
Cash and cash equivalents 1,554,552$ 34,333,228$ 34,311,551$ 1,576,229$ Accounts receivable 1,254 - 1,254 - Taxes receivable - current - 14,261,943 14,261,920 23 Taxes receivable - delinquent personal 132,248 23,966 118,622 37,592 Due from other governments - 1,912 - 1,912 Due from other funds - 250,000 - 250,000
TOTAL ASSETS 1,688,054$ 48,871,049$ 48,693,347$ 1,865,756$
LIABILITIES
Accounts payable -$ 16,174,590$ 16,174,590$ -$ Contract retainage payable 98,099 630,987 461,246 267,840 Accrued wages and related liabilities 973,224 3,552,360 3,332,804 1,192,780 Due to other governments 43,764 3,866,887 3,902,505 8,146 Due to State 34,286 3,112,032 3,138,175 8,143 Due to local units 535,354 7,502,135 7,652,684 384,805 Other liabilities 3,327 342,910 342,195 4,042
TOTAL LIABILITIES 1,688,054$ 35,181,901$ 35,004,199$ 1,865,756$
158

City of Marquette, Michigan
CAPITAL ASSETS SCHEDULES
159

City of Marquette, Michigan
SCHEDULE OF CAPITAL ASSETS USED IN THE OPERATIONOF GOVERNMENTAL FUNDS - BY SOURCE
June 30, 2007
Land and Buildings and Furniture andImprovements Improvements Equipment Other Totals
Governmental Capital Assets:Land 11,211,891$ -$ -$ -$ 11,211,891$ Land improvements 6,968,500 - - - 6,968,500 Buildings - 5,387,699 - - 5,387,699 Building improvements - 5,060,199 - - 5,060,199 Furniture and equipment - - 2,785,725 - 2,785,725 Infrastructure - - - 35,335,822 35,335,822 Construction in progress 3,487,003 - - - 3,487,003 Investment in joint venture - - - 3,524,660 3,524,660
TOTAL 21,667,394$ 10,447,898$ 2,785,725$ 38,860,482$ 73,761,499$
Investments in Governmental Capital Assets From:General Fund 17,010,267$ 4,620,623$ 2,217,767$ 30,979,200$ 54,827,857$ Federal grants 1,901,291 3,466,340 116,285 547,762 6,031,678 State grants 705,189 494,867 161,232 - 1,361,288 Private gifts 1,114,174 558,029 117,381 - 1,789,584 Authorities, Boards and Commissions 54,000 811,172 - - 865,172 Joint venture - - - 3,524,660 3,524,660 Other funds 882,473 496,867 173,060 3,808,860 5,361,260
TOTAL 21,667,394$ 10,447,898$ 2,785,725$ 38,860,482$ 73,761,499$
160

City of Marquette, Michigan
SCHEDULE OF CAPITAL ASSETS USED IN THE OPERATIONOF GOVERNMENTAL FUNDS - BY FUNCTION AND ACTIVITY
For the Fiscal Year Ended June 30, 2007
Land Building Furniture andFunction and Activity Total Land Improvements Buildings Improvements Equipment Infrastructure
General Government:City Commission 8,999$ -$ -$ -$ -$ 8,999$ -$ Elections 5,001 - - - - 5,001 - Finance and Accounting 13,186 - - - - 13,186 - Treasurer 5,978 - - - - 5,978 - Information Systems 1,398,365 - - - - 1,398,365 - Cemetery 226,936 98,002 94,648 9,048 25,238 - - City Hall and Grounds 2,457,685 100,008 128,542 1,395,545 706,651 126,939 - Other City Property 5,129,514 5,109,643 19,871 - - - -
Total General Government 9,245,664 5,307,653 243,061 1,404,593 731,889 1,558,468 -
Public Health and Safety:Police Department 296,330 - - - - 296,330 - Fire Department 425,669 32,296 14,663 154,155 106,673 117,882 -
Total Public Health and Safety 721,999 32,296 14,663 154,155 106,673 414,212 -
Highways, Streets and Bridges:City Engineer 79,286 - - - - 79,286 - Public Works 7,743,006 4,242,131 2,742,813 523,782 213,880 20,400 - Infrastructure 35,335,822 - - - - - 35,335,822 Parking System 2,475,516 753,874 70,131 1,320,171 235,396 95,944 -
Total Highways, Streets and Bridges 45,633,630 4,996,005 2,812,944 1,843,953 449,276 195,630 35,335,822
Other:Sanitation 14,932 14,932 - - - - - Social Services - - - - - - - Recreation 11,090,447 861,005 3,897,832 1,984,998 3,754,445 592,167 - Other functions 43,164 - - - 17,916 25,248 -
Total Other 11,148,543 875,937 3,897,832 1,984,998 3,772,361 617,415 -
TOTAL GOVERNMENTAL CAPITALASSETS ASSOCIATED TO FUNCTIONS 66,749,836 11,211,891$ 6,968,500$ 5,387,699$ 5,060,199$ 2,785,725$ 35,335,822$
Construction in progress 3,487,003
Investment in Marquette County Solid Waste Management Authority 3,524,660
TOTAL GOVERNMENTALCAPITAL ASSETS 73,761,499$
161

City of Marquette, Michigan
SCHEDULE OF CHANGES IN CAPITAL ASSETS USED IN THE OPERATIONOF GOVERNMENTAL FUNDS - BY FUNCTION AND ACTIVITY
For the Fiscal Year Ended June 30, 2007
Balance BalanceJune 30, June 30,
Function and Activity 2006 Additions Deductions Transfers 2007General Government:
City Commission 8,999$ -$ -$ -$ 8,999$ Elections 5,001 - - - 5,001 Finance and Accounting 7,191 5,995 - - 13,186 Treasurer 5,978 - - - 5,978 Information Systems 1,393,253 15,644 (10,531) - 1,398,366 Cemetery 226,936 - - - 226,936 City Hall and Grounds 2,402,655 74,084 (19,000) - 2,457,739 Other City Property 5,129,514 7,100 (7,153) - 5,129,461
Total General Government 9,179,527 102,823 (36,684) - 9,245,666
Public Health and Safety:Police Department 305,990 22,835 (32,495) - 296,330 Fire Department 425,669 - - - 425,669
Total Public Health and Safety 731,659 22,835 (32,495) - 721,999
Highways, Streets and BridgesCity Engineer 79,286 - - - 79,286 Public Works 7,326,773 354,363 - 61,869 7,743,005 Infrastructure 31,526,962 902,133 - 2,906,726 35,335,821 Parking System 2,475,516 - - - 2,475,516
Total Highways, Streets and Bridges 41,408,537 1,256,496 - 2,968,595 45,633,628
Other:Sanitation 14,932 - - - 14,932 Recreation 10,726,756 64,000 - 299,691 11,090,447 Other 43,164 - - - 43,164
Total Other 10,784,852 64,000 - 299,691 11,148,543
TOTAL GOVERNMENTALCAPITAL ASSETS 62,104,575 1,446,154 (69,179) 3,268,286 66,749,836
Construction in progress 4,271,067 2,484,222 - (3,268,286) 3,487,003
Investment in Marquette County Solid WasteManagement Authority 3,524,660 - - - 3,524,660
GRAND TOTAL 69,900,302$ 3,930,376$ (69,179)$ -$ 73,761,499$
162

City of Marquette, Michigan
LONG-TERM DEBT SCHEDULES
163
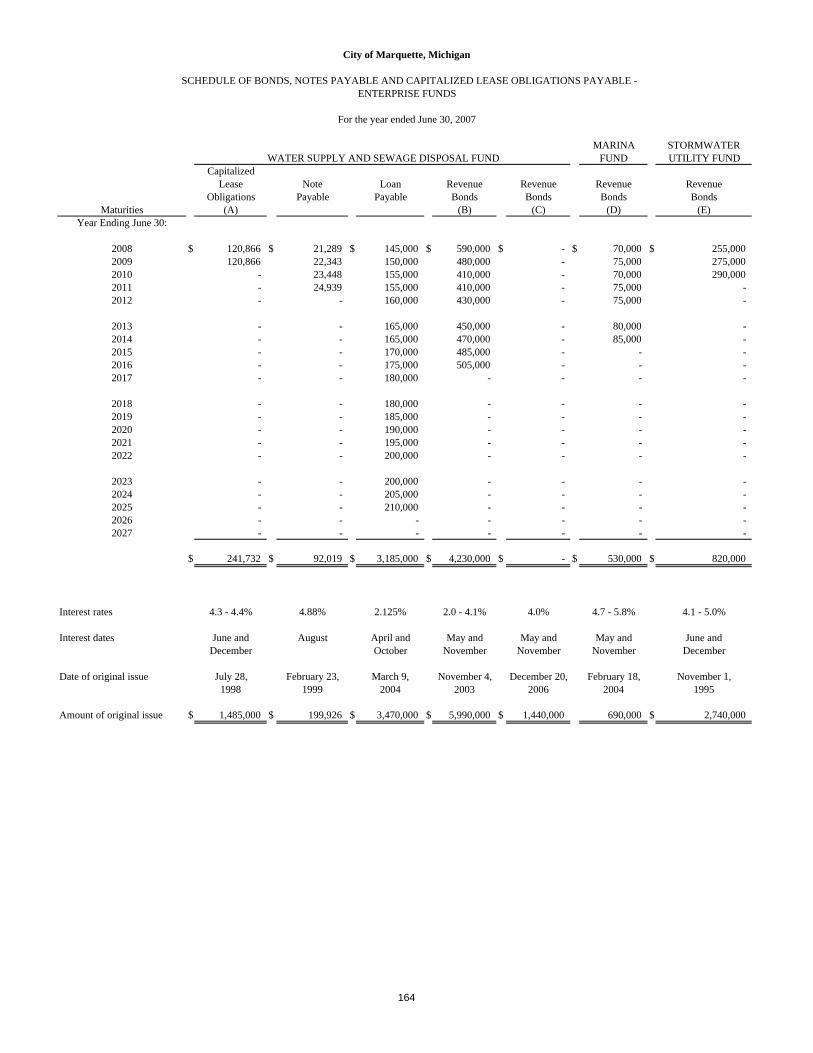
City of Marquette, Michigan
SCHEDULE OF BONDS, NOTES PAYABLE AND CAPITALIZED LEASE OBLIGATIONS PAYABLE -ENTERPRISE FUNDS
For the year ended June 30, 2007
MARINA STORMWATERWATER SUPPLY AND SEWAGE DISPOSAL FUND FUND UTILITY FUND
CapitalizedLease Note Loan Revenue Revenue Revenue Revenue
Obligations Payable Payable Bonds Bonds Bonds BondsMaturities (A) (B) (C) (D) (E)
Year Ending June 30:
2008 $ 120,866 $ 21,289 $ 145,000 $ 590,000 $ - $ 70,000 $ 255,000 2009 120,866 22,343 150,000 480,000 - 75,000 275,000 2010 - 23,448 155,000 410,000 - 70,000 290,000 2011 - 24,939 155,000 410,000 - 75,000 - 2012 - - 160,000 430,000 - 75,000 -
2013 - - 165,000 450,000 - 80,000 -2014 - - 165,000 470,000 - 85,000 -2015 - - 170,000 485,000 - - -2016 - - 175,000 505,000 - - -2017 - - 180,000 - - - -
2018 - - 180,000 - - - -2019 - - 185,000 - - - -2020 - - 190,000 - - - -2021 - - 195,000 - - - -2022 - - 200,000 - - - -
2023 - - 200,000 - - - -2024 - - 205,000 - - - -2025 - - 210,000 - - - -2026 - - - - - - -2027 - - - - - - -
$ 241,732 $ 92,019 $ 3,185,000 $ 4,230,000 $ - $ 530,000 $ 820,000
Interest rates 4.3 - 4.4% 4.88% 2.125% 2.0 - 4.1% 4.0% 4.7 - 5.8% 4.1 - 5.0%
Interest dates June and August April and May and May and May and June andDecember October November November November December
Date of original issue July 28, February 23, March 9, November 4, December 20, February 18, November 1,1998 1999 2004 2003 2006 2004 1995
Amount of original issue $ 1,485,000 $ 199,926 $ 3,470,000 $ 5,990,000 $ 1,440,000 690,000 $ 2,740,000
164

City of Marquette, Michigan
NOTES TO SCHEDULE OF BONDS, NOTES PAYABLE AND CAPITALIZED LEASE OBLIGATIONS PAYABLE – ENTERPRISE FUNDS
For the year ended June 30, 2007
A. The City may pay additional monies to the County of Marquette and may request that such additional funds be used to call bonds for redemption prior to maturity, in which event the County Board of Commissioners would be obligated to apply and use such money for such purposes to the fullest extent possible.
B. Outstanding bonds maturing in the years 2004 to 2007, inclusive, are subject to
redemption on January 1, 2004 at 100% of par plus accrued interest. The outstanding bonds maturing in years 2005 to 2016, inclusive, are subject to redemption on May 1, 2004 at 100% of par plus accrued interest.
C. Outstanding bonds are not subject to optional redemption.
D. Outstanding bonds are not subject to optional redemption.
E. Outstanding bonds maturing prior to June 1, 2004, are not subject to optional
redemption prior to maturity. Bonds maturing on or after June 1, 2004, are subject to redemption at the option of the City, in whole or part, in integral multiples of $5,000, on any date on or after June 1, 2003, at par, plus accrued interest to the redemption date.
165

City of Marquette, Michigan
SCHEDULE OF BONDS PAYABLECOMPONENT UNIT - BOARD OF LIGHT AND POWER ELECTRIC UTILITY FUND
For the year ended June 30, 2007
Revenue BondsSeries 2001
(A)MaturitiesYear Ending June 30:
2008 $ 2,790,000 2009 2,700,000
Discount (41,175)
$ 5,448,825
Interest rates 4.8 - 5.125%
Interest dates Januaryand July
Date of original issue October 11, 2001
Amount of original issue $ 21,815,150
(A) Bonds maturing in the years 2007 through 2009 are subject to redemption prior to maturity at the option of the City, in such order as the City may determine, and by lot within a single maturity, on any interest payment date on or after July 1, 2006. Bonds called for redemption shall be redeemed at par and accrued interest to the date fixed for redemption. Original issue is less than amount outstanding due to the amortization of the discount in the current year.
166
City of Marquette, Michigan
COMPONENT UNITS
INDIVIDUAL COMPONENT UNIT STATEMENTS AND SCHEDULES Component units are used to account for the discretely presented component units which follow governmental or proprietary fund accounting guidelines. BOARD OF LIGHT AND POWER: To account for the electric utility. PETER WHITE PUBLIC LIBRARY: To record revenues and expenditures of the Peter White Public Library. Financing is primarily provided through property taxes. DOWNTOWN DEVELOPMENT AUTHORITY: To record the activities associated with the Downtown Development Authority. MARQUETTE HOUSING COMMISSION: To record the activities associated with the Marquette Housing Commission.
167

City of Marquette, MichiganBoard of Light and Power Electric Utility
COMPARATIVE STATEMENT OF NET ASSETS
June 30, 2007 and 2006
2007 2006
ASSETSCurrent Assets:
Cash and cash equivalents 3,110,749$ 3,245,006$ Internally designated assets:
Customer electric rate stabilization fund 1,792,743 1,788,447 Turbine and major generating equipment overhaul fund 739,820 997,132 Replacement-risk retention fund 1,012,564 2,521,381 Investment -- RHFV 200,186 - Improvement fund 58,300 733,311
Accounts receivable, net 1,285,340 1,247,951 Other receivables 1,725,000 - Inventory 3,256,163 3,011,375 Prepaid expenses 97,224 64,399
TOTAL CURRENT ASSETS 13,278,089 13,609,002
Non-current Assets:Restricted Assets:
Bond and interest redemption fund 2,891,520 2,840,988 Bond reserve fund 2,198,000 2,198,000 Pine hill landfill fund 12,963 12,715
Total Restricted Assets 5,102,483 5,051,703
Unamortized bond issuance costs 24,161 48,936 Investment in UPPPA 2,090,698 2,037,550 Property, plant, and equipment 117,733,051 115,317,907 Accumulated depreciation (79,375,376) (76,297,451)
TOTAL NON-CURRENT ASSETS 45,575,017 46,158,645
TOTAL ASSETS 58,853,106 59,767,647
LIABILITIESCurrent Liabilities:
Accounts payable 1,152,550 730,892 Accrued liabilities 125,799 116,448 Compensated absences 883,933 814,390 Customer deposits payable 1,411,975 1,345,537 Other current liabilities 40,000 40,000
TOTAL CURRENT LIABILITIES 3,614,257 3,047,267
Current Liabilities (payable from restricted assets):Current maturities on revenue bonds 2,790,000 2,695,000 Revenue bond accrued interest payable 101,520 145,987
TOTAL CURRENT LIABILITIES (PAYABLEFROM RESTRICTED ASSETS) 2,891,520 2,840,987
Non-current Liabilities:Bonds payable 2,679,750 5,448,825 Reserve for turbine and major generating equipment overhaul 739,820 997,132 Post closure costs-Landfill 547,441 572,918
TOTAL NON-CURRENT LIABILITIES 3,967,011 7,018,875
TOTAL LIABILITIES 10,472,788 12,907,129
NET ASSETSInvested in capital assets net of related debt 35,677,925 33,571,631 Restricted:
Other activities 2,210,963 2,210,715 Unrestricted 10,491,430 11,078,172
TOTAL NET ASSETS 48,380,318$ 46,860,518$
168

City of Marquette, MichiganBoard of Light and Power Electric Utility
STATEMENT OF REVENUES, EXPENSES AND CHANGES IN NET ASSETS
For the Fiscal Year Ended June 30, 2007With Comparative Actual Amounts for the Fiscal Year Ended June 30, 2006
2007 2006
OPERATING REVENUES:Electricity Sales:
Urban 13,200,713$ 12,906,046$ Rural 7,810,320 7,487,151 Sales to Alger-Delta Co-op 968,308 854,500 Sales to Wisconsin Electric Power Company 229,068 704,187 Street lighting 327,198 331,017 Other municipal departments 702,777 705,985
Rent and other 673,594 599,764
TOTAL OPERATING REVENUES 23,911,978 23,588,650
OPERATING EXPENSES:Administrative and general 4,610,115 4,359,864 Production 11,454,801 11,363,952 Purchased power 2,739,263 1,488,238 Distribution and transmission 1,053,395 1,016,294 Customer accounting 555,617 491,914 Payment in lieu of property taxes - City of Marquette 1,413,029 1,460,884 Provision for depreciation, excluding $102,006 charged
to other operating expenses 3,095,911 3,094,271
TOTAL OPERATING EXPENSES 24,922,131 23,275,417
INCOME FROM OPERATIONS (1,010,153) 313,233
NON-OPERATING REVENUES (EXPENSES):Investment income 848,866 726,470 Delayed payment fees 30,599 30,038 Interest on refunding bonds (203,040) (291,975) Other interest expense (36,210) (37,515) Amortization of bond issuance expense (45,700) (44,144)
TOTAL NON-OPERATING REVENUES (EXPENSES) 594,515 382,874
NET INCOME (LOSS) BEFORE EXTRAORDINARY ITEM (415,638) 696,107
Extraordinary Item 1,725,000 -
NET INCOME 1,309,362 696,107
Capital contributions from customers 210,438 175,385
CHANGE IN NET ASSETS 1,519,800 871,492
Net assets, beginning of year 46,860,518 45,989,026
NET ASSETS, END OF YEAR 48,380,318$ 46,860,518$
169

S
S
S
S
R
S
City of Marquette, MichiganBoard of Light and Power Electric Utility
STATEMENT OF CASH FLOWS
For the Fiscal Year Ended June 30, 2007With Comparative Actual Amounts for the Fiscal Year Ended June 30, 2006
2007 2006CASH FLOWS FROM OPERATING ACTIVITIES:
Cash received from customers 23,874,589$ 23,680,145$ Cash paid to suppliers and employees (21,717,646) (19,893,045)
NET CASH PROVIDED BY OPERATING ACTIVITIE 2,156,943 3,787,100
CASH FLOWS FROM CAPITAL AND RELATED FINANCING ACTIVITIESAcquisition and construction of capital assets (2,572,007) (2,466,386) Proceeds from sale of equipment - - Principal payment on revenue bonds, notes payable and capital lease obligations (2,695,000) (3,805,000) Capital contributions 210,438 175,386 Interest paid on revenue bonds and notes payable (247,507) (349,051)
NET CASH (USED) FOR CAPITALAND RELATED FINANCING ACTIVITIE (5,304,076) (6,445,051)
CASH FLOWS FROM INVESTING ACTIVITIES:Investment income 930,825 877,973 Proceeds from maturities and sales of investment securities 4,974,616 4,922,891 Purchase of investments (2,892,565) (3,376,998)
NET CASH (USED) BY INVESTING ACTIVITIE 3,012,876 2,423,866
NET (DECREASE) IN CASH AND CASH EQUIVALENT (134,257) (234,085)
Cash and cash equivalents, beginning of year 3,245,006 3,479,091
CASH AND CASH EQUIVALENTS, END OF YEA 3,110,749$ 3,245,006$
Non-cash Investing, Capital and Financing Activities:Net appreciation (depreciation) in fair value of investments -$ -$
RECONCILIATION OF OPERATING INCOME TO NET CASHPROVIDED BY OPERATING ACTIVITIES:Operating income (1,010,153)$ 313,233$
Adjustments to reconcile income to net cash provided by operating activities:Depreciation 3,197,917 3,211,321 Bad debt expense 2,370 Changes in assets and liabilities:
(Increase) decrease in accounts receivable (37,389) 89,125 (Increase) decrease in inventory (244,788) 1,254,999 (Increase) decrease in prepaid expenses (32,845) 2,899 Increase (decrease) in accounts payable 421,658 (1,223,696) Increase (decrease) in accrued wages and related liabilities 9,351 (22,315) Increase (decrease) in accrued sick and vacation 69,543 21,233 Increase in customer deposits, including accrued interest 66,438 26,459 (Decrease) in landfill site post closure care cost liability (25,477) (28,737) Increase (decrease) in reserve for turbine overhaul (257,312) 140,209
NET ADJUSTMENTS 3,167,096 3,473,867
NET CASH PROVIDED BY OPERATING ACTIVITIE 2,156,943$ 3,787,100$
170
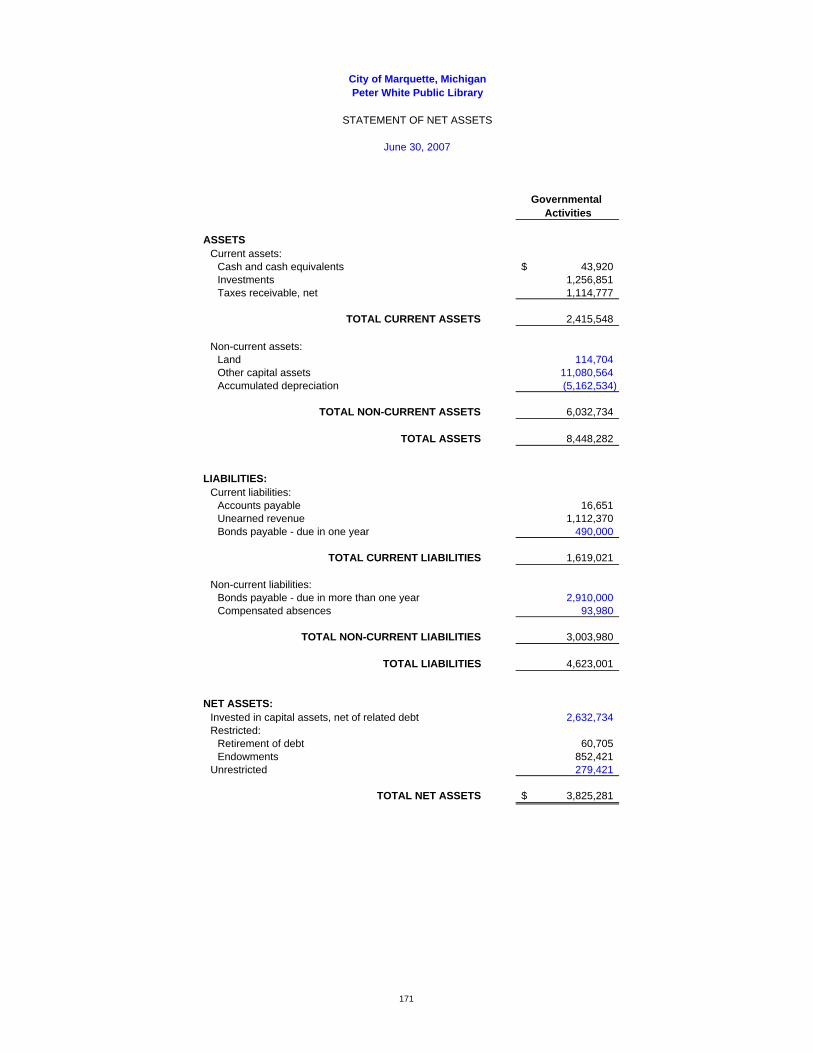
City of Marquette, MichiganPeter White Public Library
STATEMENT OF NET ASSETS
June 30, 2007
Governmental Activities
ASSETSCurrent assets:
Cash and cash equivalents 43,920$ Investments 1,256,851 Taxes receivable, net 1,114,777
TOTAL CURRENT ASSETS 2,415,548
Non-current assets:Land 114,704 Other capital assets 11,080,564 Accumulated depreciation (5,162,534)
TOTAL NON-CURRENT ASSETS 6,032,734
TOTAL ASSETS 8,448,282
LIABILITIES:Current liabilities:
Accounts payable 16,651 Unearned revenue 1,112,370 Bonds payable - due in one year 490,000
TOTAL CURRENT LIABILITIES 1,619,021
Non-current liabilities:Bonds payable - due in more than one year 2,910,000 Compensated absences 93,980
TOTAL NON-CURRENT LIABILITIES 3,003,980
TOTAL LIABILITIES 4,623,001
NET ASSETS:Invested in capital assets, net of related debt 2,632,734 Restricted:
Retirement of debt 60,705 Endowments 852,421
Unrestricted 279,421
TOTAL NET ASSETS 3,825,281$
171
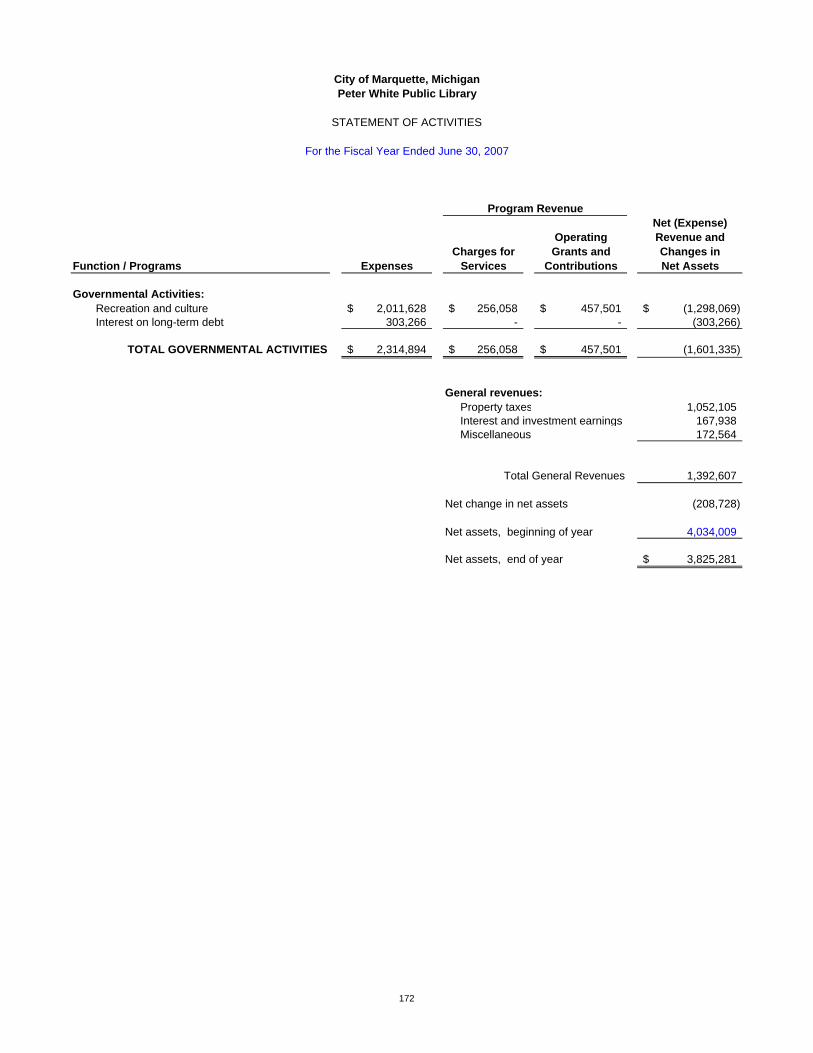
City of Marquette, MichiganPeter White Public Library
STATEMENT OF ACTIVITIES
For the Fiscal Year Ended June 30, 2007
Program RevenueNet (Expense)
Operating Revenue andCharges for Grants and Changes in
Function / Programs Expenses Services Contributions Net Assets
Governmental Activities:Recreation and culture 2,011,628$ 256,058$ 457,501$ (1,298,069)$ Interest on long-term debt 303,266 - - (303,266)
TOTAL GOVERNMENTAL ACTIVITIES 2,314,894$ 256,058$ 457,501$ (1,601,335)
General revenues:Property taxes 1,052,105 Interest and investment earnings 167,938 Miscellaneous 172,564
Total General Revenues 1,392,607
Net change in net assets (208,728)
Net assets, beginning of year 4,034,009
Net assets, end of year 3,825,281$
172
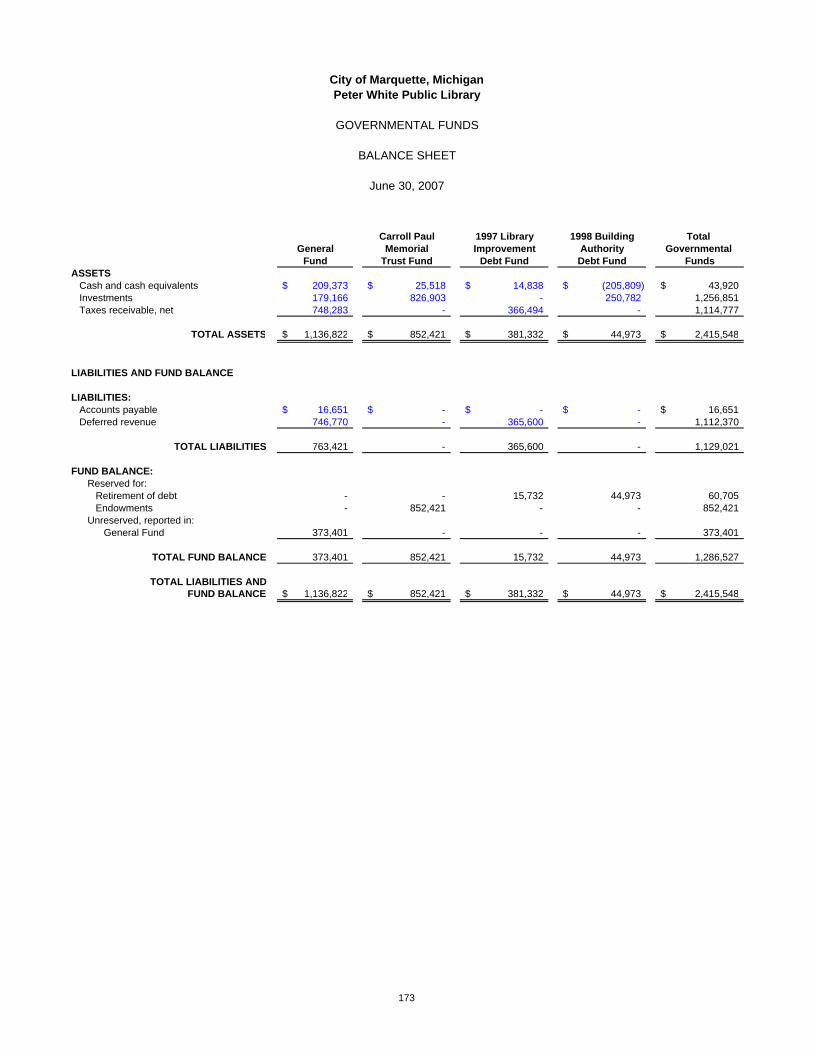
City of Marquette, MichiganPeter White Public Library
GOVERNMENTAL FUNDS
BALANCE SHEET
June 30, 2007
Carroll Paul 1997 Library 1998 Building Total General Memorial Improvement Authority Governmental
Fund Trust Fund Debt Fund Debt Fund FundsASSETS
Cash and cash equivalents 209,373$ 25,518$ 14,838$ (205,809)$ 43,920$ Investments 179,166 826,903 - 250,782 1,256,851 Taxes receivable, net 748,283 - 366,494 - 1,114,777
TOTAL ASSETS 1,136,822$ 852,421$ 381,332$ 44,973$ 2,415,548$
LIABILITIES AND FUND BALANCE
LIABILITIES:Accounts payable 16,651$ -$ -$ -$ 16,651$ Deferred revenue 746,770 - 365,600 - 1,112,370
TOTAL LIABILITIES 763,421 - 365,600 - 1,129,021
FUND BALANCE:Reserved for:
Retirement of debt - - 15,732 44,973 60,705 Endowments - 852,421 - - 852,421
Unreserved, reported in:General Fund 373,401 - - - 373,401
TOTAL FUND BALANCE 373,401 852,421 15,732 44,973 1,286,527
TOTAL LIABILITIES ANDFUND BALANCE 1,136,822$ 852,421$ 381,332$ 44,973$ 2,415,548$
173
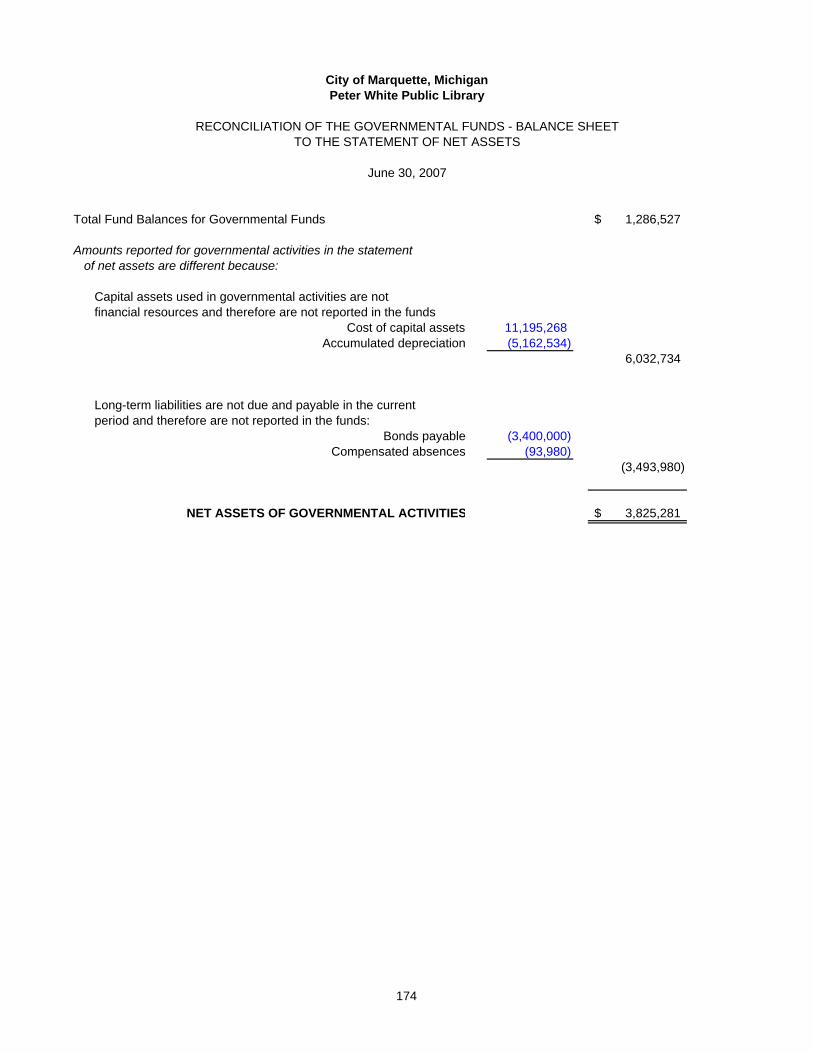
S
City of Marquette, MichiganPeter White Public Library
RECONCILIATION OF THE GOVERNMENTAL FUNDS - BALANCE SHEETTO THE STATEMENT OF NET ASSETS
June 30, 2007
Total Fund Balances for Governmental Funds 1,286,527$
Amounts reported for governmental activities in the statementof net assets are different because:
Capital assets used in governmental activities are notfinancial resources and therefore are not reported in the funds
Cost of capital assets 11,195,268 Accumulated depreciation (5,162,534)
6,032,734
Long-term liabilities are not due and payable in the currentperiod and therefore are not reported in the funds:
Bonds payable (3,400,000) Compensated absences (93,980)
(3,493,980)
NET ASSETS OF GOVERNMENTAL ACTIVITIE 3,825,281$
174

City of Marquette, MichiganPeter White Public Library
GOVERNMENTAL FUNDS
STATEMENT OF REVENUES, EXPENDITURES AND CHANGES IN FUND BALANCE
For the Fiscal Year Ended June 30, 2007
Carroll Paul 1997 Library 1998 Building TotalGeneral Memorial Improvement Authority Governmental
Fund Trust Fund Debt Fund Debt Fund FundsREVENUES:
Property taxes 675,930$ -$ 376,175$ -$ 1,052,105$ State sources 37,896 - - - 37,896 Local sources 331,883 - - - 331,883 Charges for services 52,395 - - - 52,395 Fines and forfeiture 177,790 - - - 177,790 Rentals 25,873 - - - 25,873 Contributions from private sources 57,496 - - 30,226 87,722 Investment income 16,321 104,022 - 47,595 167,938 Other 17,157 - 155,407 - 172,564
TOTAL REVENUES 1,392,741 104,022 531,582 77,821 2,106,166
EXPENDITURES:Recreation and Culture:
Personnel services 896,434 - - - 896,434 Supplies 80,261 - - - 80,261 Other services and charges 308,836 3,911 82,479 - 395,226
Capital outlay 134,125 - - - 134,125 Debt service
Principal retirement - - 210,000 225,000 435,000 Interest and fiscal charges - - 226,972 22,679 249,651
TOTAL EXPENDITURES 1,419,656 3,911 519,451 247,679 2,190,697
NET REVENUES OVER EXPENDITURES (26,915) 100,111 12,131 (169,858) (84,531)
OTHER FINANCING SOURCE (USES)Transfers In 28,450 - - - 28,450 Transfers (Out) - (28,450) - - (28,450) Refunding Bonds - - 2,935,000 - 2,935,000 Premium on Bond Issuance - - 43,401 - 43,401 Payment to refunded bond escrow agent - - (2,982,016) - (2,982,016)
TOTAL OTHER FINANCING SOURCES (USES) 28,450 (28,450) (3,615) - (3,615)
NET CHANGE IN FUND BALANCE 1,535 71,661 8,516 (169,858) (88,146)
Fund balance, beginning of year 371,866 780,760 7,216 214,831 1,374,673
FUND BALANCE, END OF YEAR 373,401$ 852,421$ 15,732$ 44,973$ 1,286,527$
175

City of Marquette, MichiganPeter White Public Library
RECONCILIATION OF THE STATEMENT OF REVENUES, EXPENDITURES AND CHANGES INFUND BALANCES OF GOVERNMENTAL FUNDS TO THE STATEMENT OF ACTIVITIES
For the Fiscal Year Ended June 30, 2007
Net Change in Fund Balances - Total Governmental Funds (88,146)$
Amounts reported for governmental activities in the statementof activities are different because:
Governmental funds report capital outlays as expenditures. However, inthe statement of activities, the cost of those assets is allocated over their estimated useful lives as depreciation expense. This is the amountby which depreciation exceeded capital outlays in the current period.
Capital outlays -$ Depreciation expense (488,912)
(488,912)
Issuance of bond principal is a revenue in the governmental funds, but the issuance increases long-term liabilities in the statement of net assets. (2,935,000)
Repayment of bond principal is an expenditure in the governmental funds,but the repayment reduces long-term liabilities in the statement of net assets. Existing debt 435,000 Defeased debt 2,885,000
Some expenses such as accrued sick and vacation expenses reportedin the statement of activities do not require the use of current financialresources and therefore are not reported as expenditures in governmentalfunds. (16,670)
CHANGE IN NET ASSETS OF GOVERNMENTAL ACTIVITIES (208,728)$
176

City of Marquette, MichiganNon-major Component Units
COMBINING STATEMENT OF NET ASSETS
June 30, 2007
Downtown MarquetteDevelopment Housing
Authority Commission Total
ASSETSCurrent assets:
Cash and cash equivalents 204,237$ 1,121,727$ 1,325,964$ Investments - 479,991 479,991 Taxes receivable, net 442,078 - 442,078 Accounts receivable, net 34,636 28,458 63,094 Inventory - 11,262 11,262 Prepaid expenses - 33,390 33,390
TOTAL CURRENT ASSETS 680,951 1,674,828 2,355,779
Non-current assets:Capital assets 2,975,557 11,299,924 14,275,481 Accumulated depreciation (339,829) (7,672,963) (8,012,792)
TOTAL NON-CURRENT ASSETS 2,635,728 3,626,961 6,262,689
TOTAL ASSETS 3,316,679 5,301,789 8,618,468
LIABILITIES:Current liabilities:
Accounts payable 461,968 116 462,084 Accrued liabilities 4,183 220,461 224,644 Unearned revenue 442,078 - 442,078 Bonds payable - due in one year 178,571 - 178,571
TOTAL CURRENT LIABILITIES 1,086,800 220,577 1,307,377
Non-current liabilities:Bonds payable - due in more than one year 500,000 - 500,000 Notes payable - due in more than one year - 985,813 985,813 Other non-current liabilities - 30,042 30,042
TOTAL NON-CURRENT LIABILITIES 500,000 1,015,855 1,515,855
TOTAL LIABILITIES 1,586,800 1,236,432 2,823,232
NET ASSETS:Invested in capital assets, net of related debt 1,957,157 2,583,976 4,541,133 Restricted - 88,381 88,381 Unrestricted (227,278) 1,393,000 1,165,722
TOTAL NET ASSETS 1,729,879$ 4,065,357$ 5,795,236$
177

City of Marquette, MichiganNon-major Component Units
COMBINING STATEMENT OF ACTIVITIES
For the Fiscal Year Ended June 30, 2007
Program Revenue Net (Expense) Revenue and Changes in Net Assets
Operating Capital Downtown MarquetteCharges for Grants and Grants and Development Housing
Function / Programs Expenses Services Contributions Contributions Authority Commission Total
Governmental Activities:Downtown Development Authority 406,832$ 104,886$ 55,000$ 261,893$ 14,947$ -$ 14,947$
Business-type Activities:Marquette Housing Commission 1,800,511 483,587 874,608 550,980 - 108,664 108,664
TOTAL 2,207,343$ 588,473$ 929,608$ 812,873$ 14,947 108,664 123,611
General revenues:Property taxes 383,506 - 383,506 Interest and investment earnings 10,076 34,212 44,288 Miscellaneous 35,206 111,915 147,121
TOTAL GENERAL REVENUES 428,788 146,127 574,915
CHANGES IN NET ASSETS 443,735 254,791 698,526
Net assets, beginning of year 1,286,144 3,810,566 5,096,710
NET ASSETS, END OF YEAR 1,729,879$ 4,065,357$ 5,795,236$
178

City of Marquette, MichiganDowntown Development Authority
STATEMENT OF NET ASSETS
June 30, 2007
Governmental Activities
ASSETSCurrent assets:
Cash and cash equivalents 204,237$ Taxes receivable, net 442,078 Accounts receivable, net 34,636
TOTAL CURRENT ASSETS 680,951
Non-current assets:Capital assets 2,975,557 Accumulated depreciation (339,829)
TOTAL NON-CURRENT ASSETS 2,635,728
TOTAL ASSETS 3,316,679
LIABILITIES:Current liabilities:
Accounts payable 806,494 Accrued wages and related liabilities 4,183 Due to primary government (344,526) Unearned revenue 442,078 Bonds payable - due in one year 178,571
TOTAL CURRENT LIABILITIES 1,086,800
Non-current liabilities:Bonds payable - due in more than one year 500,000
TOTAL NON-CURRENT LIABILITIES 500,000
TOTAL LIABILITIES 1,586,800
NET ASSETS:Invested in capital assets, net of related debt 1,957,157 Unrestricted (227,278)
TOTAL NET ASSETS 1,729,879$
179

City of Marquette, MichiganDowntown Development Authority
STATEMENT OF ACTIVITIES
For the Fiscal Year Ended June 30, 2007
Program RevenueNet (Expense)
Operating Revenue andCharges for Grants and Changes in
Function / Programs Expenses Services Contributions Net Assets
Governmental Activities:General government 203,010$ 850$ 316,893$ 114,733$ Parking system 172,820 104,036 - (68,784) Interest on long-term debt 31,002 - - (31,002) Other governmental - - - -
TOTAL GOVERNMENTAL ACTIVITIES 406,832$ 104,886$ 316,893$ 14,947
General revenues:Property taxes 383,506 Interest and investment earnings 10,076 Miscellaneous 35,206
TOTAL GENERAL REVENUES 428,788
CHANGES IN NET ASSETS 443,735
Net assets, beginning of year 1,286,144
NET ASSETS, END OF YEAR 1,729,879$
180

City of Marquette, MichiganDowntown Development Authority
GOVERNMENTAL FUNDS
BALANCE SHEET
June 30, 2007
Parking Capital Debt Total General System Projects Service Governmental
Fund Fund Fund Fund FundsASSETS
Cash and cash equivalents 201,738$ 2,499$ -$ -$ 204,237$ Taxes receivable, net 442,078 - - - 442,078 Accounts receivable, net - 8,447 26,189 - 34,636 Due from other funds 43,256 - 5,690 - 48,946
TOTAL ASSETS 687,072$ 10,946$ 31,879$ -$ 729,897$
LIABILITIES AND FUND BALANCE
LIABILITIES:Accounts payable 461,968 - - - 461,968 Accrued wages and related liabilities 4,183 - - - 4,183 Due to other funds - 12,029 36,917 - 48,946 Deferred revenue 442,078 - - - 442,078
TOTAL LIABILITIES 908,229 12,029 36,917 - 957,175
FUND BALANCE:Reserved for:
Capital projects - - (5,038) - (5,038) Unreserved, reported in:
General Fund (221,157) - - - (221,157) Special Revenue Fund - (1,083) - - (1,083)
TOTAL FUND BALANCE (221,157) (1,083) (5,038) - (227,278)
TOTAL LIABILITIES &FUND BALANCE 687,072$ 10,946$ 31,879$ -$ 729,897$
181

City of Marquette, MichiganDowntown Development Authority
RECONCILIATION OF THE GOVERNMENTAL FUNDS - BALANCE SHEETTO THE STATEMENT OF NET ASSETS
June 30, 2007
Total Fund Balances for Governmental Funds (227,278)$
Amounts reported for governmental activities in the statementof net assets are different because:
Capital assets used in governmental activities are notfinancial resources and therefore are not reported in the funds
Cost of capital assets 2,975,557 Accumulated depreciation (339,829)
2,635,728
Long-term liabilities, including bonds payable, are not dueand payable in the current period and therefore are notreported in the funds (678,571)
NET ASSETS OF GOVERNMENTAL ACTIVITIES 1,729,879$
182

City of Marquette, MichiganDowntown Development Authority
GOVERNMENTAL FUNDS
STATEMENT OF REVENUES, EXPENDITURES AND CHANGES IN FUND BALANCE
For the Fiscal Year Ended June 30, 2007
Parking Capital Debt TotalGeneral System Projects Service Governmental
Fund Fund Fund Fund FundsREVENUES:
Property taxes 383,506$ -$ -$ -$ 383,506$ State sources 261,893 - - - 261,893 Intergovernmental revenues 55,000 - - - 55,000 Charges for services - 15,172 - - 15,172 Rentals 850 88,864 - - 89,714 Investment income 9,001 - 1,075 - 10,076 Other 32,426 2,780 - - 35,206
TOTAL REVENUES 742,676 106,816 1,075 - 850,567
EXPENDITURES:Current operations:
General government 133,871 - - - 133,871 Parking system - 166,531 - - 166,531
Capital outlay 30,313 103,994 359,999 - 494,306 Debt service
Principal retirement 184,610 - - - 184,610 Interest and fiscal charges 31,002 - - - 31,002
TOTAL EXPENDITURES 379,796 270,525 359,999 - 1,010,320
EXCESS OF REVENUES OVER(UNDER) EXPENDITURES 362,880 (163,709) (358,924) - (159,753)
OTHER FINANCING SOURCES (USES):Transfers in - 148,499 - - 148,499 Transfers out (148,499) - - - (148,499)
TOTAL OTHER FINANCING SOURCES (USES) (148,499) 148,499 - - -
NET CHANGE IN FUND BALANCE 214,381 (15,210) (358,924) - (159,753)
Fund balance, beginning of year (179,335) 19,817 91,993 - (67,525)
FUND BALANCE, END OF YEAR 35,046$ 4,607$ (266,931)$ -$ (227,278)$
183
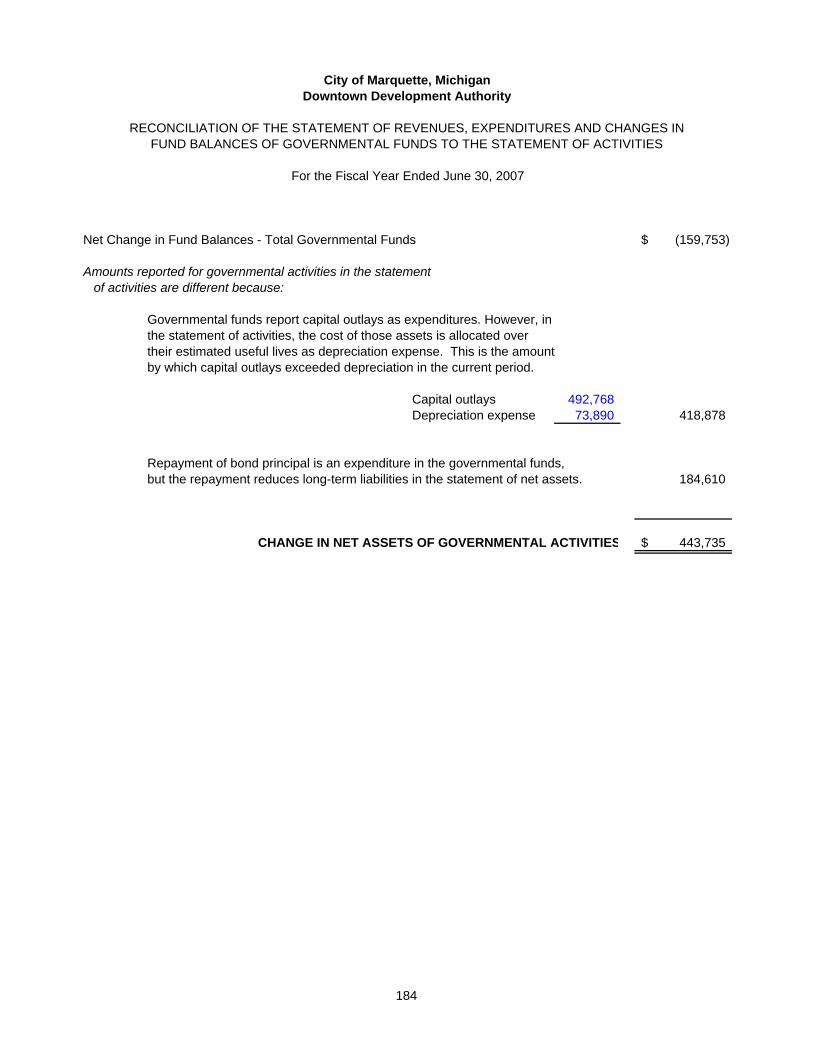
City of Marquette, MichiganDowntown Development Authority
RECONCILIATION OF THE STATEMENT OF REVENUES, EXPENDITURES AND CHANGES INFUND BALANCES OF GOVERNMENTAL FUNDS TO THE STATEMENT OF ACTIVITIES
For the Fiscal Year Ended June 30, 2007
Net Change in Fund Balances - Total Governmental Funds (159,753)$
Amounts reported for governmental activities in the statementof activities are different because:
Governmental funds report capital outlays as expenditures. However, inthe statement of activities, the cost of those assets is allocated over their estimated useful lives as depreciation expense. This is the amountby which capital outlays exceeded depreciation in the current period.
Capital outlays 492,768 Depreciation expense 73,890 418,878
Repayment of bond principal is an expenditure in the governmental funds,but the repayment reduces long-term liabilities in the statement of net assets. 184,610
CHANGE IN NET ASSETS OF GOVERNMENTAL ACTIVITIES 443,735$
184

City of Marquette, MichiganMarquette Housing Commission
STATEMENT OF NET ASSETS
June 30, 2007
2007
ASSETSCurrent Assets:
Cash and cash equivalents 1,121,727$ Accounts receivable, net 28,458 Investments 479,991 Prepaid expenses 33,390 Inventory 11,262
TOTAL CURRENT ASSETS 1,674,828
Non-current Assets:Capital assets 11,299,924 Accumulated depreciation (7,672,963)
TOTAL NON-CURRENT ASSETS 3,626,961
TOTAL ASSETS 5,301,789
LIABILITIESCurrent Liabilities:
Accounts payable 116 Accrued liabilities 220,461
TOTAL CURRENT LIABILITIES 220,577
Non-current Liabilities:Notes payable 985,813 Compensated absences 30,042
TOTAL NON-CURRENT LIABILITIES 1,015,855
TOTAL LIABILITIES 1,236,432
NET ASSETSInvested in capital assets net of related debt 2,583,976 Restricted 88,381 Unrestricted 1,393,000
TOTAL NET ASSETS 4,065,357$
185

City of Marquette, MichiganMarquette Housing Commission
STATEMENT OF ACTIVITIES
For the Fiscal Year Ended June 30, 2007
Program Revenue
Net (Expense) Revenue and Changes
in Net Assets
Fees, Fines and Operating CapitalCharges for Grants and Grants and Business-Type
Function / Programs Expenses Services Contributions Contributions Activities
Business-type Activities:Public Housing 1,800,511$ 483,587$ 874,608$ 550,980$ 108,664$
TOTAL 1,800,511$ 483,587$ 874,608$ 550,980$ 108,664
General revenues:Unrestricted investment earnings 34,212 Other 111,915
TOTAL GENERAL REVENUES 146,127
CHANGES IN NET ASSETS 254,791
Net assets, beginning of year 3,810,566
NET ASSETS, END OF YEAR 4,065,357$
186
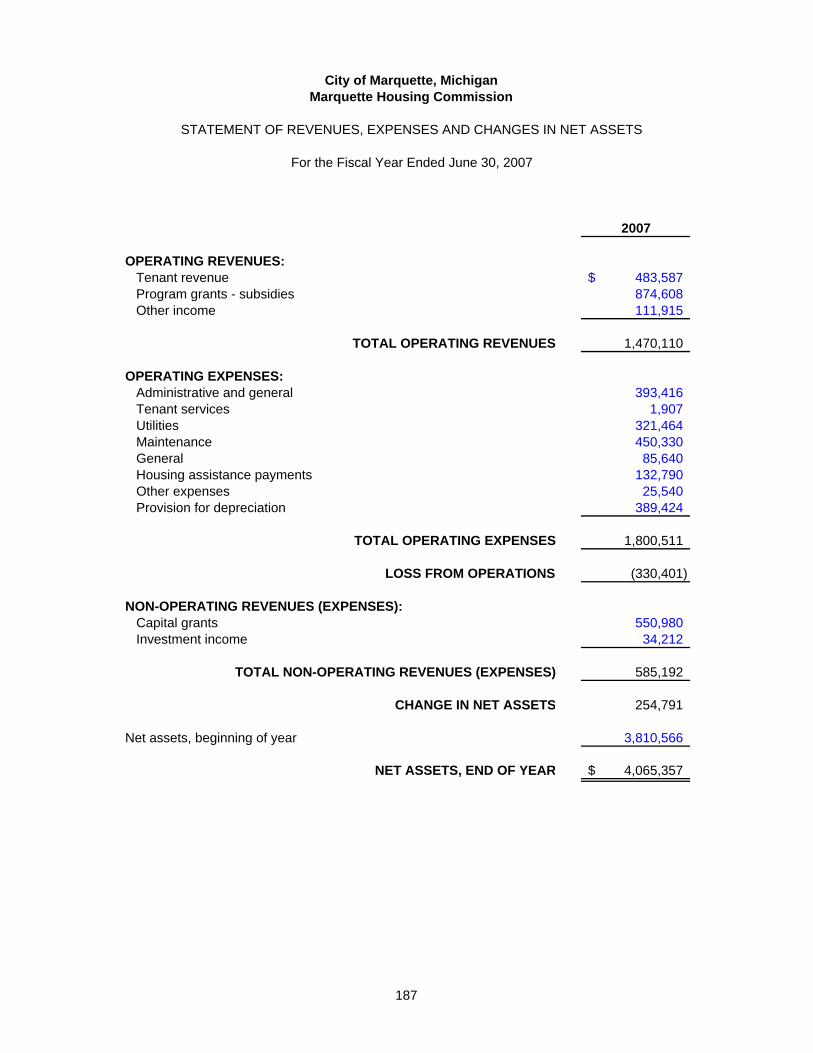
City of Marquette, MichiganMarquette Housing Commission
STATEMENT OF REVENUES, EXPENSES AND CHANGES IN NET ASSETS
For the Fiscal Year Ended June 30, 2007
2007
OPERATING REVENUES:Tenant revenue 483,587$ Program grants - subsidies 874,608 Other income 111,915
TOTAL OPERATING REVENUES 1,470,110
OPERATING EXPENSES:Administrative and general 393,416 Tenant services 1,907 Utilities 321,464 Maintenance 450,330 General 85,640 Housing assistance payments 132,790 Other expenses 25,540 Provision for depreciation 389,424
TOTAL OPERATING EXPENSES 1,800,511
LOSS FROM OPERATIONS (330,401)
NON-OPERATING REVENUES (EXPENSES):Capital grants 550,980 Investment income 34,212
TOTAL NON-OPERATING REVENUES (EXPENSES) 585,192
CHANGE IN NET ASSETS 254,791
Net assets, beginning of year 3,810,566
NET ASSETS, END OF YEAR 4,065,357$
187
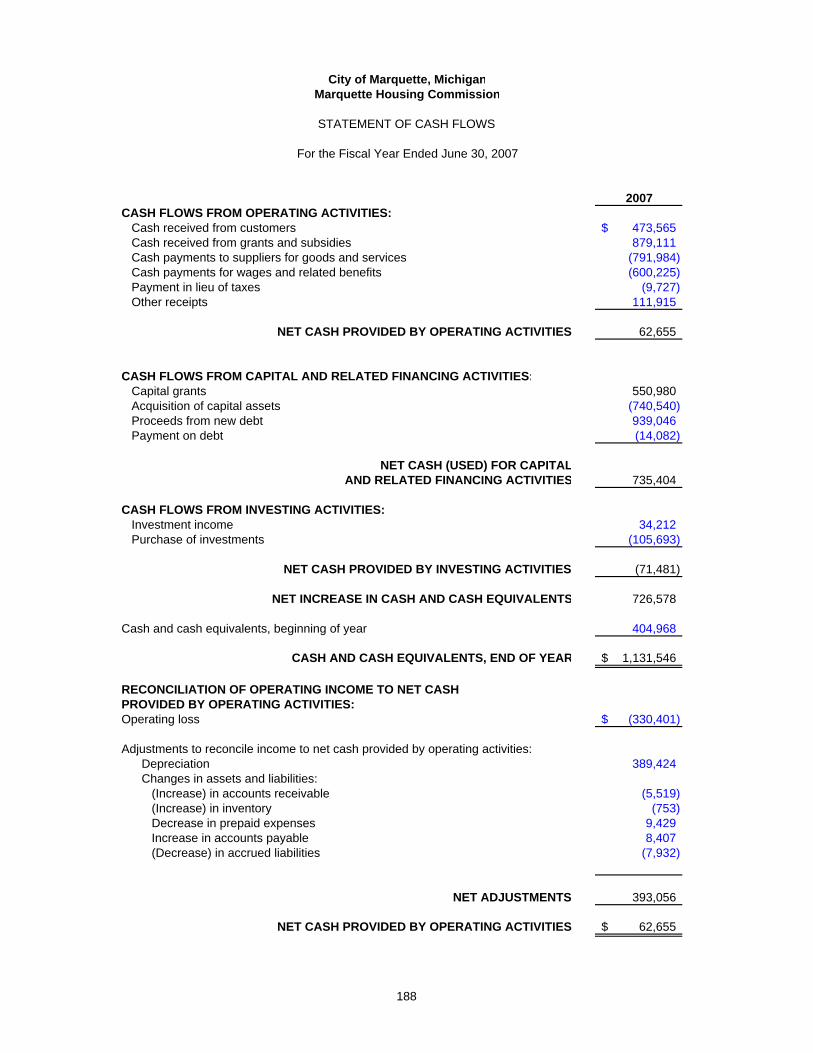
S
R
City of Marquette, MichiganMarquette Housing Commission
STATEMENT OF CASH FLOWS
For the Fiscal Year Ended June 30, 2007
2007CASH FLOWS FROM OPERATING ACTIVITIES:
Cash received from customers 473,565$ Cash received from grants and subsidies 879,111 Cash payments to suppliers for goods and services (791,984) Cash payments for wages and related benefits (600,225) Payment in lieu of taxes (9,727) Other receipts 111,915
NET CASH PROVIDED BY OPERATING ACTIVITIES 62,655
CASH FLOWS FROM CAPITAL AND RELATED FINANCING ACTIVITIES:Capital grants 550,980 Acquisition of capital assets (740,540) Proceeds from new debt 939,046 Payment on debt (14,082)
NET CASH (USED) FOR CAPITALAND RELATED FINANCING ACTIVITIES 735,404
CASH FLOWS FROM INVESTING ACTIVITIES:Investment income 34,212 Purchase of investments (105,693)
NET CASH PROVIDED BY INVESTING ACTIVITIES (71,481)
NET INCREASE IN CASH AND CASH EQUIVALENT 726,578
Cash and cash equivalents, beginning of year 404,968
CASH AND CASH EQUIVALENTS, END OF YEA 1,131,546$
RECONCILIATION OF OPERATING INCOME TO NET CASHPROVIDED BY OPERATING ACTIVITIES:Operating loss (330,401)$
Adjustments to reconcile income to net cash provided by operating activities:Depreciation 389,424 Changes in assets and liabilities:
(Increase) in accounts receivable (5,519) (Increase) in inventory (753) Decrease in prepaid expenses 9,429 Increase in accounts payable 8,407 (Decrease) in accrued liabilities (7,932)
NET ADJUSTMENTS 393,056
NET CASH PROVIDED BY OPERATING ACTIVITIES 62,655$
188

190
City of Marquette, Michigan
STATISTICAL INFORMATION This part of the City of Marquette’s comprehensive annual financial report presents detailed information as a context for understanding what the information in the financial statements, note disclosures, and required supplementary information says about the city’s overall financial health. Contents Page Financial Trends 190-195 These schedules contain trend information to help the reader understand how the city’s financial performance and well-being have changed over time.
Revenue Capacity 196-200 These schedules contain information to help the reader assess the city’s most significant local revenue source, the property tax.
Debt Capacity 201-206 These schedules present information to help the reader assess the affordability of the city’s current levels of outstanding debt and the city’s ability to issue additional debt in the future.
Demographic and Economic Information 207-209 These schedules offer demographic and economic indicators to help the reader understand the environment within which the city’s financial activities take place.
Operating Information 210-211 These schedules contain service and infrastructure data to help the reader understand how the information in the city’s financial report relates to the services the city provides and the activities it performs.
Sources: Unless otherwise noted, the information in these schedules is derived from the comprehensive annual financial reports for the relevant year. The city implemented GASB Statement 34 in 2003; schedules presenting government-wide information include information beginning in that year.

Table 1
2007 2006 2005 2004 2003
Governmental ActivitiesInvested in capital assets, net of related debt 29,731,919$ 32,827,042$ 20,668,811$ 17,517,503$ 19,624,856$ Restricted 568,371 548,317 528,637 - - Unrestricted 13,066,579 7,175,565 4,893,099 7,897,006 5,279,577
Total Governmental Activities Net Assets 43,366,869$ 40,550,924$ 26,090,547$ 25,414,509$ 24,904,433$
Business-Type ActivitiesInvestment capital assets, net of related debt 31,910,645$ 32,258,682$ 28,448,328$ 27,558,113$ 25,035,733$ Restricted 1,938,968 1,951,234 1,929,883 2,134,176 2,275,947 Unrestricted 2,698,684 5,339,506 8,722,650 8,979,306 10,863,385
Total Business-Type Activities 36,548,297$ 39,549,422$ 39,100,861$ 38,671,595$ 38,175,065$
Primary GovernmentInvested in capital assets, net of related debt 61,642,564$ 65,085,724$ 49,117,139$ 45,075,616$ 44,660,589$ Restricted 2,507,339 2,499,551 2,458,520 2,134,176 2,275,947 Unrestricted 15,765,263 12,515,071 13,615,749 16,876,312 16,142,962
Total Primary Government Net Assets 79,915,166$ 80,100,346$ 65,191,408$ 64,086,104$ 63,079,498$
Fiscal Year
City of Marquette, MichiganNet Assets by Component
Last Five Fiscal Years
190

Table 2
2007 2006 2005 2004 2003
ExpensesGovernmental Activities
General government 3,395,398$ 2,994,081$ 2,919,314$ 3,749,652$ 3,186,717$ Public health & Safety 4,948,192 4,919,863 4,680,206 4,649,016 4,208,180 Public works 3,039,550 3,546,425 2,843,875 2,850,031 2,689,183 Highway and streets 2,324,977 1,738,087 2,582,962 2,604,467 2,245,852 Social services 355,193 511,948 503,334 840,683 371,076 Sanitation 1,238,866 1,210,914 1,528,524 1,148,170 1,168,005 Recreation and Culture 1,261,545 1,302,717 1,316,150 1,398,509 1,164,311 Interest on long-term debt 750,760 845,767 504,304 458,058 490,149 Depreciation - unallocated 1,916,607 1,912,853 857,165 875,141 713,961
Total Governmental Activities Expenses 19,231,088 18,982,655 17,735,834 18,573,727 16,237,434
Business-Type ActivitiesWater supply and sewage disposal 6,512,473 6,339,831 5,895,101 5,449,460 5,438,937 Storm water utility 891,632 866,257 680,791 692,413 926,614 Marina 394,386 374,433 364,786 416,614 385,734 Intermodal transportation terminal 959,368 86,003 156,177 173,272 181,272
Total Business-Type Activities Expenses 8,757,859 7,666,524 7,096,855 6,731,759 6,932,557 Total Primary Government Expenses 27,988,947$ 26,649,179$ 24,832,689$ 25,305,486$ 23,169,991$
Program RevenuesGovernmental Activities
Charges for ServicesGeneral government 1,206,989$ 1,176,083$ 1,254,826$ 1,087,850$ 1,025,179$ Public health 202,071 202,388 183,381 108,808 106,143 Public works 1,205,514 1,102,852 1,370,220 1,027,142 625,711 Sanitation 1,255,621 1,157,631 2,065,969 1,112,255 946,345 Recreation and culture 905,996 809,727 803,526 739,130 719,708 Operating grants and contributions 2,392,818 5,446,027 2,185,688 2,873,580 2,109,042 Capital grants and contributions 114,702 647,205 265,770 1,795,016 1,283,881
Total Governmental Activities Program Revenues 7,283,711 10,541,913 8,129,380 8,743,781 6,816,009
Business-Type ActivitiesCharges for Services
Water supply and sewage disposal 6,025,359 5,914,730 5,726,868 5,680,134 5,712,063 Storm water utility 867,963 709,859 649,034 660,058 663,542 Marina 284,838 281,296 258,940 252,099 235,782 Intermodal transportation terminal 26,631 35,531 63,963 145,992 131,283
Operating grants and contributions 25,057 9,000 173,320 536 - Capital grants and contributions - - - - -
Total Business-Type Activities Program Revenues 7,229,848 6,950,416 6,872,125 6,738,819 6,742,670 Total Primary Government Program Revenues 14,513,559$ 17,492,329$ 15,001,505$ 15,482,600$ 13,558,679$
Net (Expense) RevenueGovernmental Activities (11,947,377)$ (8,440,742)$ (9,606,454)$ (9,829,946)$ (9,421,425)$ Business-Type Activities (1,528,011) (716,108) (224,730) 7,060 (189,887)
Total Primary Government Net Expense (13,475,388)$ (9,156,850)$ (9,831,184)$ (9,822,886)$ (9,611,312)$
General Revenues and Other Changes in Net AssetsGovernmental Activities
TaxesProperty taxes 7,579,498$ 7,155,812$ 6,305,971$ 5,955,861$ 5,801,421$
City of Marquette, MichiganChanges in Net AssetsLast Five Fiscal Years
(Continued)191
Fiscal Year
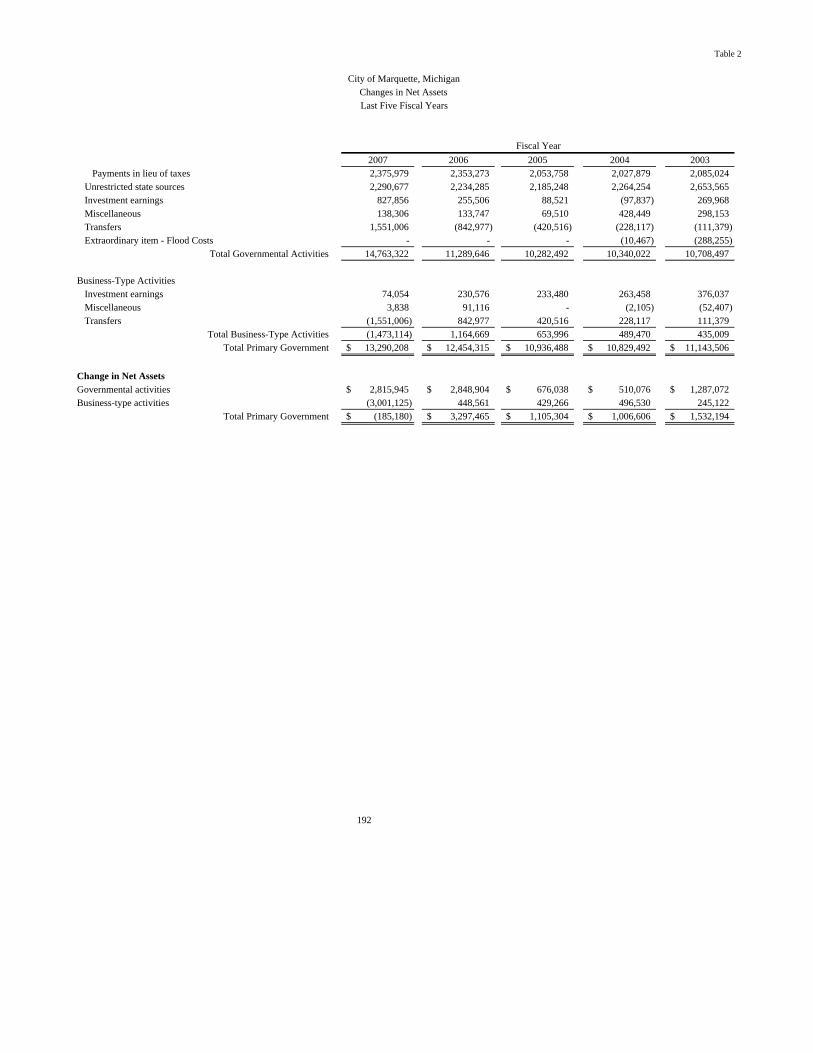
Table 2
2007 2006 2005 2004 2003
City of Marquette, MichiganChanges in Net AssetsLast Five Fiscal Years
Fiscal Year
Payments in lieu of taxes 2,375,979 2,353,273 2,053,758 2,027,879 2,085,024 Unrestricted state sources 2,290,677 2,234,285 2,185,248 2,264,254 2,653,565 Investment earnings 827,856 255,506 88,521 (97,837) 269,968 Miscellaneous 138,306 133,747 69,510 428,449 298,153 Transfers 1,551,006 (842,977) (420,516) (228,117) (111,379) Extraordinary item - Flood Costs - - - (10,467) (288,255)
Total Governmental Activities 14,763,322 11,289,646 10,282,492 10,340,022 10,708,497
Business-Type ActivitiesInvestment earnings 74,054 230,576 233,480 263,458 376,037 Miscellaneous 3,838 91,116 - (2,105) (52,407) Transfers (1,551,006) 842,977 420,516 228,117 111,379
Total Business-Type Activities (1,473,114) 1,164,669 653,996 489,470 435,009 Total Primary Government 13,290,208$ 12,454,315$ 10,936,488$ 10,829,492$ 11,143,506$
Change in Net AssetsGovernmental activities 2,815,945$ 2,848,904$ 676,038$ 510,076$ 1,287,072$ Business-type activities (3,001,125) 448,561 429,266 496,530 245,122
Total Primary Government (185,180)$ 3,297,465$ 1,105,304$ 1,006,606$ 1,532,194$
192

Table 3
2007 2006 2005 2004 2003 2002 2001 2000 1999 1998General Fund
Reserved 362,919$ 507,146$ 639,116$ 1,377,892$ 479,435$ 2,618,243$ 756,323$ 1,041,556$ 916,250$ 872,099$ Unreserved 6,212,319 3,858,518 3,501,239 2,657,563 3,216,679 2,734,442 5,134,198 3,578,665 3,191,853 2,927,772
Total General Fund 6,575,238$ 4,365,664$ 4,140,355$ 4,035,455$ 3,696,114$ 5,352,685$ 5,890,521$ 4,620,221$ 4,108,103$ 3,799,871$
All Other Governmental FundsReserved 738,103$ 1,005,637$ 1,374,127$ 3,576,886$ 528,217$ 1,006,840$ 9,460,616$ 10,107,356$ 8,794,757$ 1,299,767$
Unreserved, reported in:Special revenue funds 2,435,075 2,689,965 42,347 338,184 49,777 37,967 (33,198) (28,565) 117,615 189,649 Capital projects funds 4,472,029 - - - - - - - 355,407 1,098,485 Debt service funds - - - - - - - - - -
Total All Other Governmental Funds 7,645,207$ 3,695,602$ 1,416,474$ 3,915,070$ 577,994$ 1,044,807$ 9,427,418$ 10,078,791$ 9,267,779$ 2,587,901$
Fiscal Year
City of Marquette, MichiganFund Balances, Governmental Funds
Last Ten Fiscal Years
193

Table 4
2007 2006 2005 2004 2003 2002 2001 2000 1999 1998Revenues
Taxes 9,955,477$ 9,509,085$ 8,359,729$ 7,983,740$ 7,886,445$ 7,753,738$ 7,842,491$ 7,772,253$ 7,433,236$ 7,200,466$ Federal and state sources 4,468,979 7,990,533 4,284,731 6,143,936 5,451,549 5,915,467 5,254,885 4,612,827 5,002,412 4,537,938 Fines and penalties 99,652 95,917 137,572 136,538 138,538 139,794 118,463 117,874 113,240 129,537 Charges for services 3,509,327 4,350,929 4,998,815 3,920,203 3,267,018 3,073,992 2,977,625 2,910,359 2,952,656 2,919,028 Special assessments 44,179 89,813 63,506 66,143 104,534 92,978 209,115 22,584 72,095 102,505 Intergovernmental 162,210 143,489 128,399 156,009 134,616 132,768 112,827 80,764 92,247 74,965 Investment earnings 838,865 255,506 88,521 (97,837) 269,968 736,734 775,413 320,230 316,899 392,443 Other revenues 1,417,338 275,689 284,229 726,773 380,277 195,638 (75,848) 2,309,148 2,366,072 1,698,685
Total Revenues 20,496,027 22,710,961 18,345,502 19,035,505 17,632,945 18,041,109 17,214,971 18,146,039 18,348,857 17,055,567
Expenditures
General government 3,148,954 3,032,209 3,143,668 3,633,875 3,336,036 4,573,200 4,462,727 4,532,944 4,055,673 3,398,493 Public health and safety 5,008,943 4,902,040 4,734,456 4,500,789 4,528,147 3,357,199 3,164,445 3,618,956 3,976,852 3,145,362 Public works 3,035,467 2,946,331 7,983,219 2,709,344 3,324,287 4,933,970 2,092,375 1,727,003 1,825,822 1,200,597 Highway and streets 2,265,398 2,247,944 2,520,487 2,330,711 2,336,198 2,282,025 2,658,072 2,109,105 2,419,365 2,149,558 Social services 355,193 511,948 503,334 840,683 371,076 234,628 206,248 216,714 207,519 186,272 Sanitation 1,230,891 1,191,959 1,516,946 1,144,322 1,188,362 942,994 961,665 964,944 760,419 743,064 Recreation and culture 1,325,545 1,302,717 1,316,150 1,159,649 1,353,954 1,368,774 1,151,646 997,649 1,545,653 1,299,097 Capital outlay 3,760,586 1,835,300 2,605,104 3,186,792 1,214,746 536,311 413,537 1,651,886 1,494,160 1,881,683 Other expenditures - - - - - - 377,111 366,080 585,440 259,880 Special Assessments - - - 24,847 48,726 24,920 149,272 240,568 - - Debt Service
Professional and contractual 298,796 - - - - - - - - - Interest 628,993 855,638 499,388 362,232 390,166 398,150 427,128 414,722 524,662 619,480 Principal 952,788 918,575 874,138 627,229 604,042 537,424 810,673 566,280 802,086 583,150
Total Expenditures 22,011,554 19,744,661 25,696,890 20,520,473 18,695,740 19,189,595 16,874,899 17,406,851 18,197,651 15,466,636
Excess of revenues over (under) expenditures (1,515,527) 2,966,300 (7,351,388) (1,484,968) (1,062,795) (1,148,486) 340,072 739,188 151,206 1,588,931
Other Financing Sources (Uses)
Proceeds from borrowing 10,819,061 - 5,000,000 5,178,100 - 367,859 - 200,000 2,480,000 5,945,000 Premium on bond issuance 3,792 Extinguisment of debt (5,082,566) - - - - - - - (2,280,000) (4,790,820) Payments to escrow agent - - - - - - - - (200,000) (154,180) Transfers in 5,082,450 3,324,148 2,228,797 3,059,119 5,244,319 2,152,539 2,213,803 2,928,071 3,172,826 3,185,619 Transfers out (3,148,031) (3,786,011) (2,271,105) (2,907,308) (5,000,766) (1,895,274) (1,956,970) (2,562,309) (2,803,139) (2,780,804) Extraordinary item - Flood Costs - - - (168,526) (796,580) - - - - -
Total Other Financing Sources (Uses) 7,674,706 (461,863) 4,957,692 5,161,385 (553,027) 625,124 256,833 565,762 369,687 1,404,815
Net change in fund balances 6,159,179$ 2,504,437$ (2,393,696)$ 3,676,417$ (1,615,822)$ (523,362)$ 596,905$ 1,304,950$ 520,893$ 2,993,746$
Debt Service as a Percentage of Non-capital Expenditures 8.67% 9.91% 5.95% 5.71% 5.69% 5.02% 7.52% 6.23% 7.94% 8.85%
City of Marquette, MichiganChanges in Fund Balances, Governmental Funds
Last Ten Fiscal Years
Fiscal Year
(modified accrual basis of accounting)
194
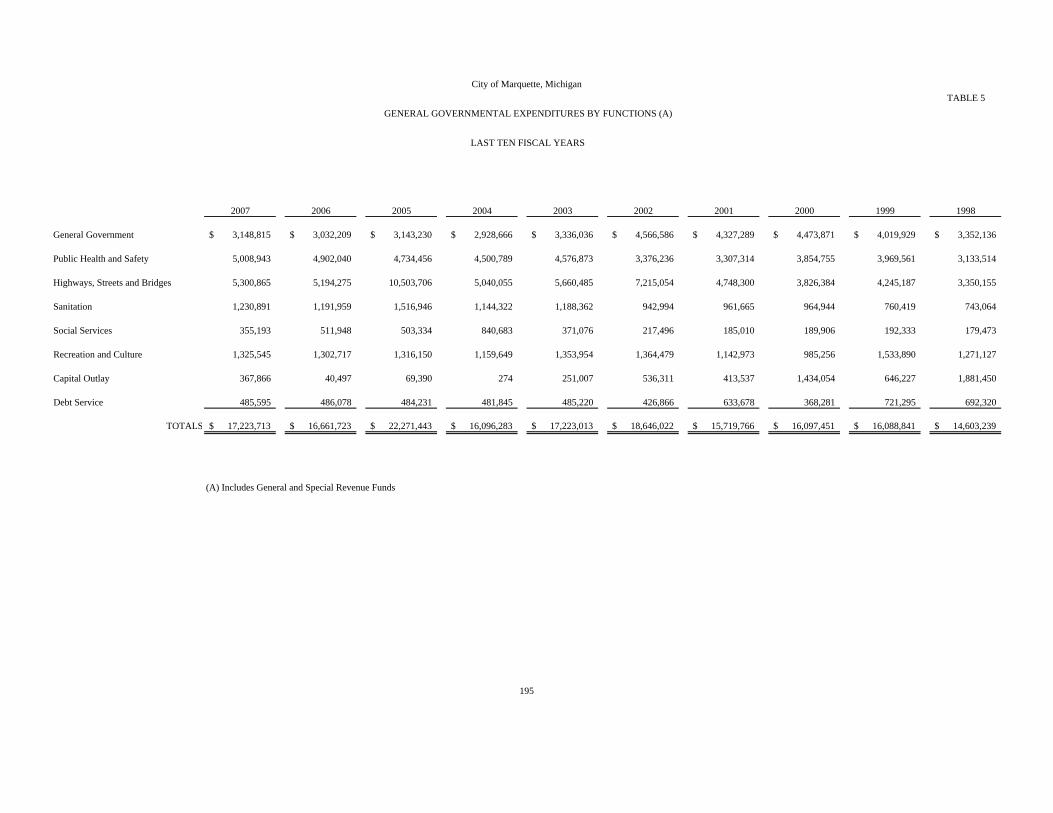
City of Marquette, MichiganTABLE 5
GENERAL GOVERNMENTAL EXPENDITURES BY FUNCTIONS (A)
LAST TEN FISCAL YEARS
2007 2006 2005 2004 2003 2002 2001 2000 1999 1998
General Government 3,148,815$ 3,032,209$ 3,143,230$ 2,928,666$ 3,336,036$ 4,566,586$ 4,327,289$ 4,473,871$ 4,019,929$ 3,352,136$
Public Health and Safety 5,008,943 4,902,040 4,734,456 4,500,789 4,576,873 3,376,236 3,307,314 3,854,755 3,969,561 3,133,514
Highways, Streets and Bridges 5,300,865 5,194,275 10,503,706 5,040,055 5,660,485 7,215,054 4,748,300 3,826,384 4,245,187 3,350,155
Sanitation 1,230,891 1,191,959 1,516,946 1,144,322 1,188,362 942,994 961,665 964,944 760,419 743,064
Social Services 355,193 511,948 503,334 840,683 371,076 217,496 185,010 189,906 192,333 179,473
Recreation and Culture 1,325,545 1,302,717 1,316,150 1,159,649 1,353,954 1,364,479 1,142,973 985,256 1,533,890 1,271,127
Capital Outlay 367,866 40,497 69,390 274 251,007 536,311 413,537 1,434,054 646,227 1,881,450
Debt Service 485,595 486,078 484,231 481,845 485,220 426,866 633,678 368,281 721,295 692,320
TOTALS 17,223,713$ 16,661,723$ 22,271,443$ 16,096,283$ 17,223,013$ 18,646,022$ 15,719,766$ 16,097,451$ 16,088,841$ 14,603,239$
(A) Includes General and Special Revenue Funds
195

City of Marquette, Michigan
TABLE 6GENERAL REVENUES BY SOURCES (A)
LAST TEN FISCAL YEARS
2007 2006 2005 2004 2003 2002 2001 2000 1999 1998
Property Taxes 7,579,498$ 7,155,812$ 6,305,971$ 5,955,861$ 5,801,421$ 5,653,404$ 5,731,848$ 5,637,496$ 5,337,013$ 5,222,963$ Payments in lieu of property taxes 2,375,979 2,353,273 2,053,758 2,027,879 2,085,024 2,100,334 2,110,643 2,134,757 2,096,223 1,977,503 State and Federal sources 4,427,476 7,442,771 4,252,731 5,012,952 5,367,545 5,915,467 5,254,885 4,616,701 5,002,412 4,537,938 Intergovernmental revenue 162,210 143,489 128,399 156,009 134,616 132,768 112,827 79,759 92,247 74,965 Licenses and permits 33,574 28,250 36,243 18,543 17,069 17,779 18,552 17,949 19,042 15,346 Charges for services 3,489,134 3,411,545 4,060,366 3,091,139 2,410,279 2,311,854 2,152,686 2,077,295 2,003,932 2,023,314 Sales 177,963 173,771 166,466 176,336 183,290 172,578 143,853 142,009 178,356 174,368 Use and admission fees 680,392 580,624 592,834 496,419 502,252 446,142 490,420 528,473 534,937 496,914 Fines and forfeits 99,652 95,917 137,572 136,538 138,538 139,794 118,463 117,874 113,240 129,537 Rentals 158,526 135,111 126,317 123,816 120,937 125,639 172,114 142,818 214,773 207,545 Special assessments 44,179 89,813 63,506 66,143 104,534 92,978 209,115 22,584 72,095 86,117 Sale of assets - 908 11,721 3,743 68,464 14,134 3,106 4,409 103,934 101,783 Contribution from private sources 124,718 107,630 21,915 21,500 95,321 94,829 45,500 29,043 65,690 47,959 Reimbursements 49,910 53,771 40,090 20,433 20,580 30,575 27,545 7,838 9,234 13,453 Investment income 614,673 172,377 21,945 (128,122) 255,826 736,734 775,369 309,371 310,245 383,220 Other revenue 192,255 113,380 53,029 117,391 63,912 17,141 30,232 523,321 219,409 14,959
TOTAL 20,210,139$ 22,058,442$ 18,072,863$ 17,296,580$ 17,369,608$ 18,002,150$ 17,397,158$ 16,391,697$ 16,372,782$ 15,507,884$
(A) Includes General and Special Revenue Funds
196

Table 7
City of Marquette, MichiganAssessed Value and Actual Value of Taxable Property
Last Ten Fiscal Years
Total TotalFiscal Year Ended Residential Commercial Industrial Less: Tax Taxable Non-homestead
30-Jun Property Property Property Exempt Property Assessed Value Tax Rate
1998 387,741,800$ 710,834,000$ 189,743,000$ 550,000,000$ 738,318,800$ 52.4645 1999 405,804,000 765,042,200 189,705,000 600,000,000 760,551,200 52.9245 2000 422,472,800 805,199,200 189,647,800 630,000,000 787,319,800 52.3896 2001 445,150,600 816,953,800 189,142,200 640,000,000 811,246,600 52.3904 2002 464,986,000 835,304,526 195,691,400 654,000,000 841,981,926 51.5246 2003 490,583,800 871,054,400 194,428,600 660,000,000 896,066,800 50.2004 2004 518,825,918 919,595,096 200,286,600 670,000,000 968,707,614 51.3095 2005 599,036,634 893,544,328 198,964,000 669,738,800 1,021,806,162 52.2010 2006 677,157,600 942,051,800 201,124,600 671,612,000 1,148,722,000 52.5148 2007 745,172,800 972,932,800 201,442,400 671,485,600 1,248,062,400 51.9322
Source: City of Marquette Assessor's Department.
Note: Property in the City is reassessed each year. Property is assessed at actual value; however, the Stateequailized values (SEV) are equal to 50% of actual value. Tax rates are per $1,000 of taxable value.
197

Table 8
City of Marquette, MichiganDirect and Overlapping Property Tax Rates
Last Ten Fiscal Years
( A ) ( B )City District Rates Overlapping Rates*
Marquette Area Fiscal Year Ended General Library Debt Service Total Public School County of
30-Jun Fund Fund Funds Direct District Marquette Total
1998 13.630$ 1.418$ -$ 15.048$ 8.600$ 9.816$ 33.464$ 1999 13.630 1.418 1.000 16.048 8.600 9.816 34.464 2000 14.130 1.418 0.960 16.508 8.600 9.816 34.924 2001 13.630 1.418 0.950 15.998 8.600 9.792 34.390 2002 13.630 1.418 0.950 15.998 8.600 9.792 34.390 2003 13.630 1.418 0.900 15.948 7.800 9.777 33.525 2004 13.630 1.418 0.850 15.898 6.600 9.703 32.201 2005 13.710 1.418 0.820 15.948 7.600 9.762 33.310 2006 14.710 1.413 0.800 16.923 7.600 9.678 34.201 2007 15.273 1.405 0.780 17.458 7.500 9.622 34.580
Source: City of Marquette Treasurer's Department.
Note: Rates for debt service are set based on each year's requirements.
* Overlapping rates are those of local and county governments that apply to property owners within the City ofMarquette.
(A) - Includes Debt Service(B) - Includes Intermediate School District, Special Education, County Wide Transit, and County Medical Facility.
198

Table 9
City of Marquette, MichiganPrincipal Property Tax Payers
Current Year and Nine Years Ago
2007 1998Percentage Percentage
of Total City of Total CityTaxable Taxable Taxable TaxableAssessed Assessed Assessed Assessed
Taxpayer Value Rank Value Value Rank Value
WE Energies 98,149,600$ 1 15.73% 98,786,000$ 1 26.47%
Marquette Medical Dental Center 10,241,278 2 1.69% 6,919,370 2 1.85%
O'Dovero Properties 4,445,112 3 0.71% 4,047,720 4 1.42%
HJ Larson & Associates, Inc. 3,997,899 4 0.64% 3,200,274 5 1.08%
Tourville Inc. 3,948,800 5 0.63% 5,280,855 3 0.86%
Shopko Stores, Inc. 3,022,700 6 0.48% 2,495,015 7 0.73%
Marquette General Hospital 2,343,493 7 0.38%
Dagnais Real Estate Inc. 2,278,806 8 0.37% 2,738,718 6 0.67%
MFC First National Bank 2,266,258 9 0.36% 2,317,949 8 0.62%
Marquette Golf & Country Club 2,233,296 10 0.36%
Woodview Village - 2,307,530 9 0.62%
SEMCO Energy Gas Co. - 1,982,900 10 0.53%Total 132,927,242$ 21.35% 130,076,331$ 34.85%
Source: City of Marquette Assessor's Department.
199

Table 10
City of Marquette, Michigan
PROPERTY TAX LEVIES AND COLLECTIONS
LAST TEN FISCAL YEARS
Collected within the Fiscal Year of the Levy Total Collections to DateFiscal Year Taxes Levied Collections
Ended for the Percentage in Subsequent PercentageJune 30, Fiscal Year Amount of Levy Years Amount of Levy
1998 5,478,127 5,463,511 99.73% 10,965 5,474,476 99.93%
(A) 1999 5,989,211 5,987,933 99.98% 44,673 6,032,606 100.72%
2000 6,295,517 6,295,517 100.00% 6,590 6,302,107 100.10%
2001 6,299,792 6,299,792 100.00% 9,455 6,309,247 100.15%
2002 6,550,764 6,550,764 100.00% 20,482 6,571,246 100.31%
2003 6,741,644 6,741,644 100.00% 7,616 6,749,260 100.11%
2004 6,903,752 6,903,752 100.00% 15,704 6,919,456 100.23%
2005 7,259,943 7,259,943 100.00% 5,722 7,265,665 100.08%
2006 8,075,509 8,075,509 100.00% 34,008 8,109,517 100.42%
2007 8,812,414 8,812,414 100.00% 4,529 8,816,943 100.05%
(A) Beginning in Fiscal Year 1999 County stopped charging back for unpaid real estate taxes.
Source: Marquette City Treasurer's Department.
200
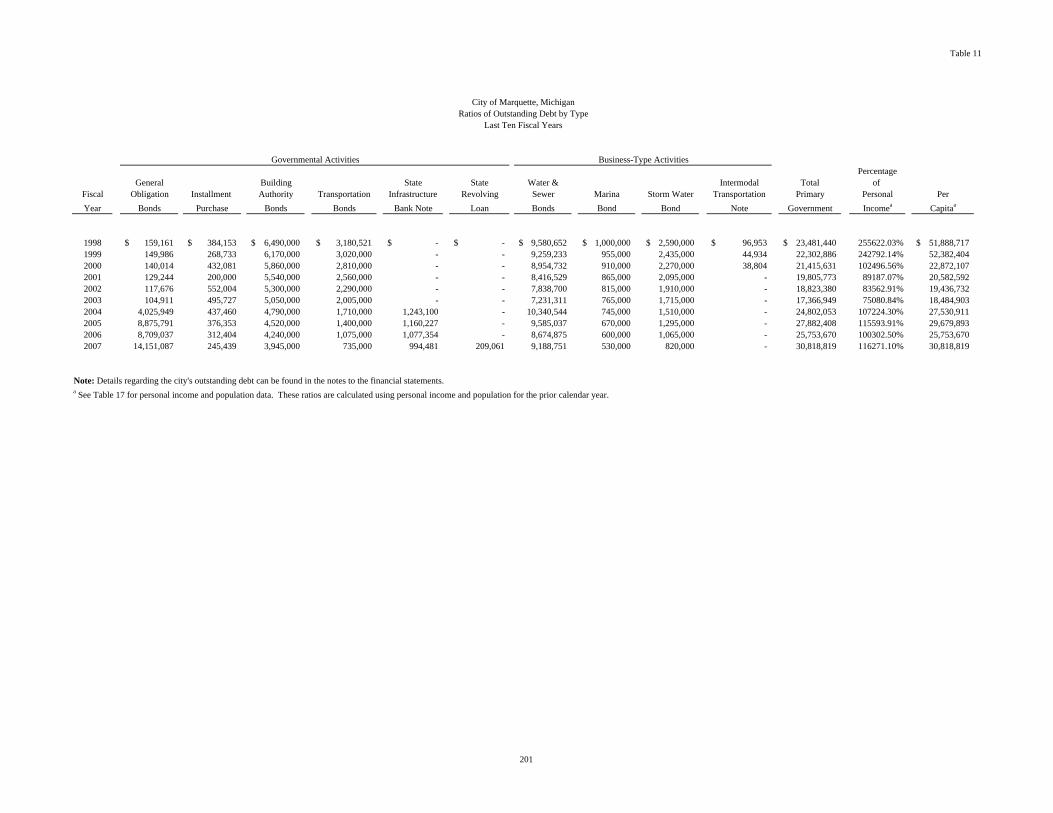
Table 11
City of Marquette, MichiganRatios of Outstanding Debt by Type
Last Ten Fiscal Years
Governmental Activities Business-Type ActivitiesPercentage
General Building State State Water & Intermodal Total of Fiscal Obligation Installment Authority Transportation Infrastructure Revolving Sewer Marina Storm Water Transportation Primary Personal PerYear Bonds Purchase Bonds Bonds Bank Note Loan Bonds Bond Bond Note Government Incomea Capitaa
1998 159,161$ 384,153$ 6,490,000$ 3,180,521$ -$ -$ 9,580,652$ 1,000,000$ 2,590,000$ 96,953$ 23,481,440$ 255622.03% 51,888,717$ 1999 149,986 268,733 6,170,000 3,020,000 - - 9,259,233 955,000 2,435,000 44,934 22,302,886 242792.14% 52,382,404 2000 140,014 432,081 5,860,000 2,810,000 - - 8,954,732 910,000 2,270,000 38,804 21,415,631 102496.56% 22,872,107 2001 129,244 200,000 5,540,000 2,560,000 - - 8,416,529 865,000 2,095,000 - 19,805,773 89187.07% 20,582,592 2002 117,676 552,004 5,300,000 2,290,000 - - 7,838,700 815,000 1,910,000 - 18,823,380 83562.91% 19,436,732 2003 104,911 495,727 5,050,000 2,005,000 - - 7,231,311 765,000 1,715,000 - 17,366,949 75080.84% 18,484,903 2004 4,025,949 437,460 4,790,000 1,710,000 1,243,100 - 10,340,544 745,000 1,510,000 - 24,802,053 107224.30% 27,530,911 2005 8,875,791 376,353 4,520,000 1,400,000 1,160,227 - 9,585,037 670,000 1,295,000 - 27,882,408 115593.91% 29,679,893 2006 8,709,037 312,404 4,240,000 1,075,000 1,077,354 - 8,674,875 600,000 1,065,000 - 25,753,670 100302.50% 25,753,670 2007 14,151,087 245,439 3,945,000 735,000 994,481 209,061 9,188,751 530,000 820,000 - 30,818,819 116271.10% 30,818,819
Note: Details regarding the city's outstanding debt can be found in the notes to the financial statements.a See Table 17 for personal income and population data. These ratios are calculated using personal income and population for the prior calendar year.
201

Table 12
City of Marquette, MichiganRatios of General Bonded Debt Outstanding
Last Ten Fiscal Years
General Bonded Debt OutstandingPercentage of
General Taxable AssessedFiscal Obligation Value a of Per
Year Bonds Property Capita b
1998 10,213,835$ 1.38% 460.17$ 1999 9,608,719$ 1.26% 501.84$ 2000 9,242,095$ 1.17% 470.72$ 2001 8,429,244$ 1.04% 428.73$ 2002 8,259,680$ 0.98% 398.75$ 2003 7,655,638$ 0.85% 372.59$ 2004 12,206,509$ 1.26% 589.57$ 2005 16,332,371$ 1.60% 790.38$ 2006 15,413,795$ 1.34% 748.93$ 2007 20,280,068$ 1.62% 989.85$
Note: Detail regarding the city's outstanding debt can be found in the notes to financial statements.a See Table 7 for property value data.b Population data can be found in Table 16.
202

Table 13
City of Marquette, MichiganDirect and Overlapping Governmental Activities Debt
As of June 30, 2007
EstimatedEstimated Share of
Debt Percentage Overlapping Governmental Unit Outstanding Applicablea Debt
Debt Repaid With Property Taxes
City of Marquette 19,420,068$ 100.00% 19,420,068$ County School District 8,405,000 62.31% 5,237,156 County of Marquette 2,280,000 29.28% 667,584
Other Debt
Transportation Bonds 735,000 100.00% 735,000 Building Authority - Arena 125,000 100.00% 125,000 Library Improvements 3,400,000 100.00% 3,400,000 Tax Increment Bonds - DDA 678,571 100.00% 678,571
Total Direct and Overlapping Debt 30,263,379$
Sources: Assessed value data used to estimate applicable percentages provided by the Marquette County Board of Equalization and Assessment. Debt outstanding data provided by each governmental unit.
Note: Overlapping governments are those that coincide, at least in part, with the geographic boundaries of the city. Thisschedule estimates the portion of the outstanding debt of those overlapping governments that is borne by the residentsand businesses of Marquette. This process recognizes that, when considering the city's ability to issue and repaylong-term debt, the entire debt burden borne by the residents and businesses should be taken into account. However, thisdoes not imply that every taxpayer is a resident, and therefore responsible for repaying the debt, of each overlapping government.
203

Table 14
City of Marquette, MichiganLegal Debt Margin Information
Last Ten Fiscal Years
Fiscal Year2007 2006 2005 2004 2003 2002 2001 2000 1999 1998
Debt Limit 62,403,120$ 50,273,175$ 47,722,369$ 45,523,480$ 43,426,154$ 42,272,394$ 40,471,374$ 39,378,376$ 38,135,925$ 37,320,377$
Total net debt applicable to limit 20,280,068 18,927,940 20,658,944 16,936,500 12,768,085 13,549,680 14,049,244 15,208,717 15,871,128 16,360,912
Legal Debt Margin 42,123,052$ 31,345,235$ 27,063,425$ 28,586,980$ 30,658,069$ 28,722,714$ 26,422,130$ 24,169,659$ 22,264,797$ 20,959,465$
Total net debt applicable to the limit as a percentage of debt limit 32.50% 37.65% 43.29% 37.20% 29.40% 32.05% 34.71% 38.62% 41.62% 43.84%
Legal Debt Margin Calculation for Fiscal Year 2007:
State Equalized Assessed Value (SEV) 624,031,200$
Debt limit (10% of total assessed value) 62,403,120 Debt applicable to limit:
General obligation bonds 20,280,068 Less: Amount set aside for repayment of general obligation debt - Total net debt applicable to limit 20,280,068
Legal debt margin 42,123,052$
Note: Under state finance law, the city's outstanding general obligation debt should not exceed 10 percent of total assessed property value.
204
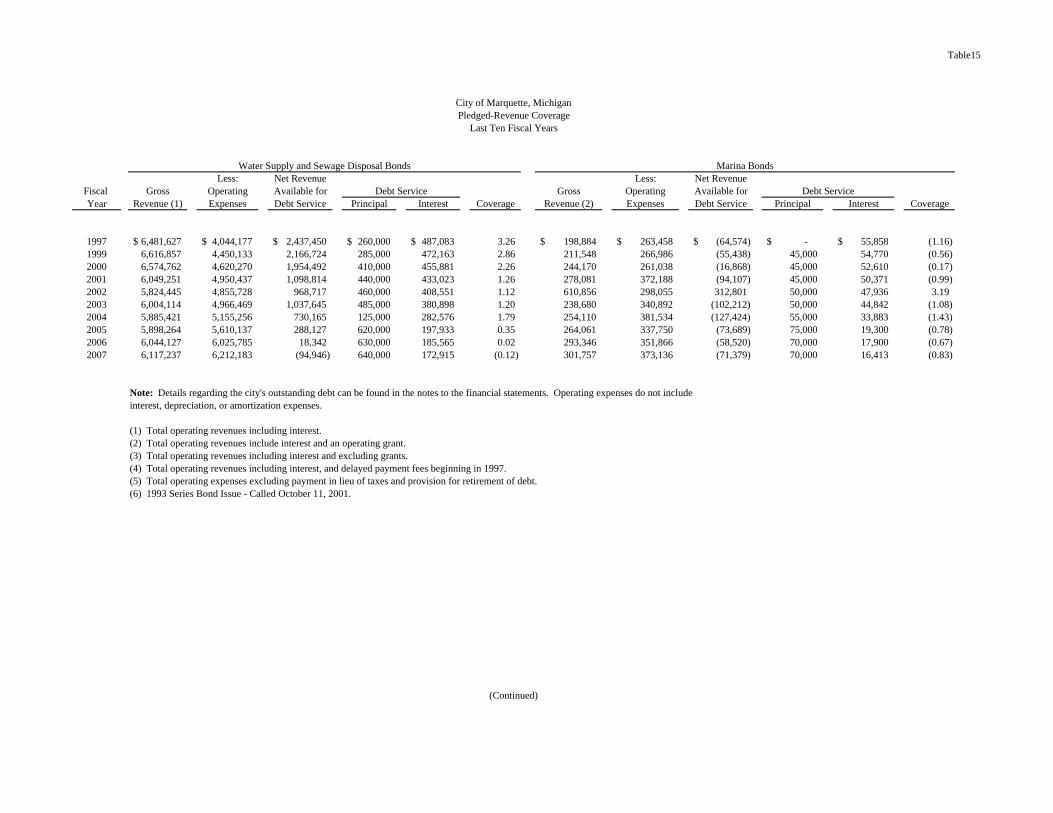
Table15
Less: Net Revenue Less: Net RevenueFiscal Gross Operating Available for Gross Operating Available forYear Revenue (1) Expenses Debt Service Principal Interest Coverage Revenue (2) Expenses Debt Service Principal Interest Coverage
1997 6,481,627$ 4,044,177$ 2,437,450$ 260,000$ 487,083$ 3.26 198,884$ 263,458$ (64,574)$ -$ 55,858$ (1.16) 1999 6,616,857 4,450,133 2,166,724 285,000 472,163 2.86 211,548 266,986 (55,438) 45,000 54,770 (0.56) 2000 6,574,762 4,620,270 1,954,492 410,000 455,881 2.26 244,170 261,038 (16,868) 45,000 52,610 (0.17) 2001 6,049,251 4,950,437 1,098,814 440,000 433,023 1.26 278,081 372,188 (94,107) 45,000 50,371 (0.99) 2002 5,824,445 4,855,728 968,717 460,000 408,551 1.12 610,856 298,055 312,801 50,000 47,936 3.19 2003 6,004,114 4,966,469 1,037,645 485,000 380,898 1.20 238,680 340,892 (102,212) 50,000 44,842 (1.08) 2004 5,885,421 5,155,256 730,165 125,000 282,576 1.79 254,110 381,534 (127,424) 55,000 33,883 (1.43) 2005 5,898,264 5,610,137 288,127 620,000 197,933 0.35 264,061 337,750 (73,689) 75,000 19,300 (0.78) 2006 6,044,127 6,025,785 18,342 630,000 185,565 0.02 293,346 351,866 (58,520) 70,000 17,900 (0.67) 2007 6,117,237 6,212,183 (94,946) 640,000 172,915 (0.12) 301,757 373,136 (71,379) 70,000 16,413 (0.83)
Note: Details regarding the city's outstanding debt can be found in the notes to the financial statements. Operating expenses do not includeinterest, depreciation, or amortization expenses.
(1) Total operating revenues including interest.(2) Total operating revenues include interest and an operating grant.(3) Total operating revenues including interest and excluding grants.(4) Total operating revenues including interest, and delayed payment fees beginning in 1997.(5) Total operating expenses excluding payment in lieu of taxes and provision for retirement of debt.(6) 1993 Series Bond Issue - Called October 11, 2001.
Water Supply and Sewage Disposal Bonds
City of Marquette, Michigan
Last Ten Fiscal YearsPledged-Revenue Coverage
(Continued)
Marina Bonds
Debt ServiceDebt Service

Table15
City of Marquette, Michigan
Last Ten Fiscal YearsPledged-Revenue Coverage
Less: Net Revenue Less: Net RevenueFiscal Gross Operating Available for Gross Operating Available forYear Revenue (3) Expenses Debt Service Principal Interest Coverage Revenue (4) Expenses (5) Debt Service Principal Interest Coverage
1998 1,070,182$ 269,298$ 800,884$ 150,000$ 129,340$ 2.87 18,693,923$ 11,907,312$ 6,786,611$ 1,825,000$ 1,711,590$ 1.92 1999 873,227 300,301 572,926 155,000 123,190 2.06 20,594,729 12,005,104 8,589,625 2,530,000 1,623,990 2.07 2000 1,021,413 318,016 703,397 165,000 116,680 2.50 20,684,893 13,619,680 7,065,213 2,725,000 1,502,550 1.67 2001 875,726 350,192 525,534 175,000 109,585 1.85 21,959,339 14,269,046 7,690,293 2,850,000 1,371,750 1.82 2002 751,114 435,175 315,939 185,000 101,885 1.10 21,790,621 13,777,615 8,013,006 2,850,000 1,104,864 2.03
24,320,000 (6)2003 744,630 833,054 (88,424) 195,000 93,560 (0.31) 25,474,342 17,496,805 7,977,537 2,675,000 604,628 2.43 2004 716,049 608,570 107,479 205,000 83,843 0.37 24,235,182 16,765,002 7,470,180 3,610,000 509,865 1.81 2005 697,959 607,499 90,460 230,000 64,635 0.31 25,251,067 19,958,521 5,292,546 3,705,000 349,050 1.31 2006 714,865 801,622 (86,757) 230,000 53,250 (0.31) 24,345,158 18,720,262 5,624,896 3,805,000 406,125 1.34 2007 844,869 838,382 6,487 245,000 53,250 0.02 24,791,443 20,413,191 4,378,252 2,695,000 291,975 1.47
Note: Details regarding the city's outstanding debt can be found in the notes to the financial statements. Operating expenses do not includeinterest, depreciation, or amortization expenses.
(1) Total operating revenues including interest.(2) Total operating revenues include interest and an operating grant.(3) Total operating revenues including interest and excluding grants.(4) Total operating revenues including interest, and delayed payment fees beginning in 1997.(5) Total operating expenses excluding payment in lieu of taxes and provision for retirement of debt.(6) 1993 Series Bond Issue - Called October 11, 2001.
Electric Utility Bonds
Debt Service
205
Storm water Utility Bonds
Debt Service
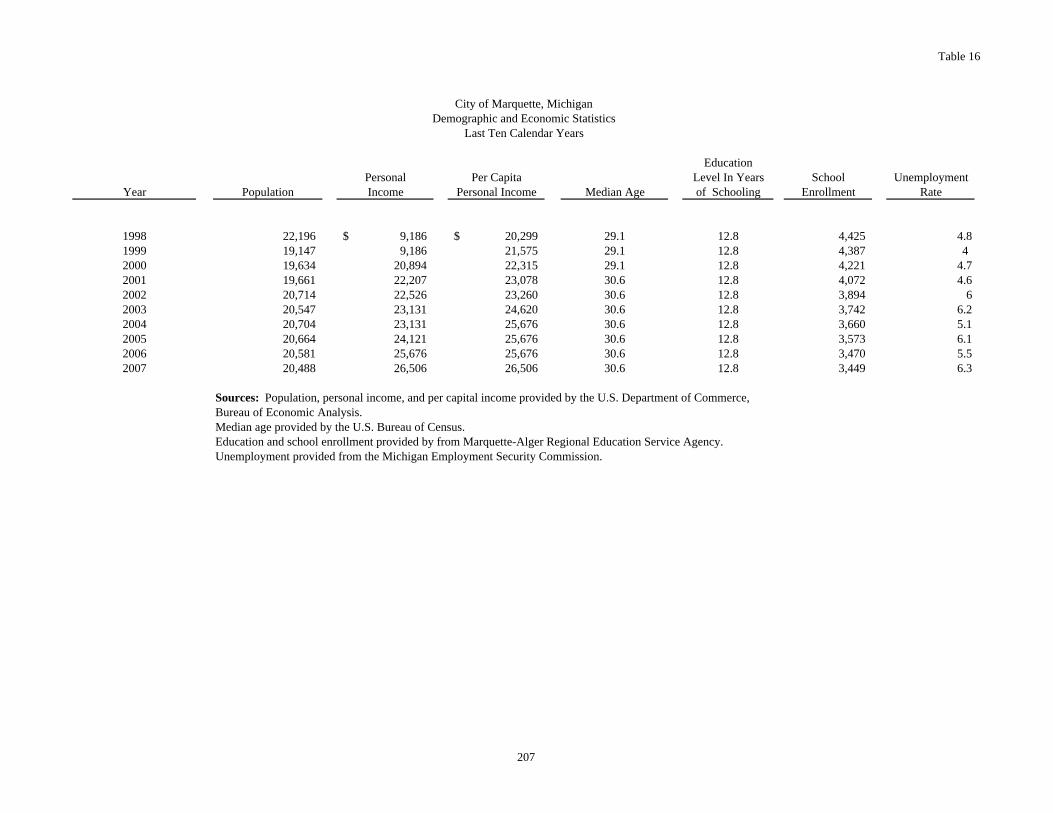
Table 16
City of Marquette, MichiganDemographic and Economic Statistics
Last Ten Calendar Years
EducationPersonal Per Capita Level In Years School Unemployment
Year Population Income Personal Income Median Age of Schooling Enrollment Rate
1998 22,196 9,186$ 20,299$ 29.1 12.8 4,425 4.81999 19,147 9,186 21,575 29.1 12.8 4,387 4 2000 19,634 20,894 22,315 29.1 12.8 4,221 4.72001 19,661 22,207 23,078 30.6 12.8 4,072 4.62002 20,714 22,526 23,260 30.6 12.8 3,894 62003 20,547 23,131 24,620 30.6 12.8 3,742 6.22004 20,704 23,131 25,676 30.6 12.8 3,660 5.12005 20,664 24,121 25,676 30.6 12.8 3,573 6.12006 20,581 25,676 25,676 30.6 12.8 3,470 5.52007 20,488 26,506 26,506 30.6 12.8 3,449 6.3
Sources: Population, personal income, and per capital income provided by the U.S. Department of Commerce,Bureau of Economic Analysis. Median age provided by the U.S. Bureau of Census.Education and school enrollment provided by from Marquette-Alger Regional Education Service Agency.Unemployment provided from the Michigan Employment Security Commission.
207

Table 17
Percentage Percentageof Total City of Total City
Taxpayer Employees Rank Employment Employees Rank Employment
Marquette General Health Systems 2,398 1 6.68% 1,857 1 5.82%
Cleveland Cliffs 1,300 2 3.62%
Northern Michigan University 1,155 3 3.22% 1,180 2 3.70%
Peninsula Medical Center 630 4 1.76%
Westwood Mall Merchants 500 5 1.39%
Marquette Area Public School District 425 6 1.18% 455 5 1.43%
Michigan Department of Corrections 425 7 1.18%
Bell Memorial Heath System 335 8 0.93% 300 7 0.94%
County of Marquette 283 9 0.79%
AMR Regional Aircraft Maintenance Facility 225 10 0.63%
Empire Iron Mining Partnership 1,000 3 3%
Tilden Mining Co. 900 4 2.82%
Wal-Mart Stores, Inc. 400 6 1.25%
American Eagle Airlines, Inc. 250 8 0.78%
Gwinn Area Community Schools 245 9 0.77%
Ojibwa Casino II 235 10 0.74%Total 7,676 21.38% 6,822 21.38%
Source: U.S. Census, Michigan Economic Development Corporation, and Michigan Department of Labor and Economic Growth provided on a county wide basis.
a Information dating back to 1998 was not available, therefore the oldest information available from the above sources was used, which dates back to 2004.
2007 1998a
City of Marquette, MichiganPrincipal Employers
Current Year and Nine Years Ago
208

Table 18
City of Marquette, MichiganFull-Time Equivalent City Government Employees by Function/Program
Last Ten Fiscal Years
Full-Time Equivalent Employees as of June 302007 2006 2005 2004 2003 2002 2001 2000 1999 1998
Function/ProgramGeneral Government
Administration Services 26 21 23 23 26 23 22 20 22 20 Public Health and Safety
Police Officers 39 39 41 41 41 42 42 42 40 41 Firefighters and Officers 25 25 26 26 25 25 27 26 26 24
Public Works 33 35 37 39 40 38 36 36 37 37 Highway and Streets 11 6 8 9 9 8 7 7 8 8 Social Services 4 4 5 4 5 5 5 5 5 5 Recreation and Culture 6 6 7 7 8 7 7 8 8 7 Storm Water 1 1 1 1 1 1 1 - - - Motor Pool 7 9 10 10 10 10 10 10 10 10 Water 15 15 17 16 16 17 17 17 17 17 Wastewater 9 8 9 10 10 10 10 10 10 10 Library 14 14 14 14 15 14 15 14 15 11
Total 190 183 198 200 206 200 199 195 198 190
Source: City Budget Office
209

Table 19
City of Marquette, MichiganOperating Indicators by Function/Program
Last Ten Fiscal Years
Fiscal Year2007 2006 2005 2004 2003 2002 2001 2000 1999 1998
Function/ProgramPolice
Physical arrests 1,424 1,401 909 1,424 1,549 1,843 1,738 848 1,543 1,568 Parking violations 8,888 10,039 9,699 7,374 4,696 4,463 10,517 9,711 12,338 13,980 Traffic violations 2,910 2,484 2,607 3,182 3,048 3,438 3,394 1,731 438 4,186
FireEmergency responses 638 540 535 603 450 503 474 Fires extinguished 29 29 32 34 32 39 24 Inspections 3,129 841 127 167 213 203 154
Refuse collectionRefuse collected (tons per week) 57.4 31.8 53.2 86.9 37.8 19.7 35.0 Recycling (tons per week) 17.2
Other public worksStreet resurfacing (miles) 2.3 1.0 1.0 1.0 1.0 1.0 1.0 1.0 1.0 1.0 Potholes repaired 108 1 1 1 1 1 1 1 1 1
Parks and recreationTotal Campers 9,308 10,202 9,243 8,196 8,119 9,769 10,677 7,932 Beach Attendance 29,557 34,381 41,498 22,133 37,679 28,629 30,697
LibraryVolumes in collection 214,802 200,000 195,406 191,711 183,314 174,916 161,356 160,617 152,703 142,000 Total volumes borrowed 335,991 335,008 300,443 328,216 328,360 322,194
WaterConsumers 5,739 5,697 5,683 5,589 5,575 5,684 5,756 5,744 5,771 5,779 Water mains breaksAverage daily consumption (millions of gallons) 2.77 2.93 3.41 2.92 3.06 2.92 2.94 3.08 3.15 3.90
WastewaterAverage daily sewage treatment (millions of gallons) 3.04 3.30 3.29 3.39 3.53 3.35 3.38 3.54 3.65 3.55
Source: Various City Departments
210

Table 20
City of Marquette, MichiganCapital Asset Statistics by Function/Program
Last Ten Fiscal Years
Fiscal Year2007 2006 2005 2004 2003 2002 2001 2000 1999 1998
Function/ProgramPolice
Stations 1 1 1 1 1 1 1 1 1 1 Fire Stations 2 2 2 2 2 2 2 2 2 2 Other Public works
Streets (miles) 99.0 99.0 98.0 98.0 97.0 85.4 85.4 85.4 85.4 84.6 Streetlights 2,317 2,358 2,358 2,349 2,354 2,387 2,386 2,402 2,372 2,384
Parks and recreationParks 19 19 19 18 18 18 18 18 18 17 Playfields 13 13 13 13 13 13 11 11 11 7 Marina 2 2 2 2 2 2 2 2 2 2 Camping Spaces 110 110 110 110 110 110 110 110 110 110 Community centers 1 1 1 1 1 1 1 1 1 1
WaterWater mains (miles) 96.5 96.5 96.5 93.5 91.0 90.0 89.8 89.7 89.3 89.0
WastewaterSanitary sewers (miles) 93.0 93.0 93.0 89.5 88.7 88.7 88.5 88.5 88.4 81.4 Storm sewers (miles) 59.0 59.0 59.0 56.0 50.0 47.5 47.4 47.3 47.3 34.4
Source: Various City Departments
211