auditing, reporting bias and market valuation reports, ... auditing, reporting bias and market...
TRANSCRIPT

Auditing, Reporting Bias and Market Valuation
D. Paul Newman McCombs School of Business
University of Texas [email protected]
Evelyn R. Patterson Kelley School of Business
Indiana University [email protected]
J. Reed Smith Kelley School of Business
Indiana University [email protected]
April 2015
Preliminary: Please do not quote.

2
Auditing, Reporting Bias and Market Valuation
Abstract
The fundamental qualitative aspects of useful financial information are relevance
and faithful representation. Because management oversees many aspects of financial
reporting such as revenue recognition and estimation, they have the ability to bias
financial reports, which can reduce the usefulness of those reports. We consider a game
that includes the market, a manager, and an auditor where the manager can engage in
costly misreporting in order to increase the market value of the firm. However, the
auditor has the ability to detect and deter such behavior, which also affects market
valuation. As part of our analysis, we provide empirical implications related to the
market’s weighting on reported earnings, the auditor’s report-contingent audit strategy,
expected bias and the auditor’s expected probability of detecting bias.

1
Auditing, Reporting Bias and Market Valuation 1. Introduction
According to the Statement of Financial Accounting Concepts No. 8 (2010)
(SFAC8), the fundamental qualitative aspects of useful financial information are
relevance and faithful representation. SFAC8 supersedes previous concept statements
and is intended to provide a better framework for addressing the usefulness of accounting
information. Because management oversees many aspects of financial reporting such as
revenue recognition and estimation, they have the ability to bias financial reports. 1
Reporting bias can affect the faithful representation aspect of financial reports and in turn,
their usefulness. Auditors, in determining which audit procedures to apply, are
particularly sensitive to these characteristics of financial reporting and to the manager’s
incentives for biasing the report.2 The usefulness of financial reporting information not
only depends on the inherent characteristics of the financial reporting framework but also
on reporting bias and how the auditor might detect or deter such behavior. The purpose
of this paper is to examine the linkage among auditing, reporting bias and the usefulness
of financial reports as reflected by the market valuation of reported earnings.
Fischer and Verrecchia (FV) (2000), provide insight into the usefulness of the
earnings report where a manager has the incentive to bias the report. They model the
1 Dechow, Ge and Shrand (2010) (DGS) note that “The second noteworthy feature of our definition of reported earnings is that reported earnings does not equal X (actual earnings) because … an accounting system that measures an unobservable construct (X) inherently involves estimations and judgment, and thus has the potential for … intentional bias.” 2 AU-C 200 Overall Objectives of the Independent Auditor and the Conduct of an Audit in Accordance With Generally Accepted Auditing Standards specifically notes that auditors should consider the effect of estimates, the business environment, complex transactions and management override in assessing the risk of material misstatement and the extent of audit procedures. Moreover, AU-C 240 Consideration of Fraud in a Financial Statement Audit states that the auditor should consider the manager’s incentives in assessing the risk of intentional misstatement.
2
impact of financial reporting on market valuation where a manager has private
information about his incentives to bias the earnings report as well as private information
about earnings. FV illustrate how information about underlying earnings characteristics,
coupled with the costs and benefits to the manager of biasing the earnings report, affects
market valuation. Included in these incentives are costs associated with the discovery of
management bias. However, in FV, the detection of bias is assumed to be exogenous. In
this environment, the inclusion of a strategic auditor potentially plays a crucial role in
determining the detection probability of bias and in the market valuation of the firm.
As in FV, we examine a model in which the firm’s market price is a linear
function of reported earnings and where uncertainty exists about both earnings and the
manager’s incentives to misreport. The market’s weighting of reported earnings
measures the degree of association between the earnings report and the market value of
the firm. An increase in the weighting indicates a stronger association and an increase in
the usefulness of reported earnings. We examine the effects of adding a self-interested
auditor to this setting. In our model, the auditor determines the extent of costly audit
testing to perform after observing the manager’s report. If the auditor detects reporting
bias, the manager must restate the earnings report to its correct value.
Overall, report-contingent auditing reduces the variability in the manager’s report
and increases the market’s weighting on reported earnings. More specifically, we find
that the market’s weighting on reported earnings increases as the auditor’s expected
liability for a failed audit increases, strengthening the association between the market
value of the firm and the earnings report. On the other hand, the market’s weighting on
reported earnings decreases as the cost of audit testing increases. Further, the market’s
3
weighting on reported earnings increases as more becomes known about the manager’s
incentive to misreport because the market is better able to back out reporting bias. These
results seem reasonably intuitive. By contrast, we also find that the market’s weighting
on reported earnings increases as the manager’s benefit from bias increases and decreases
as the manager’s cost of biasing increases. Further, in some cases, expected bias may
decrease while the weight on the earnings report also decreases. These less intuitive
effects are due to a corresponding change in reporting variability and emphasize that the
usefulness of reported earnings is not simply a function of a single reported number but
also depends on other related information.3
Moreover, our analysis examines the auditor’s response to the manager’s report.
We find that as the auditor’s expected liability for undetected bias increases, the auditor
relies more on the earnings report in determining the amount of audit testing, while the
opposite is true for an increase in the cost of auditing. Both the expected liability for
undetected bias and the cost of auditing directly affect the extent of auditing, which in
turn influences the manager’s choice of reporting bias and the market’s reaction to the
earnings report. Thus, the auditor‘s reliance on the earnings report as well as the
market’s response to the earnings report increase in the auditor’s expected liability and
decrease in the cost of auditing. On the other hand, other changes in information related
to the choices of reporting bias and market valuation have indirect effects on the auditor’s
choice of report-contingent auditing. For example, the auditor relies less on the earnings
report as more becomes known about the manager’s incentive to misreport. In this case,
3 See DGS for a discussion about how various aspects of the accounting system affect the usefulness of financial reporting.

4
the earnings report is not as informative about bias because just as the market is better
able to back out bias, so is the auditor.
Caskey, Nagar, and Petacchi (2010) (CNP) also extend the FV model with an
auditing component that is defined as the firm’s audit committee. CNP assume a
sequential process that produces the firm’s report. First, the firm manager (as in FV)
observes a noisy but unbiased signal of firm value. The manager produces a report that is
an assertion of that value. Then, the audit committee combines the manager’s report with
an independent signal of firm value to produce a firm report. Both the manager and the
audit committee benefit from a higher price for the firm and both incur costs of
misstating their reports relative to the true, but unknown, firm value. Hence CNP assume
that both the manager and the audit committee have incentives for bias and that the
overall bias in the report results from the difference between the audit committee’s report
and the true firm value.
However, the extent of auditing in CNP is independent of the manager’s report.
The audit function in the CNP model does not include an external auditor that can
strategically detect and correct bias as we do. As a result, CNP is necessarily silent
regarding the equilibrium effect of the manager’s report on the extent of auditing. Our
model focuses on the linkages among reporting, bias, and how much investigative work
the auditor performs. Unlike previous studies, this focus allows us to suggest predictions
about audit effort and audit costs in different reporting environments.
In another related study, Dye and Sridhar (2004) (DS) derive a linear pricing
equilibrium, but in a setting where the owner in the first period sells the firm to an
investor in the second period. In their model, DS consider two sources of information

5
that an accountant can aggregate to produce a financial statement report. One source is
management’s possibly biased assertion about the expected discounted cash flows of the
firm. The other source is a noisy, but unbiased, representation of the discounted cash
flows. The DS model retains many of the fundamental model features that are in FV. As
with FV, the model in DS is characterized by a linear, rational expectations pricing
function. In addition, both papers assume costly bias in the manager’s payoff, though the
form of this cost differs in the two papers. In FV, the effect of market price on the
manager’s payoff is private information but the manager incurs a known cost for bias in
the report. On the other hand, in DS, the manager’s misreporting cost is uncertain, but
his benefit from overstatement is common knowledge. We adopt the DS assumptions
regarding the manager’s benefit from overstatement and misreporting cost.
Our model also incorporates several important features found in the strategic
auditing literature. Similar to Newman, Rhoades, and Smith (1996), Newman, Patterson,
and Smith (2001), and Patterson and Noel (2003), the auditor in our model conditions his
audit strategy on the manager’s report, and the manager, in turn, chooses his report with
this fact in mind.4
Several additional papers, including Chan and Pae (1998), Newman, Patterson,
and Smith (2005), and Beyer and Sridhar (2006), study the impact of the audit on the
market valuation of the client firm. But because they do not consider an earnings report
by management, they provide no basis for evaluating the importance of the earnings
report in market valuation. We combine both of these features in our model to determine
how auditing impacts both the manager’s incentives to misreport and the market reaction 4 Other models, such as Newman and Noel (1989), Shibano (1990), Newman, Park, and Smith (1998), Hillegeist (1999), and Laux and Newman (2010) either avoid the reporting issue altogether or assume a binary report.

6
to the manager’s report. Hence, we can provide predictions about how the report impacts
auditing and how auditing affects the market pricing of the firm.
Empirical accounting research has examined many aspects of auditing and
financial reporting quality where one quality measure used in these studies is the impact
that the earnings report has on market valuation (see for example, Teoh and Wong 1993
and Liu and Thomas 2000). They presume that as earnings quality increases the
market’s weighting on reported earnings increases. In addition, studies about audit
quality assert that audit quality and the market’s weighting on reported earnings are
positively correlated. However, these studies provide no explanation about how and why
these measures are related. Defond and Zhang (DZ) (2014) suggest that financial
reporting quality and audit quality are inextricably entwined and state that
…research would benefit from more conceptual guidance in disentangling the complex relation between audit quality and financial reporting quality.
In this paper, we attempt to provide conceptual guidance about the drivers of the market’s
weighting of reported earnings in valuing the firm, which in turn is often used as an
indicator of financial and audit quality in empirical studies.
The remainder of this paper is organized as follows. In section 2, we describe the
model. We derive our equilibrium results in section 3, provide a comparative analysis in
section 4, and discuss the empirical implications of our analysis in section 5. Finally, in
section 5, we provide concluding remarks.
2. Model
We begin by assuming that the firm realizes earnings π that are normally
distributed with mean µπ and variance σπ2 . Subsequent to privately observing π,
management issues an earning report r . We follow FV by conjecturing that the market

7
price of equity P is a linear function of management’s reported earnings r and then
showing that the linear conjecture is satisfied in equilibrium. The market values the firm
at the expected value of earnings π given r or
P r( ) = E π | r( ) = β r +α (1)
where β measures the degree of association between market price and the earnings report.
In the presence of an audit, we assume that if the auditor detects bias in the report,
the report is restated to the correct earnings π and the market prices the firm at π .5 If the
auditor does not detect bias, then the bias is included in the final report and the market
prices the firm according to (1).
Next we describe the payoffs and strategies of the manager and auditor. The
manager obtains a benefit proportionate to the market price of equity τP where the
scaling parameter τ is common knowledge. τ depends on the manager’s equity
holdings in the firm or compensation arrangements such as stock options, stock
appreciation rights, restricted stock and stock award plans. Because the market price is
E π | r( ) if no bias is detected and π if bias is detected, the manager’s total expected
benefit from reported earnings is τ 1−δ( )E π | r( ) +δπ( ) where δ is the auditor’s
probability of detecting bias.
The manager also incurs a reporting cost of q2r −π − ε( )2 where ε represents the
manager’s “type,” is privately known to the manager, and is distributed normally with
5 We assume that if the audit detects bias, earnings are restated and this restatement is publicly observable.

8
mean µε and variance σε2 .6 The manager’s type ε serves to influence bias r −π( ) by
mitigating the cost of bias for higher values of ε .7 The parameter q measures the costs
associated with overriding internal control, legal penalties and loss of reputation while ε
represents the unknown sensitivity to those costs.
The manager observes true earnings π , his private information ε and then issues
a report r . As a result, the manager’s expected payoff is8
M = τ 1−δ( )E π | r( ) +δπ( )− q2 r −π − ε( )2 . (2)
We conjecture that the manager’s reporting strategy is linear in true earnings π
and his type ε .
r = bmπ + cmε + am (3)
We assume that the auditor earns a fixed, pre-determined fee. Hence, we are
concerned only with the auditor’s expected costs. The auditor observes the report r and
chooses the probability of detecting bias δ . We focus on overstatements so that the
auditor ‘s expected penalty is L r − E π | r( )( ) whenever bias goes undetected where the
legal liability parameter L reflects the auditor’s litigation or regulatory environment. In
addition, the auditor incurs a cost of k2δ 2 for choosing detection probability δ where the
6 There are many ways that the manager’s private information and reporting cost might be modeled. FV model the manager’s private information as the multiplier on market price, but assume that the cost of bias is known. In the model with auditing, no linear pricing equilibrium exists with the FV structure. Our model of misreporting cost is consistent with DS, who also model the manager’s cost of biasing the report as uncertain. 7 We assume, for simplicity, that µε > 0 , which implies that the manager is more inclined to overstate. 8 We model the manager’s expected payoff without the manager’s cost of reporting bias being dependent on auditor detection. This allows us to consider only linear equilibria, but does not eliminate the strategic tension between the auditor and the manager. 1− δ( )E π | r( ) + δπ provides the strategic tension in our model, which is consistent with previous strategic audit studies such as Hillegeist (1999) and Newman, Rhoades and Smith (1996).

9
cost parameter k represents the costliness of the audit environment. For example, a larger
k could be due to a more complex client firm environment, a smaller audit firm, or less
familiarity with the client’s industry. As a result, the auditor’s total expected costs are
A = 1−δ( )L r − E π | r( )( ) + k2δ2 (4)
where the auditor chooses δ to minimize these expected costs. We also conjecture that
the auditor chooses a linear strategy in the report or
δ r( ) = bAr + aA . (5)
The equilibrium is therefore defined by the vector α ,β,am ,bm ,cm ,aA ,bA( ) such
that: the market condition (1) is satisfied as an equality, the manager’s choices of
am ,bm ,cm( ) in (3) maximize his payoff in (2) with respect to r and the auditor’s choices
of aA ,bA( ) in (5) minimize his costs in (4) with respect to δ . Because the manager
chooses his report prior to the auditor’s detection strategy and because the market price is
determined after the audit, backward induction conditions must be satisfied, as well.
3. Equilibrium Analysis
Because the reporting, audit and pricing decisions are sequential, we first solve
for market price because that is the final choice of the game. This is followed by the
auditor’s choice of detection probability and then the manager’s reporting decision.
In the event that the auditor detects and eliminates bias, the market knows that the
restated report r = π is correct and values the stock accordingly. In the event that the
auditor has not detected bias, the market adjusts for the expected bias in determining the
market price. Of course, even though some bias remains in the report, auditing acts as a

10
deterrent. The market price, in this case, is the expected value of earnings given the
report.
P r( ) = E π | r( ) = E π( ) + Cov π , r( )Var r( ) r − E r( )( ) (6)
This expression represents the Bayesian updated expectation of earnings given the
manager’s report. Using conditions (3) and (6), we obtain the following expression for
the market price as a function of the manager’s choice parameters.
P r( ) = bmσπ2
bm2σπ
2 + cm2σε
2 r + µπ −bmσπ
2
bm2σπ
2 + cm2σε
2 bmµπ + cmµε + am( )⎛⎝⎜
⎞⎠⎟
(7)
Expression (7) can be rewritten in the form required by equation (1), P r( ) = β r +α
where
β = bmσπ2
bm2σπ
2 + cm2σε
2 , (8)
α = µπ −bmσπ
2
bm2σπ
2 + cm2σε
2 bmµπ + cmµε + am( )⎛⎝⎜
⎞⎠⎟
(9)
and the values of bm , cm and am are determined in equilibrium.
Given the manager’s choices of bm , cm and am , the auditor chooses δ to
minimize the cost in expression (4). The auditor’s first order condition for δ is equal to
−L r − E π | r( )( ) + kδ = 0, (10)
which implies that
δ = Lkr − E π | r( )( ) . (11)
Recall that E π | r( ) = P r( ) = β r +α , where β and α are given by (8) and (9)
respectively. As a result, (11) can be expressed as

11
δ r( ) = bAr + aA (12)
where
bA =Lk1− bmσπ
2
bm2σπ
2 + cm2σε
2
⎛⎝⎜
⎞⎠⎟
and (13)
aA =Lk
−µπ +bmσπ
2
bm2σπ
2 + cm2σε
2 bmµπ + cmµε + am( )⎛⎝⎜
⎞⎠⎟
. (14)
Finally we derive the manager’s choices of bm , cm and am . The manager’s payoff
in (2) is maximized by his choice of r given the equilibrium reactions of the auditor and
the market. The manager’s first order condition for r is equal to
−r q + 2bAβτ( ) + q + bAτ( )π + qε + 1− aA( )β − bAα( )τ = 0 . (15)
From (15),
r =q + bAτ( )π + qε + 1− aA( )β − bAα( )τ
q + 2bAβτ( ) (16)
Rewriting expression (16) we have
r = bmπ + cmε + am (17)
where
bm = q + bAτq + 2bAβτ
, (18)
cm = qq + 2bAβτ
and (19)
am =1− aA( )β − bAα( )τq + 2bAβτ
(20)

12
Combining (1), (8), (9), (12), (13), (14), (17), (18), (19) and (20), we obtain the
equilibrium described in Proposition 1. For simplicity, we substitute γ = σπ2
σπ2 +σε
2 where
γ measures the relative uncertainty of earnings π to the manager’s private information
ε .9
Proposition 1: The equilibrium strategies for the manager, the auditor and the
market are as follows;
Manager: r = bmπ + cmε + am
Auditor: δ r( ) = bAr + aA
Market: P r( ) = β r +α if no detection occurs and π if detection occurs.
where bm =
q + bAτq + 2bAβτ
, cm = q
q + 2bAβτ,
am =
aA 1− 2β( ) + β( )τq + 2bAβτ
,
bA =Lk1−
qγ q + bAτ( )q2 − bA
2γτ 2⎛⎝⎜
⎞⎠⎟
, aA =Lk
− 1− β( )µπ + βk qµε + βτ( )kq + Lβτ
⎛⎝⎜
⎞⎠⎟
,
β =qγ q + bAτ( )q2 − bA
2γτ 2 and α = 1− β( )µπ − β
k qµε + βτ( )kq + Lβτ
.
(All proofs are in the appendix)
Note that if bA is unique, then β is unique and each strategy is also uniquely defined.
Corollary 1 proves that while bA =Lk1−
qγ q + bAτ( )q2 − bA
2γτ 2⎛⎝⎜
⎞⎠⎟
is a cubic function of bA , only
one of three solutions results in bA > 0 and β > 0 , which we require. Further, similar to
9 This also measures the uncertainty of earnings relative to the total uncertainty of earnings plus the manager’s payoff-type, but we describe this measure more intuitively as the relative uncertainty of earnings π to the manager’s private information ε .

13
FV, we assume that the mean of µε is sufficiently large and that the variances σπ and
σε are such to maintain positive bias and audit effort in equilibrium with high probability.
Finally, we require k > Lµε +υ where υ is a constant such that that δ <1 with high
probability.10
We first discuss some of the characteristics of the equilibrium values for bA ,
bm , β and cm . These four values relate to the equilibrium weightings of r, π and ε in
the manager’s strategy, the auditor’s strategy and the market pricing function. We present
these results as a corollary to Proposition 1.
Corollary 1: Given the equilibrium described in Proposition 1, we have
the following:
1. The market’s multiplier β on reported earnings r lies between 0 and 1,
approaches 1 as γ = σπ2
σπ2 +σε
2 approaches 1 and approaches 0 as γ
approaches 0.
2. The auditor’s multiplier bA on reported earnings r lies between 0 and
Lk
, approaches 0 as γ approaches 1 and approaches Lk
as γ
approaches 0.
3. The manager’s multiplier bm on observed earnings π is strictly
positive and convex in γ , approaches 1 as γ approaches 1 and
10 These expressions could be stated in closed form, but their complexity would add more confusion than intuition. Thus for simplicity we express the equilibrium implicitly.

14
approaches 1+Lτkq
as γ approaches 0
4. The manager’s multiplier cm on his payoff-type ε is strictly positive
and convex in γ , approaches 1 as γ approaches 1 and approaches 1
as γ approaches 0.
Corollary 1 highlights the reasonableness of the equilibrium results and helps to
demonstrate the role of auditing on the market’s weighting β( ) of reported earnings for
extreme values of γ . Note that γ approaches zero when the variance of earnings σπ2 is
very small relative to variance of the manager’s misreporting type σε2 . In this case, the
market puts little weight on the manager’s report while the auditor puts maximum weight
on the manager’s report in choosing the probability of detection. The auditor emphasizes
the use of the report in choosing audit procedures when relatively little is known about
the manager’s incentives. The manager also maximally weights observed earnings and
his payoff-type in choosing the amount of overstatement. In the opposite situation in
which γ approaches 1, σε2 is small compared to σπ
2 . As a result, the market knows a
great deal about the manager’s incentive for misreporting, anticipates the amount of
reporting bias and prices shares correctly by backing out the manager’s bias. Auditing
adds little information about firm value and the auditor finds the report less useful in
determining the amount of auditing. In this case the auditor uses a fixed amount of
auditing equal to expected bias times L/k. The market does not need restated earnings to
know true earnings but the auditor requires evidence to propose an audit adjustment to
the manager.

15
4. Comparative Analysis
To better understand how the addition of a strategic auditor affects our
comparative analyses, we first consider a benchmark case in which the level of auditing
is fixed (or, equivalently, a setting in which the auditor selects the level of auditing
without considering the manager's report).
4.1 Benchmark comparative analysis
In the case where the audtor fixes audit effort at level δ , the manager’s report is
equal to
r = π + ε + τγ 1−δ( )q
where β = γ and expected bias is equal to
EB = µε +τγ 1−δ( )
q.
When δ is fixed and bA is necessarily equal to zero, Proposition 2 presents a
comparative analysis of the primary equilibrium values.
Proposition 2: When audit effort is fixed exogenously the following holds.
1. The market’s weighting on reported earnings β
a. increases as relatively more is known about the manager’s payoff-type
( σπ2 increases or σε
2 decreases),
b. is unaffected by all other parameter changes.
2. The manager’s expected bias EB
a. increases in the manager’s expected payoff-type µε ,
b. increases in the manager’s benefit multiplier τ ,
c. increases as relatively more is known about the manager’s payoff-type

16
( σπ2 increases or σε
2 decreases),
d. decreases as audit effort δ increases, and
e. decreases in q.
These results are fairly intuitive. When the variance of the manager’s payoff-type
decreases, the market relies more on reported earnings than µπ in assessing firm value
and the market’s weighting on reported earnings increases. At the same time expected
bias EB increases because the manager knows that market valuation is more sensitive to
r .
When the manager’s benefit multiplier τ and expected payoff-type µε increase,
the manager’s incentive to increase bias increases and thus, EB increases. Likewise
when the cost of biasing q increases, bias becomes more costly and EB decreases.
Finally, if audit effort δ increases, the manager anticipates a higher detection rate and EB
decreases. Thus, EB increases in the auditor’s probability of non-detection 1−δ( ) .
The above results also hold when we allow the auditor to behave strategically
without the benefit of relying on the report to determine his audit effort. 11 In this case,
audit effort increases in the liability multiplier L and decreases in the cost multiplier for
audit effort k. As expected, these results, in turn affect EB, where EB increases in k and
decreases in L. Moreover, audit effort decreases in q and increases in τ , while also
increasing as relatively more becomes known about the manager’s payoff-type.
The important feature of our benchmark setting is that β is only affected by the
market’s uncertainty about the manager’s incentives to misreport relative to uncertainty 11 In this case, EB =
k qµε + γτ( )kq + Lγτ
and δ =L qµε + γτ( )kq + Lγτ
.

17
about the underlying earnings. None of the auditor’s or manager’s incentive parameters
affect the market’s weighting on reported earnings. As we show in the next section,
introducing a strategic auditor who responds to the manager’s report yields quite
different results.
4.2 Preliminaries
Next we consider how changes in the underlying parameters affect the primary
equilibrium values in our model. These include: (1) the weighting on reported earnings
β , (2) the expected equilibrium bias, (3) the auditor’s report-contingent effort choice bA ,
and (4) the expected probability of the auditor detecting bias. For ease of exposition, we
also refer to “the expected probability of detecting bias” as expected audit effort. As
expected audit effort increases, the expected probability of detecting bias also increases.
In our analysis we consider how our model parameters affect these equilibrium values.
While bias and audit effort depend upon realizations of π and ε , we can
compute the ex ante expected amount of bias and audit effort, in equilibrium, for a given
set of parameters. Expected equilibrium bias, denoted EB, is equal to
EB = E r( )− µπ = bm −1( )µπ + cmµε + am . (21)
Substituting for the equilibrium values of bm , cm and am from Proposition 1 and
simplifying, we obtain the following equilibrium expression for expected bias.12
EB =k qµε + βτ( )kq + Lβτ
(22)
To compute expected audit effort, we observe from Proposition 1 and expression (22)
that
12 A detailed derivation of EB is shown in the appendix as part of the proof to Proposition 1.

18
E δ( ) = Lk
1− β( )E r( )− 1− β( )µπ + β EB( ) (23)
From (21) we get EB + µπ = E r( ) to obtain
E δ( ) = LkEB =
L qµε + βτ( )kq + Lβτ
(24)
We begin our comparative analysis with the market’s weighting on reported
earnings, β .
4.3 The market’s weighting on reported earnings, β .
Empiricists often regress stock price on reported earnings to infer its strength of
association with market value where the degree of assoication is measured by the slope
coefficient β . Our model offers predictions concerning empirical estimates of β based
on changes in the underlying parameters when auditing is explicitly considered in market
valuation.
When the market knows the manager’s type ( σε2 = 0 ), β is constant and equal to
one. In this case the market knows the amount of reporting bias is equal to
EB =
k qµε +τ( )kq + Lτ
= −α and adjusts price P by backing out the bias. Reported earnings
allows the market to perfectly infer true earnings π . However, as in FV, we assume that
there is uncertainty regarding the manager's reporting objective or σε2 > 0 . As a result
the earnings report becomes a noisy signal of true earnings and the slope coefficient
varies with respect to various model parameters. These variations are presented in
Proposition 3.

19
Proposition 3: The market’s weighting on reported earnings, β
1. is unaffected by changes in expected earnings µπ ,
2. is unaffected by changes in the manager’s expected payoff-type µε ,
3. increases as relatively more is known about the manager’s
payoff-type ( σπ2 increases or σε
2 decreases),
4. increases in the manager’s benefit multiplier on price τ ,
5. decreases in the manager’s cost multiplier on bias q ,
6. increases in the auditor’s liability multiplier L, and
7. decreases in the auditor’s cost multiplier on effort k.
First, note that by contrast to our benchmark case, bA (see Proposition 5) is
affected by incentive parameters of both the manager and the auditor when the auditor
adjusts his strategy in response to the manager’s report. Further, given uncertainty about
the manager’s incentives γ <1( ) , β = γ when there is no report-contingent auditing or
bA = 0 and β > γ , when we add an auditor with report-contingent auditing or bA > 0 .
This result is intuitive but non-trivial. With auditing, the manager’s report is more
meaningful because auditing effectively reduces some of the uncertainty associated with
the manager’s private information about his payoff-type. As a result, the market’s
weighting on reported earnings increases when we add an auditor who uses a report-
contingent strategy and by contrast to Proposition 2, β is now affected by more than just
a change in γ .
The market price P is based on an updated expectation of earnings conditional on
the earnings report. This conditional expectation is a linear combination of the earnings

20
expectation µπ and the report r . The β coefficient associates the variation in market
price relative to reported earnings and thus, β is independent of µπ and µε .
Variances σπ2 and σε
2 represent the degree of uncertainty that exists about
earnings and the manager’s payoff-type. In our model, all that matters is the relative
degree of uncertainty, which is measured by γ = σπ2
σπ2 +σε
2 . As γ increases, either σπ2
increases or σε2 decreases and relatively more becomes known about the manager’s
payoff-type than true earnings. As relatively more is known about the manager’s payoff-
type, the market’s weight on reported earnings increases because the market can better
anticipate and take into account the amount of bias in estimating the amount of earnings.
As τ increases, the manager’s expected benefit from biasing the report increases
while the dominant effect is that the variability in reported earnings decreases. Increases
in τ dampen the effects of increases in q.
As the manager’s cost multiplier on bias q increases, the dominant effect is again
an increase in the variability of the manager’s report and β decreases. Overall, report-
contingent auditing bA > 0( ) decreases the noise in reported earnings associated with the
manager’s payoff-type. However, increasing the manager’s cost-multiplier for bias
increases the noise in the report and dominates any incremental reductions associated
with bA . The change in β relative to q can be expressed as
dβdq
= ∂β∂bA
dbA
dq+ ∂β∂q
.
As q increases, it directly decreases β by
∂β∂q
< 0 and indirectly increases β by

21
∂β∂bA
dbA
dq> 0 where
∂β∂bA
> 0 and
dbA
dq> 0 . 13 As q becomes very large, β approaches its
minimum value γ because
∂β∂q
dominates the overall change in β (see Figure 1).
Consequently, government regulations, such as SOX, that impose severe penalties on
managers for biasing reports have the potential effect of undoing beneficial gains from
auditing.
The relation between q and β is different from that found in FV. They find that
if the cost multiplier on the manager’s penalty for bias increases, then the market’s
weighting on reported earnings or β increases. The difference is due to our modeling
assumptions. FV assume that there is no auditing and that the manager’s payoff-type is
defined by a multiplier on price P. We assume, as in DS, that the manager’s payoff-type
affects his penalty from bias. When there is no report-contingent auditing (or the audit
level is determined and fixed ex ante) in our model, a change in q has no effect on the
manager’s earnings-contingent reporting strategy and thus has no effect on β . When we
add report-contingent auditing (bA > 0), an increase in the penalty cost multiplier q
decreases the market’s weighting on reported earnings.
Overall, the market’s weighting on reported earnings increases when the auditor
chooses effort based on the report, which concurrently results in β being sensitive to
changes in q. As the cost of biasing increases, the manager’s expected payoff decreases
for a given report and the manager is less inclined to bias on average. However, the
incentive to bias depends not only on q but also on the random outcome of the manager’s
13 See Proposition 5, where we show that bA increases in q.

22
payoff-type ε . Thus, increasing q decreases the incentive to bias but also increases the
variability of the report because it is included in the multiplier on payoff-type, and the
market has a harder time in predicting the amount of reporting bias. As a result β
decreases in q.
An increase in the auditor’s legal liability cost multiplier L results in an increase
in β . As the auditor is penalized more heavily for non-detection of reporting
misstatements, the auditor’s incentive to increase his detection probability increases,
which is reflected in greater market confidence for reported earnings. The increase in L
decreases the noise associated with the uncertainty of the manager’s payoff-type. 14
dβdL
= ∂β∂bA
dbAdL
> 0
Note that L affects β indirectly by increasing the report-contingent auditing multiplier
bA . A change in the auditor’s cost multiplier k has the opposite effect. This is contrary
to case of fixed auditing (Proposition 2) where a change in L has no effect on β . Report-
contingent auditing results in increasing the market’s weighting on reported earnings
through an increase in bA based on an increase in L.
4.4 The manager’s expected bias
Next we consider how the manager’s expected bias EB is affected by various
parameter changes. These are included in Proposition 4.15
Proposition 4: The managers expected bias EB:
1. is unaffected by changes in expected earnings µπ ,
14 See Proposition 4 where we show that bA
increases in L. 15 While γ >1/ 2 is a sufficient condition for our proofs of dEB/dL < 0 and dEB/dk > 0, we can find no numerical examples where dEB/dL > 0 or dEB/dk < 0.

23
2. increases in the manager’s expected payoff-type µε ,
3. Increases as relatively more is known about the manager’s payoff type ( σπ2
increases or σε2 decreases),
4. increases in the manager’s benefit multiplier on price τ ,
5. decreases in the manager’s cost multiplier on bias q,
6. decreases in the auditor’s liability cost multiplier L when γ >1/ 2 , and
7. increases in the auditor’s cost multiplier k when γ >1/ 2 .
Expected bias EB is a function of the difference between expected reported
earnings and expected earnings. Thus, it depends on the manager’s expected payoff-type
µε and not expected earnings µπ . Expected bias increases in µε because as µε
increases, the manager has a greater incentive to bias the report.
Expected bias also increases when relatively more is known about the manager’s
payoff-type. The market can better anticipate bias and the manager increases EB to
compensate for potentially negative changes in market price. When τ increases the
manager’s benefits from an increase in bias and expected bias increases. Expected bias
also decreases in the manager’s cost multiplier q because biasing becomes more costly.
An increase in the auditor’s liability multiplier L decreases expected bias while an
increase in the auditor’s effort cost k decreases expected bias. The change in expected
bias is the manager’s reaction to a change in audit effort where audit effort increases in L
but decreases in k (see Proposition 6).
Expected bias EB and β change in the same direction when auditing is fixed
(Proposition 2). Only when we add a report-contingent auditor (Propositions 3 and 4),

24
do we have instances of β increasing while expected bias EB decreases. As the auditor’s
expected liability L increases or k decreases, the market’s weighting on reported earnings
increases and expected bias EB decreases.
4.5 The auditors choice of report-contingent audit effort and expected audit effort
To get a better understanding of how the auditor’s choice of report-contingent
effort bA and expected audit effort E δ( ) affect the auditor’s overall effort choice, we
begin by reviewing his effort function δ r( ) . From Proposition 1, we know that audit
effort is a linear function of the manager’s report r or δ r( ) = bAr + aA . We also know
from Proposition 1 that audit effort can be written as
δ r( ) = L
k1− β( ) r − µπ( ) + β EB( )
= bA r − µπ( ) + β E δ( ) . (25)
Without benefit of having seen the client’s reported numbers, the auditor can
make a preliminary choice of audit effort represented by β E δ( ) . This amount of audit
effort is based on factors such as the prior year audit and the current year assessments of
internal control, both of which provide information about the expected amount of bias.
Once the manager has a report for the auditor to observe, the auditor adjusts his audit
effort based on the report. For example, the auditor would interpret higher reported
earnings compared to his expectation of earnings (or r − µπ( ) ) as indicative of a higher
risk of an earnings overstatement, resulting in an increase in audit effort based on the
report. On the other hand, higher values of β for fixed L and k also imply that the report
25
is a better indicator of earnings, thereby lessening the possibility of overstatement
associated with a higher report and reducing audit effort.
For fixed L and k, as the market’s weighting on reported earnings increases, the
less relevant the earnings report is in determining audit effort. In such cases, the auditor
relies more on expected bias in determining audit effort. In the limit, when β = 1 , the
auditor employs a non-report-contingent audit strategy and when β = 0 , the auditor uses
the difference between reported earnings and µπ times L/k in determining his audit
strategy. 16
Based on expression (25), we see the relative importance of the auditor’s report-
contingent strategy bA and expected audit effort E δ( ) in determining the auditor’s effort
choice. Proposition 5 focuses on changes in bA with respect to changes in our game
parameters and Proposition 6 examines changes in E δ( ) .
Proposition 5: The auditor’s choice of report-contingent audit effort, bA
1. is unaffected by changes in expected earnings µπ ,
2. is unaffected by changes in the manager’s expected payoff-type µε ,
3. decreases as relatively more is known about the manager’s
payoff ( σπ2 increases or σε
2 decreases),
4. decreases in the manager’s benefit multiplier on
price τ ,
5. increases in the manager’s cost multiplier on bias q ,
6. increases in the auditor liability multiplier L , and
16 In equilibrium, β is never equal to 0 or 1.
26
7. decreases in the auditor’s cost multiplier on audit effort, k.
Changes in bA due to changes in µπ ,µε ,q,τ ,σπ2 and σε
2 follow directly from
Proposition 3, because we know that bA =
Lk
1− β( ) . Any parameter change not
involving L or k has opposite effects on bA versus β . As the market’s weighting on
reported earnings increases, it is less influential on audit effort because an increase in r
is associated less with changes in bias. Thus, as relatively more is known about the
manager’s payoff-type, the auditor relies less on reported earnings in choosing his audit
effort. Similarly, as the manager’s benefit multiplier τ increases (or, equivalently, the
cost multiplier q decreases), the auditor relies less on the report (as expected bias
(Proposition 4) and expected audit effort decreases (Proposition 6)).
L and k are the only parameter changes resulting in the same directional changes
for both β and bA . Below we demonstrate how bA increases in L.
dbAdL
= ∂bA∂L
+ ∂bA∂β
dβdL
= 1k1− β( )− L
kdβdL
> 0
where the positive direct effect of an increase in L dominates the indirect negative effect
of an increase in β due to an increase in L. There is an increase in report-contingent
auditing but the increase is lessened by the increase in the market’s weighting on reported
earnings. In a similar fashion, as auditor efficiency decreases ( k increases), the amount
of report-contingent auditing decreases.
Proposition 6 addresses the changes in E δ( ) .
Proposition 6: The auditor’s expected audit effort E δ( ) :

27
1. is unaffected by changes in expected earnings µπ ;
2. increases in the manager’s expected payoff-type µε ,
3. increases as relatively more is known about the manager’s payoff type ( σπ2
increases or σε2 decreases),
4. increases in the manager’s benefit multiplier on priceτ ,
5. decreases in the manager’s cost multiplier on bias q,
6. increases in the auditor’s liability cost multiplier L, and
7. decreases in the auditor’s cost multiplier on effort k .
The auditor’s expected audit effort E δ( ) is equal to Lk
EB and consequently changes in
expected audit effort are the same as those for EB when L and k are fixed. E δ( )
decreases in the manager’s cost multiplier q and corresponds to a decrease in EB. The
manager reduces EB with higher costs associated with bias, and the auditor responds to
the reduction with a decrease in E δ( ) . Likewise, as relatively more is known about the
manager’s payoff-type, EB increases and the auditor responds by increasing E δ( ) . Note
that despite the effects of EB on market price, the auditor and manager play a sub-game
where the auditor would like to avoid costly undetected bias.
For changes in E δ( ) with respect to L, E δ( ) and EB change in opposite
directions. We have
dE δ( )dL
=d L
kEB⎛
⎝⎜⎞⎠⎟
dL= EB
k+ LkdEBdL
> 0 .

28
Despite expected bias decreasing in the auditor liability multiplier, the auditor increases
expected audit effort because it directly affects his expected payoff. In this case the
manager reacts to the auditor’s increase in expected effort by decreasing expected bias
when γ >1/ 2 .17 The amount of increase in expected audit effort is lessened by the
associated decrease in expected bias times L/k and increased by the amount of expected
bias times 1/k. For decreases in audit efficiency (increases in k), the opposite is true.
5. Empirical Implications and Applications
In this section we provide some intuition about how the comparative statics in
Propositions 3 through 6 might be applied to empirical studies. The drivers of change in
these propositions include k , L, σπ2 , σε
2 ,µε , τ and q .
The auditor’s cost of effort k is often linked to audit quality because, in most
studies, k is inversely related to audit effort, which in turn is positively correlated to the
probability of detecting and correcting misstatements.18 More broadly, k is a technology
factor that is related to audit efficiency and effectiveness.19 As k increases, a given level
of detection probability is more expensive to employ. Thus, k decreases in auditor
independence because audit procedures are less effective and k is smaller for larger audit
firms because they have more resources, which is likely to result in a more efficient audit
technology. In addition, if audit tenure improves audit effectiveness, then tenure should
also be linked to a decrease in k.20 On the other hand, audit tenure may be associated
17 While γ >1/ 2 is a sufficient condition and our proof of dEB/dL < 0 requires this condition, we can find no numerical examples where dEB/dL > 0 . 18 See for example, Newman and Noel (1989), Newman, Patterson, and Smith (2001), and Newman, Patterson, and Smith (2005), among others. 19 Effectiveness is either due to the nature of the audit procedure itself or the person applying the procedure. 20 See Myers, Myers, and Omer (2003) and Johnson, et. al (2002) who provide evidence that longer audit tenure reduces the cost of auditing. Beck and Wu (2006) provide a theoretical explanation for this decrease in costs.

29
with declining independence when the auditor has engaged in low-balling or is
attempting to retain a client for non-audit service fees. Thus, based on our analysis we
would predict that as auditor independence declines, the market’s weight on reported
earnings decreases, the amount of report-contingent auditing decreases, expected bias
increases and expected audit effort decreases.21 We would make the same predictions for
smaller audit firms verses larger audit firms. 22
We designate the auditor’s expected litigation costs for an audit failure as L. Our
predictions related to L are consistent with several empirical studies. First, large national
audit firms have larger litigation costs and “deeper pockets.” Thus, large firms have both
smaller k and larger L, which implies that larger audit firms are associated with an
increase in the market’s weighting on reported earnings (for example, see Teoh and
Wong (1993)).
Second, several empirical studies have investigated how varying litigation
environments across countries affect the quality of reported earnings. DeFond, Hung,
Trezevant (2007) document that stronger investor protection increases the market’s
reaction to earnings (higher L). Leuz, Nanda and Wysocki (2003) suggest that
controlling shareholders have incentives to hide firm performance in order to maintain
their control benefits. They find evidence that earnings quality is positively correlated
with the level of investor protection across countries. However, they cannot rule out 21 See Gul, Tsui, and Dhaliwal (2006) (GTD) who study the effect of non-audit services (NAS) on the market’s weighting of reported earnings. They find that, overall, there is a negative effect of NAS on the market’s weighting of reported earnings because, based on their hypothesis, NAS result in less auditor independence but the negative effect is weaker for Big 6 auditors. There are two possible effects associated with NAS. They may provide scope economies for the auditor (reduce k) while also impairing independence (increase k) or diverting the auditor’s attention away from fundamental audit tasks. GTD imply that the net effect of NAS is to lessen the audit’s effectiveness but the effect is less for bigger audit firms. 22 See Teoh and Wong (1993) who find that the market’s weighting on reported earnings is larger for larger audit firms.

30
other institutional factors that may correlate with investor protection and drive their
results. For example, there may be less consensus about ethical norms regarding
reporting bias where σ ε
2 is negatively correlated to the size of L. Countries with higher
levels of investor protection may also have more common agreement on the personal
costs of bias. Francis and Wang (2010) posit that legal environments alone do not
determine earnings quality. Rather, earnings quality depends both on the legal
environment and audit quality. Their data suggest that the level of investor protection has
no impact on earnings quality if the auditor is low quality. Rather investor protection is
meaningful only if the auditor is a high quality auditor. This result is understandable if k
is sufficiently large (low audit quality) so as to mute the effects of L (higher for better
investor protection). In our model, the market’s weight on reported earnings increases in
the parameter combination L/k.
With regard to σπ
2 / σπ2 +σε
2( ) = γ , we predict that the market’s weighting on
reported earnings increases in γ . Collins and DeAngelo (1990) find that during a proxy
contest, the market is more responsive to earnings. Dechow, et. al (2010) note on page
370 that:
This finding rejects one proposed hypothesis, which is that earnings during this period are less precise because they are likely to be opportunistically managed, in which case the ERC should be lower. Rather, they interpret their finding as evidence that a proxy contest is a period of heightened uncertainty and that the earnings number is especially useful for valuation. This evidence suggests that ERCs as a proxy for earnings quality may be specific to an event-period.
Our model helps interpret this effect. As γ increases due to an increase in σπ
2 , the
market has better information about management incentives than they do about earnings
and are more able to undo any anticipated bias in reported earnings. Thus, while the

31
earnings report may be opportunistically managed, the informational attributes in this
context result in a higher ERC.
Our results also apply to studies that consider the effects of management
ownership of the firm on market valuation. This is related to our τ parameter where τ
increases in the management ownership percentage of the firm and is positively
associated with an increase in the market’s weighting on reported earnings. The results
found in several empirical studies such as Warfield, Wild and Wild (1995) and Gul, Lynn,
and Tsui (2002) (GLT) are consistent with this prediction. GLT find that as management
ownership decreases (τ decreases), the market’s weighting on reported earnings
decreases. Moreover, they show that for Big 6 auditors (k decreases) the decrease is less.
Our results also suggest that government regulation may have confounding effects
on the markets’ weighting of reported earnings. For example, SOX has substantially
increased management penalties for misstatements, including the possibility of criminal
penalties. We show that as the cost of overstatements q increases, the positive impact
that report-contingent auditing has on β (the market reaction to reported earnings)
decreases. In the limit, as q increases, β decreases to the parameter γ (see Figure 1),
which is unaffected by the auditing parameters L and k. Thus, for very large q’s, β no
longer would reflect a change audit quality based on a change in L or k.
On the other hand, SOX was designed to make audits more effective by
mandating an increase in the amount of auditing (the impact on our model would be
equivalent to decreasing k). If the increase in q is not large, the joint effects of an
increase in q and a decrease in k are difficult to predict because they each have a different
effect on β . These effects may be industry specific. For example, SOX may not have a
32
significant auditing effect (decrease in k) on financial institutions because prior to SOX
most financial institutions had well developed systems of internal control. Moreover, the
general approach to auditing financial institutions is to audit internal controls, even
before SOX. And yet they are still subject to management penalties for misstatements
(increase in q). Thus, the primary effect of SOX for financial institutions, all else held
constant, would be an increase in q.
6. Conclusion
In a game among market participants, a manager and an auditor, we consider how
their strategic interaction affects the market’s weighting on reported earnings, reporting
bias, and the amount of auditor effort based directly on the report. Because the market is
uncertain about the manager’s payoff-type, the market cannot infer reporting bias with
certainty and the noise in reported earnings increases. Overall, when we add a report-
contingent auditor to the interaction, the earnings report variance associated with this
uncertainty decreases.
We also provide predictions related to the empirical regressions of market price
and audit effort on reported earnings. We find that, when the uncertainty of earnings
increases or manager payoff-type decreases, the market’s weighting on reported earnings
increases, while report-contingent auditing decreases. As the earnings report becomes
more predictive of actual earnings, the auditor finds it less valuable in determining his
detection effort because it is less predictive of bias. Moreover, expected audit effort and
expected bias both increase. The uncertainty associated with the manager’s payoff-type
could represent the variation in personal managerial incentives. As this variation
decreases the market’s weighting on reported earnings increases.

33
In addition, we find that as the manager’s cost parameter for reporting bias
increases, the market’s weighting on reported earnings decreases and the earnings report
coefficient for the auditor increases. An increase in this parameter can affect the
market’s weighting on reported earnings in unexpected ways when investigating the
effects of regulation. In certain industries, SOX regulation may result in a decrease in
the market’s weighting on reported earnings due to the potential dominant effect of
managerial penalties for misstatements. Moreover, increased investor protection across
countries may not only increase auditor liability for audit failures but also increase
penalties on management. This in turn affects the strength of association between
market’s weighting on reported earnings and investor protection across countries.
The results for auditor liability and audit cost are different in that the earnings
report coefficients for both the market and the auditor increase in the auditor’s liability
cost and decrease in audit effort cost. Increases in auditor liability costs increase the
market’s weighting on reported earnings and the importance of the report in choosing
audit effort, while the opposite is true for audit effort costs. Thus, the impact of litigation
costs on the market’s weighting of reported earnings must be assessed in the context of
audit effort costs. A predominance of high quality auditors whose audit costs are low can
strengthen the effect of increased liability costs because the market’s weight on reported
earnings increases in the ratio of audit liability to audit effort costs. Likewise, a decrease
in this ratio can arise from a decrease in auditor quality or a decrease in auditor liability.
Concurrently, expected reporting bias decreases and expected audit effort increases in the
ratio of audit liability to audit effort costs.

34
FIGURE 1
The change in β as q increases for the case of report-contingent auditing (bA > 0) compared to the case of
constant auditing (bA = 0)
1 2 3 4 5
0.40
0.45
0.50
q
bA > 0
bA = 0

35
APPENDIX
Proof of Proposition 1: From expression (2) we have
dMdr
= −r q + 2bAβτ( ) + q + bAτ( )π + qε + 1− aA( )β − bAα( )τ
Note that d 2 Mdr 2 < 0 so that the solution to
dMdr
= 0 gives us the manager’s maximizing
choice.
When we set dMdr
= 0 , we obtain
r =q + bAτ( )π + qε + 1− aA( )β − bAα( )τ
q + 2bAβτ( )
Thus, bm =
q + bAτq + 2bAβτ
, cm = q
q + 2bAβτ and
am =
1− aA( )β − bAα( )τq + 2bAβτ
=aA 1− 2β( ) + β( )τ
q + 2bAβτ
Next, β =
qγ q + bAτ( )q2 − bA
2γτ 2 because β =
bm 1−γ( )bm
2 1−γ( ) + cm2γ
where
β =
q + bAτq + 2bAβτ
γ
q + bAτq + 2bAβτ
⎛⎝⎜
⎞⎠⎟
2
γ + qq + 2bAβτ
⎛⎝⎜
⎞⎠⎟
2
1−γ( )=
q + bAτ( ) q + 2bAβτ( )γq + bAτ( )2
γ + q2 1−γ( )⇒
β =
qγ q + bAτ( )q2 − bA
2γτ 2 .
Note from (4) that d2Adδ 2 > 0 so that expression (11) minimizes the auditor’s expected
costs.
Expression (13) derived from expression (11) implies that bA =Lk1−
qγ q + bAτ( )q2 − bA
2γτ 2⎛⎝⎜
⎞⎠⎟

36
And from (14) we have
aA =Lk
−µπ +bmσπ
2
bm2σπ
2 + cm2σε
2 bmµπ + cmµε + am( )⎛⎝⎜
⎞⎠⎟⇒
aA =Lk
− 1− β( )µπ + β EB( )
where expected bias isEB = bmµπ + cmµε + am − µπ
And so we have
EB = q + bAτq + 2bAβτ
µπ +q
q + 2bAβτµε +
Lk
− 1− β( )µπ + β EB( ) 1− 2β( ) + β⎛⎝⎜
⎞⎠⎟ τ
q + 2bAβτ− µπ
= 1q + 2bAβτ
q + bAτ( )µπ + qµε +Lk
− 1− β( )µπ + β EB( ) 1− 2β( ) + β⎛⎝⎜
⎞⎠⎟ τ − q + 2bAβτ( )µπ
⎧⎨⎩
⎫⎬⎭
= 1q + 2bAβτ
bAτ 1− 2β( )µπ + qµε +Lk
− 1− β( )µπ + β EB( ) 1− 2β( ) + β⎛⎝⎜
⎞⎠⎟ τ
⎧⎨⎩
⎫⎬⎭
= 1
q + 2 Lk
1− β( )βτLk
1− β( )τ 1− 2β( )µπ + qµε +Lk
− 1− β( )µπ + β EB( ) 1− 2β( ) + β⎛⎝⎜
⎞⎠⎟ τ
⎧⎨⎩
⎫⎬⎭
= 1kq + 2L 1− β( )βτ kqµε + Lβ EB 1− 2β( )τ + kβτ{ }⇒
EB kq + 2L 1− β( )βτ − Lβ 1− 2β( )τ( ) = kqµε + kβτ ⇒
EB kq + Lβτ( ) = kqµε + kβτ ⇒
EB =k qµε + βτ( )kq + Lβτ
Thus, aA =Lk
− 1− β( )µπ + β k qµε + βτ( )kq + Lβτ
⎛⎝⎜
⎞⎠⎟
37
Finally, from expression (9), we see that α = − kLaA so that
α = 1− β( )µπ − β k qµε + βτ( )kq + Lβτ
.
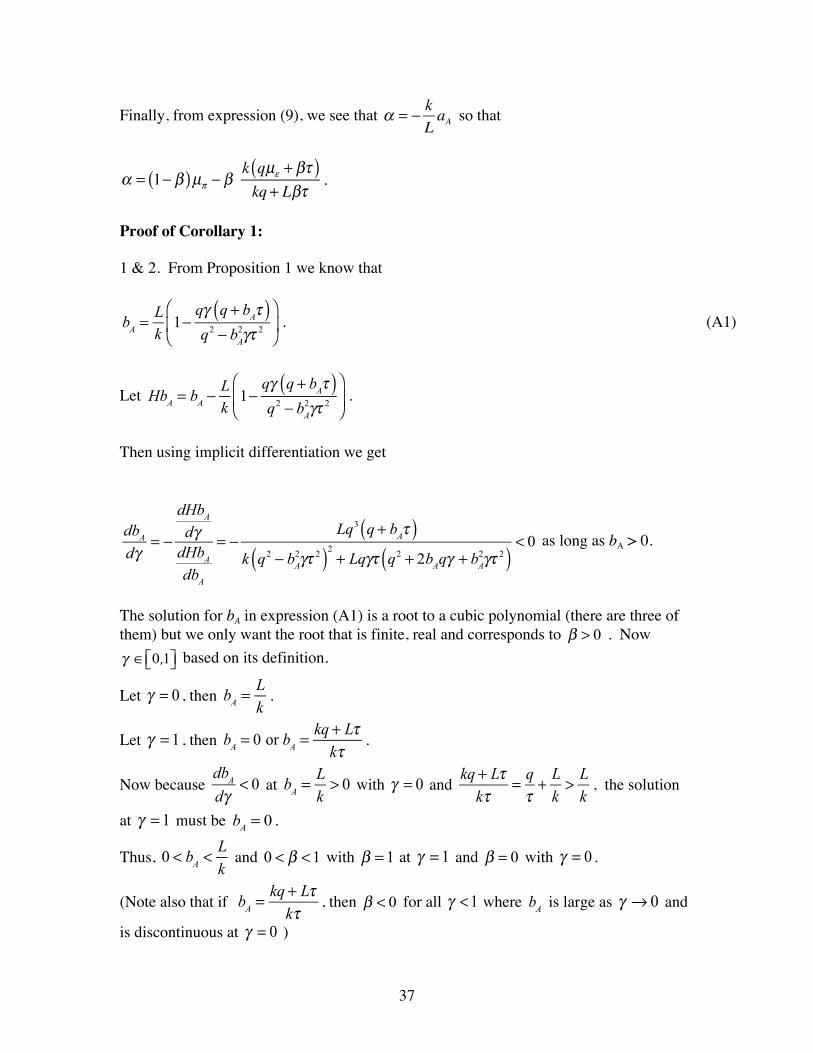
Proof of Corollary 1:
1 & 2. From Proposition 1 we know that
bA =
Lk
1−qγ q + bAτ( )q2 − bA
2γτ 2
⎛
⎝⎜
⎞
⎠⎟ . (A1)
Let HbA = bA −
Lk
1−qγ q + bAτ( )q2 − bA
2γτ 2
⎛
⎝⎜
⎞
⎠⎟ .
Then using implicit differentiation we get
dbA
dγ= −
dHbA
dγdHbA
dbA
= −Lq3 q + bAτ( )
k q2 − bA2γτ 2( )2
+ Lqγτ q2 + 2bAqγ + bA2γτ 2( )
< 0 as long as bA > 0.
The solution for bA in expression (A1) is a root to a cubic polynomial (there are three of them) but we only want the root that is finite, real and corresponds to β > 0 . Now
γ ∈ 0,1⎡⎣ ⎤⎦ based on its definition.
Let γ = 0 , then bA =
Lk
.
Let γ = 1 , then bA = 0 or bA =
kq + Lτkτ
.
Now because
dbA
dγ< 0 at
bA =
Lk> 0 with γ = 0 and
kq + Lτ
kτ= qτ+ L
k> L
k, the solution
at γ = 1 must be bA = 0 .
Thus, 0 < bA <
Lk
and 0 < β <1 with β = 1 at γ = 1 and β = 0 with γ = 0 .
(Note also that if bA =
kq + Lτkτ
, then β < 0 for all γ <1 where bA is large as γ → 0 and
is discontinuous at γ = 0 )

38
3. bm →1 as γ →1 and bm →1+ Lτ
kq as γ → 0
with
bm > Lτ4kq + 2Lτ − 2 2kq 2kq + Lτ( )
> 0 .
First we know that bm =
q + bAτq + 2bAβτ
=kq + L 1− β( )τ
kq + 2L 1− β( )βτ .
As a result,
dbm
dγ=
Lτ kq −3+ 4β( )− 2L 1− β( )2τ( )
kq + 2L 1− β( )βτ( )2
dβdγ
.
From Corollary 1, 1 &2, dβdγ
= − dbAdγ
> 0 and
d kq −3+ 4β( )− 2L 1− β( )2τ( )
dγ= 4 kq + L 1− β( )τ( ) dβ
dγ> 0
Thus bm first decreases in γ or equivalently in σπ
2 with the minimum occurring at
bm = Lτ4kq + 2Lτ − 2 2kq 2kq + Lτ( )
> 0 and bm = 1+ Lτ
kq at γ = 0
σπ
2 → 0( ) with bm = 1
at γ = 1 σπ
2 →∞( ) .
4. cm →1 as γ →1 or as γ → 0 with
1> cm > 1
1+ Lτ2kq
.
We know that cm = q
q + 2bAβτ= kq
kq + 2L 1− β( )βτ
and so
dcm
dγ=
2Lkqτ −1+ 2β( )kq + 2L 1− β( )βτ( )2
dβdγ

39
Thus, C first decreases in γ and then increases in γ with the minimum occurring at
β = 1 / 2 where cm = 2kq
2kq + Lτ. Also cm = 1 at both β = 0 or γ = 0( ) and
β = 1 or γ = 1( ) .
Proof of Proposition 2:
As before,
P r( ) = E π | r( ) = β r +α where β = bmσπ2
bm2σπ
2 + cm2σε
2
Also,
M = τ 1−δ( )E π | r( ) +δπ( )− q2 r −π − ε( )2 where we assume that δ is constant.
= τ 1−δ( ) β r +α( ) +δπ( )− q2 r −π − ε( )2
⇒ dMdr
= τβ 1−δ( )− q r −π − ε( ) = 0
⇒ r = π + ε + τβ 1−δ( )q
and so bm = cm = 1 and β = σπ2
σπ2 +σε
2 = γ
Thus, r = π + ε + τγ 1−δ( )q
(1B)
And in this case EB = µε +τγ 1−δ( )
q
Where EB increases in τ ,γ and decreases in δ ,q . Also changes in q,τ ,δ have no
impact on β .

40
Proof of Proposition 3:
(1, 2)
dβdµπ
= 0 and dβdµε
= 0
Clearly this is true because β =
qγ q + bAτ( )q2 − bA
2γτ 2 is not a function of either parameter.
(3)
dβdγ
> 0 was proved as part of Corollary 1.
(4) Proof of dβdτ
> 0 :
Note that
dβdτ
= ∂β∂bA
dbA
dτ+ ∂β∂τ
Again let HbA = bA −
Lk
1−qγ q + bAτ( )q2 − bA
2γτ 2
⎛
⎝⎜
⎞
⎠⎟
dbA
dτ= −
dHbA
dτdHbA
dbA
= −bALqγ q2 + 2bAqγτ + bA
2γτ 2( )k q2 − bA
2γτ 2( )2+ Lqγτ q2 + 2bAqγ + bA
2γτ 2( )< 0
Recall that β =
qγ q + bAτ( )q2 − bA
2γτ 2 , then
∂β∂bA
=qγτ q2 + 2bAqγτ + bA
2γτ 2( )q2 − bA
2γτ 2( )2 > 0
and
∂β∂τ
=bAqγ q2 + 2bAqγτ + bA
2γτ 2( )q2 − bA
2γτ 2( )2 > 0
Thus,
dβdτ
= ∂β∂bA
dbA
dτ+ ∂β∂τ
=

41
qγτ q2 + 2bAqγτ + bA2γτ 2( )
q2 − bA2γτ 2( )2 • −
bALqγ q2 + 2bAqγτ + bA2γτ 2( )
k q2 − bA2γτ 2( )2
+ Lqγτ q2 + 2bAqγ + bA2γτ 2( )
⎛
⎝⎜⎜
⎞
⎠⎟⎟+
bAqγ q2 + 2bAqγτ + bA2γτ 2( )
q2 − bA2γτ 2( )2 =
bAkqγ q2 + 2bAqγτ + bA2γτ 2( )
k q2 − bA2γτ 2( )2
+ Lqγτ q2 + 2bAqγτ + bA2γτ 2( )
> 0
(5)
dβdq
< 0 is proved in a similar fashion to dβdτ
> 0 where
dβdq
= ∂β∂bA
dbA
dq+ ∂β∂q
Again let HbA = bA −
Lk
1−qγ q + bAτ( )q2 − bA
2γτ 2
⎛
⎝⎜
⎞
⎠⎟
dbA
dq= −
dHbA
dqdHbA
dbA
=bALγτ q2 + 2bAqγτ + bA
2γτ 2( )k q2 − bA
2γτ 2( )2+ Lqγτ q2 + 2bAqγτ + bA
2γτ 2( )> 0
Recall that β =
qγ q + bAτ( )q2 − bA
2γτ 2 , then
∂β∂bA
=qγτ q2 + 2bAqγτ + bA
2γτ 2( )q2 − bA
2γτ 2( )2 > 0
∂β∂q
= −bAγτ q2 + 2bAqγτ + bA
2γτ 2( )q2 − bA
2γτ 2( )2 < 0
Thus,
dβdq
= ∂β∂bA
dbA
dq+ ∂β∂q
=
qγτ q2 + 2bAqγτ + bA2γτ 2( )
q2 − bA2γτ 2( )2 •
bALγτ q2 + 2bAqγτ + bA2γτ 2( )
k q2 − bA2γτ 2( )2
+ Lqγτ q2 + 2bAqγτ + bA2γτ 2( )
−bAγτ q2 + 2bAqγτ + bA
2γτ 2( )q2 − bA
2γτ 2( )2 =

42
q2 + 2bAqγτ + bA2γτ 2( ) bAγτ
q2 − bA2γτ 2( )2 −1+
Lqγτ q2 + 2bAqγ + bA2γτ 2( )
k q2 − bA2γτ 2( )2
+ Lqγτ q2 + 2bAqγτ + bA2γτ 2( ){ }
⎧
⎨⎪
⎩⎪
⎫
⎬⎪
⎭⎪=
− q2 + 2bAqγτ + bA2γτ 2( ) bAγτ
q2 − bA2γτ 2( )2
k q2 − bA2γτ 2( )2
k q2 − bA2γτ 2( )2
+ Lqγτ q2 + 2bAqγτ + bA2γτ 2( )
⎧⎨⎪
⎩⎪
⎫⎬⎪
⎭⎪
= −bAkγτ q2 + 2bAqγτ + bA
2γτ 2( )k q2 − bA
2γτ 2( )2+ Lqγτ q2 + 2bAqγτ + bA
2γτ 2( )< 0
(6) Proof that dβdL
> 0 :
We again use the chain rule where
dβdL
= ∂β∂bA
dbA
dL+ ∂β∂L
.
First we know that ∂β∂L
= 0 due to β =
qγ q + bAτ( )q2 − bA
2γτ 2 being explicitly free of L .
Next, we must find
dbA
dL and using implicit differentiation we have
as in Corollary 2, HbA = bA −
Lk
1−qγ q + bAτ( )q2 − bA
2γτ 2
⎛
⎝⎜
⎞
⎠⎟ , then
dbA
dL= −
dHbA
dLdHbA
dbA
= kL
bA q2 − bA
2γτ 2( )2
k q2 − bA2γτ 2( )2
+ Lqγτ q2 + 2bAqγτ + bA2γτ 2( )
> 0
and
∂β∂bA
=qγτ q2 + 2bAqγτ + bA
2γτ 2( )q2 − bA
2γτ 2( )2 > 0 .
Thus, dβdL
> 0 and
dbA
dL> 0 .

43
(7) Proof that dβdk
< 0 :
Similar to dβdL
, dβdk
changes in the same direction as dbAdk
and we know that
dbA
dk= −
dHbA
dkdHbA
dbA
= −bA q2 − bA
2γτ 2( )2
k q2 − bA2γτ 2( )2
+ Lqγτ q2 + 2bAqγτ + bA2γτ 2( )
< 0
Proof of Proposition 4:
Recall that EB =k qµε + βτ( )kq + Lβτ
(1) Clearly EB does not change due to a change in µπ
(2) dEBdµε
= kqkq + Lβτ
> 0
(3) Proof that dEBdγ
> 0
dEBdγ
=d
k qµε + βτ( )kq + Lβτ
⎛⎝⎜
⎞⎠⎟
dγ= dEB
γ+ dEBdβ
dβdγ
=Lq k − Lµε( )τkq + Lβτ( )2
dβdγ
> 0
because dβdγ
> 0 and k − Lµε > 0 by assumption.
(4) Proof that dEBdτ
> 0 :

44
Note that EB =k qµε + βτ( )kq + Lβτ
=k q
τµε + β
⎛⎝⎜
⎞⎠⎟
k qτ+ Lβ
where β can also be written in terms of qτ
In addition, dβdτ
and
dβdq
change in opposite directions due to Proposition 2.
Thus, dEBdτ
and dEBdq
have opposite signs. See (3) below that shows
dEBdq
< 0⇒ dEBdτ
> 0
Similarly, EB =k qµε + βτ( )kq + Lβτ
=
kLqµε + βτ( )kLq + βτ
where also dβdL
and dβdk
move in opposite
directions as proved in Proposition 2. Thus EB changes in opposite directions with
respect to k and L. In (3) we show that dEBdL
< 0 when γ >1/ 2 .
Thus dEBdk
> 0 when γ >1/ 2 .
(5) Below shows that dEBdq
< 0 .
dEBdq
= ∂EB∂β
dβdq
+ ∂EB∂q
where
dβdq
< 0 ,
∂EB∂β
=kq k − Lµε( )τ
kq + Lβτ( )2 > 0 and
∂EB∂q
= −Lβ k − Lµε( )τ
kq + Lβτ( )2 < 0 because, by
assumption, k − Lµε > 0 .
(6) Next, we show that dEBdL
< 0 when γ >1/ 2

45
dEBdL
=d
kqµε
kq + Lβτ⎛⎝⎜
⎞⎠⎟
dL+
d kβτkq + Lβτ
⎛⎝⎜
⎞⎠⎟
dL
dkqµε
kq + Lβτ⎛⎝⎜
⎞⎠⎟
dL= −
kqµετ β + L dβdL
⎛⎝⎜
⎞⎠⎟
kq + Lτβ( )2 < 0 because dβdL
> 0
and
d kβτkq + Lβτ
⎛⎝⎜
⎞⎠⎟
dL=
−kqγτ Lγ 2τ q + bAτ( )2
q2 + 2bAqγτ + bA2γτ 2( ) + k q + bAγτ( ) q2 − bA
2γτ 2( ) −q 1− 2γ( ) + 2bAqγτ + bA2γτ 2( )( )
Lγτ q + bAτ( ) + k q2 − bA2γτ 2( )( )2
k q2 − bA2γτ 2( )2
+ Lqγτ q2 + 2bAqγτ + bA2γτ 2( )( )
which is negative when γ >1/ 2 because this yields −q 1− 2γ( ) > 0
Thus, dEBdL
< 0 when γ > 1 / 2 .
(7) The proof for dEBdk
> 0 when γ > 1 / 2 is similar.
Proof of Proposition 5:
In proving Proposition 4, we note that
bA =
Lk
1− β( ) (1A)
(1, 2) Based on Proposition 2 and (1A),
dbA
dµπ
=dbA
dµε
= 0
(3)
dbA
dγ< 0 was proved as part of Corollary 1.
(4)
dbA
dτ< 0 based on (1A) and Proposition 2.

46
(5)
dbA
dq> 0 due to (1A) and Proposition 2.
(6) Also see Proposition 2 where we show that
dbA
dL> 0 .
(7)
dbA
dk< 0 was shown to be true as part of the proof to Proposition 2.
Proof of Proposition 6:
Recall that E δ( ) = L qµε + βτ( )kq + Lβτ
= LkEB
(1)
dE δ( )dµπ
= 0 because E δ( ) is free of µπ .
(2)
dE δ( )dµε
= Lk
dEBdµε
> 0
(3)
dE δ( )dγ
= Lk
dEBdγ
> 0
(4)
dE δ( )dτ
= Lk
dEBdτ
> 0
(5)
dE δ( )dq
= Lk
dEBdq
< 0
(6) Proof that
dE δ( )dL
> 0 :
dE δ( )dL
=∂E δ( )∂β
dβdL
+∂E δ( )∂L
where we know that dβdL
> 0
and
∂E δ( )∂β
=Lq k − Lµε( )τ
kq + Lβτ( )2 > 0 ,

47
∂E δ( )∂L
=kq qµε + βτ( )
kq + Lβτ( )2 > 0
Thus,
dE δ( )dL
> 0
(6) Proof that
dE δ( )dk
< 0
dE δ( )dk
=∂E δ( )∂β
dβdk
+∂E δ( )∂k
where we know that dβdk
< 0
and
∂E δ( )∂β
=Lq k − Lµε( )τ
kq + Lβτ( )2 > 0 ,
∂E δ( )∂k
= −Lq qµε + βτ( )
kq + Lβτ( )2 < 0
Thus,
dE δ( )dk
< 0

48
References
Ball, R., & Brown, P. 1968. An Empirical Evaluation of Accounting Income Numbers. Journal of Accounting Research, 6(2): 159-178.
Beck, P. and M. Wu. 2006. Learning by doing and audit quality. Contemporary
Accounting Research, 23 (1). 1-30. Beyer, A., & Sridhar, S. 2006. Effects of Multiple Clients on the Reliability of Audit
Reports. Journal of Accounting Research, 44(1): 29-51. Caskey, Nagar, and Petacchi. 2010. Reporting bias and an audit committee. The
Accounting Review, Chan, D. K., & Pae, S. 1998. An Analysis of the Economic Consequences of the
Proportionate Liability Rule. Contemporary Accounting Research, 15(4): 457-480.
Choi, J., & Wong, T. J. 2007. Auditors' governance functions and legal environments: An
international investigation. Contemporary Accounting Research, 24(1): 13-46. Claessens, S., Djankov, S., & Lang, L. H. P. 2000. The separation of ownership and
control in east asian corporations. Journal of Financial Economics, 58(1): 81-112.
DeFond, M., Hung, M., & Trezevant, R. 2007. Investor protection and the information
content of annual earnings announcements: International evidence. Journal of Accounting and Economics, 43(1): 37-67.
Dye, R. A., & Sridhar, S. S. 2004. Reliability-relevence trade-offs and the efficiency of
aggregation. Journal of Accounting Research, 42(1): 51-88. Fan, J. P. H., & Wong, T. J. 2005. Do External Auditors Perform a Corporate
Governance Role in Emerging Markets? Evidence from East Asia. Journal of Accounting Research, 43(1): 35-72.
Fellingham, J. C., & Newman, D. P. 1985. Strategic Considerations in Auditing. The
Accounting Review, 60(4): 634-650. Fischer, P. E., & Verrecchia, R. E. 2000. Reporting Bias. The Accounting Review, 75(2):
229-245. Francis, J., Ke, B., 2006. Disclosure of fees paid to auditors and the market valuation of
earnings surprises. Review of Accounting Studies 11, 495–523.
49
Francis, J. R., & Wang, D. 2008. The Joint Effect of Investor Protection and Big 4 Audits on Earnings Quality Around the World. Contemporary Accounting Research, 25(1): 4.
Gul, F.A, Lynn, S.A. and J. L. Tsui. 2006. Audit quality, management ownership,
and the informativeness of accounting earnings. Journal of Accounting, Auditing and Finance, 17(25): 25-49.
Hillegeist, S. A. 1999. Financial reporting and auditing under alternative damage
apportionment rules. The Accounting Review, 74(3): 347-369. La Porta, R., Lopez-de-Silanes, F., Shleifer, A., & Vishny, R. 2000. Investor protection
and corporate governance. Journal of Financial Economics, 58(1,2): 3-27. Laux, V., & Newman, D. P. 2010. Auditor Liability and Client Acceptance Decisions.
The Accounting Review, 85(1): 261-285. Leuz, C., Nanda, D., & Wysocki, P. D. 2003. Earnings management and investor
protection: an international comparison. Journal of Financial Economics, 69(3): 505-527.
Newman, D. P., & Noel, J. 1989. Error rates, detection rates, and payoff functions in
auditing. Auditing: A Journal of Practice and Theory, 8(2): 50-63. Newman, D. P., Park, J., & Smith, J. R. 1998. Allocating internal audit resources to
minimize detection risk due to theft. Auditing: A Journal of Practice and Theory, 17(1): 69-82.
Newman, D. P., Patterson, E., & Smith, R. 2001. The Influence of Potentially Fraudulent
Reports on Audit Risk Assessment and Planning. The Accounting Review, 76(1): 59-80.
Newman, D. P., Patterson, E. R., & Smith, J. R. 2005. The Role of Auditing in Investor
Protection. The Accounting Review, 80(1): 289-313. Newman, D. P., Rhoades, S. C., & Smith, J. R. 1996. Allocating audit resources to detect
fraud. Review of Accounting Studies, 1(2): 161-182. Patterson, E., & Noel, J. 2003. Audit strategies and multiple fraud opportunities of
misreporting and defalcation. Contemporary Accounting Research, 20(3): 519-549.
Shibano, T. 1990. Assessing Audit Risk from Errors and Irregularities; Discussion.
Journal of Accounting Research, 28: 110-140.

50
Shleifer, A., & Wolfenzon, D. 2002. Investor Protection and Equity Markets. Journal of Financial Economics, 16: 3-28.