auditor-general’s report on the financial statements of ... · no. 4 of 2013-14...
TRANSCRIPT

Strive • Lead • Excel | To Make a Difference
Report of the Auditor-General No. 4 of 2013-14Auditor-General’s Report on the Financial Statements of State entities
Volume 3 Part ILocal Government Authorities 2012-13
December 2013
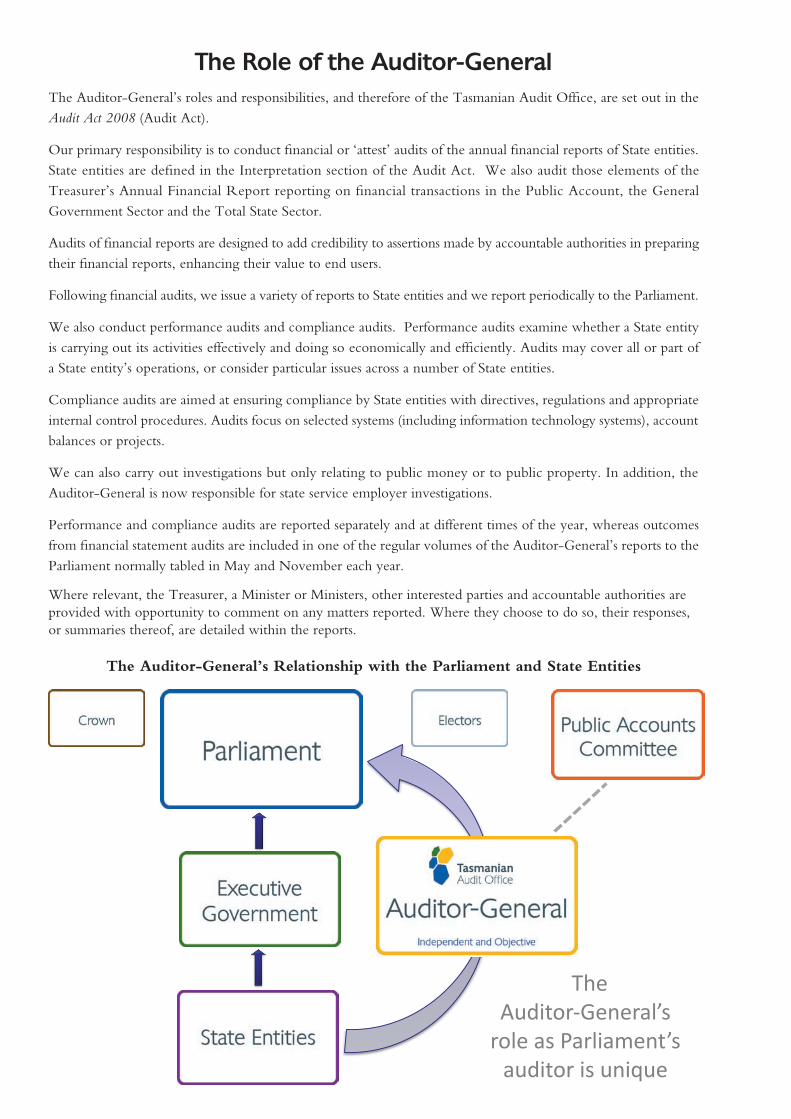
The Role of the Auditor-GeneralThe Auditor-General’s roles and responsibilities, and therefore of the Tasmanian Audit Office, are set out in the Audit Act 2008 (Audit Act).
Our primary responsibility is to conduct financial or ‘attest’ audits of the annual financial reports of State entities. State entities are defined in the Interpretation section of the Audit Act. We also audit those elements of the Treasurer’s Annual Financial Report reporting on financial transactions in the Public Account, the General Government Sector and the Total State Sector.
Audits of financial reports are designed to add credibility to assertions made by accountable authorities in preparing their financial reports, enhancing their value to end users.
Following financial audits, we issue a variety of reports to State entities and we report periodically to the Parliament.
We also conduct performance audits and compliance audits. Performance audits examine whether a State entity is carrying out its activities effectively and doing so economically and efficiently. Audits may cover all or part of a State entity’s operations, or consider particular issues across a number of State entities.
Compliance audits are aimed at ensuring compliance by State entities with directives, regulations and appropriate internal control procedures. Audits focus on selected systems (including information technology systems), account balances or projects.
We can also carry out investigations but only relating to public money or to public property. In addition, the Auditor-General is now responsible for state service employer investigations.
Performance and compliance audits are reported separately and at different times of the year, whereas outcomes from financial statement audits are included in one of the regular volumes of the Auditor-General’s reports to the Parliament normally tabled in May and November each year.
Where relevant, the Treasurer, a Minister or Ministers, other interested parties and accountable authorities are provided with opportunity to comment on any matters reported. Where they choose to do so, their responses, or summaries thereof, are detailed within the reports.
The Auditor-General’s Relationship with the Parliament and State Entities
The Auditor-General’s
role as Parliament’s auditor is unique

1
2013 PARLIAMENT OF TASMANIA
REPORT OF THE AUDITOR-GENERAL No. 4 of 2013-14
Volume 3 Part I
Local Government Authorities 2012-13
DECEMBER 2013
Presented to both Houses of Parliament in accordance with the requirements ofSection 29 of the Audit Act 2008
2013 (No. 33)
2
© Crown in Right of the State of Tasmania December 2013
Auditor-General’s reports are available from the Tasmanian Audit Office, Hobart. This report and other recent reports published by the Office can be accessed via the Office’s home page. For further information please contact:
Tasmanian Audit Office
GPO Box 851 Hobart TASMANIA 7001
Phone: (03) 6226 0100, Fax (03) 6226 0199
Email: [email protected]
Home Page: http://www.audit.tas.gov.au
ISSN 1327 2608

3
H M Blake Auditor-General
9 December 2013
President Legislative Council HOBART
Speaker House of Assembly HOBART
Dear Mr President
Dear Mr Speaker
Report of the Auditor-General No. 4 of 2013-14, Auditor-General’s Report on the Financial Statements of State entities, Volume 3 – Local Government Authorities 2012-13.
In accordance with the requirements of Section 29 of the Audit Act 2008, I have pleasure in presenting my Report on the audit of the financial statements of Local Government Authorities for the year ended 30 June 2013.
Yours sincerely
Level 4, Executive Building, 15 Murray Street, Hobart, Tasmania, 7000Postal Address GPO Box 851, Hobart, Tasmania, 7001
Phone: 03 6226 0100 | Fax: 03 6226 0199Email: [email protected]
Web: www.audit.tas.gov.au
To provide independent assurance to the Parliament and Community on the performance and accountability of the Tasmanian Public sector.Professionalism | Respect | Camaraderie | Continuous Improvement | Customer Focus
Strive | Lead | Excel | To Make a Difference
4 Foreword
foreword
This Volume details findings from financial audits of 29 local government councils for the year ended 30 June 2013 and our assessments of their financial sustainability. Also included are outcomes from our audits of the financial statements of five local government joint authorities.
In the Tasmanian context, local government councils manage significant revenues, expenditures and investments in infrastructure. In the year ended 30 June 2013, operating revenues totalled $680.175m, operating expenses $687.722m, investment in new assets was $222.084m and physical non-current assets at 30 June 2013 were $6.578bn. Cash holdings totalled $427.180m.
In addition, the five local government joint authorities in the year ended 30 June 2013 had Total Revenue $20.742m, Total Expenses $19.825m, Total Assets $24.961m and Total Liabilities $13.155m. Cash holdings totalled $6.899m.
My assessments as to financial sustainability were based on financial performance, asset management and liquidity related ratios and governance aspects as these relate to audit committees and long-term asset and financial management plans. My conclusion, as in the previous year, was that financial sustainability is improving, however there are still too many councils incurring operating deficits. Governance arrangements were also improving, this year four new audit committees were formed and four councils, which previously had no long-term management plans, implemented such plans. Overall, asset management continues to improve and at 30 June 2013 liquidity of all councils was strong.
H M Blake Auditor-General 9 December 2013

5Table of Contents
Table of ConTenTs
foreword 4
key poinTs 7
inTroduCTion 17
parT i
areas of audiT aTTenTion 20
loCal governmenT finanCial susTainabiliTy 23
loCal governmenT ComparaTive analysis 40
loCal governmenT joinT auThoriTies 50
Copping Refuse Disposal Site Joint Authority 50Dulverton Regional Waste Management Authority 54Cradle Coast Authority 57Southern Tasmanian Councils Authority 60Southern Waste Strategy Authority 62
Appendix 1 - Guide to Using this Volume 64Appendix 2 - Glossary 71Appendix 3 - Acronyms and Abbreviations 81Appendix 4 - Recent Reports 83
Vision and Purpose 84
parT ii
major CounCils 6
Clarence City Council 7Glenorchy City Council 19Hobart City Council 30Launceston City Council 41
medium CounCils 52
Brighton Council 53Burnie City Council 66Central Coast Council 80Derwent Valley Council 90
6 Table of Contents
Devonport City Council 100Huon Valley Council 111Kingborough Council 120Meander Valley Council 132Northern Midlands Council 141Sorell Council 150Waratah-Wynyard Council 160West Coast Council 171West Tamar Council 180
small CounCils 190
Break O’ Day Council 191Central Highlands Council 202Circular Head Council 212Dorset Council 222Flinders Council 232George Town Council 243Glamorgan Spring Bay Council 253Kentish Council 265King Island Council 276Latrobe Council 286Southern Midlands Council 296Tasman Council 306
Appendix 1 - Guide to Using this Volume 316Appendix 2 - Glossary 323Appendix 3 - Acronyms and Abbreviations 333Appendix 4 - Recent Reports 335
Vision and Purpose 336

7Key Points
key poinTsThis summary below notes the key points in this Report.
page
parT i
local government financial sustainability 23
Too many councils continue to report operating deficits as evidenced by:
• the consolidated (all councils) average (over the past seven years) Operating surplus ratio was below our benchmark of zero with 15 councils averaging less than zero over this period
• in 2012-13 the 29 councils generated combined net operating deficits of $7.547m with 16 councils reporting deficits totalling $15.871m.
• We recommend all Councils develop plans with the objective of achieving positive Operating surplus ratios.
From an asset management perspective the situation is stronger with:
• councils expending on average 90% of their depreciation expense on existing non-current assets, less than our 100% benchmark but improving
• all but seven councils having prepared long-term asset management and long-term financial management plans
• for those councils with such plans, five recorded Asset renewal funding ratios lower than our 90% benchmark
• Road asset consumption ratios were better than our 60% ratio benchmark.
Collectively councils reported low financial sustainability risk from a liquidity perspective as evidenced by combined Net financial liabilities ratios significantly better than our benchmark of negative 50%.
Governance arrangements also improved with 12 (eight in 2011-12) having established audit committees.
local government Comparative analysis 40
Demographics - as noted in previous years, rural councils can face difficulties in providing and maintaining services because they do not have access to the higher ratepayer base of larger councils and in some cases they manage large road networks.
Employee costs:
• the 29 councils employed 3 417 (2011-12, 3 365) FTEs at 30 June 2013 and incurred employee costs of $259.074m ($252.224m) for the financial year
• at 30 June 2013, the amount of annual, long service and some sick leave accrued by the 29 councils totalled $60.317m ($57.215m).
Statements of Comprehensive Income:
• on an ‘underlying’ basis, for the year ended 30 June 2013 councils recorded a combined Underlying Deficit of $7.547m (2011-12, $13.419m Underlying Deficit). Sixteen councils recorded a net Underlying Deficit for the 2012-13 financial year of $15.871m
• revenue raising capacities - the 29 councils raised $405.950m ($384.179m) in rates for the 2012-13 year, an increase of 5.6%,
• depreciation coverage - the ratio of depreciation to operating revenues for the 29 councils was 25.2% (26.4%).

8 Key Points
Management of working capital - all councils managed their working capital (Total Current Assets less Total Current Liabilities) effectively in 2012-13 and were capable of meeting short-term commitments.
Management of infrastructure and other non-current assets – councils manage Total Non-Current Assets amounting to $8.621bn (2011-12, $8.488bn), and in 2012-13 payments made by councils for Property, plant and equipment totalled $222.084m.
Management of debt - all councils with debt were comfortably able to meet their loan interest charges. Seven councils had no debt at 30 June 2013.
Collection of rates - rate debts owing to councils at 30 June 2013 totalled $15.289m (2011-12, $13.341m) with an average per council of $.527m ($0.460m).
loCal governmenT joinT auThoriTies 50
Copping refuse disposal site joint authority 50
The Authority recorded an Underlying Profit of $0.907m, an improvement on the previous year.
Key developments in 2012-13 included:
• revenue recorded a very large increase to $6.945m, due to additional tonnage received resulting from the January bushfires in Southern Tasmania
• expenditure also increased markedly, to $6.039m, in large part due to a new provision for landfill cell capping
• participating councils provided an equity injection of $1.300m.
dulverton regional waste management authority 54
The Authority achieved a strong Underlying Profit of $1.555m in 2012-13.
Burnie City Council became a customer in October 2012, which led to a sizeable increase in waste management and fees revenue.
It failed to comply with the requirement of Section 17(1) of the Audit Act 2008 by submitting its financial statements seven days late.
The Authority expects that by 2014 it will have established infrastructure to capture 50% of its landfill emissions. It anticipates being able to minimise overall landfill emissions below the 25 000 tonne annual threshold within the Clean Energy Act 2011 and avoid the payment of a carbon price. Emissions are not expected to exceed the threshold prior to installation of a gas capture system.
Cradle Coast authority 57
The Authority recorded a Net Deficit of $0.351m.
Cash decreased by $0.542m to $2.174m primarily due to completion of the Caring for Our Country and the Healthy Communities grant programs.
It borrowed $0.550m to fund Leasehold improvements at its new offices.
The Authority failed to comply with the requirement of Section 17(1) of the Audit Act 2008 by submitting its financial statements sixty days late.

9Key Points
southern Tasmanian Councils authority 60
The Authority reported a Net Deficit of $0.033m in 2012-13 and its Net Assets totalled $0.354m.
A number of projects were completed, or were nearing completion, during the year resulting in a decrease in the Authority’s grant revenue and a reduction in consulting and professional fees.
southern waste strategy authority 62
The Authority achieved improved financial results mainly because of the completion of two internally funded projects in respect of which most costs were incurred in the prior year.
parT ii
major CounCils 6
Clarence City Council 7
Council’s underlying result improved to a surplus of $1.008m this year.
Its net result, a deficit of $17.235m, was significantly influenced by the write-off of third party assets.
At 30 June 2013 Total Assets were $634.516m and Net Assets amounted to $625.007m.
Council was at moderate sustainability risk from asset management and financial operating perspectives but low sustainability risk from net financial liability and governance perspectives.
Road assets were adjusted for a prior period error by an amount of $26.223m.
Council re-assessed its accounting policy in relation to recognition of assets leased to other parties on a long-term basis resulting in derecognition of Bellerive Oval, $24.062m, and assets leased to the Copping Refuse Disposal Site Joint Authority, $2.691m.
glenorchy City Council 19
Council reported an Underlying Deficit in 2012-13, consistent with budget.
A Net Surplus was achieved after accounting for Capital funding and Contributions of non-current assets.
Over the four year period under review Council consistently reported an Underlying Deficit and a negative operating margin.
At 30 June 2013, Total Assets were $740.416m and Net Assets amounted to $715.329m.
Council was at moderate risk from a financial operating and asset management perspective but low financial sustainability risk from net financial liabilities and governance perspectives.
Council engaged consulting engineers to establish a close-out timetable and costs for the Jackson Street Waste Management Centre. The provision for restoration was updated accordingly.

10 Key Points
hobart City Council 30
Council’s underlying result improved from deficits in the past three years to a surplus of $0.651m in the current year.
Its net result for the year, a deficit of $2.247m, was significantly influenced by the net loss on sale of Property, plant and equipment of $1.396m (mainly Argyle Street Car Park land), the impairment from closure of the asphalt plant, $0.930m, and the transfer of $1.644m in grant funds to another council for upgrading and replacing street lighting with energy efficient lighting.
At 30 June 2013, Council had Total Assets of $1.004bn and its Net Assets amounted to $949.096m.
Council was at low financial sustainability risk from asset management, net financial liabilities and governance perspectives and moderate risk from a financial operating perspective.
Key developments for the year included completion of the $15.000m Argyle Street Car Park redevelopment and entering into a 20 year lease for Trafalgar Car park.
launceston City Council 41
Despite reporting an Underlying Deficit of $1.037m, Council improved its financial performance this year and performed better than budget.
Over the period under review, Council budgeted for Underlying Deficits.
At 30 June 2013, Total Assets were $1.492bn and Net Assets amounted to $1.445bn.
Council was at moderate financial sustainability risk from a financial operating perspective and low financial sustainability risk from governance, asset management and net financial liabilities perspectives.
Key developments included continuation of the Invermay Flood Protection Enhancement Project, the possibility of a future charge from TasWater relating to the combined sewerage and stormwater system and a possible future liability under the carbon pricing legislation.
medium CounCils 52
brighton Council 53
Council recorded an Underlying Surplus of $0.597m.
At 30 June 2013, Net Assets were $191.405m.
It was at low financial sustainability risk from net financial liabilities, asset management and financial operating perspectives but moderate financial sustainability risk from a governance perspective.
Brighton Industrial and Housing Corporation, a wholly owned subsidiary, commenced operating in July 2012 and recorded a profit of $0.185m. Commissions paid in relation to land sales amounted to $0.045m.
Council establishing an audit committee and received $0.850m from the Australian Government to assist with financing the construction of a new medical centre. The project was partly funded by Council.
11Key Points
burnie City Council 66
Council recorded Underlying Deficits in the past two years and it budgeted for a deficit result in 2012-13.
At 30 June 2013, Total Assets were $364.793m and Net Assets amounted to $353.783m.
Its subsidiaries Burnie Airport Corporation Unit Trust and Tas Communications Unit Trust recorded profits of $0.164m and $0.151m respectively.
Council was at a moderate sustainability risk from financial operating, governance and asset management perspectives but low sustainability risk from a net financial liabilities perspective.
Key developments included the construction of the Burnie Waste Transfer Station and Resource Recovery Centre, and a major stormwater improvement project.
Central Coast Council 80
Council’s Underlying Surplus improved over the four-year period, with Council achieving a close to break-even result in 2012-13.
At 30 June 2013, Net Assets were $431.714m.
It was at moderate sustainability risk from governance and financial operating perspectives, but low sustainability risk from net financial liabilities and asset management perspectives.
derwent valley Council 90
Council generated an Underlying Surplus of $0.259m in 2012-13. This was slightly better than 2011-12 and continued a trend of improved results over the past four years.
It reported Net Surpluses in all four years under review.
At 30 June 2013, Net Assets were $97.101m.
Council was at a high sustainability risk from a governance perspective, moderate risk from a financial operating perspective but at low risk from net financial liabilities and asset management perspectives.
devonport City Council 100
While still in deficit, Council recorded a much improved, and almost break-even, Underlying Deficit this year which was in line with budget.
At 30 June 2013, Total Assets were $473.483m and Net Assets amounted to $447.902m.
Council was at moderate financial sustainability risk from a financial operating, asset management and governance perspective but low financial sustainability risk from a net financial liabilities perspective.
huon valley Council 111
Council’s Underlying Surplus decreased to $0.552m in 2012-13.
Its Net Surplus for the year, $2.172m, was influenced by Capital grants and Infrastructure take-ups. The result was consistent with budget.
12 Key Points
At 30 June 2013, Net Assets were $223.430m.
Council was at moderate sustainability risk from a governance and asset management perspective but low financial sustainability risk from financial operating and net financial liabilities perspectives.
kingborough Council 120
Council’s underlying result improved this year to a deficit of $2.725m.
It has incurred Underlying Deficits in each of the four years under review with the average deficit being $3.193m.
Council recorded a Net Surplus of $0.519m this year, better than the underlying result due to Capital grants received, Contributed assets received and revision to the amount of the Barretta Tip Rehabilitation provision.
At 30 June 2013, Net Assets were $594.574m.
Council was at a high sustainability risk from a financial operating perspective, moderate risk from asset management and governance perspectives but low financial sustainability risk from a net financial liabilities perspective.
meander valley Council 132
Council recorded Underlying Surpluses in each of the four years under review with the 2012-13 Underlying Surplus being $0.684m.
At 30 June 2013, Net Assets were $279.011m.
It was at moderate sustainability risk from governance perspective but low financial sustainability risk from financial operating, asset management and net financial liabilities perspectives.
We noted the use of a 100% residual value on unsealed roads the impact of which in 2012-13 was to lower Depreciation expense by approximately $0.188m.
northern midlands Council 141
Despite reporting an Underlying Deficit of $0.083m, Council improved its financial performance this year but performed below budget.
At 30 June 2013, Net Assets were $263.659m.
Council was at moderate sustainability risk from governance and financial operating perspectives but low risk from asset management and net financial liabilities perspectives.
sorell Council 150
Council recorded an Underlying Surplus of $1.027m which was an improvement on the previous year and better than budget.
At 30 June 2013, Net Assets were $216.501m.
It was at low financial sustainability risk from financial operating, net financial liabilities and asset management perspectives and high financial sustainability risk from a governance perspective.

13Key Points
Major developments for the year included:
• Council commenced construction of its new council chambers
• receipt of Commonwealth funding, $0.650m, for the construction of a new doctors surgery
• Council incurred expenditure on the Tasmanian bushfires during the year and receivables at 30 June 2013 increased due to this.
waratah-wynyard Council 160
Council recorded Underlying Deficits in three of the four years under review and budgeted for deficit in each of these years.
At 30 June 2013, Net Assets were $176.087m.
Council was at moderate risk from governance, financial operating and asset management perspectives and low sustainability risk from a net financial liabilities perspective.
Council completed a $1.650m redevelopment of Wynyard Wharf which was officially opened on 13 October 2013.
west Coast Council 171
Council recorded an Underlying Surplus of $0.168m. Council had reported an Underlying Surplus in all four years under review.
Council was at a high sustainability risk from a governance perspective but low risk from asset management, financial operating and net financial liabilities perspectives.
west Tamar Council 180
Council consistently recorded Underlying Surpluses over the four-year period of review.
At 30 June 2013, Net Assets were $262.865m.
It was at a moderate sustainability risk from a governance and asset management perspective, but low sustainability risk from financial operating and net financial liabilities perspective.
small CounCils 190
break o’ day Council 191
Council reported an Underlying Deficit of $1.524m, an improvement on the Underlying Deficit in 2011-12 of $3.224m.
At 30 June 2013, Net Assets were $149.713m.
It was at high sustainability risk from a financial operating and governance perspective, moderate risk for asset management and low risk from a net financial liabilities perspective.
Major variations between the 2012-13 and 2011-12 included a reduction in grants of $3.427m, as a result of the 2011-12 including significant one-off amounts relating to flood compensation claims. Similarly, there was a substantial decrease in materials and services expenses of $3.916m in comparison to 2011-12, due to major flood remediation works required in that year.
14 Key Points
The organisational restructure implemented in 2012 took effect throughout 2012-13, with significant savings in Employee costs and outsourcing of the operation of waste transfer stations.
Borrowings of $1.300m were taken out during the year to finance major infrastructure works.
Central highlands Council 202
Council recorded an Underlying Deficit of $1.386m in 2012-13, an improvement on the prior period but worse than budget.
At 30 June 2013, Net Assets were $141.832m.
It was at high financial sustainability risk from a financial operating perspective, moderate risk from governance and asset management perspectives and low risk from a net financial liabilities perspective.
Key developments in the year included a rates remodelling exercise, aimed at ensuring compliance with the amended Local Government Act 1993, and approval of long-term asset and financial plans.
Circular head Council 212
Council recorded an Underlying Deficit of $0.537m in 2012-13.
It reported a Net Surplus of $4.185m and its Comprehensive Surplus was $9.012m.
At 30 June 2013, Net Assets were $156.803m.
Council was at moderate sustainability risk from asset management, financial operating and governance perspectives and at low risk from a net financial liabilities perspective.
Council was in discussion with Waratah-Wynyard Council to renew the resource sharing arrangement which is due to expire in 2013-14.
Major financial impacts included the recognition of $2.760m of stormwater assets and an impairment reversal of $0.697m on its collateralised debt obligations.
dorset Council 222
Council recorded its first Underlying Deficit since 2007-08 in the current financial year.
At 30 June 2013, Net Assets were $177.713m.
It was at moderate risk from a governance perspective but low financial sustainability risk from a financial operating, asset management and net financial liabilities perspective.
flinders Council 232
Council recorded an Underlying Deficit of $0.459m which was an improvement on the previous year and better than budget.
At 30 June 2013, Net Assets were $88.847m.
It was at high sustainability risk from a financial operating perspective, low risk from net financial liabilities perspective but moderate risk from asset management and governance perspectives.
15Key Points
george Town Council 243
Council’s underlying results improved over the period under review, with Underlying Surpluses in both 2011-12 and 2012-13.
At 30 June 2013, Net Assets were $117.490m.
It was at moderate sustainability risk from governance and financial operating perspectives and low risk from an asset management and net financial liabilities perspective.
Key developments this year included Council moving to the capital value methodology for assessing rates and completing the construction of the $1.480m Egg Island Creek Bridge.
glamorgan spring bay Council 253
Council recorded an Underlying deficit for the year of $0.717m.
At 30 June 2013, Net Assets were $110.272m.
Although Council submitted financial statements by the due date, they were not complete in all material respects and were returned to Council.
It was at high risk from a governance perspective, moderate financial sustainability risk from an asset management perspective and low risk from financial operating and net financial liabilities perspectives.
Council provided administration services for the health and medical Centres in Bicheno and Triabunna from July 2012 costing $0.245m and acquired the Spring Bay child care centre from Spring Bay Childcare Inc.
New loans of $1.200m were needed to fund the Triabunna Marina development.
kentish Council 265
Council reported an Underlying Surplus this year and performed slightly better than forecast.
At 30 June 2013, Net Assets were $98.399m.
It was at high sustainability risk from a governance perspective, moderate risk from an asset management perspective and low risk from financial operating and net financial liabilities perspectives.
We were not able to compute an Asset renewal funding ratio as Council’s long-term asset management plan did not provide sufficient information on future infrastructure costs.
king island Council 276
Council reported an Underlying Deficit of $0.524m, which was an improvement on the previous year.
At 30 June 2013, Net Assets were $69.624m.
It wrote-off waste disposal assets totalling $0.456m this year.
Council was at high sustainability risk from a governance perspective, moderate risk from financial operating and asset management perspectives, but low risk from a net financial liabilities perspective.

16 Key Points
During the year, Council approved two new golf course developments which resulted in higher revenue from planning application fees.
latrobe Council 286
In 2012-13, Council recorded an Underlying Surplus of $0.851m.
At 30 June 2013, Net Assets were $164.576m.
Council was at moderate risk from governance and asset management perspectives but low financial sustainability risk from financial operating and net financial liabilities perspectives.
It failed to comply with the requirement of Section 17(1) of the Audit Act 2008 by submitting its financial statements six days late.
southern midlands Council 296
Council recorded an Underlying Deficit of $0.553m, the fourth consecutive year of underlying deficits.
At 30 June 2013, Net Assets were $101.193m.
It was at a high sustainability risk from a financial operating perspective, moderate risk from asset management and governance perspectives, but low sustainability risk from a net financial liabilities perspective.
Tasman Council 306
Council generated an Underlying Surplus of $0.513m.
At 30 June 2013, Net Assets were $47.132m.
While performing a stocktake, Council discovered assets to the value of $0.539m that were no longer held by it resulting in these assets being written-off.
It was at moderate financial sustainability risk from governance and asset management perspectives and low risk from operating and net financial liabilities perspectives.
A major development in 2013 was the Tasmanian bushfire natural disaster which occurred in January 2013. Council incurred additional costs in relation to this but was reimbursed by the Red Cross and through the Tasmanian Disaster Relief and Recovery Arrangements. This impacted on Total Revenue and Total Expenses but the net financial impact was minimal.

17Introduction
inTroduCTion
This Report deals with the outcomes from completed financial statement audits of Local Government Authorities reporting for the financial year ended 30 June 2013.
The Report also contains the outcomes from completed financial statement audits of five Local Government Joint Authorities for the financial year ended 30 June 2013.
In addition, Chapters on areas of audit attention, financial sustainability and comparative analysis covering all councils are included.
Our Report includes details of matters raised with entity management during the course of audits. The rationale for inclusion or otherwise rests on our perception of the public interest in each point and the need to confine comments to those matters that have more than a managerial dimension.
All councils were given the opportunity to provide us with comments, for inclusion in their respective Chapters, on our ‘Conclusions as to financial sustainability’. Their comments have been included where received. Comments provided are not subject to the audit nor the evidentiary standards required in reaching an audit conclusion. Responsibility for the accuracy, fairness and balance of these comments rest solely with those who provided the response or comment.
formaT of The reporTUnless specifically indicated, comments in this Report were current as at 26 November 2013.
In addition to this Introduction, this Report includes:
• Part I:
○ Key Points
○ Areas of Audit Attention
○ Local Government Financial Sustainability
○ Local Government Comparative Analysis
○ Local Government Joint Authorities
• Part II:
○ Local Government Councils categorised as:
- major councils
- medium councils
- small councils.
We changed the format and contents of chapters this year to shorten the commentary and provide a high level summary of key information.
The revised Report differs in the following main respects:
• snapshot summary of key points at the beginning of each Chapter
• concise outline of key developments and audit findings
• key areas of audit attention and how we addressed those areas during the audit
• greater use of charts to display information previously presented in textual format
• financial statements and analysis tables moved into Chapter Appendices.
18 Introduction
Individual chapters were structured as follows:
• a snapshot of the entity
• introduction* or subsidiary entities (where applicable)
• key areas of audit attention
• audit of the 2012-13 statements
• key findings
• key developments
• assessment of financial sustainability
• analysis of financial performance, concentrating on underlying result and underlying budget
• analysis of financial position reviewing total assets and net assets
• appendices covering the statements of comprehensive income, financial position, cash flows and key financial ratios*.
*An introduction was used only for Local Government Joint Authorities.
presenTaTion of finanCial informaTion - CounCilsThe review and analysis of the financial statements of councils covers the Statement of Comprehensive Income, Statement of Financial Position, Statement of Cash Flows and Financial Analysis. Our review of the financial statements usually covers four financial periods, which represents council operations after the transfer of responsibilities for water and sewerage activities.
The financial analysis section of each Chapter also includes an examination of four years of data.
We also note our decision to re-format the Comprehensive Income Statements by including:
• interest revenue and finance costs as part of Total Revenue and Total Expenses respectively.
This year we also reported an Underlying Surplus (Deficit) rather than Net Operating Surplus (Deficit).
In our analysis of financial performance we have, if necessary, reallocated certain revenue or expenditure items to better assist readers to interpret financial performance. We use the term ‘Underlying Surplus (Deficit)’ throughout the Report. We define ‘underlying’ as from continuing operations, excluding:
• non-operational capital funding
• revenue and expenses which are outside the normal course of operations, for example the cost of restructuring or significant gains or losses on sale or transfer of assets
• non-recurring items which are part of recurrent activities but unusual due to their size and nature.
As in previous years, we have disclosed Financial Assistance Grants based on the actual allocation for each financial year, not on a cash receipt basis. The offsets of grants in advance have been included below the Underlying Surplus (Deficit) in the Statement of Comprehensive Income.
finanCial susTainabiliTy raTiosThe ratios applied in assessing the financial sustainability of councils have remained unchanged from our 2012 Report. While not a ratio, we have continued assessing applicable governance arrangements and criteria to assess financial sustainability. Details of the ratios, governance arrangements considered and criteria are outlined in the Chapter headed ‘Local Government Financial Sustainability’.

19Introduction
norThern Tasmanian regional developmenT board lTdThe previous report contained an individual Chapter on the Northern Tasmanian Regional Development Board Ltd. This year, this Chapter has been omitted as further inquiry concluded the company was not a State entity. However, an audit was still conducted, but on an arrangements basis.

20 Areas of Audit Attention
areas of audiT aTTenTion
inTroduCTionWhen planning council audits we consider a number of matters including:
• items reported by us in prior years
• matters that affect council operations from an industry and business perspective, or from operational developments within each council.
These and other factors influence audit plans and identification of areas for particular audit attention. In almost all cases, there are common areas requiring audit attention and these are noted in this Chapter.
Areas of particular audit attention relating to specific councils are addressed in individual Chapters and are not repeated here.
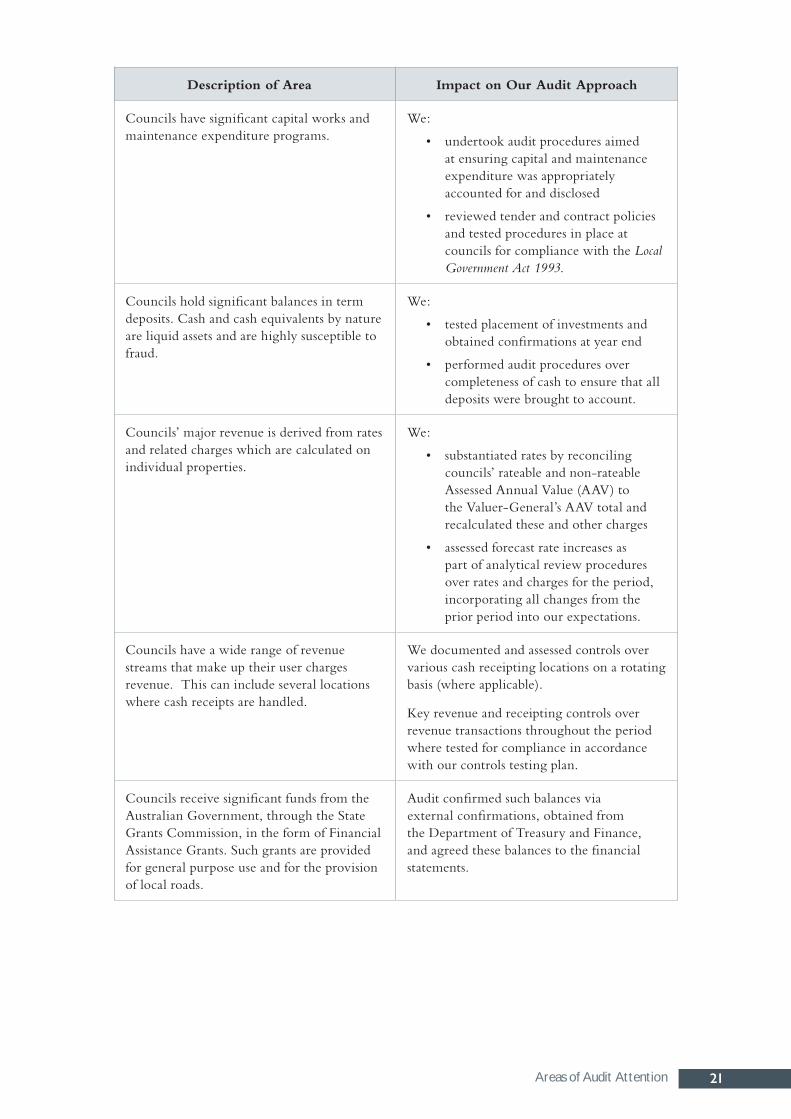
The following table summarises those common areas of audit attention and the associated impact on our audit approach.
Common areas of audiT aTTenTion
Description of Area Impact on Our Audit Approach
Property, plant and equipment include material long-life infrastructure assets recorded at fair value.
Revaluations require estimations, judgments and complex calculations. There is a risk of material misstatement of assets and depreciation as a result of this process.
Useful lives of assets and consequent depreciation policies can have a significant impact upon annual financial results.
We tested:
• valuation reports, calculations and underlying assumptions supporting fair values of assets
• the qualifications of those persons conducting valuations to ensure appropriate independent expertise and assessed the extent to which management reviewed and challenged their work
• reconciliation of asset registers to general ledgers. This included audit of additions and disposals to ensure completeness and accuracy.
Depreciation rates and useful lives of assets were reviewed to ensure that depreciation calculations were accurately recorded within both the asset register and general ledger and that depreciation policies were standards compliant.
21Areas of Audit Attention
Description of Area Impact on Our Audit Approach
Councils have significant capital works and maintenance expenditure programs.
We:
• undertook audit procedures aimed at ensuring capital and maintenance expenditure was appropriately accounted for and disclosed
• reviewed tender and contract policies and tested procedures in place at councils for compliance with the Local Government Act 1993.
Councils hold significant balances in term deposits. Cash and cash equivalents by nature are liquid assets and are highly susceptible to fraud.
We:
• tested placement of investments and obtained confirmations at year end
• performed audit procedures over completeness of cash to ensure that all deposits were brought to account.
Councils’ major revenue is derived from rates and related charges which are calculated on individual properties.
We:
• substantiated rates by reconciling councils’ rateable and non-rateable Assessed Annual Value (AAV) to the Valuer-General’s AAV total and recalculated these and other charges
• assessed forecast rate increases as part of analytical review procedures over rates and charges for the period, incorporating all changes from the prior period into our expectations.
Councils have a wide range of revenue streams that make up their user charges revenue. This can include several locations where cash receipts are handled.
We documented and assessed controls over various cash receipting locations on a rotating basis (where applicable).
Key revenue and receipting controls over revenue transactions throughout the period where tested for compliance in accordance with our controls testing plan.
Councils receive significant funds from the Australian Government, through the State Grants Commission, in the form of Financial Assistance Grants. Such grants are provided for general purpose use and for the provision of local roads.
Audit confirmed such balances via external confirmations, obtained from the Department of Treasury and Finance, and agreed these balances to the financial statements.

22 Areas of Audit Attention
Description of Area Impact on Our Audit Approach
Various staff within councils are able to place orders for goods and services under various delegation limits and centralised payment processing systems. These arrangements require effective internal controls including separation between ordering and approval processes.
Audit testing included:
• detailed analytical procedures performed over expenditure accounts against prior year and budget
• understanding key controls over payment and expenditure transactions and subjecting these to audit tests throughout the period.
Councils employ a large number of employees, on differing rates of pay, and employee expenses is a significant expenditure item. A number of employees complete timesheets which increases the complexity of the payroll process.
Audit testing included:
• detailed analytical procedures performed over wages and salary accounts, based upon average full time equivalent employees numbers
• verifying that key controls over payroll transactions operated with throughout the period.
Annual leave and long service leave (LSL) balances are material in most councils. Calculations of LSL liabilities are based on a number of assumptions and, where applicable, discounting is applied.
Employee provisions calculations were tested for accuracy and reasonableness. We also tested the allocation between current and non-current liabilities.
Councils process a number of journal entries within their finance systems to manage transactions, adjust account balances or correct misallocations.
Audit tested a sample of general journals posted throughout the year, and at year end to ensure that these journals represented valid transactions and were supported by adequate documentation.
23Local Government Financial Sustainability
loCal governmenT finanCial susTainabiliTy
snapshoT• Fifteen of the 29 councils, over the seven year period of review, had an average Operating
surplus ratio below benchmark, which is too high.
• While there was an improvement in the average Asset sustainability ratio over the period under review, at a total councils level, in general, councils under-invested capital expenditure on existing assets.
• Twenty two councils had developed long-term asset management and financial management plans, an improvement on the previous year.
• There was improvement in the level of service potential available in Council’s road infrastructure assets. At 30 June 2013, no council was at high risk with road assets having sufficient capacity to provide services to rate payers.
• All councils were in a position where they were able to service their current commitments, had manageable debt levels and capacity to borrow should the need arise.
• Councils in general had a high financial sustainability risk from a governance perspective, moderate financial sustainability risk from financial operating and asset management perspectives but low risk from a net financial liabilities perspective.
inTroduCTionIn Report of the Auditor-General No 1 issued in June 2010, we included, for the first time, an analysis of the financial sustainability of councils by applying five selected financial ratios assessed over a four year period. Similar analysis has been completed since then with this Report, where relevant, covering a seven year period.
The ratios analyse councils’ operating results, asset management practices and net financial liabilities (liquidity) over the seven year period to 30 June 2013. However, the Asset renewal funding ratio was only calculated based on long-term financial and asset management plans, where available, since 30 June 2012.
Our assessment of financial sustainability included reviewing aspects of governance arrangements in councils. We examined whether each council had an audit (or similar) committee, and if so, the committee’s charter, internal audit arrangements if any, and long-term financial and asset management plans. However, these governance arrangements have not been subjected to audit.
Our assessments in this Volume are necessarily high level, with further detail provided in individual Chapters for each council.
indiCaTors of finanCial susTainabiliTyA generally accepted definition of financial sustainability is whether local government councils have sufficient current and prospective financial capacity to meet their current and prospective financial requirements. Therefore, to be sustainable, councils needs to have sufficient capacity to be able to manage future financial risks without having to radically adjust their current revenue or expenditure policies.
The ratios applied to assess financial sustainability were selected because they provide a set of interrelated indicators enabling self and comparative assessment. Because these ratios provide a
24 Local Government Financial Sustainability
method to analyse past results they can be helpful as indicators in forecasting and identifying trends. Therefore, councils can use ratios such as those applied here to assess their own current and future financial performance and position.
These ratios also facilitate comparative assessment between councils and can be used to assess both short-term and long-term financial sustainability. The various ratios and observations reported below are only indicators of performance or of financial position. They should not be considered in isolation. We note also that other financial sustainability ratios exist which may have relevance but which are not included.
Despite these cautions, taken together these ratios can indicate low, moderate or high financial sustainability risk. The indicators used in this Report are:
• Operating surplus ratio
• Asset sustainability ratio
• Asset renewal funding ratio
• Road asset consumption ratio
• Net financial liabilities ratio
• Governance arrangements, particularly audit committees and long-term asset and financial management plans.
In assessing financial sustainability we have considered these ratios in three groups:
• financial operating performance
• asset management
• liquidity and the extent to which net liabilities can be serviced by operating income.
Governance arrangements were assessed separately although long-term asset and financial management plans were also assessed as part of asset management.
The table following provides a description of the indicator, how it is calculated and, where applicable, a generally accepted benchmark result.
25Local Government Financial Sustainability
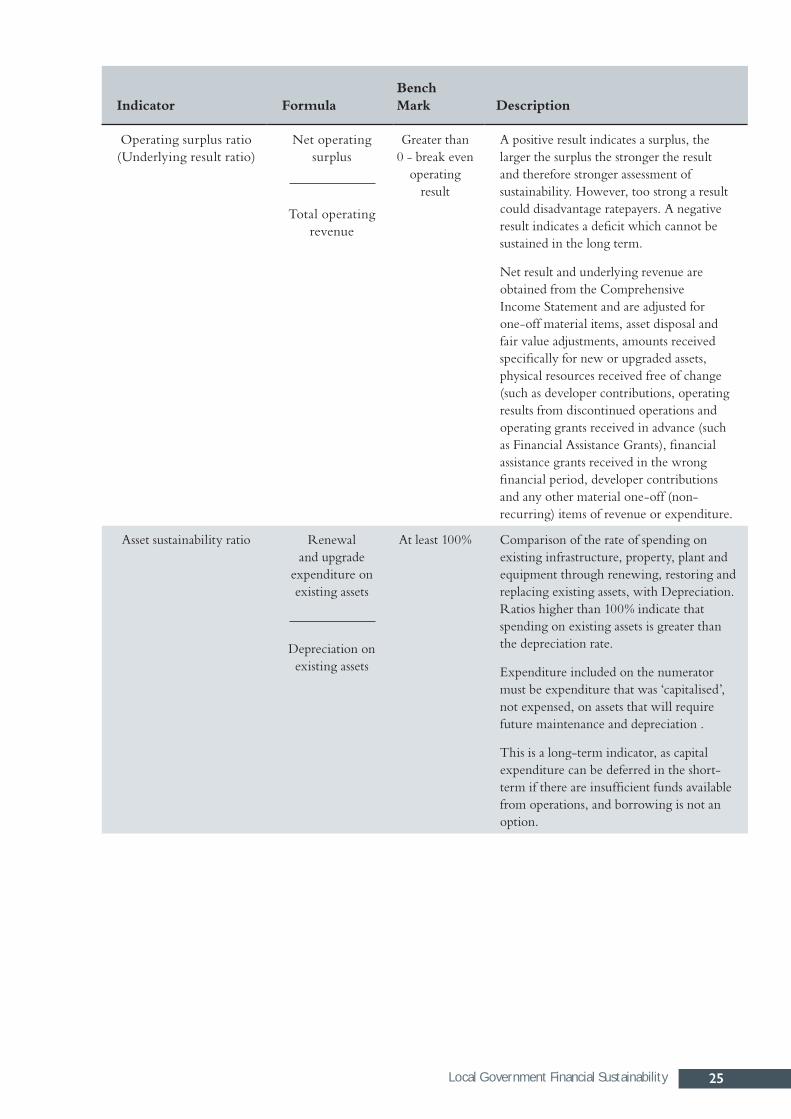
Indicator FormulaBench Mark Description
Operating surplus ratio (Underlying result ratio)
Net operating surplus
Total operating revenue
Greater than 0 - break even
operating result
A positive result indicates a surplus, the larger the surplus the stronger the result and therefore stronger assessment of sustainability. However, too strong a result could disadvantage ratepayers. A negative result indicates a deficit which cannot be sustained in the long term.
Net result and underlying revenue are obtained from the Comprehensive Income Statement and are adjusted for one-off material items, asset disposal and fair value adjustments, amounts received specifically for new or upgraded assets, physical resources received free of change (such as developer contributions, operating results from discontinued operations and operating grants received in advance (such as Financial Assistance Grants), financial assistance grants received in the wrong financial period, developer contributions and any other material one-off (non-recurring) items of revenue or expenditure.
Asset sustainability ratio Renewal and upgrade
expenditure on existing assets
Depreciation on existing assets
At least 100% Comparison of the rate of spending on existing infrastructure, property, plant and equipment through renewing, restoring and replacing existing assets, with Depreciation. Ratios higher than 100% indicate that spending on existing assets is greater than the depreciation rate.
Expenditure included on the numerator must be expenditure that was ‘capitalised’, not expensed, on assets that will require future maintenance and depreciation .
This is a long-term indicator, as capital expenditure can be deferred in the short-term if there are insufficient funds available from operations, and borrowing is not an option.

26 Local Government Financial Sustainability
Indicator FormulaBench Mark Description
Asset renewal funding ratio
Future (planned) asset replacement
expenditure
Future asset replacement expenditure
(actual) required
At least 90% Measures the capacity to fund asset replacement requirements. An inability to fund future requirements will result in revenue or expense or debt consequences, or a reduction in service levels.
This is a most useful measure relying on the existence of long-term financial (or separate asset) management plans. Where these may exist, unless they have been independently assured, they will not be used (however, we subsequently decided to accept plans as provided).
Asset consumption ratio - roads
Depreciated replacement cost
Current replacement cost
>60% Shows the depreciated replacement cost of an entity’s depreciable assets relative to their ‘as new’ (replacement) value.
It therefore shows the average proportion of new condition left in assets.
Depending on the nature of the entity’s assets, this ratio could be calculated in total and by asset class, for example roads, bridges and stormwater assets.
Net financial liabilities ratio
Liquid assets less Total liabilities
Total operating revenue
Net financial liabilities
between zero to negative
50% of operating income.
Positive ratio indicates
liquid assets in excess of total
liabilities.
The significance of net amount owed compared with the period’s income. Indicates the extent to which net financial liabilities could be met by operating income.
Where the value is falling over time, it indicates that the entity’s capacity to meet its financial obligations from operating income is strengthening.
Reasons for an increase in the net financial liabilities ratio will sometimes also result in an entity incurring higher net operating costs (e.g. from additional maintenance and depreciation costs associated with acquiring new assets). This will detract from the entity’s overall operating result.
A Council with a healthy operating surplus could quite appropriately decide to allow its net financial liabilities ratio to increase in order to provide additional services to its community through the acquisition of additional assets without detracting from its financial sustainability.

27Local Government Financial Sustainability
On the following pages we apply these ratios to the consolidated financial position of the 29 councils included in this Report, over a seven-year period and then comparatively averaging the performance of all councils. With the exception of the Asset renewal funding ratio, all data used in calculating the ratios and preparing the various graphs were sourced from audited council financial statements. Also, within the graphs, where relevant, a red line represents the actual ratio each year and a black line the benchmark for the period under review. Where we were able to assess the Asset renewal funding ratio, this was based on long-term asset and financial management plans provided but not audited.
As noted we have expanded our sustainability assessment of councils to incorporate information on governance arrangements. In conjunction with operating performance, asset management and liquidity and the extent to which net liabilities can be serviced by operating income, we consider governance further facilitates our comparative assessment between councils. The results of our review are detailed in a Governance section of this Chapter.
In making our assessment of financial sustainability, we adopted the following criteria:
Low Moderate High
Financial sustainability operating perspective
Average operating surplus over the past four year > 0
Average operating deficits between 0% and negative 10% of operating revenue over the past four years
Average operating deficits >10% of operating revenue over the past four years
Financial sustainability asset management perspective
Asset sustainability ratio >100% and average road consumption ratio > 60%
Either Asset sustainability ratio between 50% and 100% or average road consumption ratio > 40%
Asset sustainability ratio < 50% and average road consumption ratio < 40%
Financial sustainability net financial liabilities perspective
Net financial liabilities ratio > than negative 50%
Net financial liabilities ratio between (50%) and (100%)
Net financial liabilities ratio > (100%)
Financial sustainability governance perspective*
Audit Committee with an active internal audit function and both long term asset and financial management plans.
Audit committee or finance committee with no internal audit function and both long term asset and financial management plans.
No audit committee or either a long term asset management plan or financial management plan, or no plans at all.
* Weighting is placed on Audit Committees and that have an active internal audit functions as the long-term plans are not subject to audit and relate to future periods, these plans have been given less weighting in our assessment of governance.

28 Local Government Financial Sustainability
finanCial susTainabiliTy Trendsoperating surplus ratio
This ratio serves as an overall measure of financial operating effectiveness. To assure long-term financial sustainability, councils should, at a minimum, budget and operate to break-even thereby avoiding operating (also referred to as ‘Underlying’) Deficits. Doing so would enable councils to generate sufficient revenue to fulfil their operating requirements including coverage of their depreciation charges. Breaking even is represented by an operating surplus ratio of zero or greater.
Figure 1 Seven-year Operating Surplus Ratio
The average Operating surplus ratio was below the benchmark of zero in all seven years under review. The ratio declined to minus 5.0 in 2009-10 with this fall likely, in the main, to have been due to the water and sewerage reforms which were effective from 1 July 2009. A number of councils required priority dividends to overcome lost operating income.
There was a significant improvement in 2010-11, with a ratio of minus 1.2. However, the average declined to minus 2.2 in 2011-12, improved slightly this year but was still negative.
The 29 councils generated a combined net underlying deficit of $7.547m, with 16 councils generating net operating deficits totalling $15.871m.
The following table shows all councils that generated net underlying deficits in 2012-13 along with respective operating surplus ratios.
(6)
(5)
(4)
(3)
(2)
(1)
0
2007 2008 2009 2010 2011 2012 2013
Year
Operating surplus ratio - Average (All Councils)

29Local Government Financial Sustainability
Underlying Deficit
Operating Surplus Ratio
2012-13 2012-13
$'000s %Glenorchy (2 634) (4.7)Launceston (1 037) (1.2)Burnie (1 160) (3.1)Central Coast (231) (1.0)Devonport (47) (0.1)Kingborough (2 725) (8.5)Northern Midlands (83) (0.6)Waratah-Wynyard (1 990) (13.3)Break O'Day (1 524) (14.0)Central Highlands (1 386) (22.8)Circular Head (537) (4.1)Dorset (264) (2.2)Flinders (459) (10.3)Glamorgan Spring Bay (717) (6.8)King Island (524) (7.6)Southern Midlands (553) (6.4)
TOTAL (15 871)
30 Local Government Financial Sustainability
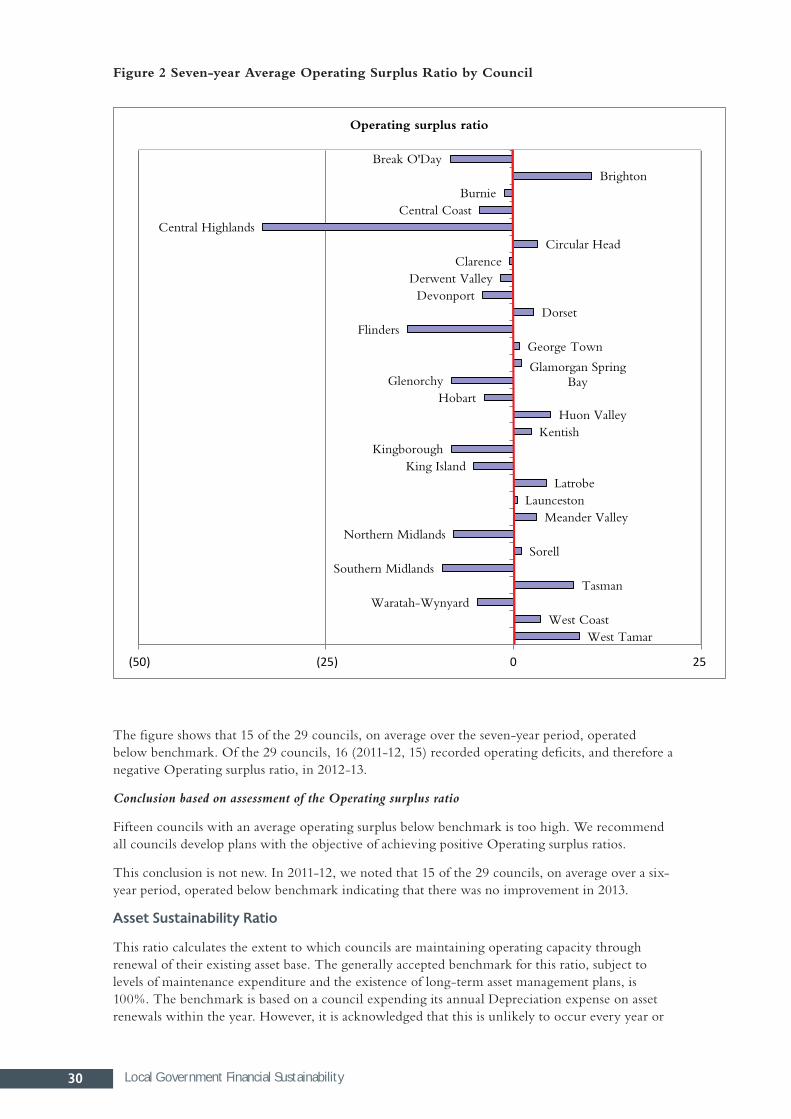
Figure 2 Seven-year Average Operating Surplus Ratio by Council
The figure shows that 15 of the 29 councils, on average over the seven-year period, operated below benchmark. Of the 29 councils, 16 (2011-12, 15) recorded operating deficits, and therefore a negative Operating surplus ratio, in 2012-13.
Conclusion based on assessment of the Operating surplus ratio
Fifteen councils with an average operating surplus below benchmark is too high. We recommend all councils develop plans with the objective of achieving positive Operating surplus ratios.
This conclusion is not new. In 2011-12, we noted that 15 of the 29 councils, on average over a six-year period, operated below benchmark indicating that there was no improvement in 2013.
asset sustainability ratio
This ratio calculates the extent to which councils are maintaining operating capacity through renewal of their existing asset base. The generally accepted benchmark for this ratio, subject to levels of maintenance expenditure and the existence of long-term asset management plans, is 100%. The benchmark is based on a council expending its annual Depreciation expense on asset renewals within the year. However, it is acknowledged that this is unlikely to occur every year or
Break O'DayBrighton
BurnieCentral Coast
Central HighlandsCircular Head
ClarenceDerwent Valley
DevonportDorset
FlindersGeorge Town
Glamorgan Spring BayGlenorchy
HobartHuon Valley
Kentish Kingborough
King IslandLatrobe
LauncestonMeander Valley
Northern MidlandsSorell
Southern MidlandsTasman
Waratah-WynyardWest Coast
West Tamar
(50) (25) 0 25
Operating surplus ratio

31Local Government Financial Sustainability
evenly over a number of years. As a result, our assessment is based on a seven-year average. It is also acknowledged that this ratio has imperfections which are addressed by the Asset renewal funding ratio discussed later in this Chapter. However, until all councils have established adequate long-term asset management and financial plans, we will continue to include the Asset sustainability ratio in our assessments of financial sustainability.
Figure 3 Average Asset Sustainability Ratio
Councils expended, on average, the equivalent of 90% of their depreciation expense on maintaining their existing non-current assets. The average annual ratio improved from 79% in 2007 to 97% in 2013 and indicates that, taken as a whole, councils improved their investment in existing assets at a level near to Depreciation charges.
60
80
100
120
2007 2008 2009 2010 2011 2012 2013
%
Year
Asset sustainability ratio - Average (All Councils)

32 Local Government Financial Sustainability
Figure 4 Seven-year Average Asset Sustainability Ratio by Council
In most cases councils failed to meet the benchmark, with only eight (2011-12, six) having an Asset sustainability ratio equal to or above 100% over the seven-year period. However, a further eight (seven) councils averaged above 90% and only two were below 60%.
Conclusion based on assessment of the asset sustainability ratio
While there was an improvement in the average ratio over the period under review at a total councils level, in general, councils under-invested capital expenditure on existing assets.
asset renewal funding ratio
This ratio measures councils’ capacity to fund future asset replacement requirements. An inability to fund future requirements will result in revenue, expenditure or debt consequences, or a reduction in service levels.
The measure relies on the existence of long-term financial and long-term asset management plans. The ratio measures planned asset replacement requirements against planned asset replacement expenditure. To maintain operating capacity, we would expect a council to fund not less than 90%
0 20 40 60 80 100 120 140 160 180
Break O'Day
Brighton
Burnie
Central Coast
Central Highlands
Circular Head
Clarence
Derwent Valley
Devonport
Dorset
Flinders
George Town
Glamorgan Spring Bay
Glenorchy
Hobart
Huon Valley
Kentish
Kingborough
King Island
Latrobe
Launceston
Meander Valley
Northern Midlands
Sorell
Southern Midlands
Tasman
Waratah-Wynyard
West Coast
West Tamar
%
Average Asset sustainability ratio
33Local Government Financial Sustainability
of its planned asset requirements. Identification of shortfalls enables councils to develop strategies to address future asset replacement requirements in full.
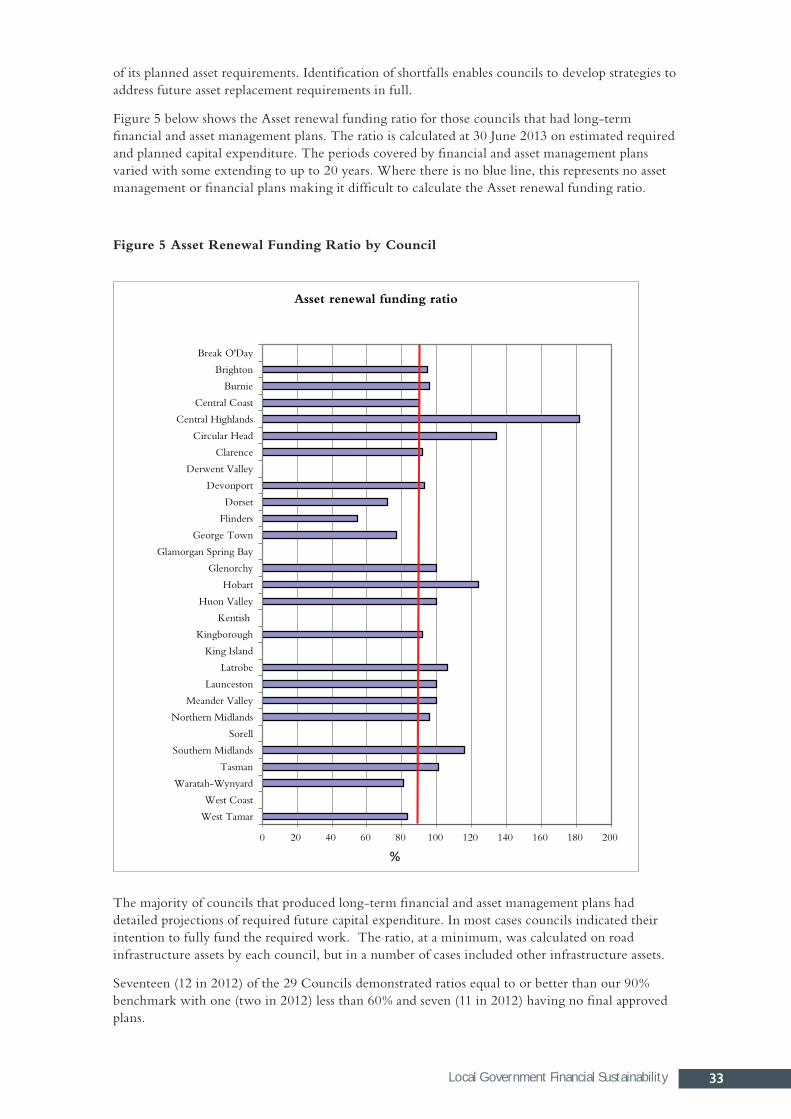
Figure 5 below shows the Asset renewal funding ratio for those councils that had long-term financial and asset management plans. The ratio is calculated at 30 June 2013 on estimated required and planned capital expenditure. The periods covered by financial and asset management plans varied with some extending to up to 20 years. Where there is no blue line, this represents no asset management or financial plans making it difficult to calculate the Asset renewal funding ratio.
Figure 5 Asset Renewal Funding Ratio by Council
The majority of councils that produced long-term financial and asset management plans had detailed projections of required future capital expenditure. In most cases councils indicated their intention to fully fund the required work. The ratio, at a minimum, was calculated on road infrastructure assets by each council, but in a number of cases included other infrastructure assets.
Seventeen (12 in 2012) of the 29 Councils demonstrated ratios equal to or better than our 90% benchmark with one (two in 2012) less than 60% and seven (11 in 2012) having no final approved plans.
0 20 40 60 80 100 120 140 160 180 200
Break O'Day
Brighton
Burnie
Central Coast
Central Highlands
Circular Head
Clarence
Derwent Valley
Devonport
Dorset
Flinders
George Town
Glamorgan Spring Bay
Glenorchy
Hobart
Huon Valley
Kentish
Kingborough
King Island
Latrobe
Launceston
Meander Valley
Northern Midlands
Sorell
Southern Midlands
Tasman
Waratah-Wynyard
West Coast
West Tamar
Asset renewal funding ratio
%

34 Local Government Financial Sustainability
Conclusion based on assessment of the asset renewal funding ratio
Twenty two councils had developed approved asset management and financial management plans, an improvement on the 18 in 2012, and 17 equalled or bettered this benchmark. Overall, the situation regarding long-term financial and asset planning had improved.
road Consumption ratio
Our review of asset consumption was based only on road infrastructure primarily due to road infrastructure assets representing 47.6%, or $3.135bn, of total infrastructure assets held by the 29 councils of $6.578bn.
The ratio indicates the levels of service potential available in existing road infrastructure managed by councils. The higher the percentage, the greater future service potential is available to provide services to ratepayers.
Figure 6 below shows the road asset consumption ratio on a consolidated basis for the 29 councils in each of the past seven years. Ratios above 60% represent low financial sustainability risk and less than 40% high financial sustainability risk.
Figure 6 Average Road Consumption Ratio
The figure indicates relatively low levels of consumption of council road assets with improvement over the period. The road consumption ratio improved from 58% in 2007 to 65% in 2013, with all councils within a low or moderate asset sustainability risk. A number of reasons contributed to the improvement including:
• higher capital expenditure on road assets
• councils, as part of regular revaluations, reviewing and extending the useful lives of road asset components and, in some cases, introducing residual values
• greater use of financial and asset management plans.
Also relevant is increasing involvement of council engineers in asset valuations processes.
The ratio indicates, on a consolidated basis, that councils had sufficient service capacity remaining in their road infrastructure assets.
50
55
60
65
70
2007 2008 2009 2010 2011 2012 2013
%
Year
Road consumption ratio - Average (All Councils)
35Local Government Financial Sustainability
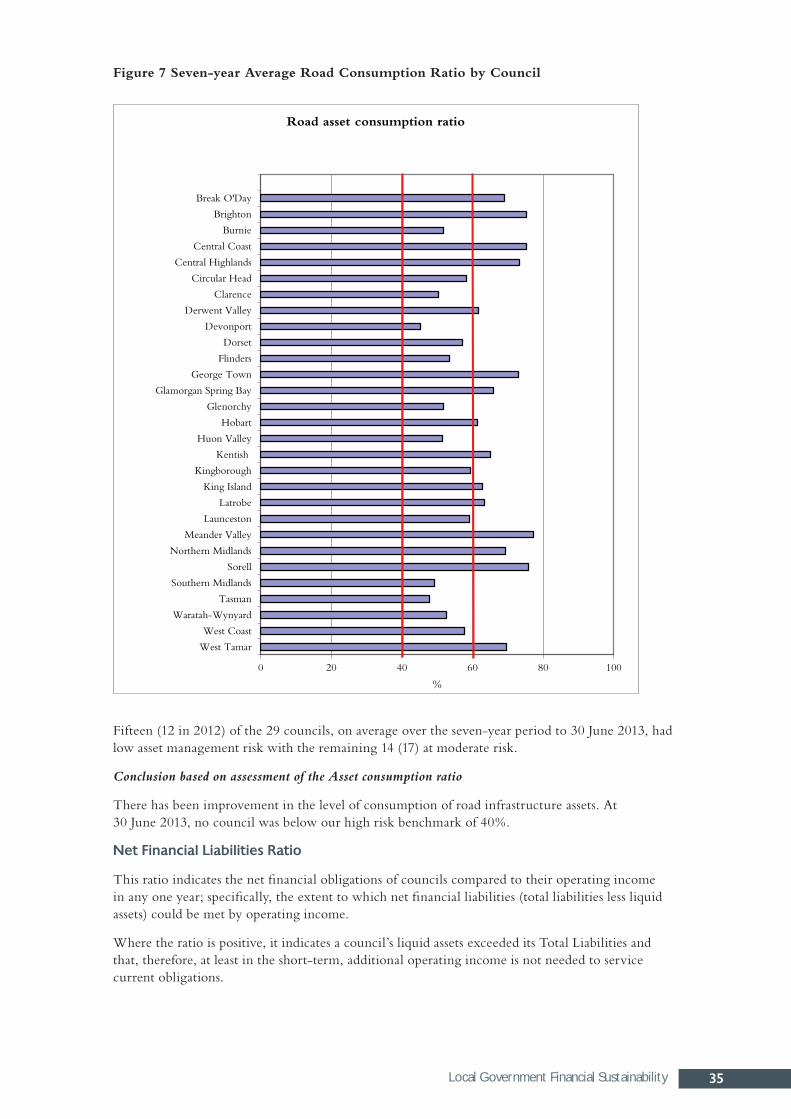
Figure 7 Seven-year Average Road Consumption Ratio by Council
Fifteen (12 in 2012) of the 29 councils, on average over the seven-year period to 30 June 2013, had low asset management risk with the remaining 14 (17) at moderate risk.
Conclusion based on assessment of the Asset consumption ratio
There has been improvement in the level of consumption of road infrastructure assets. At 30 June 2013, no council was below our high risk benchmark of 40%.
net financial liabilities ratio
This ratio indicates the net financial obligations of councils compared to their operating income in any one year; specifically, the extent to which net financial liabilities (total liabilities less liquid assets) could be met by operating income.
Where the ratio is positive, it indicates a council’s liquid assets exceeded its Total Liabilities and that, therefore, at least in the short-term, additional operating income is not needed to service current obligations.
0 20 40 60 80 100
Break O'Day
Brighton
Burnie
Central Coast
Central Highlands
Circular Head
Clarence
Derwent Valley
Devonport
Dorset
Flinders
George Town
Glamorgan Spring Bay
Glenorchy
Hobart
Huon Valley
Kentish
Kingborough
King Island
Latrobe
Launceston
Meander Valley
Northern Midlands
Sorell
Southern Midlands
Tasman
Waratah-Wynyard
West Coast
West Tamar
%
Road asset consumption ratio

36 Local Government Financial Sustainability
Conversely, a negative ratio indicates an excess of Total Liabilities over liquid assets meaning that, if all liabilities fell due at once, additional operating revenue would be needed to fund the shortfall in liquid assets.
Our benchmark is a ratio of between 0% and minus 50%, with a council having net liabilities at minus 50%, or less of one year’s operating revenue, being considered low risk.
Figure 8 Average Net Financial Liabilities Ratio
The average Net financial liabilities ratio was positive each year. This was because, on a consolidated basis, total liquid assets exceeded Total Liabilities. At 30 June 2013, the 29 councils had current liabilities of $134.811m and non-current liabilities of $131.344m, which included Borrowings of $85.598m. However, Cash and other current liquid assets totalled $427.180m, which was $161.025m greater than Total Liabilities. Operating revenue generated during 2012-13 totalled $680.175m.
The ratio improved in 2009-10 when many councils transferred borrowings to the water and sewerage corporations.
The ratio is calculated without reference to commitments councils may have entered into or the need to fund programs from funds already received, such as unexpended Capital grants. Bearing this in mind, this ratio indicates that:
• Collectively, councils are holding liquid assets, primarily cash balances, well beyond their day-to-day requirements. This results in strong investment incomes.
• Generally, asset renewal, replacement, or investments in new assets, are being funded from current rates, existing cash holdings or capital grants with limited use of borrowings.
(50)
(40)
(30)
(20)
(10)
0
10
20
30
40
50
2007 2008 2009 2010 2011 2012 2013
%
Year
Net financial liabilities ratio - Average (All Councils)
37Local Government Financial Sustainability
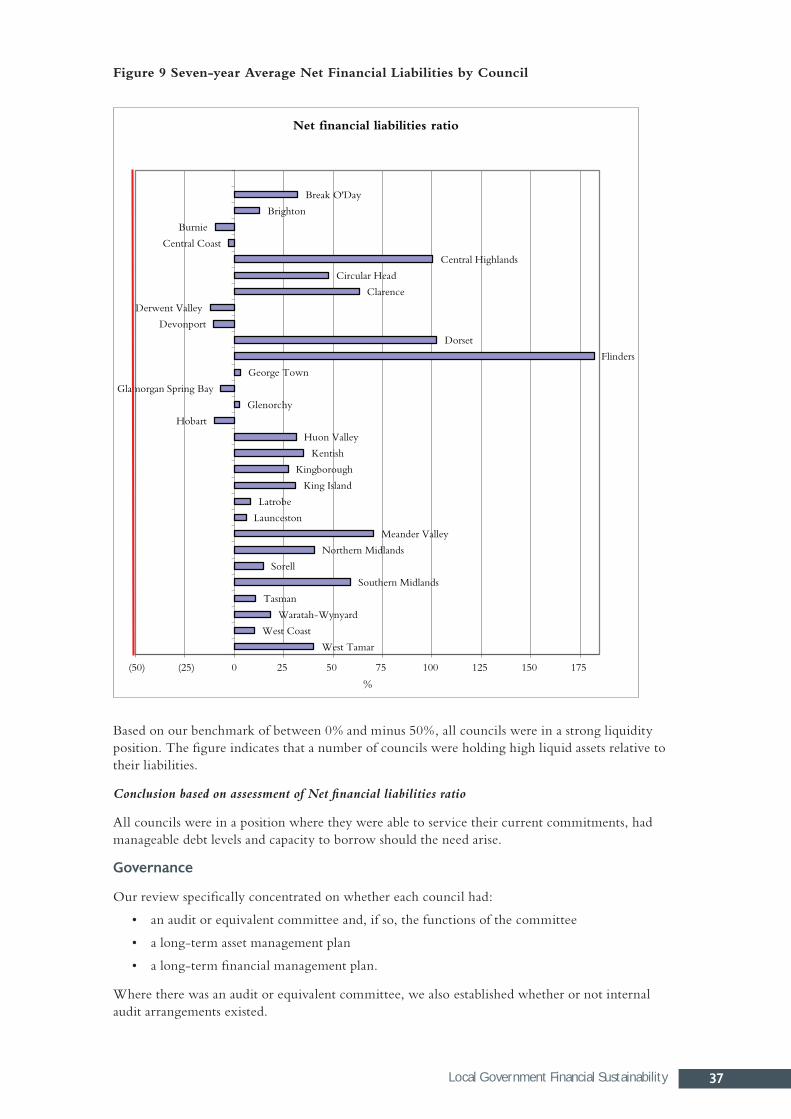
Figure 9 Seven-year Average Net Financial Liabilities by Council
Based on our benchmark of between 0% and minus 50%, all councils were in a strong liquidity position. The figure indicates that a number of councils were holding high liquid assets relative to their liabilities.
Conclusion based on assessment of Net financial liabilities ratio
All councils were in a position where they were able to service their current commitments, had manageable debt levels and capacity to borrow should the need arise.
governance
Our review specifically concentrated on whether each council had:
• an audit or equivalent committee and, if so, the functions of the committee
• a long-term asset management plan
• a long-term financial management plan.
Where there was an audit or equivalent committee, we also established whether or not internal audit arrangements existed.
Break O'Day
Brighton
Burnie
Central Coast
Central Highlands
Circular Head
Clarence
Derwent Valley
Devonport
Dorset
Flinders
George Town
Glamorgan Spring Bay
Glenorchy
Hobart
Huon Valley
Kentish
Kingborough
King Island
Latrobe
Launceston
Meander Valley
Northern Midlands
Sorell
Southern Midlands
Tasman
Waratah-Wynyard
West Coast
West Tamar
(50) (25) 0 25 50 75 100 125 150 175
%
Net financial liabilities ratio
38 Local Government Financial Sustainability
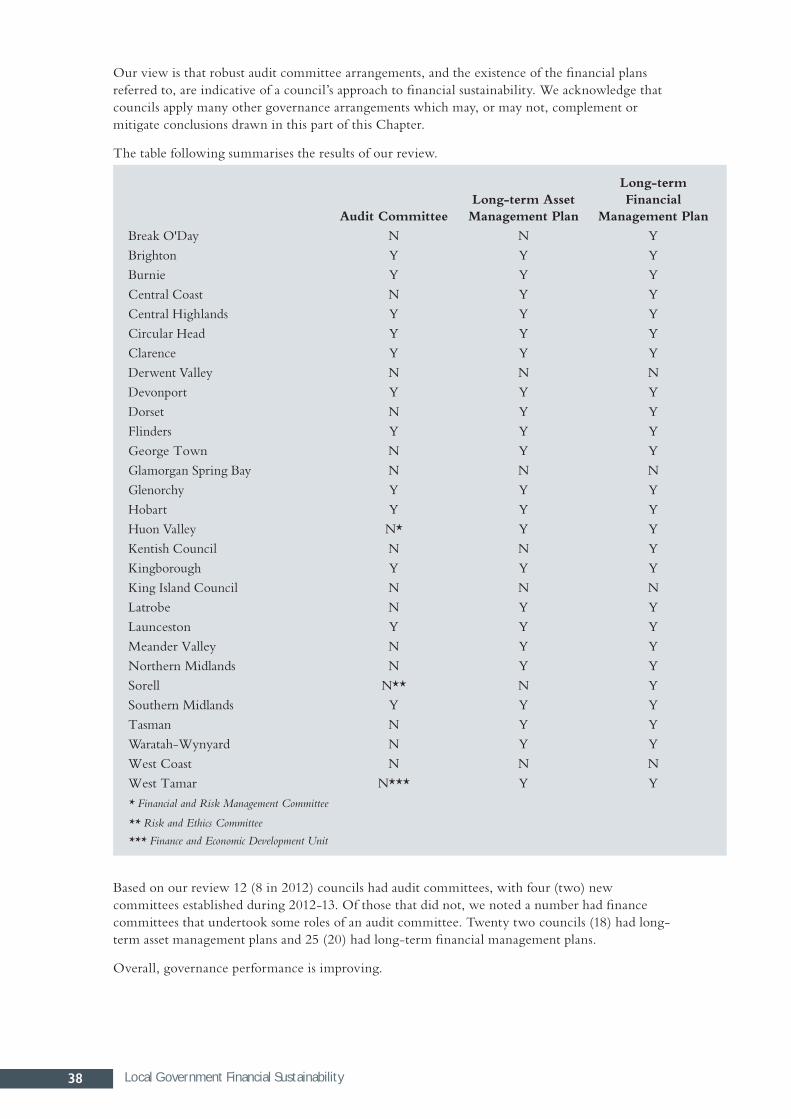
Our view is that robust audit committee arrangements, and the existence of the financial plans referred to, are indicative of a council’s approach to financial sustainability. We acknowledge that councils apply many other governance arrangements which may, or may not, complement or mitigate conclusions drawn in this part of this Chapter.
The table following summarises the results of our review.
Audit CommitteeLong-term Asset Management Plan
Long-term Financial
Management Plan
Break O'Day N N YBrighton Y Y YBurnie Y Y YCentral Coast N Y YCentral Highlands Y Y YCircular Head Y Y YClarence Y Y YDerwent Valley N N NDevonport Y Y YDorset N Y YFlinders Y Y YGeorge Town N Y YGlamorgan Spring Bay N N NGlenorchy Y Y YHobart Y Y YHuon Valley N* Y YKentish Council N N YKingborough Y Y YKing Island Council N N NLatrobe N Y YLaunceston Y Y YMeander Valley N Y YNorthern Midlands N Y YSorell N** N YSouthern Midlands Y Y YTasman N Y YWaratah-Wynyard N Y YWest Coast N N NWest Tamar N*** Y Y* Financial and Risk Management Committee
** Risk and Ethics Committee
*** Finance and Economic Development Unit
Based on our review 12 (8 in 2012) councils had audit committees, with four (two) new committees established during 2012-13. Of those that did not, we noted a number had finance committees that undertook some roles of an audit committee. Twenty two councils (18) had long-term asset management plans and 25 (20) had long-term financial management plans.
Overall, governance performance is improving.

39Local Government Financial Sustainability
Conclusions as to governance arrangements
Overall, while not enough councils had audit committees or long-term asset and financial management plans in place, changes were encouraging.
overall finanCial susTainabiliTy assessmenTBased on these ratios and governance arrangements, we concluded that at 30 June 2013, assessed on average performance over the past seven years, councils in general had a high financial sustainability risk from a governance perspective, moderate financial sustainability risk from financial operating and asset management perspectives but low risk from a net financial liabilities perspective.
While there has been some improvement since 2011-12, a number of councils need to address continued operating deficits, introduction of audit committees and further development of long-term asset and financial management plans.
As mentioned in previous Reports, councils are generally under-investing in existing assets with only eight out of 29 councils investing in existing assets, on average over a seven-year period, in excess of their annual depreciation charge.
Road asset consumption ratios improved over the seven year period. Overall, on a total road asset basis, the 29 councils’ road assets had sufficient capacity to continue to provide services to ratepayers.
Individual assessments are included in each council’s Chapter.

40 Local Government Comparative Analysis
loCal governmenT ComparaTive analysisComparative analysis covering financial and other information for Tasmania’s 29 councils has been compiled with results provided in four attachments to this Chapter. The information provided is for the financial year ended 30 June 2013. The attachments are presented with councils grouped as either major city; other urban and large rural; or other smaller rural.
This is the eighth year that this analysis has been included in this Report. While only one year’s data is provided, where relevant, comparative totals for 2011-12 are included.
The attachments are:
• Demographics
• Employee costs
• Comprehensive Income Statements
• Statements of Financial Position.
Our analysis of the attachments is of a general nature and should be read in conjunction with the individual Chapters on each council and the Local Government Financial Sustainability Chapter in this Report.
When considering the various ratios and observations reported in this Chapter, it needs to be borne in mind that they are only indicators of performance or of financial position. The various ratios should not be considered in isolation. However, taken together, various ratios can indicate good or poor financial condition or performance. It is also important to review these ratios over time with the analysis in this Chapter only considering performance for the single 2012-13 financial year.
demographics (note most recent data available is for 2011-12)
Comments here are made by reference to Attachment 1.
The Tasmanian population, as recorded by the Australian Bureau of Statistics – Regional Population Growth, increased by 2 763, 0.54%, from 2010-11 to 2011-12. Across the State, populations of each municipal area vary considerably, ranging from 802 (2010-11, 804) in Flinders to 67 146 (67 190) in Launceston. The major cities’ populations represented 42.00% or 215 951 (42.90%, 215 878) of the total population, but only covered 2.92% or 1 986 sq. kms of the State’s area in square kilometres. Conversely, the 13 smaller rural councils’ combined populations represented 13.30%, 68 386 (13.34%, 68 171) of the total population, but covered 59.7% or 40 480 sq. kms of the State’s area in square kilometres.
As noted in previous years, rural councils can face difficulties in providing and maintaining services because they do not have access to the higher ratepayer base of larger councils and in some cases they manage large road networks. This is highlighted in the number of rateable valuations per square kilometre ratio which reflects the population and area disparity between the councils already referenced.
employee Costs
Comments here are made by reference to Attachment 2, which summarises Employee costs, Employee entitlements and Full Time Equivalents (FTEs) for the 29 councils.
The 29 councils in the table employed 3 417 (2011-12, 3 365) FTEs at 30 June 2013 and incurred Employee costs of $259.074m ($252.224m) for the financial year. Average employee costs per FTE varied from a high of $81 000 per FTE at Circular Head and George Town Councils to a low of $57 000 per FTE at Tasman Council with the average being $72 000.
Councils’ FTEs per 1 000 head of population also varied with smaller rural councils having lower population bases and higher ratios. Flinders Council had a ratio of 28.7 FTEs per 1 000 head of

41Local Government Comparative Analysis
population due to its small population. The average for the 29 councils was 8.3 FTE per 1 000 head of population.
At 30 June 2013, the amount of annual, long service and some sick leave accrued by the 29 councils for their employees totalled $60.317m (2011-12, $57.215m). On a per FTE basis this equated to $16 680 with variations between councils ranging from $7 526 per FTE at Tasman to $34 569 at Derwent Valley.
statement of Comprehensive income
Comments here are made by reference to Attachment 3.
The combined net Surplus for the 29 councils was $25.002m, a decrease of 76.4 % from 2011-12, $106.028m and included:
• $32.939m (2011-12, $72.616m) in Capital grant funding
• $34.780m ($34.772m) in contributed assets, mainly through subdivisions
• negative $0.116m (positive $18.456m) net Financial Assistance Grants which related to 50% funding received in June 2013 for 2013-14, adjusted for 50% funding received in June 2012 for the 2012-13 financial period
• $6.354m ($0.339m) in other non-operating revenue, offset by
• $42.105m ($5.491m) in non-operating expenditure which included a derecognition of assets of $35.336m by Clarence City Council.
However, on an ‘underlying’ basis, for the year ended 30 June 2013 councils recorded combined Underlying Deficits of $7.547m ($13.419m Underlying Deficit). Sixteen councils recorded a net Underlying Deficit for the 2012-13 financial year with results varying from an Underlying Surplus of $1.732m at West Tamar Council to an Underlying Deficit of $2.725m at Kingborough Council.
On a Comprehensive income basis, combined Comprehensive Surpluses totalled $146.554m (2011-12, $395.967m), a decrease of $249.413m. The Comprehensive income items for this year mainly consisted of the following:
• fair value net asset revaluation increments of $93.325m (2011-12, $445.051m)
• write-up of councils’ net investments in the water and sewerage corporations of $13.937m ($11.626m) based on movements in each corporation’s net assets during 2012-13
• actuarial gains of $12.100m ($4.922m) on defined benefit superannuation schemes. These gains only applied to those councils not operating under multi-employer defined benefit schemes.
Revenue Raising Capacities
The 29 councils raised $405.950m (2011-12, $384.179m) in rates for 2012-13, an increase of 5.6%. City councils, in general, earn a greater percentage of their operating revenue from rates. This was reflected in the rate revenue to operating revenue ratio. In contrast, councils that had a lower rate to operating revenue ratio received a higher percentage of recurrent grant revenue. It was noted that there were seven councils (eight) with rate revenue to operating revenue ratios of less than 50%, meaning that they were heavily reliant on recurrent grant funding. One of these councils also had the lowest average rates per rateable valuation although it generated relatively high rate revenues per head of population.
On average councils are rating $1 326 per rateable property, but are expending $2 491 in operating costs. Councils’ operating expenses are being supported by other revenue sources including fees and charges, interest revenue and grants. A reduction in grant funding would have a significant impact on local government, with any possible loss in revenue having to be offset by an increase in rates or a reduction in costs and services, in particular those funded by grants.
42 Local Government Comparative Analysis
Councils’ own source revenues represent operating revenue other than recurrent grants. Expressing own source revenues as a percentage of total operating revenues indicated a council’s ability to generate its own funding, without relying on recurrent Government grants. In general terms, the resulting ratios in Attachment 3 highlight that, consistent with ratios discussed previously, smaller councils generate lower amounts of own source revenues in percentage terms.
Also shown in Attachment 3 are the ratios of operating (or recurrent) grants per head of population and operating grants compared to operating revenues. These ratios confirm previous observations that smaller councils were more reliant on recurrent operating grants. To illustrate this point, smaller rural councils’ grants per head of population were considerably greater than other councils, for example Flinders Council, $2 433, King Island Council, $1 326, and Central Highlands Council, $929, compared to Hobart City Council, $70, or Clarence City Council, $89.
Depreciation to Operating Revenues
The Depreciation to operating revenue ratio provides an indication of the extent to which a council was funding, from current revenues, its future asset replacement through depreciation. There is no benchmark for this ratio except that we anticipate that councils should at least budget to break-even on an operating basis therefore fully covering annual Depreciation charges.
The ratio of Depreciation to operating revenues for the 29 councils was 25.2% (2011-12, 26.4%), with major cities averaging 21.0% (23.0%), other urban and larger rural 23.7% (23.7%) and other smaller rural councils 28.0% (29.9%). The ratios remained fairly constant from 2011-12 to 2012-13.
There were considerable fluctuations in the smaller rural council percentages, varying between 17.2% at Glamorgan Spring Bay Council, which had a comparatively low infrastructure assets base with non-current infrastructure assets per head of population of $16 397, to 48.2% at Central Highlands where the non-current infrastructure assets per head of population was $52 959. This highlighted the importance of having long-term asset management plans (further information about this is included in the Local Government Financial Sustainability Chapter) and budgeting to ensure that operating revenues are sufficient to cover all operating costs, including Depreciation. It is acknowledged that the latter will be more difficult in regional communities with significant infrastructure.
However, it is inappropriate to consider this ratio in isolation with further discussion about this when reviewing the depreciation to capital expenditure ratios later in this Chapter.
statement of financial position
Comments here are made with reference to Attachment 4.
Management of working capital
On the basis that a working capital ratio of one or better is effective, all councils manage working capital (Total Current Assets less Total Current Liabilities expressed as a ratio greater or less than one) effectively with most achieving a ratio of well above one at 30 June 2013. This ratio provides an indication as to whether or not an entity can meet its short-term commitments from existing current assets.
It is noted, however, that all councils had large or reasonably large bank and investment balances, some of which were committed to future capital projects. The significant cash balances are further illustrated by the Net financial liabilities ratio (Total Liabilities less liquid assets divided by operating revenue expressed as a percentage). Most councils had positive percentages meaning liquid assets exceeded Total Liabilities. This is further examined in the Local Government Sustainability Chapter.
Management of infrastructure and other non-current assets
Included in Total Non-Current Assets, amounting to $8.621bn (2011-12, $8.488bn), were infrastructure assets controlled by the 29 councils at 30 June 2013 totalling $6.578bn ($6.125bn).

43Local Government Comparative Analysis
In 2012-13, payments made by councils for Property, plant and equipment totalled $222.084m (2011-12, $192.917m) and Depreciation charged on these assets totalled $153.695m ($153.814m). A useful measure to assess the extent to which a council was adequately investing in its non-current asset base is expenditure on all assets expressed as a percentage of depreciation with an ideal target of not less than 100%. However, a better measure for this ratio is to express expenditure on existing assets as a percentage of depreciation. This particular measure is further assessed in the Chapter dealing with Financial Sustainability.
For the 29 councils, the average of total capital expenditure, on existing and new assets, to depreciation ratio was 139.7% (2011-12, 121.8%) indicating most councils were re-investing in their non-current assets at an appropriate rate. However, some councils stand out as being below the target of 100%. In each case, further details are provided in individual Council Chapters of this Report.
Another indicator which can be used to assess whether or not a council is adequately re-investing in its non-current asset base is to compare rate revenue to non-current infrastructure assets. This ratio indicates the level of rating undertaken in relation to the infrastructure bases being managed by each council. The higher the ratio the better.
The analysis of non-current infrastructure assets per square kilometre and per head of population confirms the concentration of infrastructure and people in the major cities and larger urban areas. Rural councils manage lower levels of infrastructure assets, but across larger geographical areas.
The ratio of non-current infrastructure assets per rateable valuation indicated that each rateable valuation supported a fairly consistent level of infrastructure. We have not analysed why it is that some councils vary significantly from the average of $25 067 (2011-12, $24 633).
Management of Debt
We have included in our analysis relevant ratios around debt management because how councils manage debt and associated interest costs can have short and long-term impacts on rating strategies and asset replacement programs. Inter-generational equity also needs to be considered as does the impact of asset replacement programs and any effect of proposed new initiatives.
A review of the interest coverage ratio for each council (cash interest payments divided by net operating cash flows expressed as a percentage) indicated that all councils with debt were comfortably able to meet their loan interest charges.
Brighton Council, Huon Valley Council, Kingborough Council, Meander Valley Council, Northern Midlands Council, Central Highlands Council and Flinders Council did not have any loan debt at 30 June 2013.
The indebtedness ratio complements the current ratio and illustrates a council’s ability to meet longer-term commitments. The ratio compares non-current liabilities to a council’s own source revenue, the lower the percentage the stronger a council’s position to meet longer term liabilities. Those councils with ratios well above the average of 18.3% (2011-12, 18.3%) were, in general, holding higher levels of non-current borrowings at 30 June 2013 than the councils with lower ratios. However, the ratios indicate all councils could meet future longer term debt commitments.
Collection of Rates
For the 29 councils, rate debts owing to councils at 30 June 2013 totalled $15.289m (2011-12, $13.341m) with an average per council of $527 000 ($460 000). Expressing rate debtors as a percentage of rates raised indicated that, in general, councils were recovering outstanding rate debts in a reasonable timeframe. Southern Midlands Council at 11.2% had the highest ratio. It is noted, however, that all councils had significant power under the Local Government Act 1993 to recover rate debts against a property.

44 Local Government Comparative Analysis
ATTACHMENT 1 – LOCAL GOVERNMENT COMPARATIVE ANALYSIS DEMOGRAPHICS
CouncilPopulation
2011-12
Area in Square
Kilometres
Population Per Square Kilometre
Number of Rateable
Valuations
Number of Rateable Valuations Per Square Kilometre
Average Rateable
Valuations Per
Head of Population
Clarence 53 081 377 140.8 23 981 63.6 0.5
Glenorchy 45 382 120 378.2 20 965 174.7 0.5
Hobart 50 342 78 647.1 23 534 302.5 0.5
Launceston 67 146 1 411 47.6 30 598 21.7 0.5
Brighton 16 629 171 97.2 6 926 40.5 0.4
Burnie 20 148 610 33.0 9 675 15.9 0.5
Central Coast 22 365 931 24.0 10 631 11.4 0.5
Derwent Valley 9 956 4 104 2.4 5 046 1.2 0.5
Devonport 25 727 111 231.8 11 963 107.8 0.5
Huon Valley 16 020 5 498 2.9 10 190 1.9 0.6
Kingborough 35 090 717 48.9 16 674 23.3 0.5
Meander Valley 19 633 3 320 5.9 9 641 2.9 0.5
Northern Midlands 12 741 5 126 2.5 6 713 1.3 0.5
Sorell 14 147 583 24.3 8 623 14.8 0.6
Waratah-Wynyard 14 298 3 526 4.1 7 503 2.1 0.5
West Tamar 22 867 690 33.1 11 117 16.1 0.5
Break O'Day 6 514 3 521 1.9 6 347 1.8 1.0
Central Highlands 2 369 7 976 0.3 3 682 0.5 1.6
Circular Head 8 300 4 891 1.7 4 878 1.0 0.6
Dorset 7 152 3 223 2.2 5 170 1.6 0.7
Flinders 802 1 994 0.4 1 161 0.6 1.4
George Town 6 789 653 10.4 4 405 6.7 0.6
Glamorgan Spring Bay 4 432 2 522 1.8 5 608 2.2 1.3
Kentish 6 367 1 155 5.5 3 561 3.1 0.6
King Island 1 599 1 100 1.5 1 636 1.5 1.0
Latrobe 10 524 600 17.5 5 729 9.5 0.5
Southern Midlands 6 306 2 611 2.4 3 594 1.4 0.6
Tasman 2 440 659 3.7 3 386 5.1 1.4
West Coast 4 792 9 575 0.5 4 574 0.5 1.0
Total 513 958 67 853 7.6 267 511
Average per Council 17 723 2 340 61.2 9 225 28.9 0.7
Total 2010-10 511 195 67 853 7.5 265 175Average per Council
2010-11 17 627 2 340 60.3 9 144 28.4 0.7
Average Population per square kilometre for Tasmania 7.57
Average Rateable properties per square kilometre 3.94
Average Rateable properties per Head of Population 0.52
Source
Population figures derived from Australian Bureau of Statistics - Regional Population Growth, Australia 2011-12.
Local Government areas taken from the ABS website ‘2001 Census Community Profile Series’, Statistics estimated at 30 June 2005.
Rateable properties obtained from Councils.

45Local Government Comparative Analysis
ATTACHMENT 2 – LOCAL GOVERNMENT COMPARATIVE ANALYSIS EMPLOYEE COSTS - 2012-13
Council Tot
al E
mplo
yee
Cost
s
FT
Es
Ave
rage
Cost
per
FT
E *
FT
E p
er 1
000
Popula
tion
Tot
al L
abour
Cost
s to
Oper
atin
g R
even
ue
Tot
al L
abour
Cost
s to
Oper
atin
g Exp
enditure
Pro
visi
ons
for
Em
plo
yee
Entitlem
ents
Em
plo
yee
Entitlem
ents
per
FT
E
$'000s No. $'000s No. % % $'000s $
Clarence 15 989 220 73 4.1 30.3 30.9 4 039 18 359
Glenorchy 21 508 272 79 6.0 38.5 36.8 5 784 21 265
Hobart 51 388 616 83 12.2 48.2 48.5 13 740 22 305
Launceston 33 964 431 79 6.4 38.5 38.1 6 636 15 397
Brighton 2 908 50 58 3.0 22.5 23.6 835 16 700
Burnie 15 052 187 80 9.3 40.6 39.3 2 277 12 176
Central Coast 10 032 141 71 6.3 45.6 45.1 2 432 17 248
Derwent Valley 3 446 51 68 5.1 32.4 33.2 1 763 34 569
Devonport 12 765 167 76 6.5 35.9 35.9 2 686 16 084
Huon Valley 9 223 133 69 8.3 42.4 41.7 1 560 11 729
Kingborough 12 423 180 69 5.1 38.8 35.7 2 298 12 767
Meander Valley 5 915 76 78 3.9 33.6 35.0 1 325 17 434
Northern Midlands 4 631 64 72 5.0 30.7 30.6 1 423 22 234
Sorell 6 117 82 75 5.8 36.6 39.0 1 209 14 744
Waratah-Wynyard 5 625 83 68 5.8 37.6 33.2 1 505 18 133
West Tamar 7 318 92 80 4.0 33.1 36.0 2 108 22 913
Break O'Day 3 784 52 73 8.0 34.8 30.5 555 10 673
Central Highlands 1 918 34 56 14.4 31.5 25.7 629 18 500
Circular Head 4 435 55 81 6.6 33.8 32.4 886 16 109
Dorset 4 536 60 76 8.4 37.7 36.9 1 119 18 650
Flinders 1 613 23 70 28.7 36.0 32.7 228 9 913
George Town 3 949 49 81 7.2 41.7 42.1 792 16 163
Glamorgan Spring Bay 3 755 54 70 12.2 35.8 33.5 742 13 741
Kentish 2 268 33 69 5.2 27.4 28.1 401 12 152
King Island 2 673 34 79 21.3 38.8 33.9 445 13 088
Latrobe 3 235 45 72 4.3 30.3 32.9 882 19 600
Southern Midlands 3 509 54 65 8.6 40.6 38.1 1 233 22 833
Tasman 1 078 19 57 7.8 17.6 17.5 143 7 526
West Coast 4 017 60 67 12.5 36.7 37.2 642 10 700
Total 259 074 3 417 60 317
Average per Council 8 934 118 72 8.3 35.4 34.7 2 080 16 680
Total 2011-12 252 224 3 365 57 215
Average per Council
2011-12 8 697 116 73 7.9 35.4 34.7 1 973 16 565
* Staff costs include capitalised salaries and wages.

46 Local Government Comparative Analysis
ATTACHMENT 3 – LOCAL GOVERNMENT COMPARATIVE ANALYSIS STATEMENT OF COMPREHENSIVE INCOME - 2012-13
Council Oper
atin
g R
even
ue*
Non-O
per
atin
g R
even
ue*
Tot
al R
even
ue
Oper
atin
g Exp
enditure
Non-O
per
atin
g Exp
enditure
**
Tot
al E
xpen
diture
Under
lyin
g Su
rplu
s (D
efici
t)
Net
Surp
lus
(Defi
cit)
Net
Surp
lus
(Defi
cit)
to
Tot
al R
even
ue
Com
pre
hensi
ve
Surp
lus
(Defi
cit)
Oper
atin
g Su
rplu
s R
atio
Sel
f Fin
anci
ng
Rat
io
$'000s $'000s $'000s $'000s $'000s $'000s $’000s $'000s % $’000s % %
Clarence 52 748 17 093 69 841 51 740 35 336 87 076 1 008 (17 235) (24.7) (14 019) 1.9 24.7
Glenorchy 55 799 8 162 63 961 58 433 0 58 433 (2 634) 5 528 8.6 1 651 (4.7) 28.3
Hobart 106 603 660 107 263 105 952 3 558 109 510 651 (2 247) (2.1) 38 432 0.6 13.1
Launceston 88 185 6 977 95 162 89 222 0 89 222 (1 037) 5 940 6.2 (4 626) (1.2) 14.2
Brighton 12 906 2 506 15 412 12 309 0 12 309 597 3 103 20.1 (1 089) 4.6 19.1
Burnie 37 110 2 604 39 714 38 270 47 38 317 (1 160) 1 397 3.5 6 650 (3.1) 17.8
Central Coast 22 021 901 22 922 22 252 0 22 252 (231) 670 2.9 9 019 (1.0) 18.4
Derwent Valley 10 645 78 10 723 10 386 0 10 386 259 337 3.1 4 802 2.4 28.4
Devonport 35 538 4 631 40 169 35 585 0 35 585 (47) 4 584 11.4 36 240 (0.1) 26.3
Huon Valley 21 950 2 554 24 504 21 398 0 22 332 552 2 172 8.9 2 886 2.5 12.4
Kingborough 32 059 4 050 36 109 34 784 806 35 590 (2 725) 519 1.4 (256) (8.5) 9.4
Meander Valley 17 604 860 18 464 16 920 429 17 349 684 1 115 6.0 3 035 3.9 26.5
Northern Midlands 15 061 2 269 17 330 15 144 0 15 144 (83) 2 186 12.6 (5 523) (0.6) 41.9
Sorell 16 728 1 075 17 803 15 701 0 15 701 1 027 2 102 11.8 5 844 6.1 28.2
Waratah-Wynyard 14 968 2 273 17 241 16 958 0 16 958 (1 990) 283 1.6 816 (13.3) 12.8
West Tamar 22 078 1 802 23 880 20 346 0 20 346 1 732 3 534 14.8 4 457 7.8 21.6
Break O'Day 10 882 1 141 12 023 12 406 0 12 406 (1 524) (383) (3.2) 6 294 (14.0) 25.4
Central Highlands 6 090 686 6 776 7 476 0 7 476 (1 386) (700) (10.3) 1 876 (22.8) 27.4
Circular Head 13 131 4 722 17 853 13 668 0 13 668 (537) 4 185 23.4 9 012 (4.1) 15.6
Dorset 12 032 839 12 871 12 296 0 12 296 (264) 575 4.5 4 656 (2.2) 28.5
Flinders 4 475 572 5 047 4 934 0 4 934 (459) 113 2.2 2 428 (10.3) 29.0
George Town 9 477 2 311 11 788 9 383 0 9 383 94 2 405 20.4 4 858 1.0 22.4
Glamorgan Spring Bay 10 498 910 11 408 11 215 0 11 215 (717) 193 1.7 19 518 (6.8) 15.3
Kentish 8 263 1 282 9 545 8 075 0 8 075 188 1 470 15.4 4 391 2.3 29.5
King Island 6 896 883 7 779 7 420 456 7 876 (524) (97) (1.2) ( 32) (14.2) 21.5
Latrobe 10 692 1 485 12 177 9 841 0 9 841 851 2 336 19.2 2 707 8.0 26.0
Southern Midlands 8 650 729 9 379 9 203 0 9 203 (553) 176 1.9 2 834 (6.4) 27.0
Tasman 6 132 128 6 260 5 659 539 6 158 513 102 1.6 (1 263) 8.4 24.1
West Coast 10 954 471 11 425 10 786 0 10 786 168 639 5.6 956 1.5 25.7
Total 680 175 74 654 754 829 687 722 42 105 729 827 (7 547) 25 002 146 554
Average per
Council 23 454 2 574 26 029 23 715 1 452 25 166 (260) 862 5.8 5 054 (2.14) 22.8
Total 2011-12 658 488 124 938 783 426 671 907 5 491 677 398 (13 419) 106 028 395 967
Average per
Council 2011-12 22 706 4 308 27 015 23 169 189 23 359 (463) 3 656 11.8 13 654 (2.42) 26.3
* Operating revenue includes 2010 Financial Assistance Grant received in June 2009.
** Non-operating revenue and expenditure include capital grants, contributed assets and revaluation and impairment adjustments. Also, Non-operating revenue includes the net
result of Financial Assistance Grant received in advance.

47Local Government Comparative Analysis
ATTACHMENT 3 – LOCAL GOVERNMENT COMPARATIVE ANALYSIS STATEMENT OF COMPREHENSIVE INCOME - 2012-13 (continued)
Council Rat
e R
even
ue
Rat
e R
even
ue
to
Oper
atin
g R
even
ue
Ave
rage
Rat
e Per
R
atea
ble
Val
uat
ion
Rat
e R
even
ue
Per
H
ead
of Popula
tion
Oper
atin
g C
ost
s Per
R
atea
ble
Val
uat
ion
Counci
l’s O
wn
Sourc
e R
even
ue
Counci
l’s O
wn
Sourc
e R
even
ue
to
Oper
atin
g R
even
ue
Oper
atin
g G
over
nm
ent G
rants
*
Oper
atin
g G
rants
Per
Hea
d of
Popula
tion
Oper
atin
g G
over
nm
ent G
rants
to
Oper
atin
g R
even
ue
Dep
reci
atio
n to
O
per
atin
g R
even
ue
$’000s % $ $ $ $'000s % $’000s $ % %
Clarence 40 471 76.7 1 688 762 2 158 48 035 91.1 4 713 89 8.9 19.5
Glenorchy 26 848 48.1 1 281 592 2 787 49 403 88.5 6 396 141 11.5 27.7
Hobart 67 178 63.0 2 855 1 334 4 502 103 066 96.7 3 537 70 3.3 15.8
Launceston 55 802 63.3 1 824 831 2 916 81 588 92.5 6 597 98 7.5 21.0
Brighton 7 088 54.9 1 023 426 1 777 10 790 83.6 2 116 127 16.4 21.7
Burnie** 19 723 53.1 2 039 979 3 956 33 059 89.1 4 051 201 10.9 21.5
Central Coast 12 877 58.5 1 211 576 2 093 17 966 81.6 4 055 181 18.4 23.9
Derwent Valley 5 605 52.7 1 111 563 2 058 7 219 67.8 3 426 344 32.2 20.3
Devonport 25 020 70.4 2 091 973 2 975 33 298 93.7 2 240 87 6.3 24.6
Huon Valley 9 862 44.9 968 616 2 100 17 637 80.4 4 313 269 19.6 19.8
Kingborough 20 732 64.7 1 243 591 2 086 28 096 87.6 3 963 113 12.4 21.7
Meander Valley 9 517 54.1 987 485 1 755 12 953 73.6 4 651 237 26.4 26.7
Northern Midlands 8 400 55.8 1 251 659 2 256 11 024 73.2 4 037 317 26.8 29.6
Sorell 10 399 62.2 1 206 735 1 821 13 094 78.3 3 634 257 21.7 23.3
Waratah-Wynyard 9 122 60.9 1 216 638 2 260 11 819 79.0 3 149 220 21.0 26.5
West Tamar 14 223 64.4 1 279 622 1 830 19 644 89.0 2 434 106 11.0 24.8
Break O'Day 6 882 63.2 1 084 1 056 1 955 8 263 75.9 2 619 402 24.1 30.9
Central Highlands 2 975 48.9 808 1 256 2 030 3 889 63.9 2 201 929 36.1 48.2
Circular Head 6 781 51.6 1 390 817 2 802 10 176 77.5 2 955 356 22.5 24.3
Dorset 6 004 49.9 1 161 839 2 378 8 236 68.5 3 796 531 31.5 30.0
Flinders 1 247 27.9 1 074 1 555 4 250 2 524 56.4 1 951 2 433 43.6 40.2
George Town 6 672 70.4 1 515 983 2 130 7 794 82.2 1 683 248 17.8 22.0
Glamorgan Spring Bay 6 079 57.9 1 084 1 372 2 000 8 412 80.1 2 086 471 19.9 17.2
Kentish 4 470 54.1 1 255 702 2 268 5 654 68.4 2 609 410 31.6 26.6
King Island 1 876 27.2 1 147 1 173 4 814 4 775 69.2 2 121 1 326 30.8 27.7
Latrobe 5 979 55.9 1 044 568 1 718 9 094 85.1 1 598 152 14.9 22.8
Southern Midlands 4 029 46.6 1 121 639 2 561 5 555 64.2 3 095 491 35.8 30.7
Tasman 3 788 61.8 1 119 1 552 1 659 5 140 83.8 992 407 16.2 18.0
West Coast 6 301 57.5 1 378 1 315 2 358 8 770 80.1 2 184 456 19.9 24.9
Total 405 950 25 209 72 252 586 973 93 202 11 469
Average per Council 13 998 55.9 1 326 869 2 491 20 240 79.3 3 214 395 20.7 25.2
Total 2011-12 384 179 95 601
Average per Council
2011-12 13 248 54.6 1 273 831 2 419 19 410 78.2 3 297 423 21.8 26.4
* Operating grant revenue excludes 2012-13 Financial Assistance Grant received in June 2012, but includes 2011-12 Financial Assistance Grant received in
June 2012.
** Operating costs per Rateable Valuation calculated on Council’s financial information excluding subsidiaries where material.
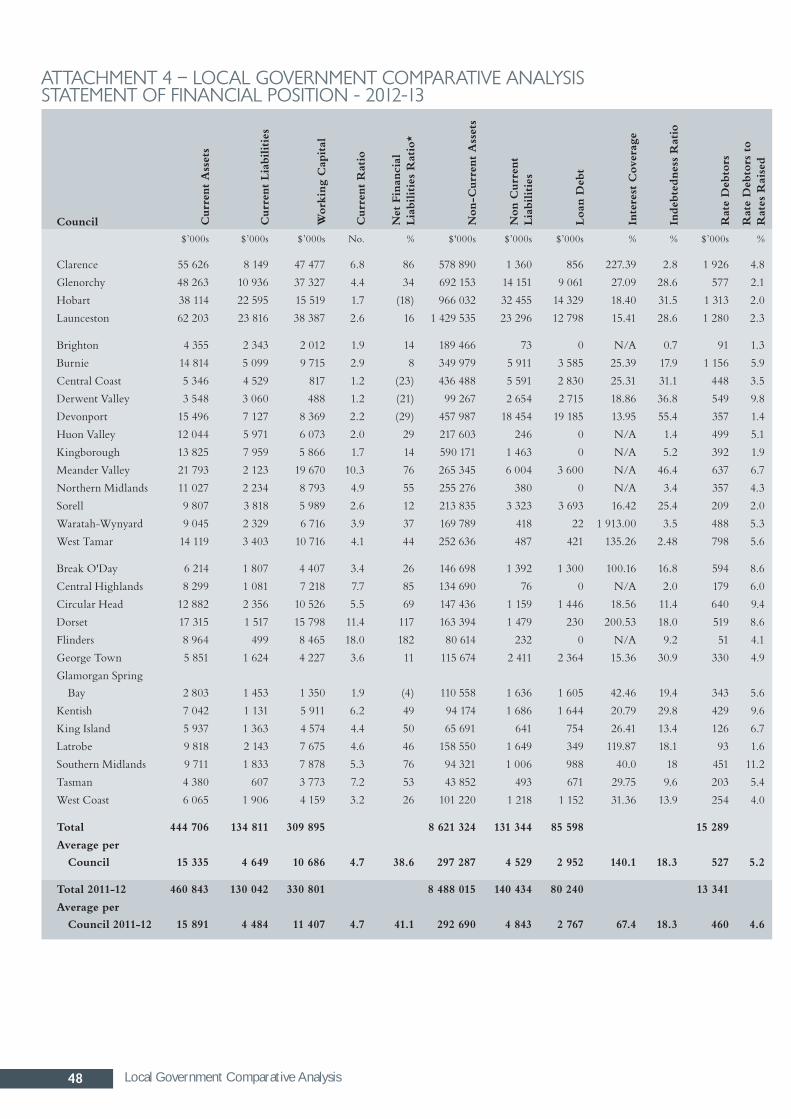
48 Local Government Comparative Analysis
ATTACHMENT 4 – LOCAL GOVERNMENT COMPARATIVE ANALYSIS STATEMENT OF FINANCIAL POSITION - 2012-13
Council Curr
ent A
sset
s
Curr
ent Lia
bilitie
s
Work
ing
Cap
ital
Curr
ent R
atio
Net
Fin
anci
al
Lia
bilitie
s R
atio
*
Non-C
urr
ent A
sset
s
Non
Curr
ent
Lia
bilitie
s
Loan
Deb
t
Inte
rest
Cov
erag
e
Indeb
tednes
s R
atio
Rat
e D
ebto
rs
Rat
e D
ebto
rs t
o
Rat
es R
aise
d
$’000s $’000s $’000s No. % $'000s $’000s $’000s % % $’000s %
Clarence 55 626 8 149 47 477 6.8 86 578 890 1 360 856 227.39 2.8 1 926 4.8
Glenorchy 48 263 10 936 37 327 4.4 34 692 153 14 151 9 061 27.09 28.6 577 2.1
Hobart 38 114 22 595 15 519 1.7 (18) 966 032 32 455 14 329 18.40 31.5 1 313 2.0
Launceston 62 203 23 816 38 387 2.6 16 1 429 535 23 296 12 798 15.41 28.6 1 280 2.3
Brighton 4 355 2 343 2 012 1.9 14 189 466 73 0 N/A 0.7 91 1.3
Burnie 14 814 5 099 9 715 2.9 8 349 979 5 911 3 585 25.39 17.9 1 156 5.9
Central Coast 5 346 4 529 817 1.2 (23) 436 488 5 591 2 830 25.31 31.1 448 3.5
Derwent Valley 3 548 3 060 488 1.2 (21) 99 267 2 654 2 715 18.86 36.8 549 9.8
Devonport 15 496 7 127 8 369 2.2 (29) 457 987 18 454 19 185 13.95 55.4 357 1.4
Huon Valley 12 044 5 971 6 073 2.0 29 217 603 246 0 N/A 1.4 499 5.1
Kingborough 13 825 7 959 5 866 1.7 14 590 171 1 463 0 N/A 5.2 392 1.9
Meander Valley 21 793 2 123 19 670 10.3 76 265 345 6 004 3 600 N/A 46.4 637 6.7
Northern Midlands 11 027 2 234 8 793 4.9 55 255 276 380 0 N/A 3.4 357 4.3
Sorell 9 807 3 818 5 989 2.6 12 213 835 3 323 3 693 16.42 25.4 209 2.0
Waratah-Wynyard 9 045 2 329 6 716 3.9 37 169 789 418 22 1 913.00 3.5 488 5.3
West Tamar 14 119 3 403 10 716 4.1 44 252 636 487 421 135.26 2.48 798 5.6
Break O'Day 6 214 1 807 4 407 3.4 26 146 698 1 392 1 300 100.16 16.8 594 8.6
Central Highlands 8 299 1 081 7 218 7.7 85 134 690 76 0 N/A 2.0 179 6.0
Circular Head 12 882 2 356 10 526 5.5 69 147 436 1 159 1 446 18.56 11.4 640 9.4
Dorset 17 315 1 517 15 798 11.4 117 163 394 1 479 230 200.53 18.0 519 8.6
Flinders 8 964 499 8 465 18.0 182 80 614 232 0 N/A 9.2 51 4.1
George Town 5 851 1 624 4 227 3.6 11 115 674 2 411 2 364 15.36 30.9 330 4.9
Glamorgan Spring
Bay 2 803 1 453 1 350 1.9 (4) 110 558 1 636 1 605 42.46 19.4 343 5.6
Kentish 7 042 1 131 5 911 6.2 49 94 174 1 686 1 644 20.79 29.8 429 9.6
King Island 5 937 1 363 4 574 4.4 50 65 691 641 754 26.41 13.4 126 6.7
Latrobe 9 818 2 143 7 675 4.6 46 158 550 1 649 349 119.87 18.1 93 1.6
Southern Midlands 9 711 1 833 7 878 5.3 76 94 321 1 006 988 40.0 18 451 11.2
Tasman 4 380 607 3 773 7.2 53 43 852 493 671 29.75 9.6 203 5.4
West Coast 6 065 1 906 4 159 3.2 26 101 220 1 218 1 152 31.36 13.9 254 4.0
Total 444 706 134 811 309 895 8 621 324 131 344 85 598 15 289
Average per
Council 15 335 4 649 10 686 4.7 38.6 297 287 4 529 2 952 140.1 18.3 527 5.2
Total 2011-12 460 843 130 042 330 801 8 488 015 140 434 80 240 13 341
Average per
Council 2011-12 15 891 4 484 11 407 4.7 41.1 292 690 4 843 2 767 67.4 18.3 460 4.6

49Local Government Comparative Analysis
ATTACHMENT 4 – LOCAL GOVERNMENT COMPARATIVE ANALYSIS STATEMENT OF FINANCIAL POSITION - 2012-13 (continued)
Council Pay
men
ts for
Pro
per
ty, Pla
n an
d
Equip
men
t
Dep
reci
atio
n
Tot
al C
apital
Exp
enditure
to
Dep
reci
atio
n R
atio
Rat
e R
even
ue
to N
on-C
urr
ent
Infr
astr
uctu
re A
sset
s
Non-C
urr
ent
Infr
astr
uctu
re
Ass
ets
per
Squar
e K
ilom
etre
Non-C
urr
ent
Infr
astr
uctu
re
Ass
ets
per
Hea
d of
Popula
tion
Non-C
urr
ent
Infr
astr
uctu
re
Ass
ets
per
Rat
eable
V
aluat
ion
$’000s $’000s % % $ $ $
Clarence 15 425 10 269 150.2 10.8 990 435 7 034 15 570
Glenorchy 26 429 15 462 170.9 5.5 4053 242 10 718 23 200
Hobart 25 365 16 871 150.3 9.0 9543 882 14 749 31 551
Launceston 21 882 18 528 118.1 6.0 662 464 13 921 30 549
Brighton 5 091 2 800 181.8 5.3 778 749 8 008 19 227
Burnie 6 756 7 996 84.5 6.8 477 121 14 445 30 082
Central Coast 8 443 5 260 160.5 3.5 393 318 16 373 34 444
Derwent Valley 3 126 2 156 145.0 7.5 18 111 7 465 14 730
Devonport 23 441 8 736 268.3 6.6 3400 685 14 672 31 554
Huon Valley 9 328 4 352 214.3 5.5 32 528 11 163 17 550
Kingborough 6 910 6 967 99.2 4.3 665 212 13 592 28 605
Meander Valley 5 105 4 708 108.4 4.6 62 108 10 503 21 388
Northern Midlands 6 123 4 456 137.4 4.0 41 025 16 505 31 327
Sorell 9 016 3 891 231.7 5.7 312 873 12 894 21 153
Waratah-Wynyard 3 782 3 964 95.4 7.0 36 788 9 072 17 288
West Tamar 4 731 5 467 86.5 7.5 274 374 8 279 17 030
Break O'Day 4 474 3 361 133.1 6.3 31 042 16 779 17 220
Central Highlands 2 786 2 933 95.0 2.4 15 729 52 959 34 074
Circular Head 4 560 3 188 143.0 5.4 25 541 15 051 25 609
Dorset 5 391 3 608 149.4 4.1 44 893 20 231 27 987
Flinders 1 362 1 798 75.8 1.6 38 616 96 010 66 322
George Town 4 013 2 087 192.3 7.1 143 862 13 837 21 326
Glamorgan Spring
Bay 3 005 1 810 166.0 8.4 28 816 16 397 12 959
Kentish 3 886 2 194 177.1 5.1 75 690 13 730 24 550
King Island 1 407 1 910 73.7 3.1 55 505 38 184 37 320
Latrobe 3 187 2 436 130.8 4.6 217 922 12 424 22 823
Southern Midlands 2 505 2 655 94.4 5.0 30 815 12 759 22 386
Tasman 969 1 105 87.7 8.9 64 783 17 497 12 608
West Coast 3 586 2 727 131.5 8.3 7 884 15 754 16 505
Total 222 084 153 695
Average per
Council 7 658 5 300 139.7 5.9 776 690 18 311 25 067
Total 2011-12 192 917 153 814
Average per
Council 2011-12 6 652 5 304 121.8 5.8 738 274 17 829 24 633

50 Copping Refuse Disposal Site Joint Authority
Copping refuse disposal siTe joinT auThoriTy (The authority)
snapshoT• The Authority recorded an Underlying Profit of $0.907m, an improvement on the previous
year.
• A Comprehensive Profit of $0.635m was reported for the year.
• Net Assets increased to $2.957m.
The Authority’s operations are undertaken by a small number of staff, which increases risk due to a lack of segregation of duties. This risk was mitigated to an acceptable level by the nature and extent of audit testing we performed.
The audit was completed satisfactorily and there were no major issues identified.
Key Developments in 2012-13 included:
• revenue recorded a very large increase this year, to $6.945m, due to additional tonnage received resulting from the January bushfires in Southern Tasmania
• expenditure also increased markedly, to $6.039m, in large part due to a new provision for landfill cell capping
• participating Councils provided an equity injection of $1.300m.
inTroduCTionThe Authority was established as a joint authority under Section 30 of the Local Government Act 1993 and gazetted on 1 March 2001. It trades under the name of Southern Waste Solutions.
Its principal objective is to manage a putrescibles landfill disposal site which conforms to the Development Proposal and Environmental Management Plan and associated permit conditions issued by the then Environmental Management and Pollution Control Board. It must successfully manages the landfill disposal site business by:
• operating efficiently in accordance with sound commercial practice
• maximising the net worth of the Authority’s assets
• operates the site to maximise benefits to member councils.
The Authority is jointly owned by the Clarence City, Kingborough, Sorell and Tasman Councils. It also has long-term contracts for waste disposal and transport with Huon Valley and Break O’Day Councils and a contract for waste disposal with Glamorgan Spring Bay Council.
audiT of The 2012-13 sTaTemenTsSigned financial statements were received on 13 August 2013. An unqualified audit report was issued on 27 September 2013.

51Copping Refuse Disposal Site Joint Authority
key findings, developmenTs and areas of audiT aTTenTionjanuary bushfires
The increase in profit this year was mainly attributable to a significant amount of fire debris and other level two waste delivered to the landfill. The Authority also provided assistance to the clean-up effort by offering space for storage of bulk debris, expanded opening hours and discounted gate fees for affected areas. Costs were also incurred, including a temporary cell to store debris, which were absorbed by the Authority.
Capping of Cells
The Authority is required to meet specific environmental conditions, set by the Environmental Protection Authority in order to operate a waste management site, which includes a requirement to rehabilitate the site. As part of the regulatory requirements, the Authority undertakes significant works on sealing waste cells, to an environmentally appropriate level, a process known as capping. This year a provision for capping of $1.447m was established to offset future expenditure.
debt reduction and operational needs payment
In July 2012, participating Councils agreed to make a proportionate payment of $1.300m for debt reduction and for the Authority’s operational needs. This was paid by the Clarence, Sorell, Tasman and Kingborough Councils based on their respective shares in the Authority.
Class C Controlled waste facility development
While approval was obtained in June 2012 for the C cell project, community debate continued during the year under review. The Authority’s application to the Federal Government for a grant to assist with the cost of constructing the C cell was unsuccessful. The Authority is continuing its plans to progress construction of the cell this financial year.
Carbon pricing
The Clean Energy Act 2011 (the Act) introduced a carbon pricing mechanism, effective 1 July 2012. It is understood that the Commonwealth’s carbon pricing mechanism will not have an impact on the Authority.
A consultant was engaged to assess the impact of a carbon price on its operations. The report indicated that while the projection of methane gas emissions for the Authority over the next 30 years is over the 25 000 tonne limit, it is offset by the flaring of methane gas which places the Authority under the limit.
segregation of duties
The Authority’s operations are undertaken by a small number of staff, which increases risk due to a lack of segregation of duties. This risk was mitigated to an acceptable level by the nature and extent of audit testing we performed.
The audit was completed satisfactorily, with no major issues identified. At the time of writing this Chapter, a final management letter was being drafted.

52 Copping Refuse Disposal Site Joint Authority
summary of finanCial resulTsSTATEMENT OF COMPREHENSIVE INCOME
2012-13 2011-12$'000s $'000s
Waste management revenue 6 946 4 093 Total Revenue 6 946 4 093
Employee costs 548 466 Depreciation 977 704 Borrowings costs 324 353 Waste management costs 4 190 2 240
Total Expenses 6 039 3 763
Underlying Profit (Loss) 907 330
Income tax expense (272) (99)Comprehensive Profit 635 231
The Authority recorded an Underlying Profit of $0.907m, a large increase of $0.577m from 2011-12.
Revenue increased by $2.853m to $6.946m resulting from additional tonnage processed, approximately 40 000 tonnes, mainly due to the bushfires. This was offset by increased expenditure of $2.276m to $6.039m, largely due to the establishment of a provision for capping costs of $1.447m, with maintenance and operating expenses increasing by $0.341m. Depreciation rose by $0.273m to $0.977m reflecting that cells are depreciated according to total capacity as determined by regular volumetric surveys and the number of tonnes of waste delivered.

53Copping Refuse Disposal Site Joint Authority
STATEMENT OF FINANCIAL POSITION
2013 2012
$’000s $’000sCash and financial assets 2 599 577 Receivables 597 525 Other 34 5 Total Current Assets 3 230 1 107
Payables 807 594 Borrowings 444 416 Provisions - income tax 521 0 Provision - cell capping 1 447 0 Provision - employee benefits 37 23 Total Current Liabilities 3 256 1 033
Working Capital (26) 74
Property, plant and equipment 6 575 6 027 Deferred income tax asset 450 201 Other 100 100 Total Non-Current Assets 7 125 6 328
Borrowings 4 125 5 368 Deferred income tax liability 1 2 Provision - employee benefits 16 10 Total Non-Current Liabilities 4 142 5 380
Net Assets 2 957 1 022
Contributed Capital 1 324 24 Reserves 627 627 Accumulated (deficits) surpluses 1 006 371 Total Equity 2 957 1 022
Total Equity increased by $1.935m to $2.957m due to the Comprehensive Profit and the equity injection of $1.300m. Cash was $2.599m, an increase of $2.022m, resulting from the additional revenue received and equity injection after repayment of Borrowings of $1.216m which decreased total debt to $4.569m. Property, plant and equipment increased by $0.548m due to new cell developments.
Provision for capping of $1.447m was established this year for the reason discussed previously. This is shown as a current liability as the majority of this provision is expected to be expended in 2013-14 due to the completion of one cell.
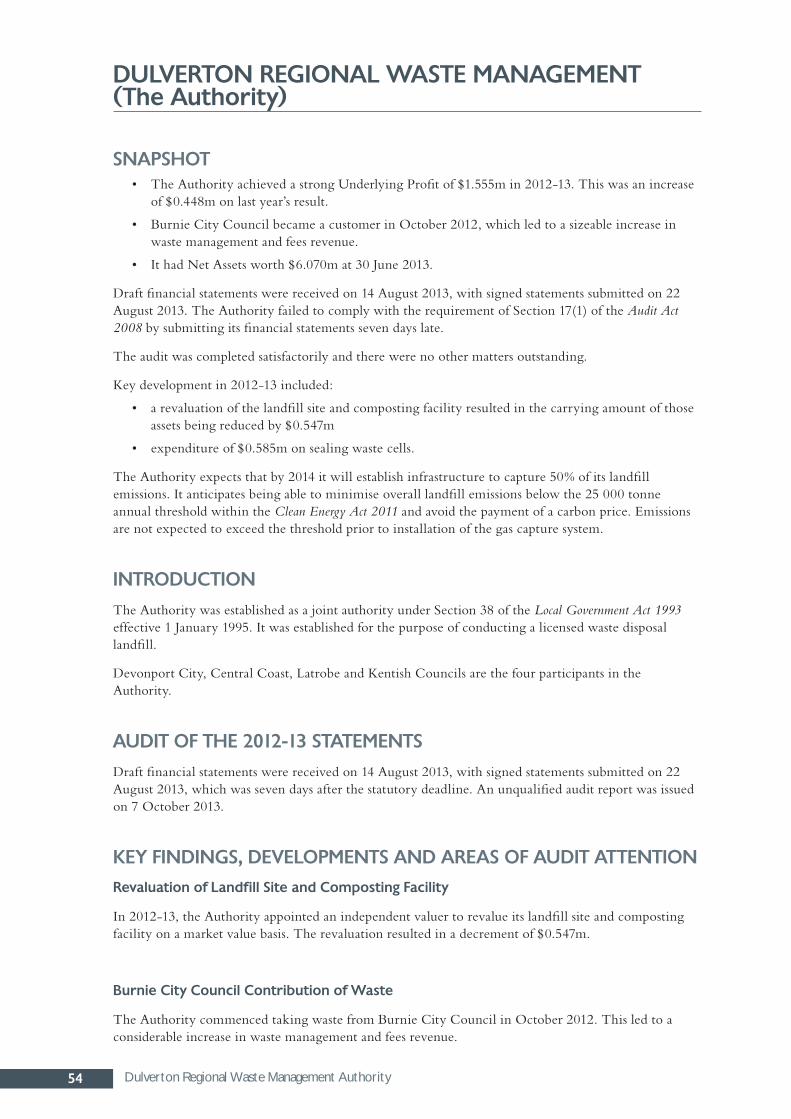
54 Dulverton Regional Waste Management Authority
dulverTon regional wasTe managemenT (The authority)
snapshoT• The Authority achieved a strong Underlying Profit of $1.555m in 2012-13. This was an increase
of $0.448m on last year’s result.
• Burnie City Council became a customer in October 2012, which led to a sizeable increase in waste management and fees revenue.
• It had Net Assets worth $6.070m at 30 June 2013.
Draft financial statements were received on 14 August 2013, with signed statements submitted on 22 August 2013. The Authority failed to comply with the requirement of Section 17(1) of the Audit Act 2008 by submitting its financial statements seven days late.
The audit was completed satisfactorily and there were no other matters outstanding.
Key development in 2012-13 included:
• a revaluation of the landfill site and composting facility resulted in the carrying amount of those assets being reduced by $0.547m
• expenditure of $0.585m on sealing waste cells.
The Authority expects that by 2014 it will establish infrastructure to capture 50% of its landfill emissions. It anticipates being able to minimise overall landfill emissions below the 25 000 tonne annual threshold within the Clean Energy Act 2011 and avoid the payment of a carbon price. Emissions are not expected to exceed the threshold prior to installation of the gas capture system.
inTroduCTionThe Authority was established as a joint authority under Section 38 of the Local Government Act 1993 effective 1 January 1995. It was established for the purpose of conducting a licensed waste disposal landfill.
Devonport City, Central Coast, Latrobe and Kentish Councils are the four participants in the Authority.
audiT of The 2012-13 sTaTemenTsDraft financial statements were received on 14 August 2013, with signed statements submitted on 22 August 2013, which was seven days after the statutory deadline. An unqualified audit report was issued on 7 October 2013.
key findings, developmenTs and areas of audiT aTTenTionrevaluation of landfill site and Composting facility
In 2012-13, the Authority appointed an independent valuer to revalue its landfill site and composting facility on a market value basis. The revaluation resulted in a decrement of $0.547m.
burnie City Council Contribution of waste
The Authority commenced taking waste from Burnie City Council in October 2012. This led to a considerable increase in waste management and fees revenue.
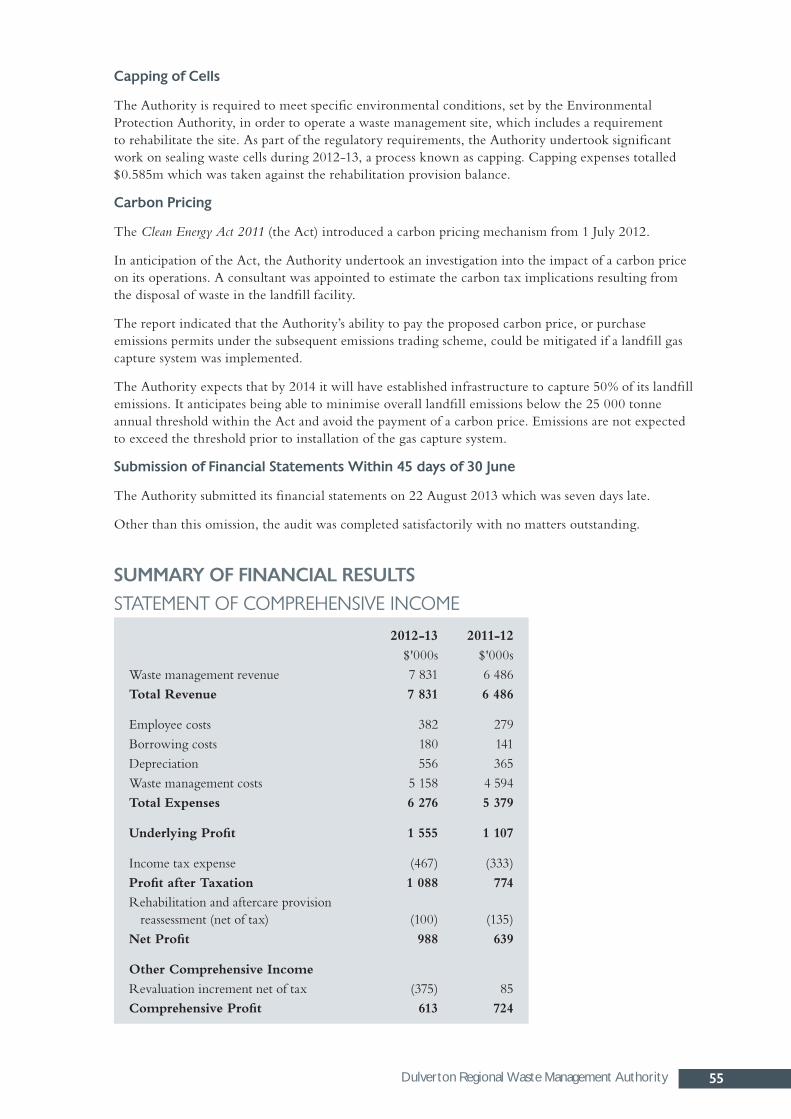
55Dulverton Regional Waste Management Authority
Capping of Cells
The Authority is required to meet specific environmental conditions, set by the Environmental Protection Authority, in order to operate a waste management site, which includes a requirement to rehabilitate the site. As part of the regulatory requirements, the Authority undertook significant work on sealing waste cells during 2012-13, a process known as capping. Capping expenses totalled $0.585m which was taken against the rehabilitation provision balance.
Carbon pricing
The Clean Energy Act 2011 (the Act) introduced a carbon pricing mechanism from 1 July 2012.
In anticipation of the Act, the Authority undertook an investigation into the impact of a carbon price on its operations. A consultant was appointed to estimate the carbon tax implications resulting from the disposal of waste in the landfill facility.
The report indicated that the Authority’s ability to pay the proposed carbon price, or purchase emissions permits under the subsequent emissions trading scheme, could be mitigated if a landfill gas capture system was implemented.
The Authority expects that by 2014 it will have established infrastructure to capture 50% of its landfill emissions. It anticipates being able to minimise overall landfill emissions below the 25 000 tonne annual threshold within the Act and avoid the payment of a carbon price. Emissions are not expected to exceed the threshold prior to installation of the gas capture system.
submission of financial statements within 45 days of 30 june
The Authority submitted its financial statements on 22 August 2013 which was seven days late.
Other than this omission, the audit was completed satisfactorily with no matters outstanding.
summary of finanCial resulTsSTATEMENT OF COMPREHENSIVE INCOME
2012-13 2011-12$'000s $'000s
Waste management revenue 7 831 6 486 Total Revenue 7 831 6 486
Employee costs 382 279 Borrowing costs 180 141 Depreciation 556 365 Waste management costs 5 158 4 594 Total Expenses 6 276 5 379
Underlying Profit 1 555 1 107
Income tax expense (467) (333)Profit after Taxation 1 088 774
Rehabilitation and aftercare provision reassessment (net of tax) (100) (135)
Net Profit 988 639
Other Comprehensive Income
Revaluation increment net of tax (375) 85 Comprehensive Profit 613 724

56 Dulverton Regional Waste Management Authority
In 2012-13, the Authority recorded an Underlying Profit of $1.555m (2011-12, $1.107m) an increase of $0.448m. The improved result was primarily due to Burnie City Council using the services of the Authority from October 2012. Higher revenue of $1.345m was partially offset by increased in Waste management costs. The construction of new waste cells in 2011-12 increased Depreciation to $0.556m this year.
STATEMENT OF FINANCIAL POSITION
2013 2012
$’000s $’000sCash 1 534 1 769 Receivables 897 944 Other assets 77 71 Total Current Assets 2 508 2 784
Payables 601 994 Borrowings 419 578 Provisions - employee benefits 27 18 Provisions - income tax 144 112 Provisions - rehabilitation 0 720 Total Current Liabilities 1 191 2 422
Working Capital 1 317 362
Property, plant and equipment 7 977 8 841 Deferred tax assets 205 335 Other assets 89 0 Total Non-Current Assets 8 271 9 176
Borrowings 2 115 2 709 Provisions - employee benefits 1 1 Provisions - rehabilitation 110 25 Provisions - aftercare 547 354 Deferred tax liabilities 745 992 Total Non-Current Liabilities 3 518 4 081
Net Assets 6 070 5 457
Contributed Capital 1 747 1 747 Reserves 2 319 2 694 Retained earnings 2 004 1 016 Total Equity 6 070 5 457
Total Equity increased by the Comprehensive Profit of $0.613m. The profit generated positive cash inflows from operations of $0.754m which included payment for cell capping of $0.585m. However, Cash decreased to $1.534m (2011-12, $1.769m) as cash inflows were used to repay Borrowings of $0.753m and fund plant and equipment purchases of $0.228m.
A condition of its operation is that the Authority carries provisions for rehabilitation and after care. In 2012-13, the total provision for rehabilitation decreased by $0.635m primarily due to capping expenses of $0.585m. The provision for aftercare increased due to a reassessment of the provision by $0.194m.
Property, plant and equipment decreased by $0.864m primarily due to Depreciation of $0.556m and a revaluation decrement of $0.537m.

57Cradle Coast Authority
Cradle CoasT auThoriTy (The authority)
snapshoT• The Authority recorded a Net Deficit of $0.351m for 2012-13.
• Net Assets decreased to $2.221m at 30 June.
• Cash decreased by $0.542m to $2.174m primarily due to the completion of the Caring for Our Country and the Healthy Communities grant programs.
• The Authority borrowed $0.550m in 2012-13 to fund Leasehold improvements of its new offices.
The Authority failed to meet its legislative requirements by submitting its financial statements 60 days late.
The Authority’s operations are undertaken by a small number of staff, which increases risk due to a lack of segregation of duties. This risk was mitigated to an acceptable level by the nature and extent of audit testing performed.
The audit was completed satisfactorily with no other items outstanding.
inTroduCTionThe Authority was established in 2000 as a Joint Authority under Section 38 of the Local Government Act 1993 (the Act) by its participating Councils: Burnie City, Devonport City, Waratah-Wynyard, Central Coast, Latrobe, Kentish, Circular Head, King Island and West Coast. These municipal areas combine to form the Cradle Coast region.
It was established to facilitate the sustainable development of the region, resolve regional issues and coordinate regional scale activity in areas such as tourism, health and local government services. The Authority also hosts the region’s Natural Resource Management Committee and its staff.
audiT of The 2012-13 sTaTemenTsSigned financial statements were received on 14 October 2013. An unqualified audit report was issued on 7 November 2013.
key findings, developmenTs and areas of audiT aTTenTionsubmission of financial statements
Section 17(1) of the Audit Act 2008, requires financial statements to be submitted to the Auditor-General within 45 days of the end of each financial year. The Authority failed to comply with this requirement and submitted its financial statements 60 days late.
office relocation
The Authority relocated its offices to new premises which required significant leasehold improvements. These works were funded by borrowings of $0.550m.
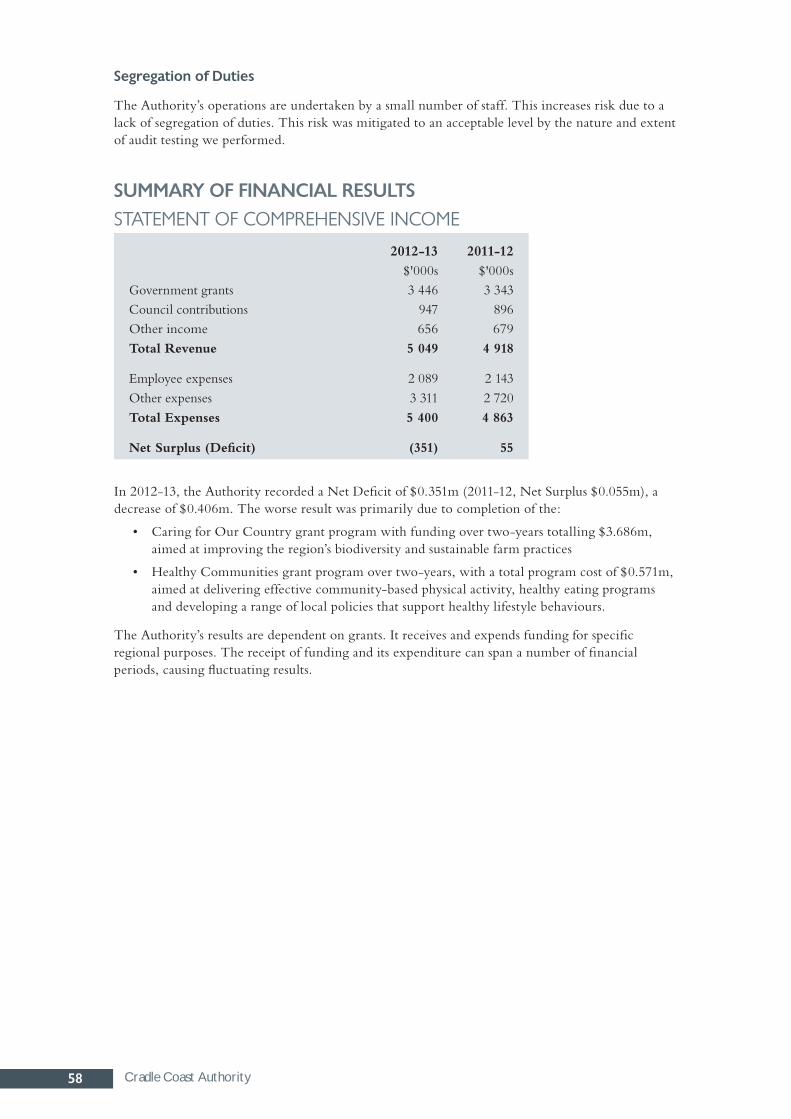
58 Cradle Coast Authority
segregation of duties
The Authority’s operations are undertaken by a small number of staff. This increases risk due to a lack of segregation of duties. This risk was mitigated to an acceptable level by the nature and extent of audit testing we performed.
summary of finanCial resulTsSTATEMENT OF COMPREHENSIVE INCOME
2012-13 2011-12$'000s $'000s
Government grants 3 446 3 343 Council contributions 947 896 Other income 656 679 Total Revenue 5 049 4 918
Employee expenses 2 089 2 143 Other expenses 3 311 2 720 Total Expenses 5 400 4 863
Net Surplus (Deficit) (351) 55
In 2012-13, the Authority recorded a Net Deficit of $0.351m (2011-12, Net Surplus $0.055m), a decrease of $0.406m. The worse result was primarily due to completion of the:
• Caring for Our Country grant program with funding over two-years totalling $3.686m, aimed at improving the region’s biodiversity and sustainable farm practices
• Healthy Communities grant program over two-years, with a total program cost of $0.571m, aimed at delivering effective community-based physical activity, healthy eating programs and developing a range of local policies that support healthy lifestyle behaviours.
The Authority’s results are dependent on grants. It receives and expends funding for specific regional purposes. The receipt of funding and its expenditure can span a number of financial periods, causing fluctuating results.

59Cradle Coast Authority
STATEMENT OF FINANCIAL POSITION
2013 2012
$’000s $’000sCash 2 174 2 716 Other assets 300 55 Plant and equipment 205 129 Leasehold improvements 515 0 Total Assets 3 194 2 900
Payables 227 146 Provisions - employee benefits 196 182 Borrowings 550 0 Total Liabilities 973 328
Net Assets 2 221 2 572
Total Equity 2 221 2 572
Total Equity decreased by the Net Deficit of $0.351m. Cash decreased to $2.174m (2011-12, $2.716m) due to completion of the previously mentioned grant programs, $0.399m, and the acquisition of office equipment, $0.149m.
During 2012-13, the Authority relocated its offices and expended $0.524m on Leasehold improvements, which were funded by Borrowings of $0.550m. Other assets increased to $0.300m (2011-12, $0.055m) primarily due to grant funding amounts receivable at year end. Higher Payables at 30 June 2013 related to increased expenditure at the end of the year relating to the completion of grant programs mentioned earlier.

60 Southern Tasmanian Councils Authority
souThern Tasmanian CounCils auThoriTy (The authority)
snapshoT• The Authority reported a Net Deficit of $0.033m in 2012-13. Its Net Assets totalled
$0.354m.
• It held $0.374m in cash, of which $0.199m was restricted, to be applied to the purpose for which it was provided.
• A number of projects were completed, or were nearing completion, during the year resulting in a decrease in the Authority’s grant revenue and a reduction in consulting and professional fees incurred.
inTroduCTionThe Authority is a joint authority established under the Local Government Act 1993. It is a body corporate, whose powers and functions are specified in its rules, as adopted by member Councils. The members of the Authority represent all twelve southern Tasmanian councils. Each member Council appoints a councillor to represent it and vote on its behalf at general meetings of the Authority.
The purpose of the Authority is to enable members to work together to facilitate and coordinate agreed regional development strategies and actions to achieve sustainable economic, environmental and social outcomes for the southern region of Tasmania.
The Authority procures accounting and administrative services from Hobart City Council.
audiT of The 2012-13 sTaTemenTsSigned financial statements were received on 15 August 2013 and an unqualified audit report was issued on 29 September 2013.
key findings, developmenTs and areas of audiT aTTenTionThere were no key findings, developments or areas of audit attention.
The audit was completed satisfactorily with no matters outstanding.
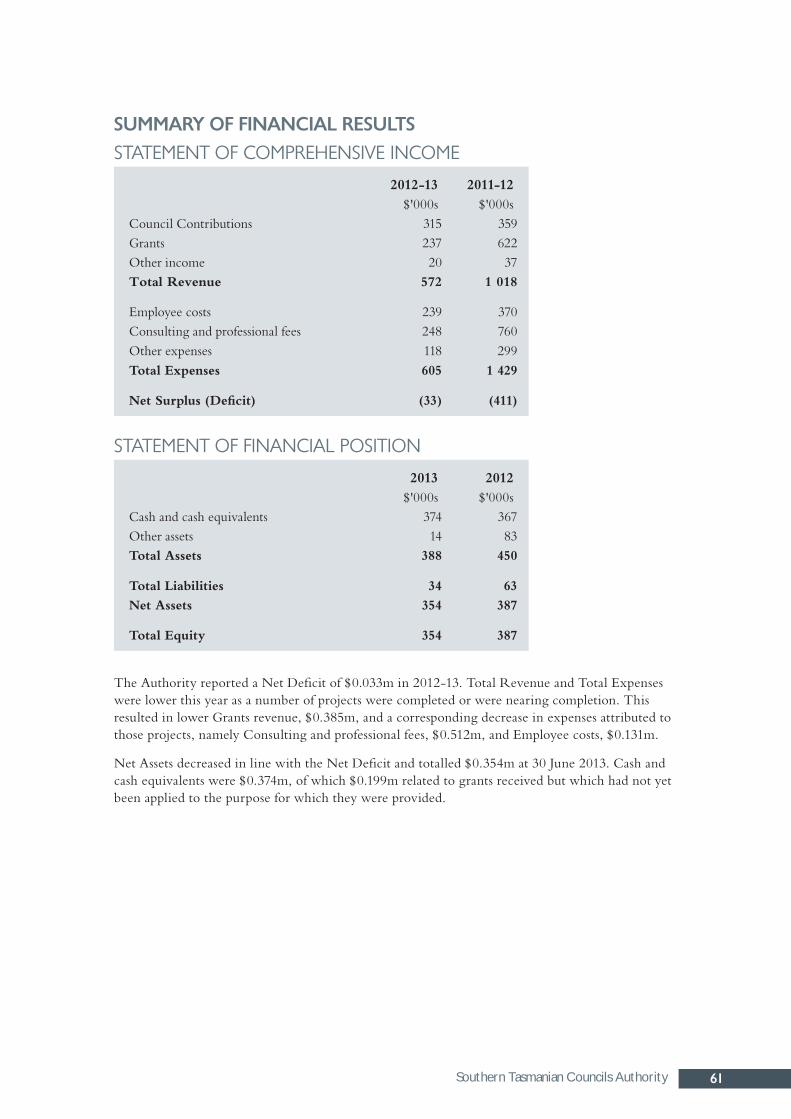
61Southern Tasmanian Councils Authority
summary of finanCial resulTsSTATEMENT OF COMPREHENSIVE INCOME
2012-13 2011-12$'000s $'000s
Council Contributions 315 359 Grants 237 622 Other income 20 37 Total Revenue 572 1 018
Employee costs 239 370 Consulting and professional fees 248 760 Other expenses 118 299 Total Expenses 605 1 429
Net Surplus (Deficit) (33) (411)
STATEMENT OF FINANCIAL POSITION
2013 2012$'000s $'000s
Cash and cash equivalents 374 367 Other assets 14 83 Total Assets 388 450
Total Liabilities 34 63
Net Assets 354 387
Total Equity 354 387
The Authority reported a Net Deficit of $0.033m in 2012-13. Total Revenue and Total Expenses were lower this year as a number of projects were completed or were nearing completion. This resulted in lower Grants revenue, $0.385m, and a corresponding decrease in expenses attributed to those projects, namely Consulting and professional fees, $0.512m, and Employee costs, $0.131m.
Net Assets decreased in line with the Net Deficit and totalled $0.354m at 30 June 2013. Cash and cash equivalents were $0.374m, of which $0.199m related to grants received but which had not yet been applied to the purpose for which they were provided.
62 Southern Waste Strategy Authority
souThern wasTe sTraTegy auThoriTy (The authority)
snapshoT• The Authority achieved improved financial results mainly because of the completion of two
internally funded projects in respect of which most costs were incurred in the prior year.
• A Net Surplus of $0.053m was achieved this year (2011-12, Deficit $0.034m).
• Net Assets totalled $0.204m ($0.151m) at 30 June 2013.
inTroduCTionThe Southern Waste Strategy Authority (the Authority) is a joint authority established under the Local Government Act 1993. The Authority is a body corporate, whose powers and functions are specified in its rules, as adopted by its member Councils. Members of the Authority represent all twelve southern Tasmanian councils. Each member Council appoints a councillor to represent it and vote on its behalf at general meetings of the Authority.
The purpose of the Authority is to facilitate integrated regional strategic waste planning in southern Tasmania and implementation thereof.
audiT of The 2012-13 sTaTemenTsSigned financial statements were received on 15 July 2013 and an unqualified audit opinion was issued on 14 August 2013.
key findings, developmenTs and areas of audiT aTTenTionThere were no key findings or developments.
A key financial reporting risk was identified which was the lack of segregation of duties because of the Authority’s small size. This risk was mitigated to an acceptable level by the nature and extent of audit testing we performed.
The audit was completed satisfactorily with no matters outstanding.

63Southern Waste Strategy Authority
summary of finanCial resulTsSTATEMENT OF COMPREHENSIVE INCOME
2012-13 2011-12$'000s $'000s
Member subscriptions 326 315Other income 18 6Total Revenue 344 321
Employee costs 162 172Advertising 42 38Consulting and professional fees 22 3Program costs 15 71Other expenses 50 71Total Expenses 291 355
Net Surplus (Deficit) 53 (34)
STATEMENT OF FINANCIAL POSITION
2013 2012
$’000s $’000sCash and cash equivalents 218 174Other assets 27 27Total Assets 245 201
Total Liabilities 41 50
Net Assets 204 151
Total Equity 204 151
The Authority’s financial results for 2012-13 were positively impacted by:
• the completion of two internally funded programs, E-Waste Collection and Household Hazardous Waste, reducing Program costs significantly this year
• one-off revenue of $0.014m received from member councils to assist with advertising expenditure.
These factors were partly offset by higher consultancy fees, $0.019m, to conduct a follow up review on a survey conducted in 2010-11 for Kerbside Waste Collection and Processing for Southern Tasmania.
The consequence of these factors was an improvement from a $0.034m deficit in 2011-12 to a surplus of $0.053m in 2012-13.
The surplus contributed to higher Net Assets which was mainly made up of higher cash balance offset partially by a reduction in employee provisions included in Total Liabilities.
64 Appendix 1 - Guide to Using This Report
appendix 1 - guide To using This reporT
This Report is prepared under section 29 of the Audit Act 2008 (the Audit Act), which requires the Auditor-General, on or before 31 December in each year, to report to Parliament in writing, on the audit of State entities and audited subsidiaries of State entities in respect of the preceding financial year. The issue of more than one report titled the Auditor-General’s Report on the Financial Statements of State Entities, comprising six volumes, satisfies this requirement each year. The volumes are:
• Volume 1 – Executive and Legislature, Government Departments, Tasmanian Health Organisations, Other General Government Sector State entities, Other State entities and Superannuation Funds
• Volume 2 – Government Businesses, Other Public Non-Financial Corporations and Water Corporations
• Volume 3 - Local Government Authorities (Part I and II)
• Volume 4 – Analysis of the Treasurer’s Annual Financial Report
• Volume 5 - Other State entities 31 December, including University of Tasmania.
Where relevant, State entities are provided with the opportunity to comment on any of the matters reported. Where they choose to do so, responses are detailed within that particular section.
formaT of The finanCial analysisEach entity’s financial performance is analysed by discussing the Comprehensive Income Statement, Statement of Financial Position and Statement of Cash Flows supplemented by Financial Analysis applying the indicators documented in the Financial Performance sections of this Report. The layout of some of these primary statements has been amended from the audited statements, to, where appropriate:
• make the statements more relevant to the nature of the entity’s business
• highlight the entity’s working capital, which is a useful measure of liquidity.
Departments are required to present budget amounts on the face of their primary statements. As a consequence details and commentary in relation to these amounts have been included in this Report.

65Appendix 1 - Guide to Using This Report
finanCial analysis
The following tables illustrate the methods of calculating performance indicators used in the individual financial analysis sections of this Report, together with a number of benchmarks used to measure financial performance
Financial Performance Indicator
Bench Mark1 Method of Calculation
financial performance
Earnings Before Interest and Tax (EBIT) ($'000s)
Result from Ordinary Activities before Gross Interest Expense and Tax
EBITDA ($’000s)Result from Ordinary Activities before
Gross Interest Expense, Tax, Depreciation and Amortisation
Operating margin >1.0Operating Revenue divided by Operating
Expenses
Operating surplus (deficit) ($'000s)
Own source revenue percentage
Operating surplus ratio >0Net operating surplus (deficit) divided by
total operating revenue
Own source revenueTotal Revenue less Total Grant Revenue,
Contributed Assets and Asset Revaluation Adjustments
Return on assets EBIT divided by Average Total Assets
Return on equityResult from Ordinary Activities after
Taxation divided by Average Total Equity
Self financing ratioNet Operating Cash Flows divided by
Operating Revenue
financial management
Asset consumption ratioBetween 40%
and 60%
Depreciated replacement cost of asset (eg. infrastructure, roads, bridges) divided by current replacement cost of asset
Asset renewal funding ratio 90%-100%Future (planned) asset replacement
expenditure divided by future asset replacement expenditure (actual) required
Capital Investment Gap, Asset investment ratio or Investment gap
>100%Payments for Property, plant and equipment
divided by Depreciation expenses
Asset sustainability ratio, Capital Replacement Gap, Asset renewal ratio or Renewal gap
100%Renewal and upgrade expenditure on
existing assets divided by depreciation on existing assets

66 Appendix 1 - Guide to Using This Report
Financial Performance Indicator
Bench Mark1 Method of Calculation
Cost of debtGross Interest Expense divided by Average
Borrowings (include finance leases)
Creditor turnover 30 daysPayables divided by credit purchases
multiplied by 365
Current ratio >1 Current Assets divided by Current Liabilities
Debt collection 30 daysReceivables divided by billable Revenue
multiplied by 365
Debt to equity Debt divided by Total Equity
Debt to total assets Debt divided by Total Assets
Indebtedness ratioNon-Current Liabilities divided by Own
Source Revenue
Interest coverage ratioNet operating cashflows less interest and
tax payments divided by Net interest payments
Interest cover – EBIT >2 EBIT divided by Gross Interest Expense
Interest cover – EBITDA >2 EBITDA divided by Gross Interest Expense
Interest cover – Funds from Operations
>2Cash from Operations plus Gross Interest
Expense divided by Gross Interest Expense
Liquidity ratio 2:1Liquid assets divided by current liabilities
other than provisions
Net financial assets (liabilities)($’000s)
Total financial liabilities less liquid assets
Net financial liabilities ratio 0 – (50%)Total liabilities less liquid assets divided by
total operating income
returns to government
CSO funding ($’000)Amount of community service obligation
funding received from Government
Dividend payout ratio 50%Dividend divided by Result from Ordinary
Activities after Tax
Dividend to equity ratioDividend paid or payable divided by Average
Total Equity
Dividends paid or payable ($'000s)
Dividends paid or payable that relate to the year subject to analysis
Effective tax rate 30%Income Tax paid or payable divided by
Result from Ordinary Activities before Tax
Government guarantee fees ($’000)
Amount of guarantee fees paid to owners (usually Government)

67Appendix 1 - Guide to Using This Report
Financial Performance Indicator
Bench Mark1 Method of Calculation
Income tax paid ($'000s)Income Tax paid or payable that relates to
the year subject to analysis
Total return to equity ratio Total Return divided by Average Equity
Total return to the State ($'000s) or total return to owners
Dividends plus Income Tax and Loan Guarantee fees
other information
Average leave per FTE ($'000s)Total employee annual and long service
leave entitlements divided by Staff Numbers
Average long service leave balance
Not more than 100
days
Actual long service leave provision days due divided by average FTEs
Average recreational leave balance
20 days 3
Actual annual leave provision days due divided by average FTEs
Average staff costs (2)
($'000s)
Total employee expenses (including capitalised employee costs) divided by Staff Numbers
Employee costs (2)
as a % of operating expenses
Total employee costs divided by Total Operating Expenses
Employee costs capitalised ($'000s)
Capitalised employee costs
Employee costs expensed ($'000s)
Total employee costs per Income Statement
Operating cost to rateable property
Operating expenses plus finance costs divided by rateable properties per valuation roll
Rates per capitaPopulation of council area divided by rates
revenue
Rates per operating revenueTotal rates divided by operating revenue
including interest income
Rates per rateable propertyTotal rates revenue divided by rateable
properties per valuation rolls
Staff numbers FTEs Effective full time equivalents
1 Benchmarks vary depending on the nature of the business being analysed. For the purposes of this Report, a single
generic benchmark has been applied.
2 Employee costs include capitalised employee costs, where applicable, plus on-costs.
3 May vary in some circumstances because of different award entitlements.

68 Appendix 1 - Guide to Using This Report
An explanation of most financial performance indicators is provided below:
finanCial performanCe• Earnings before interest and tax (EBIT) – measures how well an entity can earn a
profit, from its operations, regardless of how it is financed (debt or equity) and before it has to meet external obligations such as income tax. This is a measure of how well it goes about its core business.
• Earnings before income tax, depreciation and amortisation (EBITDA) – measures how well an entity can generate funds without the effects of financing (debt or equity), depreciation and amortisation and before it has to meet external obligations such as income tax. This measure is of particular relevance in cases of entities with large amounts of non-current assets as the distortionary accounting and financing effects on the entity’s earnings are removed, enabling comparisons to be made across different entities and sectors.
• Operating margin – this ratio serves as an overall measure of operating effectiveness.
• Operating Surplus (Deficit) or Result from operations – summarises revenue transactions and expense transactions incurred in the same period of time and calculates the difference.
• Operating surplus ratio – a positive result indicates a surplus with the larger the surplus the stronger surplus and therefore stronger assessment of sustainability. However, too strong a result could disadvantage ratepayers. A negative result indicates a deficit which cannot be sustained in the long-term.
• Own source revenue – represents revenue generated by a council through its own operations. It excludes any external Government funding, contributed assets and revaluation adjustments.
• Return on assets – measures how efficiently management used assets to earn profit. If assets are used efficiently, they earn profit for the entity. The harder the assets work at generating revenues, and thus profit, the better the potential return for the owners.
• Return on equity – measures the return the entity has made for the shareholders on their investment.
• Self financing ratio – this is a measure of council’s ability to fund the replacement of assets from cash generated from operations.
finanCial managemenT• Asset consumption ratio – shows the depreciated replacement cost of an entity’s
depreciable assets relative to their ‘as new’ (replacement) value. It therefore shows the average proportion of new condition left in the depreciable assets.
• Asset renewal funding ratio – measures the capacity to fund asset replacement requirements. An inability to fund future requirements will result in revenue, expense or debt consequences, or a reduction in service levels. This is a most useful measure relying on the existence of long-term financial and asset management plans.
• Asset sustainability ratio – provides a comparison of the rate of spending on existing infrastructure, property, plant and equipment through renewing, restoring and replacing existing assets, with depreciation. Ratios higher than 100% indicate that spending on existing assets is greater than the depreciation rate. This is a long-term indicator, as capital expenditure can be deferred in the short-term if there are insufficient funds available from operations and borrowing is not an option.
• Capital Investment Gap, Asset investment ratio or Investment gap – indicates whether the entity is maintaining its physical capital by re-investing in or renewing non-current assets (caution should be exercised when interpreting this ratio for entities with significant asset balances at cost as the level of depreciation may be insufficient).
• Capital Replacement Gap, Asset renewal ratio or Renewal gap – indicates whether the entity is maintaining its physical capital by re-investing in or renewing existing non-
69Appendix 1 - Guide to Using This Report
current assets (caution should be exercised when interpreting this ratio as the amount of capital expenditure on existing assets has largely been provided by the respective councils and not subject to audit).
• Cost of debt – reflects the average interest rate applicable to debt.
• Creditors turnover – indicates how extensively the entity utilises credit extended by suppliers.
• Current ratio – current assets should exceed current liabilities by a ‘considerable’ margin. It is a measure of liquidity that shows an entity’s ability to pay its short term debts.
• Debt collection – indicates how effectively the entity uses debt collection practices to ensure timely receipt of monies owed by its customers.
• Debt to equity – an indicator of the risk of the entity’s capital structure in terms of the amount sourced from borrowings and the amount from Government.
• Debt to total assets – an indicator of the proportion of assets that are financed through borrowings.
• Interest cover – EBIT – an indicator of the ability to meet periodic interest payments from current profit (before interest expense). The level of interest cover gives a guide of how much room there is for interest payments to be maintained in the face of interest rate increases or reduced profitability.
• Interest cover – Funds from operations – examines the exposure or risk in relation to debt, an indicator of the ability to meet periodic interest payments from funds from operations (before interest expense). The level of interest cover gives a guide of how much room there is for interest payments to be maintained in the face of interest rate increases or reduced funds from operations.
• Net financial liabilities ratio – indicates the extent to which net liabilities can be met by operating income. A falling ratio indicates that the entity’s capacity to meet its financial obligations from operating income is strengthening.
reTurns To governmenT• Dividend payout ratio – the amount of dividends relative to the entity’s net income.
• Dividend to equity ratio – the relative size of an entity’s dividend payments to shareholders’ equity. A low dividend to equity ratio may indicate that profits are being retained by the entity to fund capital expenditure.
• Dividends paid or payable – payment by the entity to its shareholders (whether paid or declared as a payable).
• Effective tax rate – is the actual rate of tax paid on profits.
• Income tax paid – tax payments by the entity to the State in the year.
• Total return to equity ratio – measures the Government’s return on its investment in the entity.
• Total return to the State – is the funds paid to the owners consisting of income tax, dividends and guarantee fees.
oTher informaTion• Average leave balance per FTE ($’000s) – indicates the extent of unused leave at balance
date.
• Average long service leave balance or days long service leave due – records the average number of days long service leave accumulated per staff member.
• Average recreational leave balance or days annual leave due – records the average number of days annual leave accumulated per staff member. In general, council staff accrue 20 days annual leave per annum.

70 Appendix 1 - Guide to Using This Report
• Average staff costs – measures the average cost of employing staff in the entity for the year.
• Employee costs as a percentage of operating expenses - indicates the relative significance of employee costs compared to other operating expenses.
• Employee costs capitalised ($’000s) – represents employee costs that have been capitalised rather than expensed.
• Employee costs expensed ($’000s) – represents the level of employee costs expensed, i.e. included in the Statement of Comprehensive Income. This together with the Employee costs Capitalised will provide a total employee cost figure for use in other related ratios.
• Staff numbers FTEs – as at the end of the reporting period the number of staff employed expressed as full-time equivalents (FTEs).
The above indicators are used because they are commonly applied to the evaluation of financial performance. Care should be taken in interpreting these measures, as by definition they are only indicators, and they should not be read in isolation.
audiT findings - risk CaTegories
In reporting audit finding to clients, we have determined the following three risk categories. These categories are based on their significance and potential impact on the client.
Risk Category Client Impact
High Matters which pose a significant business or financial risk to the entity and/or matters that have resulted or could potentially result in a modified or qualified audit opinion if not addressed as a matter of urgency by the entity.
Moderate Matters of a systemic nature that pose a moderate business or financial risk to the entity if not addressed as high priority within the current financial year and/or matters that may escalate to high risk if not addressed promptly and/or low risk matters which have been reported to management in the past but have not been satisfactorily resolved or addressed.
Low Matters that are isolated, non-systemic or procedural in nature and/or matters that reflect relatively minor administrative shortcomings and could be addressed in the context of the entity’s overall control environment.
71Appendix 2 - Glossary
appendix 2 - glossaryaccountability
The responsibility to provide information to enable users to make informed judgements about the performance, financial position, financing and investing, and compliance of the State entity.
adverse opinion
An adverse opinion is issued when the auditor, having obtained sufficient appropriate audit evidence, concludes that misstatements, individually or in the aggregate, are both material and pervasive to the financial report.
amortisation
The systematic allocation of the depreciable amount of an intangible asset over its useful life.
asset
A resource controlled by an entity as a result of past events, and from which future economic benefits are expected to flow to the entity.
asset useful life
The period over which an asset is expected to provide the entity with economic benefits. Depending on the nature of the asset, the useful life can be expressed in terms of time or output.
asset valuation
The fair value of an asset on a particular date.
audit act 2008
An Act of the State of Tasmania that:
• ensures that the State has an Auditor-General with the necessary functions, immunities and independence
• provides for the independent audit of the public sector and related entities.
auditor’s opinion (or auditor’s report)
Written expression within a specified framework indicating the auditor’s overall conclusion on the financial reports based on audit evidence obtained.
biological asset
A living animal or plant.
borrowing costs
Interest and other costs that an entity incurs in connection with the borrowing of funds.
Capital expenditure
Amount capitalised to the Statement of Financial Position (also referred to as the balance sheet) for expenditure on or contributions by a State entity to major assets controlled or owned by the entity, including expenditure on:
• capital renewal of existing assets that returns the service potential or the life of the asset to that which it had originally been commissioned
• capital expansion which extends an existing asset at the same standard to a new group of users.
72 Appendix 2 - Glossary
Capital grant
Government funding provided to an agency for acquiring capital assets such as buildings, land or equipment.
Carrying amount
The amount at which an asset is recognised after deducting any accumulated depreciation (amortisation) and accumulated impairment losses thereon.
Cash
Cash on hand and demand deposits.
Cash equivalents
Short-term, highly liquid investments that are readily convertible to known amounts of cash and which are subject to an insignificant risk of changes in value.
Cash flows
Inflows and outflows of cash and cash equivalents.
Comprehensive result
The overall net result of all items of income and expense recognised for the period. It is the aggregate of net surplus (deficit) or profit (loss) and other movements in equity.
Consolidated financial statements
The financial statements of a group in which the assets, liabilities, equity, income, expenses and cash flows of the parent and its subsidiaries are presented as those of a single economic entity.
Contributed assets
Assets, usually property, plant and equipment, contributed to a State entity at no cost or are non-reciprocal.
Control
The capacity of an entity to dominate decision-making, directly or indirectly, in relation to the financial and operating policies of another entity so as to enable that other entity to operate with it in achieving the objectives of the controlling entity.
Corporations act 2001
An Act of the Commonwealth of Australia that sets out the laws dealing with business entities in Australia at Federal and State levels. It focuses primarily on companies, although it also covers some laws relating to other entities such as partnerships and managed investment schemes.
Cost
The amount of cash or cash equivalents paid or the fair value of the other consideration given to acquire an asset at the time of its acquisition or construction.
The Council
The group of councillors, who are the elected representatives of people who are residents in the council’s municipality or ratepayers of the council.
73Appendix 2 - Glossary
Current asset
An asset that an entity:
• expects to realise or intends to sell or consume it in its normal operating cycle;
• holds primarily for the purpose of trading;
• expects to realise within twelve months after the reporting period; or
• is cash or a cash equivalent unless it is restricted from being exchanged or used to settle a liability for at least twelve months after the reporting period.
An entity shall classify all other assets as non-current.
Current liability
A liability that an entity:
• expects to settle in its normal operating cycle;
• it holds primarily for the purpose of trading;
• is due to be settled within twelve months after the reporting period; or
• does not have an unconditional right to defer settlement for at least twelve months after the reporting period.
An entity shall classify all other liabilities as non-current.
(Current) replacement cost
The cost an entity would incur to acquire the asset at the end of the reporting period.
deficit
Total expenditure exceeds Total Revenue. Term is generally applied to results of not-for-profit entities. Equivalent term in the case of for-profit entities is a loss.
depreciation
The systematic allocation of the depreciable amount of an asset over its useful life.
depreciated replacement cost
The current replacement cost of an asset less, where applicable, accumulated depreciation calculated on the basis of such cost to reflect the already consumed or expired future economic benefits of the asset.
derivative
A financial instrument or other contract with all three of the following characteristics:
• its value changes in response to the change in a specified interest rate, financial instrument price, commodity price, foreign exchange rate, index of prices or rates, credit rating or credit index, or other variable, provided in the case of a non-financial variable that the variable is not specific to a party to the contract (sometimes called the ‘underlying’)
• it requires no initial net investment or an initial net investment that is smaller than would be required for other types of contracts that would be expected to have a similar response to changes in market factors
• it is settled at a future date.
disclaimer of opinion
A disclaimer of opinion is used when it is not possible for the auditor to form an opinion. This may occur in rare circumstances when the auditor is unable to obtain sufficient appropriate audit
74 Appendix 2 - Glossary
evidence on which to base the opinion, and the auditor concludes that the possible effects on the financial report of undetected misstatements, if any, could be both material and pervasive.
emphasis of matter
An auditor’s report can include an emphasis of matter paragraph that draws attention to a disclosure or item in the financial report that is relevant to the users of the report but is not of such nature that it affects the auditor’s opinion (i.e. the auditor’s opinion remains unmodified).
employee benefits provision
The liability recognised for employees’ accrued service entitlements, including all costs related to employment consisting of wages and salaries, leave entitlements, redundancy payments and superannuation contributions.
equity or net assets
Residual interest in the assets of an entity after deduction of its liabilities. Where liabilities exceed assets, this gives rise to negative equity or net liabilities or accumulated deficits.
expense
Outflows or other depletions of economic benefits in the form of incurrence of liabilities or depletion of assets of the entity, other than those relating to contributions by owners, that results in a decrease in equity, or increase in a liability, during the reporting period.
fair value
The amount for which an asset could be exchanged or a liability settled, between knowledgeable, willing parties in an arm’s length transaction.
financial asset
Any asset that is:
• cash
• an equity instrument of another entity
• a contractual right:
○ to receive cash or another financial asset from another entity; or
○ to exchange financial assets or financial liabilities with another entity under conditions that are potentially favourable to the entity; or
• a contract that will or may be settled in the entity’s own equity instruments and is:
○ a non-derivative for which the entity is or may be obliged to receive a variable number of the entity’s own equity instruments; or
○ a derivative that will or may be settled other than by the exchange of a fixed amount of cash or another financial asset for a fixed number of the entity’s own equity instruments.
financial delegation
A schedule that specifies the level or approval required for each transaction category to facilitate the execution of functions necessary for the efficient operation of the entity.
financial liability
Any liability that is:
• a contractual obligation:
○ to deliver cash or another financial asset to another entity; or

75Appendix 2 - Glossary
○ to exchange financial assets or financial liabilities with another entity under conditions that are potentially unfavourable to the entity; or
• a contract that will or may be settled in the entity’s own equity instruments and is:
○ a non-derivative for which the entity is or may be obliged to deliver a variable number of the entity’s own equity instruments; or
○ a derivative that will or may be settled other than by the exchange of a fixed amount of cash or another financial asset for a fixed number of the entity’s own equity instruments.
financial position
The relationship of the assets, liabilities and equity of an entity, as reported in the Statement of Financial Position (balance sheet).
financial report
Structured representation of financial information, which usually includes accompanying notes, derived from accounting records and intended to communicate an entity’s financial performance over a period of time and its economic resources or obligations at a point in time in accordance with a financial reporting framework.
financial statements
A complete set of financial statements comprises:
• a Statement of Financial Position as at the end of the period
• a Statement of Profit or Loss and Other Comprehensive Income for the period
• a Statement of Changes in Equity for the period
• a Statement of Cash Flows for the period
• Notes, comprising a summary of significant accounting policies and other explanatory information
• comparative information in respect of the preceding period
• a Statement of Financial Position as at the beginning of the preceding period when an entity applies an accounting policy retrospectively or makes a retrospective restatement of items in its financial statements, or when it reclassifies items in its financial statements.
An entity may use titles for the statements other than those used in the relevant accounting standard. For example, an entity may use the title ‘Statement of Comprehensive Income’ instead of ‘Statement of Profit or Loss and Other Comprehensive Income’.
financial sustainability
An entity’s ability to manage financial resources so it can meet its spending commitments both at present and into the future.
financial year
The period of 12 months for which a financial report is prepared.
for-profit entity
An entity whose principal objective is the generation of profit. A for-profit entity can be a single entity or a group of entities comprising the parent entity and each of the entities that it controls.
future economic benefit
The potential to contribute, directly or indirectly, to the flow of cash and cash equivalents to the entity. The potential may be a productive one that is part of the operating activities of the entity. It may also take the form of convertibility into cash or cash equivalents or a capability to reduce cash outflows.

76 Appendix 2 - Glossary
general purpose financial report
A financial report intended to meet the information needs common to users who are unable to command the preparation of reports tailored so as to satisfy, specifically, all of their information needs.
going concern
An entity which is expected to be able to pay its debts as and when they fall due, and continue in operation for the foreseeable future without any intention or necessity to liquidate or otherwise wind up its operations.
governance
The control arrangements in place at an entity that are used to govern and monitor its activities in order to achieve its strategic and operational goals.
government business enterprises act 1995
An Act that makes provision in respect of the establishment, commercial operation and accountability of Government Business Enterprises, the relationship between Government Business Enterprises and the Government and the payment of financial returns to the State by Government Business Enterprises and for related purposes.
impairment loss
The amount by which the carrying amount of an asset exceeds its recoverable amount.
internal audit
A function of an entity’s governance framework that examines and reports to management, or those charged with governance, on the effectiveness of risk management, control and governance processes.
independent auditor’s report
An expression of the independent auditor’s opinion on an entity’s financial (and performance) report.
intangible asset
An identifiable non-monetary asset without physical substance.
internal control
Processes affected by an entity’s structure, work and authority flows, people and management information systems, designed to assist the entity accomplish specific goals and objectives. Internal controls are a means by which an entity’s resources are directed, monitored and measured. They play an important role in preventing and detecting error and fraud and protecting the entity’s resources.
investment
The expenditure of funds intended to result in medium to long-term service and/or financial benefits arising from the development and/or use of infrastructure assets by either the public or private sectors.
joint venture
A contractual agreement joining together two or more parties for the purpose of executing a particular business undertaking. All parties agree to share in the profits and losses of the enterprise.

77Appendix 2 - Glossary
land under roads
Land under roadways, and road reserves, including land under footpaths, nature strips and median strips.
liability
A present obligation of the entity arising from past events, the settlement of which is expected to result in an outflow of resources from the entity.
local government act 1993
An Act of the State of Tasmania that provides for local government and establishes councils to plan for, develop and manage municipal areas in the interests of their communities.
loss
Total expenditure exceeds total revenue. Term is generally applied to results of for-profit entities. Equivalent term in the case of not-for-profit entities is a deficit.
masterfile
A database of records pertaining to one of the main subjects of an information system, such as customers, employees and vendors. Masterfiles contain descriptive data that does not often change, such as name and address and bank account details.
material
Omissions or misstatements of items are material if they could, individually or collectively, influence the economic decisions that users make on the basis of the financial statements. Materiality depends on the size and nature of the omission or misstatement judged in the surrounding circumstances. The size or nature of the item, or a combination of both, could be the determining factor.
materiality
Information is material if its omission or misstatement could influence the economic decisions of users taken on the basis of the financial report.
modified audit opinion
The Auditing Standards establish three types of modified opinions, namely, a qualified opinion, an adverse opinion, and a disclaimer of opinion. The decision regarding which type of modified opinion is appropriate depends upon:
• the nature of the matter giving rise to the modification, that is, whether the financial report is materially misstated or, in the case of an inability to obtain sufficient appropriate audit evidence, may be materially misstated; and
• the auditor’s judgement about the pervasiveness of the effects or possible effects of the matter on the financial report.
non-financial asset
Physical assets such as land, buildings and infrastructure.
non-reciprocal
Transfers in which an entity receives assets without directly giving equal value in exchange to the other party to the transfer.
78 Appendix 2 - Glossary
not-for-profit entity
An entity whose principal objective is not the generation of profit. A not-for-profit entity can be a single entity or a group of entities comprising the parent entity and each of the entities that it controls.
onerous contract
A contract in which the unavoidable costs of meeting the obligations under the contract exceed the economic benefits expected to be received under it.
operating cycle
The time between the acquisition of assets for processing and their realisation in cash or cash equivalents.
performance report
A statement containing pre-determined performance indicators and targets and actual results against these for that financial year, with an explanation for any significant variance between the results and the targets.
pervasive
A term used, in the context of misstatements, to describe the effects on the financial report of misstatements or the possible effects on the financial report of misstatements, if any, that are undetected due to an inability to obtain sufficient appropriate audit evidence. Pervasive effects on the financial report are those that, in the auditor’s judgement:
• are not confined to specific elements, accounts or items of the financial report;
• if so confined, represent or could represent a substantial proportion of the financial report; or
• in relation to disclosures, are fundamental to users’ understanding of the financial report.
profit
Total revenue exceeds total expenditure. Term is generally applied to results of profit entities. Equivalent term in the case of not-for-profit entities is a surplus.
property, plant and equipment (including infrastructure)
Tangible items that:
• are held for use in the production or supply of goods or services, for rental to others, or for administrative purposes; and
• are expected to be used during more than one period.
public sector entity
A department; a public hospital; a local government; a statutory body; an entity controlled by one, or more than one department, public hospital, local government or statutory body; or an entity controlled by a public sector entity.
Qualified audit opinion
A qualification is issued when the auditor concludes that an unqualified opinion cannot be expressed due to one of the following reasons:
• The auditor, having obtained sufficient appropriate audit evidence, concludes that misstatements, individually or in the aggregate, are material, but not pervasive, to the financial report; or
79Appendix 2 - Glossary
• The auditor is unable to obtain sufficient appropriate audit evidence on which to base the opinion, but the auditor concludes that the possible effects on the financial report of undetected misstatements, if any, could be material but not pervasive.
A qualified opinion shall be expressed as being except for the effects of the matter to which the qualification relates.
recoverable amount
The higher of an asset’s net selling price and its value in use.
relevant
Measures or indicators used by an entity are relevant if they have a logical and consistent relationship to an entity’s objectives and are linked to the outcomes to be achieved.
residual value (of an asset)
The estimated amount that an entity would currently obtain from disposal of an asset, after deducting the estimated costs of disposal, if the asset were already of the age and in the condition expected at the end of its useful life.
revaluation
Recognising a reassessment or restatement of values for assets or liabilities at a particular point in time.
revenue
Inflows of funds or other enhancements or savings in outflows of service potential, or future economic benefits in the form of increases in assets or reductions in liabilities of the entity, other than those relating to contributions by owners which result in an increase in equity during the reporting period.
risk
The chance of a negative impact on the objectives, outputs or outcomes of the entity.
special purpose financial statements
A financial report intended to only meet the information needs of specific users who are able to command the preparation of reports tailored so as to satisfy, specifically, all of their information needs.
stakeholder
A person, group, or organisation that has a direct or indirect stake in an organisation because it can affect or be affected by the organisation’s actions, objectives and policies.
state entity
A body, whether corporate or unincorporated, that has a public function to exercise on behalf of the State or is wholly owned by the State, as defined under the Audit Act 2008, including:
• an agency
• a council
• a Government Business Enterprise
• a State-owned company
• a State authority that is not a Government Business Enterprise

80 Appendix 2 - Glossary
• the council, board, trust or trustees, or other governing body (however designated) of, or for, a corporation, body of persons or institution, that is or are appointed by the Governor or a Minister of the Crown
• a body or authority referred to in section 21, established under section 29 or 30, or continued under section 326, of the Local Government Act 1993
• the Corporation incorporated under section 5 of the Water and Sewerage Corporation Act 2012
• a body or authority in respect of which the Treasurer has made a determination under section 32A.
state owned Company
A company incorporated under the Corporations Act which is controlled by:
• the Crown
• a State authority
• another company which is itself controlled by the Crown or a State authority.
steering committee
Provides oversight and strategic direction for key organisational processes or risk.
surplus
Total revenue exceeds total expenditure. Term is generally applied to results of not-for-profit entities. Equivalent term in the case of for-profit entities is a profit.
Those charged with governance
The person(s) with responsibility for overseeing the strategic direction of the entity and obligations related to the accountability of the entity. This includes overseeing the financial reporting process. In most cases this would be the Board of Directors (or equivalent). In the case of government departments, this would be the Secretary. If an entity has an audit committee or equivalent then that committee may have the governance function delegated to it.
unqualified audit opinion – financial report
A positive written expression provided when the financial report has been prepared and presents fairly the transactions and balances for the reporting period in accordance with the requirements of the relevant legislation and Australian accounting standards.
Also referred to as a clear audit opinion.
value in use
The present value of estimated future cash flows expected to arise from the continuing use of an asset and from its disposal at the end of its useful life.
value in use (in respect of not-for-profit entities)
Depreciated replacement cost of an asset when the future economic benefits of the asset are not primarily dependent on the asset’s ability to generate net cash inflows and where the entity would, if deprived of the asset, replace its remaining future economic benefits.
working capital
Working capital is the amount of current assets minus the amount of current liabilities at a specific date. It reflects how much in liquid assets that an entity has on hand. Working capital is needed to pay for planned and unexpected expenses and meet the short-term obligations.
81Appendix 3 - Acronyms and Abbreviations
appendix 3 - aCronyms and abbreviaTions
AAS Australian Accounting StandardsAAR Average Area RateAASB Australian Accounting Standards BoardABF Activity Based FundingAEMO Australian Energy Market OperatorAEMC Australian Energy Market CommissionAER Australian Energy RegulatorAETV Aurora Energy Tamar ValleyAPRA Australian Prudential Regulation AuthorityBBP Bell Bay Power Pty LtdBLW Ben Lomond WaterCEO Chief Executive OfficerCFO Chief Financial OfficerCLAF Crown Land Administration FundCMW Cradle Mountain WaterCOPE Commonwealth Own Purpose ExpenditureCPI Consumer Price IndexDHHS Department of Health and Human ServicesDIER Department of Infrastructure, Energy and ResourcesDORC Depreciated Optimised Replacement CostDPIPWE Department of Primary Industries, Parks, Water and
EnvironmentEBIT Earnings Before Interest and TaxEBITDA Earnings Before Interest, Tax, Depreciation and AmortisationEEP Environmental Energy ProductsFBT Fringe Benefits TaxFCAS Frequency Control Ancillary ServicesFMAA Financial Management and Audit Act 1990FTE Full-time EquivalentFSI Forest Services InternationalGBE Government Business EnterpriseGWh Gigawatt HourHEC Hydro-Electric CorporationIRRs Inter Regional RevenuesIS Information SecurityIT Information TechnologyKIPC King Island Ports CorporationKV KilovoltLGA Local Government AreaLG Local GovernmentLGAT Local Government Association of TasmaniaLSL Long Service LeaveMAIB Motor Accidents Insurance BoardMAR Maximum Allowable RevenueMIC Member Investment Choice
82 Appendix 3 - Acronyms and Abbreviations
MWh Megawatt Hour
NEM National Electricity MarketNEMMCO National Electricity Market Management Company LimitedNewood Newood Holdings Pty LtdPRBF Parliamentary Retiring Benefits FundPSF Parliamentary Superannuation FundR40s Roaring 40s Renewable Energy Pty LtdRBF Retirement Benefits FundRBFB Retirement Benefits Fund BoardREC Renewable Energy CertificatesSFC State Fire CommissionSFCSS State Fire Commission Superannuation SchemeSG Superannuation GuaranteeSOC State Owned CompanySW Southern WaterTAS Tasmanian Accumulation SchemeTascorp Tasmanian Public Finance CorporationTasracing Tasracing Pty LtdTASSS Tasmanian Ambulance Service Superannuation SchemeTasWater Tasmanian Water and Sewerage Corporation Pty LtdTCFA Tasmanian Community Forest AgreementTDRA Temporary Debt Repayment AccountTFA Tasmanian Forests AgreementTFIA Tasmanian Forest Intergovernmental AgreementTFS Tasmanian Fire ServiceTHO Tasmanian Health OrganisationTI Treasurer’s InstructionTIPL Tasmanian Irrigation Pty LtdTMD (formerly known as Telecommunications Management
Division), a division of the Department of Premier and Cabinet TVPS Tamar Valley Power StationTWSC Tasmanian Water and Sewerage CorporationUTAS University of TasmaniaWACC Weighted Average Cost of CapitalWIF Water Infrastructure FundVaR Value at Risk

83Appendix 4 - Recent Reports
appendix 4 - reCenT reporTs
Tabled no. TiTle
March No. 8 of 2011-12 The assessment of land-use planning applications
June No. 9 of 2011-12 Volume 6 - Other State Entities 30 June 2011 and 31 December 2011
June No. 10 of 2011-12 Public Trustee: management of minor trusts
June No. 11 of 2011-12 Updating the Motor Registry System
June No. 12 of 2011-12 Follow up of Special Reports 75-81
July No 1 of 2012-13 Sale of TOTE Tasmania
October No 2 of 2012-13 TasPorts: benefits of amalgamation - October 2012
November No 3 of 2012-13 Volume 3 - Government Business Enterprises, State Owned Companies and Water Corporations 2011-12
November No 4 of 2012-13 Volume 4 - Local Government Authorities 2011-12
November No 5 of 2012-13 Volume 1 - Analysis of the Treasurer’s Annual Financial Report 2011-12
November No 6 of 2012-13 Volume 2 - Executive Legislature, Government Departments, other General Government Sector State entities and Superannuation Funds 2011-12
December No 7 of 2012-13 Compliance with the Tasmanian Adult Literacy Plan 2010-15
March No 8 of 2012-13 National Partnership Agreement on Homelessness
March No 9 of 2012-13 Royal Derwent Hospital: site sale
May No 10 of 2012-13 Hospital bed management and primary preventative health
May No. 11 of 2012-13 Financial Statements of State entities: Volume 5 - Other State entities
May No. 11 of 2012-13 Department of Health and Human Services - Output based expenditure (included in Financial Statements of State entities: Volume 5 - Other State entities)
August No. 1 of 2013-14 Fraud control in local government
November No. 2 of 2013-14 Volume 1 - Executive and Legislature, Government Departments, Tasmanian Health Organisations, Other General Government Sector State entities, Other State entities and Superannuation Funds
November No. 3 of 2013-14 Volume 2 - Government Businesses, Other Public Non-Financial Corporations and Water Corporations
Auditor-General’s reports are available from the Tasmanian Audit Office. These and other published reports can be accessed via the Office’s homepage www.audit.tas.gov.au

Level 4, Executive Building, 15 Murray Street, Hobart, Tasmania, 7000Postal Address GPO Box 851, Hobart, Tasmania, 7001
Phone: 03 6226 0100 | Fax: 03 6226 0199Email: [email protected]
Web: www.audit.tas.gov.au
To provide independent assurance to the Parliament and Community on the performance and accountability of the Tasmanian Public sector.Professionalism | Respect | Camaraderie | Continuous Improvement | Customer Focus
Strive | Lead | Excel | To Make a Difference
VISION AND PURPOSE
our vision
STRIVE | LEAD | EXCEL | TO MAKE A DIFFERENCE
our purpose
To provide independent assurance to the Parliament and Community on the performance and accountability of the Tasmanian Public sector
Availability of reports
Auditor-General’s reports are available from the Tasmanian Audit Office, Hobart. This report and other recent reports published by the Office can be accessed via the Office’s home page. For further information please contact the Office.
© Crown in right of the state of Tasmania december 2013

Audit Mandate and Standards Applied
Mandate
Section 17(1) of the Audit Act 2008 states that:
‘An accountable authority other than the Auditor-General, as soon as possible and within 45 days after the end of each financial year, is to prepare and forward to the Auditor-General a copy of the financial statements for that financial year which are complete in all material respects.’
Under the provisions of section 18, the Auditor-General:
‘(1) is to audit the financial statements and any other information submitted by a State entity or an audited subsidiary of a State entity under section 17(1).’
Under the provisions of section 19, the Auditor-General:
‘(1) is to prepare and sign an opinion on an audit carried out under section 18(1) in accordance with requirements determined by the Australian Auditing and Assurance Standards
(2) is to provide the opinion prepared and signed under subsection (1), and any formal communication of audit findings that is required to be prepared in accordance with the Australian Auditing and Assurance Standards, to the State entity’s appropriate Minister and provide a copy to the relevant accountable authority.’
Standards Applied
Section 31 specifies that:
‘The Auditor-General is to perform the audits required by this or any other Act in such a manner as the Auditor-General thinks fit having regard to –
(a) the character and effectiveness of the internal control and internal audit of the relevant State entity or audited subsidiary of a State entity; and
(b) the Australian Auditing and Assurance Standards.’
The auditing standards referred to are Australian Auditing Standards as issued by the Australian Auditing and Assurance Standards Board.

Photo courtesy of Tourism Tasmania and Joe Shemesh
Phone (03) 6226 0100Fax (03) 6226 0199email [email protected] www.audit.tas.gov.au
Address Level 4, Executive Building 15 Murray Street, Hobart
Postal Address GPO Box 851, Hobart 7001Office Hours 9am to 5pm Monday to Friday
Launceston OfficePhone (03) 6336 2503 Address 2nd Floor, Henty House
1 Civic Square, Launceston