auditory stimulation system - uni-muenster.de 2: schematic circuit diagram of the auditory...
TRANSCRIPT

Auditory Stimulation System
Institute for Biomagnetism and Biosignalanalysis 1 2 3
University of Muenster, Germany
June 27, 2007
1Tel.: ++49-251-83-568652Fax: ++49-251-83-568743e-mail: [email protected]

Components
1. USB Audio Interface
2. Trigger Detection Unit
3. I/O front panel
4. Audio Mixer
5. Diagnostic Audiometer (not included in delivery)
6. Parametric Equalizer
7. Electrostatic Transducers + Driver Unit
8. Rubber Tubing + plastic fittings
1

Trig
ger
Equalizer
Equalizer
Aud
io M
ixer
��������
��������
��������
��������
��������
��������
��������
��������
��������
��������
��������
��������
��������
��������
��������
��������
��������
��������
��������
��������
��������
��������
��������
��������
��������
��������
USB
Transducer
Transducer
Earp
iece
sEa
rpie
ces
rubb
er tu
bing
rubb
er tu
bing
unit
mar
ker d
etec
tion
mag
netic
ally
shi
elde
d ro
om
Aud
io In
terf
ace
Trig
ger
Com
pute
r
Stim
ulat
ion
Cont
rol
MEG
Elec
troni
c Ra
ck Aud
iom
eter
(not
incl
uded
in d
eliv
ery)
Figure 1: Block diagram of the auditory stimulation system
2
M
F
M
F
FSt6.3
FSt6.3
F
F
F
M
XLR plug (male)
F
F
F St6.3
F
F
F
F
F St6.3
1
2
3
4
F
F FF F
F F F
USB Audio DeviceInput
Output
F F F F F F
M M M M
IP
OP
3 41 2 5 6
Audio Mixer1 2 3 4 5 6
F F
CD1 CD2Audiometer
SwitchF
F
EQ/Filterright F
F
B
FSt6.3
F
FSt6.3
F
F EQ/Filterleft F
F
F
F
mono (female)
phono plug
phono plug
stereo (female)
BNC plug (female)
RCA plug (female)
F F
Trigger
Detector
F
F
FF
acoustic stimulation IBB Muenster, 2006 Dec 20
MS
RS
tax
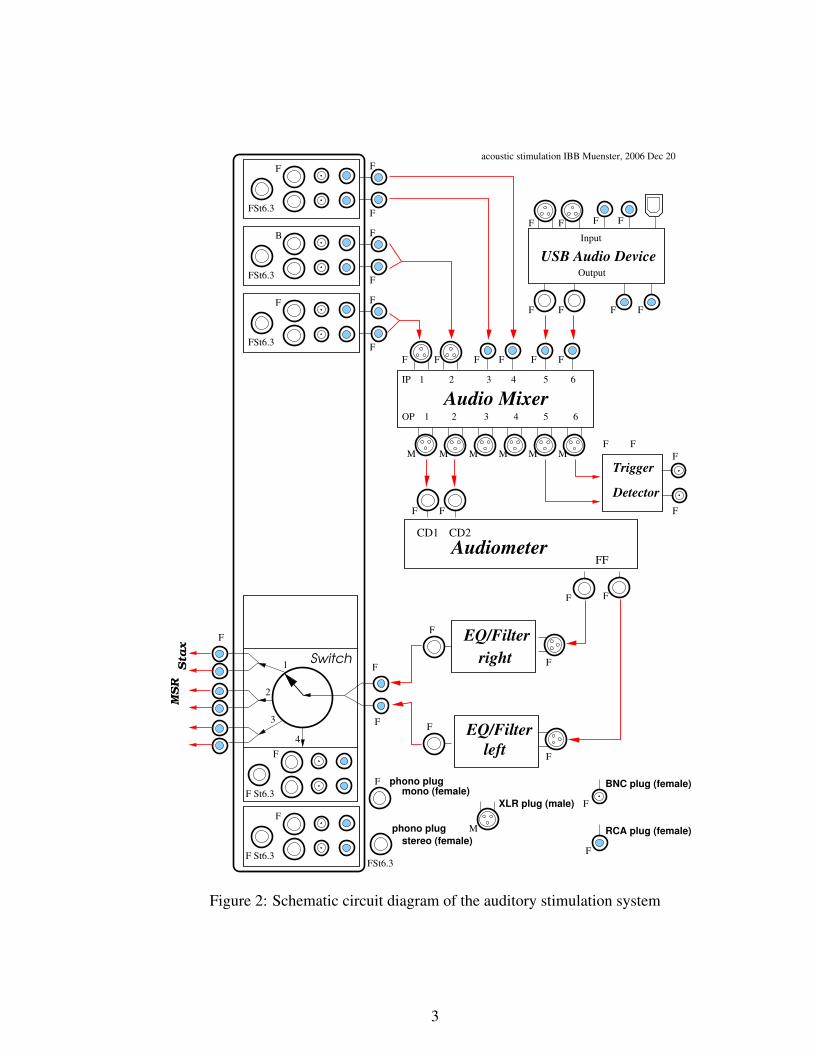
Figure 2: Schematic circuit diagram of the auditory stimulation system
3

USB Audio Interface
The audio signal is generated by an external audio interface which has to be connected to theUSB port of a computer. The interface is mounted in a panel in the most upper row of thedelivered rack frame. Setting the switch in the front to internal the audio interface is driven by acomputer connected via an USB cable belonging to the scope of delivery. Putting the switch toexternal another computer can be used connecting it to the USB port below the switch. On bothcomputers a stimulation control software (e.g. Presentation) can run. The technical specifica-tion of the integrated D/A converter (24 bit, up to 96 kHz sampling rate) are superior to standardon-board audio devices and enables signal generation with a well defined frequency contentsand phase stability. Further advantages of the external audio device are the low crosstalk be-tween channels (<-60 between left and right channel over the whole frequency range), verygood signal-to-noise ratio (100 dB), narrow specification of sampling rate, and the possibilityof using different computers for controlling the experiments.
Main Specifications: (For further information and full specification see: www.edirol.com)
Manufacturer RolandType Edirol Audio Capture UA-25Signal Processing AD/DA Conversion at 24 bit linearSampling Frequency real-time hardware sample rate converter
(switchable 44.1 / 48 / 96 kHz)Interface USBConnectors Input Jacks: XLR / RCA phono
Output Jacks: 1/4 inch phone type / RCA phonoMonitoring: Headphones Jacks (Stereo 1/4 inch)
Some additional hints:
1. to drive the audio interface with the Presentation software we recommend to set the AudioMixer Settings to Custom Mixer , Primary Buffer.
2. to get the best performance the output volume of the audio interface should be set tothree-fourth of the total range (watch hand setting: 3h)WARNING: do not change this setting as long you are not able to readjust the settingsfor the audio filters and transducer
3. in default delivery state the audio interface is set to non advanced mode (16bit, 48kHz),you can change this setting with the switches on the back and front side of the deviceWARNING: using it in advanced mode you have to install the device drivers from a CDincluded in the delivery on all computers connected to the device!
4

Trigger Detection Unit
In most cases the stimulation control program (e.g. Presentation) does not run in real timemode. This often causes a trigger uncertainty. which was found uniformly distributed over6 ms for the Presentation software. To avoid the jitter in the trigger signal an electronic markerdetection unit was developed in our lab. Therefore, a cosine shaped pulse signal with a carrierfrequency of 18 kHz, an peak-to-peak amplitude of 20% of the peak amplitude of the stimulussignal and a total duration of 2 ms is added to the stimulus signal time-series (see figure 3).This marker signal will be detected by the electronic of the unit and a TTL level trigger pulsewill be generated usable to synchronize an MEG recording. A proper setting of the mid-timepoint of the marker pulse enables the user even to correct time delays due to the acoustic soundsignal runtime (rubber tubes). The high frequency marker experiences damping during transferthrough the sound transmission system and is not audible. The marker detection unit containstwo BNC ports to output the generated trigger pulses for two separate channels which enablesthe user to set two different trigger time-points for a stereo sound stimulus. Two LED indicatorsare integrated for online monitoring the trigger events.Hint: In order to use the trigger detection unit the audio mixer routing matrix has to be setup ina proper way (see below for further details)
A program executable under Linux to add the pulse signal to your stimuli is attached on theCD. To get a description how to use it just enter the command add audio marker without anyoptions. To correct the time delay due to the acoustic sound signal runtime in the rubber tubesa recommended latency for the pulse is 5ms (for a tone burst it might be even better to put thetrigger time point to a latency which corresponds to the half amplitude of the rising slope sincethis is a reasonable latency percepting such kind of stimuli).
5

-1
-0.5
0
0.5
1
0 2 4 6 8 10 12
ampl
itude
time [ms]
-0.1 0
0.1
3.5 4.5 5.5
Figure 3: Exemplarily beginning part of a stimulus signal timeseries containing an added markerpulse at the time range from 2 to 4 ms; in the small upper panel the timeseries for the markersignal is shown
I/O front panel
An I/O front panel including three input and one output unit is mounted in the upper row of theelectronic enclosure. Each of the input ports can be used to feed in a stereo signal either via twomono RCA, BNC or 1/4 inch phone connectors or one stereo phone connector. These ports aredirectly connected to the audio mixer.
The output unit consists of a switch which can be used to put the output of the equalizer either tothree different connectors (RCA) at the back of the unit or one output unit on the front includingthe same type of connectors as the input units described above (for further details see figure 2).In the default delivery state the stimulation signal is passed through to the transducers puttingthe switch to setting 1.
Audio Matrix Mixer
To be able to superimpose multiple audio signals an audio mixer is included in the stimulationpathway. This is quite convenient if e.g. a masking noise should be overlayed to the stimulussignal. The implemented device is capable to mix signals from 6 different inputs and redistributethem to 6 independant output channels. The behaviour of the routing matrix is programmableand can be controlled by the WinDR software (you can find it on the attached CD) running on
6

a Windows system connected via a serial cable (included in delivery). Almost all additionalsettings like the input and output gain levels and the functionallity of the functions keys andfront panel LEDs can be changed with this software and stored as patches on the audio mixermemory buffer. The device disposes as well of 2 digital processing engines which enables it toapply an equalizer or signal muter to the input signals.By default the USB audio interface is connected to the input ports 5 (left channel) and 6 (rightchannel). For outgoing signals the ports 1 and 2 are used. A corresponding patch labeled withIBBstd is stored both on the audio mixer memory buffer and in a configuration file available onthe attached CD. To operate the auditory stimulation system using the default pathway includingthe USB audio interface this patch should be activated.In order to use the trigger detection unit the input signal has to be linked as well to the outputchannels 5 and 6 (already implemented in the IBBstd patch setup). To superimpose furthersignals or just use another signal source the three additional input ports on the front panelmounted in the upper row of the enclosure can be used. Those are connected internally to theaudio mixer input channels 1 to 4 (for further details see figure 2).
Hint: Before you start changing the settings for the audio matrix mixer you should archive theexisting configuration by using the WinDR software tool.
Main Specifications: (For further information and full specification see the attaced manual orwww.allen-heath.com)
Manufacturer Allen&HeathType DR66input/output lines 6 (2 XLR, 4 RCA) / 6 (6 XLR)Frequency Response 20Hz – 20kHz, +0/-1dBSignal to Noise ratio better than -80 dB rms 22 Hz to 22 kHzCrosstalk at 1 kHz better than -80 dBProcessing 24 bit linearPower Supply AC 50-60 Hz, 100-120 V or 200-240 V
Audiometer (not included in the delivery)
The calibrated step attenuators of a diagnostic audiometer are used for conveniently set the stim-ulus intensities. This allows of fast and precisely determining the individual sensation thresh-olds in-time immediately before the experimental run. The audiometer should be placed closeto the stimulation control computer screen on the operator’s desk (figure 4). Two loudspeakerboxes can be used to monitor the attenuated sound signal presented to the subject’s ears.
To connect the audiometer to the audio mixer the two cables labeled with ’Audiometer Tape1’and ’Audiometer Tape2’ ending on a 1/4 inch phone type (mono) has to be plugged into theaudiometer input ports. The two cables labeled with ’Audiometer FFL’ and ’Audiometer FFR’
7

Figure 4: diagnostic audiometer on the operator’s desk with two loudspeakers monitoring thesound signal
should be plugged into the free field ports of the audiometer to connect it to the parametricequalizers described below.
Main Specifications for the audiometer used at our lab(may be different from the one you are using!) (For further information: www.gnotometrics.com)
Manufacturer Madsen ElectronicsType Midimate 622Channels 2 separate output channelsConnectors Input: 2 x 1/4 inch phone type
Output: 2 x Phone (mono), 2 x free-field loudspeaker1 Power Supply AC 50-60 Hz, 100-120 V or 200-240 VPatient Safety complies with IEC 601-1
Additional Hints: We recommend to use a clinical audiometer which is applicable for speechaudiometry. The audiometer should be capable to attenuate input signals in a range of 125 dB.
8

Equalizer
Two parametric equalizers (one for each side of sound presentation) are integrated in the stimu-lation system pathway to compensate non-linearities in the frequency transfer characteristic ofthe subsequent parts of the sound delivery system (transducers, plastic tubes, transitions). Eachequalizer contains of 5 independently adjustable bandpass filters (detailed specification see be-low). For each filter the low- and high-cut off frequency as well as the attenuation/amplifyingfactor can be set independently.
Main Specifications: (For further information: www.behringer.com)
Manufacturer BehringerType Ultra-Q Pro PEQ2200Installation 19” rack mountableAudio In-/Output XLR and 1/4 inch jacksParametric Filter Frequency bands:
1: 20 Hz - 400 Hz2: 60 Hz - 1 kHz3: 150 Hz - 2.5 kHz4: 500 Hz - 8 kHz5: 1 kHz - 20 kHz
Bandwidth: variable (0.03 to 2 octaves)Power Supply AC 50-60 Hz, 100-120 V or 200-240 V
The equalizers are mounted in combination with the USB audio interface and the trigger detec-tion unit in a 19” enclosure.
To adjust the filter setting parameters a white noise signal (bandwith 0-12kHz, 70 dBSPL) wassend to the auditory stimulation system. The outcoming sound tapped after running up to thevery end of the pathway (after passing the below described plastic tubes) was measured withan Ear Simulator (Type 4157, Bruel & Kjaer). Using the PULSE hard- and software packagefor real-time sound and oscillation analysis (Types 3560, 7533, 3109, 7700, Bruel & Kjaer) wewere able to perform an online compensation of the non-linearities in the frequency transfercharacteristic by adjusting the parameters of the equalizers. The resulting settings you can getfrom the table file settingsPEQ2200.xls which you can find on the attached CD. The values arerepresenting the corresponding watch hand settings.
Transducers
To convert the electrical stimulation signal into an acoustic sound an electrostatic transducer incombination with a driver unit is used. The transducer is fully made from plastic material anddoes not contain any metallic or magnetic parts. The original enclosure of the driver unit is
9

Figure 5: Electrostatic earphones (left channel, covered in a plastic enclosures) (inside redcircle) and driver unit (inside blue circle) mounted at the MEG system gantry inside the MSR
replaced by a case made of aluminium to avoid intereference to the MEG recordings. Both de-vices are mounted at the gantry of the MEG system inside the magnetically shielded room (seefigure 5). The driver unit is placed at the opposite end of the gantry whereas the transducers areplaced behind the patient’s seat. The left and right ear transducers are installed in separate plas-tic enclosures produced in the mechanical workshop of our institute. These small boxes containconnection fittings between the transducers and the rubber tubes (see below) used to deliver thesound signal to the subject’s ear. The actual position of the transducer boxes was chosen avoid-ing any interferences with the MEG signals produced by the transducers and keeping the lengthof the plastic tubes as short as possible in order to minimize high frequency damping. Intensivetesting procedures, searching for optimal placing of the transducers resulted in the setup shownin figure 5. Tubes of 90 cm length were used for this configuration.
Main Specifications (Driver Unit for Electrostatic Earspeakers):(For further information: www.stax.co.jp/index-E.html)
Manufacturer StaxType SRM-212Frequency Response DC 20kHz: deviation within -3dBGain 60 dBmax. Output Voltage 280 V r.m.s.Power Consumption DC 12V 4W
10

Figure 6: Plastic enclosures containing one electrostatic earphone and a connection fitting tothe rubber tube visible at the top
HINT: to get the best performance the output volume level switch of the driver unit should beset to three-fourths of the total range (watch hand setting: 3h)
Main Specifications (Electrostatic Earspeakers):(For further information: www.stax.co.jp/index-E.html)
Manufacturer StaxType SR-003Frequency Response 20Hz - 1kHz ±2dB
1kHz - 20kHz ±4dBmax. Level 119dB SPL at 1kHz
Rubber tubing, plastic fitting pieces
On the last part of the auditory stimulation pathway the acoustic sound is passed through arubber tube with a length of 90cm and an inner diameter of 3mm. This tube is connected via
11

Figure 7: rubber tube being connected to a silicon earpiece via a plastic fitting piece; the headlocalization coil is mounted on the connection piece
a plastic piece having a rectangular shape to a silicon earpiece (figure 7). To achieve the bestpossible fitting to the subject’s ear canal the earpieces are available in different sizes. Addition-ally the plastic connection piece can be used to mount the coils being used by CTF in the headlocalization procedure during an MEG recording. This approach enables the user to get highlyreproducible anatomical markers (fiducials) to build the head coordinate system.
12
Check for interferences to the MEG recordings
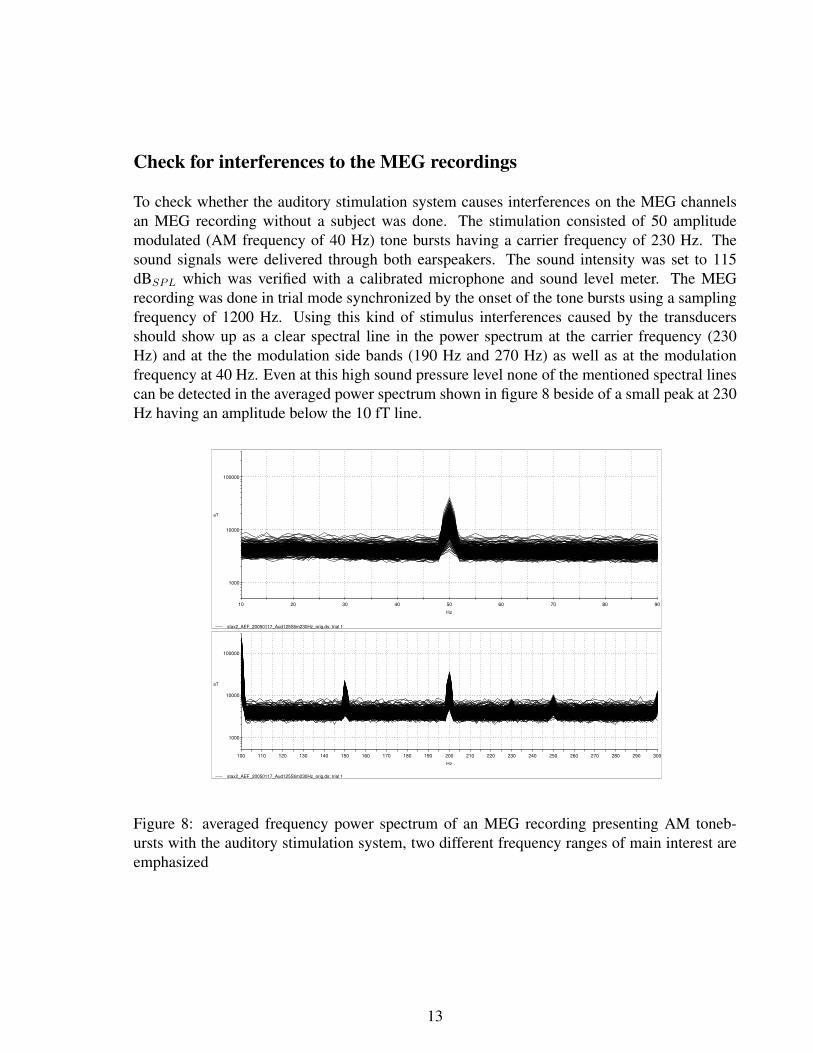
To check whether the auditory stimulation system causes interferences on the MEG channelsan MEG recording without a subject was done. The stimulation consisted of 50 amplitudemodulated (AM frequency of 40 Hz) tone bursts having a carrier frequency of 230 Hz. Thesound signals were delivered through both earspeakers. The sound intensity was set to 115dBSPL which was verified with a calibrated microphone and sound level meter. The MEGrecording was done in trial mode synchronized by the onset of the tone bursts using a samplingfrequency of 1200 Hz. Using this kind of stimulus interferences caused by the transducersshould show up as a clear spectral line in the power spectrum at the carrier frequency (230Hz) and at the the modulation side bands (190 Hz and 270 Hz) as well as at the modulationfrequency at 40 Hz. Even at this high sound pressure level none of the mentioned spectral linescan be detected in the averaged power spectrum shown in figure 8 beside of a small peak at 230Hz having an amplitude below the 10 fT line.
stax2_AEF_20050117_Aud125Stim230Hz_orig.ds: trial 1
1000
10000
100000
10 20 30 40 50 60 70 80 90Hz
aT
stax2_AEF_20050117_Aud125Stim230Hz_orig.ds: trial 1
1000
10000
100000
100 110 120 130 140 150 160 170 180 190 200 210 220 230 240 250 260 270 280 290 300Hz
aT
Figure 8: averaged frequency power spectrum of an MEG recording presenting AM toneb-ursts with the auditory stimulation system, two different frequency ranges of main interest areemphasized
13

Frequency Transfer Characteristic
The PULSE hard- and software package for real-time sound and oscillation analysis (Modules3560, 7533, 3109, 7700, Bruel & Kjaer) was applied to determine the frequency transfer charac-teristic of the auditory stimulation system. Therefore a white noise signal (bandwith 0-12kHz,70 dBSPL) was send through the whole pathway. The outcoming sound signal tapped afterpassing the plastic tubes was acquired with an Ear Simulator (Type 4157, Bruel & Kjaer).The resulting transfer characteristic is shown in figure 9.
In addition the same measuring setup was used to determine the frequency transfer characteristicfor sinusoidal signals. Instead of white noise pitch sounds with a sound pressure level of 100 dB(attenuation setting on the audiometer) having different carrier frequencies (250Hz – 8kHz)were used as input signals. The acquired results are shown in table 1.
Table 1: frequency transfer characteristic for sinusoidal signalsfrequency [Hz] intensity [dbSPL]
250 103500 95750 96
1000 941250 961500 952000 983000 1024000 986000 1038000 84
According to these measurements the frequency transfer characteristic is almost linear in afrequency range from 125 Hz up to 6 kHz. Therefore the system is capable to transfer evenhigher harmonics of complex sound signals with a sufficient intensity.
14

30
40
50
60
70
80
84210.50.1
inte
nsity
[dB
SPL]
frequency [kHz]
left channel
84210.50.1frequency [kHz]
right channel
Figure 9: frequency transfer characteristic of the stimulation system for the left and right chan-nel using a white noise (bandwith 0-12kHz, 70 dBSPL) as input signal (black), the red lineshows a curve approximation fitted to the acquired values
15

Summary
Components belonging to the stimulation system
1. enclosure (19” mounting rack) containing
• USB Audio Interface
• Trigger Detection Unit
• I/O front panel
• Audio Mixer
• Parametric Equalizer
• internal cabeling
• internal powerbar
2. Electrostatic Transducers (covered in plastic enclosures) + Driver Unit
3. Rubber Tubing (90cm) + 2 rectangular plastic pieces (connection to earpieces)
4. USB cable (to connect audio interface to computer)
5. RS232 cable (to connect audio mixer to computer)
6. RF shielded audio cable (5m, to connect audiometer to audio mixer)
7. RF shielded audio cable (10m, to connect output panel in enclosure to transducers)
8. manuals for included devices
9. CD containing
• add audio marker (UNIX executable to add sound detection marker)
• create audio file (UNIX executable to generate a toneburst sound file)
• WinDR (Windows executable for controlling the audio mixer)
• manual for the audio mixer
• parametric filter settings (settingsPEQ2200.xls)
• startup instructions
• manual and technical specifications
ATTENTION: All electronic devices belonging to this auditory stimulation sys-tem are setup for a power supply of 250V (AC 50Hz).Do not use them under different conditions!
16