auditory-visual processing represented in the human superior
TRANSCRIPT

AS
RRMa
Ub
sc
d
ApdpPopnhadricaEvislucOacfiegP
K
*sUEAyetrcnltd
Neuroscience 145 (2007) 162–184
0d
UDITORY-VISUAL PROCESSING REPRESENTED IN THE HUMAN
UPERIOR TEMPORAL GYRUSIesaitoemMmsno1S
ttaLwsabiaa2a1(itgLJcaCHeWrptaMi
. A. REALE,a,b* G. A. CALVERT,c,d T. THESEN,c
. L. JENISON,b H. KAWASAKI,a H. OYA,a
. A. HOWARDa AND J. F. BRUGGEa,b
Department of Neurosurgery, University of Iowa, Iowa City, IA 52242,SA
Department of Psychology, University of Wisconsin, 1202 West John-on Street, Madison, WI 53706, USA
University Laboratory of Physiology, University of Oxford, Oxford, UK
Department of Psychology, University of Bath, Bath, UK
bstract—In natural face-to-face communication, speecherception utilizes both auditory and visual information. Weescribed previously an acoustically responsive area on theosterior lateral surface of the superior temporal gyrus (fieldLST) that is distinguishable on physiological grounds fromther auditory fields located within the superior temporallane. Considering the empirical findings in humans andon-human primates of cortical locations responsive toeard sounds and/or seen sound-sources, we reasoned thatrea PLST would also contain neural signals reflecting au-iovisual speech interactions. To test this hypothesis, eventelated potentials (ERPs) were recorded from area PLST us-ng chronically implanted multi-contact subdural surface-re-ording electrodes in patient–subjects undergoing diagnosisnd treatment of medically intractable epilepsy, and corticalRP maps were acquired during five contrasting auditory,isual and bimodal speech conditions. Stimulus conditionsncluded consonant–vowel (CV) syllable sounds alone, silenteen speech or CV sounds paired with a female face articu-ating matched or mismatched syllables. Data were analyzedsing a MANOVA framework, with the results from plannedomparisons used to construct cortical significance maps.ur findings indicate that evoked responses recorded fromrea PLST to auditory speech stimuli are influenced signifi-antly by the addition of visual images of the moving lowerace and lips, either articulating the audible syllable or carry-ng out a meaningless (gurning) motion. The area of cortexxhibiting this audiovisual influence was demonstrablyreater in the speech-dominant hemisphere. © 2006 IBRO.ublished by Elsevier Ltd. All rights reserved.
ey words: temporal lobe, audiovisual processing, speech.
Correspondence to: R. A. Reale, Department of Psychology, Univer-ity of Wisconsin, 1202 West Johnson Street, Madison, WI 53706,SA. Tel: �1-608-263-5851; fax: �1-608-263-5929.-mail address: [email protected] (R. A. Reale).bbreviations: AI, primary auditory cortex; AV, audiovisual; AW, anal-sis window; CV, consonant–vowel; ECoG, electrocorticogram; EEG,lectroencephalogram; ERPs, event-related potentials; fMRI, func-
ional magnetic resonance imaging; FWE, family-wise (type-I) errorate; MANOVA, multivariate analysis of variance; MEG, magnetoen-ephalography; MTG, middle temporal gyrus; PCA, principal compo-ent analysis; PET, positron emission tomography; PLST, posterior
ateral superior temporal gyrus; SF, Sylvian fissure; STG, superior
iemporal gyrus; STS, superior temporal sulcus; VW, Van der Waer-en.
306-4522/07$30.00�0.00 © 2006 IBRO. Published by Elsevier Ltd. All rights reseroi:10.1016/j.neuroscience.2006.11.036
162
n natural face-to-face communication, speech perceptionngages neural processes that integrate acoustic and vi-ual information. Under these conditions listeners naturallynd effortlessly create a unified and coherent percept us-
ng complementary information obtained through hearinghe speaker’s voice and seeing the articulatory movementsf a speaker’s face. As a result, speech perception isnhanced, presumably using neural mechanisms of bi-odal interaction (Fowler, 2004; Massaro, 1998, 2004;unhall and Vatikiotis-Bateson, 2004). The impact of oneodality upon the perception of the other during audiovi-
ual (AV) speech processing is especially important inoisy or reverberant environments, or when hearing istherwise impaired (Campbell and Dodd, 1980; Dodd,977; Grant and Seitz, 2000; Sumby and Pollack, 1954;ummerfield, 1987, 1992).
The integrative mechanisms of the perceptual systemhat bind auditory and visual modalities are complex and inhe broadest sense involve neural circuitry distributedcross the frontal, parietal and temporal lobes (Calvert andewis, 2004; Hall et al., 2005; Kaas and Collins, 2004) asell as subcortical structures long known to exhibit multi-ensory interactions (Stein and Meredith, 1993; Wallace etl., 2004). Temporal lobe cortex within or close to theanks of the superior temporal sulcus (STS) has been
dentified as a region of multimodal integration and inter-ctions in both humans (Calvert and Lewis, 2004; Wright etl., 2003) and non-human primates (Barraclough et al.,005; Baylis et al., 1987; Benevento et al., 1977; Bruce etl., 1981; Desimone and Gross, 1979; Hikosaka et al.,988). Hemodynamic and magnetoencephalographyMEG) studies in humans also suggest that AV speechnteractions occur within even more extensive areas of theemporal lobe including cortex of the superior temporalyrus (STG) and superior temporal plane (Calvert andewis, 2004; Karnath, 2001; Kuriki et al., 1995; Raij andousmaki, 2004). These latter cortices comprise the mostonsistently identified locations for secondary (associative)nd primary auditory cortical fields (Binder et al., 1997;reutzfeldt et al., 1989; Galaburda and Sanides, 1980;ackett et al., 2001; Howard et al., 2000; Liegeois-Chauvelt al., 1991; Rivier and Clarke, 1997; Sweet et al., 2005;allace et al., 2002). Studies of scalp-recorded event-
elated potentials (ERPs) in human have consistently im-licated auditory cortex as a site for both AV and audio-actile multimodal integration (Besle et al., 2004; Foxe etl., 2000; Giard and Peronnet, 1999; Molholm et al., 2002;urray et al., 2005; van Wassenhove et al., 2005). These
mplications are well supported by hemodynamic evidence
n human (Calvert et al., 1999, 2000; Foxe et al., 2002;ved.
Phraomrstsg(d
ppa(bc(cabafmi(tstiveMCtwgofiqcwobcairas
apdfit
ecsttstwedFaupcws
wafd(tltatieemsMt
H
Tpmyifchiohdsocwifthws
R. A. Reale et al. / Neuroscience 145 (2007) 162–184 163
ekkola et al., 2005; van Atteveldt et al., 2004) and non-uman primate (Kayser et al., 2005). Direct intracranialecordings from macaque auditory cortex revealed thatudio-tactile (Fu et al., 2003; Schroeder et al., 2001; Schr-eder and Foxe, 2002) and AV (Ghazanfar et al., 2005)ultimodal convergence occurs in auditory cortices poste-
ior to the primary auditory area including at least oneecondary field (Schroeder et al., 2003). Taken togetherhese findings have promoted a framework for multisen-ory processing that emphasizes convergence and inte-ration at the earliest stages of auditory cortical processingfor review see Ghazanfar and Schroeder, 2006; Schroe-er et al., 2003).
Auditory cortex of the temporal lobe of human is com-osed of multiple fields although, with the exception of therimary field (primary auditory cortex, AI), there is still nogreement on the number of fields or their spatial locationsreviewed by Hackett, 2003). These fields are thought toe organized in a three-tier, core–belt–parabelt, hierarchi-al processing system, similar to that proposed for monkeyHackett et al., 1998a; Kaas and Hackett, 2000; Raus-hecker and Tian, 2000; Sweet et al., 2005; Wessinger etl., 2001). Only the core primary field, AI, is considered toe homologous between monkey and human (Hackett etl., 2001; Hackett, 2003). Thus, for the present, studies of
unctional localization outside of the auditory core in hu-ans must be carried out on humans. Noninvasive imag-
ng methods (functional magnetic resonance imagingfMRI), positron emission tomography (PET), MEG, elec-roencephalogram (EEG)) provide powerful approaches totudies of functional localization in the human brain, andhese have been applied to cortical localization of AVnteraction patterns (fMRI: Callan et al., 2003, 2004; Cal-ert et al., 1997, 1999, 2000; Calvert, 2001; MacSweeneyt al., 2002; Pekkola et al., 2005; van Atteveldt et al., 2004;EG: Mottonen et al., 2002; Sams et al., 1991, and EEG:allan et al., 2001; Klucharev et al., 2003). Taken together
hese studies suggest that multisensory interactions occurithin portions of the STS, middle and superior temporalyri as well as cortical areas traditionally considered toverlap with auditory cortex. Which of the multiple auditoryelds on STG represent these interactions is, however, auestion not answered by noninvasive approaches be-ause functional imaging studies have not been combinedith the locations of cytoarchitectonically or electrophysi-logically identified fields. The question can be addressedy systematic mapping of stimulus-evoked activity re-orded directly from the STG. Under these conditions rel-tively precise functional localization can be achieved in
ndividual human subjects. Heretofore, however, no directecordings in humans from any physiologically identifieduditory cortical field have been shown to exhibit multisen-ory interactions.
We described previously an acoustically responsiverea on the posterior lateral surface of the STG (fieldosterior lateral superior temporal gyrus (PLST)) that isistinguishable on physiological grounds from auditoryelds located on Heschl’s gyrus (HG) within the superior
emporal plane (Howard et al., 2000). Considering the ampirical findings in humans and non-human primates ofortical locations responsive to heard sounds and/or seenound-sources, we reasoned that area PLST would con-ain neural signals reflecting AV speech interactions. Toest this hypothesis we recorded directly from PLST andurrounding perisylvian cortex and compared ERPs ob-ained there to auditory, visual and AV stimuli. Recordingsere made using multi-contact subdural surface-recordinglectrodes chronically implanted in patients undergoingiagnosis and treatment of medically intractable epilepsy.ive stimuli were created for these experiments: 1) anudible consonant–vowel (CV) syllable alone, 2) an artic-lating female face alone, 3) an articulating female faceaired with this female’s natural audible utterance of aongruent CV syllable, 4) an audible CV syllable pairedith meaningless lip movement, and 5) an audible CVyllable paired with lip movement of a different syllable.
The ERP was considered a multivariate observation inhich the ordered sequence of measured voltages definedresponse vector that depended upon three experimental
actors: Stimulus Type, Electrode Site, and Analysis Win-ow (AW). We used multivariate analysis of varianceMANOVA) to test inferences based on contrasts betweenhese factors and constructed maps showing the corticalocations of significant effects. We interpret significant con-rasts between the bimodal response to combined heardnd seen speech (AV speech) and the unimodal responseo either modality presented alone as reflecting an AVnteraction. Our findings indicate that within area PLSTvoked responses to auditory speech stimuli are influ-nced significantly by the addition of visual images of theoving lower face and lips, either articulating the audible
yllable or carrying out a meaningless (gurning) motion.oreover, this AV influence was demonstrably more ex-
ensive on the speech-dominant hemisphere.
EXPERIMENTAL PROCEDURES
uman subjects
he eight subjects (six male, two female) in this study wereatients undergoing diagnosis and, later, surgical treatment foredically intractable epilepsy. They ranged in age from 18 to 56
ears. As part of their clinical treatment plan multi-contact record-ng grids were implanted over the perisylvian cortex and for theollowing 2 weeks their electrocorticogram (ECoG) was monitoredontinuously for seizure activity. The recording grid was on the leftemisphere (L) of four subjects and the right (R) of four. An
ntra-arterial amobarbital procedure (WADA test) was carried outn seven subjects, and the results indicated that the left cerebralemisphere of each was dominant for speech. One subject (L122)id not undergo WADA testing, and hence cerebral dominance forpeech in this subject is uncertain. Research recordings werebtained from the grid electrodes while the subjects were recliningomfortably in a bed or sitting upright in a chair. Speech tokensere delivered through calibrated insert earphones while visual
mages were presented on a video monitor positioned directly inront of the subject. Recording sessions were carried out either inhe epilepsy ward or in our specially designed and equippeduman electrophysiological recording facility. Informed consentas obtained after the nature and possible consequences of thetudies were explained to the patient. All study protocols were
pproved by the University of Iowa Institutional Review Board.
Ssjp
stcstkSagtgc(ct1rlRshrlirtro
S
AmaicmppmsttAcaiiq2ucm
Fuvideo screen showing a centrally place black visual fixation point on a
bpamsOtlo
R. A. Reale et al. / Neuroscience 145 (2007) 162–184164
ubjects did not incur additional risk by participating in thesetudies. Presurgical audiometric testing showed that for all sub-ects pure-tone thresholds (500 Hz–4000 Hz) and language com-rehension were within normal limits.
No cortical abnormalities were identified in the MRI of twoubjects (R104, L118). Mesial temporal sclerosis was identified inhree subjects (R129, L100, L106). Subject L122 had regions ofortical dysplasia involving the middle and posterior portions of theuperior and middle temporal gyri. Recordings were obtained fromwo subjects (R98 and R127) with lesions of cortical areas that arenown to be anatomically and functionally related to the posteriorTG. Subject R98, an 45-year old male, had experienced simplend complex partial seizures from the age of 13. He had under-one a partial right temporal lobectomy on October 23, 1996. Athat time the right hippocampus and inferior and middle temporalyri were removed leaving intact the STG, including the cortex thatomprises the ventral bank of the STG; the middle temporal gyrusMTG) cortex lining the ventral surface of the STS was removedompletely. Hence, the cortex lining the ventral surface of the STShat is considered a major site of visual input (Seltzer and Pandya,978) could not contribute to the ERPs recorded on the STG whenecordings were made nearly 8 years later. The boundaries of theesion were identified by analysis of serial MRI sections. Subject127 had, in 1979, sustained a right frontal head injury. Heubsequently developed meningitis and CSF rhinorrhea. In 1980e underwent surgical treatment of a right orbital abscess andeconstruction of the orbit. MRI revealed a right frontal encepha-omalacia and large porencephalic cyst. He began having seizuresn 1981. PET imaging revealed absence of metabolism in theegion of the right frontal lobe injury and reduced metabolismhroughout the right temporal lobe. This subject provided us theare opportunity to examine evoked activity in STG in the absencef normal cortico-cortical input from the frontal lobe.
timulus construction
udio, visual and AV stimuli were derived from videotaped seg-ents of the lower face, including the mouth, of a female speakerrticulating three syllables (/da/, /gi/, /tu/) or carrying out mean-
ngless lip movements (gurning). We chose these syllables be-ause we were especially interested in probing the earliest cross-odal influences of AV speech perception using non-semantichonetic stimuli whose integration is likely to occur at a pre-lexical,honetic categorization stage (MacSweeney et al., 2001; Sum-erfield, 1991; Summerfield and McGrath, 1984). They were also
hown to be easily discriminated, both acoustically and visually, inwo companion studies (Calvert et al., 2005; Thesen et al., 2005)hat served as complementary approaches to this investigation ofV interactions. The image was restricted to the lower face be-ause we wished to focus our attention on the role played by therticulators in AV speech (Summerfield, 1992) and to minimize the
nfluence of possible confounding factors such as gaze and facialdentity (Campbell et al., 1986, 2001). Fig. 1 illustrates nine se-uential video frames from a series of 62 frames (lasting about000 ms) viewed by the subject in which the syllable /da/ wasttered. Natural AV speech is an ecologically valid stimulus and isharacterized by the temporal precedence of visual speech, as theovement of the facial articulators usually precedes the onset of
ackground whose luminance and color were matched to subsequentresentations of the subjects lower face. The static face image thenppeared and remained for 734 ms before the lips moved (diodearker 1) and nominally 1167 ms before the start of the audible
yllable (diode marker 2). Diode markers are not visible to the subject.nset of the acoustic syllable was derived from a digitized version of
he sound waveform delivered to the earphones. The entire sequence
ig. 1. Sequence of sample frames from a video clip (AVI format)sed to present AV speech. The sequence begins and ends with a asted about 2 s and ended when the lips stopped moving and theriginal video screen appeared showing the black visual fixation point.

tsvwfbem
taispc
r
s
t
I→
aGtclaahccdStdtbtasao
ittwttntf
tn
A
PcmsEefumfcltmelsndotafm
E
DfdidppwEspLRdocg
ctIeptstsrp
bTwafs
Ts
St
A
V
A
A
A
R. A. Reale et al. / Neuroscience 145 (2007) 162–184 165
he acoustic stimulus by tens to hundreds of milliseconds. Theeries began with a video screen showing a centrally-placed blackisual fixation point on a background whose luminance and colorere matched to the subsequent presentations of a human lower
ace. The face appeared abruptly, and shortly thereafter the lipsegan to move followed by the start of the vocal utterance. Thentire AV token ended with the appearance of the original color-atched uniform background screen.
Table 1 shows the auditory and visual components making uphe five stimulus types for which the resulting ECoG data werenalyzed. One of the AV speech tokens was congruent (AdaVda),
.e. the visually articulated syllable was the same as the auditoryyllable. Audio-alone (Ada) and visual-alone (Vda) tokens wereroduced simply by eliminating the respective visual or the audioomponent from the video clip. In this framework, an AV-stimulus
esponse (AdaVda
→) was considered to be the summation of re-
ponse vectors Ada
→and Vda
→elicited by the auditory and visual
okens presented separately, plus an interaction vector (INT→
). As
NT is, by definition, elicited only by the bimodal stimulus, it is notccounted for by linear addition of unimodal responses (see alsoiard and Peronnet, 1999). In order to test whether AV interac-
ions required congruent (naturally paired) components, two in-ongruent AV speech tokens were constructed by pairing articu-atory lip movement associated with the syllable /da/ with theudible signal of the syllable /gi/ (AgiVda), and by pairing theudible syllable /da/ with meaningless, closed-mouth movementsaving no relationship to any syllable utterance (AdaVgurn), a visualondition known as gurning (Campbell et al., 2001). Stimulusonstruction was aided by the use of a commercially availableigital video editing software (Premiere V6.0, Adobe Systems Inc.,an Jose, CA, USA)). The 62 video frames that made up an AV
oken were played out at 29.97 fps, with (stereo) audio signalsigitized at 44.1 kHz and 16 bit resolution (digital AVI format). Athe start of a video sequence a blank screen appeared with alack cross in the center. The subject was instructed to fixate onhis point and then to watch carefully the subsequent facial im-ges. We did not monitor the subject’s eye movements during thiseries of subjects. In more recent studies using an eye-trackingpparatus, a subject’s eyes commonly scanned the presentationsf the human lower face during data collection.
Ten identical repetitions of each stimulus type were presentedn random order from a single AVI multimedia file together with 10rials of AV speech that utilized the articulation and utterance ofhe syllable /tu/. The subject was instructed to press a buttonhenever /tu/ was detected. This action served only to maintain
he subject’s vigilance during the showing of the video clip. Elec-rophysiological data from these 10 /tu/ trials were discarded andot analyzed. Typically, four AVI movie files (total�40 trials peroken in Table 1), each with unique randomization, were available
able 1. Auditory and visual components and response vectors for fivetimulus types
timulusype
Auditorysignal
Visual image Responsevectors
da /da/ None Ada
→
da None Natural lip movement for /da/ Vda
→
daVda /da/ Natural lip movement for /da/Ada
→�Vda
→�INT→
giVda /gi/ Natural lip movement for /da/Agi
→�Vda
→�INT→
daVgurn /da/ GurningAda
→�Vgurn
→�INT→
or presentation. We randomized the stimulus events in an attempt fi
o further reduce uncontrolled non-stationary influences (e.g. alert-ess, arousal).
coustic calibration and stimulus presentation
rior to surgery each subject was custom fitted in the hearing aidlinic of the Univ. Iowa Department of Otolaryngology with earolds of the kind commonly worn by hearing aid users. Acoustic
timuli were delivered binaurally over miniature earphones (ER4B,tymotic Research, Elk Grove Village, IL, USA) integrated intoach ear mold. An intensity level was chosen that was comfortableor the subject and that permitted easy discrimination of the nat-rally spoken syllables. Provision was also made for a probeicrophone to be inserted through a second port on the ear mold
or the purpose of acoustic calibration. Acoustical calibration wasarried out in six of the eight subjects by presenting maximumength sequences (Golay codes, Zhou et al., 1992) and recordingheir responses through a clinical probe microphone (ER-7C: Ety-otic Research) system. Subsequently, in these six subjectsqualizer filters were constructed for sound-path channels to the
eft and right ears, and these filters were used to compensate thepeech tokens for each channel. For the remaining two subjects,o attempt was made to compensate for the small frequencyependent differences in sound pressure level inherent in theutput of the earphones. Real Player® (RealNetworks Inc., Seat-le, WA, USA) was used for playback of digital AVI media files at
comfortable sound level (typically 35–40 dB above threshold)rom a dedicated PC platform with a standard flat-screen CRTonitor.
lectrophysiological recording
etails of electrode implantation and data acquisition can beound in an earlier paper (Howard et al., 2000), and only a briefescription will be give here. In each subject an array of platinum–
ridium disc electrodes (1.6 mm diameter, 4–5 mm inter-electrodeistance) embedded in a silicon membrane was implanted on theial surface over the perisylvian regions of the temporal andarietal lobes, including the posterolateral STG where previouslye had identified an auditory field (PLST, Howard et al., 2000).CoG data were acquired (2 ksamples/s; bandpass 1–1000 Hz)imultaneously from the 64 surface-electrode recording grids im-lanted on the left hemisphere in three subjects (L106, L100,122) and the right hemisphere in four subjects (R98, R104,127, R129). In one subject (L118), 22 contacts were found to beefective and, hence, simultaneous recording was obtained fromnly 42 sites. MRI and intraoperative photographs aided the re-onstruction of the location of the electrode grid with respect toyral landmarks.
The number and distribution of active cortical sites re-orded varied from one subject to the next, as the placement ofhe electrode grid depended entirely on clinical considerations.n each of the present subjects, the multi-contact surface-lectrode recording grid had been largely confined to theosterolateral STG. This limitation precluded systematic inves-igations of more anterior temporal cortex. We did not studyites outside of the electrode arrays illustrated in this paper, ashese were the only grids of this type implanted. Four-contacttrip electrodes were placed beneath the inferior temporal gy-us, but these recordings were used exclusively for clinicalurposes.
ERPs obtained in response to stimuli that contained an audi-le syllable were referenced in time to the onset of the syllable.his syllable onset was derived from a digitized copy of the audioaveform delivered to the subject’s earphone. For the visual-lone stimulus type, ERPs were timed with respect to the videorame that correlated with the onset of the (removed) audibleyllable (nominally 432 ms after the onset of lip movement). This
ducial time stamp was marked by the appearance of a small
wsdonoa
tusit
tiassctmdpsa
Fstp
R. A. Reale et al. / Neuroscience 145 (2007) 162–184166
hite circle (unseen by the subject) in the upper left corner of thecreen (see Fig. 1). The appearance of this white circle wasetected by a diode that emitted a TTL signal, that was digitizedn still another A/D channel. These multiple time markers wereeeded to synchronize responses with stimulus constructs, as theperating system of a PC could interrupt playback at unpredict-ble times.
Research recording usually began 2 days after electrode implan-ation. At this time, an image of the recording grid was superimposedpon a preoperative MRI of the lateral surface of the cerebral hemi-phere using gyral landmarks derived from photographs taken during
mplantation surgery. Later, when the recording grid was removed,
ig. 2. Average ERP waveforms evoked by unimodal (Auditory or Viubject L106. Measured voltages (blue) and their spline-fit counterpemporal boundaries of the three 500 ms AWs included in the MANOVAlotted in the upward direction.
he grid position was verified and, if necessary, its representation on w
he postoperative MRI adjusted appropriately. Typically, in thenitial recording sessions, we obtained ERP maps using onlyudible stimuli including clicks, noise bursts, tone bursts andyllables. This preliminary recording served to acquaint theubject with the recording sessions, to identify technical diffi-ulties that might have arisen during early surgical recovery, toest the responsiveness of the cortex beneath the grid, and toap the location and boundaries of area PLST. Duration ofaily recording times was controlled by the subject’s consent. Inractice, this limitation precluded a parametric exploration oftimulus variables (e.g. interval between, or intensity of, visualnd auditory stimulus components) that are commonly studied
bimodal (AV) speech and recorded at the site of maximal voltage in) are shown for each stimulus type. Vertical dashed lines mark the. A common ordinate scale is used for all waveforms. Negative voltage
sual) andarts (redanalysis
ith animal models of AV interactions.

S
TsosmrprHANorvatLPTanisvaanltttns
tsSdp(tsi‘ttOawstla(ttTstn
Frthe original recording sites derived from spline fit. Ordinate scale
�ira
R. A. Reale et al. / Neuroscience 145 (2007) 162–184 167
pline–Laplacian transformation
he ERP is the result of a series of local synaptic current sinks andources triggered by the invasion of stimulus-evoked input arrivingver one or more afferent pathways. Based on evidence fromingle- and multi-neuron recording and current source densityeasurement, it is generally accepted that the ERP waveform
ecorded by an electrode on the brain surface reflects thesehysiologic events occurring mainly within the cortex in someestricted region beneath the recording electrode (Creutzfeldt andouchin, 1984; reviewed by Arezzo et al., 1986; Vaughan andrezzo, 1988; Mitzdorf, 1991, 1994; Steinschneider et al., 1992).evertheless, the spatial distribution of the potentials sampled byur electrodes was necessarily influenced by the choice of theeference electrode and the effects of spatial smearing due toolume conduction in tissue and fluid of the brain. In order to helpmeliorate these influences, the distribution of the measured po-ential was transformed with a spatial filter using the surfaceaplacian operation (Nunez and Westdorp, 1994; Nunez andilgreen, 1991; Nunez, 1981; Perrin et al., 1987; Law et al., 1993).he surface Laplacian is independent of the reference electrodend is proportional to the so-called current source density. It isow appreciated that the 3-D Laplacian of the scalp EEG potential
s a good estimate of the spatial distribution of the dura/pialurface potentials (Nunez and Westdorp, 1994; Nunez and Srini-asan, 2006). In this application, as in ours, the Laplacian acts ashigh-pass spatial filter that de-emphasizes deep brain sources
nd/or coherent sources distributed over large cortical areas. Theature of the Laplacian is to improve the spatial resolution of more
ocal cortical sources. From a physiological point of view, estima-ion of the cortical sources underlying the dura/pial surface poten-ial, requires adoption of models for volume conduction, and cor-ical current sources (e.g. dipole approximations). This report doesot provide data that bear on these issues. Rather we employ theurface-Laplacian method solely as a spatial filter.
The surface Laplacian required an accurate representation ofhe spatial distribution of potential that is generally derived usingpline interpolation (Perrin et al., 1987; Law et al., 1993). Thus thepline–Laplacian transformation required two steps. First, theistribution of voltages sampled by the electrode array was inter-olated using a two-dimensional natural cubic spline to yield ahigh-resolution) continuously smooth function of potential acrosshe two-dimensional recording grid. Since the spline and the sub-equent Laplacian are analytical solutions, they can be used tonterpolate potentials at any electrode location (e.g. locations ofbad’ electrodes) for display or statistical comparisons. Second,he surface Laplacian was calculated using an analytic solution tohe second-order spatial derivatives required for the computation.ur higher-order Spline–Laplacian, with units of voltage per unit-rea, was derived exclusively using analytical mathematics inhich the spline coefficients were estimated in a least squaresense. This has the advantage over numerical techniques wherehe computational overhead to estimate a suitably dense interpo-ated grid becomes unnecessary. Fig. 2 shows for one subject theveraged ERP waveforms (blue) measured at one electrode sitechosen for maximal voltage excursion) within PLST for the firsthree stimulus constructs shown in Table 1. This is compared withhe waveform derived from the spline fit (red) at this electrode site.he comparison is representative of the degree to which a mea-ured ERP and its derived spline representation agree; for most ofhe waveform the two curves superimpose, with some exceptionsoted around waveform peaks and valleys.
100 to 100 �V. (C) Laplacian transformation of the spline fit used tollustrate average Spline–Laplacian waveform at each of the original
2
ig. 3. Spline–Laplacian transformation. (A) Location of 64-contactecording grid overlying perisylvian cortex. (B) Average ERP at each of ecording sites. Ordinate scale �325 to 325 �V/cm . The SF and STSre shown in gray on the spatial maps of waveforms.

Ec5aw5uan2a
ttgicawtLwsiseceamebgtse
S
TuavEatfelMvldadrstt
epsotore
datipttct
pawu5tslPtk8utarsfoobt
C
StnmfarNtmao
Ew
Te
C
C
C
C
C
R. A. Reale et al. / Neuroscience 145 (2007) 162–184168
The most prominent negative and positive deflections inRPs occur in response to those stimuli having an audible syllableomponent (Ada and AdaVda) and are largely confined to the00 ms window following syllable onset (Fig. 2 A and C). Remark-bly fewer prominent deflections occur in the succeeding 500 msindow, and even fewer noticeable peaks and valleys in the00 ms window preceding syllable onset (but during visual stim-lation). These features were also typical of ERPs recorded fromrea PLST in response to audible-only stimuli including clicks,oise bursts, tone bursts and syllables (see also Brugge et al.,005; Howard et al., 2000) and guided our selection of AWs useds a factor in the MANOVA analysis described below.
Fig. 3 illustrates, for the Ada stimulus, the effects of applyinghe Spline–Laplacian transformation to the ERPs measured simul-aneously at the 64 electrode sites depicted on the rectangularrid overlying perisylvian cortex. The response field in Fig. 3B is
llustrated using the average Spline ERPs. There, waveformsharacteristic of area PLST, having clearly distinguishable positivend negative deflections and overlying STG, are flanked by similaraveforms at some sites above the Sylvian fissure (SF) and below
he STS (Howard et al., 2000). Subjecting these data to theaplacian transformation (Fig. 3C) resulted in a response field thatas independent of the reference electrode and therefore empha-ized local sources of current largely confined to the STG. Theres a close correspondence between pre- and post-transformationhapes of ERPs at some but not all electrode sites. This is to bexpected, as the Spline–Laplacian transformation reduces voltageontributions from distant sites. Furthermore, Spline–Laplacianstimates are not expected to be very accurate near the edge ofn electrode grid (Nunez and Pilgreen, 1991) where the disagree-ent in shapes can be most marked. We attempted to reduce thisdge effect during spline interpolation (not entirely successfully)y adding extra electrode sites along each edge of the recordingrid (see online Supplementary Data) and requiring their voltageso be zero. In this study, analyses of differences between re-ponse fields arising from different experimental factors alwaysmployed ERPs transformed by the Spline–Laplacian.
tatistical analysis: MANOVA
he analysis of variance model we employed is one commonlysed to test hypotheses concerning the effects of differencesmong two or more experimental factors on the dependent uni-ariate response measurement. In our studies, the dependentRP measurement was treated as a multivariate response vectornd assumed to be sampled from a multivariate normal distribu-ion (Donchin, 1966). In this approach, MANOVA is a suitableramework in which to test whether ERPs differ among our threexperimental factors: Stimulus Type, Electrode Site and AW (Dil-
on and Goldstein, 1984). A three-way, repeated-measuresANOVA provided an overall test of the equality of these multi-
ariate ERP vectors as well as tests for main effects (Stimulus: 5evels, Electrode Sites: 42–64 levels, AWs: 3 levels) and effectsue to combinations of experimental factors. Thus, our statisticalnalysis does not depend upon the measurement of a singleeflection in the ERP (since the response variable is a vectorepresenting the ERP waveform) nor does it depend upon aimple difference in the response variable (e.g. additive or sub-ractive). Rather, any systematic difference between the con-rasted waveforms beyond chance is sufficient to mark an effect.
The first statistic of interest was the omnibus combinationffect, which indicated whether differences among ERPs de-ended on a conjunction between levels of stimulus, electrodeite, and AW. In MANOVA, when the classification has more thanne factor, and omnibus tests for main effects and their combina-ions are significant, it is common to test (i.e. contrast) the meansf each level of each factor and their combinations, adjusting theesulting P-values to reflect these multiple comparisons. When the
xperimenter’s primary interest is in a set of focused (e.g. single- eegree-freedom) tests one can safely ignore the omnibus resultsnd simply construct these multiple comparison tests. We choseo be conservative on this, and introduced the omnibus test which,f found to be significant (alpha�0.05), led us to carry out fivelanned contrasts (Table 2) to identify those electrode sites con-
ributing to the proposed effect. Significant (non-zero) differenceshat arose from using these contrasts were, depending on theomparison, interpreted to reflect an AV interaction, differences inhe unimodal responses, or both.
The MANOVA procedure was preceded by a principal com-onent analysis (PCA) in order simply to reduce the dimension-lity of the ERP data vectors (Hotelling, 1933; Suter, 1970). Itould not have been possible to carry out the multivariate analysissing the original ERP vectors of such high dimensionality (i.e.00 sample times). However, there is redundancy within thisemporal dimension so that linear combinations of the originalample-time variables were replaced with a set of new uncorre-ated principal component scores. For each subject the input to theCA was the corpus of ERPs comprising all trials for all stimulus
ypes, AWs, and electrode sites, after down-sampling to 1sample/s. For our subjects this translated to between 45,000 and0,000 ERPs using the three AWs described above (Fig. 2). These of the PCA scores (i.e. weights) in the ERP vectors, rather thathe original voltage measurements, does not depend upon anssumption of orthogonality but only upon the adequacy of theepresented ERPs (see online Supplementary Data: Methods). Aufficient number of PCs (from 14-to-21) was retained to accountor 90% of the variance, which typically represented at least anrder-of-magnitude reduction (e.g. 500 to �50) in the dimensionf the input vectors. In practice, we employed ERPs transformedy the Spline–Laplacian as the input vectors for the PCA compu-ation.
ortical significance maps
patial maps of average ERPs, like that shown in Fig. 3B, illus-rate the mean spatio-temporal relationships expressed by theeural signals in response to a particular stimulus. In order toake comparisons among response fields corresponding to dif-
erent stimuli, ERPs (transformed by the Spline–Laplacian) werenalyzed using a three-way MANOVA with a doubly-multivariateepeated-measures design (SAS v9.1, SAS Institute Inc., Cary,C, USA), as described above. The AW levels were chosen by
he temporal relationship between audible syllable onset and theajor deflections in an ERP (see Fig. 2). A more detailed temporalnalysis is beyond the scope of this paper, and will be the subjectf a subsequent article.
In all 8 subjects, the omnibus effect (Stimulus�AW�lectrode Site) was significant at the 0.05 level. Contrast codingas then used to test the five comparisons listed in Table 2 at
able 2. Response model and five planned contrasts used to identifylectrode sites exhibiting a significant effect
Response model: AV→
�A� �V� �INT→
Planned contrast Response vectors tested
1 AdaVda
→vs. Ada
→
Vda
→�INT→
2 AdaVda
→vs. Vda
→
Ada
→�INT→
3 AdaVgurn
→vs. Ada
→
Vgurn
→�INT→
4 AdaVda
→vs. AdaVgurn
→Vda
→�Vgurn
→
5 AdaVda
→vs. AgiVda
→Ada
→�Agi
→
ach of the electrode sites. These pair-wise comparisons among

smswmfbaemaghrdjcpcwtm
WlbtaefPbatpttopmsvmpenfiwwaslIma
Aast
tdqpao
P
WciomtssAAsdsritwi
satoptpttaernpAwrs
ftfhwmtatt
s
R. A. Reale et al. / Neuroscience 145 (2007) 162–184 169
timuli allowed for the construction of cortical significance maps byarking the location of each electrode site at which the corre-
ponding (multiple-comparison adjusted) P-value for that contrastas �0.05. Performing multiple comparisons required this adjust-ent to the raw P-values in order to control for the inflation of the
amily-wise (type-I) error rate (FWE). This inflation in the proba-ility of making at least one false rejection of a null hypothesis islways of concern when the entire family of inferences is consid-red rather than any single family member. When the dependenteasure is univariate, there are well-known post hoc tests anddjustments to control for the FWE. Such procedures are notenerally available for our multivariate ERP data. In this case,owever, ‘generalized Bonferroni methods’ were found to workeasonably well as multiple inference procedures. These proce-ures control the error rate for testing individual hypotheses, not
ust the overall null. The Bonferroni method guarantees strictontrol of the FWE when the concern is with either multiple hy-otheses or simultaneous confidence intervals even when theomparisons are not necessarily independent. Since our interestas only in simultaneous tests of hypotheses, FWE was con-
rolled and power improved by using the Hochberg-modifiedethod (Westfall et al., 1999).
RESULTS
e described previously an area of cortex on the postero-ateral STG (field PLST) that could be activated, bilaterally,y a wide range of acoustic stimuli including clicks, pure-ones, band-pass noise, and syllable utterances (Brugge etl., 2005; Howard et al., 2000). Fig. 4 illustrates, for theight subjects in the current study, the average ERP wave-orm recorded at the site of maximal responsiveness withinLST to three stimulus types: auditory /da/ alone (Ada,lue), visual /da/ alone (Vda, green) and the congruentuditory-visual /da/ (AdaVda, red). The average ERPs at
his and all other sites within PLST exhibited prominentositive and negative voltage deflections in response tohe acoustic utterance delivered in isolation. These deflec-ions were essentially confined in time to 500 ms after thenset of the acoustic event, which we refer to as AW2. Theresence during AW1 of the lower face and its associatedovements in the absence of the acoustic utterance, re-
ulted in an average ERP with little or no recognizableoltage deflections. These results are not interpreted toean that PLST does not respond to a visual stimulusresented alone. The trigger used to synchronize the av-rage waveform was related to acoustic syllable onset andot to the earlier appearance of either the initial visualxation image or the static lower face. Lip movements,hich began 432 ms (nominally) before syllable onset andhich are the salient cues to seen speech in this study, areseries of visual events with a gradual onset and progres-
ion. Hence this visual stimulus may not evoke the timeocked activity necessary for a detectable averaged ERP.nstead, one would expect an ERP associated with lipovement, if present at all, to be progressively elaboratednd necessarily small (e.g. Besle et al., 2004).
For any one subject, ERP deflections in response toV speech (AdaVda) were similar, though not identical, inppearance to those seen in response to the acousticyllable presented alone (see Figs. 2, 4 and 6). In addition,
he relationship among the three average ERPs evoked by iheir corresponding stimulus types (e.g. Fig. 4) clearlyiffered among subjects. As will be described subse-uently, this subjective impression was tested using com-arisons between stimulus types and related to the later-lity of the hemisphere from which the recordings werebtained.
roportion of sites exhibiting significant effects
e first compare, for each subject in the study, the per-entage of electrode sites on the grid that exhibited signif-
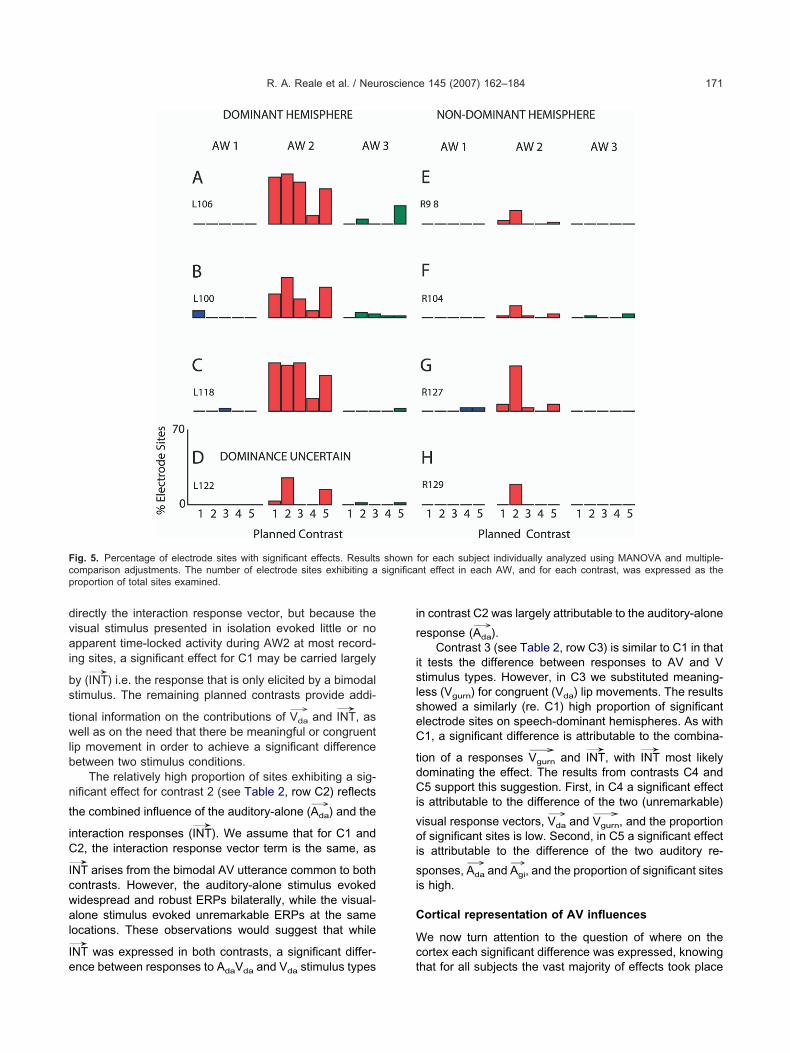
cant differences for each of the five contrasts within eachf the three AWs. Table 2 shows the form of the responseodel along with each of the five planned contrasts and
he ERP vectors being tested by each of them. Fig. 5hows in each panel the proportion of significant recordingites for each subject during AW1 (blue), AW2 (red) andW3 (green) as a function of the five contrasts. Panels–C represent data from the speech-dominant hemi-pheres as determined by WADA testing. Panel D showsata from the subject (L122) for which the hemisphericpeech dominance was uncertain. Panels E–H representesults obtained from non-speech-dominant hemispheresn the remaining four subjects. As described in Experimen-al Procedures, subject R127 (G) had a frontal lobe lesion,hereas subject R98 (E) had a previous resection of the
nferior and middle temporal gyri.Several features in these data that are common to all
ubjects stand out in Fig. 5. First, during AW1 the percent-ge of significant electrode sites was low (�4%) for all ofhe five contrasts. This is the time epoch just prior thenset of the audible syllable during which the face wasresent and lips began to move. This result indicates thathere was little, if any, time locked activity generated by theresence alone of the lower face and moving lips, and thathe MANOVA approach we used was relatively insensitiveo the apparent random fluctuations in the EEG prior tocoustic stimulation. Second, all subjects exhibited significantffects during AW2, although the proportions of significantecording sites were demonstrably greater on speech-domi-ant hemispheres. The third general feature is that the pro-ortions of significant electrode sites detected in AW3, likeW1, were either negligibly small or zero when comparedith their counterparts in AW2, and they showed no clear
elationships to the contrasts. Thus, we have restricted sub-equent illustrations of results to AW2.
Results of contrast 1 (see Table 2, row C1) show thator speech dominant hemispheres a relatively high propor-ion of recording sites exhibited a significant effect. Farewer significant sites were identified on non-dominantemispheres or on the hemisphere for which dominanceas uncertain. We interpret these significant effects toean that at the effective recording sites the response to
he auditory utterance /da/ was influenced by the subject’sbility to view the articulation of that utterance. In terms ofhe current model (Table 2), the significant effect found forhis contrast reflects the combined influence of two re-
ponse vectors: the visual-alone response (Vda
→) and the
nteraction response (INT→
). We are unable to measure

Fsa
R. A. Reale et al. / Neuroscience 145 (2007) 162–184170
ig. 4. Average ERPs obtained for three stimulus types. Responses shown from one electrode site (maximal voltage) within area PLST from eachubject. Visual alone (V ) stimulus type produces ERPs with minimal voltage deflections from baseline. Auditory alone (A ) and AV speech (A V )
da da da dalways produce a series of positive and negative deflections beginning shortly (15–50 ms) after audible syllable onset.
dvai
bs
twlb
n
t
iC
I→
cwal
I→
e
i
r
islseC
tdCi
voi
si
C
Wc
Fc significap
R. A. Reale et al. / Neuroscience 145 (2007) 162–184 171
irectly the interaction response vector, but because theisual stimulus presented in isolation evoked little or nopparent time-locked activity during AW2 at most record-
ng sites, a significant effect for C1 may be carried largely
y (INT→
) i.e. the response that is only elicited by a bimodaltimulus. The remaining planned contrasts provide addi-
ional information on the contributions of Vda
→and INT
→, as
ell as on the need that there be meaningful or congruentip movement in order to achieve a significant differenceetween two stimulus conditions.
The relatively high proportion of sites exhibiting a sig-ificant effect for contrast 2 (see Table 2, row C2) reflects
he combined influence of the auditory-alone (Ada
→) and the
nteraction responses (INT→
). We assume that for C1 and2, the interaction response vector term is the same, as
NT arises from the bimodal AV utterance common to bothontrasts. However, the auditory-alone stimulus evokedidespread and robust ERPs bilaterally, while the visual-lone stimulus evoked unremarkable ERPs at the same
ocations. These observations would suggest that while
NT was expressed in both contrasts, a significant differ-
ig. 5. Percentage of electrode sites with significant effects. Resultsomparison adjustments. The number of electrode sites exhibiting aroportion of total sites examined.
nce between responses to AdaVda and Vda stimulus types t
n contrast C2 was largely attributable to the auditory-alone
esponse (Ada
→).
Contrast 3 (see Table 2, row C3) is similar to C1 in thatt tests the difference between responses to AV and Vtimulus types. However, in C3 we substituted meaning-
ess (Vgurn) for congruent (Vda) lip movements. The resultshowed a similarly (re. C1) high proportion of significantlectrode sites on speech-dominant hemispheres. As with1, a significant difference is attributable to the combina-
ion of a responses Vgurn
→and INT
→, with INT
→most likely
ominating the effect. The results from contrasts C4 and5 support this suggestion. First, in C4 a significant effect
s attributable to the difference of the two (unremarkable)
isual response vectors, Vda
→and Vgurn
→, and the proportion
f significant sites is low. Second, in C5 a significant effects attributable to the difference of the two auditory re-
ponses, Ada
→and Agi
→, and the proportion of significant sites
s high.
ortical representation of AV influences
e now turn attention to the question of where on theortex each significant difference was expressed, knowing
for each subject individually analyzed using MANOVA and multiple-nt effect in each AW, and for each contrast, was expressed as the
shown
hat for all subjects the vast majority of effects took place

davrwaopsdwets
C
Wr((aaef
(tmeAuLDtrfiass(tc
ii
t
V→
pi
es
nCFsw
twicwsntw
C
IsssEaispcine(bCatsdt
fttun(ctjarjcc
si
vsp
rps
R. A. Reale et al. / Neuroscience 145 (2007) 162–184172
uring the 500 ms window (AW2) after the onset of thecoustic event. Because of the considerable inter-subjectariation in gross anatomical landmarks and in location ofecording grids with respect to the location of area PLST itas not feasible to pool data and thereby make grand-verage comparisons across our subject population with-ut blurring the representational results. We thereforeresent the individual cortical significance maps for eachubject for all contrasts, restricting our description of theistribution of the significant recording sites to AW2 and,ith the exception of Fig. 8, to the left hemisphere, asssentially all effects involving the AV-interaction responseook place during this time window and within this hemi-phere.
ontrast 1: AdaVda
→vs. Ada
→
e found consistently that, for any given subject, theesponse field associated with congruent AV speechAdaVda) and that obtained with auditory stimulation aloneAda) were characterized by polyphasic ERPs with similarmplitude distributions and time courses Nevertheless, it ispparent from Fig. 4 that differences between the ERPsvoked with AdaVda and Ada stimulus types were obtainedrom some subjects at certain electrode sites.
We begin by presenting in detail data for subject L106Fig. 6). In this subject the recording grid was located overhe left (speech dominant) hemisphere. The grid covereduch of the middle and posterior aspects of the STG, andxtended onto the parietal lobe above and the MTG below.V speech (AdaVda) as well as auditory-alone (Ada) stim-lation evoked robust responses with the largest Spline–aplacian ERPs localized to the STG (Fig. 6 B and C).espite the similarity between response fields, the statis-
ical results indicated that significant differences were rep-esented (Fig. 6A) over essentially the entire responseelds (see online Supplementary Data: Results). Thus, itppears that the waveform differences apparent at theingle electrode site in Fig. 4A were significant and repre-entative of most other sites in the response fields. Fig. 9B and C) presents C1 significance maps from two addi-ional left hemisphere, speech-dominant, cases that areonsistent with the results from subject L106.
We interpret the AdaVda
→vs. Ada
→significance map as
dentifying those cortical locations where the ECoG wasnfluenced significantly by the simultaneous presence of
wo responses: Vda
→�INT→
. However, the observation that
da response fields were, as a rule, unremarkable in com-arison to response fields obtained with a stimulus that
ncluded an audible syllable suggests that this statistical
ffect is largely attributable to INT→
—the interaction re-ponse that is elicited only by a bimodal stimulus.
Only a few recording sites on the non-speech-domi-ant hemispheres exhibited significant effects for contrast1 as can be appreciated by the low percentages listed inig. 5 (E–H), and hence the statistical maps for theseubjects are not shown. Although grid coverage of the STG
as less extensive on these right hemispheres, it appears ahat the number of the auditory responsive sites detectedas sufficient to uncover an AV interaction in these cases,
f it were present. Fig. 9D shows the significance map forontrast C1 obtained from the left-hemisphere patient forhich speech dominance was uncertain. In this case, thetatistical mapping data appear more consistent with theon-speech-dominant, right hemispheres subjects, al-hough L122 also demonstrated areas of cortical dysplasiaithin the STG.
ontrast 2: AdaVda
→vs. Vda
→
n Fig. 7 we present in detail contrast C2 data for the sameubject (L106) for which we previously presented C1 re-ults. Whereas AV speech (AdaVda) evoked robust re-ponses with most easily-recognized Spline–LaplacianRPs localized to the STG (Fig. 7B), relatively few discern-ble deflections were seen in the waveforms correspond-
ng to the Vda stimulus type that was generated when theseame lip movements were presented without the accom-anying audible utterance (Fig. 7C). Thus, a Spline–Lapla-ian ERP to the visual-alone stimulus, if present, was small
n amplitude and apparently localized to a few sites at orear where the response to the AV stimulus was mostffective. The cortical significance map for contrast C2Fig. 7A) could easily have been suggested by comparingy eye the two constituent response fields (i.e. Fig. 7B and). In this subject, 30 of 64 electrode sites (47%) exhibitedsignificant difference for contrast C2 with all but a few of
hem clustered over the STG. This result is remarkablyimilar in both the proportion (42%) and in the spatialistribution of significant sites obtained with contrast C1 forhe same subject.
Significance maps for contrast C2 are shown in Fig. 8or six additional subjects. Two (A, B) were derived fromhe left, speech-dominant, hemisphere and one (C) fromhe left hemisphere where the speech dominance wasncertain. Three maps (D, E, F) were derived from right,on-speech dominant, hemispheres. Like subject L106Fig. 7), for all subjects significant electrode sites wereommonly observed for this contrast and their locationsended to aggregate over posterolateral STG. In all sub-ects the recording grid sampled the cortical areas dorsalnd ventral to the STG, although significant sites werearely detected there. The analysis included the two sub-ects (R127, Fig. 8E: R98) with lesions that altered cortico-ortical inputs from the frontal lobe (R127) or from theortex lining the ventral bank of the STS (R98).
We interpret the AdaVda
→vs. Vda
→significance map as
howing those cortical locations where the ECoG wasnfluenced significantly under the presence of response
ectors Ada
→�INT→
(see online Supplementary Data: Re-ults). These contrast data by themselves, however, do notermit parsing the significance effect between these two
esponses: Ada
→and INT
→. Auditory alone (Ada) stimulation
roduced a clearly distinguishable response field in thisubject and all others in this study. As stated earlier, we
ssume that the INT→
response inferred from the results of

C
w
rt
mcmowu
C
Fg
pca
masie
mstsptajctlfr
bnta
C
Fs
(t
(
F1in AW2. (B) Average Spline–Laplacian waveform at each of the
orfs(a
R. A. Reale et al. / Neuroscience 145 (2007) 162–184 173
1 is the same as that seen with C2, as the AV stimulus
as the same for both C1 and C2. If, however, the Ada
→
esponse vector was very large as compared with INT→
thenhese significance maps could be interpreted as arising
ainly from the Ada
→response. This interpretation would be
onsistent with the demonstrated C2 cortical significanceaps in both left and right hemispheres in Fig. 8 and thebservation that response fields for AV speech (AdaVda)ere similar in extent to those obtained with auditory stim-lation alone (Ada), regardless of hemisphere.
ontrast 3: AdaVgurn
→vs. Ada
→
rom Table 1 we see that, according to our model, con-ruent AV speech (AdaVda) could elicit as many as three
ossible response vectors (Ada
→�Vda
→�INT→
). Similarly, in-ongruent AV speech (AdaVgurn), produced by substitutinggurning motion for the natural movement of the speaker’s
outh, also could elicit three vectors (Ada
→�Vgurn
→�INT→
). If,s suggested above, visual-alone stimulation produced amall or negligible response vector, compared with the
nteraction term, then contrast C3 will test whether congru-nt lip movement is required for significant effects. Further-
ore, if the interaction response (INT→
) does not differubstantially between the AdaVgurn and AdaVda stimulusypes, then the significance maps for contrasts C3 and C1hould bear a close resemblance to each other. The ap-licable cortical significance maps are shown in Fig. 9 forhe four left hemisphere subjects in our population. Imagesre arranged to facilitate direct comparison for each sub-
ect between the significance maps for contrasts C1 (leftolumn) and C3 (right column). It seems remarkable thathese map pairings are nearly identical in the number andocation of significant recording sites. This finding providesurther support for our contention that the significant effecteliably detected at these electrode sites is carried mainly
y the AV interaction (INT→
) and suggests that the effect isot dependent on congruent lip movement. These sugges-ions are further supported by results from contrasts C4nd C5.
ontrast 4: AdaVda
→vs. AdaVgurn
→
rom Table 1 we see that, with our model, congruent AVpeech was considered to elicit response components
Ada
→�Vda
→�INT→
), that differed only in the visual term fromhose vectors resulting from incongruent AV speech
Ada
→�Vgurn
→�INT→
). Thus, contrasting these two stimulus
riginal recording sites elicited by congruent AV speech (AdaVda). Grayectangles replace filled circles. (C) Average Spline–Laplacian wave-orms elicited by unimodal Auditory speech (Ada). The SF and STS arehown in gray on the spatial maps of waveforms. The ordinate scale
2
ig. 6. Comparison of spatial maps of Spline–Laplacians for Contrast. (A) Filled circles mark the recording sites at which C1 was significant vertical line: �200 to �200 �V/cm ) is common to both maps and thebscissa scale includes all three AWs.

t
e
�o
tsartappsihrsatt
C
Itt
/1t
A→
tut
(vaifnssfinsstdS
wAestbs
F2this contrast was significant in AW2. (B) Average Spline–Laplacian
R. A. Reale et al. / Neuroscience 145 (2007) 162–184174
ypes (Contrast 4, Table 2) resulted in testing the differ-
nce between the two visual response vectors (Vda
→
Vgurn
→). The AV interaction response (INT
→) had cancelled
ut since the current model makes no distinction between
he INT→
vector elicited by AdaVda and the interaction re-ponse resulting from AdaVgurn. If, as shown earlier, visual-lone stimulation produced relatively small and scarceesponse vectors (see Figs. 4 and 7), then testing an effecthat depended on their difference was expected to produce
significant outcome at few, if any, electrode sites. Thisrediction was upheld as shown by the significance mapsresented in Fig. 10. On the speech-dominant left-hemi-pheres (Fig. 10A–C) there were no more than five signif-
cant recording sites and on the dominance-undeterminedemisphere (Fig. 10D) and on the non-speech-dominantight hemispheres (not shown) there were none. Thoseignificant sites were within the spatial domain of AV inter-ctions seen with contrasts C1 and C3, which suggestshat differences in the visual-alone response vectors,hough small, could still produce measurable effects.
ontrast 5: AdaVda
→vs. AgiVda
→
ncongruent AV speech (AgiVda), produced by substitutinghe audible syllable/gi/ for the syllable /da/ while retaininghe natural movements of the speaker’s mouth for syllable
da/, elicits three response vectors, Agi
→�Vda
→�INT→
(Table). These response components differ only in the audi-ory term from those evoked by congruent AV speech,
da�Vda
→�INT→
; assuming again that the interaction vec-ors are identical. Therefore, contrasting these two stim-lus types (contrast C5, Table 2) resulted in testing
he difference between the two auditory responses
Ada
→�Agi
→), as the AV interaction canceled out. Unlike
isual-alone stimulation, auditory-alone stimulation withny CV syllable was typically capable of evoking ERPs
n area PLST similar to those depicted in Fig. 3B. There-ore, a significant effect for contrast C5 would depend oneural processing that discriminated between acousticignals for da/ and gi/. Fig. 11 illustrates the corticalignificance maps corresponding to contrast C5 for theour left-hemisphere subjects in our population. Clearly,n speech-dominant hemispheres (Fig. 11A, B, C) theumber of electrode sites at which the contrast wasignificant suggests that the acoustic difference in theyllables was discriminated. The significance map ob-ained from the left-hemisphere patient for which speechominance was uncertain (D) does not show this effect.imilarly, the statistical results from the four non-speech
aveform at each of the original recording sites elicited by congruentV speech (AdaVda). Gray rectangles replace filled circles. (C) Av-rage Spline–Laplacian waveforms elicited by unimodal Visualpeech (Vda). The locations of the SF and STS are shown in gray onhe spatial maps of waveforms. The ordinate scale is common to
2
ig. 7. Comparison of spatial maps of Spline–Laplacians for Contrastin subject L106: (A) Filled circles mark the recording sites at which oth maps (vertical line: �200 to �200 �V/cm ) and the abscissacale includes all three AWs.

dtt5
satCatde
uFldct
T
Slfa
Fcd
R. A. Reale et al. / Neuroscience 145 (2007) 162–184 175
ominant, right hemisphere subjects indicate propor-ions of significant effects much smaller (Fig. 5E–H) thanhose observed in speech-dominant hemispheres (Fig.A–C).
For every subject in this study, the proportion ofignificant electrode sites detected for contrast C5 waspproximately equal to the proportion obtained with ei-
her contrast C1 or C3 (see Fig. 5). For contrasts C1 and3, we argued that the significant effect could be largelyttributed to an AV interaction response. Furthermore,he cortical significance maps for contrast C5 in speech-ominant hemispheres (Fig. 11A, B, C) are nearly co-
ig. 8. Cortical significance maps from three left (A–C) and three rightontrast was significant in AW2. Stippled area in (E) shows the extenescription).
xtensive with the significance maps for these subjects g
nder either contrast C1 (Fig. 9A, B, C) or C3 (Fig. 9E,, G). Taken together these findings suggest that over-
apping territories in posterolateral STG on the speech-ominant hemisphere are engaged in the neural pro-essing associated with both AV interactions and acous-ic syllable discrimination.
est for laterality effect
ince we did not have an a priori hypothesis to test for aaterality effect, we took an exploratory approach and per-ormed nonparametric tests for location differences across
one-way classification. Our data were classified into two
misphere subjects for contrast C2. Filled circles mark sites where thisl lobe damage sustained earlier by subject R127 (see text for further
(D–F) het of fronta
roups: those subjects who had electrodes placed on the

te
a
Fck hibited z
R. A. Reale et al. / Neuroscience 145 (2007) 162–184176
emporal lobe of the LEFT hemisphere and those who had
ig. 9. Cortical significance maps for contrasts C1 (A–D) and C3 (Eontrast was significant in AW2. The left hemisphere of three subjectsnown. Maps for C1 and C3 for the four right hemisphere subjects ex
lectrodes in the RIGHT hemisphere. The response vari- r
ble was the F-value calculated from Wilkes’ lambda thathe four left hemisphere subjects. Filled circles mark sites where the00, L118) was speech dominant. Speech dominance of L122 was notero to four significant sites (not shown).
–H) for t(L106, L1
esulted from planned contrasts C1 and C3 since a signif-

ii
agtn9dsTasibsstttsittse
Sam1keBaWsAptaF2aSwn
roohhacgifii
Fst/N
R. A. Reale et al. / Neuroscience 145 (2007) 162–184 177
cant effect in these contrasts was attributed to an AV
ig. 10. Cortical significance maps for contrast C4 for the four left hemi-phere subjects Meaningless mouth movement (gurning) substituted forhe natural movement of the speaker’s mouth in articulating the syllableda/. Filled circles mark sites where this contrast was significant in AW2.o significant sites were found in the four right hemisphere cases.
nteraction that was relatively larger than either visual- a
lone response and therefore dominated the effect. Ouroal was to decide whether the location and distribution ofhis response variable differed for the two populations. Theonparametric procedure (Procedure NPAR1WAY, SAS.1) performed a test for location using the Van der Waer-en (VW) scores in a simple linear rank statistic. VWcores are the quantiles of a standard normal distribution.hese scores are also known as quantile normal scoresnd are powerful for normal distributions. The VW two-ample test statistic was significant (Z�8.34, P�0.0001)ndicating rejection of the null hypothesis of no differenceetween LEFT and RIGHT hemisphere populations. Aimilar effect was found using the raw F-values as the inputcores (Z�7.96, P�0.0001). To test the hypothesis thathe two groups of observations have identical distributions,he procedure provides empirical distribution function sta-istics, including the two-sample Kolmogorov-Smirnov testtatistic. The result for the KS two-sample test was signif-
cant (KS�3.31, P�0.0001), which indicates rejection ofhe null hypothesis that the F-value distributions were iden-ical for the two levels of hemisphere. The same pattern oftatistically significant effects were observed when usingxact statistics based on Monte Carlo estimation.
DISCUSSION
peech communication often integrates hearing and seeing,nd thus it should not be surprising to find that human he-odynamic (Callan et al., 2003, 2004; Calvert et al., 1997,999, 2000; Calvert, 2001; MacSweeney et al., 2002; Pe-kola et al., 2005; van Atteveldt et al., 2004), MEG (Mottonent al., 2002; Sams et al., 1991), and EEG (Callan et al., 2001;esle et al., 2004; Giard and Peronnet, 1999; Klucharev etl., 2003; Molholm et al., 2002; Murray et al., 2005; vanassenhove et al., 2005) studies have implicated wide-
pread involvement of superior temporal auditory cortex inV interactions. Human auditory cortex is made up of multi-le fields, however, and with the exception of core area A1
here is still no full agreement on their number and spatialrrangement (Hackett et al., 2001, 2003; Hackett, 2003;ormisano et al., 2003; Sweet et al., 2005; Wessinger et al.,001). Thus, while the converging hemodynamic, MEGnd EEG evidence from human studies points to theTG as playing a role in AV interactions, the question ofhich of the multiple auditory fields are so involved hasot been fully answered by those experiments.
Our major finding here is that AV interactions are rep-esented within physiologically-defined auditory area PLSTn the human posterolateral STG. The AV representationverlaps extensively with PLST on the speech-dominantemisphere, but is hardly in evidence on the non-dominantemisphere. The results were derived from ERPs to heardnd seen speech recorded directly from lateral temporalortex using pial-surface electrodes implanted in neurosur-ical patients undergoing diagnosis and treatment of med-
cally intractable epilepsy. The ERP maps obtained wererst processed by the Spline–Laplacian technique, which
mproved the spatial resolution of local cortical sources
nd de-emphasized deep brain sources and/or coherent
st
mLt
maptrcMs(esesghvnqriwOiinMeu
A
Sbiutimaehaoeql
rtedirh
FsrFs
R. A. Reale et al. / Neuroscience 145 (2007) 162–184178
ources distributed over large cortical areas. Data were
ig. 11. Cortical significance maps for contrast C5 for the four left hemi-phere subjects. The audible syllable /gi/ substituted for syllable /da/ whileetaining the natural movements of the speaker’s mouth for syllable /da/.illed circles mark sites where this contrast was significant in AW2. Fewignificant sites were found in the four right hemisphere cases.
hen subjected to a MANOVA analysis (see online Supple- c
entary Data: Discussion) to test whether the Spline–aplacian ERPs differed among three experimental fac-ors, including the stimulus type, electrode site and AW.
In our cortical significance maps, AV interactions wereost frequently localized to electrode sites in area PLST,lthough a few sites were routinely located above the SF inarietal cortex. These parietal sites are typically located athe physical edge of the recording grid and, therefore, mayepresent a computational artifact (see Experimental Pro-edures: Spline–Laplacian transformation). Cortex of theTG and posterior STS has been identified in human fMRI
tudies as sites of AV integration to both non-speechBeauchamp et al., 2004) as well as speech tokens (Callant al., 2004). The latter authors proposed that the multi-ensory effects noted in their study might have their gen-sis in the biological motion that occurs during naturalpeech articulation. In this regard, the posterior STS re-ion, but apparently not adjacent STG, is reported to ex-ibit robust hemodynamic activation in human subjectsiewing eye and mouth movements without an accompa-ying auditory component (Puce et al., 1998). It seemsuite unlikely, however, that the AV interaction we foundepresented within field PLST arose from activity spread-ng from multimodal cortex of the STS or from the MTGhere in several subjects the recording sites were located.ur spatial filtering likely reduced or eliminated far field
nfluences that may have arisen from possible AV activityn these distant regions. We interpret the fact that we foundo evidence of AV interactions from recorded sites onTG to mean that our coverage of this gyrus was notxtensive enough to identify active sites, or that the stimulised were not of the kind to elicit such an interaction.
V interactions
ignificant differences that arose from using five contrastsetween bimodal and unimodal responses were, depend-
ng on the contrast, interpreted to reflect differences in thenimodal response, an AV interaction, or some combina-ion of the two. In other words, an AV interaction wasdentified under a simple model of vector response sum-
ation. In testing for significance, the analyses took intoccount the entire waveform within each AW and at eachlectrode site. Because the aim of the study was to test theypothesis that AV interactions occurred within a knownuditory field, this approach was chosen to identify wheren the posterolateral temporal cortex significant differ-nces were expressed during each of three AWs. Theuestion of when the interactions occurred is left for fol-
ow-up studies and analyses.The major finding of an AV interaction came from the
esults of contrast C1 (AdaVda
→vs. Ada
→). Although the audi-
ory-alone stimulus and the congruent-AV stimulus bothvoked ERPs that were similar in waveform and in spatialistribution on the STG, our analysis often revealed signif-
cant differences at many of the same sites that wereesponsive to auditory stimulation in the speech-dominantemisphere. According to our model, these differences
ould have arisen from a visual response, from an AV
ivowiowrscafAs
c
(bvcsew(
w
arsco(tocmloddfittAe
farfmpfbdtr
r
rlotppficRt11sva1mSdvleahtmlngt1tms(Dmtac
hk1ra(tetttthmsA
R. A. Reale et al. / Neuroscience 145 (2007) 162–184 179
nteraction response or from a combination of the two. Theisual stimulus when presented in isolation evoked littlebvious time-locked response during any AW. If an ERPas associated with the visual-alone stimulus during AW2,
t appeared to be very low in amplitude and confined to butne or a few sites within the significance map. From thise inferred that the visual stimulus contributed little to the
esults of contrast C1, and that it was an interaction re-ponse vector that was mainly responsible for any signifi-ant effects. Our current model incorporated an AV inter-ction response that did not depend upon the particularorm of the bimodal stimulus (e.g. AdaVda or AdaVgurn or
giVda) that evoked the interaction. This formulation wasupported by the remarkable similarity between signifi-
ance maps for contrasts C1 (AdaVda
→vs. Ada
→) and C3
AdaVgurn
→vs. Ada
→) since it was argued that the effect for
oth contrasts was dominated by this same interactionector. The finding of an AV interaction under both speechonditions is in accord with results from a recent scalp ERPtudy in which the use of AV speech stimuli providedvidence for multisensory interactions regardless ofhether the speech tokens were congruent or incongruent
van Wassenhove et al., 2005).When we apply our model to contrast C4, however,
hich tested the difference between response vectors Vda
→
nd Vgurn
→, we conclude that not only were there two visual
esponse vectors at a few electrode sites but that, howevermall, the difference between these vectors was signifi-ant. This conclusion follows from the model’s formulationf the AV interaction associated with the congruentAdaVda) stimulus type as identical to that associated withhe incongruent (AdaVgurn) type. Nevertheless, regardlessf the support for this formulation discussed above, weannot rule out the possibility that the interaction vectoray differ depending on the composition of the AV stimu-
us. Such differences might reasonably be expected toccur for those AV stimulus types that are known to pro-uce robust auditory illusions (e.g. the McGurk effect) oreviance potentials, and the model can be easily re-con-gured to reflect this dependence. Limitations of recordingime prevented us from employing additional stimulusypes to address more fully whether and to what extent theV interactions corresponding to congruent and incongru-nt cases might, indeed, be unique.
It is not too surprising to find that visual-alone stimuliailed to elicit ERPs more comparable to those evoked by
stimulus containing a causal auditory event. In our cur-ent experimental design ERPs were synchronized to ef-ective sounds having relatively rapid onset times. Lipovements, on the other hand, had gradual onsets androgression times and, therefore, were not optimal stimuli
or eliciting precise time-locked activity typically revealedy the average ERP. Alternative approaches that do notepend on precise trial-by-trial synchronization (e.g. spec-
ral analysis) may prove more effective in revealing corticalesponses to lip movement.
The fact that in humans robust ERPs to AV stimuli are
ecorded on posterolateral STG indicates that this cortex seceives highly synchronized stimulus-evoked afferent vol-eys. It is certainly conceivable that the AV interactions webserved in ERPs from posterolateral STG in human arehe result of AV information arriving over cortico-corticalathways. In Old-World monkeys, auditory parabelt on theosterior STG has connections not only with other auditoryelds of the temporal lobe, but with regions in the prefrontalortex (Hackett et al., 1998b, 1999; Molinari et al., 1995;omanski et al., 1999a,b) and cortex forming the banks of
he STS (Ward et al., 1946; Seltzer and Pandya, 1978,994; Galaburda and Pandya, 1983; Petrides and Pandya,988; Hackett et al., 1998a) considered to have multisen-ory function. Polysensory STS receives its input fromisual cortex and from polysensory thalamic nuclei (Seltzernd Pandya, 1978, 1994; Desimone and Ungerleider,986). Additionally, afferent activity arising in visual cortexay be transmitted to the posterior STG directly (Foxe andchroeder, 2005; Nascimento-Silva et al., 2005; Schroe-er et al., 2003). Both the highly synchronized afferentolley evoked by an AV stimulus and the relatively short
atency of the onset of the resulting ERP suggest, how-ver, that direct sources of the earliest PLST input at leastre the multimodal areas of the thalamus. In the non-uman primate, auditory belt and parabelt cortex, unlikehe auditory core, receive their thalamo-cortical inputainly from the thalamic nuclei that lie outside of the lateral
emniscal route. These nuclei include the dorsal and mag-ocellular divisions of the medial geniculate body, supra-eniculate nucleus, nucleus limitans and medial and cen-ral pulvinar (Rauschecker et al., 1997; Hackett et al.,998b), all of which are well represented in the humanhalamus (Winer, 1984). Non-lemniscal thalamus receivesultisensory convergent input from visual, somatic sen-
ory and auditory areas of the brainstem and midbrainBenedek et al., 1997; Graybiel, 1972; Jones, 1985; Le-oux et al., 1987; Wepsic, 1966; Winer, 1992). Hence theost parsimonious interpretation of our results would be
hat AV interactions recorded in human posterolateral STGre the result of converging cortico-cortical and thalamo-ortical unisensory and/or polysensory inputs.
The non-speech dominant hemispheres of two subjectsad sustained lesions of multisensory cortical areas that havenown connections with the posterolateral STG (Barbas,988; Hackett et al., 1998b, 1999; Molinari et al., 1995; Pet-ides and Pandya, 1988; Romanski et al., 1999a,b; Seltzernd Pandya, 1978, 1994; Ward et al., 1946). One subjectR98) had undergone resection of the inferior and middleemporal gyri and anterior pole of the STG in an earlierpilepsy procedure. The second (R127) had sustained araumatic head injury that severely damaged his right fron-al lobe. In both cases, responses in PLST to any stimulusype containing an audible syllable provided robust ERPshat appeared similar to those evoked from any other rightemisphere subject. Furthermore, cortical significanceaps resulting from all tested contrasts differed in no
ubstantial way between lesioned and non-lesioned cases.pparently any significant effects that we observed in le-
ioned cases did not require the presence of either intact
ct
st2aiehBpisNm2taht2assmssiassfseC
P
AtpFapaTtata(bia
dtow
paCNfpBlattP
o1rlccpo(app
oekatecfbppnssappasapots
At0g
A
R. A. Reale et al. / Neuroscience 145 (2007) 162–184180
ortico-cortical afferent or efferent pathways connectinghese multisensory cortical fields.
In human studies that employed natural AV speechtimuli, significant AV effects can be strongly lateralized tohe left hemisphere (Callan et al., 2004; Calvert et al.,000; Calvert, 2001; MacSweeney et al., 2002; Pekkola etl., 2005). Speech perception is often held to be special-
zed in the dominant (typically left) hemisphere (Libermant al., 1967), as speech perception is closely linked toighly lateralized language processing (Geschwind, 1970;inder et al., 1997). Evidence has accumulated over theast several years, however, that the numerous processes
nvolved in temporal and spectral analyses of the speechignal are mediated bilaterally (Hickok and Poeppel, 2004;orris and Wise, 2000) although integration time constantsay differ between hemispheres (Poeppel and Hickok,004; Zatorre et al., 2004). We have not been able to test
his latter suggestion directly because of clinical consider-tions, but it is the case that PLST on either the right or leftemisphere is activated robustly by a wide range of acous-ic signals, including CV syllables (see also Binder et al.,000). Although bilateral activation of PLST holds forcoustic signals presented alone, it appears from our re-ults that the AV interaction occurring when an audibleyllable is paired with the visual image of the movingouth that uttered that sound is disproportionately repre-
ented on the speech-dominant hemisphere. Indeed, weaw very little evidence of AV interaction in the non-dom-nant hemisphere. Our conclusion on this is still tentatives our sample size is quite small, and we are unable totudy both the left and right hemispheres in the sameubject. Nonetheless, this finding is consistent with thoserom fMRI studies which identified STS cortex only in thepeech dominant left hemisphere as the site with the high-st specificity for bimodal integration (Callan et al., 2004;alvert et al., 2000; Calvert and Lewis, 2004).
LST–posterior lateral STG
rea PLST is physiologically differentiated from, but func-ionally connected to, auditory cortex on the supratemporallane (Brugge et al., 2003, 2005; Howard et al., 2000).rom the standpoint of major fissural landmarks, PLSTppears to correspond to, or overlap with, the posteriorortion of cytoarchitectonic areas 22 of Brodmann (1909),rea TA of von Economo (1929), areas PaAe, PaAi andpt of Galaburda and Sanides (1980), and chemoarchitec-
onic area STA of Rivier and Clarke (1997) and Wallace etl. (2002). Where (or whether) PLST stands in a postulatedhree-tier hierarchical model, which is based largely onnatomical and electrophysiological findings in monkeyKaas and Hackett, 1998; Rauschecker and Tian, 2000)ut for which there is also evidence from functional imag-
ng studies in human (Formisano et al., 2003; Wessinger etl., 2001) is another question.
The lateral surface of the STG is associated with au-itory language processing with the posterior extent tradi-
ionally referred to as Wernicke’s area. Structural lesionsr electrical disruption of this area in humans is associated
ith impairments in phonologic processing, auditory com-rehension, word/sentence repetition, and simpler forms ofcoustic–phonetic processing (Boatman et al., 1995;rone et al., 2001; Karbe et al., 1998; Lesser et al., 1986;aeser et al., 1990; Selnes et al., 1985). Thus, these
unctional observations provide evidence for both belt andarabelt proposed organizational features. In this context,oatman (2004) has suggested that the organization of
ateral STG is not compatible with the traditional singlenterior–posterior division scheme, but rather with a struc-ure composed of multiple, functional subdivisions thatogether support speech perception. We propose thatLST is one such subdivision.
We have tentatively considered PLST a homolog of allr part of the auditory parabelt of monkey (Hackett et al.,998a). Equally plausible is the possibility that PLST rep-esents a belt field perhaps homologous to the middleateral area in monkey (Rauschecker et al., 1995; Raus-hecker and Tian, 2004). However, more recent cyto- andhemo-architectonic findings in human report that the belt/arabelt does not extend onto the posterior lateral surfacef the STG, a region said to be occupied by area TptGalaburda and Sanides, 1980; Sweet et al., 2005). Sweetnd colleagues (2005) have argued forcefully that thearabelt in monkey corresponds to only a portion of thelanum temporale in humans.
Studies on non-human primates, however, shed lightn areas of multimodal representation in human only to thextent that the organization of auditory cortex in human isnown and the homologies between human and monkeyuditory cortical fields are understood. Our study may helpo reconcile these proposed homologies by providing directlectrophysiological recordings from non-core auditoryortical fields in humans that can be compared with datarom monkey. As Hackett (2003) points out, homologieseyond the auditory core remain tenuous, especially forarabelt regions, as this cortex may have undergone ex-ansion in humans and thus may include additional areasot accounted for at present. It has been posited thatpeech processing in the human may involve a ventralerial processing stream that arises bilaterally in the coreuditory fields and proceeds to engage multiple belt andarabelt fields located more laterally on the supratemporallane and STG (Hickok and Poeppel, 2004; Rauscheckernd Tian, 2000). Systematic electrical stimulation mappingtudies have clearly identified posterolateral STG as anrea containing circuitry that critically supports speecherception (reviewed by Boatman, 2004). Our observationf AV interactions being represented in PLST implicateshis field as playing a role in processing heard and seenpeech at an early stage of speech processing.
cknowledgments—This work was supported by National Insti-utes of Health Grants DC-04290, DC-00657, DC-00116, HD-3352, and M01-RR-59 (General Clinical Research Centers Pro-ram) and by the Hoover Fund and Carver Trust.
REFERENCES
rezzo JC, Vaughan HG Jr, Kraut MA, Steinschneider M, Legatt AD
(1986) Intracranial generators of event related potentials in the
B
B
B
B
B
B
B
B
B
B
B
B
B
B
B
C
C
C
C
C
C
C
C
C
C
C
C
C
C
C
D
D
D
D
D
F
F
F
F
F
F
G
G
G
R. A. Reale et al. / Neuroscience 145 (2007) 162–184 181
monkey. In: Evoked potential frontiers of clinical neuroscience, Vol.3 (Cracco RQ, Bodis-Wollner I, eds), pp 174–189. New York: AlanR. Liss.
arbas H (1988) Anatomic organization of basoventral and mediodor-sal visual recipient prefrontal regions in the rhesus monkey.J Comp Neurol 276:313–342.
arraclough NE, Xiao D, Baker CI, Oram MW, Perrett DI (2005)Integration of visual and auditory information by superior temporalsulcus neurons responsive to the sight of actions. J Cogn Neurosci17:377–391.
aylis GC, Rolls ET, Leonard CM (1987) Functional subdivisions ofthe temporal lobe neocortex. J Neurosci 7:330–342.
eauchamp MS, Lee KE, Argall BD, Martin A (2004) Integration ofauditory and visual information about objects in superior temporalsulcus. Neuron 41:809–823.
enedek G, Perény J, Kovács G, FischerSzátmári L, Katoh YY (1997)Visual, somatosensory, auditory and nociceptive modality propertiesin the feline suprageniculate nucleus. Neuroscience 78:179–189.
enevento LA, Fallon J, Davis BJ, Rezak M (1977) Auditory-visualinteraction in single cells in the cortex of the superior temporalsulcus and the orbital frontal cortex of the macaque monkey. ExpNeurol 57:849–872.
esle J, Fort A, Delpuech C, Giard MH (2004) Bimodal speech: earlysuppressive visual effects in human auditory cortex. Eur J Neurosci20:2225–2234.
inder JR, Frost JA, Hammeke TA, Cox RW, Rao SM, Prieto T (1997)Human brain language areas identified by functional magneticresonance imaging. J Neurosci 17:353–362.
inder JR, Frost JA, Hammeke TA, Bellgowan PS, Springer JA, Kauf-man JN, Possing ET (2000) Human temporal lobe activation byspeech and nonspeech sounds. Cereb Cortex 10:512–528.
oatman D, Lesser RP, Gordon B (1995) Auditory speech processingin the left temporal lobe: an electrical interference study. BrainLang 51:269–290.
oatman D (2004) Cortical bases of speech perception: evidence fromfunctional lesion studies. Cognition 92:47–65.
rodmann K (1909) Vergleichende Loakalisationslehre der Grosshirn-rinde. Leipzig, Germany: J. A. Barth.
ruce C, Desimone R, Gross CG (1981) Visual properties of neuronsin a polysensory area in superior temporal sulcus of the macaque.J Neurophysiol 46:369–384.
rugge JF, Volkov IO, Garell PC, Reale RA, Howard MA (2003)Functional connections between auditory cortex on Heschl’s gyrusand on the lateral superior temporal gyrus in humans. J Neuro-physiol 90:3750–3763.
rugge JF, Volkov IO, Reale RA, Garell PC, Kawasaki H, Oya H, Li Q,Howard MA (2005) The posterolateral superior temporal auditoryfield in humans: Functional organization and connectivity. In: Au-ditory cortex: a synthesis of human and animal research (Konig Ret al., eds), pp 145–162. Mahwah, NJ: Erlbaum.
allan DE, Callan AM, Kroos C, Vatikiotis-Bateson E (2001) Multimodalcontribution to speech perception revealed by independent compo-nent analysis: a single-sweep EEG case study. Brain Res Cogn BrainRes 10:349–353.
allan DE, Jones JA, Munhall K, Callan AM, Kroos C, Vatikiotis-BatesonE (2003) Neural processes underlying perceptual enhancement byvisual speech gestures. Neuroreport 14:2213–2218.
allan DE, Jones JA, Munhall K, Kroos C, Callan AM, Vatikiotis-Bateson E (2004) Multisensory integration sites identified by per-ception of spatial wavelet filtered visual speech gesture informa-tion. J Cogn Neurosci 16:805–816.
alvert GA, Bullmore ET, Brammer MJ, Campbell R, Williams SC, McGuirePK, Woodruff PW, Iversen SD, David AS (1997) Activation of auditorycortex during silent lipreading. Science 276:593–596.
alvert GA, Brammer MJ, Bullmore ET, Campbell R, Iversen SD, DavidAS (1999) Response amplification in sensory-specific cortices during
crossmodal binding. Neuroreport 10:2619–2623.alvert GA, Campbell R, Brammer MJ (2000) Evidence from func-tional magnetic resonance imaging of crossmodal binding in thehuman heteromodal cortex. Curr Biol 10:649–657.
alvert GA (2001) Crossmodal processing in the human brain: insightsfrom functional neuroimaging studies. Cereb Cortex 11:1110–1123.
alvert GA, Lewis JW (2004) Hemodynamic studies of audiovisual inter-actions. In: The handbook of multisensory processing (Calvert GA etal., eds), pp 483–502. Cambridge: MIT Press.
alvert GA, Thesen T, Hansen PC, Singh K, Campbell R, Holliday IE(2005) Changes in cortical oscillatory power during audio-visualspeech perception revealed by MEG. Annual Meeting of the Soci-ety for Cognitive Neuroscience 216 (Suppl S).
ampbell R, Dodd B (1980) Hearing by eye. Q J Exp Psychol32:85–99.
ampbell R, Landis T, Regard M (1986) Face recognition and lip-reading: a neurological dissociation. Brain 109:509–521.
ampbell R, MacSweeney M, Surguladze S, Calvert G, McGuire P,Suckling J, Brammer MJ, David AS (2001) Cortical substrates forthe perception of face actions: an fMRI study of the specificity ofactivation for seen speech and for meaningless lower-face acts(gurning). Brain Res Cogn Brain Res 12:233–243.
reutzfeldt OD, Houchin J (1984) Neuronal basis of EEG-waves. In:Handbook of electroencephalography and clinical neurophysiology,Vol. 2 (Remond A, ed), pp 2/C/3–2/C/55. Amsterdam: Elsevier.
reutzfeldt O, Ojemann G, Lettich E (1989) Neuronal activity in thehuman lateral temporal lobe. I. Responses to speech. Exp BrainRes 77:451–475.
rone NE, Boatman D, Gordon B, Hao L (2001) Induced electrocor-ticographic gamma activity during auditory perception. BrazierAward-winning article, 2001. Clin Neurophysiol 112:565–582.
esimone R, Gross CG (1979) Visual areas in the temporal cortex ofthe macaque. Brain Res 178:363–380.
esimone R, Ungerleider LG (1986) Multiple visual areas in the caudalsuperior temporal sulcus of the macaque. J Comp Neurol248:164–189.
illon WR, Goldstein M (1984) Multivariate analysis. Methods andapplications. New York: Wiley and Sons.
odd B (1977) The role of vision in the perception of speech. Percep-tion 6:31–40.
onchin E (1966) A multivariate approach to the analysis of averageevoked potentials. IEEE Trans Biomed Eng 13:131–139.
ormisano E, Kim DS, Di Salle F, van de Moortele PF, Ugurbil K,Goebel R (2003) Mirror-symmetric tonotopic maps in human pri-mary auditory cortex. Neuron 40:859–869.
owler CA (2004) Speech as a supramodal or amodal phenomenon.In: The handbook of multisensory processing (Calvert GA et al.,eds), pp 189–202. Cambridge: MIT Press.
oxe JJ, Morocz IA, Murray MM, Higgins BA, Javitt DC, Schroeder CE(2000) Multisensory auditory-somatosensory interactions in earlycortical processing revealed by high-density electrical mapping.Brain Res Cogn Brain Res 10:77–83.
oxe JJ, Wylie GR, Martinez A, Schroeder CE, Javitt DC, Guilfoyle D,Ritter W, Murray MM (2002) Auditory-somatosensory multisensoryprocessing in auditory association cortex: an fMRI study. J Neuro-physiol 88:540–543.
oxe JJ, Schroeder CE (2005) The case for feedforward multisensoryconvergence during early cortical processing. Neuroreport 16:419–423.
u KM, Johnston TA, Shah AS, Arnold L, Smiley J, Hackett TA, GarraghtyPE, Schroeder CE (2003) Auditory cortical neurons respond to so-matosensory stimulation. J Neurosci 23:7510–7515.
alaburda AM, Sanides F (1980) Cytoarchitectonic organization of thehuman auditory cortex. J Comp Neurol 190:597–610.
alaburda AM, Pandya DN (1983) The intrinsic architectonic andconnectional organization of the superior temporal region of therhesus monkey. J Comp Neurol 221:169–184.
eschwind N (1970) The organization of language and the brain.
Science 170:940–944.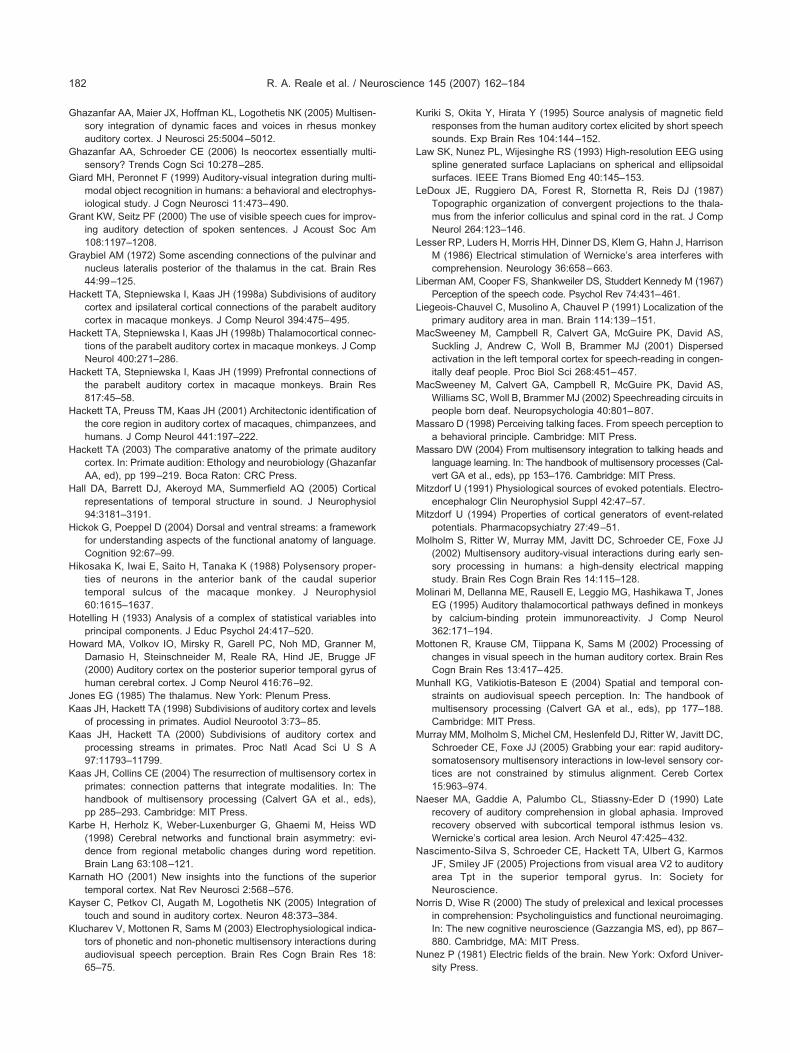
G
G
G
G
G
H
H
H
H
H
H
H
H
H
H
JK
K
K
K
K
K
K
K
L
L
L
L
L
M
M
M
M
M
M
M
M
M
M
M
N
N
N
N
R. A. Reale et al. / Neuroscience 145 (2007) 162–184182
hazanfar AA, Maier JX, Hoffman KL, Logothetis NK (2005) Multisen-sory integration of dynamic faces and voices in rhesus monkeyauditory cortex. J Neurosci 25:5004–5012.
hazanfar AA, Schroeder CE (2006) Is neocortex essentially multi-sensory? Trends Cogn Sci 10:278–285.
iard MH, Peronnet F (1999) Auditory-visual integration during multi-modal object recognition in humans: a behavioral and electrophys-iological study. J Cogn Neurosci 11:473–490.
rant KW, Seitz PF (2000) The use of visible speech cues for improv-ing auditory detection of spoken sentences. J Acoust Soc Am108:1197–1208.
raybiel AM (1972) Some ascending connections of the pulvinar andnucleus lateralis posterior of the thalamus in the cat. Brain Res44:99–125.
ackett TA, Stepniewska I, Kaas JH (1998a) Subdivisions of auditorycortex and ipsilateral cortical connections of the parabelt auditorycortex in macaque monkeys. J Comp Neurol 394:475–495.
ackett TA, Stepniewska I, Kaas JH (1998b) Thalamocortical connec-tions of the parabelt auditory cortex in macaque monkeys. J CompNeurol 400:271–286.
ackett TA, Stepniewska I, Kaas JH (1999) Prefrontal connections ofthe parabelt auditory cortex in macaque monkeys. Brain Res817:45–58.
ackett TA, Preuss TM, Kaas JH (2001) Architectonic identification ofthe core region in auditory cortex of macaques, chimpanzees, andhumans. J Comp Neurol 441:197–222.
ackett TA (2003) The comparative anatomy of the primate auditorycortex. In: Primate audition: Ethology and neurobiology (GhazanfarAA, ed), pp 199–219. Boca Raton: CRC Press.
all DA, Barrett DJ, Akeroyd MA, Summerfield AQ (2005) Corticalrepresentations of temporal structure in sound. J Neurophysiol94:3181–3191.
ickok G, Poeppel D (2004) Dorsal and ventral streams: a frameworkfor understanding aspects of the functional anatomy of language.Cognition 92:67–99.
ikosaka K, Iwai E, Saito H, Tanaka K (1988) Polysensory proper-ties of neurons in the anterior bank of the caudal superiortemporal sulcus of the macaque monkey. J Neurophysiol60:1615–1637.
otelling H (1933) Analysis of a complex of statistical variables intoprincipal components. J Educ Psychol 24:417–520.
oward MA, Volkov IO, Mirsky R, Garell PC, Noh MD, Granner M,Damasio H, Steinschneider M, Reale RA, Hind JE, Brugge JF(2000) Auditory cortex on the posterior superior temporal gyrus ofhuman cerebral cortex. J Comp Neurol 416:76–92.
ones EG (1985) The thalamus. New York: Plenum Press.aas JH, Hackett TA (1998) Subdivisions of auditory cortex and levels
of processing in primates. Audiol Neurootol 3:73–85.aas JH, Hackett TA (2000) Subdivisions of auditory cortex and
processing streams in primates. Proc Natl Acad Sci U S A97:11793–11799.
aas JH, Collins CE (2004) The resurrection of multisensory cortex inprimates: connection patterns that integrate modalities. In: Thehandbook of multisensory processing (Calvert GA et al., eds),pp 285–293. Cambridge: MIT Press.
arbe H, Herholz K, Weber-Luxenburger G, Ghaemi M, Heiss WD(1998) Cerebral networks and functional brain asymmetry: evi-dence from regional metabolic changes during word repetition.Brain Lang 63:108–121.
arnath HO (2001) New insights into the functions of the superiortemporal cortex. Nat Rev Neurosci 2:568–576.
ayser C, Petkov CI, Augath M, Logothetis NK (2005) Integration oftouch and sound in auditory cortex. Neuron 48:373–384.
lucharev V, Mottonen R, Sams M (2003) Electrophysiological indica-tors of phonetic and non-phonetic multisensory interactions duringaudiovisual speech perception. Brain Res Cogn Brain Res 18:
65–75.uriki S, Okita Y, Hirata Y (1995) Source analysis of magnetic fieldresponses from the human auditory cortex elicited by short speechsounds. Exp Brain Res 104:144–152.
aw SK, Nunez PL, Wijesinghe RS (1993) High-resolution EEG usingspline generated surface Laplacians on spherical and ellipsoidalsurfaces. IEEE Trans Biomed Eng 40:145–153.
eDoux JE, Ruggiero DA, Forest R, Stornetta R, Reis DJ (1987)Topographic organization of convergent projections to the thala-mus from the inferior colliculus and spinal cord in the rat. J CompNeurol 264:123–146.
esser RP, Luders H, Morris HH, Dinner DS, Klem G, Hahn J, HarrisonM (1986) Electrical stimulation of Wernicke’s area interferes withcomprehension. Neurology 36:658–663.
iberman AM, Cooper FS, Shankweiler DS, Studdert Kennedy M (1967)Perception of the speech code. Psychol Rev 74:431–461.
iegeois-Chauvel C, Musolino A, Chauvel P (1991) Localization of theprimary auditory area in man. Brain 114:139–151.
acSweeney M, Campbell R, Calvert GA, McGuire PK, David AS,Suckling J, Andrew C, Woll B, Brammer MJ (2001) Dispersedactivation in the left temporal cortex for speech-reading in congen-itally deaf people. Proc Biol Sci 268:451–457.
acSweeney M, Calvert GA, Campbell R, McGuire PK, David AS,Williams SC, Woll B, Brammer MJ (2002) Speechreading circuits inpeople born deaf. Neuropsychologia 40:801–807.
assaro D (1998) Perceiving talking faces. From speech perception toa behavioral principle. Cambridge: MIT Press.
assaro DW (2004) From multisensory integration to talking heads andlanguage learning. In: The handbook of multisensory processes (Cal-vert GA et al., eds), pp 153–176. Cambridge: MIT Press.
itzdorf U (1991) Physiological sources of evoked potentials. Electro-encephalogr Clin Neurophysiol Suppl 42:47–57.
itzdorf U (1994) Properties of cortical generators of event-relatedpotentials. Pharmacopsychiatry 27:49–51.
olholm S, Ritter W, Murray MM, Javitt DC, Schroeder CE, Foxe JJ(2002) Multisensory auditory-visual interactions during early sen-sory processing in humans: a high-density electrical mappingstudy. Brain Res Cogn Brain Res 14:115–128.
olinari M, Dellanna ME, Rausell E, Leggio MG, Hashikawa T, JonesEG (1995) Auditory thalamocortical pathways defined in monkeysby calcium-binding protein immunoreactivity. J Comp Neurol362:171–194.
ottonen R, Krause CM, Tiippana K, Sams M (2002) Processing ofchanges in visual speech in the human auditory cortex. Brain ResCogn Brain Res 13:417–425.
unhall KG, Vatikiotis-Bateson E (2004) Spatial and temporal con-straints on audiovisual speech perception. In: The handbook ofmultisensory processing (Calvert GA et al., eds), pp 177–188.Cambridge: MIT Press.
urray MM, Molholm S, Michel CM, Heslenfeld DJ, Ritter W, Javitt DC,Schroeder CE, Foxe JJ (2005) Grabbing your ear: rapid auditory-somatosensory multisensory interactions in low-level sensory cor-tices are not constrained by stimulus alignment. Cereb Cortex15:963–974.
aeser MA, Gaddie A, Palumbo CL, Stiassny-Eder D (1990) Laterecovery of auditory comprehension in global aphasia. Improvedrecovery observed with subcortical temporal isthmus lesion vs.Wernicke’s cortical area lesion. Arch Neurol 47:425–432.
ascimento-Silva S, Schroeder CE, Hackett TA, Ulbert G, KarmosJF, Smiley JF (2005) Projections from visual area V2 to auditoryarea Tpt in the superior temporal gyrus. In: Society forNeuroscience.
orris D, Wise R (2000) The study of prelexical and lexical processesin comprehension: Psycholinguistics and functional neuroimaging.In: The new cognitive neuroscience (Gazzangia MS, ed), pp 867–880. Cambridge, MA: MIT Press.
unez P (1981) Electric fields of the brain. New York: Oxford Univer-
sity Press.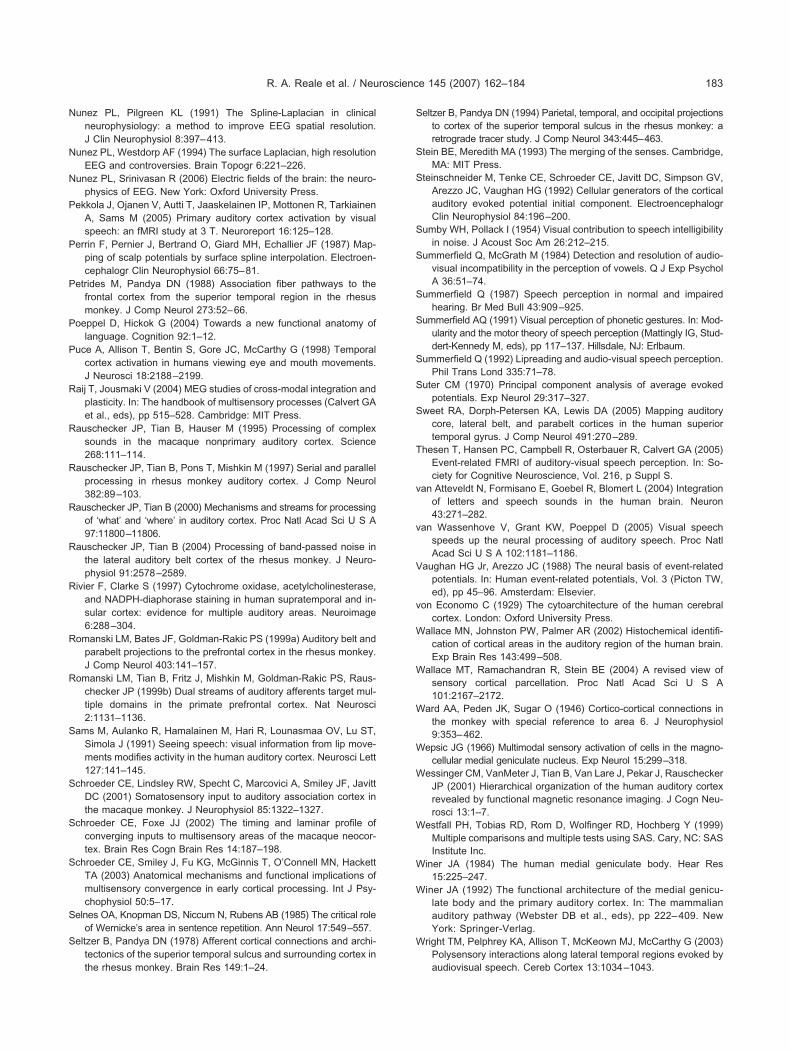
N
N
N
P
P
P
P
P
R
R
R
R
R
R
R
R
S
S
S
S
S
S
S
S
S
S
S
S
S
S
S
S
T
v
v
V
v
W
W
W
W
W
W
W
W
W
R. A. Reale et al. / Neuroscience 145 (2007) 162–184 183
unez PL, Pilgreen KL (1991) The Spline-Laplacian in clinicalneurophysiology: a method to improve EEG spatial resolution.J Clin Neurophysiol 8:397–413.
unez PL, Westdorp AF (1994) The surface Laplacian, high resolutionEEG and controversies. Brain Topogr 6:221–226.
unez PL, Srinivasan R (2006) Electric fields of the brain: the neuro-physics of EEG. New York: Oxford University Press.
ekkola J, Ojanen V, Autti T, Jaaskelainen IP, Mottonen R, TarkiainenA, Sams M (2005) Primary auditory cortex activation by visualspeech: an fMRI study at 3 T. Neuroreport 16:125–128.
errin F, Pernier J, Bertrand O, Giard MH, Echallier JF (1987) Map-ping of scalp potentials by surface spline interpolation. Electroen-cephalogr Clin Neurophysiol 66:75–81.
etrides M, Pandya DN (1988) Association fiber pathways to thefrontal cortex from the superior temporal region in the rhesusmonkey. J Comp Neurol 273:52–66.
oeppel D, Hickok G (2004) Towards a new functional anatomy oflanguage. Cognition 92:1–12.
uce A, Allison T, Bentin S, Gore JC, McCarthy G (1998) Temporalcortex activation in humans viewing eye and mouth movements.J Neurosci 18:2188–2199.
aij T, Jousmaki V (2004) MEG studies of cross-modal integration andplasticity. In: The handbook of multisensory processes (Calvert GAet al., eds), pp 515–528. Cambridge: MIT Press.
auschecker JP, Tian B, Hauser M (1995) Processing of complexsounds in the macaque nonprimary auditory cortex. Science268:111–114.
auschecker JP, Tian B, Pons T, Mishkin M (1997) Serial and parallelprocessing in rhesus monkey auditory cortex. J Comp Neurol382:89–103.
auschecker JP, Tian B (2000) Mechanisms and streams for processingof ‘what’ and ‘where’ in auditory cortex. Proc Natl Acad Sci U S A97:11800–11806.
auschecker JP, Tian B (2004) Processing of band-passed noise inthe lateral auditory belt cortex of the rhesus monkey. J Neuro-physiol 91:2578–2589.
ivier F, Clarke S (1997) Cytochrome oxidase, acetylcholinesterase,and NADPH-diaphorase staining in human supratemporal and in-sular cortex: evidence for multiple auditory areas. Neuroimage6:288–304.
omanski LM, Bates JF, Goldman-Rakic PS (1999a) Auditory belt andparabelt projections to the prefrontal cortex in the rhesus monkey.J Comp Neurol 403:141–157.
omanski LM, Tian B, Fritz J, Mishkin M, Goldman-Rakic PS, Raus-checker JP (1999b) Dual streams of auditory afferents target mul-tiple domains in the primate prefrontal cortex. Nat Neurosci2:1131–1136.
ams M, Aulanko R, Hamalainen M, Hari R, Lounasmaa OV, Lu ST,Simola J (1991) Seeing speech: visual information from lip move-ments modifies activity in the human auditory cortex. Neurosci Lett127:141–145.
chroeder CE, Lindsley RW, Specht C, Marcovici A, Smiley JF, JavittDC (2001) Somatosensory input to auditory association cortex inthe macaque monkey. J Neurophysiol 85:1322–1327.
chroeder CE, Foxe JJ (2002) The timing and laminar profile ofconverging inputs to multisensory areas of the macaque neocor-tex. Brain Res Cogn Brain Res 14:187–198.
chroeder CE, Smiley J, Fu KG, McGinnis T, O’Connell MN, HackettTA (2003) Anatomical mechanisms and functional implications ofmultisensory convergence in early cortical processing. Int J Psy-chophysiol 50:5–17.
elnes OA, Knopman DS, Niccum N, Rubens AB (1985) The critical roleof Wernicke’s area in sentence repetition. Ann Neurol 17:549–557.
eltzer B, Pandya DN (1978) Afferent cortical connections and archi-tectonics of the superior temporal sulcus and surrounding cortex in
the rhesus monkey. Brain Res 149:1–24.eltzer B, Pandya DN (1994) Parietal, temporal, and occipital projectionsto cortex of the superior temporal sulcus in the rhesus monkey: aretrograde tracer study. J Comp Neurol 343:445–463.
tein BE, Meredith MA (1993) The merging of the senses. Cambridge,MA: MIT Press.
teinschneider M, Tenke CE, Schroeder CE, Javitt DC, Simpson GV,Arezzo JC, Vaughan HG (1992) Cellular generators of the corticalauditory evoked potential initial component. ElectroencephalogrClin Neurophysiol 84:196–200.
umby WH, Pollack I (1954) Visual contribution to speech intelligibilityin noise. J Acoust Soc Am 26:212–215.
ummerfield Q, McGrath M (1984) Detection and resolution of audio-visual incompatibility in the perception of vowels. Q J Exp PsycholA 36:51–74.
ummerfield Q (1987) Speech perception in normal and impairedhearing. Br Med Bull 43:909–925.
ummerfield AQ (1991) Visual perception of phonetic gestures. In: Mod-ularity and the motor theory of speech perception (Mattingly IG, Stud-dert-Kennedy M, eds), pp 117–137. Hillsdale, NJ: Erlbaum.
ummerfield Q (1992) Lipreading and audio-visual speech perception.Phil Trans Lond 335:71–78.
uter CM (1970) Principal component analysis of average evokedpotentials. Exp Neurol 29:317–327.
weet RA, Dorph-Petersen KA, Lewis DA (2005) Mapping auditorycore, lateral belt, and parabelt cortices in the human superiortemporal gyrus. J Comp Neurol 491:270–289.
hesen T, Hansen PC, Campbell R, Osterbauer R, Calvert GA (2005)Event-related FMRI of auditory-visual speech perception. In: So-ciety for Cognitive Neuroscience, Vol. 216, p Suppl S.
an Atteveldt N, Formisano E, Goebel R, Blomert L (2004) Integrationof letters and speech sounds in the human brain. Neuron43:271–282.
an Wassenhove V, Grant KW, Poeppel D (2005) Visual speechspeeds up the neural processing of auditory speech. Proc NatlAcad Sci U S A 102:1181–1186.
aughan HG Jr, Arezzo JC (1988) The neural basis of event-relatedpotentials. In: Human event-related potentials, Vol. 3 (Picton TW,ed), pp 45–96. Amsterdam: Elsevier.
on Economo C (1929) The cytoarchitecture of the human cerebralcortex. London: Oxford University Press.
allace MN, Johnston PW, Palmer AR (2002) Histochemical identifi-cation of cortical areas in the auditory region of the human brain.Exp Brain Res 143:499–508.
allace MT, Ramachandran R, Stein BE (2004) A revised view ofsensory cortical parcellation. Proc Natl Acad Sci U S A101:2167–2172.
ard AA, Peden JK, Sugar O (1946) Cortico-cortical connections inthe monkey with special reference to area 6. J Neurophysiol9:353–462.
epsic JG (1966) Multimodal sensory activation of cells in the magno-cellular medial geniculate nucleus. Exp Neurol 15:299–318.
essinger CM, VanMeter J, Tian B, Van Lare J, Pekar J, RauscheckerJP (2001) Hierarchical organization of the human auditory cortexrevealed by functional magnetic resonance imaging. J Cogn Neu-rosci 13:1–7.
estfall PH, Tobias RD, Rom D, Wolfinger RD, Hochberg Y (1999)Multiple comparisons and multiple tests using SAS. Cary, NC: SASInstitute Inc.
iner JA (1984) The human medial geniculate body. Hear Res15:225–247.
iner JA (1992) The functional architecture of the medial genicu-late body and the primary auditory cortex. In: The mammalianauditory pathway (Webster DB et al., eds), pp 222– 409. NewYork: Springer-Verlag.
right TM, Pelphrey KA, Allison T, McKeown MJ, McCarthy G (2003)Polysensory interactions along lateral temporal regions evoked by
audiovisual speech. Cereb Cortex 13:1034–1043.
Z
ZS
S
R. A. Reale et al. / Neuroscience 145 (2007) 162–184184
atorre RJ, Bouffard M, Belin P (2004) Sensitivity to auditory objectfeatures in human temporal neocortex [erratum appears in J Neu-rosci 2004;24(21):5078]. J Neurosci 24:3637–3642.
hou B, Green DM, Middlebrooks JC (1992) Characterization of ex-ternal ear impulse responses using Golay codes. J Acoust Soc Am
92:1169–1171. tAPPENDIX
upplementary data
upplementary data associated with this article can be found, in
he online version, at doi: 10.1016/j.neuroscience.2006.11.036.(Accepted 8 November 2006)(Available online 22 January 2007)