aughinish alumina ltd. - environmental protection · pdf filesurveillance audits by our...
TRANSCRIPT

Aughinish Alumina Ltd. Askeaton, Co. Limerick
IPPC Licence Reg. P0035-05
Annual Environmental Report
2012

Aughinish Alumina Ltd. March 2013 AER 2012
2 | P a g e
This page is intentionally blank

Aughinish Alumina Ltd. March 2013 AER 2012
3 | P a g e
Aughinish Alumina Ltd. Integrated Pollution Prevention & Control Licence
Register No. P0035-05
Annual Environmental Report 2012
March 2013 Contents 1. Introduction ......................................................................................................... 7 1.1 Description of the Activity ......................................................................................... 7 1.2 Management Structures ........................................................................................... 7 1.3 Organisational Structure ........................................................................................... 8 1.4 Environmental Policy .............................................................................................. 10 2. Emissions ......................................................................................................... 11 2.1 Emissions to Air ...................................................................................................... 12 2.1.1 Boiler Emissions ................................................................................................... 12 2.1.2 Calciner Emissions ............................................................................................... 13 2.1.3 CHP Emissions ..................................................................................................... 14 2.1.4 Other Emission Points (Dust Collection Units) ...................................................... 15 2.1.5 Compliance Summary .......................................................................................... 16 2.2 Emissions to Water ................................................................................................ 20 2.2.1 Process Effluent (W1-1) ....................................................................................... 20 2.2.2 Toxicity Testing .................................................................................................... 21 2.2.3 Heavy Metal, Aluminium and Soda Analysis ......................................................... 22 2.2.4 Effluent VOC Screen ............................................................................................ 23 2.2.5 Sanitary Effluent ................................................................................................... 24 2.2.6 Surface Water Monitoring ..................................................................................... 25 2.2.7 Surface Water Monitoring at the BRDA ................................................................ 25 2.2.8 Discharges to Water Compliance Summary ......................................................... 25 3. Waste Management .......................................................................................... 26 3.1 Waste Quantities 2012 ............................................................................................ 26 4. Monitoring and Enforcement ........................................................................... 33 4.1 Monitoring .............................................................................................................. 33 4.2 Third Party Inspections ........................................................................................... 34 5. Resource Consumption ................................................................................... 35 5.1 Energy Consumption .............................................................................................. 35 5.1.1 Energy Efficiency Report 2012 ............................................................................. 36 5.2 Water Consumption ................................................................................................ 36 6. Environmental Incidents and Complaints ........................................................ 37 6.1 Category 1 Incidents............................................................................................... 37 6.2 Category 2 – 5 Incidents ......................................................................................... 37 6.3 Complaints ............................................................................................................. 37 7. Environmental Management ............................................................................. 38 7.1 Environmental Management Programme (EMP) Report 2012 ................................ 38 7.2 Environmental Objectives and Targets 2013 .......................................................... 40 7.3 Pollutant Release and Transfer Register (PRTR) ................................................... 42 7.3.1 Caustic Mass Balance .......................................................................................... 44 8. Other Reports ................................................................................................. 456 8.1 Noise Monitoring Programme ................................................................................. 45 8.2 Groundwater Monitoring ......................................................................................... 47 8.2.1 Estuarine Springs ................................................................................................. 47

Aughinish Alumina Ltd. March 2013 AER 2012
4 | P a g e
8.2.2 Plant Observation Wells (POW)........................................................................... 48 8.2.3 BRDA Observation Wells (OW) ........................................................................... 52 8.3 Leak Detection Monitoring System ......................................................................... 55 8.4 Fugitive Emissions in the AAL Plant Area .............................................................. 55 8.5 Ambient Air Quality Monitoring ............................................................................... 56 8.5.1 Ambient Air Sulphur Dioxide…………………………………………………………….57 8.5.2 Ambient Air Particualte Deposition ……………………………………………………58 8.5.3 Ambient Air PM10 Monitoring…………………………………………………………..58 8.5.4 Ambient Air PM2.5 Monitoring………………………………………………………….59 8.6 Bund, Tank and Pipeline Integrity Testing .............................................................. 60 8.6.1 Bunds & Tanks……………………………………………………………………………60 8.6.2 Underground Pipelines…………………………………………………………………..60 8.7 Decommissioning and Residuals Management Plan (DRMP/CRAMP) Review ..... 61 8.7.1 Update of CRAMP ............................................................................................... 61 8.7.2 Update of CRAMP Costs ..................................................................................... 61 8.7.3 Financial Provision ............................................................................................... 61 8.8 Environmental Liabilities Risk Assessment (ELRA) Review ................................... 61 8.8.1 Update of ELRA ................................................................................................... 62 8.8.2 Update of ELRA Costs ......................................................................................... 62 8.8.3 Financial Provision ............................................................................................... 62 8.8.4 Statement of Measures for Prevention of Environmental Damage ........................ 62 8.8.5 Consultation with the Local Authority/PRA’s on Emergency Planning for BRDA ... 62 8.9 Annual BRDA Status Report .................................................................................. 61 8.9.1 BRDA Waste Composition and Tonnage Data ..................................................... 64 8.9.2 BRDA Containment Capacity ............................................................................... 65 8.9.3 Results of BRDA Monitoring Programme .............................................................. 66 8.9.4 Revisions to BRDA Operational Plan .................................................................... 66 8.9.5 Summary of BRDA Development/Remedial Works 2012 ...................................... 66 8.9.6 Progress on Closure Planning & Revegetation of BRDA ...................................... 66 8.9.7 BRDA Events 2012............................................................................................... 67 8.9.8 Report on Annual BRDA Review .......................................................................... 67 8.9.9 Progress with Implementation of Golders Breakout Study .................................... 69 8.9.10 BRDA Biennial Audit ........................................................................................... 69 8.9.11 Report on Implementation of Extractive Waste Management Plan ...................... 70 8.10 Progress on Bauxite Residue Neutralisation ........................................................ 70 8.10.1 Testing Methodology to confirm Bauxite Residue Neutralisation ......................... 71 8.11 Raw Materials Efficiency and Waste Reduction ................................................... 72 8.12 Public Information Programme………………………………………………………….72
List of Tables
Table 1 Management Systems at AAL Table 2 Mass Emissions to Air - Boilers 2012 Table 3 Mass Emissions to Air - Calciners 2012 Table 4 Mass Emissions to Air – CHP 2012 Table 5 Summary of Particulate Emissions from Dust Collection Units Table 6 Evaluation of Compliance with 48-hour Average ELV’s - Boilers 2012 Table 7 Evaluation of Compliance with Monthly Average ELV’s - Boilers 2012 Table 8 Evaluation of Compliance – Calciners 2012 Table 9 Evaluation of Compliance – CHP 2012 Table 10 Licensed Discharges to Water Table 11 Process Effluent (W1-1) Mass Emissions 2012 Table 12 Process Effluent – Toxicity Testing Results Table 13 Process Effluent – Heavy Metal Results Table 14 Process Effluent – Aluminium and Soda Results
Aughinish Alumina Ltd. March 2013 AER 2012
5 | P a g e
Table 15 Process Effluent – VOC Screen Table 16 Sanitary Effluent Mass Emissions 2012 Table 17 Surface Water Discharge Monitoring Results 2012 Table 18 Surface Water Monitoring Results in the BRDA 2012 Table 19 Summary Information on Waste Quantities Table 20 Information on Individual Waste Streams Table 21 Number of EPA Site Visits 2012 Table 22 EPA Industrial Effluent Results Table 23 EPA Sanitary Effluent Results Table 24 EPA Emissions to Air Results Table 25 Summary Energy Data 2008 to 2012 Table 26 Summary Water Consumption Data 2008 to 2012 Table 27 Environmental Management Programme (EMP) 2012 Report Table 28 EMP Objectives and Targets 2013 Table 29 PRTR Summary for 2012 Table 30 Results of Caustic Mass Balance Table 31 Noise Survey Results – Noise Sensitive Locations Table 32 Noise Survey Results – Boundary Locations Table 33 Estuarine Spring Monitoring Results 2012 Table 34 POW Monitoring Results 2012 Table 35 BRDA OW Monitoring Results 2012 Table 36 Borehole Groundwater Monitoring Results 2012 Table 37 Dust Deposition Rates 2012
Table 38 Ambient Air Sulphur Dioxide Continuous Monitoring Results (g/m3)
Table 39 Ambient Air Sulphur Dioxide Diffusion Tubes Results (g/m3) Table 40 Ambient Air Mean Particulate Deposition Rates (mg/m2/day) Table 41 Ambient Air PM10 Monitoring Results 2012 Table 42 Ambient Air Sodium Monitoring Results 2012 Table 43 Ambient Air PM2.5 Monitoring Results 2012 (µg/m3) Table 44 BRDA Operational Status Table 45 BRDA Waste Composition & Tonnage (2012) Table 46 Accumulated Quantities of Waste to BRDA 1983 to 2012 Table 47 Estimated Capacity of BRDA Table 48 Raw Material Efficiency and Waste Reduction
List of Figures
Figure 1 Boiler Mass Emissions 2012 Figure 2 Calciner Mass Emissions 2012 Figure 3 CHP Mass Emissions 2012 Figure 4 Process Effluent Mass Emissions 2012 Figure 5 Sanitary Effluent Mass Emissions 2012 Figure 6 Energy Use 2010 - 2012 Figure 7 Plant Water Consumption
Attachments
Attachment 1 Process Effluent Toxicity Test Reports Attachment 2 Waste Analysis Attachment 3 Energy Efficiency Report 2012 Attachment 4 AER/PRTR Emissions Data Information Attachment 5 Noise Survey Report 2012 Attachment 6 BRDA Operational Plan Attachment 7 BRDA Closure Planning & Re-vegetation

Aughinish Alumina Ltd. March 2013 AER 2012
6 | P a g e
This page is intentionally blank

Aughinish Alumina Ltd. March 2013 AER 2012
7 | P a g e
1. Introduction
This document comprises the fourteenth Aughinish Alumina Limited (AAL) Annual Environmental Report (AER). The report covers the period from the 1st January 2012 to the 31st December 2012 and has been prepared in accordance with the Environmental Protection Agency (EPA) ‘Guidance Note on the Annual Environmental Report’ and other relevant guidance as provided by the EPA on their website (www.epa.ie).
1.1 Description of the Activity AAL was granted a revised Integrated Pollution Prevention and Control Licence (IPPCL) in October 2012. The Licence grants AAL permission to carry out the following activities in accordance with the requirements and conditions as set out in the Licence:
The production of basic inorganic chemicals The operation of combustion installations with a rated thermal input
exceeding 50MW The recovery or disposal of waste in a facility
This IPPC Licence (Reg. No. P0035-05) supersedes the installation’s previous licence (Reg. No. P0035-04), which was issued in 2008.
The AAL plant extracts alumina from bauxite using the Bayer Process, a chemical method that has been developed and refined over the past century and is used by over 40 alumina extraction plants worldwide.
Approximately 70% of the bauxite processed by AAL comes for Guinea in West Africa with the remainder coming from Brazil. The finished product, alumina, is exported for further processing through smelting to aluminium metal.
The production output of the plant in 2012 was 1,924,385 tonnes of alumina hydrate representing an increase of approximately 0.1% over 2011 production levels.
1.2 Management Structures
Since March 2008, AAL has been wholly owned by United Company RUSAL, which is the largest integrated aluminium company worldwide.
AAL has a structured management approach to the operation of the business in terms of product quality, process control, environment, safety, training and analytical capability. Training of personnel is a key function in the successful operation of the plant. The IPPCL requires the company to establish and maintain an Environmental Management System (EMS) and the conditions of the licence outline the form that the EMS should take at AAL. In order to demonstrate its commitment to environmental protection, AAL has gained certification of its EMS to the international standard ISO 14001:2004.

Aughinish Alumina Ltd. March 2013 AER 2012
8 | P a g e
Safety, environmental and quality management systems are audited on an on-going basis by a combination of internal audit teams and external certification surveillance audits by our certification body Det Norske Veritas (DNV UK). Table 1 Management Systems at AAL
Year System Accreditation
Body
1993 International Safety Rating System (ISRS)
DNV
1995 ISO 9002 Quality Management System
DNV
2000 ISO 14001:2004 Environmental Management System
DNV
1.3 Organisational Structure
AAL operates a relatively flat management structure with a strong emphasis on team working. The company structure for 2012 is set out in the organogram overleaf and outlines the responsibility for day-to-day management of environmental issues at the plant.
The Environmental Co-ordinator has overall responsibility for environmental management and reports directly to the Management Team. The Environmental Co-ordinator is supported in the day-to-day activities by the Environmental Engineer(s), who have responsibility for the maintenance of the Environmental Management System, undertaking specific projects of an environmental nature and evaluating compliance with the IPPCL. The Environmental Technologists are responsible for environmental monitoring activities including sampling and analysis of all emissions and discharges from the site. The Contractor Alliance comprises three main contractor companies providing various engineering, operational and maintenance services all of whom are based on-site. As part of contractor induction training, an Environmental Manual is issued to each contractor. This contains information on site environmental requirements and instructions for environmental management and control to ensure compliance with the IPPCL. Contractors are regularly updated through regular training and safety briefings.

Aughinish Alumina Ltd. March 2013 AER 2012
9 | P a g e

Aughinish Alumina Ltd. March 2013 AER 2012
1 0 | P a g e
1.4 Environmental Policy

Aughinish Alumina Ltd. March 2013 AER 2012
1 1 | P a g e
1. Emissions
AAL implements a comprehensive environmental monitoring programme to assess the significance of emissions from site activities. The programme includes emissions to air, effluent discharges, surface water and waste monitoring. An overview of the results of the monitoring conducted during 2012 is presented in this section.
This section also includes an evaluation of compliance with the conditions and schedules of the IPPCL, together with a summary of environmental incidents reported to the Agency during 2012. Any external complaints received by AAL during 2012 are detailed, together with a description of the investigations and corrective actions initiated as a result of those complaints.
Summary information on all emissions, discharges and waste arising from operations at AAL has been submitted to the Agency via the AER/PRTR Annual Environmental Reporting website. Monitoring data, summarised in the following sections, shows continued compliance with IPPC Licence conditions and emission limit values.

Aughinish Alumina Ltd. March 2013 AER 2012
1 2 | P a g e
2.1 Emissions to Air
There are 17 IPPC licensed air emission points at AAL. The primary sources of emissions to air are the Boilers (Emission Point Ref. A1), Calciners (Emission Point Ref. A2) and Combined Heat and Power Plant (CHP) (Emission Point Refs. A3-A and A3-B). IPPC Licence P0035-05 licensed a new emission point for a natural gas fired boiler to be installed in the future.
The remaining emission sources comprise bag house and cyclone exhausts for control of particulate emissions from materials handling operations and three diesel fired boilers for heating buildings.
2.1.1 Boiler Emissions
Boiler emissions are one of the major air emission sources on the site. Depending on the parameter, monitoring varies from continuous online monitoring, to quarterly analyses as specified in Schedule C1.1 (Control of Emissions to Air) of IPPC Licence P0035-05. A summary of the actual mass emissions for the licensed parameters during the reporting period is tabulated in Table 2 below.
Actual mass emissions of oxides of sulphur (as SO2), as tabulated below, are generated by calculation, based on the sulphur content of the fuel and the quantity of fuel oil consumed in 2012. Nitrogen oxides mass emissions (as NO2) are derived from measured NO2 values, and estimated exhaust gas flow rates. Dust mass emissions from the boilers are calculated from the measured particulate emissions and estimated exhaust gas flow rates. The gas flow rate estimation is based on the quantity of fuel used, as there is a stochiometric relationship between air flow and fuel consumption.
Licensed mass emissions are based on emissions concentration and flow rate at ELV, taking a 366 day operational period.
Table 2 Mass Emissions to Air - Boilers 2012
Emission Point Ref. A1 Boilers
Mass Emission (kg) 2011
Mass Emission (kg) 2012
Licensed Mass Emissions
via NERP* (kg)
Oxides of Sulphur (as
SO2) 1,799,077 1,620,128 4,140,000
Nitrogen Oxide (as NO2)
629,021 610,033 1,095,000
Dust 49,746 37,525 123,000
*NERP is the National Emissions Reduction Programme Emissions of sulphur dioxide, nitrogen oxides and dust from the main site boilers were significantly below licensed mass emission rates permitted for these parameters. The actual mass emission of SO2 from the boilers decreased by 11% in 2012 compared to the 2011 figure. Emissions of nitrogen oxides (as NO2) decreased by 3% during the same period. These reductions are due to the reduction in the quantity of fuel combusted in the boilers in 2012 versus 2011.

Aughinish Alumina Ltd. March 2013 AER 2012
1 3 | P a g e
Figure 1 Boiler Mass Emissions 2012
2.1.2 Calciner Emissions
Emissions from the calciners are summarised in Table 3 below as actual annual mass emissions (in Kgs) for the licensed parameters during the 2012 reporting period. Mass emissions of oxides of sulphur are generated by calculation, based on the sulphur content of the fuel and the quantity of fuel oil consumed. Particulate mass emissions are based on the measured particulates, as monitored as part of the IPPC Licence requirements, and estimated exhaust gas flow rates.
Table 3 Mass Emissions to Air - Calciners 2012
Emission Point Ref. A2 – Calciner
Mass Emission (Kgs) 2011
Mass Emission (Kgs) 2012
Licensed Mass Emissions (Kgs)
Oxides of Sulphur (as SO2)
253,606 0 6,282,317
Particulates 86,784 97,544 235,704
There were no emissions of oxides of sulphur from the calciners during 2012. This was due to conversion of all the calciners to a dual fuel combustion system during

Aughinish Alumina Ltd. March 2013 AER 2012
1 4 | P a g e
2011 which allows the calciner units to use either natural gas or HFO as their primary fuel. In 2012, no HFO was combusted in the calciners.
Figure 2 Calciner Mass Emissions 2012
2.1.3 CHP Emissions
Schedule C1.1 of the IPPCL requires the monitoring of oxides of nitrogen (NO2) in CHP stack emissions. The licence requirements for the CHP heat recovery steam generator stack are as outlined below: No 24-hour value shall exceed the emission limit value of 75 mg/Nm3 No hourly value shall exceed twice the ELV (150 mg/Nm3)
The NO2 monitoring data for 2012 is shown in Table 4 below. Table 4 Mass Emissions to Air - CHP 2012
Emission Point Ref. A3A & A3B – CHP
Mass Emission (Kgs) 2011
Mass Emission (Kgs) 2012
Licensed Mass Emissions
(Kgs)
Nitrogen Oxides (as NO2)
229,309 297,448 948,672

Aughinish Alumina Ltd. March 2013 AER 2012
1 5 | P a g e
Figure 3 CHP Mass Emissions 2012
2.1.4 Other Emission Points (Dust Collection Units)
There are 9 licensed process air emission points. These emissions are from dust collection units (DCUs) associated with bauxite and alumina handling and conveying operations at the plant. Actual mass emissions of particulates from each of the licensed emission points are tabulated below and are based on average quarterly monitoring results and total hours of operation during 2012. Licensed mass emissions are based on discharges at the ELV over a 24 hour, 366 day operational period. The combined actual annual mass emission of particulates from the licensed emission points was 8,581 kg during 2012 which is significantly lower than the permitted annual mass emission for the combined sources of 175,045 kg. In addition, each individual sample collected during the quarterly monitoring events was significantly below the relevant emission limit value for that source.

Aughinish Alumina Ltd. March 2013 AER 2012
1 6 | P a g e
Table 5 Summary of Particulate Emissions from Dust Collection Units
Emission Point Ref./Description
Mass Emission (Kg) 2011
Mass Emission (Kg) 2012
Licensed Emission
(Kg)
5 Transfer Tower 4 & 5
Exhaust Fan 0 0 51,899
6 Bauxite Crusher
Scrubber Exhaust Fan
5,132 1,495 49,168
8 Transfer Tower 3 Scrubber Exhaust
Fan 0 0 21,594
11 Alumina Loader Dust Fan FA49AL03 Outer
128 95 20,716
12 Alumina Loader Dust
Fan FA49A Inner 932 1,286 9,708
16 Alumina Silo 1 Exhaust Fan FA12A017
1,256 1,890 6,588
17 Alumina Silo 2 Exhaust Fan FA12A018
979 1,652 6,588
18 Alumina Silo 3 Exhaust Fan FA12A019
997 1,600 4,392
19 Alumina Silo 1/2
Exhaust Fan FA12A020
649 563 4,392
Total 10,074 8,581 175,045
There are three unmonitored licensed combustion emission points at the plant. Licensed emission points 13, 14 and 15 are associated with small scale building heating boilers in Area 73, Area 76 and Area 79 respectively. These units are fired on gas oil with less than 0.2% sulphur. There are no emission limits set for these small boilers and there is no requirement to monitor emissions.
2.1.5 Compliance Summary
Compliance with the relevant emission limit values (ELV’s) for emissions to atmosphere is evaluated as follows for boiler, calciner and CHP emissions.
Boiler Emissions
The overall annual level of compliance with emission limit values for continuous monitoring of HFO boiler emissions to atmosphere is tabulated overleaf for the 48-hour and the monthly average compliance requirements as specified in Condition 4.1.4 of the IPPCL. The parameters evaluated are sulphur dioxide and nitrogen oxides. No monthly mean shall exceed the ELV (750 mg/Nm3 for NOx and 1700
mg/Nm3 for SO2) 95% of 48-hour mean values shall not exceed 825 mg/Nm3
for NOx 97% of 48-hour mean values shall not exceed 1,825 mg/Nm3
for SOx

Aughinish Alumina Ltd. March 2013 AER 2012
1 7 | P a g e
The evaluation indicates that HFO boiler emissions were fully compliant with both the 48-hour (Table 6) and monthly average (Table 7) emission limits as specified in Condition 4.1.4 of the IPPC Licence.
Table 6 Evaluation of Compliance with 48-hour Average ELV’s – HFO Boilers 2012
Parameter Oxides of Sulphur (as
SO2) Nitrogen Oxides (as NO2)
No. Measurement Intervals
183 183
Boiler Ref. A B C A B C
No. of Periods above ELV
0 0 0 0 0 0
% of 48-hour periods below ELV
100% 100% 100% 100% 100% 100%
Target % below ELV for
compliance 97% 97% 97% 95% 95% 95%
Compliant Yes Yes Yes Yes Yes Yes
Table 7 Evaluation of Compliance with Monthly Average ELV’s – HFO Boilers 2012
Parameter Oxides of Sulphur (as
SO2) Nitrogen Oxides (as NO2)
# Measurement Intervals
12 12
Boiler Ref. A B C A B C
No. of Periods above ELV
0 0 0 0 0 0
% of monthly periods below ELV
100% 100% 100% 100% 100% 100%
Target % monthly periods below ELV
for compliance 100% 100% 100% 100% 100% 100%
Compliant Yes Yes Yes Yes Yes Yes

Aughinish Alumina Ltd. March 2013 AER 2012
1 8 | P a g e
Calciner Emissions
The requirements for Calciner particulate emissions as outlined in Condition 4.1.3 of the IPPC licence are as follows:
No daily average value shall exceed the ELV (50 mg/Nm3) No hourly average shall exceed twice the ELV (100 mg/Nm3)
An evaluation of the continuous monitoring data for 2012 is summarised in Table 8.
Table 8 Evaluation of Compliance – Calciners 2012
Parameter IPPC ELV (mg/m3)
Actual 2012 (mg/m3)
Comment
Daily Average Particulates
50 100%<50
(Average = 21) Compliant
Hourly Maximum
Particulates 100
100% < 100 (Average of hourly
maximum = 28) Compliant
In addition, for non-continuous monitoring of calciner emissions conducted quarterly using an isokinetic stack sampler in accordance with IPPC Licence requirements, individual results were fully compliant with the relevant ELV’s for calciner emissions. CHP Emissions A summary of all data for CHP emissions is included in Table 9. In all cases, the emissions were compliant with the relevant ELVs.
Table 9 Evaluation of Compliance - CHP 2012
Parameter IPPC ELV (mg/m3)
Actual 2012 (mg/m3)
Comment
A3-A (GT1) Daily average
NOX 100%< 75
100% <75 (Average = 18)
Compliant
A3-A (GT1) Hourly maximum
NOX 100%< 150
100% <150 (Average = 26)
Compliant
A3-B (GT2) Daily average
NOX 100%< 75
100% <75 (Average = 37)
Compliant
A3-B (GT2) Hourly maximum
NOX 100%< 150
100% <150 (Average = 44)
Compliant

Aughinish Alumina Ltd. March 2013 AER 2012
1 9 | P a g e
Dust Collection Units
Other particulate emissions are required to be sampled on a quarterly basis.
All monitoring results for each of the emission points were fully compliant with the specified emission limit values set out in the IPPC licence.

Aughinish Alumina Ltd. March 2013 AER 2012
2 0 | P a g e
2.2 Emissions to Water
AAL has two licensed discharges of treated effluent to the Shannon Estuary as follows:
Table 10 Licensed Discharges to Water
Licence Reference Receiving Water Characteristics
W1-1 Shannon Estuary Treated Industrial (Process) Effluent
Sanitary Effluent Shannon Estuary Treated Sanitary Effluent
Discharges of treated industrial and sanitary effluents to the Shannon Estuary are made at an outfall point close to the AAL Marine Terminal. Both discharges are sampled continuously for both flow and pH, and for other parameters at weekly, monthly, quarterly and six monthly frequencies, as specified in Schedules C.2.1 (Control of Emissions to Water) and C.2.2 (Monitoring of Emissions to Water) of the IPPCL.
2.2.1 Process Effluent (W1-1)
Treated process effluent is discharged to the Shannon Estuary at emission point W1-1. Summary monitoring results for 2012 are tabulated below in Table 11. Toxicity testing, heavy metal screening and VOC (volatile organic compounds) for process effluent are detailed in Sections 2.2.2, 2.2.3 and 2.2.4 respectively.
The data reported in Table 11 is for the 12 months of 2012. Figures for 2011 are included by way of comparison. It is noted that annual mass emissions for all parameters during the reporting period were within licensed emission limit values. While hourly and daily flow values occasionally approach up to the relevant limit, annual volumetric emissions from W1-1 are significantly below the permitted ELV. The reason for the increased volume of process effluent in 2012 is due to the fact that the new BRDA became operational in late 2011 which has increased the storm water catchment area by 80 hectares.
Table 11 Process Effluent (W1-1) Mass Emissions 2012
Parameters Mass
Emissions (kg) 2011
Mass Emissions (kg)
2012
Licensed Emissions (kg)
Volume (m3) 3,864,398 4,989,297 10,980,000
BOD 280,198 425,597 863,760
Suspended Solids 45,342 56,961 549,000
OFG 3,864 4,989 164,700

Aughinish Alumina Ltd. March 2013 AER 2012
2 1 | P a g e
Figure 4 Process Effluent Mass Emissions 2012
2.2.2 Toxicity Testing
Schedule B.2 (Emissions to Water) and Schedule C.2.2 (Monitoring of Emissions to Water) of the IPPC Licence requires biannual toxicity testing of the treated effluent. The ELV for toxicity is 5 Toxic Units (TU).
Two samples of treated effluent (each consisting of 24 hour flow proportional composite samples) were collected and dispatched to the Shannon Aquatic Toxicity Laboratory (SATL) of Enterprise Ireland. These samples were collected in June and December 2012. The acute toxicity of each sample was analysed on suitable sensitive aquatic indicator species i.e. Tisbe battagliai and Vibrio fischeri. The results (see Table 12) show that the effluent was compliant with the ELV for toxicity. The toxicity testing reports provided by SATL are included as Attachment 1 to this report.

Aughinish Alumina Ltd. March 2013 AER 2012
2 2 | P a g e
Table 12 Process Effluent - Toxicity Testing Results 2012
Test Parameter June 2012
Results (TU) December 2012
Results (TU) ELV (TU)
48h LC50 to Tisbe battagliai
< 3.1 < 3.1 5
30 min EC50 to Vibrio fischeri
< 2.2 < 2.2 5
Note: Values denoted less than (<) are below the relevant threshold or limit of detection for that test
2.2.3 Heavy Metal, Aluminium and Soda Analysis
AAL is required to analyse treated process effluent for heavy metals, aluminium and soda under IPPCL Schedule C.2.2 Monitoring of Emissions to Water. Heavy Metals Heavy metal analysis of the effluent discharged at emission point W1-1 was undertaken by FitzScientific Ltd. on a quarterly basis during 2012. Analytical results for 2012 are shown in Table 13 below.
Table 13 Process Effluent (W1-1) - Heavy Metal Results 2012
Parameter Conc. (mg/l)
Conc. (mg/l)
Conc. (mg/l)
Conc. (mg/l)
Limit of Detection
Q1 Q2 Q3 Q4 (mg/l)
As 0.025 0.038 0.057 0.039 0.005
Cd 0.0007 0.001 0.001 0.0003 0.0002
Cr 0.006 0.008 0.003 0.0004 0.001
Cu 0.011 0.003 0.008 0.006 0.003
Hg 0.005 0.006 0.004 0.005 0.0001
Ni 0.005 0.016 0.008 0.004 0.0025
Pb 0.0001 0.0132 <LOD 0.0006 0.001
Zn 0.013 0.005 0.004 0.004 0.003
Ti <LOD <LOD <LOD <LOD 0.004
Fe 0.024 0.085 0.077 0.062 0.001
Mg 5.805 5.377 10.305 1.987 0.001
The results of the analyses for aluminium and soda are detailed in Table 14. The figure provided for each parameter is the average result for the 2011 and 2012 monthly monitoring intervals.

Aughinish Alumina Ltd. March 2013 AER 2012
2 3 | P a g e
Table 14 Process Effluent (W1-1) - Aluminium & Soda Results
Parameter Units Annual
Average Annual
Average ELV
2011 2012
Aluminium mg/l Al 1.65 1.34 Not specified
Soda g/l Na2O 2.41 2.63 Not specified
2.2.4 Effluent VOC Screen
VOC screening of industrial effluent (at W1-1) is undertaken biannually as specified in Schedule C.2.2 of the IPPC Licence. Biannual sampling and analysis was undertaken in June and December 2012. Laboratory analysis was undertaken by Fitz Scientific Ltd. using a modified version of the US EPA Method 524.2, as approved by the Agency (Ref. M35/AP/12). The VOC concentration in the sample taken in June 2012 was 5.0 µg/l and the VOC concentration in the December 2012 sample was 3.6 µg/l. Table 15 Process Effluent (W1-1) - VOC Screen
Date Units Test Method Result
18/06/2012 µg/l VOC USEPA 542.2 5.0
04/12/2012 µg/l VOC USEPA 542.2 3.6

Aughinish Alumina Ltd. March 2013 AER 2012
2 4 | P a g e
2.2.5 Sanitary Effluent
Treatment of sanitary effluent is provided for by a proprietary biological effluent treatment plant, which comprises an activated sludge (aeration) stage and a settlement/clarification stage, prior to discharge. The system discharges to the industrial effluent discharge pipeline at a point upstream of the final discharge at W1-1. In the unlikely event that pH, BOD or suspended solids levels in the treated effluent do not meet the specified IPPC ELV’s, the treated effluent is re-circulated within the system and is not discharged i.e. potentially non-compliant effluent is returned for re-treatment to ensure compliance. Annual mass emissions for treated sanitary effluent discharges are tabulated on Table 16 below.
Table 16 Sanitary Effluent Mass Emissions 2012
Parameter Mass Emissions
(kg) 2011 Mass Emissions
(kg) 2012
Licensed Emissions
(kg)
Volume (m3) 13,555 14,907 87,840
BOD 47 72 2,196
Suspended Solids
62 40 3,074
The annual volumetric discharge mass emissions for all parameters were significantly below permitted levels for those discharges.
Figure 5 Sanitary Effluent Mass Emissions 2012

Aughinish Alumina Ltd. March 2013 AER 2012
2 5 | P a g e
2.2.6 Surface Water Monitoring
Monitoring of surface water run-off from the site is undertaken at five discharge locations referred to as Surface Streams (SS). Monitoring results for each emission point are summarised in Table 17 as the
average value for the monitoring period.
Table 17 Results of Surface Water Discharge Monitoring 2012
Emission Point Reference pH Conductivity (µS/cm) Na2O (g/l)
Frequency Weekly Weekly Monthly
SS 1 8.2 120 0.011
SS 2 8.3 192 0.009
SS 3 8.3 206 0.018
SS 4 8.4 120 0.007
SS 5 8.3 329 0.030
(Note: Results are numerical average of 2012 data)
2.2.7 Surface Water Monitoring at the BRDA
Monitoring of surface water run-off in the area of the existing BRDA is undertaken at two licensed locations – Mangan’s Lough and the OPW Channel. Results for each emission point are detailed in Table 18 and show the average value over the monitoring period. As the surface water in the area is subject to saline intrusion, the soda and conductivity values are subject to sodium interference owing to the presence of sodium salts in the brackish water.
Table 18 BRDA Surface Water Monitoring Results 2012
Description pH Conductivity µS/cm Soda (Na2O) g/l
Mangan's Lough 7.0 803 0.13
OPW Channel 7.8 2,582 0.51 (Note: Results are numerical average of 2012 monthly monitoring data)
2.2.8 Discharges to Water Compliance Summary
All discharges of treated process wastewater and sanitary effluent complied fully with the relevant emission limit values set out in the IPPCL.

Aughinish Alumina Ltd. March 2013 AER 2012
2 6 | P a g e
3. Waste Management
The national waste database table, providing a summary of waste arising at the AAL facility has been compiled for the calendar year 2012. The information is tabulated on Tables 19 and 20.
3.1 Waste Quantities 2012
Table 19 Summary Information on Waste Quantities Generated
Year 2008 2009 2010 2011 2012
Total quantity of waste produced in calendar
year (tonnes) 1,242,451 996,074 1,252,784 1,342,802 1,305,251
Total quantity of waste disposed of on-site
1,240,695 995,448 1,251,219 1,341,342 1,303,383
Total quantity of waste disposed of off-site
274 166 246 215 215
Total quantity of waste recovered on-site
0 0 0 0 382
Total quantity of waste recovered off-site
1,482 460 1,318 1,245 1,270
Year 2008 2009 2010 2011 2012
Quantity of Non-hazardous waste
produced in calendar year (tonnes)
1,265,311 980,752 1,235,628 1,322,599 1,289,351
Quantity of non-hazardous waste
disposed of on-site 1,263,666 980,210 1,234,162 1,321,264 1,287,575
Quantity of non-hazardous waste
disposed of off-site 256 136 231 202 195
Quantity of non-hazardous waste recovered on-site
0 0 0 0 382
Quantity of non-hazardous waste recovered off-site
1,389 406 1,234 1,134 1,199
Year 2008 2009 2010 2011 2012
Quantity of Hazardous waste produced in
calendar year (tonnes) 12,669 15,322 17,156 20,203 15,900
Quantity of hazardous waste disposed of on-site
12,558 15,238 17,057 20,079 15,808
Quantity of hazardous waste disposed of off-site
18 30 15 14 20.5
Quantity of hazardous waste recovered on-site
0 0 0 0 0
Quantity of hazardous waste recovered off-site
93 54 84 111 71

Aughinish Alumina Ltd. March 2013 AER 2012
2 7 | P a g e
The quantities of waste disposed of to the plant Bauxite Residue Disposal Area (BRDA) are estimated using a number of methods:
Volumes of red mud disposed of to the BRDA are calculated from the annual production figures and the determined mud factor generated by analysis of the bauxite ores used during the reporting period.
Volumes of salt cake, process scale and other process wastes are based on the number of containers multiplied by typical container net weight. As
such, the degree of accuracy is of the order of 10% on these figures. There was an overall decrease of 37,532 tonnes of waste generated on site in 2012 compared to 2011. This decrease was primarily due to the improved quality of raw bauxite which led to a reduction in residual bauxite following alumina extraction.
Results of waste analysis carried out by AAL during 2012 are included as Attachment 2.

Aughinish Alumina Ltd. March 2013 AER 2012
2 8 | P a g e
Table 20 Information on Individual Waste Streams EWC Code Haz
(Y/N) Description of
Waste Name of
Waste Collection Contractor
(where applicable)
Waste Collection Permit No.
Name of Waste Disposal/ Recovery
Contractor(s) (where applicable)
Method of Disposal/Recovery
Location of Disposal/ Recovery
Waste Licence/
Permit No.
Quantity (Tonnes/ annum)
15 01 11 Y Aerosol Cans John Malone Transport
WCP-LK-543-08b
Rilta Environmental Ltd., Greenogue Business Park, Rathcoole, Co. Dublin
D10 Incineration on land (b) Off-site Abroad
W0192-03 5.00
17 06 01 Y Asbestos John Malone Transport
WCP-LK-543-08b
Rilta Environmental Ltd., Greenogue Business Park, Rathcoole, Co. Dublin
D1 Deposit on, in or under land
(c) Off-site Abroad
W0192-03 5.5
16 06 01 Y Batteries (lead-acid)
John Malone Transport
WCP-LK-543-08b
Rilta Environmental Ltd. Greenogue Business Park, Rathcoole, Co. Dublin
R4 Recycling/reclamation of metals & metal compounds
(b) Off-site Ireland
W0192-03 8.62
20 01 01 N Cardboard Greenstar WCP-DC-08-1120-01
Greenstar, Dock Road, Limerick
R3 Recycling/reclamation of organic substances which are not used as solvents
(b) Off-site Ireland
W0082-02 15.4
18 01 04 Y Clinical Waste SRCL WCP-DC-09-1178-01
SRCL Ltd., 420-430 Beech Road, Western Industrial Estate, Naas Road, Dublin 12
D9 Physico chemical treatment
(b) Off-site Ireland
W0055-02 0.028
20 01 99 N Conveyor Belting
Quarry Plant Supplies
N/A Pat O'Connor, Quarry Plant Supplies, Straffan, Co. Kildare
R11 Uses of residual materials obtained from any of the operations numbered R1-R10
(b) Off-site Ireland
N/A 31.9
17 04 01 N Copper Hegarty Metals Recycling
WCP-LK-027-02b
Hegarty Metals Recycling, Ballysimon Rd., Limerick
R4 Recycling/reclamation of metals & metal compounds
(c) Off-site Abroad
WFP-LKC-11-001-01
28.3
16 11 04 N
Flue Stack Residue (Boiler Ash)
N/A N/A Aughinish Alumina Ltd. D1 Deposit on, in or under land
Site landfill IPPCL P0035-05
3.0

Aughinish Alumina Ltd. March 2013 AER 2012
2 9 | P a g e
EWC Code Haz (Y/N)
Description of Waste
Name of Waste
Collection Contractor
(where applicable)
Waste Collection Permit No.
Name of Waste Disposal/ Recovery
Contractor(s) (where applicable)
Method of Disposal/Recovery
Location of Disposal/ Recovery
Waste Licence/
Permit No.
Quantity (Tonnes/ annum)
16 11 04 N
Flue Stack Residue (Refractory Waste)
N/A N/A Aughinish Alumina Ltd. D1 Deposit on, in or under land
Site landfill IPPCL P0035-05
80
20 01 21 Y
Fluorescent & Mercury Containing Bulbs
Irish Lamp Recycling
WCP-DC-08-1115-01
Irish Lamp Recycling, Athy, Co Kildare
R4 Recycling/reclamation of metals & metal compounds
(b) Off-site Ireland
WFP-KE-08-0348-01
11.00
20 03 01 N General Waste Greenstar WCP-DC-08-1120-01
Greenstar, Dock Road, Limerick
D1 Deposit on, in or under land
(b) Off-site Ireland
W0082-02 179.0
16 05 04 Y Halon Cylinders John Malone Transport
WCP-LK-543-08b
Rilta Environmental Ltd. Greenogue Business Park, Rathcoole, Co. Dublin
R5 Recycling/reclamation of inorganic substances
(c) Off-site Abroad
W0192-03 0.68
01 03 99 N Lime Grits/Stone N/A N/A Aughinish Alumina Ltd. D1 Deposit on, in or under land
Site landfill IPPCL P0035-05
5,590
15 01 04 N
Metal Containers (empty IBC's & drums)
John Malone Transport
WCP-LK-543-08b
Rilta Environmental Ltd., Greenogue Business Park, Rathcoole, Co. Dublin
R4 Recycling/reclamation of metals & metal compounds
(b) Off-site Ireland
W0192-03 12.5
16 01 07 Y Oil Filters Enva WCP-DC-08-1116-01
Enva Shannon, Smithstown Industrial Estate, Shannon, Co. Clare
R11 Uses of residual materials obtained from any of the operations numbered R1-R10
(b) Off-site Abroad
W0041-01 0.10

Aughinish Alumina Ltd. March 2013 AER 2012
3 0 | P a g e
EWC Code Haz (Y/N)
Description of Waste
Name of Waste
Collection Contractor
(where applicable)
Waste Collection Permit No.
Name of Waste Disposal/ Recovery
Contractor(s) (where applicable)
Method of Disposal/Recovery
Location of Disposal/ Recovery
Waste Licence/
Permit No.
Quantity (Tonnes/ annum)
13 08 99 Y Oily Rags / Oil Dry
John Malone Transport
WCP-LK-543-08b
Rilta Environmental Ltd. Greenogue Business Park, Rathcoole, Co. Dublin
D10 Incineration on land (b) Off-site Ireland
W0192-03 10.0
20 01 01 N Paper/ Documents
DGD Papers
WCP/LK/021/02b, WCP/LK/021/05c WCP/LK/062/02b
DGD Papers Ltd., Bay M1, Raheen Business Park, Limerick
R3 Recycling/reclamation of organic substances which are not used as solvents
(b) Off-site Ireland
WFP-LK-2008-09C
1.1
20 01 39 N
Plastic containers (clean IBC's, drums)
John Malone Transport
WCP-LK-543-08b
Rilta Environmental Ltd., Greenogue Business Park, Rathcoole, Co. Dublin
R9 Used oil re-refining or other reuses of previously used oil
(b) Off-site Ireland
W0192-03 45.2
15 01 10 Y
Plastic containers (contaminated IBC's & drums)
SRCL WCP-DC-09-1203-01
SRCL Ltd./Ecosafe Systems, 420-430 Beech Road, Western Industrial Estate, Naas Road, Dublin 12
R12 Waste exchange prior to recovery
(b) Off-site Abroad
W0055-02 2.9
20 01 36 N Printer Toner Cartridges
Condells N/A Condells The Office Centre, 9 Roches St., Limerick
R4 Recycling/reclamation of metals & metal compounds
(b) Off-site Ireland
N/A 0.08
01 03 09 N Red Mud N/A N/A Aughinish Alumina Ltd. D1 Deposit on, in or under land
Site landfill IPPCL P0035-05
1,183,358
01 03 99 N
Process waste (tank cleanout scale, sludge etc.)
N/A N/A Aughinish Alumina Ltd. D1 Deposit on, in or under land
Site landfill IPPCL P0035-05
16,709
01 03 07 Y Salt Cake N/A N/A Aughinish Alumina Ltd. D1 Deposit on, in or under land
Site landfill IPPCL P0035-05
15,808

Aughinish Alumina Ltd. March 2013 AER 2012
3 1 | P a g e
EWC Code Haz (Y/N)
Description of Waste
Name of Waste
Collection Contractor
(where applicable)
Waste Collection Permit No.
Name of Waste Disposal/ Recovery
Contractor(s) (where applicable)
Method of Disposal/Recovery
Location of Disposal/ Recovery
Waste Licence/
Permit No.
Quantity (Tonnes/ annum)
01 03 99 N Sand N/A N/A Aughinish Alumina Ltd. D1 Deposit on, in or under land
Site landfill IPPCL P0035-05
81,835
19 08 05 N Sanitary Effluent Sludge
N/A N/A Aughinish Alumina Ltd. D2 Land Treatment Designated area on-site
IPPCL P0035-05
381.9
17 04 07 N Steel & Aluminium Scrap Metal
Hegarty Metals Recycling
WCP-LK-027-02b
Hegarty Metals Recycling, Ballysimon Rd., Limerick
R4 Recycling/reclamation of metals & metal compounds
(c) Off-site Abroad
WFP-LKC-11-001-01
918.3
20 01 38 N Timber Reels (used)
Hegarty Metals Recycling
WCP-LK-027-02b
Hegarty Metals Recycling, Ballysimon Rd., Limerick
R11 Uses of residual materials obtained from any of the operations numbered R1-R10
(b) Off-site Ireland
WFP-LKC-11-001-01
33.1
19 12 04 N Used Hosing (Rubber)
Greenstar WCP-DC-08-1120-01
Greenstar, Dock Road, Limerick
R11 Uses of residual materials obtained from any of the operations numbered R1-R10
(b) Off-site Ireland
W0082-02 31.5
20 01 25 N Vegetable Oils & Greases
Frylite WCP-DC-10-1297-01
Frylite Dublin Ltd., Unit J1, Ballymount Industrial Estate, Dublin 12
R3 Recycling/reclamation of organic substances which are not used as solvents
(b) Off-site Ireland
WCP-DC-10-1297-01
1.2
16 02 14 N
Waste Electrical & Electronic Equipment (WEEE)
Greenstar WCP-DC-08-1120-01
Greenstar, Dock Road, Limerick
R4 Recycling/reclamation of metals & metal compounds
(b) Off-site Ireland
W0082-02 3.0
20 01 38 N Wood - recycling Hegarty Metals Recycling
WCP-DC-08-1120-01
Greenstar, Dock Road, Limerick
R3 Recycling/reclamation of organic substances which are not used as solvents
(b) Off-site Ireland
W0082-02 77.8
20 01 38 N Wood - landfill
Hegarty Metals Recycling
WCP-DC-08-1120-01
Greenstar, Dock Road, Limerick
D1 Deposit on, in or under land
(b) Off-site Ireland
W0082-02 15.8

Aughinish Alumina Ltd. March 2013 AER 2012
3 2 | P a g e
EWC Code Haz (Y/N)
Description of Waste
Name of Waste
Collection Contractor
(where applicable)
Waste Collection Permit No.
Name of Waste Disposal/ Recovery
Contractor(s) (where applicable)
Method of Disposal/Recovery
Location of Disposal/ Recovery
Waste Licence/
Permit No.
Quantity (Tonnes/ annum)
13 01 13, 13 07 01
Y Waste Oil John Malone Transport
WCP-LK-543-08b
Rilta Environmental Ltd., Greenogue Business Park, Rathcoole, Co. Dublin
R9 Used oil re-refining or other reuses of previously used oil
(b) Off-site Ireland
W0192-03 38.4
16 07 08 Y Waste Oil/Water Washings
Lehane Environmental
WCP-CK-08-0574-02
Rilta Environmental Ltd. Greenogue Business Park, Rathcoole, Co. Dublin
R9 Used oil re-refining or other reuses of previously used oil
(b) Off-site Ireland
W0192-03 9.32
Hazardous Waste Non Hazardous Waste

Aughinish Alumina Ltd. March 2013 AER 2012
3 3 | P a g e
4. Monitoring and Enforcement 4.1 Monitoring
The EPA, and their representatives, made 3 separate monitoring visits during 2012. On 2 occasions, Agency personnel collected samples of treated process effluent and sanitary effluent. During these site visits, the Agency personnel also inspected the site surface water streams and samples were collected from SS-5. One monitoring visit was carried out by Catalyst Environmental Ltd. on behalf of the EPA during which emissions to air from the calciner stack (Emission Point Ref. A2) were monitored. Results for all samples collected were compliant with the relevant schedules and conditions of the IPPC licence. Summarised data from Agency site monitoring visits is tabulated in Table 21 and Agency monitoring results are summarised in Tables 22, 23 and 24. Table 21 Number of EPA Site Visits 2012
Table 22 EPA Industrial Effluent Results (Emission Ref. W1-1)
Parameter EPA Result Range IPPCL ELV
pH 8.1 – 8.75 6 – 9
Solids(mg/l) <2 – <16 50
BOD (mg/l) <LOD - 10 2360 (kg/day)
For all samples collected by the Agency, results were compliant with the emission limit values as stated in Schedule B.2 of the IPPC Licence. Table 23 EPA Sanitary Effluent Results
Parameter EPA Result Range IPPCL ELV
pH 7.8 - 8.1 6 – 9
Solids(mg/l) <8 – 29 35
BOD (mg/l) 1.2 – 2.4 25
In all cases, sanitary effluent results were compliant with the relevant ELV’s. Table 24 EPA Emissions to Air Results (Calciner Stack A2)
Parameter Max EPA Result IPPCL ELV
Particulates 21.7 mg/m3 50 mg/m3
No. of Monitoring Visits 3 No.
Exceedences Compliance
Rate (%)
Total No. of Samples 8 0 100%
Parameters Monitored (Water) 42 0 100%
Parameters Monitored (Air) 5 0 100%

Aughinish Alumina Ltd. March 2013 AER 2012
3 4 | P a g e
4.2 Third Party Inspections
AAL obtained certification to the international environmental management system (EMS) standard ISO14001 in 2000. DNV-QA (Det Norske Veritas Quality Assurance) carried out a detailed audit of the system in November 2012. No non-conformances with ISO14001 were raised during this audit. AAL operates a rigorous internal audit schedule in order to ensure conformance with plant operating systems (production, quality, safety, environmental) and to facilitate the process of continual improvement in those systems.

Aughinish Alumina Ltd. March 2013 AER 2012
3 5 | P a g e
5. Resource Consumption
5.1 Energy Consumption
Owing to the nature of the Bayer process used at AAL for alumina manufacturing and post extraction processing, energy represents the most economically significant impact to the process. For this reason, AAL was designed with energy efficiency in mind. Heat recovery and power efficiency are two of the key process efficiency targets that receive close scrutiny. Table 25 Summary Energy Data 2008 to 2012
Source 2008 2009 2010 2011 2012
(MW) (MW) (MW) (MW) (MW)
Heavy Fuel Oil
258.8 172.4 286.2 189.7 112.6
Power (Electrical)
42.1 31.5 41.9 43.4 43.1
Diesel 2.8 0.9 0.9 1.3 0.5
Natural Gas
392.7 375.5 384.0 479.5 569.8
Total 696.4 580.2 712.9 713.8 725.9
Figure 6 Energy Use 2010 - 2012

Aughinish Alumina Ltd. March 2013 AER 2012
3 6 | P a g e
5.1.1 Energy Efficiency Report 2012
The 2012 energy efficiency report is attached to this document as Attachment 3.
5.2 Water Consumption
AAL receives potable water from Limerick County Council for process and domestic uses. The bulk of the potable water is demineralised in the AAL water treatment plant for use in boiler steam generation. The balance of the potable water is used for process make-up, where process condensate (re-condensed water from the process) supply is not available, and also as domestic water. AAL does not abstract any groundwater for process or domestic purposes. There was a slight decrease in water usage by the plant in 2012 as a result of a minor improvement in steam efficiency (see Table 26). The relative consumption of water (m3 per tonne of alumina hydrate produced) decreased slightly during 2012 versus 2011 and is similar to consumption rates seen in previous years.
Table 26 Summary Water Consumption Data 2008 to 2012
Year Total (m3)
Relative Consumption
(m3/tonne product)
2012 5,182,967 2.69
2011 5,245,081 2.73
2010 5,179,203 2.78
2009 4,284,051 3.45
2008 5,368,168 2.84
Figure 7 Plant Water Consumption

Aughinish Alumina Ltd. March 2013 AER 2012
3 7 | P a g e
6. Environmental Incidents and Complaints
In the event of an environmental incident occurring, AAL informs the EPA and, where appropriate, Limerick County Council and Inland Fisheries Ireland in accordance with the conditions of the IPPC Licence. AAL has a procedure for classification and reporting of environmental incidents. The procedure was revised in 2011 to include the requirements of the EPA Revised Guidance to Licensees/COA Holders on the Notification, Management and Communication of Environmental Incidents issued in December 2010. As part of the requirements of the IPPC Licence, AAL operates, through the plant Environmental Management System, a procedure for logging and responding to complaints received from the public.
6.1 Category 1 Incidents
There were two Category 1 (minor) incidents notified to the EPA during 2012:
Spillage of process liquor to the ground following the flooding of a process bund caused by an unexpected power outage in the plant on the 31st of January 2012. The bulk of the spillage was recovered back into the plant process thereby minimising environmental damage.
Discharge of approximately 100 litres of discoloured water at Surface Stream 5 on the 18th of May 2012. The source of this water was a minor discharge of dilute bauxite slurry dust from the Bauxite ore Transfer Tower 3 dust collection skip. This material was inert and contained no process chemicals.
6.2 Category 2 – 5 Incidents
There were no Category 2, 3, 4 or 5 (Limited, Serious, Very Serious or Catastrophic) environmental incidents during 2012.
6.3 Complaints
Two complaints were received during 2012. Details are as follows: On the 15th March 2012, AAL received correspondence from the EPA containing a complaint regarding AAL received by the Agency from a member of the public in Askeaton, Co. Limerick. The complaint referred to an alleged air pollution event on the 5th March. AAL reviewed all emissions data corresponding to that date and found that all emissions were compliant with the relevant IPPC emission limit values. A letter detailing the findings of the review of the emission data was sent to the EPA. On the 26th May 2012, AAL received a complaint by telephone from a member of the public regarding possible dusting in the BRDA. BRDA operations were reviewed and it was found that all dust control measures (automatic sprinklers on the mud and water bowsers on the roads) had been activated to prevent any dusting. Dust gauge data for the period of the complaint was reviewed and found to be below the internal limit of 350mg/m2/day.

Aughinish Alumina Ltd. March 2013 AER 2012
3 8 | P a g e
7. Environmental Management
Section 7 of this AER contains summary information on the AAL Environmental Management Programme (EMP). A revised Schedule of Objectives and Targets for 2013 is presented in Section 7.2 for Agency approval. Both the EMP and Schedule of Objectives and Targets fall under the site ISO 14001 Environmental Management System. Accordingly, they are included within a structured system of management review and periodic auditing by both internal auditors and independent third party auditors (DNV). The Pollution Release and Transfer Register (PRTR), which is a requirement of Condition 6.17 of the IPPCL, has been updated to reflect emissions during the 2011 monitoring period.
7.1 Environmental Management Programme (EMP) Report 2012
The AAL Environmental Management Programme (EMP) is a continuously updated plan showing the status of key environmental improvement programmes being undertaken within the plant and is reviewed as part of the ISO 14001 Environmental Management System (EMS). Progress in achieving planned objectives and targets during 2012 is summarised in this section. It sets out the objectives, associated targets and a comment on progress in meeting those targets. During 2012, significant progress was achieved in a number of key areas related to reduced emissions to air, improvements in quality assurance of CEMS, improvement in groundwater quality and development of a suitable method for neutralisation of bauxite residue. In addition, it is noted that significant work is undertaken on an on-going or recurring basis at the plant in order to continuously maintain and update AAL plant environmental performance. A summary of the progress in meeting a number of the plant targets during 2012 is provided overleaf.

Aughinish Alumina Ltd. March 2013 AER 2012
3 9 | P a g e
Table 27 EMP 2012 Report
No. Objective Target Progress
1 Improve Air Quality & reduce CO2 emissions
Secure funding for the installation of a natural gas boiler to replace an existing HFO boiler. HFO use is ~100 ktonne per year (down from 350 ktonne/year) and this will reduce it to ~30 ktonnes/year.
Funding secured for natural gas boiler, installation likely to take place in 2014. Planning permission successfully obtained.
2 Operate the on-site landfill (BRDA) to best practice
Commission BRDA Phase 2 without environmental impact.
BRDA Phase 2 successfully commissioned.
3 Partially neutralise bauxite residue deposited in BRDA
Develop methodology for atmospheric carbonation and neutralisation of bauxite residue in the BRDA. Emphasis is on farming techniques during wet months.
Methodology for partial neutralisation of bauxite residue in the BRDA successfully developed. As per Condition 8.4.19 of IPPC Licence P0035-05 the Mud Farming methodology will be documented.
4
Eliminate sources of groundwater contamination & implement remediation programme for historic contamination in plant area
Install groundwater recovery pumps at the POWs identified as having the highest pH (funding dependent).
Recovery pumps installed in POW's 1 & 13.
Achieve 100% compliance on Integrity Testing Programme & implement planned repairs for 2012.
2012 Integrity Testing Programme implemented and planned repairs completed.
5 Caustic Mass Balance
Close the caustic balance for 2012.
Closed caustic balance for 2012. Calculation has reached the limit of accuracy based on analytical methods used.
6
Reduction of BOD in industrial effluent discharged to the Shannon
Effectiveness of bacterial reduction of BOD to be assessed during 2012 to determine future direction of programme.
Programme reviewed and proposal sent to EPA as part of the last IPPC Licence review. Condition addressing effluent BOD reduction was removed from new IPPC Licence P0035-05.

Aughinish Alumina Ltd. March 2013 AER 2012
4 0 | P a g e
Table 27 EMP 2012 Report (Contd)
No. Objective Target Progress
7
Implement recommendations of Closure Plan as per Residues Solutions Residue Management Sustainability report
Construct & commence operation of a constructed wetlands area for treatment of BRDA leachate in conjunction with the University of Limerick & the IAI (International Aluminium Institute).
Wetlands area constructed within the BRDA for leachate treatment trial. Research will proceed during 2013.
8
Implement recommendations of Golders Associates Breakout Study report
Construct gabion barrier protection at the toe of the external embankment of the BRDA to proof against climate change driven increased levels of storms.
Construction works rescheduled to 2013.
9
Improve quality assurance of continuous emission monitors (CEMS) for emissions to air and meet requirements of EU Standard EN 14181.
Conduct ‘Annual Surveillance Testing’ as required under EN14181.
Annual Surveillance Testing carried out during 2012
Boiler Particulate online monitor performance to be improved.
Boiler particulate online monitors re-calibrated during 2012. Performance being assessed to identify possible further improvements.
10 Reduce fugitive emissions
Minimise on-site alumina dusting at alumina storage silos and Jetty ship loading points.
Improvements works carried out during 2012 at alumina storage silos and jetty loading points.
7.2 Environmental Objectives and Targets 2013
AAL reviews the plant Environmental Management System on an on-going basis with the aim of updating and refining the Environmental Management Programme (EMP) to take account of progress in meeting objectives and targets.
In addition, new targets are added on the basis of achievement of existing targets and where issues have been identified as requiring a formal and structured EMP approach to drive their implementation. New targets, which have been added for 2013 are summarised overleaf in Table 28. This list highlights only those targets added to the EMP and excludes the significant work involved in on-going programmes and projects to achieve existing targets, the detail of which is set out in the EMP for 2012. The primary focus of the EMP in achieving significant environmental objectives during 2013 will be the implementation of the new IPPC Licence conditions with

Aughinish Alumina Ltd. March 2013 AER 2012
4 1 | P a g e
regard to the BRDA as well as to continue the progress in recent years towards improving air emissions by the increased use of natural gas.
Table 28 EMP Objectives and Targets 2013
No. Objective Target
1 Operate the BRDA to best practice
Install upgraded automatic sprinkler system in Phase 1
Implement mud farming for partial neutralisation
Increase effluent disposal capacity to 1250 m3/hr
Demonstrate that farmed mud is non-hazardous
2 Implement recommendations of Golders BRDA Breakout Study report
Implement Gabion basket wall at the toe of the external embankment.
3 Implement recommendations of Residues Solutions report
Test constructed wetland for treatment of BRDA leachate.
4 Implement new monitoring & reporting of BRDA operations
Implement new Licence Monitoring & Reporting Conditions
Prepare BRDA Extractive Waste Management Plan
Prepare BRDA Safety Manual
Prepare BRDA Water Balance & Management Plan
Prepare BRDA Internal Emergency Plan and liaise with Limerick County Council on BRDA External Emergency Response Plan
Agree Mud Farming procedures and agree test methods for assessment of neutralised mud
Define scope for BRDA biennial audit
Issue progress reports on rehabilitation & break-out study.
5 Improve air quality & reduce CO2 emissions
Secure funding for the installation of 2 natural gas boilers onsite to replace an existing HFO boilers (which will be retained as strategic back-up)
6
Improve quality assurance of continuous emission monitors (CEMS) for emissions to air. Must meet requirements of EU Standard EN 14181.
Conduct ‘Annual Surveillance Testing’ as required under EN14181.
Improve boiler particulate monitors calibration
Improve calciner particulate monitor calibration
Define start-up and shutdown for boilers, gas turbines and calciners as per IED requirements

Aughinish Alumina Ltd. March 2013 AER 2012
4 2 | P a g e
Table 28 EMP Objectives and Targets 2013 (contd)
No. Objective Target
7 Reduce fugitive emissions Reduce alumina dusting at jetty & alumina storage silos
8 Improve groundwater quality
Achieve 100% compliance on Integrity Testing Programme & implement planned repairs for 2013.
Commission groundwater assessment as per requirements of Condition 6.15.4 of IPPCL.
Install groundwater recovery pumps at the POWs identified as having the highest pH (funding dependent)
Install silt traps & oil separators on surface water streams
Proposal on integrity testing of all open process drains to be submitted to the Agency
Implement monthly inspection and recording of leaks from all external valves and flanges
9 Conduct Caustic Mass Balance
Close the process caustic balance for 2013.
7.3 Pollutant Release and Transfer Register (PRTR)
The Pollutant Release and Transfer Register (PRTR) have been updated to provide further data for the calendar year 2012. Based on the emissions arising from the boilers and calciners, and also emissions which currently appear on the European Pollutant Emission Register (EPER), the following substances are included in the PRTR for 2012;
Sulphur dioxide (SO2)
Oxides of nitrogen (as NO2)
Particulate matter
Carbon dioxide
Arsenic
Cadmium
Chromium
Copper
Nickel
Zinc
Mercury
Lead
Aluminium
Iron
Magnesium
Biological oxygen demand

Aughinish Alumina Ltd. March 2013 AER 2012
4 3 | P a g e
Fats, oils and greases
Suspended solids Sulphur dioxide mass emissions are based on measured ‘S’ concentration in HFO multiplied by HFO consumption rate. Nitrogen dioxide and particulate mass emissions have been calculated based on results of direct stack gas measurement multiplied by calculated stack gas flow rates. Carbon dioxide and heavy metal emissions have been calculated based on fuel consumption multiplied by the appropriate emission factor. Emission factors used for calculations Hg, Cr and Cu are based on Ireland specific emission factors for oil fired power plant. All other emission calculations are based on UK NAEI dataset for fuel oil fire power stations. Table 29 PRTR Summary for 2012
Emissions to Air (tonnes)
Source
CHP Calciner Boiler Total
(Tonnes) Method of
Measurement Pollutant Name
Oxides of Sulphur (as
SO2) 7 3 1,620 1,630 E & M
Nitrogen oxides (as NO2)
297 539 610 1,446 E & M
Particulates N/A 98 38 135 E & M
Carbon Dioxide**
758,496 313,365 288,904 1,360,766 E & M
Arsenic N/A 0.000 0.011 0.011 C
Cadmium N/A 0.000 0.012 0.012 C
Chromium N/A 0.000 0.014 0.014 C
Copper N/A 0.000 0.014 0.014 C
Mercury N/A 0.000 0.002 0.002 C
Nickel N/A 0.000 0.505 0.505 C
Lead N/A 0.000 0.028 0.028 C
Zinc N/A 0.000 0.041 0.041 C
The full PRTR is included as Attachment 4. This document has also been submitted to the Agency via the AER/PRTR Reporting Website. AAL proposes to monitor and report the same parameters for the 2013 PRTR.

Aughinish Alumina Ltd. March 2013 AER 2012
4 4 | P a g e
7.3.1 Caustic Mass Balance
AAL have continued to undertake a detailed evaluation of caustic flows within the process during 2012. This work has continued on previous mass balance exercises undertaken at the plant over the past few years in order to further close out the quantity of caustic which is unaccounted for. The mass balance undertaken during 2012, and tabulated below in Table 30, has closed off the input-output cycle and resolved caustic consumption at the plant to approximately 1kg caustic (sodium hydroxide) per tonne of alumina hydrate produced. This is likely to be due to margins of error in sampling and measurement of caustic concentrations of minor streams which are based on periodic grab samples.
Table 30 Results of Caustic Mass Balance 2012
Element Units (kg/tH)
Input
Total Caustic Consumption 61.6
Outputs
Caustic in Mud 53.3
Caustic in Alumina 4.2
Caustic in Alumina Hydrate Ships 0.2
Caustic in Sand to BRDA 0.5
Caustic in Saltcake to BRDA 2.7
Caustic in process scale from Tank Turnarounds shipped to BRDA
0.2
Caustic in West pond disposal to the BRDA (Storm Water Pond)
5.3
Caustic in treated (neutralized & clarified) industrial effluents to the river
-2.5
Caustic recovery to process from the BRDA
-1.0
Total Output 62.8
Unaccounted -1.1

Aughinish Alumina Ltd. March 2013 AER 2012
4 5 | P a g e
8. Other Reports
This section contains details of other once off projects and reports required under the various conditions of the IPPC Licence. Generally, where documentation has already been submitted to the Agency, summarised information is provided. Full text reports are included as attachments where relevant.
Monitoring data from annual surveys (noise) together with results from ambient air quality, dust deposition and groundwater monitoring are summarised.
Updates to the facility Closure, Restoration and Aftercare Management Plan (CRAMP), the Environmental Liabilities Risk Assessment (ELRA) and the costings and financial provisions associated with both are provided.
The landfill status report (BRDA Operational Plan) is a recurring requirement of the IPPCL and has been updated to reflect quantities of waste deposited and development works undertaken during the 2012 calendar year.
8.1 Noise Monitoring Programme
AAL is required to carry out an annual noise survey in accordance with IPPC Licence Conditions 4.5 and 6.16. Schedule B.4 sets out the relevant noise limits at off-site noise sensitive locations (NSL) as:
Day-time: 55 dB (A) Leq
Night-time: 45 dB (A) Leq
A survey of noise levels at boundary and off-site noise sensitive locations was carried out in July and August 2012. At each monitoring location, day and night-time measurements were made for the following measurement parameters: LAeq, LAmax, LAmin, LA90 and LA10. The monitoring results are summarised on Table 31 and 32.
Table 31 Noise Survey Results – Noise Sensitive Locations
Noise levels measured at noise sensitive receptors (primarily close to dwellings) during day-time periods ranged from LAeq 46 dB(A) to 53 dB(A) with corresponding LA90 values ranging from 41 dB(A) to 46 dB(A).
Location Day-time Night-time
LAeq LA90 LA10 LAeq LA90 LA10
NSL 1 49 46 51 44 39 43
NSL 2 53 43 53 46 34 38
NSL 3 51 43 51 37 34 39
NSL 4 46 41 47 46 32 37
NSL 5 53 42 52 39 34 38

Aughinish Alumina Ltd. March 2013 AER 2012
4 6 | P a g e
The night-time LAeq values recorded ranged from 37 dB(A) to 46 dB(A) with corresponding LA90 values ranging from 32 dB(A) to 39 dB(A). During both survey periods, the noise climate at all off-site noise sensitive receptors was dominated by road traffic on the N69, road traffic to and from the AAL facility, operations in Foynes Port, wind generated noise and birdsong.
The noise limit of 45 dB(A) for night-time periods was marginally exceeded at two locations (NSL2 and NSL4). However there was no audible noise coming from the facility at these locations at the time of the survey and the monitored LA90 values which are representative of background noise were significantly below the 45 dB(A) limit. The predominant noise recorded at NSL2 was road traffic noise from the N69 and the predominant noise recorded at NSL4 was noted to be emanating from Foynes Port.
The noise limit of 55 dB(A) for day-time periods was not exceeded at any of the noise-sensitive receptor locations.
Table 32 Noise Survey Results – Boundary Locations
Location Day-time Night-time
LAeq LA90 LA10 LAeq LA90 LA10
B1 55 52 55 66 64 67
B2 56 55 57 51 50 52
B3 53 47 56 52 36 41
B4 52 43 52 36 35 37
B5 42 36 45 30 27 30
B6 52 48 54 51 50 52
B7 45 40 47 30 28 36
B8 42 36 45 36 28 32
B9 53 45 55 53 45 55
Noise levels measured at plant boundary locations during day-time periods ranged from LAeq 42 dB(A) to 56 dB(A). Noise levels measured at plant boundary locations during night-time periods ranged from LAeq 30 dB(A) to 66 dB(A). The study concluded that AAL is compliant with respect to noise levels emanating from the facility. The full text of the noise survey report is included as Attachment 5.

Aughinish Alumina Ltd. March 2013 AER 2012
4 7 | P a g e
8.2 Groundwater Monitoring
AAL undertakes an extensive groundwater monitoring programme. Overall, 87 groundwater monitoring locations have been established with the agreement of the Agency and are routinely monitored in accordance with Schedule C.8 of the IPPCL. The current IPPCL does not specify limit values for groundwater quality. Monitoring locations can be categorised into the following: (i) Estuarine Springs (ES) are foreshore springs which discharge from the
limestone bedrock at the foreshore (ES1 - 16) (ii) Plant Observation Wells (POW) beneath the process plant (POW1 - 33);
the area around the south pond (SPW1 - 6) and the north pond (NPW1 - 3) and the boreholes (BH1 - 4) in the underground fuel storage tank area.
(iii) Observation Wells (OW) around the perimeter of the Phase 1 and Phase 2 BRDA (OW1-45) installed within estuarine alluvium, glacial till and limestone bedrock.
8.2.1 Estuarine Springs
Estuarine springs (referred to as ES’s) are locations where the water table level intersects ground level to allow groundwater to directly discharge to the surface. The ES’s are therefore accepted as the main indicators of groundwater quality beneath the plant area. Sixteen individual estuarine springs have been identified and are routinely monitored (ES1 - 16).
Table 33 contains a summary of monitoring results for the 2012 reporting period. Reporting is as per Schedule C.8 of the IPPC Licence. Table 33 Estuarine Spring Monitoring Results 2012
Emission Point Ref. pH* Conductivity (µS/cm) Soda (g/l)
ES 1** 12.1 2,495 1.42
ES 2 7.9 23,108 5.43
ES 3 8.1 10,396 2.33
ES 4 No Flow No Flow No Flow
ES 5 8.2 323 0.03
ES 6 No Flow No Flow No Flow
ES 7 7.4 1,114 0.16
ES 8 9.3 7,745 1.68
ES 9 8.1 10,317 2.31
ES 10 7.8 1,398 0.21
ES 11 8.0 2,518 0.52
ES 12** 11.8 4,542 1.25
ES 13 8.7 411 0.08
ES 14 8.3 1709 0.34
ES 15 8.3 582 0.10
ES 16 9.0 957 0.28
*Numerical average of the data for the reporting period **Spring recovered for treatment - no direct discharge to estuary

Aughinish Alumina Ltd. March 2013 AER 2012
4 8 | P a g e
The results show that there has been a gradual and sustained improvement in the quality of the spring discharges and that only three currently have pH >9 ; ES1, ES8 and ES12. It should be noted that there is no direct discharge to the Estuary from ES1 and ES12 as these streams are intercepted and pumped to the effluent plant for treatment.
8.2.2 Plant Observation Wells (POW)
Table 34 contains a summary of plant observation well (POW) groundwater monitoring results for 2012. The table also includes data for those wells located around the north effluent pond (NPW) and the south effluent pond (SPW). Monitoring results are reported to the Agency in the quarterly monitoring reports. The values reported here are the average of analytical results returned during the 2012 monitoring period.

Aughinish Alumina Ltd. March 2013 AER 2012
4 9 | P a g e
Table 34 POW Monitoring Results 2012
POW pH Conductivity
Total Alk. Cl Fl Soda Al As Cd Cr Cu Fe Pb Mg Hg Ni SO4 Ti Zn
Ref. S/cm
mg/l CaCO3 mg/l mg/l g/l µg/l µg/l µg/l µg/l µg/l µg/l µg/l mg/l µg/l µg/l
mg/l SO4 µg/l µg/l
POW 1 12.4 9,895 2,616 441 2.3 2.2 132,100 41 0.1 6.9 2.0 36 1.1 0.4 1.2 9.3 1157 <5 2.5
POW 2 10.0 1,781 199 116 0.5 0.45 15,430 15.5 <0.09 <2.14 1.0 55 1.06 4.66 0.3 3.1 465 <5 2.5
POW 3 10.6 2,820 228 163 0.8 0.91 1,128 11.4 <0.09 <0.93 0.9 31 <0.38 0.66 0.3 1.2 799 <5 <4.6
POW 5 12.6 16,945 8,088 75 6.4 4.2 1,528 250.5 0.4 <2.14 4.6 10 0.9 <0.55 4.4 27.7 177 <5 5.8
POW 6 9.2 501 106 11 0.2 0.49 684 1.2 <0.09 1.9 1.7 143 0.8 1.4 0.2 0.3 99 12.7 4.3
POW 7 9.7 264 136 4 0.2 0.07 1,350 1.1 <0.09 <2.14 0.7 2,540 0.91 0.8 0.17 <0.47 4 <5 4.3
POW 8 8.3 706 92 53 0.08 0.1 35 <0.96 <0.09 <0.93 0.4 976 0.67 10.0 <0.2 <0.47 141 <5 <0.41
POW 9 7.8 517 210 24 0.1 0.04 32 <0.1 <0.09 3 0.7 153 0.69 2.9 0.13 0.5 8 <5 2.5
POW 10 7.9 431 203 12 0.1 0.02 44 <0.96 <0.09 <2.14 1.4 147 0.37 0.9 0.22 0.3 58 <5 2.6
POW 11 12.1 4,617 1,699 31 2.1 1.09 67,070 57.7 0.3 1.55 5.1 45 4.02 0.5 1.57 0.5 45 <5 4.7
POW 12 11.5 2,752 1,296 31 1.4 0.72 58,640 48.7 0.1 2.2 4.1 78 1.0 <0.55 1.4 1.3 29 <5 <0.41
POW 13 10.6 1,567 827 27 0.9 0.4 53,820 35.3 0.1 <2.14 3.1 113.5 0.7 <0.55 0.7 1.0 486 <5 7.3
POW 14 7.2 832 346 23 0.2 0.07 20 <0.1 <0.09 <2.14 1.7 4,758 1.1 3.7 0.13 1.0 <1.56 <5 2.7
POW 15 7.5 1,228 577 44 0.2 0.25 109 1.6 <0.09 18.8 1.1 1,628 <0.38 8.5 0.27 0.9 <0.75 <5 <4.6
POW 16 10.6 3,100 1,487 32 2.4 0.94 7,690 33.4 0.6 2.1 3.6 456 4.7 <0.55 1.0 4.0 33 6.4 <4.6
POW 17 13.1 45,950 15,694 76 27 10.4 601,500 668 1.1 7.1 12.3 80 3.0 <0.55 18.0 22 123 <5 24.0
POW 18 12.2 4,663 1,786 36 59.3 1.08 99,920 60.3 0.2 <2.14 3.1 90 2.0 <0.27 1.3 0.6 45 <5 2.6
POW 19 12.1 5,068 1,996 38 2.0 1.21 101,800 64.2 0.2 <0.93 0.7 433 1.6 <0.55 1.6 2.4 57 <5 2.8
POW 20 11.5 3,086 1,349 32 1.5 0.83 84,670 41.4 0.1 9.7 21.6 182 1.3 <0.55 1.2 5.1 32 <5 4.5
POW 21 8.3 548 151 57 0.1 0.07 149 0.6 <0.09 <2.14 0.8 287 1.3 10.0 0.4 0.4 30 <5 2.5
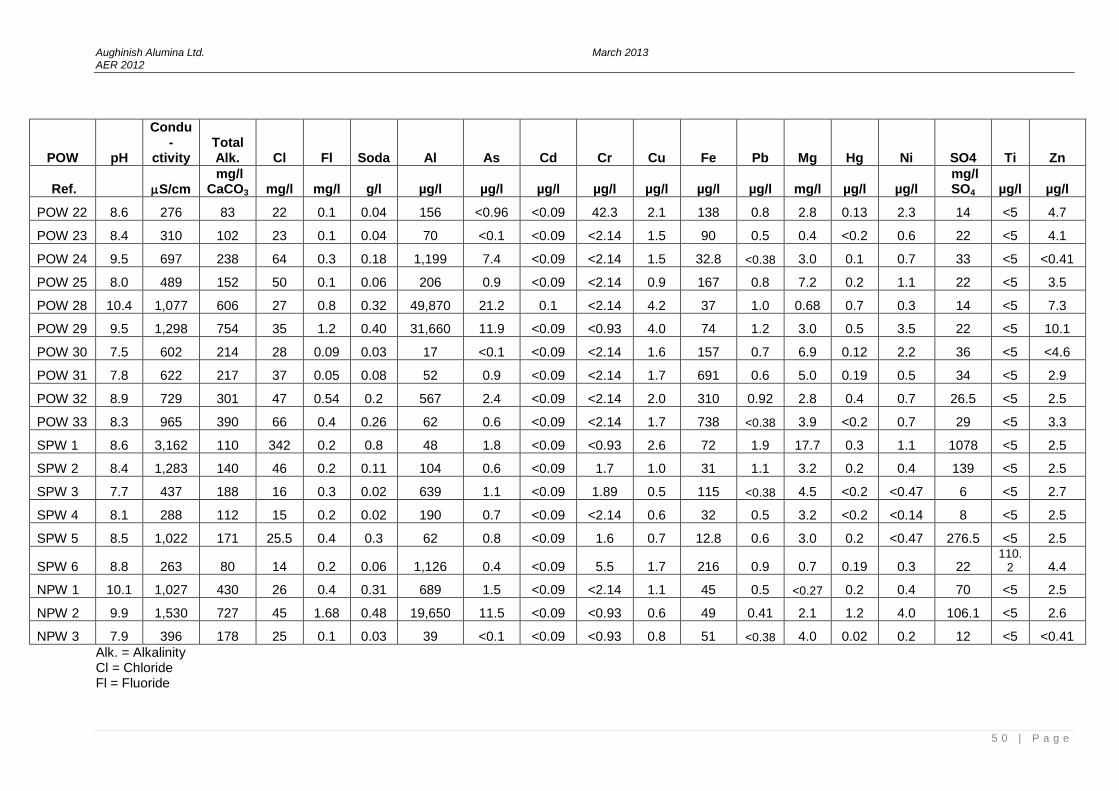
Aughinish Alumina Ltd. March 2013 AER 2012
5 0 | P a g e
POW pH
Condu-
ctivity Total Alk. Cl Fl Soda Al As Cd Cr Cu Fe Pb Mg Hg Ni SO4 Ti Zn
Ref. S/cm
mg/l CaCO3 mg/l mg/l g/l µg/l µg/l µg/l µg/l µg/l µg/l µg/l mg/l µg/l µg/l
mg/l SO4 µg/l µg/l
POW 22 8.6 276 83 22 0.1 0.04 156 <0.96 <0.09 42.3 2.1 138 0.8 2.8 0.13 2.3 14 <5 4.7
POW 23 8.4 310 102 23 0.1 0.04 70 <0.1 <0.09 <2.14 1.5 90 0.5 0.4 <0.2 0.6 22 <5 4.1
POW 24 9.5 697 238 64 0.3 0.18 1,199 7.4 <0.09 <2.14 1.5 32.8 <0.38 3.0 0.1 0.7 33 <5 <0.41
POW 25 8.0 489 152 50 0.1 0.06 206 0.9 <0.09 <2.14 0.9 167 0.8 7.2 0.2 1.1 22 <5 3.5
POW 28 10.4 1,077 606 27 0.8 0.32 49,870 21.2 0.1 <2.14 4.2 37 1.0 0.68 0.7 0.3 14 <5 7.3
POW 29 9.5 1,298 754 35 1.2 0.40 31,660 11.9 <0.09 <0.93 4.0 74 1.2 3.0 0.5 3.5 22 <5 10.1
POW 30 7.5 602 214 28 0.09 0.03 17 <0.1 <0.09 <2.14 1.6 157 0.7 6.9 0.12 2.2 36 <5 <4.6
POW 31 7.8 622 217 37 0.05 0.08 52 0.9 <0.09 <2.14 1.7 691 0.6 5.0 0.19 0.5 34 <5 2.9
POW 32 8.9 729 301 47 0.54 0.2 567 2.4 <0.09 <2.14 2.0 310 0.92 2.8 0.4 0.7 26.5 <5 2.5
POW 33 8.3 965 390 66 0.4 0.26 62 0.6 <0.09 <2.14 1.7 738 <0.38 3.9 <0.2 0.7 29 <5 3.3
SPW 1 8.6 3,162 110 342 0.2 0.8 48 1.8 <0.09 <0.93 2.6 72 1.9 17.7 0.3 1.1 1078 <5 2.5
SPW 2 8.4 1,283 140 46 0.2 0.11 104 0.6 <0.09 1.7 1.0 31 1.1 3.2 0.2 0.4 139 <5 2.5
SPW 3 7.7 437 188 16 0.3 0.02 639 1.1 <0.09 1.89 0.5 115 <0.38 4.5 <0.2 <0.47 6 <5 2.7
SPW 4 8.1 288 112 15 0.2 0.02 190 0.7 <0.09 <2.14 0.6 32 0.5 3.2 <0.2 <0.14 8 <5 2.5
SPW 5 8.5 1,022 171 25.5 0.4 0.3 62 0.8 <0.09 1.6 0.7 12.8 0.6 3.0 0.2 <0.47 276.5 <5 2.5
SPW 6 8.8 263 80 14 0.2 0.06 1,126 0.4 <0.09 5.5 1.7 216 0.9 0.7 0.19 0.3 22 110.
2 4.4
NPW 1 10.1 1,027 430 26 0.4 0.31 689 1.5 <0.09 <2.14 1.1 45 0.5 <0.27 0.2 0.4 70 <5 2.5
NPW 2 9.9 1,530 727 45 1.68 0.48 19,650 11.5 <0.09 <0.93 0.6 49 0.41 2.1 1.2 4.0 106.1 <5 2.6
NPW 3 7.9 396 178 25 0.1 0.03 39 <0.1 <0.09 <0.93 0.8 51 <0.38 4.0 0.02 0.2 12 <5 <0.41
Alk. = Alkalinity Cl = Chloride Fl = Fluoride

Aughinish Alumina Ltd. March 2013 AER 2012
5 1 | P a g e
*POW 4, 26 and 27 have been decommissioned

Aughinish Alumina Ltd. March 2013 AER 2012
5 2 | P a g e
8.2.3 BRDA Observation Wells (OW)
Table 35 contains a summary of summary of BRDA Observation Well (OW) groundwater monitoring results for 2012 as per Schedule C.8 of the IPPCL. The current IPPCL does not set out limit values for groundwater quality. Monitoring results are reported to the Agency in the quarterly monitoring reports. The values reported here are the average of analytical results returned during the 2012 monitoring period. In April 1997, OW’s 3, 4, 5 and 6 were capped as part of an extension of the original BRDA. OW’s 7, 8, 16, 17, 18, 19 and 23 were decommissioned during 2010 as part of the Phase 2 BRDA extension. OW’s 9, 10, 11 and 12 are subject to saline intrusion and accordingly, the measured electrical conductivity, chloride and soda (Na2O) values are subject to interference.
A review of the monitoring results for pH in 2012 indicate that pH is below 9 in all wells.

Aughinish Alumina Ltd. March 2013 AER 2012
5 3 | P a g e
Table 35 BRDA OW Monitoring Results 2012
OW Ref. pH
Conduct- ivity
Total Alk. Cl Fl Soda Al As Cd Cr Cu Fe Pb Mg Hg Ni SO4 Ti Zn
mS/cm mg/l
CaCO3 mg/l mg/l g/l µg/l µg/l µg/l µg/l µg/l µg/l µg/l mg/l µg/l µg/l mg/l SO4 µg/l µg/l
OW 1 8.2 1,639 355 145 0.7 0.4 43.9 1.2 <0.09 <2.14 2.6 27.6 2.31 16.3 <0.2 0.3 228.7 <5 190.9
OW 2 8.8 1,950 346 237 1.2 0.5 462 9.98 <0.09 <2.14 1.4 75 1.53 13.8 0.2 0.2 199.8 <5 21.3
OW 9 7.2 12,068 709 3,584 1.2 2.7 <11 5.24 <0.09 <2.14 2.7 2142 0.61 105.5 <0.2 1.1 454 <5 10.27
OW 10 7.3 29,388 141 11,023 1.0 6.2 20 0.88 <0.09 <2.14 1.8 1001 0.26 722.8 <0.2 2.6 691.5 <5 2,315
OW 11 7.2 31,050 1,966 10,862 0.5 7.5 30 0.14 <0.09 3.1 0.3 35 <0.38 620.6 <0.2 0.6 180.3 5.8 19.6
OW 12 7.5 28,020 1,441 9,728 0.5 6.6 26 0.57 <0.09 <2.14 1.2 446 <0.38 554.6 <0.2 1.5 325.5 <5 15.31
OW 13 7.7 477 199 17 <0.5 0.02 37 <0.1 <0.09 <2.14 2.8 60 0.21 5.4 <0.2 0.5 3.0 <5 6.9
OW 14 7.5 580 238 35 <0.5 0.02 35 <0.1 <0.09 <2.14 3.1 28 <0.38 5.1 <0.2 0.3 9.7 <5 4.50
OW 15 7.6 591 255 20 <0.5 0.01 28 0.18 <0.09 <2.14 1.7 22 <0.38 5.2 <0.2 0.8 9.0 <5 2.88
OW 20 7.6 3,077 562 594 1.25 0.65 40 0.22 <0.09 <2.14 4.7 161 0.15 32.1 0.1 6 144 <5 4.3
OW 21 7.2 31,225 2,326 10,911 <0.5 7.11 22 0.54 <0.09 2.10 1.5 606 0.134 813.1 <0.04 1.78 <0.75 <5 2.6
OW 22 7.0 5,018 462 1,129 1.00 0.86 4 0.40 <0.09 <2.14 1.60 461 6.54 43.3 <0.2 11.5 118.3 <5 10.8
OW 24 7.1 14,588 890 4,298 0.87 3.50 <11 3.89 <0.09 <0.93 1.50 498 0.20 222.9 <0.2 9.5 797.2 <5 98.4
OW 25 7.0 19,938 1002 6,172 0.61 4.97 24 3.89 <0.09 2.35 1.38 3351 0.17 222.9 <0.2 3.5 1238.0 <5 11.9
OW 26 7.4 7,025 709 2,649 0.62 2.42 33 1.79 <0.09 <0.93 1.44 454 1.32 62.0 <0.2 4.4 373.3 <5 31.2
OW 27 7.1 15,373 586 4,775 0.67 3.48 22 0.17 <0.09 <0.93 1.40 471 1.31 210.8 <0.2 2.0 809.6 <5 135.4
OW 28 7.1 14,118 669 4,371 1.03 3.19 27 0.74 <0.09 <0.93 1.57 572 1.24 281.1 <0.2 4.3 664.1 <5 16.2
OW 29 7.2 17,113 826 5,412 1.07 3.97 17 2.37 <0.09 <0.93 2.08 1834 0.16 284.0 <0.2 5.7 772.3 <5 8.2
OW 30 7.0 3,281 571 442 0.65 0.42 32 1.19 <0.09 <0.93 2.25 189 0.17 55.0 <0.2 0.8 429.1 <5 11.3
OW 31 7.0 8,105 748 2,304 0.84 1.69 14 3.99 <0.09 <0.93 2.40 375 0.17 267.9 <0.2 3.8 439.5 <5 6.3
OW 32 6.7 27,223 655 9,316 0.66 6.36 32 1.60 0.1 <2.14 3.74 2504 0.29 631.1 <0.2 10.7 2041.7 <5 10.2
OW 33 7.0 16,788 639 4,875 <0.5 3.82 59 2.28 <0.09 <2.14 3.33 2788 0.32 339.4 <0.2 4.6 2422.3 <5 29.4
OW 34 7.6 949 288 54 <0.5 0.04 24 0.39 <0.09 <2.14 1.99 17 0.19 7.4 <0.2 0.5 47.9 <5 6.7
OW 35 7.1 3,736 513 758 0.67 0.72 39 1.11 <0.09 <2.14 2.70 298 0.23 26.2 <0.2 3.7 142.3 <5 29.2

Aughinish Alumina Ltd. March 2013 AER 2012
5 4 | P a g e
OW Ref. pH
Conduct- ivity
Total Alk. Cl Fl Soda Al As Cd Cr Cu Fe Pb Mg Hg Ni SO4 Ti Zn
mS/cm mg/l
CaCO3 mg/l mg/l g/l µg/l µg/l µg/l µg/l µg/l µg/l µg/l mg/l µg/l µg/l mg/l SO4 µg/l µg/l
OW 36 7.1 11,087 499 3,534 <0.5 2.35 47 0.96 <0.09 <2.14 2.47 222 0.18 289.9 <0.2 6.9 405.4 <5 73.4
OW 37 7.3 806 331 38 <0.5 0.02 14 0.45 <0.09 <2.14 1.23 118 0.17 16.5 <0.2 0.5 23.4 <5 4.3
OW 38 7.4 707 210 31 <0.5 0.02 26 0.64 <0.09 <0.93 1.38 167 0.56 4.8 <0.2 0.7 29.6 <5 3.0
OW 39 7.3 1,044 222 22 <0.5 0.02 36 0.45 <0.09 <0.93 1.18 101 0.61 19.4 <0.2 1.1 260.1 <5 4.4
OW 40 7.6 623 199 45 <0.5 0.03 77 0.54 <0.09 <0.93 0.96 120 2.35 9.9 <0.2 1.0 28.9 <5 6.0
OW 41 7.5 689 222 41 <0.5 0.02 44 0.34 <0.09 <2.14 1.63 76 0.23 11.0 <0.04 0.4 17.8 <5 3.3
OW 42 7.3 762 248 33 <0.5 0.02 58 0.37 <0.09 <2.14 1.91 92 0.20 6.1 <0.04 0.4 10.1 <5 2.9
OW 43 7.6 3,249 214 898 <0.5 0.51 50 0.41 <0.09 <2.14 1.31 39 0.28 62.1 <0.04 0.5 106.6 <5 4.2
OW 44 7.2 865 314 42 <0.5 0.04 39 0.40 <0.09 <0.93 1.30 63 0.33 12.1 <0.2 0.7 31.1 <5 4.9
OW 45 7.1 1,190 283 61 <0.5 0.08 589 0.83 <0.09 <2.14 2.12 282 1.69875 17.1 <0.2 1.1 105.0 <5 101.6
Alk. = Alkalinity Cl = Chloride Fl = Fluoride * OW7, 8, 16, 17, 18, 19, 23 were decommissioned in 2010 due to BRDA expansion

Aughinish Alumina Ltd. March 2013 AER 2012
5 5 | P a g e
8.3 Leak Detection Monitoring System
In accordance with Schedule C.8 of the IPPC Licence and Condition 6.20, AAL is required to undertake bi-annual groundwater monitoring for hydrocarbon in four monitoring boreholes (BH1- BH4) located in the former underground fuel storage area. The fuel storage area comprised three steel underground storage tanks (UST’s), two of which were used for diesel and one for petrol. The two diesel UST’s were decommissioned after Agency approval in 2005.
Low levels of DRO and PAH were detected in groundwater samples taken during 2010. This was believed to be related to historic leaks prior to the decommissioning of the UST’s. AAL commenced an in situ remediation programme in late 2010 involving the application of an oxygen release compound (calcium oxyhydroxide) which biodegrades the hydrocarbons.
The results of groundwater monitoring carried out in May and December 2012 are tabulated in Table 36 below.
Table 36 Borehole Groundwater Monitoring Results 2012
Borehole Ref.
Date DRO* (g/l) PAH* (g/l)
BH 1 28/05/12 2004 <0.1
10/12/12 406 <0.1
BH 2 28/05/12 12,354 <0.1
10/12/12 129,331 <0.1
BH 3 28/05/12 220 <0.1
10/12/12 1,372 <0.1
BH 4 28/05/12 167 <0.1
10/12/12 832 <0.1 *DRO – Diesel Range Organic hydrocarbons; PAH - Polycyclic Aromatic Hydrocarbons.
The UST accounting for the elevated DRO in BH2 is decommissioned. This is residual diesel and will reduce over time.
8.4 Fugitive Emissions in the AAL Plant Area AAL undertakes monitoring for fugitive dust emissions at twenty eight locations within the site perimeter. The dust deposition gauges (labelled DG 1–28) measure deposited particulate material, collected over a 30-day period in accordance with TA Luft/VDI Guidelines 2119 Part 2. In total, there are 19 deposition gauges located around the BRDA to monitor dusting from the landfill area including the Phase 2 BRDA (DG 4–13, 20–28). Dust deposition measures the daily quantity of dust settling over a specified area (m2) and is expressed as milligrams per square metre per day (mg/m2/day). Average results for 2012 are summarised in Table 38. Results are presented as mean annual rates for each location, together with the range of monthly data recorded throughout the year.

Aughinish Alumina Ltd. March 2013 AER 2012
5 6 | P a g e
Deposition rates were generally low (<100mg/m2/day) and Enterprise Ireland suggests that average levels between 30 – 100 mg/m2/day are typical of small towns and light industrial areas and as such are ‘hardly noticeable’. Table 37 Dust Deposition Rates (mg/m2/day) in 2012
Deposition Gauge No.
Average Deposition Rate
(mg/m2/day)
Range (Min - Max) (mg/m2/day)
TA Luft Guideline Limit mg/m²/day
D.G. 1 43 12 - 78 350
D.G. 2 45 3 - 95 350
D.G. 3 23 3 - 48 350
D.G. 4 45 2 - 128 350
D.G. 5 22 2 - 70 350
D.G. 6 18 2 - 77 350
D.G. 7 39 3 - 146 350
D.G. 8 38 6 - 123 350
D.G. 9 25 0 - 104 350
D.G. 10 19 4 - 42 350
D.G. 11 22 3 - 58 350
D.G. 12 35 4 - 105 350
D.G. 13 29 5 - 87 350
D.G. 14 8 1 - 20 350
D.G. 15 20 5 - 80 350
D.G. 16 15 2 - 74 350
D.G. 17 28 12 - 46 350
D.G. 18 49 13 - 106 350
D.G. 19 110 28 - 324 350
D.G. 20 17 5 - 34 350
D.G. 21 37 1 - 241 350
D.G. 22 23 1 - 100 350
D.G. 23 19 1 - 103 350
D.G. 24 25 4 - 63 350
D.G. 25 27 3 - 102 350
D.G. 26 24 2 - 82 350
D.G. 27 18 1 - 52 350
D.G. 28 20 4 - 78 350
DG19 is located near the alumina silos and outdoor hydrate storage area.
8.5 Ambient Air Quality Monitoring
A programme of ambient air quality monitoring (both on-site and off-site) is carried out by AAL in accordance with Conditions 5.8 and 6.18 of the IPPC Licence. The parameters monitored as part of the ambient air quality monitoring programme are:

Aughinish Alumina Ltd. March 2013 AER 2012
5 7 | P a g e
Sulphur dioxide
Deposited Dust
Particulate Matter below 10µm (PM10)
Particulate Matter below 2.5 µm (PM2.5)
All results from the ambient air quality monitoring programme are reviewed versus the relevant limits and thresholds of the Ambient Air Quality and Cleaner Air for Europe (CAFE) Directive 2008/50/EC as transposed into Irish legislation by the Air Quality Standard Regulations 2011 (SI 180/2011). Overall, the results of the monitoring indicate the ambient air quality in the area is good, with the various values falling within the relevant targets for those parameters.
8.5.1 Ambient Air Sulphur Dioxide Monitoring
Sulphur dioxide (SO2) is monitored as part of the ambient air quality monitoring programme via two continuous active SO2 monitors located at Foynes and Ballysteen, along with passive diffusion tubes placed at 9 locations (including co-location with the continuous monitors).
Table 38 Ambient Air Sulphur Dioxide Continuous Monitoring Results (g/m3)
Continuous SO2 Monitors
SO2 Monitoring
Location CAFE Limits
(µg/m3)
Basis of Application of Limit Value
Foynes Ballysteen
Max Hourly Value
(µg/m3)
76.1 67.6 350 Not to be exceeded
more than 24 times in a calendar year
Max Daily Average (µg/m3)
20.2 12.2 125 Not to be exceeded more than 3 times in
a calendar year
Winter Mean (µg/m3)
6.8 4.4 20 1
st October to 31
st
March
# Daily Averages >50µg/m
3
0 0 50
Lower Assessment Threshold: 40% of 24-
hour limit, not to be exceeded more than 3 times in a calendar
year
A summary of the ambient sulphur dioxide diffusion tubes results are tabulated below in Table 40, along with a description of their locations.

Aughinish Alumina Ltd. March 2013 AER 2012
5 8 | P a g e
Table 39 Ambient Air Sulphur Dioxide Diffusion Tubes Monthly Results (g/m3)
Monitoring Location
Annual Mean
(g/m3)
Min Result
(µg/m3)
Max Result
(µg/m3)
CAFE Lower
Assessment Threshold
Kenricks House (Site #1) 1.0 0.6 1.8
<50µg/m3
(Not to be exceeded
more than 3 times per
year)
Kenricks House (1A) 1.5 0.8 3.8
Raw Water Intake (2) 1.8 0.9 5.5
Keane’s House (3) 1.1 0.9 1.8
Water Works (4) 0.9 0.7 2.0
Foynes (5) 1.7 0.8 4.0
Moran’s House (6) 2.3 2.0 6.0
Fitzsimon’s House (7) 1.3 1.1 2.2
Aughinish (8) 1.3 0.9 2.9
Foynes Reservoir (9) 1.5 0.4 4.5
Foynes Reservoir (9A) 1.2 0.8 3.0
*CAFÉ threshold shown is lower assessment threshold for SO2 (40% of 24-hour limit value)
8.5.2 Ambient Air Particulate Deposition
Particulate deposition is monitored at 2 off-site locations as part of the ambient air quality monitoring programme. Table 41 below shows a summary of the results for these monitoring locations during 2012. Table 40 Ambient Air Mean Monthly Particulate Deposition Rates (mg/m2/day)
Site No. Location Deposition Rate
(mg/m2/day) Range (mg/m2/day)
3 Keane’s House 23 4 - 46
7 Fitzsimons House 26 2 - 62
8.5.3 Ambient Air PM10 Monitoring Particulate matter below 10µm (PM10) is monitored by AAL at 3 locations (1 onsite & 2
offsite) using Partisol Model 2025 Air Samplers. Filters for all monitors are weighed at an external accredited laboratory. Table 42 below shows a summary of the results obtained for PM10 monitoring during 2012.
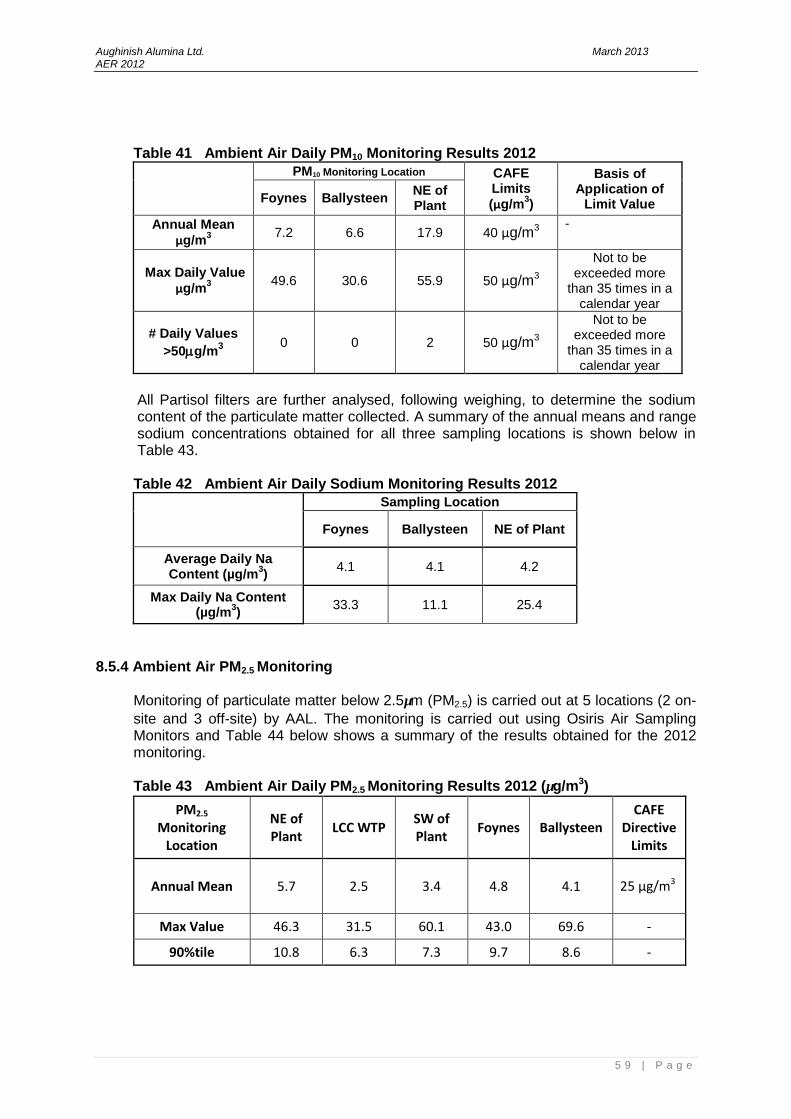
Aughinish Alumina Ltd. March 2013 AER 2012
5 9 | P a g e
Table 41 Ambient Air Daily PM10 Monitoring Results 2012
PM10 Monitoring Location CAFE Limits
(µg/m3)
Basis of Application of
Limit Value Foynes Ballysteen NE of Plant
Annual Mean
µg/m3
7.2 6.6 17.9 40 µg/m3
-
Max Daily Value
µg/m3
49.6 30.6 55.9 50 µg/m3
Not to be exceeded more
than 35 times in a calendar year
# Daily Values
>50g/m3
0 0 2 50 µg/m3
Not to be exceeded more
than 35 times in a calendar year
All Partisol filters are further analysed, following weighing, to determine the sodium content of the particulate matter collected. A summary of the annual means and range sodium concentrations obtained for all three sampling locations is shown below in Table 43. Table 42 Ambient Air Daily Sodium Monitoring Results 2012
Sampling Location
Foynes Ballysteen NE of Plant
Average Daily Na Content (µg/m
3)
4.1 4.1 4.2
Max Daily Na Content (µg/m
3)
33.3 11.1 25.4
8.5.4 Ambient Air PM2.5 Monitoring
Monitoring of particulate matter below 2.5µm (PM2.5) is carried out at 5 locations (2 on-
site and 3 off-site) by AAL. The monitoring is carried out using Osiris Air Sampling Monitors and Table 44 below shows a summary of the results obtained for the 2012 monitoring. Table 43 Ambient Air Daily PM2.5 Monitoring Results 2012 (µg/m3)
PM2.5 Monitoring
Location
NE of Plant
LCC WTP SW of Plant
Foynes Ballysteen CAFE
Directive Limits
Annual Mean 5.7 2.5 3.4 4.8 4.1 25 µg/m3
Max Value 46.3 31.5 60.1 43.0 69.6 -
90%tile 10.8 6.3 7.3 9.7 8.6 -

Aughinish Alumina Ltd. March 2013 AER 2012
6 0 | P a g e
8.6 Bund, Tank and Pipeline Integrity Testing
Condition 6 of the IPPC Licence (Control and Monitoring) states the requirements for the protection of groundwater from spills, leaks and improper storage. Specifically, Conditions 6.10 deals with the inspection and testing of bunding structures, tanks and underground pipelines.
8.6.1 Bunds and Tanks
The site has a number of integrity testing and repair programmes. The integrity testing of all bunding structures and tanks is carried out on an on-going three-year cycle. In total, there are 330 separate items requiring integrity testing at AAL and in 2012 the integrity of 77 items was confirmed.
In the past few years substantial sections of the drainage network have been upgraded with a steel or stainless steel liner to minimise the risk of groundwater contamination.
8.6.2 Underground Pipelines All pipelines carrying process effluent are above-ground. All non-process effluent pipelines (sanitary) were re-tested in 2010 in accordance with IPPC Licence Condition 6.10. A number of minor repairs were identified and these have been completed. The pipelines will be tested again in 2013.

Aughinish Alumina Ltd. March 2013 AER 2012
6 1 | P a g e
8.7 Decommissioning and Residuals Management Plan (DRMP/CRAMP) Review
Condition 10 of the IPPC Licence requires that AAL shall continue to maintain a fully detailed and costed Decommissioning and Residuals Management Plan (DRMP), which is adequate to assure the Agency that AAL is at all times capable of financing the environmental decommissioning and restoration of the AAL site at closure. The plan must be reviewed annually.
8.7.1 Update of CRAMP
In 2010, the DRMP was revised to form a CRAMP (Closure Restoration and Aftercare Management Plan) in accordance with the 2006 EPA Document: Guidance on Environmental Liability Risk Assessment, Residuals Management Plans and Financial Provision and further guidance and instruction from the Agency. The total cost of closure, restoration and aftercare of the entire facility which includes for long-term management and monitoring over a 30-year period was estimated at €20,393,853 in 2010, which was updated for inflation in 2011 to €21,015,171. In 2012, AAL constructed a trial wetlands effluent treatment area which will be assessed in the coming years to determine its suitability to form part of the CRAMP.
8.7.2 Update of CRAMP Costs
The projected closure, restoration and aftercare costs for 2012, based on the Wholesale Price Index, Capital Goods; Materials and Wages (as published by the Central Statistic Office for year 2012) January 2012 to December 2012, is calculated below:
€21,015,171 x 112.5/111.6 = €21,183,292 8.7.3 Financial Provision
In July 2011, AAL proposed to the Agency that it will commence to set aside €2 million per annum into a secure fund by means of an Agency designated deposit account from 2014. This will ensure that adequate closure funds will be in place and under Agency control by 2025 and will ensure compliance with IPPCL Condition 12.2.1. At present the funding is guaranteed by a Parent Company Guarantee from our owners UC Rusal. The structure of the underwriting for this activity is such that it allows for escalations based on changes to the scope or to the Wholesale Price Index (WPI).
8.8 Environmental Liabilities Risk Assessment (ELRA) Review
In accordance with Condition 12.7.2 of the IPPC Licence, AAL is required to engage an independent consultant to complete a comprehensive and fully costed Environmental Liabilities Risk Assessment (ELRA), at least every three years. The ELRA must address the liabilities from past and present activities on-site and must include those liabilities and costs identified in Condition 10 for execution of the CRAMP.

Aughinish Alumina Ltd. March 2013 AER 2012
6 2 | P a g e
The ELRA shall be reviewed as necessary to reflect any significant changes on site. Under Condition 12.7.3, AAL is also required to have adequate financial provision in place to cover the identified liabilities in the event of occurrence.
8.8.1 Update of ELRA In 2010, a revised ELRA was conducted by AAL’s consultants PM Group. The assessment identified no medium or high level risks. All risks were in the green low level range. The cost, calculated in accordance with the EPA Guidance, for unknown liabilities associated with the operational and closure phases of the AAL facility was calculated at €2,804,700. The ELRA will be reviewed in 2013 in line with the updated guidance from the Agency, when issued.
8.8.2 Update of ELRA Costs
The figure is updated annually based on the Wholesale Price Index, Capital Goods; Materials and Wages (as published by the Central Statistic Office). In 2011 the original figure was updated to €2,890,148. The updated figure for 2012 was calculated as follows:
€2,890,148 x 112.5/111.6 = €2,913,269
8.8.3 Financial Provision
AAL has General Liability Insurance which provides environmental insurance cover to a level significantly greater than the figure above. Details have previously been submitted to the Agency.
8.8.4 Statement of Measures in Relation to Prevention of Environmental Damage
The measures currently undertaken by AAL in relation to the prevention of environmental damage and possible remedial actions were detailed in the revised CRAMP and ELRA submitted to the EPA during 2010.
8.8.5 Report on consultation with the Local authority & the Principal Response
Agencies in relation to Emergency Planning for the BRDA During 2012, RUSAL Aughinish consulted with and met representatives of Limerick County Council (LCC) (Fire Service & Environment Dept) and the Health Service Executive (HSE) with a view to the preparation of an External Emergency Plan for the BRDA. The consultation process consisted of written and verbal communication with LCC, a site inspection by LCC and the HSE on 17th October 2012 and submission of documentation to LCC to assist the preparation of the External Emergency Plan. The documentation submitted included the Aughinish Internal Emergency Response Plan, BRDA emergency procedures, a Risk Assessment and Breakout Study for the BRDA, maps, drawings etc. A newspaper notice was published by LCC on the 24th January 2013 notifying the public that the process of drafting the External Emergency Plan had commenced.

Aughinish Alumina Ltd. March 2013 AER 2012
6 3 | P a g e
8.9 Annual Landfill (BRDA) Status Report
Operational information required under Schedule D of the IPPC Licence in respect of the Bauxite Residue Disposal Area (BRDA) is tabulated In Table 45 below. There are no closed areas within the BRDA and all areas are currently operational. Table 44 BRDA Operational Status
Parameter
Details
Landfill name &
Licence number
Aughinish Alumina Ltd. (BRDA)
IPPCL Reg. P0035-05
Landfill location Aughinish Island
(National Grid Ref. 127300E, 152200N)
Reporting period Jan 01 – Dec 31 2012
Owner and/or operator Aughinish Alumina Ltd.
Area occupied by waste 168.5 hectares
(94.5 ha Phase 1 BRDA, 74 ha Phase 2
BRDA)
Tonnage and composition of
waste deposited in the
preceding year
1,303,383 tonnes
(See Table 46)
Methods of depositing Pumping/Trucking
Time and duration of depositing 24 hours per day, 365 days per year
Total accumulated quantities of
waste deposited 24,061,439 tonnes (Table 47)
Calculated remaining capacity 25,606,117 tonnes (Table 48)
Calculated final capacity of site 49,667,556 tonnes
Year in which final capacity of
site is expected to be reached 2031
Stability checks undertaken See Section 8.9.3
Results of monitoring
programme See Section 8.9.3
Summary of any monitoring
non-compliances and corrective
actions taken
No non-compliances in 2012
Summary of any
development/remedial works
carried out in the preceding year
See Section 8.9.5
Revisions to Landfill Operational
Plan
See Attachment 6
Progress on restoration of
completed cells Not Applicable

Aughinish Alumina Ltd. March 2013 AER 2012
6 4 | P a g e
8.9.1 BRDA Waste Composition and Tonnage Data
Information on current and projected waste disposal rates, together with a breakdown of waste types is tabulated below. Table 45 BRDA Waste Composition & Tonnage 2012
Waste Stream EWC Code Jan – Dec
2012 Total (t)
As % of total waste
landfilled
Fluestack Residues
(dry) 16 11 04 83 0.01%
Lime Grits/Stone (wet) 01 03 99 5,590 0.43%
Sand (wet) 01 03 99 81,835 6.28%
Process Waste (wet) 01 03 99 16,709 1.28%
Red Mud (dry) 01 03 09 1,183,358 90.79%
Salt Cake (wet) 01 03 07 15,808 1.21%
Total Waste 1,303,383 100.00%
Table 46 Accumulated Quantities of Waste to BRDA 1983 to Dec 2012
Waste Stream EWC Code 1983 –
Dec 2012
As % of total waste
landfilled
Effluent Sludge A34
Clarifier (dry)* 06 05 03 4,380 0.02%
Fluestack Residues (dry) 16 11 04 4,489 0.02%
Lime Grits (wet) 01 03 99 122,186 0.51%
Process Waste (wet)
(incl. Sand) 01 03 99 2,230,543 9.27%
Red Mud (dry) 01 03 09 21,338,072 88.68%
Salt Cake (wet) 01 03 07 361,769 1.50%
Total Waste 24,061,439 100%
(Note1: The data for all residues for 1983 - 1997 other than red mud are estimated based on pro-rata tonnages for the period 1997 to 2000)
* Material no longer generated at plant.

Aughinish Alumina Ltd. March 2013 AER 2012
6 5 | P a g e
Engineering estimates of the total occupied and remaining capacity of the BRDA have been updated to reflect recorded quantities of waste deposited at the facility during 2012 and take into account the residue deposited in both the Phase 1 BRDA and the Phase 2 BRDA commissioned since 2011 and are tabulated overleaf.
Table 47 Estimated Capacity of BRDA
Period MOM Note 1
Waste during
period (t)
Accumulated waste
(t)
Remaining
capacity of
BRDA (t)
1983-
2000 R 9,952,703 9,952,703 9,762,404
2001 R 1,110,916 11,063,619 8,651,488
2002 R 1,111,886 12,175,505 7,539,602
2003 R 1,053,818 13,229,323 6,485,784
2004 R 1,077,940 14,307,263 5,407,844
2005 R 1,224,053 15,531,316 4,183,791
2006 R 1,270,270 16,801,586 2,913,520
2007 R 1,221,369 18,022,955 1,692,151
2008 R 1,240,695 19,263,651 451,455
2009 R 994,993 20,165,917 3,213,230 Note 2
2010 R 1,251,060 21,416,978 1,962,170
2011 R 1,341,079 22,758,056 26,909,500 Note 3
2012 R 1,303,383 24,061,439 25,606,117
2013 E 1,338,933 25,400,372 24,267,184
1 MOM – Method of Measurement; R = Recorded (Measured); E = Engineering Estimate
2 Increase in capacity of Phase 1 BRDA with increase in height to 32 meters (i.e. going from Stage 7
perimeter lift to Stage 10 perimeter lift) following issue of IPPCL P0035-04 in 2008. 3 Phase 2 BRDA was commissioned in Aug 2011 increasing the overall capacity from 31
st Dec 2011
onwards.
8.9.2 BRDA Containment Capacity
Containment capacity within the BRDA is developed by the construction of rock fill terrace embankments around the BRDA perimeter. These embankments are constructed in stages, each stage increasing the elevation of the BRDA by 2 metres. For the Phase 1 BRDA approximately 4% of the Phase 1 BRDA perimeter is currently at Stage 10, 49% of the BRDA perimeter is currently at Stage 9, 41% is at Stage 8 and 6% is at Stage 7. All mud filling in the Phase 2 BRDA has yet to fill up to the top of the inner wall.ie. Stage 0. The current IPPC Licence and planning permission permits the entire existing Phase 1 and Phase 2 BRDA perimeters to be raised to Stage 10. This will extend the lifetime of the existing BRDA to mid-year 2031 at current licensed production rates.

Aughinish Alumina Ltd. March 2013 AER 2012
6 6 | P a g e
8.9.3 Results of BRDA Monitoring Programme The 2012 Report on the BRDA monitoring programme is reported in the Golder 2012 Annual (Stability) Review submitted via ALDER. The executive summary of the Golders report can be found in Section 8.9.8. Monitoring of environmental conditions at the BRDA is undertaken on a routine basis through the collection of samples of groundwater from observation wells (OW’s) and surface waters for analysis. Monitoring results for the 2012 reporting period are detailed in Section 2.2.7 (Surface Waters) and 8.2.3 (Groundwater) of this AER.
There are 28 dust deposition gauges at various locations around the perimeter of the BRDA to determine the rates of dusting from the BRDA. Monitoring results for the 2012 reporting period have been detailed in Section 8.4 (Fugitive Emissions in the AAL Plant Area).
8.9.4 Revisions to BRDA Operational Plan
The BRDA Operational Plan has been updated to detail construction works which were completed in the BRDA in 2012 and is appended as Attachment 6.
8.9.5 Summary of BRDA Development/Remedial Works 2012 The Storm Water Pond and the Liquid Waste Pond were raised by 1.3 metres in 2012. This delivered additional storage capacity for storm water and for treated process effluent respectively to reflect the additional catchment area of the Phase 2 BRDA. A pumping facility was installed to pump storm water from the Phase 2 BRDA to the Phase 1 BRDA. The civil works for the Salt Cake cell were undertaken in the last quarter of 2012 and the entire composite lining system was leak tested in accordance with the CQA Plan. The mechanical and electrical works for the leachate collection system for the new salt cake cell were progressed by year end 2012. The development of the residue carbonation via on-site testing and development works continued during 2012 to confirm the range of mud layer thickness and time periods as well as machinery requirements to achieve the optimum reduction in residue causticity. A report on this ‘Residue Neutralisation’ work is being prepared for submission in April 2013.
8.9.6 Progress on Closure Planning & Re-vegetation of BRDA IPPC Licence Condition 8.4.17 requires that AAL continues to strive to implement the recommendations in the relevant sub-sections of the Residues Solutions Report submitted to the Agency in July 2007. The subsections to be addressed are:
Closure Planning
Closure Re-vegetation
Post-Closure Management
Alternative Uses of Residue For the last number of years AAL, in conjunction with the University of Limerick, has been carrying out an extensive research programme with the specific aim of

Aughinish Alumina Ltd. March 2013 AER 2012
6 7 | P a g e
developing the knowledge required for the closure and successful revegetation of the BRDA. This research programme has been carried out both on and off site by AAL personnel and contracted researchers. A progress report is included as Attachment 7.
8.9.7 BRDA Events 2012
The following events relating to the BRDA are relevant:
The full CQA Validation Report compiled by Golder Associates for the Phase 2 BRDA was issued to the Agency in February 2012
The contract to raise the Storm Water Pond and Liquid Waste Pond by 1.3 metres was implemented by Murphy International Ltd under the supervision of Golder Associates in the period April to July 2012.
The completed CQA Validation Report for the SWP and LWP raise was issued in October 2012.
The composite lining element for construction of the new Salt Cake Cell within the BRDA was completed by Priority Construction Ltd under the supervision of Golder Associates in the period September to December 2012. The remaining civil works and mechanical and electrical works associated with the project will be completed by February 2013
A permanent pumping facility to transfer water from the Phase 2 BRDA Perimeter Channel to the Phase 1 BRDA Perimeter Channel was commissioned in June 2012
60% of the dusting prevention sprinkler system within the Phase 1 BRDA was upgraded in the period June to August 2012 to the same standard as the Phase 2 BRDA sprinkler system. The balance will be upgraded by end April 2013.
The upstream side (i.e. landside) of the headwall for the south west sluice gate to the Robertstown River was sealed permanently closed in July 2012. Therefore the drainage network from all the lands between the BRDA and the Shannon/Robertstown River now enters the Robertstown River through a single discharge at the existing North West sluice gate. This facilitates routine monitoring and in the unlikely event of a BRDA containment failure it will facilitate isolation of the drainage system from the Robertstown River.
The development of the residue neutralisation process via on-site testing and development works continued during 2012 to confirm the range of mud layer thickness and time periods as well as machinery requirements to achieve the optimum reduction in residue causticity
There were no significant incidents as per Condition 9.5 or reportable incidents as per Condition 11.2 within the BRDA during 2012.
8.9.8 Report on Annual BRDA Review
Golder Associates were commissioned by AAL to prepare a report to facilitate licensee compliance with Appendix C7 of IPPC License P0035-05 namely ‘the annual review’ for the Bauxite Residue Disposal Area (BRDA). This section comprises the executive summary of the Golders report and the full report will be submitted to the Agency via the ALDER system.
The stability assessment summarises the monitoring results from the Casagrande piezometers, the vibrating wire piezometers and inclinometers / extensometers and visual inspection of the facilities and assesses the stability of

Aughinish Alumina Ltd. March 2013 AER 2012
6 8 | P a g e
the BRDA, the inner and outer perimeter walls forming the perimeter interceptor channel, the storm water and liquid waste ponds.
The Phase 1 BRDA is formed from two facilities, the original Phase 1 BRDA, covering an area of 72 ha and the Phase 1 BRDA extension covering an area of 32 ha. The Phase 1 extension is lined with a HDPE geomembrane while the original Phase 1 relies on the low permeability of the estuarine soils to minimise seepage from the base of the facility, plus the inherent low permeability of the red mud itself. Phase 2 BRDA covers an area of 80 Ha and was commissioned in 2011 and is currently receiving the majority of the red mud generated.
The initial design for the Phase 1 BRDA facility was to provide storage to the year 2009 based on the facility constructed to Stage 7 (elevation 18 m AMSL), which equates to a central elevation of 27.5 m AMSL or 26 m above original ground level. A site investigation and design report was presented to AAL (References 2.1 to 2.4) proposing to raise the facility in three more stages (Stages 8, 9 and 10), resulting in a maximum perimeter elevation of 24 m and a central elevation of 32 m AMSL.
AAL have successfully raised the stack wall to Stage 8 and in certain sections to Stage 9.
The key components of the BRDA are:
Low Permeability Outer Perimeter Embankment Wall;
Permeable Inner Perimeter Embankment Wall;
Perimeter Interceptor Channel;
Composite Lined System Throughout the Phase 1 Extension and Phase 2 BRDA;
Stage Raises; and
Upper level bench to reduce the overall side slopes from 6H:1V to 6.3H:1V.
The Phase 1 and the new Phase 2 BRDA are surrounded by a perimeter interceptor channel which is formed by constructing the outer and inner perimeter embankment walls. Surface water collected in the perimeter interceptor channel is pumped back to the plant or into the storm water pond during storm events. The Phase 1 and Phase 2 channels connect on the western section of the facilities. The Phase 1 and Phase 2 facilities will also be merged in the future.
Treated effluent is pumped from the Area 34 Annex effluent treatment facility and into the liquid waste pond prior to discharge into the River Shannon.
Unlike conventional tailings facilities or water retaining dams, the BRDA retains little to no surface water on the red mud. The red mud is discharged as a paste from several near central discharge points to form a dome which typically has the apex some 6m to 8m above the perimeter stack wall elevation. The structure is raised by constructing perimeter walls on the red mud by the upstream method which involves the construction of a series of retaining bunds upstream of the toe of the BRDA facility and so forming a supporting face to the overall structure.
The final elevation of the perimeter stack wall will be 24 m AMSL and the highest elevation of stacked residue will be 32 m AMSL, or some 30 m above ground level.
From the results of the monitoring of the inclinometers, extensometers and piezometers together with the 2010 CPT testing, it is apparent that the stack wall

Aughinish Alumina Ltd. March 2013 AER 2012
6 9 | P a g e
of the BRDA is stable at the current elevations and the facility is performing in accordance with the design.
The outer and inner perimeter walls, the storm water and liquid waste ponds are performing in accordance with the design.
Visual inspection of the facilities indicates no signs of distress in the walls.
Golders Associates consider that the Continuous Penetration Testing (CPT) and laboratory testing should be undertaken during 2013 in the red mud at stage 9, and six new piezometers and four inclinometers should be installed into the stack wall. For the purpose of the future annual audits, Golders also recommend that eight new piezometers should be installed in the estuarine foundation soils beneath the outer perimeter wall and the storm water pond.
Where seepages emanating from the Phase 1 BRDA perimeter interceptor channel are intercepted, the flow rate should be monitored to determine any changes in flow rate.
The volume of any red mud retained in the perimeter interceptor channel should be estimated and checked against design calculations to ensure sufficient flood storage is available and the freeboard can be maintained. The red mud has the ability to throttle seepage emanating from defects in the geomembrane forming the lining system in the perimeter interceptor channel.
Spillways and /or overflow pipes should be considered to connect the Phase 2 BRDA perimeter interceptor channel to the Phase 1 BRDA perimeter interceptor channel and certainly should be installed at closure. Currently water in the Phase 2 BRDA is pumped into the Phase 1 BRDA. It is understood that AAL are going to install two additional submersible pump adjacent to the sump area which pumps the Phase 1 PIC back to the effluent treatment plant. These two new pumps will be solely dedicated to pumping from the Phase 1 PIC to the SWP. As the existing large PIC pump has a valve tee connection to facilitate filling of the Storm Water Pond, these two new dedicated pumps give a large measure of equipment flexibility to discharge water from the PIC to the SWP.
AAL have their own power generating station providing a very reliable supply to the plant and ancillary structures such as the pumps servicing the PIC, SWP and LWP. Electricians provide 24 hour coverage for emergencies resulting from electrical outages or breakdowns.
8.9.9 Progress with Implementation of Golders Breakout Study A complete revision of the Golder Associates BRDA Risk Assessment and Breakout Study was submitted to the Agency in March 2013 (refer also to Section 8.8.5). The majority of the recommendations in the most recent report are already being implemented and a detailed progress report will be submitted to the Agency in due course as per the timescale in Condition 8.4.16. The contract to install the gabion mattress along the downstream walls of the north and west sides of the Phase 1 BRDA and the west wall of the Phase 2 BRDA has been awarded to InterGeo Ltd for implementation during Quarters 2 and 3 of 2013.
8.9.10 Biennial Audit at the BRDA

Aughinish Alumina Ltd. March 2013 AER 2012
7 0 | P a g e
AAL has submitted to the Agency a proposal outlining the scope of the biennial audit and the frequency of the equivalent Safety Evaluation of Existing Dams (SEED) audit to be undertaken at the BRDA.
8.9.11 Report on Implementation of Extractive Waste Management Plan
RUSAL Aughinish is required under Condition 8.3.1 of the revised IPPC Licence P0035-05 to draw up an Extractive Waste Management Plan for the minimisation, treatment, recovery & disposal of extractive waste in accordance with Regulation 5 of the Waste Management (Management of Waste from Extractive Industries).
8.10 Progress on Bauxite Residue Neutralisation
In 2008, Aughinish Alumina received an updated IPPC licence (P0035-04) which required a study to be undertaken into the feasibility to neutralise or partially neutralise red mud residue. During 2008-2011 studies at the University of Limerick into mud neutralisation concluded that enhanced atmospheric carbonation during mud farming presented the only feasible means of mud partial neutralisation at Aughinish without undermining the environmentally sound dry disposal method employed at the Aughinish BRDA. This conclusion was acknowledged by the EPA and is reflected in the current IPPC licence P0035-05 (October 2012) where Aughinish Alumina is required to implement neutralisation of bauxite residue to the ‘best practicable level’ and preferably via atmospheric carbonation employing mud farming (Conditions 8.4.18/19).
During 2012 mud farming development trials were conducted in BRDA Phase 1 to identify the most suitable tractors, ploughs and re-compaction equipment to undertake enhanced carbonation through mud farming on a full industrial scale. The trials were deemed successful with pH reduction from ~13 in fresh mud to below 11.5. During 2013 the process of industrial mud farming will be implemented in BRDA Phase 1 and gradually in BRDA Phase 2 as the Phase 2 area is commissioned with a protective mud layer above the synthetic liner.
Based on the mud farming trials in 2012 the following outlines how partial neutralisation of red mud via enhanced atmospheric carbonation will be implemented at Aughinish.
Red mud residue from the Aughinish Alumina Bayer process for alumina extraction undergoes water washing and vacuum filtration prior to re-pulping and pumping as a thick paste to the Bauxite Residue Disposal Area (BRDA) for deposition and drying. The combined BRDA area is effectively a large mono-cell and will be divided into 50 operational areas or cells to facilitate short discharge times and thin layer deposition. Red mud will be deposited in one cell at a time to a layer depth of approximately 0.4m. When a mud cell has been filled during 2 -3 days of operation the fresh mud discharge will move to a new cell. After a period of 7-14 days the cell which has been filled with red mud will be ‘amphirolled’ to express residual water from the mud and to aid its compaction. Following 10-15 passes of an amphiroll over a 2-4 month period the mud will reach a steady state compaction level. The typical solids concentration will have increased from 58% up to >70% during this Amphirolling period. This is the most important and time-consuming step in mud farming.
Following Amphirolling the mud cell will be levelled and graded using a tracked bucket excavator to leave the cell ready for aeration and carbonation through

Aughinish Alumina Ltd. March 2013 AER 2012
7 1 | P a g e
ploughing and harrowing. At this point the causticity of the entrained water is typically 70% (i.e. 70% of the soda is present as caustic and the balance is present as sodium carbonate) and the pH is typically 12. By continually exposing red mud and its associated dilute caustic to the CO2 contained in the atmosphere the entrained sodium hydroxide in the mud will convert gradually to sodium carbonate and the pH will reduce. Over the course of approximately 20 passes of the plough/harrow the caustic will gradually carbonate and the pH will reduce to below 11.5. The benefit of reducing causticity and pH is that the mud becomes less corrosive to human tissue and so is less hazardous. At pH below 11.5 it is expected that there will be no corrosive effect on human skin tissue and thus pH 11.5 is considered a benchmark for mud neutralisation.
After partial neutralisation the mud will be re-compacted by means of a vibrating roller to leave the cell ready for the sequence to recommence with deposition of fresh mud. In theory the cycle time available is 120 days between subsequent deposition cycles of fresh mud in a given mud cell.
This new technology of enhanced atmospheric carbonation is being developed at Rusal Aughinish Alumina. It presents a significant challenge given:
The slime nature of red mud (d50 <5 microns) which makes the mud difficult to de-water and difficult to work until it has been adequately de-watered
The quantity of mud to be processed annually (~1.2 million tonnes per annum dry basis)
The Irish weather (extended periods of low rainfall with minimal net evaporation)
As a consequence it will be difficult to implement the full mud farming cycle during the wet winter months when net evaporation (evaporation-rainfall) is negative. However, the greater the area available for mud deposition and drying, the greater the cycle time available within which to neutralise the mud.
At present BRDA Phase 1 with an active area of 55 hectares is almost full while BRDA Phase 2 with an active area of 78 hectares has only recently commenced operation. Once BRDA Phase 1 is exhausted the active drying and carbonation area will reduce by 40% and mud farming logistics will become even more difficult. For this reason we are considering the feasibility to extend the life-time of BRDA Phase 1 by increasing the permitted height by 3 more stage lifts. This issue will be addressed at the end of 2013 when full scale mud farming has been implemented and when BRDA Phase 1 side slopes have been re-vegetated as part of the interim closure works on Phase 1.
8.10.1 Testing Methodology to confirm Bauxite Residue Neutralisation
As per the requirements of IPPC Licence Condition 8.4.20, AAL shall, in due course, submit a proposal to the Agency for agreement on the scope and frequency of the testing methods to be utilised to confirm neutralisation of the bauxite residue by mud farming.

Aughinish Alumina Ltd. March 2013 AER 2012
7 2 | P a g e
8.11 Raw Materials Efficiency and Waste Reduction
AAL continually strives to improve the efficiency of its processes in order to reduce the raw materials consumed and the waste produced. Table 49 shows the volumes of raw materials consumed and waste produced for 2010 and 2011. The relative consumption for each parameter is calculated as the volume consumed per tonne of alumina hydrate produced.
Table 49 Raw Material Efficiency & Waste Reduction
Material 2011
Consumption
Relative Consumption (Volume/tonne
alumina)
2012 Consumption
Relative Consumption (Volume/tonne
alumina)
Alumina Produced (tonnes)
1,922,208 N/A 1,924,385 N/A
Bauxite Ore Consumed
(tonnes) 4,283,084 2.2 4,353,058 2.3
Sodium Hydroxide (tonnes)
115,048 0.06 118,604 0.06
Sulphuric Acid (tonnes)
12,362 0.01 19,919 0.01
Heavy Fuel Oil (tonnes)
148,667 0.1 88,821 0.0
Water (m3) 5,245,081 2.7 5,182,967 2.7
Waste (tonnes)
1,342,802 0.7 1,305,251 0.7
Energy (GJ) 713.8 11.7 725.9 11.9
The increase in the amount of sulphuric acid consumed in 2012 versus 2011 is reflective of the increased volume of industrial effluent neutralised before discharge. This is due primarily to the 80 hectare additional BRDA catchment area.
The reduction in heavy fuel oil consumed during 2012 is due to decreased combustion of the oil in site calciners since they were converted to a dual capability with natural gas.
8.12 Public Information Programme
In accordance with IPPC Licence Condition 2.2.2.7, AAL maintains a public awareness and information programme. As agreed with the Agency, copies of quarterly monitoring reports, monthly complaint reports and annual environmental reports are retained at the gatehouse on the AAL site. This documentation can be reviewed by any member of the public at all reasonable times. AAL held a public meeting with its neighbours on the 18th December 2012. The main items on the agenda were:
Aughinish Alumina plant performance and outlook
BRDA operation.

Aughinish Alumina Ltd. March 2013 AER 2012
Attachment 1 Effluent Toxicity Test Reports

Aughinish Alumina Ltd. March 2013 AER 2012
This page is intentionally blank


Aughinish Alumina Ltd. March 2013 AER 2012
Attachment 2 Waste Analysis Results

Aughinish Alumina Ltd. March 2013 AER 2012
This page is intentionally blank

Waste Monitoring Results
Monthly Report
Description Date IPPCL pH Dry matter Chloride Fluoride Soda
Total
Alkalinity Al* As* Cd* Cr* Cu* Fe* Pb* Mg* Hg* Ni* Ti* Zn*
Limits % mg/Kg mg/Kg mg/Kg mg/Kg CaCO3 mg/Kg mg/Kg mg/Kg mg/Kg mg/Kg mg/Kg mg/Kg mg/Kg mg/Kg mg/Kg mg/Kg mg/Kg
C.4 Red Mud Jan N/A 12.3 58 33 51 6920 11804 22129 0.276 < 0.01 195 3.115 12092 3.92 73.99 0.0184 0.848 6654 7.46Waste
Monitoring Sand Jan N/A 12.2 81 18 50 4832 8389 12520 0.864 < 0.01 152.7 2.06 33386 6.50 324 0.021 2.332 1859 3.96
Salt Cake Jan N/A 13.2 57 2654 744 218002 325166 76778 27.49 < 0.01 0.0887 1.20 16.72 < 0.01 7.03 0.580 1.397 1.112 12.80
Salt Cake Feb N/A 13.1 57 698 716 213116 314571 53279 33.23 < 0.01 < 0.01 0.83 19.26 < 0.01 11.9 0.605 0.58 0.82 1.24
Salt Cake Mar N/A 13.3 56 767 1040 212381 310528
pH -- Chloride Fluoride Soda
Total
Alkalinity Al* As* Cd* Cr* Cu* Fe* Pb* Mg* Hg* Ni* Ti* Zn*
mg/l mg/l mg/l mg/l CaCO3 mg/l µg/l µg/l µg/l µg/l µg/l µg/l mg/l µg/l µg/l µg/l µg/l
Red Mud stack
Leachate Jan N/A 11.0 -- 11 17.2 2200 3401 167.8 223.6 0.669 18.75 19.3 341.7 <0.38 2.914 5.624 3.044 96.2 < 4.6Red Mud stack
Leachate Feb N/A 11.0 -- 64 20.9 2900 5712 176 228 0.441 4.629 6.762 247.8 <0.38 < 0.55 6.764 1.222 56.18 < 4.6Red Mud stack
Leachate Mar N/A 10.8 -- < 1 6.7 3760 3902 193 175.4 0.43 9.64 4.82 62.4 2.60 3.14 5.95 1.84 < 5 < 4.6
pH Dry matter
Organic
matter N P -- Al* As* Cd* Cr* Cu* Fe* Pb* Mg* Hg* Ni* Ti* Zn*
% % mg/l mg/l mg/l µg/l µg/l µg/l µg/l µg/l µg/l mg/l µg/l µg/l µg/l µg/l
Sanitary Sludge Jan N/A 6.6 0.92 99.7 362.9 118.7 -- 258800 89.54 5.697 468.1 5469 33980 75.01 2.914 0.163 163.5 100.1 3335
Sanitary Sludge Feb N/A 7.2 0.79 99.7 344.0 144.5 -- 890.5 3.584 < 0.14 < 0.43 17.37 839.3 < 0.2 15.23 0.05 16.42 < 5 34.24
Sanitary Sludge Mar N/A 7.2 0.87 99.8 394.0 106.0 -- 208.7 0.878 < 0.14 < 0.43 4.186 1320 2.25 17.25 0.031 27.38 < 5 37.91
*Metal analysis and Sanitary Sludge analysis : Fitz Scientific Metal analysis for Salt Cake (March) not available in time for Report
Ref: Q. 1 2012
Emission Point
Reference
Aughinish Alumina Ltd
Licence No. P0035-04
Page 20 of 20
28/03/2013

Waste Monitoring Results
Monthly Report
Description Date IPPCL pH Dry matter Chloride Fluoride Soda
Total
Alkalinity Al* As* Cd* Cr* Cu* Fe* Pb* Mg* Hg* Ni* Ti* Zn*
Limits % mg/Kg mg/Kg mg/Kg mg/Kg CaCO3 mg/Kg mg/Kg mg/Kg mg/Kg mg/Kg mg/Kg mg/Kg mg/Kg mg/Kg mg/Kg mg/Kg mg/Kg
C.4 Red Mud April N/A 11.9 59 14 61 4626 8097 35308 0.459 < 10 219.88 2.385 362 4.62 69.64 < 0.2 0.600 4566 2.39Waste
Monitoring Sand April N/A 11.8 81 7 40 3751 6351 12066 0.756 < 10 131.8 88.41 1623 5.23 230.8 < 0.2 0.695 1736 2.95
Salt Cake April N/A 13.2 57 684 787 218915 321290 76153 26.19 < 10 0.136 1.76 27.56 0.064 10.89 0.533 1.857 1.454 1.55
Salt Cake May N/A 13.2 56 686 797 205853 323176 73370 30.39 < 10 0.15 1.93 20.77 < 10 9.94 0.830 1.49 0.78 2.59
Salt Cake June N/A 13.1 57 658 1381 209395 311333
pH -- Chloride Fluoride Soda
Total
Alkalinity Al* As* Cd* Cr* Cu* Fe* Pb* Mg* Hg* Ni* Ti* Zn*
mg/l mg/l mg/l mg/l CaCO3 mg/l µg/l µg/l µg/l µg/l µg/l µg/l mg/l µg/l µg/l µg/l µg/l
Red Mud stack
Leachate April N/A 11.6 -- 65 31.0 4000 5988 255 575.9 1.20 34.76 39.68 404.8 8.999 0.651 12.82 7.802 76.52 < 4.6Red Mud stack
Leachate May N/A 10.9 -- 91 30.0 5000 7533 5.51 66.74 0.113 1.17 18.34 91.95 20.2 < 0.55 13.79 4.218 < 5 7.337Red Mud stack
Leachate June N/A 11.0 -- 47 36.5 4200 6617 3.60 175.5 1.504 < 0.93 61.22 13.66 0.84 < 0.55 13.58 6.75 < 5 5.46
pH Dry matter
Organic
matter N P -- Al* As* Cd* Cr* Cu* Fe* Pb* Mg* Hg* Ni* Ti* Zn*
% % mg/l mg/l µg/l µg/l µg/l µg/l µg/l µg/l µg/l mg/l µg/l µg/l µg/l µg/l
Sanitary Sludge April N/A 7.2 0.78 99.7 391.4 9.2 -- 96890 35.61 7.289 556.7 3930 21000 91.31 30.89 8.355 330.4 142.2 3540
Sanitary Sludge May N/A 7.2 0.79 99.7 304.9 4.1 -- 104600 24.46 8.189 539.2 4352 37750 112.4 40.07 7.07 283.4 62.15 3992
Sanitary Sludge June N/A 7.2 0.57 99.8 257.1 43.2 -- 60790 40.47 5.814 316 3188 22340 57.35 36.97 5.767 157.3 116.5 2954
*Metal analysis and Sanitary Sludge analysis : Fitz Scientific Metal analysis for Salt Cake (June) not available in time for Report
Ref: Q. 2 2012
Emission Point
Reference
Aughinish Alumina Ltd
Licence No. P0035-04
Page 20 of 20
28/03/2013
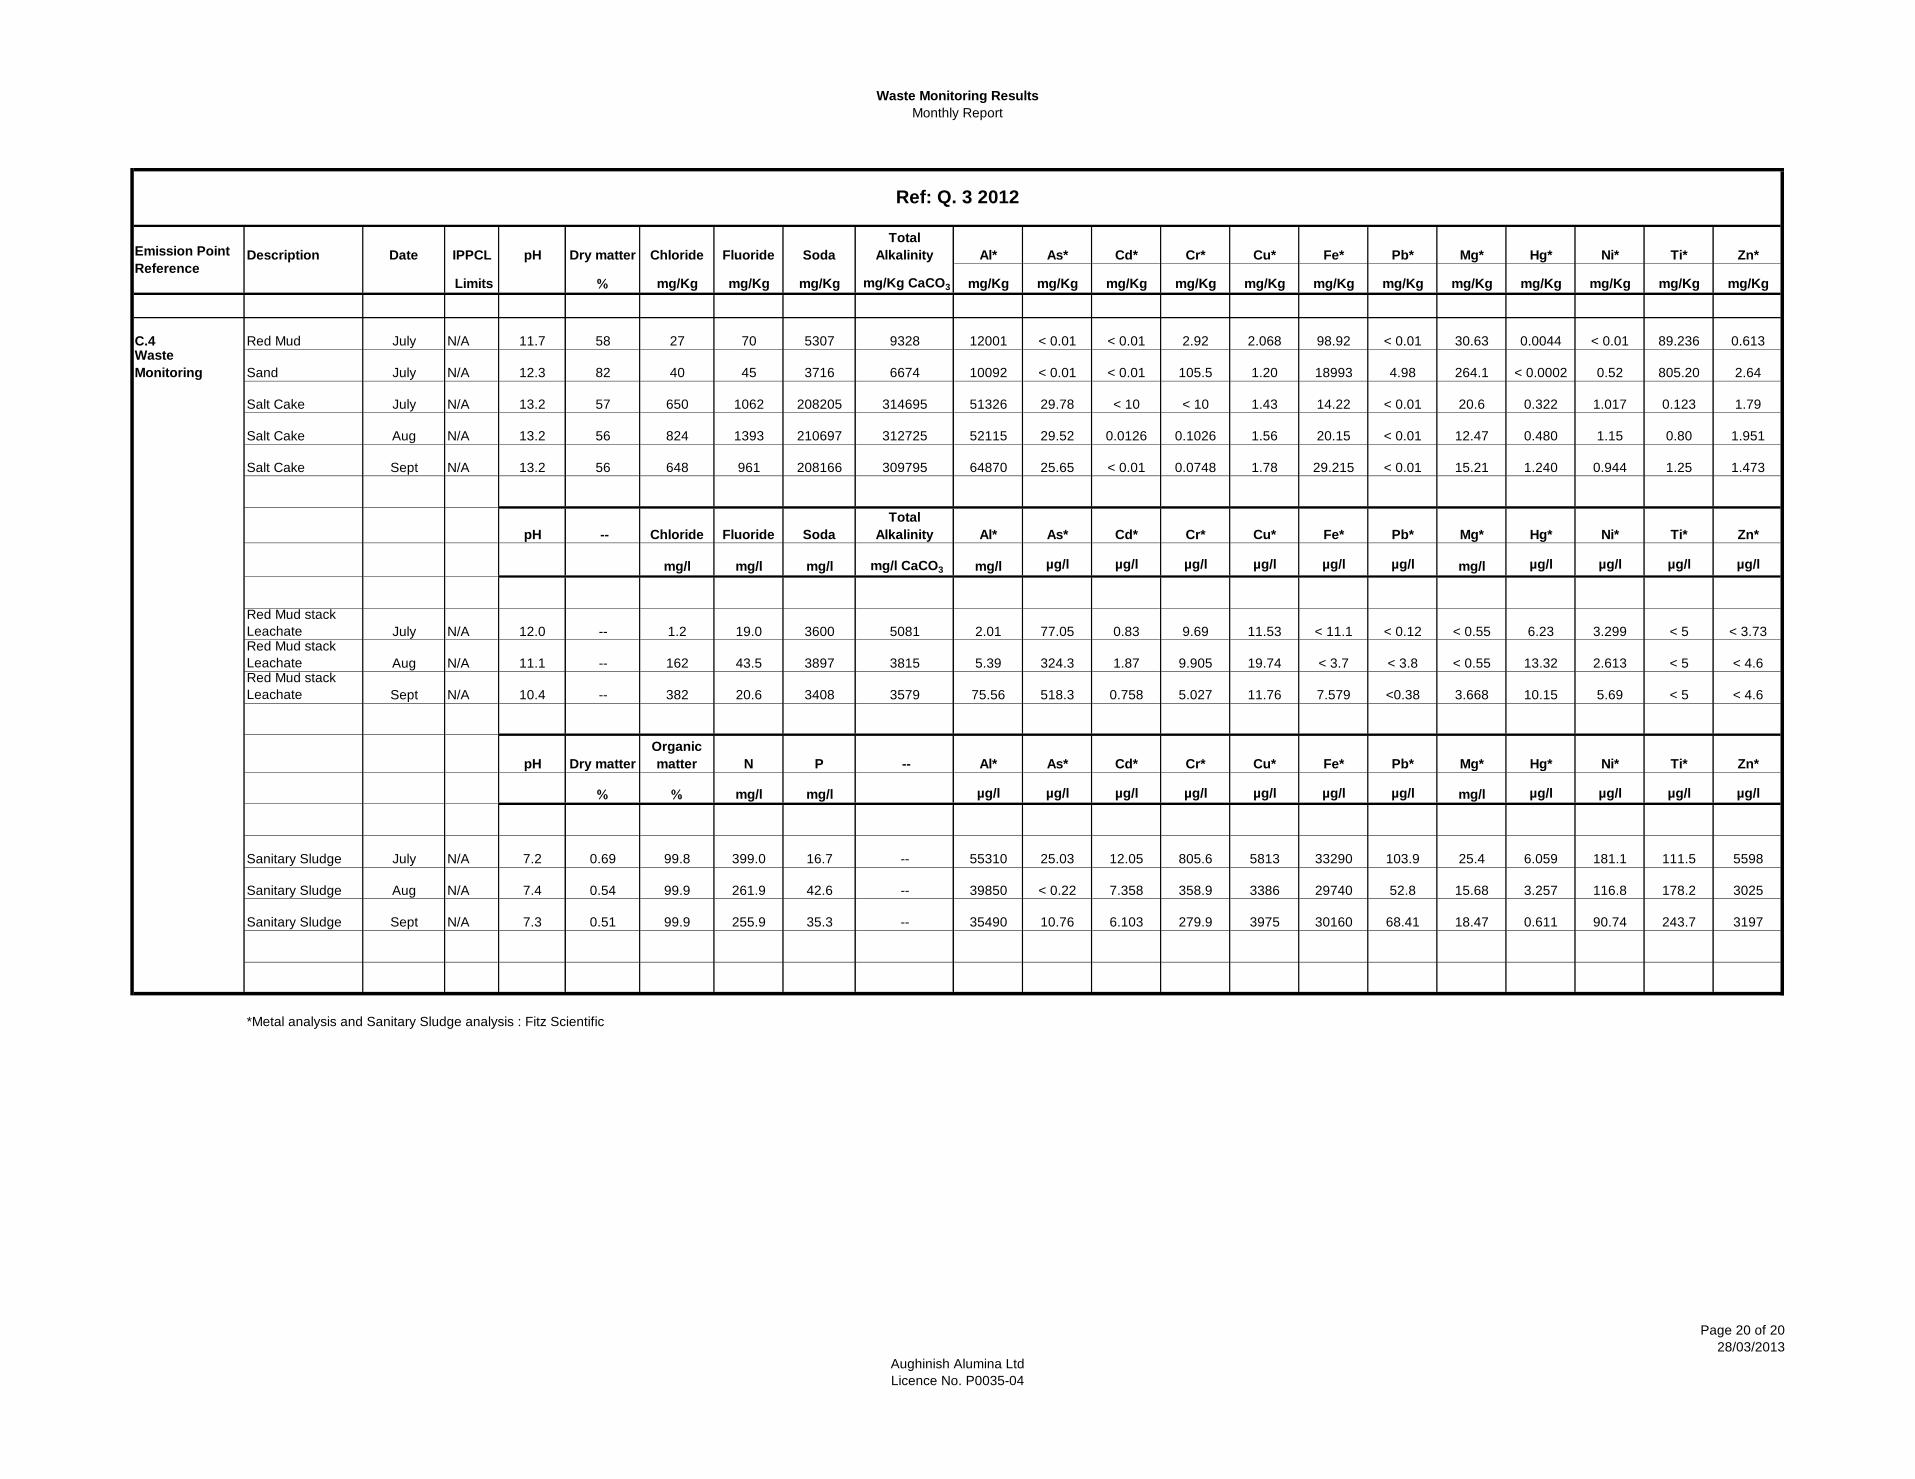
Waste Monitoring Results
Monthly Report
Description Date IPPCL pH Dry matter Chloride Fluoride Soda
Total
Alkalinity Al* As* Cd* Cr* Cu* Fe* Pb* Mg* Hg* Ni* Ti* Zn*
Limits % mg/Kg mg/Kg mg/Kg mg/Kg CaCO3 mg/Kg mg/Kg mg/Kg mg/Kg mg/Kg mg/Kg mg/Kg mg/Kg mg/Kg mg/Kg mg/Kg mg/Kg
C.4 Red Mud July N/A 11.7 58 27 70 5307 9328 12001 < 0.01 < 0.01 2.92 2.068 98.92 < 0.01 30.63 0.0044 < 0.01 89.236 0.613Waste
Monitoring Sand July N/A 12.3 82 40 45 3716 6674 10092 < 0.01 < 0.01 105.5 1.20 18993 4.98 264.1 < 0.0002 0.52 805.20 2.64
Salt Cake July N/A 13.2 57 650 1062 208205 314695 51326 29.78 < 10 < 10 1.43 14.22 < 0.01 20.6 0.322 1.017 0.123 1.79
Salt Cake Aug N/A 13.2 56 824 1393 210697 312725 52115 29.52 0.0126 0.1026 1.56 20.15 < 0.01 12.47 0.480 1.15 0.80 1.951
Salt Cake Sept N/A 13.2 56 648 961 208166 309795 64870 25.65 < 0.01 0.0748 1.78 29.215 < 0.01 15.21 1.240 0.944 1.25 1.473
pH -- Chloride Fluoride Soda
Total
Alkalinity Al* As* Cd* Cr* Cu* Fe* Pb* Mg* Hg* Ni* Ti* Zn*
mg/l mg/l mg/l mg/l CaCO3 mg/l µg/l µg/l µg/l µg/l µg/l µg/l mg/l µg/l µg/l µg/l µg/l
Red Mud stack
Leachate July N/A 12.0 -- 1.2 19.0 3600 5081 2.01 77.05 0.83 9.69 11.53 < 11.1 < 0.12 < 0.55 6.23 3.299 < 5 < 3.73Red Mud stack
Leachate Aug N/A 11.1 -- 162 43.5 3897 3815 5.39 324.3 1.87 9.905 19.74 < 3.7 < 3.8 < 0.55 13.32 2.613 < 5 < 4.6Red Mud stack
Leachate Sept N/A 10.4 -- 382 20.6 3408 3579 75.56 518.3 0.758 5.027 11.76 7.579 <0.38 3.668 10.15 5.69 < 5 < 4.6
pH Dry matter
Organic
matter N P -- Al* As* Cd* Cr* Cu* Fe* Pb* Mg* Hg* Ni* Ti* Zn*
% % mg/l mg/l µg/l µg/l µg/l µg/l µg/l µg/l µg/l mg/l µg/l µg/l µg/l µg/l
Sanitary Sludge July N/A 7.2 0.69 99.8 399.0 16.7 -- 55310 25.03 12.05 805.6 5813 33290 103.9 25.4 6.059 181.1 111.5 5598
Sanitary Sludge Aug N/A 7.4 0.54 99.9 261.9 42.6 -- 39850 < 0.22 7.358 358.9 3386 29740 52.8 15.68 3.257 116.8 178.2 3025
Sanitary Sludge Sept N/A 7.3 0.51 99.9 255.9 35.3 -- 35490 10.76 6.103 279.9 3975 30160 68.41 18.47 0.611 90.74 243.7 3197
*Metal analysis and Sanitary Sludge analysis : Fitz Scientific
Ref: Q. 3 2012
Emission Point
Reference
Aughinish Alumina Ltd
Licence No. P0035-04
Page 20 of 20
28/03/2013

Waste Monitoring Results
Monthly Report
Description Date IPPCL pH Dry matter Chloride Fluoride Soda
Total
Alkalinity Al* As* Cd* Cr* Cu* Fe* Pb* Mg* Hg* Ni* Ti* Zn*
Limits % mg/Kg mg/Kg mg/Kg mg/Kg CaCO3 mg/Kg mg/Kg mg/Kg mg/Kg mg/Kg mg/Kg mg/Kg mg/Kg mg/Kg mg/Kg mg/Kg mg/Kg
C.4 Red Mud Oct N/A 12.4 59 26 71 5685 9996 32790 0.063 < 10 256.509 2.739 10780.30 5.058 41.21 < 0.0002 0.707 1550 1.23Waste
Monitoring Sand Oct N/A 12.2 81 6 37 3419 6220 8754 < 10 < 10 44.4 1.47 14795 5.70 254.54 < 0.0002 0.700 74.97 3.07
Salt Cake Oct N/A 13.3 56 613 1055 196928 315819 2272 24.79 < 10 0.129 2.07 34.03 < 10 13.54 0.402 1.469 2.047 2.31
pH -- Chloride Fluoride Soda
Total
Alkalinity Al* As* Cd* Cr* Cu* Fe* Pb* Mg* Hg* Ni* Ti* Zn*
mg/l mg/l mg/l mg/l CaCO3 mg/l µg/l µg/l µg/l µg/l µg/l µg/l mg/l µg/l µg/l µg/l µg/l
Red Mud stack
Leachate Oct N/A 10.7 -- 72.8 29.5 4200 4434 113 387.2 0.70 40.71 40.11 110.6 1.167 1.706 8.47 9.373 115.2 < 4.6Red Mud stack
Leachate Nov N/A 11.3 -- 2980 27.44 26.64 0.278 8.954 10.75 < 3.7 < 3.8 < 0.55 0.706 3.337 14.45 < 4.6
pH Dry matter
Organic
matter N P -- Al* As* Cd* Cr* Cu* Fe* Pb* Mg* Hg* Ni* Ti* Zn*
% % mg/l mg/l µg/l µg/l µg/l µg/l µg/l µg/l µg/l mg/l µg/l µg/l µg/l µg/l
Sanitary Sludge Oct N/A 7.1 0.63 99.9 344.0 39.2 -- 52150 14.8 7.638 318.8 4996 32710 108.2 16.27 7.737 138.3 95.76 4051
Sanitary Sludge Nov N/A 7.3 0.94 99.8 415.8 2.7 -- 55010 26.41 7.38 301.1 7283 32500 44.56 26.78 5.06 186.9 87.22 4633
*Metal analysis and Sanitary Sludge analysis : Fitz Scientific
Ref: Q. 4 2012
Emission Point
Reference
Aughinish Alumina Ltd
Licence No. P0035-04
Page 19 of 19
28/03/2013

Aughinish Alumina Ltd. March 2013 AER 2012
Attachment 3 Energy Efficiency Report 2012

Aughinish Alumina Ltd. March 2013 AER 2012
This page is intentionally blank

Energy Efficiency Report 2012
RUSAL Aughinish
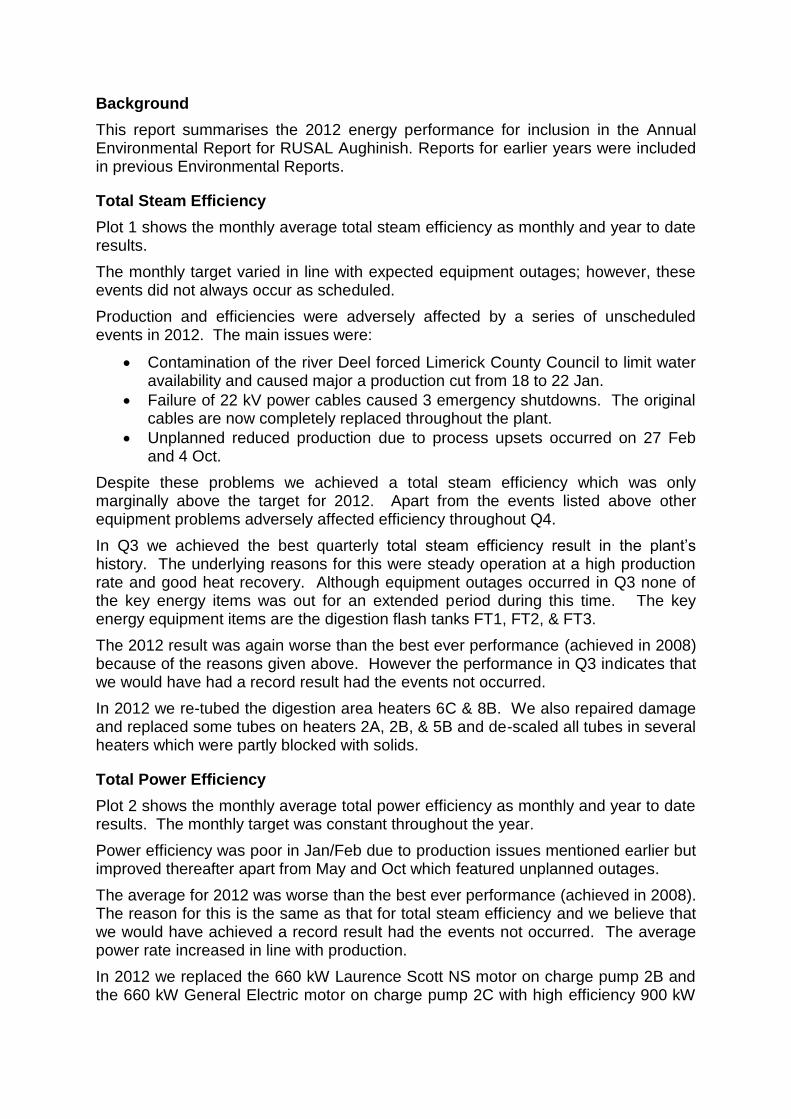
Background
This report summarises the 2012 energy performance for inclusion in the Annual Environmental Report for RUSAL Aughinish. Reports for earlier years were included in previous Environmental Reports.
Total Steam Efficiency
Plot 1 shows the monthly average total steam efficiency as monthly and year to date results.
The monthly target varied in line with expected equipment outages; however, these events did not always occur as scheduled.
Production and efficiencies were adversely affected by a series of unscheduled events in 2012. The main issues were:
Contamination of the river Deel forced Limerick County Council to limit water availability and caused major a production cut from 18 to 22 Jan.
Failure of 22 kV power cables caused 3 emergency shutdowns. The original cables are now completely replaced throughout the plant.
Unplanned reduced production due to process upsets occurred on 27 Feb and 4 Oct.
Despite these problems we achieved a total steam efficiency which was only marginally above the target for 2012. Apart from the events listed above other equipment problems adversely affected efficiency throughout Q4.
In Q3 we achieved the best quarterly total steam efficiency result in the plant’s history. The underlying reasons for this were steady operation at a high production rate and good heat recovery. Although equipment outages occurred in Q3 none of the key energy items was out for an extended period during this time. The key energy equipment items are the digestion flash tanks FT1, FT2, & FT3.
The 2012 result was again worse than the best ever performance (achieved in 2008) because of the reasons given above. However the performance in Q3 indicates that we would have had a record result had the events not occurred.
In 2012 we re-tubed the digestion area heaters 6C & 8B. We also repaired damage and replaced some tubes on heaters 2A, 2B, & 5B and de-scaled all tubes in several heaters which were partly blocked with solids.
Total Power Efficiency
Plot 2 shows the monthly average total power efficiency as monthly and year to date results. The monthly target was constant throughout the year.
Power efficiency was poor in Jan/Feb due to production issues mentioned earlier but improved thereafter apart from May and Oct which featured unplanned outages.
The average for 2012 was worse than the best ever performance (achieved in 2008). The reason for this is the same as that for total steam efficiency and we believe that we would have achieved a record result had the events not occurred. The average power rate increased in line with production.
In 2012 we replaced the 660 kW Laurence Scott NS motor on charge pump 2B and the 660 kW General Electric motor on charge pump 2C with high efficiency 900 kW

Siemens units. The only remaining NS motors are on the 5th stage injection pumps. We have no plans to replace them in the immediate future.
Other Energy Issues
We operated the 3 calciners on natural gas throughout 2012; this reduced CO2 emissions and cost.
In 2012 we completed engineering design on a project to install 2 new gas fired boilers, each with a capacity of 150 t/hr steam. RUSAL approved the project in Dec. We placed the order in March 2013 and will start installation onsite during Q1 2014. The gas boilers will reduce CO2 emissions and energy cost but we will retain the option of using the oil fired boilers when required.
We again qualified as a high quality CHP site under the UK CHPQA Self-assessment Scheme. We are also certified as high efficiency CHP through the Commission for Energy Regulation’s scheme.
We made no further progress on the prototype inter-condenser in Area 41.
Energy Management System
In 2004 Aughinish implemented an Energy Management System (EnMS) based on the Danish Standard DS2403. We were the first company in Ireland and the first alumina plant in the world to implement such a system. Follow-up audits through to 2008 confirmed that we met the standard’s requirements.
In 2009 we ceased all external audits as part of a cost cutting program to ensure the plant’s survival. However, we retained the structures on DS2403 in terms of monitoring energy performance and planning improvements. Also in 2009 the European Standard EN16001 replaced DS2403, which became obsolete. In 2011 ISO50001 replaced EN16001, which in turn became obsolete.
Given the changes which were occurring at the time we decided to await the formal release of ISO50001 before resuming external auditing. In Dec 2012 we underwent a stage 1 audit with Certification Europe and in 2013 we plan to complete a stage 2 audit and have our EnMS certified as compliant with the ISO 50001 standard.

Energy Programme for 2013
The main projects affecting heat recovery are:
Implement the Advanced Wash Project This redirects most of the first washer overflow stream from the blow-off area to the first growth tank in the precipitation area. It de-bottlenecks the blow-off pumps and decanters, facilitating an increase in production. Steam use will increase slightly because of a lower liquor temperature but the higher production will improve total steam usage efficiency.
Operate with 3 sweetening pumps online We currently have 3 sweetening pumps, 32C/D/E, with any 2 in service and the third out for maintenance or on standby. We will install a facility to run all 3 pumps simultaneously. This will increase the production from sweetening, which is more energy efficient. We will still have to run 2 pumps when maintenance is required on the 3rd pump.
Replace 12C Boiler Feed Water Heater with a new unit. We installed 12C heater in 2000 to heat boiler feed water from 80 to 120 C. It has no standby and the cost impact of taking it out for maintenance and/or cleaning is prohibitive. Heater performance has deteriorated and it now only delivers 100 C. The new heater will be installed in Q2. It is a replacement for the original which we will re-tube onsite and re-install in 3-4 years.
Improve steam efficiency when significant equipment is out of service. Although we achieved 5.59 GJ/t total steam usage efficiency in Q3 the usage is greater when key equipment is not in service. We will identify and implement procedure to minimise the impact of such outages on energy usage efficiency.
Re-tube two heaters in the digestion area.
Continue test work on the Area 41 inter-condenser.
The production target for 2013 is 1,990,000 t. We expect to achieve a total steam efficiency which will be better than that achieved in 2008, our best ever annual performance.
We have no significant projects affecting power. The higher production will improve total power efficiency and we expect to achieve a value better than that in 2008, which was also our best ever performance.

Plot 1 - Total Steam Efficiency in 2012
Plot 2 - Total Power Efficiency in 2012

Aughinish Alumina Ltd. March 2013 AER 2012
This page is intentionally blank

Aughinish Alumina Ltd. March 2013 AER 2012
Attachment 4 AER/PRTR Emissions Data Information

Aughinish Alumina Ltd. March 2013 AER 2012
This page is intentionally blank

| PRTR# : P0035 | Facility Name : Aughinish Alumina Limited | Filename :
P0035_2012.xls | Return Year : 2012 | 3013 28/03/2013 13:22
Guidance to completing the PRTR workbook
Version 1.1.16
REFERENCE YEAR 2012
1. FACILITY IDENTIFICATION
Parent Company Name Aughinish Alumina Limited
Facility Name Aughinish Alumina Limited
PRTR Identification Number P0035
Licence Number P0035-05
Waste or IPPC Classes of Activity
No. class_name
30.10 General
11.1
The recovery or disposal of waste in a facility, within the meaning of
the Act of 1996, which facility is connected or associated with
another activity specified in this Schedule in respect of which a
licence or revised licence under Part IV is in force or in respect of
which a licence under the said Part is or will be required.
2.2
The burning of any fuel in a boiler or furnace with a nominal heat
output exceeding 50MW
Address 1 Askeaton Island
Address 2 Askeaton
Address 3 County Limerick
Address 4
Limerick
Country Ireland
Coordinates of Location -9.05928 52.6243
River Basin District IEGBNISH
NACE Code 2442
Main Economic Activity Aluminium production
AER Returns Contact Name Liam Fleming
AER Returns Contact Email Address [email protected]
AER Returns Contact Position Environmental Coordinator
AER Returns Contact Telephone Number 061 604232
AER Returns Contact Mobile Phone Number
AER Returns Contact Fax Number 061 604090
Production Volume 0.0
Production Volume Units
Number of Installations 0
Number of Operating Hours in Year 0
Number of Employees 0
User Feedback/Comments
Web Address
2. PRTR CLASS ACTIVITIES
Activity Number Activity Name
4(b)
Gases, such as ammonia, chlorine or hydrogen chloride,fluorine or
hydrogen fluoride, carbon oxides, sulphur compounds,nitrogen
oxides, hydrogen, sulphur dioxide, carbonyl chloride,Acids, such as
chromic acid, hydrofluoric acid, phosphoric acid, nitric acid,
hydrochloric acid, sulphuric acid, oleum, sulphurous acids,Bases,
such as ammonium hydroxide, potassium hydroxide, sodium
hydroxide,Salts, such as ammonium chloride, potassium chlorate,
potassium carbonate, sodium carbonate, perborate...
5(a) Installations for the recovery or disposal of hazardous waste
5(d) Landfills
50.1 General
3. SOLVENTS REGULATIONS (S.I. No. 543 of 2002)
Is it applicable? No
Have you been granted an exemption ?
If applicable which activity class applies (as per
Schedule 2 of the regulations) ?
Is the reduction scheme compliance route being
used ?
4. WASTE IMPORTED/ACCEPTED ONTO SITE Guidance on waste imported/accepted onto site
Do you import/accept waste onto your site for on-
site treatment (either recovery or disposal
activities) ? No
This question is only applicable if you are an IPPC or Quarry site
AER Returns Workbook

4.1 RELEASES TO AIR Link to previous years emissions data | PRTR# : P0035 | Facility Name : Aughinish Alumina Limited | Filename : P0035_2012.xls | Return Year : 2012 | 28/03/2013 13:22
8 11 19 19 27 27 6 14 6 6 6 6 10
SECTION A : SECTOR SPECIFIC PRTR POLLUTANTS
Please enter all quantities in this section in KGs
QUANTITY
Boiler House (Emission
Point Reference No: A1) Calciner Stack (A2)
Gas Turbines (A3-A &
A3-B)
Bauxite Crusher
Scrubber Exhaust
(6)
Alumina Loader
Dust Fan (11)
Alumina Loader
Dust Fan (12)
Alumina Silo's
Exhaust Fan (17)
Alumina
Silo's
Exhaust
Fan (18)
Alumina
Silo's
Exhaust
Fans (19
& 20)
No. Annex II Name M/C/E Method Code Designation or Description Emission Point 1 Emission Point 2 Emission Point 3 Emission Point 4 Emission Point 5 Emission Point 6 Emission Point 7
Emission
Point 8
Emission
Point 9
T (Total)
KG/Year
A
(Accidental)
KG/Year
F
(Fugitive)
KG/Year
08 Nitrogen oxides (NOx/NO2) C OTH
Calculation based on fuel
usage & continous
monitoring (boilers & gas
turbines) 610032.6 538506.8 297448.0 0.0 0.0 0.0 0.0 0.0 0.0 1445987.4 0.0 0.0
11 Sulphur oxides (SOx/SO2) C OTH
Calculation based on fuel
usage 1620128.2 0.0 10000.0 0.0 0.0 0.0 0.0 0.0 0.0 1630128.2 0.0 0.0
86 Particulate matter (PM10) C OTH
Calculation based on fuel
usage 37525.0 97544.1 0.0 1495.4 95.1 1285.7 1889.9 1652.4 2162.7 143650.3 0.0 0.0
03 Carbon dioxide (CO2) C ETS 288904437.0 313365278.9 758495891.8 0.0 0.0 0.0 0.0 0.0 0.0 ######### 0.0 0.0
* Select a row by double-clicking on the Pollutant Name (Column B) then click the delete button
SECTION B : REMAINING PRTR POLLUTANTS
Please enter all quantities in this section in KGs
QUANTITY
No. Annex II Name M/C/E Method Code Designation or Description Emission Point 1 T (Total) KG/Year A (Accidental) KG/Year F (Fugitive) KG/Year
0.0 0.0 0.0 0.0
* Select a row by double-clicking on the Pollutant Name (Column B) then click the delete button
SECTION C : REMAINING POLLUTANT EMISSIONS (As required in your Licence)
Please enter all quantities in this section in KGs
QUANTITY
Pollutant No. Name M/C/E Method Code Designation or Description Emission Point 1 T (Total) KG/Year A (Accidental) KG/Year F (Fugitive) KG/Year
0.0 0.0 0.0 0.0
* Select a row by double-clicking on the Pollutant Name (Column B) then click the delete button
Additional Data Requested from Landfill operators
Landfill: Aughinish Alumina Limited
Please enter summary data on the
quantities of methane flared and / or
utilised
additional_pollutant_no T (Total) kg/Year M/C/E Method Code
Designation or
Description
Facility Total Capacity m3
per hour
Total estimated methane generation (as per
site model) 0.0 N/A
Methane flared 0.0 0.0 (Total Flaring Capacity)
Methane utilised in engine/s 0.0 0.0 (Total Utilising Capacity)
Net methane emission (as reported in Section
A above) 0.0 N/A
POLLUTANT METHOD
Method Used
For the purposes of the National Inventory on Greenhouse Gases, landfill operators are requested to provide summary data on landfill gas (Methane)
flared or utilised on their facilities to accompany the figures for total methane generated. Operators should only report their Net methane (CH4)
emission to the environment under T(total) KG/yr for Section A: Sector specific PRTR pollutants above. Please complete the table below:
Method Used
Method Used
RELEASES TO AIR
POLLUTANT METHOD
Method Used
POLLUTANT
RELEASES TO AIR
RELEASES TO AIR
METHOD

4.2 RELEASES TO WATERS Link to previous years emissions data | PRTR# : P0035 | Facility Name : Aughinish Alumina Limited | Filename : P0035_2012.xls | Return Year : 2012 | 28/03/2013 13:22
8 15 23 23 31 36 6 6 6 6 6 7 36
SECTION A : SECTOR SPECIFIC PRTR POLLUTANTS Data on ambient monitoring of storm/surface water or groundwater, conducted as part of your licence requirements, should NOT be submitted under AER / PRTR Reporting as this only concerns Releases from your facility
Please enter all quantities in this section in KGs
QUANTITY
Industrial Effluent (W1-1)
No. Annex II Name M/C/E Method Code Designation or Description Emission Point 1 T (Total) KG/Year A (Accidental) KG/Year F (Fugitive) KG/Year
17 Arsenic and compounds (as As) M OTH APHA SMEW & WW 3125 197.3 197.3 0.0 0.0
18 Cadmium and compounds (as Cd) M OTH APHA SMEW & WW 3126 3.2 0.0 0.0 0.0
19 Chromium and compounds (as Cr) M OTH APHA SMEW & WW 3127 21.4 0.0 0.0 0.0
20 Copper and compounds (as Cu) M OTH APHA SMEW & WW 3128 35.4 0.0 0.0 0.0
21 Mercury and compounds (as Hg) M OTH APHA SMEW & WW 3129 24.9 0.0 0.0 0.0
22 Nickel and compounds (as Ni) M OTH APHA SMEW & WW 3130 41.3 0.0 0.0 0.0
23 Lead and compounds (as Pb) M OTH APHA SMEW & WW 3131 23.2 0.0 0.0 0.0
24 Zinc and compounds (as Zn) M OTH APHA SMEW & WW 3132 32.7 0.0 0.0 0.0
* Select a row by double-clicking on the Pollutant Name (Column B) then click the delete button
SECTION B : REMAINING PRTR POLLUTANTS
Please enter all quantities in this section in KGs
QUANTITY
No. Annex II Name M/C/E Method Code Designation or Description Emission Point 1 T (Total) KG/Year A (Accidental) KG/Year F (Fugitive) KG/Year
0.0 0.0 0.0 0.0
* Select a row by double-clicking on the Pollutant Name (Column B) then click the delete button
SECTION C : REMAINING POLLUTANT EMISSIONS (as required in your Licence)
Please enter all quantities in this section in KGs
QUANTITY
Industrial Effluent (W1-1) Sanitary Effluent
Pollutant No. Name M/C/E Method Code Designation or Description Emission Point 1 Emission Point 2 T (Total) KG/Year
A (Accidental)
KG/Year
F
(Fugitive)
KG/Year
355 Aluminium M OTH APHA SMEW & WW 3125 6698.1 0.0 6698.1 0.0 0.0
303 BOD M OTH
APHA SMEW & WW
2540D 425597.0 72.2 425669.2 0.0 0.0
314 Fats, Oils and Greases M OTH
APHA SMEW & WW
2540D 4989.3 0.0 4989.3 0.0 0.0
357 Iron M OTH APHA SMEW & WW 3126 308.8 0.0 308.8 0.0 0.0
240 Suspended Solids M OTH
APHA SMEW & WW
2540D 56961.1 40.5 57001.6 0.0 0.0
320 Magnesium M OTH APHA SMEW & WW 3127 29278.4 0.0 29278.4 0.0 0.0
* Select a row by double-clicking on the Pollutant Name (Column B) then click the delete button
RELEASES TO WATERS
Method Used
RELEASES TO WATERS
RELEASES TO WATERS
Method Used
POLLUTANT
Method Used
POLLUTANT
POLLUTANT

4.3 RELEASES TO WASTEWATER OR SEWER Link to previous years emissions data | PRTR# : P0035 | Facility Name : Aughinish Alumina Limited | Filename : P0035_2012.xls | Return Year : 2012 | 28/03/2013 13:22
8 8 16 16 6 6 6 6
SECTION A : PRTR POLLUTANTS
Please enter all quantities in this section in KGs
QUANTITY
No. Annex II Name M/C/E Method Code Designation or Description Emission Point 1 T (Total) KG/Year A (Accidental) KG/Year F (Fugitive) KG/Year
0.0 0.0 0.0 0.0
* Select a row by double-clicking on the Pollutant Name (Column B) then click the delete button
SECTION B : REMAINING POLLUTANT EMISSIONS (as required in your Licence)
Please enter all quantities in this section in KGs
QUANTITY
Pollutant No. Name M/C/E Method Code Designation or Description Emission Point 1 T (Total) KG/Year A (Accidental) KG/Year F (Fugitive) KG/Year
0.0 0.0 0.0 0.0
* Select a row by double-clicking on the Pollutant Name (Column B) then click the delete button
OFFSITE TRANSFER OF POLLUTANTS DESTINED FOR WASTE-WATER TREATMENT OR SEWER
OFFSITE TRANSFER OF POLLUTANTS DESTINED FOR WASTE-WATER TREATMENT OR SEWER
Method Used
Method Used
POLLUTANT METHOD
POLLUTANT METHOD

4.4 RELEASES TO LAND Link to previous years emissions data | PRTR# : P0035 | Facility Name : Aughinish Alumina Limited | Filename : P0035_2012.xls | Return Year : 2012 | 28/03/2013 13:22
8 8 16 16 6 6 6 6
SECTION A : PRTR POLLUTANTS
Please enter all quantities in this section in KGs
QUANTITY
No. Annex II Name M/C/E Method Code Designation or Description Emission Point 1 T (Total) KG/Year A (Accidental) KG/Year
0.0 0.0 0.0
* Select a row by double-clicking on the Pollutant Name (Column B) then click the delete button
SECTION B : REMAINING POLLUTANT EMISSIONS (as required in your Licence)
Please enter all quantities in this section in KGs
QUANTITY
Pollutant No. Name M/C/E Method Code Designation or Description Emission Point 1 T (Total) KG/Year A (Accidental) KG/Year
0.0 0.0 0.0
* Select a row by double-clicking on the Pollutant Name (Column B) then click the delete button
POLLUTANT METHOD
Method Used
RELEASES TO LAND
RELEASES TO LAND
POLLUTANT METHOD
Method Used

5. ONSITE TREATMENT & OFFSITE TRANSFERS OF WASTE | PRTR# : P0035 | Facility Name : Aughinish Alumina Limited | Filename : P0035_2012.xls | Return Year : 2012 | 29/03/2013 14:21
5 39 Please enter all quantities on this sheet in Tonnes 0
Quantity
(Tonnes per
Year)
Haz Waste : Name and
Licence/Permit No of Next Destination
Facility Non Haz Waste:
Name and Licence/Permit No of
Recover/Disposer
Haz Waste : Address of Next
Destination Facility
Non Haz Waste: Address of
Recover/Disposer
Name and License / Permit No. and
Address of Final Recoverer / Disposer
(HAZARDOUS WASTE ONLY)
Actual Address of Final Destination i.e.
Final Recovery / Disposal Site
(HAZARDOUS WASTE ONLY)
Transfer Destination
European Waste
Code Hazardous Q uant it y T/ Year Description of Waste
Waste
Treatment
Operation M/C/E Method Used
Location of
Treatment Nam e and Licence / Per m it No. of Recover er / Disposer / Br oker Addr ess of Recover er / Disposer / Br oker Nam e and Addr ess of Final Dest inat ion i. e. Final Recover y / Disposal Sit e ( HAZARDO US WASTE O NLY) Licence / Per m it No. of Final Dest inat ion i. e. Final Recover y / Disposal Sit e ( HAZARDO US WASTE O NLY)
Within the Country 01 03 07 Yes 15808.0 salt cake D1 C Volume Calculation Onsite of generation
Aughinish Alumina Ltd.,IPPC
Licence P0035-05
Aughinish
Island,Askeaton,Askeaton,Co
Limerick,Ireland
Aughinish Alumina ,IPPC
Licence P0035-05,Aughinish
Island,.,Askeaton,Co.
Limerick,Ireland
Aughinish
Island,.,Askeaton,Co.
Limerick,Ireland
Within the Country 01 03 99 No 5590.0 lime grits D1 C Volume Calculation Onsite of generation
Aughinish Alumina Ltd.,IPPC
Licence P0035-05
Aughinish
Island,Askeaton,Askeaton,Co
Limerick,Ireland
Within the Country 01 03 99 No 16709.0 process wastes (sand, scales, tank sludges) D1 C Volume Calculation Onsite of generation
Aughinish Alumina Ltd.,IPPC
Licence P0035-05
Aughinish
Island,Askeaton,Askeaton,Co
Limerick,Ireland
Within the Country 01 03 99 No 1183358.0 red mud D1 C Volume Calculation Onsite of generation
Aughinish Alumina Ltd.,IPPC
Licence P0035-05
Aughinish
Island,Askeaton,Askeaton,Co
Limerick,Ireland
Within the Country 13 07 01 Yes 38.4 waste oil and diesel D9 M Volume Calculation Offsite in Ireland
Rilta Environmental
Ltd,W0192-03
Greenogue Business
Park,Rathcoole,Co.
Dublin,Co. Dublin,Ireland
Rilta Environmental
Ltd,W0192-03
Greenogue Business
Park,Rathcoole,Co.
Dublin,Co. Dublin,Ireland
Within the Country 13 08 99 Yes 10.0 oily rags/spent oil dry absorbent R9 C Weighed Offsite in Ireland
Rilta Environmental
Ltd,W0192-03
Greenogue Business
Park,Rathcoole,Co.
Dublin,Co. Dublin,Ireland
Rilta Environmetnal
Ltd,W0192-03,Greenogue
Business Park,Rathcoole,Co.
Dublin,.,Ireland
Greenogue Business
Park,Rathcoole,Co.
Dublin,.,Ireland
Within the Country 15 01 04 No 12.5 metallic packaging/drums R4 M Weighed Offsite in Ireland
Rilta Environmental
Ltd,W0192-03
Greenogue Business
Park,Rathcoole,Co.
Dublin,Co. Dublin,Ireland
Within the Country 16 02 14 No 3.0
waste electrical & electronic equipment
(WEEE) R4 M Weighed Offsite in Ireland Greenstar,W0082-02
Dock Road,Dock
Raod,Limerick,Limerick,Irelan
d
Within the Country 16 06 01 Yes 8.62 lead batteries R4 C Weighed Offsite in Ireland
Rilta Environmental
Ltd,W0192-03
Greenogue Business
Park,Rathcoole,Co.
Dublin,Co. Dublin,Ireland
Rilta Environmental
Ltd,W0192-03
Greenogue Business
Park,Rathcoole,Co.
Dublin,Co. Dublin,Ireland
Within the Country 16 11 04 No 80.0 flue stack residue - refractory waste D1 C Volume Calculation Onsite of generation
Aughinish Alumina Ltd.,IPPC
Licence P0035-05
Aughinish
Island,Askeaton,Askeaton,Co
Limerick,Ireland
Within the Country 17 04 01 No 28.3 copper R4 M Weighed Offsite in Ireland
Hegarty Metals
Recycling,WFP-LKC-11-001-
01
Ballysimon Road,Ballysimon
Road,Limerick,Limerick,Irelan
d
Within the Country 17 04 07 No 918.3 mixed metals R4 M Weighed Offsite in Ireland
Hegarty Metals
Recycling,WFP-LKC-11-001-
01
Ballysimon Road,Ballysimon
Road,Limerick,Limerick,Irelan
d
Within the Country 18 01 04 No 0.028 clinical waste D1 M Weighed Offsite in Ireland SRCL,W0055-02
420-430 Beech
Road,Western Industrial
Estate,Naas Road,Dublin
12,Ireland
Within the Country 19 08 05 No 381.9 sludges from treatment of urban waste water D2 C Volume Calculation Onsite of generation
Aughinish Alumina Ltd.,IPPC
Licence P0035-05
Aughinish
Island,Askeaton,Askeaton,Co
Limerick,Ireland
Within the Country 19 12 04 No 31.5 rubber hosing R11 M Weighed Offsite in Ireland Greenstar,W0082-02
Dock Road,Dock
Raod,Limerick,Limerick,Irelan
d
Within the Country 20 01 01 No 15.4 cardboard R3 M Weighed Offsite in Ireland Greenstar,W0082-02
Dock Road,Dock
Raod,Limerick,Limerick,Irelan
d
Within the Country 20 01 01 No 1.1 paper R3 M Weighed Offsite in Ireland
DGD Papers,WFP-LK-2008-
09C
Bay M1,Raheen Business
Park,Limerick,Limerick,Ireland
Within the Country 20 01 21 Yes 11.0
fluorescent tubes and other mercury-
containing waste R4 M Weighed Offsite in Ireland
Irish Lamp Recycling,WFP-KE-
08-0348-01
Athy,Athy,Co Kildare,Co
Kildare,Ireland
Irish Lamp Recycling,WFP-KE-
08-0348-01
Athy,Athy,Co Kildare,Co
Kildare,Ireland
Within the Country 20 01 25 No 1.2 edible oil and fat R3 E Volume Calculation Offsite in Ireland
Frylite Dublin Ltd.,WCP-DC-
10-1297-01
Ballymount Industrial
Estate,Unit J1,Dublin
12,12,Ireland
Within the Country 20 01 36 No 0.08 used printer toner catridges R4 C Weighed Offsite in Ireland
Condells The Office
Centre,None
Roches
Street,9,Limerick,Limerick,Irel
and
Within the Country 20 01 38 No 33.1 used timber reels R11 M Weighed Offsite in Ireland
Hegarty Metals
Recycling,WFP-LKC-11-001-
01
Ballysimon Road,Ballysimon
Road,Limerick,Limerick,Irelan
d
Within the Country 20 01 38 No 77.8 wood for recycling R3 M Weighed Offsite in Ireland
Hegarty Metals
Recycling,WFP-LKC-11-001-
01
Ballysimon Road,Ballysimon
Road,Limerick,Limerick,Irelan
d
Within the Country 20 01 38 No 15.8 wood for landfill D1 M Weighed Offsite in Ireland Greenstar,W0082-02
Dock Road,Dock
Raod,Limerick,Limerick,Irelan
d
Within the Country 20 01 39 No 45.2 plastics (empty IBC's & drums) R9 M Weighed Offsite in Ireland
Rilta Environmental
Ltd,W0192-03
Greenogue Business
Park,Rathcoole,Co.
Dublin,Co. Dublin,Ireland
Within the Country 20 01 99 No 31.9 conveyor belting R11 M Weighed Offsite in Ireland
Quarry Plant Supplies
Ltd,None
Straffan,Straffan,Co
Kildare,Co Kildare,Ireland
Within the Country 20 03 01 No 179.0 mixed municipal waste D1 M Weighed Offsite in Ireland Greenstar,W0082-02
Dock Road,Dock
Raod,Limerick,Limerick,Irelan
d
Within the Country 16 11 04 No 3.0 Flue Stack Residue (boiler ash) D1 E Volume Calculation Onsite of generation
Aughinish Alumina Ltd.,IPPC
Licence P0035-05
Aughinish
Island,Askeaton,Askeaton,Co
Limerick,Ireland
To Other Countries 15 01 10 Yes 2.9
Plastic containers (contaminated IBC'c &
drums) R12 M Weighed Abroad SRCL,W0055-02
420-430 Beech
Road,Western Industrial
Estate,Naas Road,Dublin
12,Ireland
Recyfuel,Not known,Zoning
Industriel d?Ehein,Zoning
Industriel d?Ehein,Engis,B-
4480 ,Belgium
Zoning Industriel
d?Ehein,Zoning Industriel
d?Ehein,Engis,B-4480
,Belgium
Within the Country 01 03 09 No 81835.0 Sand (from alumina production) D1 C Volume Calculation Onsite of generation
Aughinish Alumina Ltd.,IPPC
Licence P0035-05
Aughinish
Island,Askeaton,Askeaton,Co
Limerick,Ireland
Within the Country 16 07 08 Yes 9.32
wastes containing oil (waste oil/water
washings) R9 C Volume Calculation Offsite in Ireland
Rilta Environmental
Ltd,W0192-03
Greenogue Business
Park,Rathcoole,Co.
Dublin,Co. Dublin,Ireland
Rilta Environmetnal
Ltd,W0192-03,Greenogue
Business Park,Rathcoole,Co.
Dublin,.,Ireland
Greenogue Business
Park,Rathcoole,Co.
Dublin,.,Ireland
To Other Countries 16 05 04 Yes 0.68
gases in pressure containers (including
halons) containing dangerous substances-
Halon cylinders R5 M Weighed Abroad
Rilta Environmental
Ltd,W0192-03
Greenogue Business
Park,Rathcoole,Co.
Dublin,Co. Dublin,Ireland
Meridian Technical Services
Ltd ,EAWML/83425,14 Hailey
Road ,Erith ,Kent ,DA 18
4Ap,United Kingdom
14 Hailey Road ,Erith ,Kent
,DA 18 4Ap,United Kingdom
To Other Countries 16 01 07 Yes 0.1 oil filters R11 M Weighed Abroad Enva Shannon,W0041-01
Smithstown Industrial
Estate,Shannon,Co.
Clare,0,Ireland
To Other Countries 17 06 01 Yes 5.5 insulation materials containing asbestos D1 M Weighed Abroad
Rilta Environmental
Ltd,W0192-03
Greenogue Business
Park,Rathcoole,Co.
Dublin,Co. Dublin,Ireland
GroBenasper
Entsorgungsgesellschaft mbh
& Co. KG,eg0108,Bimohler
Str. 57a,24623 GroBenaspe
,Hamburg ,.,Germany
Bimohler Str. 57a,24623
GroBenaspe ,Hamburg
,.,Germany
To Other Countries 15 01 11 Yes 5.0 Aerosol cans empty D10 M Weighed Abroad
Rilta Environmental
Ltd,W0192-03
Greenogue Business
Park,Rathcoole,Co.
Dublin,Co. Dublin,Ireland
De-Pack Limited
,EAWML/43679,Wymeswold
Industrial Estate ,Burton on
the Wolds ,Leicestershire
,.,United Kingdom
Wymeswold Industrial Estate
,Burton on the Wolds
,Leicestershire ,.,United
Kingdom
* Select a row by double-clicking the Description of Waste then click the delete button
Link to previous years waste data
Link to previous years waste summary data & percentage change
Method Used

Aughinish Alumina Ltd. March 2013 AER 2012
Attachment 5 Noise Survey Report 2012

Aughinish Alumina Ltd. March 2013 AER 2012
This page is intentionally blank
OES Consulting
FBD House, Fels Point, Tralee, Co. Kerry
p: 066 7128321 w: www.oes.ie
RUSAL Aughinish Ltd.
Aughinish Island, Askeaton, Co. Limerick. IPPC Licence Reg No. P0035-04
Report on
Annual Environmental Noise Survey 2012
September 2012


RUSAL Aughinish Ltd. Aughinish Island, Askeaton, Co. Limerick Report on Annual Environmental Noise Survey 2012
Contents
1. Introduction .................................................................................................... 1 2. Methodology .................................................................................................. 2
2.1 Measurement Locations 2 2.2 Survey Periods 4 2.3 Weather 4 2.4 Instrumentation 4 2.5 Procedure 5 2.6 Measurement Parameters 5
3. Noise Monitoring Results ................................................................................ 7 4. Summary of Noise Survey.............................................................................. 9 5. Conclusions .................................................................................................. 10 6. References.................................................................................................... 11
Attachments Attachment A Site location Map Showing Noise Monitoring Locations Attachment B Certificates of Calibration Attachment C Noise Monitoring Report Sheets Attachment D Photo Log Attachment E RUSAL Aughinish Weather Reports

RUSAL Aughinish September 2012
Annual Environmental Noise Survey 2012
OES Consulting Page 1 of 11
1. Introduction
OES Consulting (OES) was commissioned by RUSAL Aughinish Ltd. to undertake their annual environmental noise assessment at their facility in Aughinish Island, Askeaton, Co. Limerick. The noise assessment was undertaken in accordance with Conditions set out in the Integrated Pollution Prevention and Control (IPPC) Licence (Reg No. P0035-04). The relevant Conditions and Schedules of the Licence are as follows:
• In accordance with Condition 4.5 of the licence ‘‘noise from the
installation shall not give rise to sound pressure levels measured at
noise sensitive locations of the installation which exceed the limit
value(s).’’
• In accordance with Condition 6.13 of the licence ‘‘the licensee
shall carry out a noise survey of the site operations annually. The
survey programme shall be undertaken in accordance with the
methodology specified in the Agency publication ‘Guidance Note
for Noise: Licence Applications, Surveys and Assessments in Relation
to Scheduled Activities (NG4), April 2012’.’’
• In accordance with Schedule B.4 of the licence ‘‘noise from the
installation shall not give rise to sound pressure levels measured at
noise sensitive locations which exceed the limit value of 55dB(A) by
day and 45dB(A) by night. In addition, there shall be no clearly
audible tonal or impulsive noise component in the noise emission
from the activity at any noise sensitive location.’’
• In accordance with Condition C.5 ‘‘the assessment included noise
measurement assessments at nine Boundary Locations (B1 to B 9)
and five Noise Sensitive Locations (NSL1 to NSL5).’’
The survey was carried out between the dates 9th to the 10th July and 21st to the 23rd August 2012 (dates inclusive). The noise survey was undertaken by Tomás McCarthy of OES.
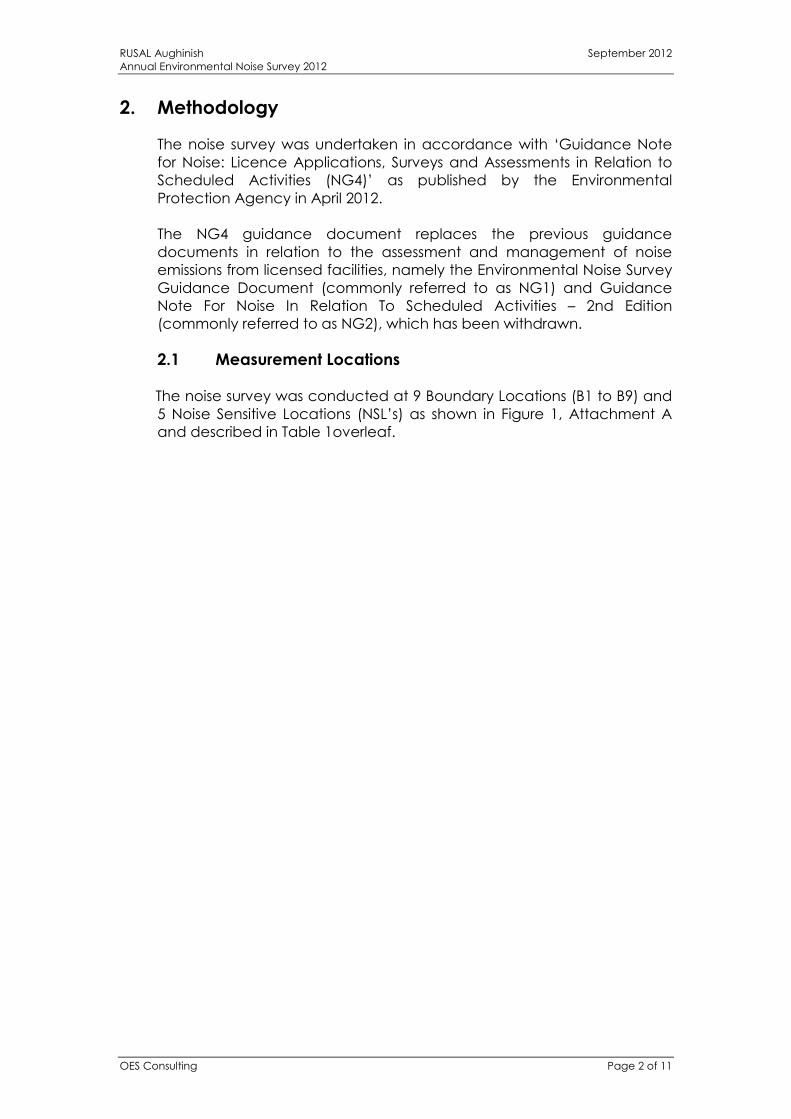
RUSAL Aughinish September 2012
Annual Environmental Noise Survey 2012
OES Consulting Page 2 of 11
2. Methodology
The noise survey was undertaken in accordance with ‘Guidance Note for Noise: Licence Applications, Surveys and Assessments in Relation to Scheduled Activities (NG4)’ as published by the Environmental Protection Agency in April 2012. The NG4 guidance document replaces the previous guidance documents in relation to the assessment and management of noise emissions from licensed facilities, namely the Environmental Noise Survey Guidance Document (commonly referred to as NG1) and Guidance Note For Noise In Relation To Scheduled Activities – 2nd Edition (commonly referred to as NG2), which has been withdrawn.
2.1 Measurement Locations
The noise survey was conducted at 9 Boundary Locations (B1 to B9) and 5 Noise Sensitive Locations (NSL’s) as shown in Figure 1, Attachment A and described in Table 1overleaf.

RUSAL Aughinish September 2012
Annual Environmental Noise Survey 2012
OES Consulting Page 3 of 11
Table 1 Noise Monitoring Locations
Monitoring location
GPS Cordinates
Location type Location relative to RUSAL Aughinish installation
B1 528276 655432
Boundary
Located on the North-West corner of the jetty where ships are unloaded and loaded.
B2 528807 653808
Boundary Located at the North East of the facility, close to the cooling towers.
B3
528676
652702 Boundary
Located towards the North
side of the main access road.
B4 528153 651916
Boundary Located to the South of the facility, close to the cattle grid.
B5 526797 652555
Boundary Located to the Western corner of the site in the vicinity of the
BRDA.
B6 528002 653635
Boundary Located close to the side access road to the Southwest of the main plant.
B7 526713 652467
Boundary Located to the Southwest corner of the site.
B8 527668 650952
Boundary Located to the South of the BRDA extension.
B9 528780 651096
Boundary Located to the Southeast of the BRDA extension.
NSL1 529168 652761
Noise sensitive location
Located approximately 600m South East of the facility along Poulawela Creek.
NSL2 529000 651731
Noise sensitive location
Located approximately 1,200m to the South East of the facility in the vicinity of a dwelling.
NSL3 527720 649969
Noise sensitive location
Located approximately 3km to the South of the facility in the townland of Oola.
NSL4 526069
652096
Noise sensitive
location
Located approximately 2.6km
to the South West. Located at the eastern end of Foynes Port.
NSL5 528805 651209
Noise sensitive location
Located 1.9km directly South of the facility in the vicinity of a residential building.

RUSAL Aughinish September 2012
Annual Environmental Noise Survey 2012
OES Consulting Page 4 of 11
2.2 Survey Periods
In accordance with the NG4 Guidelines, three sampling periods are required at each noise sensitive location during the daytime. Two sampling periods are required during the night-time survey’s.
The survey was undertaken during a typical operational production period during the daytime and night-time survey as required for compliance evaluation.
2.3 Weather The weather during the daytime surveys was mild (nominally 11 to 20°C) and with a calm to light breeze (0 – 5m/s). During the night-time survey, it was calm with an occasional light breeze. Temperatures dropped to approximately below 12°C at night-time. Conditions were generally dry throughout both periods with occasional short periods of rain.
2.4 Instrumentation
All measurements were undertaken using a Type 1 Precision Integrating Sound Level Meter (Cirrus Optimus) and associated hardware (calibrator, tripod) and software. Measurement equipment was calibrated prior to and post day and night-time surveys. The frequency of calibration may be adjusted depending on observed instrument drift. Calibration certificates for the noise meter and calibrator are presented in Attachment B. Details of the monitoring equipment used are provided in Table 2. Table 2 Monitoring Equipment
Instrument Type Manufacturer Model Number Serial Number
Sound Level Meter Cirrus Research plc
CR:171B G056143
Acoustic Calibrator Cirrus Research plc
CR:515 55191
Interpretation and
Interface Software
Cirrus Research
plc
Noise Tools N/A
The Sound Level Meter and associated software and accessories conform to the following standards:
• IEC 61672-1, Class 1, Group X • IEC 60651, Type 1, Group X • IEC 60804, Type 1, Group X • IEC 61260, IEC 60942, Class 1 • ANSI S1.4 & ANSI S1.4A, Type 1 • ANSI S1.43, Type 1
The Acoustic Calibrator was calibrated to published data as described and recommended by IEC standard Electroacoustics – Sound Calibrators IEC 60942:2003, IEC 90942:1997, BS EN 60942:1998 and BS EN 60942:2003.

RUSAL Aughinish September 2012
Annual Environmental Noise Survey 2012
OES Consulting Page 5 of 11
2.5 Procedure Sample periods were 15 minutes for Boundary Locations and 30 minutes for Noise Sensitive Locations (NSL) during the daytime and night-time surveys. The results were saved to the instrument memory for later analysis where appropriate. Survey personnel noted all primary noise sources contributing to noise build-up. The noise meter was attended by OES personnel at all times. The survey results were noted onto a Survey Record Sheet immediately following each measurement. The meter was calibrated before, during and at the end of the survey period.
2.6 Measurement Parameters The boundary survey results are presented in terms of the following five parameters: Noise Sensitive Location any dwelling house, hotel or hostel, health building, educational establishment, place of worship or entertainment, or any other facility or other area of high amenity which for its proper enjoyment requires the absence of noise at nuisance levels.
LAeq is the equivalent continuous sound level. It is a type of average and is used to describe a fluctuating noise in terms of a single noise level over the sample period. LAmax is the instantaneous maximum sound level measured during the sample period. LAmin is the instantaneous minimum sound level measured during the sample period. LA10 is the sound level that is exceeded for 10% of the sample period. It is typically used as a descriptor for traffic noise. LA90 is the sound level that is exceeded for 90% of the sample period. It is typically used as a descriptor for background noise. The EPA NG4 Guidelines states that ‘‘for some noise surveys, the LAF90,T index may be
used to give a good indication of the actual noise output from the site,
where the noise emissions on site are relatively steady and extraneous
noises may unduly influence the measured LAeq,T’’.
LAr,T The Rated Noise Level, equal to the LAeq/ LA90 during a specified time interval (T), plus specified adjustments for tonal character and/or impulsiveness of the sound. The “A” suffix denotes sound levels that have been “A-weighted” in order to account for the non-linear nature of human hearing.

RUSAL Aughinish September 2012
Annual Environmental Noise Survey 2012
OES Consulting Page 6 of 11
Tonal Sounds which cover a range of only a few Hz which contains a clearly audible tone, i.e. distinguishable, discrete or continuous noise (whine, hiss, screech, or hum etc.) are referred to as being ‘tonal’. An audible tone is normally defined as being greater than or equal to the following values in both adjacent one third octave bands:
• 15dB in low frequency one third octave bands (25Hz to 125Hz); • 8dB in middle frequency bands (160Hz to 400Hz), and; • 5dB in high frequency bands (500Hz to 10,000Hz).
1/3 octave analysis Frequency analysis of sound such that the frequency spectrum is subdivided into bands of one–third of an octave each. All sound levels in this report are expressed in terms of decibels (dB) relative to 2x10⁻⁵ Pa.

RUSAL Aughinish September 2012
Annual Environmental Noise Survey 2012
OES Consulting Page 7 of 11
3. Noise Monitoring Results
Detailed noise monitoring results of all noise monitoring locations are appended as Attachment C of the report. A summary of the survey average LAeq, LA90, LA10 and A 1/3rd octave frequency analysis for day and night time measurements are outlined in Tables 3 and 4 below. Table 3 Daytime - Noise Monitoring Results Summary
Noise
location L Aeq
L A90
L A10
L Amax
Tonal or
Impulsive noise* (Y/N)
L AR
Comments
(ex. main noise sources on site, & extraneous
noise ex. road traffic)
Is site
compliant with IPPC noise limit (55dBA)?
Noise Sensitive Locations - Monitoring Results
NSL 1 49 46 51 69 N 46
Distant N69 traffic, faint plant noise audible
Yes
NSL 2 53 43 53 75 N 43
Distant traffic noise from the
N69, occasional
passing traffic
on local road
Yes
NSL 3 51 43 51 73 N 43
N69 traffic noise audible, faint plant
noise audible
Yes
NSL 4 46 41 47 71 N 41
Port activities dominant, very faint air emission noise
from RusAL
Yes
NSL 5 53 42 52 78 N 42
Distant traffic noise from the N69, very faint noise audible
from the BRDA area
Yes
Boundary Location - Noise Monitoring Results
B1 55 52 55 76 N 55 Plant Noise N/A
B2 56 55 57 63 N 56 Plant Noise N/A
B3 53 47 56 69 N 53 Plant Noise N/A
B4 52 43 52 72 N 52 Plant Noise N/A
B5 42 36 45 57 N 42 Plant Noise N/A
B6 52 48 54 63 N 52 Plant Noise N/A
B7 45 40 47 62 N 45 Plant Noise N/A
B8 42 36 45 65 N 42 Plant Noise N/A
B9 53 45 55 68 N 53 Plant Noise N/A

RUSAL Aughinish September 2012
Annual Environmental Noise Survey 2012
OES Consulting Page 8 of 11
Table 4 Night -Time Noise Monitoring Results Summary
Noise location L A
eq
L A90
L A10
L Amax
Tonal or Impulsive
noise* (Y/N)
L AR
Comments (ex. main
noise sources on site, & extraneous noise ex.
road traffic)
Is site compliant
with IPPC noise limit (45dBA)?
Noise Sensitive Locations - Monitoring Results
NSL 1 44 39 43 62 N 39
Distant N69 traffic, faint plant noise audible
Yes
NSL 2 46 34 38 73 N 34
Distant traffic noise from the N69,
occasional passing traffic on
local road
No
NSL 3 37 34 39 53 N 34
N69 traffic noise
audible, faint plant noise
audible
Yes
NSL 4 46 32 37 75 N 32
Port activities dominant, very faint air
emission noise from RUSAL
No
NSL 5 39 34 38 68 N 34
Distant traffic noise from
the N69, very faint noise
audible from the BRDA
area
Yes
Boundary Location - Noise Monitoring Results
B1 66 64 67 69 N 66 Plant Noise N/A
B2 51 50 52 56 N 51 Plant Noise N/A
B3 52 36 41 76 N 52 Plant Noise N/A
B4 36 35 37 46 N 36 Plant Noise N/A
B5 30 27 30 57 N 30 Plant Noise N/A
B6 51 50 52 56 N 51 Plant Noise N/A
B7 30 28 36 44 N 30 Plant Noise N/A
B8 36 28 32 70 N 36 Plant Noise N/A
B9 53 45 55 68 N 53 Plant Noise N/A

RUSAL Aughinish September 2012
Annual Environmental Noise Survey 2012
OES Consulting Page 9 of 11
4. Summary of Noise Survey
A summary of the noise monitoring measurements taken at the Noise Sensitive Locations and Boundary Locations are presented below:
4.1 Noise Sensitive Locations
RUSAL Aughinish’s IPPC Licence Daytime noise limit of 55 dB (LAeq) was not exceeded at any of the Noise Sensitive Locations. RUSAL Aughinish’s IPPC Licence Night time noise limit of 45 dB (LAeq) was not exceeded at any of the Noise Sensitive Locations with the exception of NSL2 and NSL4 which marginally exceeded the limit with a monitored measurement of 46 dB for both. However noise emanating from RUSAL Aughinish at these locations during the survey was barely perceptible. The NG4 Guidelines states that ‘‘for some noise surveys, the LAF90,T index may be used to give a good
indication of the actual noise output from the site, where the noise
emissions on site are relatively steady and extraneous noises may unduly
influence the measured LAeq,T’’. A review of the data obtained during the survey shows that the LA90 monitored values, which are representative of background noise, to be significantly below the limit values. It can therefore be concluded that RUSAL Aughinish are in compliance with the Licence limits. There was no tonal or impulsive component in the noise detected (subjectively or measured) emanating from the facility at any of the monitoring locations.
4.2 Boundary Locations Boundary noise monitoring results reflect the nature and scale of operations taking place close to these areas and were directly related to plant operations. The daytime LAeq recorded at the boundary locations ranged from 42 dB at boundary location B5 to 56 dB at boundary location B2. The night time LAeq recorded at the boundary locations ranged from 30 dB at boundary location B5 to 66 dB at boundary location B1 (the Jetty). Noise emissions from the RUSAL Aughinish facility include contributions from the operation of the process plant and equipment within the installation, together with vehicular movements both within and outside the site. The position of the Boundary Locations are however sufficiently removed from the noise sensitive areas to cause disturbance and therefore unlikely to be a nuisance.

RUSAL Aughinish September 2012
Annual Environmental Noise Survey 2012
OES Consulting Page 10 of 11
5. Conclusions
Based on the noise monitoring undertaken at RUSAL Aughinish the following can be concluded:
• The daytime noise limit was complied with at all noise sensitive locations.
• The night-time noise limit was complied with at all noise sensitive
locations.
• There was no audible or measurable tonal or impulsive component in the noise at the noise sensitive locations.

RUSAL Aughinish September 2012
Annual Environmental Noise Survey 2012
OES Consulting Page 11 of 11
6. References
‘Guidance Note for Noise: Licence Applications, Surveys and Assessments in Relation to Scheduled Activities (NG4)’ as published by the Environmental Protection Agency in April 2012. IS0 1996: Acoustics - Description and Measurement of Environmental Noise

Att
ac
hm
en
t A
tta
ch
me
nt A
A
No
ise M
oni
torin
g L
oc
atio
nsN
oise
Mo
nito
ring
Lo
ca
tions

!
!!
!
!
!!
!
! !
!
!
!
!
N4
NSL4
Ordnance Survey Ireland. All Rights Reserved. Licence number EN0059512
OES Consulting2nd Floor FBD HouseFels PointTraleeCo Kerry
Project: Annual Noise Survey
Revision: 01
OES Ref: F1_1017_21
DocumentControl:
Drawn By: TQChecked By: EO'L
Client: RUSAL Aughinish
Noise Monitoring LocationsMap Title:
Date: 23/09/2010
Legend
! Noise Sensitive Locations (NSL)
! Boundary Locations Locations (B)¯
NSL 4
B5
NSL 3
B8
B7
B9
NSL 5
NSL 2
B1
B6B2
B3
B4
NSL 1
0 1,000 2,000 3,000 4,000500Meters

Att
ac
hm
en
t A
tta
ch
me
nt B
B C
ert
ific
ate
s o
f Ca
libra
tion
Ce
rtifi
ca
tes
of C
alib
ratio
n
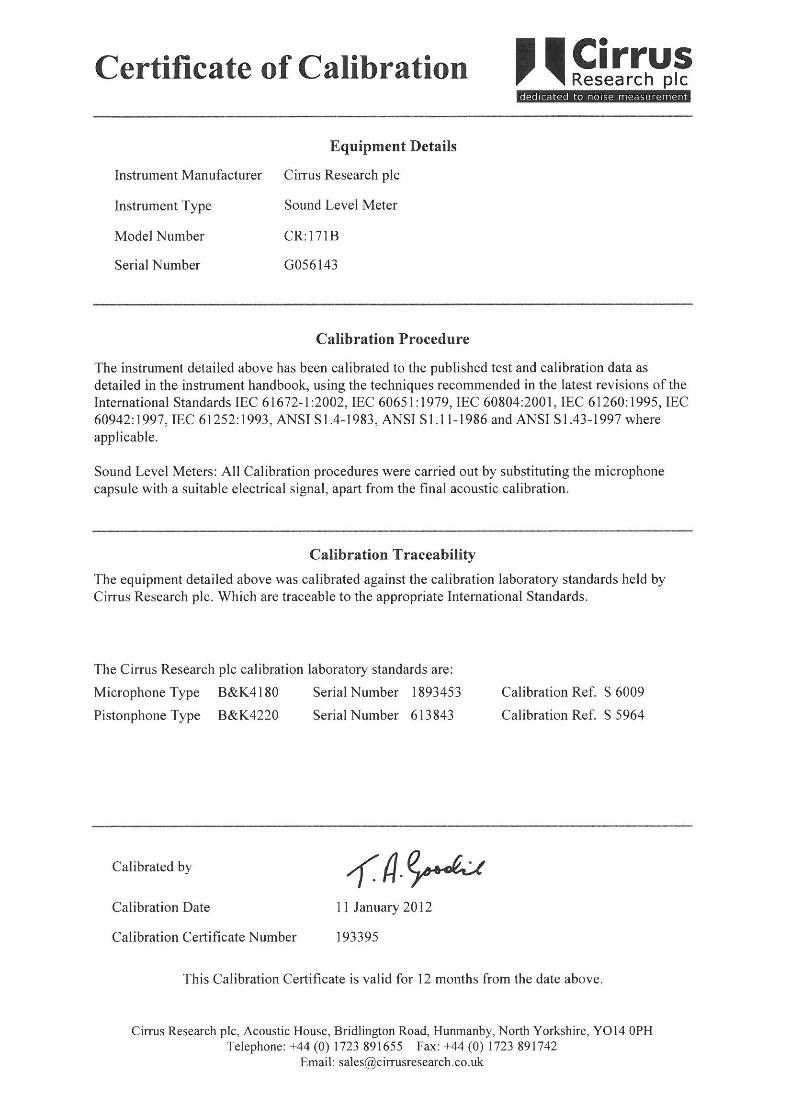


Att
ac
hm
en
t A
tta
ch
me
nt C
C
No
ise M
oni
torin
g R
ep
ort
Sh
ee
tsN
oise
Mo
nito
ring
Re
po
rt S
he
ets

Date Printed 26/08/2012
M8DAC0100000600 Cirrus Research NoiseTools Page 1 of 1

Date Printed 26/08/2012
M8DAC01000005FB Cirrus Research NoiseTools Page 1 of 1

Date Printed 26/08/2012
M8DAC0100000A5E Cirrus Research NoiseTools Page 1 of 1

Date Printed 26/08/2012
M8DAC01000005F3 Cirrus Research NoiseTools Page 1 of 1
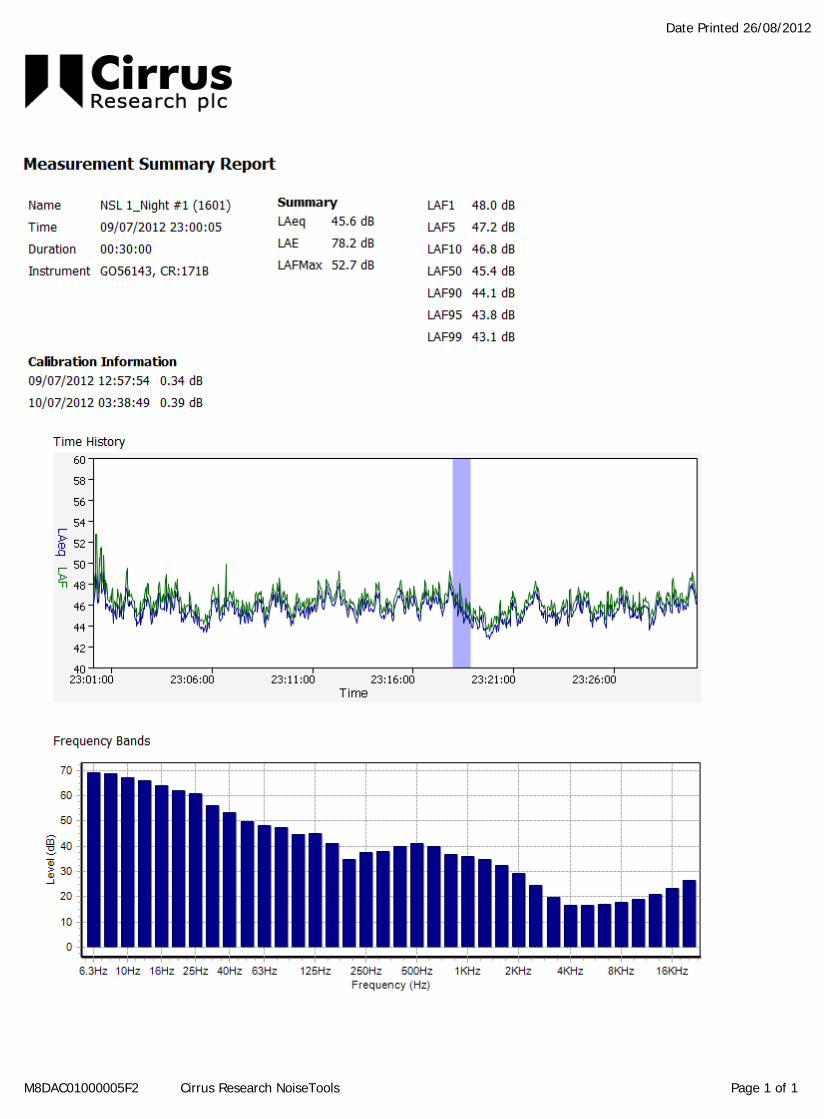
Date Printed 26/08/2012
M8DAC01000005F2 Cirrus Research NoiseTools Page 1 of 1

Date Printed 26/08/2012
M8DAC01000005EC Cirrus Research NoiseTools Page 1 of 1

Date Printed 26/08/2012
M8DAC01000005FF Cirrus Research NoiseTools Page 1 of 1

Date Printed 26/08/2012
M8DAC01000005FA Cirrus Research NoiseTools Page 1 of 1

Date Printed 26/08/2012
M8DAC0100000A5C Cirrus Research NoiseTools Page 1 of 1

Date Printed 26/08/2012
M8DAC01000005F4 Cirrus Research NoiseTools Page 1 of 1

Date Printed 26/08/2012
M8DAC01000005EE Cirrus Research NoiseTools Page 1 of 1

Date Printed 26/08/2012
M8DAC0100000A4F Cirrus Research NoiseTools Page 1 of 1

Date Printed 26/08/2012
M8DAC01000005FD Cirrus Research NoiseTools Page 1 of 1

Date Printed 26/08/2012
M8DAC0100000A4C Cirrus Research NoiseTools Page 1 of 1

Date Printed 26/08/2012
M8DAC0100000A5D Cirrus Research NoiseTools Page 1 of 1

Date Printed 26/08/2012
M8DAC01000005F6 Cirrus Research NoiseTools Page 1 of 1

Date Printed 26/08/2012
M8DAC01000005EF Cirrus Research NoiseTools Page 1 of 1

Date Printed 26/08/2012
M8DAC01000005EB Cirrus Research NoiseTools Page 1 of 1

Date Printed 26/08/2012
M8DAC0100000602 Cirrus Research NoiseTools Page 1 of 1

Date Printed 26/08/2012
M8DAC0100000601 Cirrus Research NoiseTools Page 1 of 1

Date Printed 26/08/2012
M8DAC01000005F8 Cirrus Research NoiseTools Page 1 of 1

Date Printed 26/08/2012
M8DAC01000005F7 Cirrus Research NoiseTools Page 1 of 1

Date Printed 26/08/2012
M8DAC01000005F1 Cirrus Research NoiseTools Page 1 of 1

Date Printed 26/08/2012
M8DAC01000005F0 Cirrus Research NoiseTools Page 1 of 1

Date Printed 26/08/2012
M8DAC01000005FE Cirrus Research NoiseTools Page 1 of 1
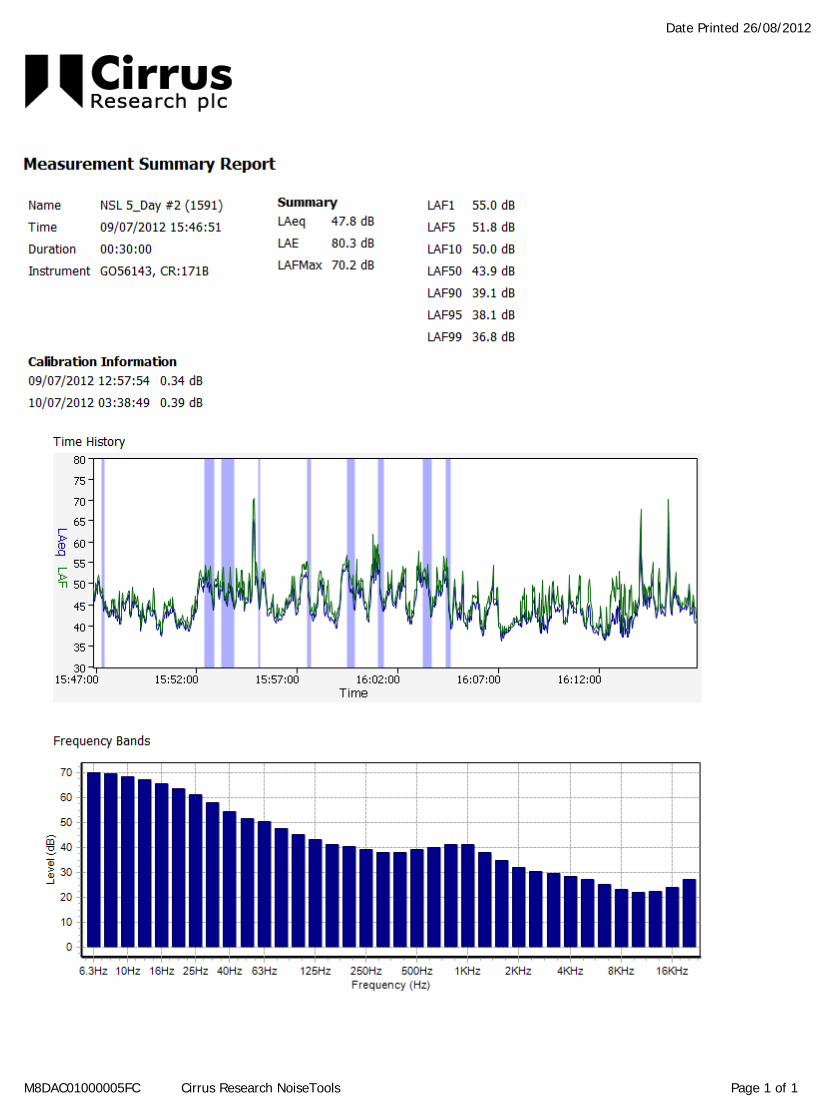
Date Printed 26/08/2012
M8DAC01000005FC Cirrus Research NoiseTools Page 1 of 1

Date Printed 26/08/2012
M8DAC0100000A5B Cirrus Research NoiseTools Page 1 of 1

Date Printed 26/08/2012
M8DAC01000005F5 Cirrus Research NoiseTools Page 1 of 1

Date Printed 26/08/2012
M8DAC01000005ED Cirrus Research NoiseTools Page 1 of 1

Date Printed 26/08/2012
M8DAC0100000A50 Cirrus Research NoiseTools Page 1 of 1

Att
ac
hm
en
t A
tta
ch
me
nt E
E W
ea
the
r Re
po
rts
We
ath
er R
ep
ort
s

Aughinish Weather Data
Temperature(°C) 09/07/2012 – 10/07/2012

Temperature (°C) 21/08/2012 – 23/08/2012

Wind Speed Jetty (mph) 09/07/2012 – 10/07/2012

Wind Speed Jetty (mph)21/08/2012 – 23/08/2012

Wind Speed BRDA (mph) 09/07/2012 – 10/07/2012

Wind Speed BRDA (mph) 21/08/2012 – 23/08/2012

Wind Direction (degrees) 09/07/2012 – 10/07/2012

Wind Direction (degrees) 21/08/2012 – 23/08/2012

Aughinish Alumina Ltd. March 2013 AER 2012
This page is intentionally blank

Aughinish Alumina Ltd. March 2013 AER 2012
Attachment 6 BRDA Operational Plan

Aughinish Alumina Ltd. March 2013 AER 2012
This page is intentionally blank

RUSAL Aughinish Ltd. Bauxite Residue Disposal Area (BRDA) Operational Plan (BRDA OP001)
Prepared by: P O’Loughlin Date: 12.10.04
Approval Date:
L Fleming:
Reference No. BRDA Operational Plan
BRDA OP001
Issue 1
Revised by: Edward Lowe Date 27.03.13
E Lowe
i
Rev. 6
RUSAL Aughinish
IPPC Licence P0035-04
Bauxite Residue Disposal Area
Operational Manual
March 2013

RUSAL Aughinish Ltd. Bauxite Residue Disposal Area (BRDA) Operational Plan (BRDA OP001)
Prepared by: P O’Loughlin Date: 12.10.04
Approval Date:
L Fleming:
Reference No. BRDA Operational Plan
BRDA OP001
Issue 1
Revised by: Edward Lowe Date 27.03.13
E Lowe
ii
Rev. 6
Bauxite Residue Disposal Area (BRDA)
Operational Manual
Contents
1.0 Introduction ................................................................................................. 1
2.0 Site Management and Responsibilities ..................................................... 5
3.0 Waste Analysis ........................................................................................... 9
4.0 Operational Principles .............................................................................. 12
5.0 Waste Handling and Placement ............................................................... 13
6.0 Emergency Procedures ............................................................................ 18
7.0 Dust Control .............................................................................................. 19
8.0 Surface Water Management and Protection ........................................... 20
9.0 Groundwater Management and Protection ............................................. 21
10.0 Leachate Management and Disposal ...................................................... 23
11.0 Life Expectancy......................................................................................... 24
12.0 Restoration ................................................................................................ 24
13.0 Aftercare Management ............................................................................. 27
14.0 Environmental Monitoring Programme ................................................... 29
Appendix 1 .............................................................................................................. 30
Appendix 2 .............................................................................................................. 31

RUSAL Aughinish Ltd. Bauxite Residue Disposal Area (BRDA) Operational Plan (BRDA OP001)
Prepared by: P O’Loughlin Date: 12.10.04
Approval Date:
L Fleming:
Reference No. BRDA Operational Plan
BRDA OP001
Issue 1
Revised by: Edward Lowe Date 27.03.13
E Lowe:
Page 1 of 29
Rev. 6
1.0 Introduction
The Bauxite Residue Disposal Area (BRDA) is a dedicated facility, owned, developed and operated by RUSAL Aughinish Ltd as the landfill/tailings storage area for the permanent deposition of specific bauxite and process residues generated within the alumina extraction plant.
This Operational Plan includes all relevant data for the effective operation, monitoring long-term planning and aftercare of the BRDA. It is intended to demonstrate that the BRDA operations are in accordance with best management practices, the environmental policies of RUSAL Aughinish Ltd and the existing IPPCL conditions.
This Operational Plan has been structured in order to facilitate a clear presentation of relevant information as required by Condition 8.3.

RUSAL Aughinish Ltd. Bauxite Residue Disposal Area (BRDA) Operational Plan (BRDA OP001)
Prepared by: P O’Loughlin Date: 12.10.04
Approval Date:
L Fleming:
Reference No. BRDA Operational Plan BRDA OP001 Issue 1
Revised by: Edward Lowe Date 27.03.13
E Lowe: Page 2 of 29 Rev. 6
.
Figure 1 Organisation Chart

RUSAL Aughinish Ltd. Bauxite Residue Disposal Area (BRDA) Operational Plan (BRDA OP001)
Prepared by: P O’Loughlin Date: 12.10.04
Approval Date:
L Fleming:
Reference No. BRDA Operational Plan
BRDA OP001
Issue 1
Revised by: Edward Lowe Date 27.03.13
E Lowe
Page 3 of 29
Rev. 6
2.0 Site Management and Responsibilities
The Technical and Knowledge Management Manager has overall responsibility for the operation of the Bauxite Residue Disposal Area (BRDA). The BRDA is referred to as Area 54 (A54). The BRDA Operations Engineer has functional and administrative responsibility for the management of the BRDA. Placement of waste material within the BRDA is undertaken by Murphy International Ltd. under a Site Process Materials Management Contract (SPM Management Contract). The BRDA Specialist Contractor has responsibility for mud farming operations. The BRDA Operations Facilitator has overall responsibility for day-to-day operations. The BRDA Operations Team has overall responsibility for technical developments in the residue production and the day to day operations. The BRDA Operations Team includes:
BRDA Operations Engineer.
Engineering Dept. Consultant Engineer
BRDA Operations Facilitator
SPM Management Contractor
BRDA Specialist Contractor The Engineering Dept. Consultant Engineer has functional responsibility for all technical developments within the BRDA area and advises the BRDA Operations Team. The SPM Management Contractor is responsible for all landfill operations and maintenance as per contract. All queries from members of the public are managed by the Human Resources (HR) Manager. All liaison with and queries from the EPA are managed by the Environmental Coordinator. The following describes the personnel associated with the BRDA and their roles and responsibilities. Operation of the BRDA
The day-to-day operation of the BRDA is carried out under the SPM Management Contract. Under this contract, Murphy International Ltd. (the Contractor) has responsibility for the following:
Collection, transport and placement of all process plant residues at the BRDA.
Maintenance and organisation of red mud placement operations.

RUSAL Aughinish Ltd. Bauxite Residue Disposal Area (BRDA) Operational Plan (BRDA OP001)
Prepared by: P O’Loughlin Date: 12.10.04
Approval Date:
L Fleming:
Reference No. BRDA Operational Plan
BRDA OP001
Issue 1
Revised by: Edward Lowe Date 27.03.13
E Lowe
Page 4 of 29
Rev. 6
Reporting of waste quantities deposited to the BRDA to the Environmental Dept.
Organisation and development of all landfill operations and maintenance, including construction of internal access roads.
Organisation and implementation of all internal storage developments within the BRDA, including perimeter rockfill construction.
Organisation, implementation and maintenance of environmental protection measures.
The responsibilities of the BRDA Operations Team include: 1. Patrolling and liaising with the SPM Management Contractor on discharge points to
be operated. Assessing the vulnerability of dusting and liaising with contractor on appropriate measures to suppress it.
2. Advising the Local 2 CRO to operate the dust suppression sprinkler system with water as and when required.
3. Submitting job tickets for any maintenance work required. 4. Formulation of medium and longer-term operating strategies. 5. The BRDA Operations Team with support from the Central Engineering Dept
manages the construction of rockfill embankments on the periphery of the mud-stacking areas.
Control of Mud Quality The Local 2 (L2) Control Room Operator (CRO) is responsible for monitoring mud throughput and mud line pressure.
The L2 Process Operator (PO) is responsible for sampling, field patrols, filter checks, pump checks, filter washing and mud line pressure control. The L2 PO has responsibility for bringing on- and off-line filters, washing filter cloths and flushing of vents when washing (1A, 1B, 2A, 2B, 3A, 3B and 50A/50B).
The L2 Process Engineer is responsible for monitoring and achieving all long-term trends and process targets in the Mud Filtration Area (Area 34).
Continuity The BRDA is required to continuously store the bauxite residue generated in the process plant. This requires continuous management on a daily basis. The following sections outline the approach required to optimise the storage of the bauxite residue. Mud Washing The L2 CRO is responsible for, monitoring wash flow and filter speed.
The L2 PO is responsible for, sampling, field patrols, wash distribution and cloth repairs.

RUSAL Aughinish Ltd. Bauxite Residue Disposal Area (BRDA) Operational Plan (BRDA OP001)
Prepared by: P O’Loughlin Date: 12.10.04
Approval Date:
L Fleming:
Reference No. BRDA Operational Plan
BRDA OP001
Issue 1
Revised by: Edward Lowe Date 27.03.13
E Lowe
Page 5 of 29
Rev. 6
Management of Surface Water Runoff – Water Management
The L2 CRO is responsible for monitoring pond levels and stream distribution. The CRO records any non-compliance in the L2 Day Log and reports these to the Shift Plant Facilitator (SPF). The SPF reports any non-compliances in the shiftlog.
The L2 PO is responsible for sampling, field valve set up and field patrols.
The Environment Coordinator is responsible for formal notification of the Environmental Protection Agency (EPA) as soon as practicable regarding IPPC licence non-compliances.
Pond Cleanouts and Inspection
The L2 Process Engineer and Facilitator are responsible for deciding when a clean-out may commence. Pond sludge is pumped to the effluent clarifier for recycling to the plant. The BRDA Operations Team decides where the remaining ‘non-pumpable’ sludge is disposed in the BRDA. The Environmental Engineer is responsible for reviewing clean-out operations and to advise on environmental control measures as necessary.
The L2 CRO is responsible for monitoring any condensate dumps to the West Pond or its trenches. The L2 PO is responsible for monitoring pumping from the Liquid Waste Pond during a normal clean-out.
The L2 Environmental Facilitator is responsible for inspection of ponds.
The Civil Engineering Department is responsible for monitoring and overseeing any repairs to the pond liners or concrete.
Dust Emissions Control The L2 Equipment Facilitator is responsible for ensuring that no dusting occurs on the BRDA and to take the necessary measures to prevent dusting. These measures include ensuring the sprinkling system is applied appropriately to damp down potential fugitive dust emissions at all times. The SPM Management Contractor is responsible for the maintenance, filling and operation of all mobile water sprayers and permanently installed sprinkler systems. The SPM Management Contractor, BRDA Specialist Contractor and BRDA Field Facilitator maintains a watching brief for the meteorological conditions which favour dusting and are responsible for communicating this to the L2 Equipment Facilitator on a daily basis.

RUSAL Aughinish Ltd. Bauxite Residue Disposal Area (BRDA) Operational Plan (BRDA OP001)
Prepared by: P O’Loughlin Date: 12.10.04
Approval Date:
L Fleming:
Reference No. BRDA Operational Plan
BRDA OP001
Issue 1
Revised by: Edward Lowe Date 27.03.13
E Lowe
Page 6 of 29
Rev. 6
Emergency Response In the event of a dusting emergency, the SPM Management Contractor is responsible for directly notifying the SPF and L2 CRO. Depending on the response required, the SPM Management Contractor has responsibility for requesting assistance, organising all dust suppression resources and ensuring that the Emergency Response Procedure (SWM 2022) is implemented. Dusting is categorised a plant emergency. The plant emergency number (Ext. 4444) is used to contact Security in A79.

RUSAL Aughinish Ltd. Bauxite Residue Disposal Area (BRDA) Operational Plan (BRDA OP001)
Prepared by: P O’Loughlin Date: 12.10.04
Approval Date:
L Fleming:
Reference No. BRDA Operational Plan
BRDA OP001
Issue 1
Revised by: Edward Lowe Date 27.03.13
E Lowe
Page 7 of 29
Rev. 6
3.0 Waste Analysis 3.1 Waste Origin and Composition
All bauxite-derived solid and sludge residues arising from alumina production at the plant are directed to the BRDA in accordance with IPPC Licence conditions. Almost all the solid residue material arises from the initial caustic digestion of the bauxite ore. After exiting the bauxite digesters, the residue is segregated into two fractions, the fine red mud fraction, representing approximately 90% of the total and the coarse fraction, known as process sand, representing the other 10%. Together these represent about 97% of the total bauxite residue from the plant. The remaining proportion comprises salt cake, from a salting-out liquor purification process and other process wastes including sand, scale, sludges and construction and demolition waste. Table 1 below lists the waste types approved by the EPA for placement within the BRDA. Table 1 Approved Waste Types
The red mud is subject to counter-current washing to reduce the concentration of entrained caustic before being de-watered in a vacuum drum filter and pumped as slurry to the BRDA. The coarser process sand fraction is delivered to the storage area in dumper trucks. Salt cake, lime grits, refractory and scale that are trucked to the BRDA, are confined to specific areas within the existing BRDA. Accumulated sludges from process ponds are also deposited within the BRDA.
Table 2 overleaf shows the approximate composition of the main process residues
disposed of to the BRDA.
Red Mud
Process Sand
Salt Cake
Process Scale
Lime Grits
Pond Cleanout Sludge (from LWP, SWP, North Pond, South Pond, East Pond, West Pond)
Miscellaneous Refractory Material (non-hazardous)
Building Rubble (used for roadway/embankment construction within the BRDA)
Sludge from the Sanitary Treatment Plant A82 (emergency only)
A34 Effluent Clarifier Underflow Sludge (discontinued)

RUSAL Aughinish Ltd. Bauxite Residue Disposal Area (BRDA) Operational Plan (BRDA OP001)
Prepared by: P O’Loughlin Date: 12.10.04
Approval Date:
L Fleming:
Reference No. BRDA Operational Plan
BRDA OP001
Issue 1
Revised by: Edward Lowe Date 27.03.13
E Lowe
Page 8 of 29
Rev. 6
Table 2 Process Residues deposited in the BRDA
Waste Stream European Waste
Catalogue Code
Hazardous/
Non-Hazardous
(EWC Classification)
Approximate %
of Total Residue
Deposited
Bauxite Residue
(Red mud & sand)
01 03 09 Non-Hazardous 88%
Process Waste 01 03 99 Non-Hazardous 10%
Lime Grits 01 03 99 Non-Hazardous 1%
Salt Cake 01 03 07 Hazardous 2%
3.2 Waste Quantities
Data on waste composition and quantities is collected in accordance with IPPC Licence conditions and is included in quarterly reports and Annual Environmental Reports (AER’s) to the EPA. 2010 data is included in Section 3 of the 2010 AER.
3.3 Physical Properties
The red mud residue is pumped from the mud separation area (Local 2) to the storage area as slurry with solids content of between 55% and 60%. Once the mud has been discharged it begins to dry, with water being lost through “bleeding”, surface evaporation and mud farming. It has been found that after an average ‘maturing period’ of 3 to 4 months for a mud layer of 0.3 to 0.6m thick, a solids content of around 68% to 70% is achieved. Particle size analyses of red mud indicate that the material is largely silt size, with 90% of the particles smaller than 35 microns and 35% finer than 2 microns. The permeability of the mud is correspondingly very low and has been assessed to be in the range 1 x 10⁻⁸ to 1 x 10⁻⁹m/sec. The average specific gravity of the dry mud solids is 3.3.
The process sand is poorly graded medium sand having 90% and 10% of the particles smaller than 500 and 100 µm respectively. The permeability of the process sand is estimated to be about 1000 times greater than the permeability of the red mud.
Salt cake is deposited as a 70% solids cake.
3.4 Chemical Properties
The principal constituents of the red mud solids (expressed as the oxides) are iron oxide (Fe2O3), aluminium oxide (Al2O3) and titanium dioxide (TiO2).
The aqueous solution entrained within the red mud contains a small amount of residual dissolved caustic (sodium hydroxide) and alumina in spite of the repeated washing in the plant. It is this residual dissolved caustic that gives the red mud its elevated pH characteristics. Most of this caustic converts to sodium carbonate and sodium

RUSAL Aughinish Ltd. Bauxite Residue Disposal Area (BRDA) Operational Plan (BRDA OP001)
Prepared by: P O’Loughlin Date: 12.10.04
Approval Date:
L Fleming:
Reference No. BRDA Operational Plan
BRDA OP001
Issue 1
Revised by: Edward Lowe Date 27.03.13
E Lowe
Page 9 of 29
Rev. 6
bicarbonate following deposition in the BRDA. This conversion process is accelerated and enhanced via atmospheric carbonation using the mud farming process.
Salt cake consists of the organic degradation products from humates in the bauxite, including sodium carbonate, sodium sulphate and sodium oxalate.

RUSAL Aughinish Ltd. Bauxite Residue Disposal Area (BRDA) Operational Plan (BRDA OP001)
Prepared by: P O’Loughlin Date: 12.10.04
Approval Date:
L Fleming:
Reference No. BRDA Operational Plan
BRDA OP001
Issue 1
Revised by: Edward Lowe Date 27.03.13
E Lowe
Page 10 of 29
Rev. 6
4.0 Operational Principles The following summarises the key operating principles for the BRDA:
1. The BRDA accepts only those residues described in and permitted by the current
IPPC Licence. 2. The red mud is pumped to the BRDA at optimum solids and deposited in layers to
maximise maturing by drying, consolidation and mud farming to optimise overall storage capacity of the BRDA.
3. The approach to the placement of red mud is based on mud farming as described
in Section 5.
4. Storage capacity is developed within the BRDA by construction of rockfill embankments around the BRDA using upstream embankment construction where the underlying red mud supports the upper rockfill embankment.
5. The overall stability of the upstream rockfill core mud retention terraces around the
perimeter of the BRDA is determined by routine monitoring and assessment of the undrained shear strength of the red mud and underlying estuarine soil.
6. The soda content of the red mud and other residues being deposited is minimised
to optimise soda recovery in the plant and to minimise environmental liabilities associated with the BRDA. The soda content of the red mud is further reduced using the mud farming/atmospheric carbonation process.
7. The integrity of all HDPE geomembranes for environmental protection is
maintained. No mobile equipment is permitted to come into direct contact with the geomembrane.
8. The runoff and leachate is directed to and collected in a perimeter channel and
pumped back to the plant for treatment as described in Section 8.0. 9. The surface water inventories in the perimeter channel and adjacent Storm Water
Pond (SWP) are minimised and pumping capacities are maximised as practicably as possible to ensure that there is sufficient operational freeboard for major rainfall events.
10. A water sprinkling dust suppression system is used over the entire red mud and
process sand surfaces to prevent dusting. 11. The downstream toe drains, external watercourses and groundwater observation
wells are routinely inspected and sampled in accordance with IPPCL conditions.
12. All incidents, whether of an environmental or health and safety nature are reported and investigated to ensure that any necessary remedial action is taken and to prevent any re-occurrence of the incident.

RUSAL Aughinish Ltd. Bauxite Residue Disposal Area (BRDA) Operational Plan (BRDA OP001)
Prepared by: P O’Loughlin Date: 12.10.04
Approval Date:
L Fleming:
Reference No. BRDA Operational Plan
BRDA OP001
Issue 1
Revised by: Edward Lowe Date 27.03.13
E Lowe
Page 11 of 29
Rev. 6
5.0 Waste Handling and Placement
The BRDA is a dedicated and engineered facility for the placement of specific process residues as detailed below.
5.1 Red Mud
The majority of red mud slurry is pumped from the Mud Filtration Building in A34 to the BRDA at generally greater than 58% solids. A small proportion of low solids red mud slurry, collected from the maintenance turnaround cleaning of the mud settling and washing tanks, is trucked to the BRDA by the Contractor and deposited on existing red mud surfaces. The red mud including low solids red mud is matured through surface evaporation and the mud farming process as described in 5.8. The placement of red mud within the BRDA is controlled by the procedures: SWM 2022: Area 54A Operation of the BRDA; and SWM 2009 Minimise Mud Soda Losses and Maximise Mud Density to the BRDA. The plant Waste Management Manual (WM001) also covers the placement of red mud (Section 4.3.2.9)
5.2 Process Sand Process sand is the quartzite fraction of the bauxite residue. This is washed as effectively as possible to remove all leachable soda and in particular to extract all leachable sodium aluminate which could potentially contain product (refer to SWM 2006 Area 27A Operation). Process sand is trucked by the Contractor from Area 27 to the BRDA. The transfer of process sand to the BRDA is covered by Section 4.3.1.8 of the plant Waste Management Manual (WM001).
5.3 Salt Cake Salt cake is produced in the liquor purification/oxalate removal area of the process plant (A65). The liquor is purified through the precipitation of impurities that occur when the process liquor is concentrated. These impurities are removed as a filter cake, consisting principally of sodium compounds with carbonate, sulphate, oxalate, fluoride and chloride. Salt cake is classified as a hazardous waste and is deposited within a section of the existing BRDA bunded by red mud and process sand. The disposal of salt cake is covered under Section 4.3.1.8 of the plant Waste Management Manual (WM001).

RUSAL Aughinish Ltd. Bauxite Residue Disposal Area (BRDA) Operational Plan (BRDA OP001)
Prepared by: P O’Loughlin Date: 12.10.04
Approval Date:
L Fleming:
Reference No. BRDA Operational Plan
BRDA OP001
Issue 1
Revised by: Edward Lowe Date 27.03.13
E Lowe
Page 12 of 29
Rev. 6
5.4 Lime Grits These are the insoluble clinker cores of the burnt limestone cobbles dissolved in the lime slaking plant within the process. These are trucked from the process plant to the BRDA by the Contractor and are used as road surfacing materials in the immediate area around the salt cake. The disposal of lime grits is covered under Section 4.3.2.6 of the plant Waste Management Manual (WM001)
5.5 Process Scale
Process scale consists of hydrated sodium aluminium silicate sometimes combined with bauxite residues, removed from the interiors of process tanks, vessels and pipes during routine and turnaround maintenance activities in the process plant. All such scales are trucked by the Contractor to the BRDA and deposited on the existing red mud surfaces or on compacted process sand areas. The disposal of scale is covered under Section 4.3.2.6 of the plant Waste Management Manual (WM001).
5.6 Transport and Placement of Wastes
The BRDA is operated under the SPM Management Contract by Murphy International Ltd. who have overall responsibility for the collection, transportation, and placement of waste. The contract extends to maintenance and resourcing of all equipment, including vehicles, which operate within the BRDA, including environmental control equipment for dust suppression. All residues are either pumped or trucked in specified skips or dumpers to the BRDA area. All drivers are trained to ensure that only wastes permitted for disposal in the BRDA should be contained in the designated skips. If other waste streams are contained in the skips the skips will not be removed for disposal. Drivers are also trained on checking and handling of leachate which may arise. All trucked residues are transported to the BRDA area on a network of internal access roads constructed to engineering standards. Trucked residues must be deposited on a layer of matured red mud. Process sand may be deposited directly onto red mud surfaces provided mechanical plant is confined to adjacent engineered designed and supervised access roads or the mobile plant is moving on a layer of compacted process sand.
5.7 Relevant Standard Operational Procedures
In addition to the sections of the SPM Management Contract and the Waste Management Manual listed above, the following standard operating procedures (standard work methods) deal with the operation of the BRDA:

RUSAL Aughinish Ltd. Bauxite Residue Disposal Area (BRDA) Operational Plan (BRDA OP001)
Prepared by: P O’Loughlin Date: 12.10.04
Approval Date:
L Fleming:
Reference No. BRDA Operational Plan
BRDA OP001
Issue 1
Revised by: Edward Lowe Date 27.03.13
E Lowe
Page 13 of 29
Rev. 6
Table 3 Relevant SWM’s
Procedure Number Purpose
SWM 2005 Wash Circuit Control
SWM 2006 Area 27A Operation
SWM 2009 Minimise Mud Soda Losses and Maximise Mud Density
SWM 2017 Pond Cleanouts and Inspections
SWM 2022 Area 54A Operation of the BRDA
5.8 Mud Farming Process
5.8.1 General Approach
The general approach to be taken is to practice what is called “mud farming”. Mud is deposited in separate drying bays or cells in the BRDA constructed using mud bunds or embankments as detailed on 54-G-1130 (see Appendix 1). A screw-propelled amphirol (photo below) is used to plough the mud in the drying cells on a regular basis to accelerate and improve the natural drying process. This process is also used to maximise the atmospheric carbonation of the red mud residue by increasing the caustic soda / CO2 interface contact. This process continues until the increasing density of the mud residue reduces the effectiveness of the amphirol. A low ground pressure swamp dozer is then used to level the drying cell and reconstruct the cell walls.
Amphirol used for mud farming

RUSAL Aughinish Ltd. Bauxite Residue Disposal Area (BRDA) Operational Plan (BRDA OP001)
Prepared by: P O’Loughlin Date: 12.10.04
Approval Date:
L Fleming:
Reference No. BRDA Operational Plan
BRDA OP001
Issue 1
Revised by: Edward Lowe Date 27.03.13
E Lowe
Page 14 of 29
Rev. 6
5.8.2 Operations
The BRDA Mud Farming operation consists of the following tasks:
Residue Planning
Filling the Drying Cells
Drainage Management
Mud Farming Each of these systems is described below:
Residue Planning
The Phase 1 and 2 BRDAs have been subdivided into approximately 51 separate drying cells as detailed in the attached drawing 54-G-1130 (Appendix 1). Signs identifying each cell number as detailed on 54-G-1130 have been installed on the perimeter of the BRDA. Mud is pumped to the drying cells via 3 pipelines aligned along the road to the Central Discharge Platform. A total of 19 separate discharge points have been installed on the pipelines to facilitate the filling of the drying cells in Phase 1 & 2 as detailed on 54-G-1130. NB. Each discharge point is flushed before a period of non-usage (i.e. > 1 week) to prevent line restrictions and blockages. Mud Points 1 to 10 and 15 to 19 are flushed from the Central Discharge Platform using the recycled water. Mud Points 11 to 14 are flushed by injecting process condensate into the suction of the Area 34 Mud Pumps. The BRDA Operations Team meets weekly and identifies the storage area required for the following week’s production and associated mud farming, drainage and maintenance activities. Outer embankment walls are constructed in a timely manner, to ensure that residue storage area is available on a medium term (quarterly) basis in the BRDA. Surveys of the BRDA are completed on a quarterly basis to estimate the ‘live’ storage volume available. A weekly residue plan is issued each week, on BPI, to Local 2 and the SPF’s detailing the filling plan for the week. This plan details mud valve changes and alternatives in the event of pipeline maintenance requirements or valve problems.
Filling the Drying Cells
A 400mm – 500mm deep layer is filled into each drying cell in 200 – 250mm mud layers. A polymer hose is installed on each discharge point to allow the mud to be spread evenly across the cell. Each cell is surveyed in advance by the SPM Management Contractor to identify, repair and raise sprinkler pipes as necessary.

RUSAL Aughinish Ltd. Bauxite Residue Disposal Area (BRDA) Operational Plan (BRDA OP001)
Prepared by: P O’Loughlin Date: 12.10.04
Approval Date:
L Fleming:
Reference No. BRDA Operational Plan
BRDA OP001
Issue 1
Revised by: Edward Lowe Date 27.03.13
E Lowe
Page 15 of 29
Rev. 6
Cell filling is monitored by the BRDA Operations Team from 8am - 4.30pm Mon - Fri. Cell filling is monitored by the L2 Process Operator and SPF’s during the evenings / nights and at the weekends to ensure that filling is occurring according to the weekly residue plan.
Drainage Management
Drainage from the drying cells will initially be assisted by the long reach excavator to free the “bleed” liquor and rainfall from the cell. After approximately 7 – 14 days, the Amphirol will complete an initial plough of the cell. During this period the excavator will be required to maintain the drainage channels particularly around the embankment walls. Additional drainage may also be required to eliminate areas of standing water at the perimeter of the BRDA.
Mud Farming
Mud farming will commence approximately 7 - 14 days after mud deposition has ceased. A daily inspection of all drying cells is required by the BRDA Operations Team. The amphirol continues to make passes over the mud cells every 3-7 days until the indentations in the mud reduce to < 5 – 10 mm. The cells are then re-built using a low ground pressure bulldozer with perimeter walls approximately 800mm - 900mm in height using mature mud.
Atmospheric Carbonation
The atmospheric carbonation process commences immediately after the mud farming process has been completed. The mature red mud is initially ploughed to break up the compacted red mud surface. The ploughed red mud is then further reduced in size by harrowing to maximize the exposure of the caustic soda in the mud to atmospheric carbon dioxide. The mud is then repeatedly harrowed on a daily basis until the pH is gradually reduced from an initial pH 12-13 until it is < 11.5. In the event of a heavy rain forecast, the mud is rolled to seal the mud surface and prevent water ingress.

RUSAL Aughinish Ltd. Bauxite Residue Disposal Area (BRDA) Operational Plan (BRDA OP001)
Prepared by: P O’Loughlin Date: 12.10.04
Approval Date:
L Fleming:
Reference No. BRDA Operational Plan
BRDA OP001
Issue 1
Revised by: Edward Lowe Date 27.03.13
E Lowe
Page 16 of 29
Rev. 6
6.0 Emergency Procedures The management of emergencies is coordinated by a fully resourced and trained plant security team who are on site 24 hours per day, 365 days per year. In the event of an emergency, the organisation of safety and emergency response is co-ordinated and located centrally at the security gatehouse (A79). The overall plant Emergency Response Plan and procedures covers activities in the BRDA. The plant Emergency Response Plan deals with emergency preparedness, planning, response and co-ordination in the case of significant emergencies or incidents at the plant. The defined categories of emergency include environmental emergencies and emergencies which may have to potential to lead to environmental damage. Environmental Emergency Response Procedure (P007.76.025) details specific measures to be taken in the event of a significant environmental incident at the plant in addition to defining roles and responsibilities in an emergency. The main environmental emergency which can arise in the BRDA is dusting. It is classified as an emergency and is subject to formalised emergency response procedures (P007.02.012 Dust Emergency at the BRDA and P007.02.014 Severe Weather - Frost). Under the SPM Contract, the SPM Management Contractor has defined responsibilities in the event of dusting. These responsibilities extend from prevention to response through:
Review of meteorological conditions
Preventative damping of BRDA
Maintenance of equipment
Operation of sprinklers, bowsers
Resourcing emergency response
Communication with RUSAL Aughinish personnel in an emergency response
Ensuring that relevant SWM’s and Emergency Response Procedures are followed

RUSAL Aughinish Ltd. Bauxite Residue Disposal Area (BRDA) Operational Plan (BRDA OP001)
Prepared by: P O’Loughlin Date: 12.10.04
Approval Date:
L Fleming:
Reference No. BRDA Operational Plan
BRDA OP001
Issue 1
Revised by: Edward Lowe Date 27.03.13
E Lowe
Page 17 of 29
Rev. 6
7.0 Dust Control
Historical evidence shows that incidents of fugitive dust generation occur under the effects of the following:
Wind speeds in excess of 5 m/sec
Freezing or very warm temperatures
Dry air-conditions, i.e. low humidity
The primary objective in management of placement operations at the BRDA is to prevent the formation of conditions where fugitive dust generation can occur.
7.1 Dusting Prevention and Response Measures
The following fugitive dusting prevention and response measures are implemented at the BRDA.
1. Minimise mud flat area exposed to dusting risk by ploughing the mud surfaces via
the mud farming process.
2. Keep mud flats in service (i.e. wet) as long as possible to limit areas of potential dusting.
3. Water spray (dust suppression) sprinkler system installed to ensure 100%
coverage over red mud areas.
4. Ensure bowser units are available to transport and discharge water from the Liquid Waste Pond (LWP).
5. Bowsers should be left at the Liquid Waste Pond outside of normal business hours
and where significant potential for dusting exists. If taken to be used elsewhere on site, must be returned cleaned to the Liquid Waste Pond and filled with water.
6. Open individual valves on sprinklers for approximately five minutes at a time and
rotate as required.
The procedure to be followed in the event of dusting is SWM 2022. 7.2 Shannon Estuary Water Treatment Plant Roofs
Construction and covering of the roofs of the adjacent Limerick County Council Water Treatment Plant was completed in September 2011 in compliance with Condition 6.18 of the IPPCL.

RUSAL Aughinish Ltd. Bauxite Residue Disposal Area (BRDA) Operational Plan (BRDA OP001)
Prepared by: P O’Loughlin Date: 12.10.04
Approval Date:
L Fleming:
Reference No. BRDA Operational Plan
BRDA OP001
Issue 1
Revised by: Edward Lowe Date 27.03.13
E Lowe
Page 18 of 29
Rev. 6
8.0 Surface Water Management and Protection
The BRDA is bounded by the River Shannon, the Robertstown River and Poulaweala Creek. The River Shannon is tidal at RUSAL Aughinish with a range of over 5m (spring tides). Surface water runoff due to rainfall from the Phase 1 BRDA discharges to perimeter interceptor channel 1 (PIC 1). PIC 1 runs along the entire northern, western and southern perimeter of the Phase 1 BRDA. Similarly surface water runoff due to rainfall from the Phase 2 BRDA discharges to perimeter interceptor channel 2 (PIC 2). PIC 2 runs along the western and southern perimeter of the Phase 2 BRDA. PIC 2 is pumped into PIC 1 using a submersible pump with a capacity of 600m3/hr.
The runoff water is pumped from PIC 1 to the Storm Water Pond (SWP), located in the northeastern corner of the BRDA (adjacent to the Liquid Waste Pond) via a submersible pump with a capacity of 750m3/hr. Two pumps are installed in the SWP to recycle surface water to the plant and to the effluent treatment system with a capacity of 375m3/hr each. Surface water runoff is also recycled to the plant from PIC 1 by a submersible pump with a capacity of 750m3/hr. Surface water is treated in an effluent clarification system before ultimately being discharged to the River Shannon. The Pumping capacity of the BRDA and Effluent Treatment system is attached in Appendix 2.
Short term heavy rainfall events in the BRDA are accommodated in the Perimeter Interceptor Channels (PIC 1 & PIC 2), Storm Water Pond (SWP) which have the following storage capacities:
PIC 1 – 110,000m3 plus 28,000m3 freeboard.
PIC 2 – 68,000 m3 plus 20,000m3 freeboard.
SWP – 182,000 m3 plus 60,000m3 freeboard. Total – 360,000m3 m3 plus 108,000m3 freeboard.
This design storage capacity is sufficient to ensure a 1 in 200 year rainfall event can be safely managed within the system, while allowing treated effluent discharges to remain within daily flow limits as specified in the IPPC Licence (Schedule 2(ii)).

RUSAL Aughinish Ltd. Bauxite Residue Disposal Area (BRDA) Operational Plan (BRDA OP001)
Prepared by: P O’Loughlin Date: 12.10.04
Approval Date:
L Fleming:
Reference No. BRDA Operational Plan
BRDA OP001
Issue 1
Revised by: Edward Lowe Date 27.03.13
E Lowe
Page 19 of 29
Rev. 6
9.0 Groundwater Management and Protection
Aughinish Island is hydro geologically isolated from the mainland and can be regarded as an independent groundwater body. The BRDA is underlain by two geologically dissimilar components. The northern part of the Phase 1 BRDA is generally underlain by low conductivity estuarine deposits, which are subject to saline intrusion (with the water table). The original plant BRDA was developed directly on this material. The eastern part of the Phase 1 BRDA is underlain by limestone bedrock. This section of the BRDA is sealed within 1.0mm and 2.0mm thick HDPE sheets, on 600mm of screened glacial till. The Phase 2 BRDA is underlain by estuarine deposits on the west side and by limestone bedrock on the eastern side. The Phase 2 BRDA is sealed within 1.5mm and 2.0mm thick HDPE sheets, on a layer of geosynthetic clay liner (GCL).
9.1 Groundwater Seepage Controls The original northern part of the BRDA was developed over an extensive deposit of low hydraulic conductivity estuarine soil. In addition, the upstream slope of the outer wall around the BRDA and the SWP was sealed with a composite liner consisting of a 750 mm thick compacted glacial till fill covered with a 2.0 mm thick HDPE liner anchored in the estuarine soil along the toe of the Outer wall. In addition, all areas along the toes of the Outer wall where the estuarine soil thickness is less than 4.0 m (applies to the BRDA) or where glacial till or rock outcrop (applies to the SWP) was encountered, were sealed with 2mm thick smooth HDPE liner. All runoff reporting to the open drainage ditch is stored between the Outer wall and the Rockfill Starter Dyke (RFSD).
The extended southern part of the BRDA is sealed with 1.0 and 2.0 mm thick smooth and double textured HDPE sheets. Beneath the HDPE sheets, the subgrade consists of a series of mineral varying from 300mm to 600mm thick depending on the subgrade.
9.2 Seepage/Leakage Management and Control The following seepage and leakage control systems are in place: (1) Collection and pumping back to the open perimeter drains of identified localised and concentrated seepage sources, e.g. around the northwest corner of the original BRDA. (2) A leak collector toe drain along the northern and northwestern edge of the BRDA. Leachate intercepted by the toe drain is routed to a sealed concrete sump from where it is pumped into the SWP or into the Perimeter Channel.

RUSAL Aughinish Ltd. Bauxite Residue Disposal Area (BRDA) Operational Plan (BRDA OP001)
Prepared by: P O’Loughlin Date: 12.10.04
Approval Date:
L Fleming:
Reference No. BRDA Operational Plan
BRDA OP001
Issue 1
Revised by: Edward Lowe Date 27.03.13
E Lowe
Page 20 of 29
Rev. 6
9.3 Landfill Gas
The bauxite residues are inorganic therefore there is no landfill gas generated by the placement of the residues.
9.4 Gabion Mattress Protection of the Outer wall
Installation of a gabion mattress on the downstream slope of the outer wall of the Phase 1 and 2 BRDAs is currently under construction and will be completed by October 2013.

RUSAL Aughinish Ltd. Bauxite Residue Disposal Area (BRDA) Operational Plan (BRDA OP001)
Prepared by: P O’Loughlin Date: 12.10.04
Approval Date:
L Fleming:
Reference No. BRDA Operational Plan
BRDA OP001
Issue 1
Revised by: Edward Lowe Date 27.03.13
E Lowe
Page 21 of 29
Rev. 6
10.0 Leachate Management and Disposal
The BRDA does not generate leachate in the conventional sense of the term (as applied to waste disposal) due to: a) The bauxite process residues placed within the BRDA are inorganic and do not
degrade. b) The red mud on placement and maturation has hydraulic conductivity values of the
order of 1x10⁻⁹ m/sec. Accordingly, recharge and downward movement of liquid into the waste (through precipitation) does not occur.
Although there is no positive leachate collection system in place, washout or bleed water from the red mud is collected in the perimeter channel and returned to the plant for treatment and licensed discharge.

RUSAL Aughinish Ltd. Bauxite Residue Disposal Area (BRDA) Operational Plan (BRDA OP001)
Prepared by: P O’Loughlin Date: 12.10.04
Approval Date:
L Fleming:
Reference No. BRDA Operational Plan
BRDA OP001
Issue 1
Revised by: Edward Lowe Date 27.03.13
E Lowe
Page 22 of 29
Rev. 6
11.0 Life Expectancy
The existing Phase 1 BRDA consists of the original BRDA and the Phase 1 extension, which have been merged since 1999. As the rate of placement is a direct function of production activity, the life expectancy of the BRDA will be reduced with increasing levels of production. Following the commissioning of the Phase 2 BRDA in 2011, the life expectancy of the combined Phase 1 and 2 BRDAs has been increased by 22 years until 2033, based on current production levels and waste generation levels. This is reviewed each year as part of the AER. Further details are provided in Section 3 of the 2013 AER.
The calculated remaining capacity of the BRDA is detailed in Table 46 of the 2013 AER.
12.0 Restoration
A Decommissioning and Closure Plan for the site was prepared by SRK Consulting Ltd. and Enviroplan Services Ltd in 1999 – this included proposals for the restoration and aftercare of the BRDA. The Plan was submitted to the Agency as part of the first plant AER in 1999. A revised plan taking into account the Phase 2 extension to the BRDA was submitted in 2005 as part of the application for a revised IPPC Licence. The plan is updated annually and the most recent update was submitted to the EPA in December 2010. Based on research undertaken to date, it is proposed that the BRDA will be rehabilitated both in the interim (2103) and following final closure of the facility by establishing a surface vegetation cover to ensure physical and chemical stabilisation of the stored bauxite residues. Establishment of vegetation on the bauxite residues stored at the BRDA has been successfully demonstrated by greenhouse and field trials carried out in conjunction with the University of Limerick. To achieve this, amendment of the residue (using gypsum and process sand) is required and an understanding of the basic physical and chemical principles for reclaiming alkaline residues must be established. Considerable attention has been focused on the testing and measures that can be used to ensure appropriate surface soil conditions are present which will promote successful vegetation establishment and surface rehabilitation of the BRDA while controlling costs. Engineering proposals to address the drainage, seepage, control of storm water and surface run-off from the BRDA both in the interim and following final closure of the facility have been investigated and designed by AAL’s consultant Golder Associates.
12.1 Closure and Restoration Programme Closure will involve utilisation of those techniques that have been proven in operations, or demonstrated in field trials, which have the greatest potential to achieve the performance criteria for air, soil, surface water and groundwater. A key element of this closure plan will be the rehabilitation cover for the BRDA. Because of the variety of

RUSAL Aughinish Ltd. Bauxite Residue Disposal Area (BRDA) Operational Plan (BRDA OP001)
Prepared by: P O’Loughlin Date: 12.10.04
Approval Date:
L Fleming:
Reference No. BRDA Operational Plan
BRDA OP001
Issue 1
Revised by: Edward Lowe Date 27.03.13
E Lowe
Page 23 of 29
Rev. 6
wastes within the BRDA, there are several different surface treatments which will be necessary in order to ensure that performance criteria are achieved following closure. The BRDA will be rehabilitated to ensure physical and chemical stabilisation of the red mud. The newly created soil (red mud mixed with process sand, gypsum and organic waste) will be seeded with a grassland seed mixture, and fertiliser applied by broadcast spreader. AAL propose to achieve self-sustaining vegetation cover after a period of five years. It is proposed that through delivery of ‘completion criteria’ sustainability of the vegetation cover system can be demonstrated. Steps will be taken to ensure that a suitable drainage system is established on the rehabilitated BRDA. Engineered surface water drainage berms will be created to allow for stormwater drainage. Careful supervision will be provided during final mud deposition on the BRDA to ensure the surface topography remains consistent for the construction of a system to direct surface water and lateral seepage safely off the BRDA.
The maintenance of efficient surface water drainage from the BRDA, avoiding as far as possible soil erosion into the perimeter channel, will contribute to the improvement of water quality after closure. With time, it is expected that rainwater flushing and wet-dry cycles in the surface layers of the BRDA, will improve water quality so that runoff and seepage can be discharged without treatment.
12.2 Interim Restoration As part of the extension of the BRDA, an interim restoration plan will be put in place to provide for intermediate cover of the perimeter embankment slopes as the height of the area is increased. This will involve the installation of a mud drain just below the operating mud stage, which will intercept and drain water in a controlled manner to the Perimeter Interceptor Channel. Construction of this drain was completed in 2012 in advance of the landscaping works in 2013. Each of the stages on the Phase 1 and Phase 1 Extension will then be improved by infilling the external step with a drainage medium and topsoil, thereby giving the BRDA the appearance of a sloped and domed hill.
12.3 Timeframe
Table 5 shows the proposed fill dates for each phase of the BRDA. Restoration of the BRDA will be carried out on a phased basis. Interim landscaping of Stages 1-8 side slopes in the Phase 1 BRDA will be completed in 2013 and will include design features to allow for the further restoration and closure of the entire BRDA. The southern face of the Phase 1 BRDA Stages 1 to 7 will also be landscaped, though it will be later obscured by progressive filling of the Phase 2 BRDA. Landscaping of Stages 1-6 of the Phase 2 BRDA will occur after Stage 6 is constructed. It is estimated that the entire BRDA will reach capacity by approximately 2034. Following full closure, all remaining Stages and the domed surface of the BRDA will be restored.
Table 5 Timing of Stages in the BRDA
Date Phase 2 Phase 1 Phase 1 Extension

RUSAL Aughinish Ltd. Bauxite Residue Disposal Area (BRDA) Operational Plan (BRDA OP001)
Prepared by: P O’Loughlin Date: 12.10.04
Approval Date:
L Fleming:
Reference No. BRDA Operational Plan
BRDA OP001
Issue 1
Revised by: Edward Lowe Date 27.03.13
E Lowe
Page 24 of 29
Rev. 6
2012 Fill Starter Dam Stage 9 Stage 8
2013 Fill Starter Dam Stage 9 Stage 8
2014 Stage 1 Stage 9 Stage 8
2015 Stage 1 Stage9 Stage 9
2016 Stage 1 Stage9 Stage 9
2017 Stage 2 Stage 9 Stage 9
2018 Stage 2 Stage 9 Stage 9
2019 Stage 3 Stage 10 Stage 10
2020 Stage 3 Stage 10 Stage 10
2021 Stage 4 Stage 10 Stage 10
2022 Stage 4 Stage 10 Stage 10
2023 Stage 5 Stage 10 Stage 10
2024 Stage 5 Stage 10 Stage 10
2025 Stage 6 Stage 10 Stage 10
2026 Stage 6 Phase 1
Extension full Phase 1 Extension
full
2027 Stage 7
Restore Phase 1 Restore Phase 1
2028 Stage 7
2029 Stage 8
2030 Stage 8
2031 Stage 9
2032 Stage 9
2033 Stage 10
2034 Phase 2 Extension full

RUSAL Aughinish Ltd. Bauxite Residue Disposal Area (BRDA) Operational Plan (BRDA OP001)
Prepared by: P O’Loughlin Date: 12.10.04
Approval Date:
L Fleming:
Reference No. BRDA Operational Plan
BRDA OP001
Issue 1
Revised by: Edward Lowe Date 27.03.13
E Lowe
Page 25 of 29
Rev. 6
13.0 Aftercare Management 13.1 Aftercare Monitoring
Success of surface re-vegetation (which will be critical in meeting requirements for control of fugitive dust and valuable in the limitation of subsurface seepage and the maintenance of geotechnical stability) will be measured on the basis of vegetation and soil biological surveys. These surveys will be conducted annually until Year 5 upon which time it is anticipated that the re-vegetation programme will be deemed successful. Should the five-year objective not be met, AAL will identify the measures that it will undertake to improve the performance of the cover.
At closure, the water sprinkler system will continue for a limited period, particularly throughout any periods of leaching and weathering, until surface rehabilitation by a vegetated surface cover is established. The long-term suppression of fugitive dust will be achieved by installing a vegetation cover with sufficient density to retain the residue material.
Water treatment will no longer be considered necessary when the pH in the perimeter channel is maintained at less than or equal to pH 9 with a Total Suspended Solids (TSS) of less than 50 mg/l for 90% of the samples taken over a 12-month period. Following attainment of water quality objectives for a one-year period without treatment, the water management system will be decommissioned. The perimeter channel and the SWP can then be breached (with spillway and sluice constructions) to allow for direct discharge to the Shannon Estuary via the Robertstown River. It is anticipated that this can be achieved within five years post-closure. Monitoring of surface water quality and groundwater quality in the vicinity of the BRDA will continue for a period of up to 30 years post closure. To monitor geotechnical stability, for five years after the closure of the BRDA, AAL will conduct periodic monitoring of subsoil moisture, to demonstrate that the suction head for the upper subsoil layers is being maintained, or reduced, as a result of the rehabilitation measures.
13.2 Final Land Use
The preferred land-use option for the BRDA, based on current knowledge of the chemistry and biology of the sown grassland cover, is to develop the area for nature conservation. A section of AAL land to the north of the BRDA has already been developed as a Bird Sanctuary, so the development of a nature conservation area is in keeping with AAL land conservation practices. The bird sanctuary management has been featured and reported on by organisations such as the Irish Wildbird Conservancy since its development in 1981. The choice of end-use is also in line with procedures in the 2004 EU BREF on Tailings Management where it states that ‘rehabilitation is such that the ultimate land use is optimised and is compatible with the surrounding area and the requirements of the local community’.

RUSAL Aughinish Ltd. Bauxite Residue Disposal Area (BRDA) Operational Plan (BRDA OP001)
Prepared by: P O’Loughlin Date: 12.10.04
Approval Date:
L Fleming:
Reference No. BRDA Operational Plan
BRDA OP001
Issue 1
Revised by: Edward Lowe Date 27.03.13
E Lowe
Page 26 of 29
Rev. 6
Lands adjacent to the AAL facility are subject to EU and national environmental designations and the sensitivity of these environmental receptors, particularly in the key areas of surface and groundwater quality, have been taken into account in the design of the BRDA restoration and aftercare process.
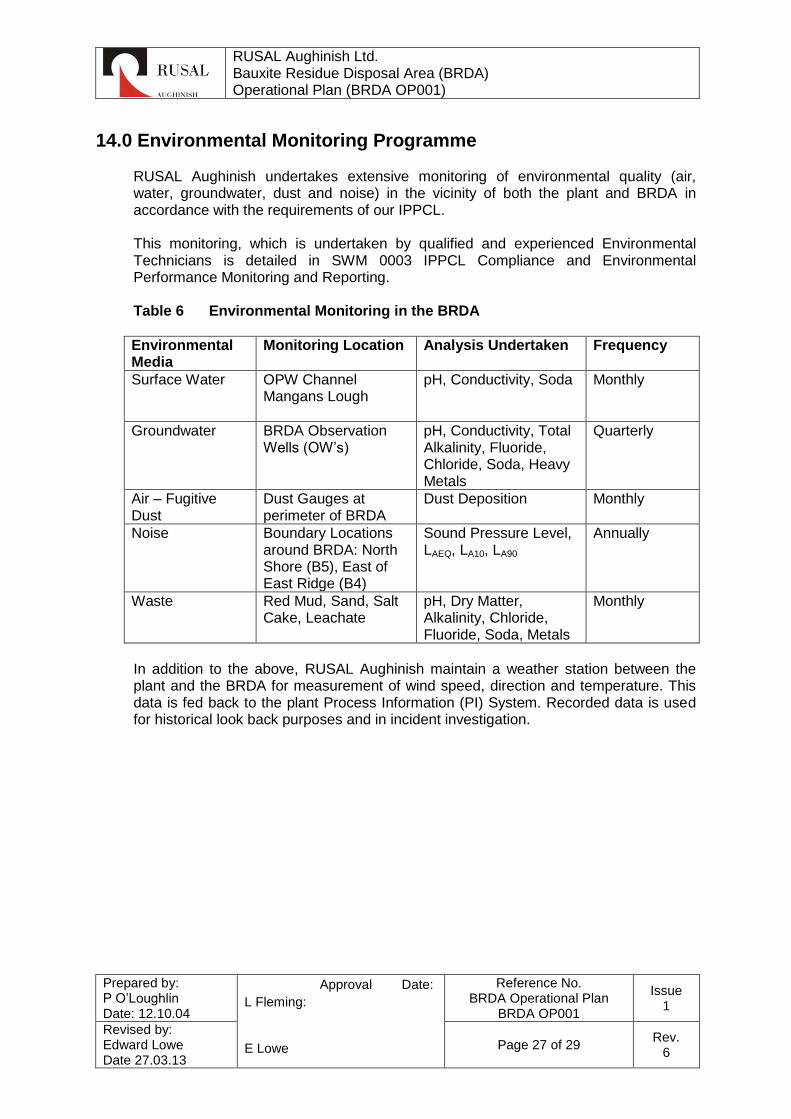
RUSAL Aughinish Ltd. Bauxite Residue Disposal Area (BRDA) Operational Plan (BRDA OP001)
Prepared by: P O’Loughlin Date: 12.10.04
Approval Date:
L Fleming:
Reference No. BRDA Operational Plan
BRDA OP001
Issue 1
Revised by: Edward Lowe Date 27.03.13
E Lowe
Page 27 of 29
Rev. 6
14.0 Environmental Monitoring Programme RUSAL Aughinish undertakes extensive monitoring of environmental quality (air, water, groundwater, dust and noise) in the vicinity of both the plant and BRDA in accordance with the requirements of our IPPCL. This monitoring, which is undertaken by qualified and experienced Environmental Technicians is detailed in SWM 0003 IPPCL Compliance and Environmental Performance Monitoring and Reporting. Table 6 Environmental Monitoring in the BRDA
Environmental Media
Monitoring Location Analysis Undertaken Frequency
Surface Water OPW Channel Mangans Lough
pH, Conductivity, Soda Monthly
Groundwater BRDA Observation Wells (OW’s)
pH, Conductivity, Total Alkalinity, Fluoride, Chloride, Soda, Heavy Metals
Quarterly
Air – Fugitive Dust
Dust Gauges at perimeter of BRDA
Dust Deposition Monthly
Noise Boundary Locations around BRDA: North Shore (B5), East of East Ridge (B4)
Sound Pressure Level, LAEQ, LA10, LA90
Annually
Waste Red Mud, Sand, Salt Cake, Leachate
pH, Dry Matter, Alkalinity, Chloride, Fluoride, Soda, Metals
Monthly
In addition to the above, RUSAL Aughinish maintain a weather station between the plant and the BRDA for measurement of wind speed, direction and temperature. This data is fed back to the plant Process Information (PI) System. Recorded data is used for historical look back purposes and in incident investigation.

RUSAL Aughinish Ltd. Bauxite Residue Disposal Area (BRDA) Operational Plan (BRDA OP001)
Prepared by: P O’Loughlin Date: 12.10.04
Approval Date:
L Fleming:
Reference No. BRDA Operational Plan
BRDA OP001
Issue 1
Revised by: Edward Lowe Date 27.03.13
E Lowe
Page 28 of 29
Rev. 6
Appendix 1

RUSAL Aughinish Ltd. Bauxite Residue Disposal Area (BRDA) Operational Plan (BRDA OP001)
Prepared by: P O’Loughlin Date: 12.10.04
Approval Date:
L Fleming:
Reference No. BRDA Operational Plan
BRDA OP001
Issue 1
Revised by: Edward Lowe Date 27.03.13
E Lowe
Page 29 of 29
Rev. 6
Appendix 2

Aughinish Alumina Ltd. March 2013 AER 2012
This page is intentionally blank

Aughinish Alumina Ltd. March 2013 AER 2012
Attachment 7 BRDA Closure Planning & Re-vegetation

Aughinish Alumina Ltd. March 2013 AER 2012
This page is intentionally blank

Residues Solutions Report - Recommendations (Condition 8.4.17) – Update March 2013
1
R. Courtney
Closure Planning
Address some gaps in the understanding of the surface water quality in the closure plan.
Improve the long-term predictions of water quality, by a better understanding of residue
leachate chemistry and by conducting a more comprehensive assessment of the residue
permeability and leaching characteristics. This is not an urgent action; however, it will take a
considerable period to determine with precision. It is recommended that:
1. Clear confirmation of the likely starting pH of the residue for all leaching testing.
In the documentation reviewed and recent experiments there is over 1 unit
difference in pH. While this may appear to be a minor issue it impacts on the
predicted alkalinity leaching rate and potential effluent water quality.
Successful employment of the mud farming practice on the BRDA promotes carbonation of
the red mud within the BRDA resulting in partial neutralisation to a stable pH around 10.5.
2. Make a more thorough assessment of the rainfall variability and impact on
surface water quality with emphasis on the likely leachate quality variation and
impacts on the proposed management approach.
Leachate quality and run-off will be monitored within the recently established trial cell
demonstration area. Surface run-off quality data from revegetated area will be collected and
all leachate/ run-off data will be included in model for water quality operation of a
constructed wetland treatment cell.
The effects of dilution rates and water quality on BRDA leachate pH and alkalinity are being
assessed as part of the constructed wetlands project.
3. The effluent water quality variability is also likely to be influenced by the run-off
water quality of the vegetated surface and the rate at which organic material or
gypsum will need to be added to ensure maintenance of a growth horizon in the
residue. A detailed review of the changes in surface water quality in response to
the management practices required to sustain the re-vegetation is required.
Results from 5yr old revegetated residue show that organic matter is accumulating and that
Ca content in vegetation is not deficient. Continuous monitoring of vegetated residue
physico-chemical conditions will determine if conditions deteriorate to an extent where
supplemental gypsum application is required. Findings thus far indicate that the decrease in
exchangeable sodium achieved for vegetation establishment has been successful and levels
decrease further (Fig. 1). Supplemental gypsum/ organic matter addition is not anticipated in
such a scenario.

Residues Solutions Report - Recommendations (Condition 8.4.17) – Update March 2013
2
R. Courtney
Fresh Yr 1 Yr 5 Yr 100
500
1000
1500
2000
Residue treatment
Na (
mg
/kg
)
Figure 1. Exchangeable sodium in fresh bauxite residue and in restored residue over a
10-yr sampling period
4. A long-term or accelerated freshwater leaching of residue column study is
required to confirm the leachate chemistry and provide data to support the
theoretical position. This program should include a thorough investigation of the
alkalinity leaching chemistry. If possible, the opportunity to conduct a core drill
should be considered to examine some of the initial residue placed by the plant
before 1985 as this would have had an opportunity to leach for over twenty years.
Collection of leachate data from the trial cell is summarised below (Table 1). Residue
leachate pH, conductivity and soda content have all increased over the 4 year sampling
period. Leachate collected over this period is composed of entrained liquor from the residue
that was pumped to the cell at high soda and moisture content (due to plant operational
conditions at time). However, this cell has recently been pumped dry and future samples
should therefore be of recharge of residue with fresh percolation leachate and influenced by
the vegetation cover now growing on amended residue surface.
Table 1. Selected properties of BRDA trial cell leachate
pH EC
(µs/cm)
Na2O
(g/l)
May-07 12.62 26710 9.6
Sep-07 13.02 37100 11.3
Mar-11 13.24 67400 16
Sep-11 13.22 68300 16.5

Residues Solutions Report - Recommendations (Condition 8.4.17) – Update March 2013
3
R. Courtney
5. An appropriate statistically robust permeability monitoring program followed by
a probabilistic approach to the estimation of vertical and horizontal permeability
is required to provide confidence limits around the anticipated surface water
dilution flows. This information will ensure the modelling precision exists to
develop reasonable confidence in predicting when the effluent water quality
objective will be met.
This has yet to be undertaken.
6. Given the uncertainty in the effluent water quality, specific research is required as
part of AAL’s ongoing BRDA Closure Plan to address the potential for pH control
beyond the budgeted 5 years of operation of the run-off neutralization plant.
Pending confirmation of the leachate chemistry over time via the Closure
Demonstration Cells it would be prudent to consider development of a wetlands
or similar facility to trim the final pH of the run-off prior to final discharge.
Constructed wetland.
Constructed wetlands are designed and built for specific purposes and are recognised as
effective remediation technology for a wide range of polluting effluents. Use of constructed
wetlands to treat alkaline leachates has recently been demonstrated in both literature and
industrial site visits, and the potential exists for similar concepts for alkaline bauxite residue
leachate. Preliminary trials have demonstrated the potential for wetland type substrates to
buffer alkalinity in synthetic residue leachate.
Rusal Aughinish has been successful (February 2012) in obtaining research funding from the
International Aluminium Institute (IAI) to implement a pilot wetland to treat residue leachate.
The pilot wetland cell has been constructed on the BRDA and planted with wetland
vegetation (Phragmites australis, Typha latifolia and Sparganium erectum) (Plate 1). The
constructed wetland ecosystem will require a minimum of one-year for establishment before
receiving BRDA leachate. A PhD study has commenced (September 2012) using
complimentary laboratory based batch trials to investigate mechanisms that occur within
wetland systems.
o Dilution effect on leachate alkalinity
o The effect of organic matter in buffering leachate alkalinity
o The effect of CO2 in buffering leachate alkalinity
Anticipated leachate quality at closure will be diluted by surface run-off from the amended
and restored BRDA. A leachate dosing system that will simulate closure quality leachate is
currently gone to tender. The system will be comprised of a series of tanks the will mix
BRDA leachate with water to a predetermined pH and is anticipated to be in place by early
summer.
This pilot constructed wetland study will be well placed to examine the temporal variability
of both surface runoff and BRDA leachate generation.

Residues Solutions Report - Recommendations (Condition 8.4.17) – Update March 2013
4
R. Courtney
Plate 1. Wetland cell constructed on BRDA. Vegetation is currently in the
establishment phase.

Residues Solutions Report - Recommendations (Condition 8.4.17) – Update March 2013
5
R. Courtney
7. As all land-forms are susceptible to erosion, the potential erosion risk of the post-
closure BRDA should be assessed and modelled under a range of potential
scenarios.
In its unamended state the fine fraction residue (red mud) lacks aggregation. This lack of
structural stability can promote seal and crust formation at the soil surface, resulting in
erosion. Furthermore, structural problems created by physical processes such as dispersion of
clay minerals and specific conditions such as surface crusting and hardsetting may affect
water and air movement, plant-available water-holding capacity, root penetration, seedling
emergence and tillage and sowing operations.
Table 2 illustrates the effect of the amendment and restoration process in improving residue
physical properties. Texture of unamended residue is dominated by fine particle size (silt and
clay) leading to poor physical quality as a growth medium. Amended and restored residue
exhibits properties analogous to soils taken from adjacent unmanaged grassland from within
the refinery site. Further, initial decreases in residue pH and EC from the restoration process
are further improved over time, illustrating the overall soil development that occurs in the
residue.
Due to the high exchangeable sodium (ESP) content of the mud, dispersion is the driving
force controlling the breakdown of microaggregates, resulting in immediate production of
dispersed clay.
Gypsum and organic matter applications are used in the restoration process on the residue.
The basis of microaggregate (<250 µm) formation in soils is flocculation of soil colloids
through the formation of clay–organic matter complexes linked together by polyvalent
cations and it is recognized that gypsum has a role in flocculating clay particles in soils and is
effective in stabilizing aggregates under 250 µm.
Formation of aggregates is important in the formation of soil structure since the pores within
and between aggregates provide for gaseous exchange, water storage and transport as well as
serving as microhabitats for soil biota. The stability of the porous structure is dependent on
the stability of aggregates. Thus water stable aggregation (the ability of aggregates to
withstand the slaking and dispersive effects of water) is an important structural property.
Effect of residue physico-chemical parameters (carbon content and ESP) on aggregate
stability is shown in Figure 2. Water stable macro aggregates (> 250 µm) of different residue
treatments are shown in Figure 3b.

Residues Solutions Report - Recommendations (Condition 8.4.17) – Update March 2013
6
R. Courtney
W . S . A (% )
% C
(5
3-2
00
mm
)
0 2 0 4 0 6 0 8 0 1 0 0
0
5
1 0
1 5
0 2 0 4 0 6 0 8 0 1 0 0
0
2 0
4 0
6 0
8 0
1 0 0
r2 = 0 .7 4
W . S . A (% )
ES
P (
%)
(a )(b )
Figure 2. Relationship of residue C content (a) and ESP (b) with water stable
macroaggregates (W.S.A.)
The monitoring programme for the restored BRDA includes the residue physical properties
and factors influencing them eg. ESP, organic matter, pH and microbial biomass.
0 1 0 2 0 3 0 4 0 5 0 6 0
1 0
1 5
2 0
2 5
3 0
E S P (% )
% <
2
m
(a)
2 0
4 0
6 0
8 0
1 0 0
U n a m e n d ed
A m e n d e d
R e s to re d
WS
A %
(b )
Figure 3a – Relationship of residue exchangeable sodium (Na) with dispersible clay
content
Figure 3b – Water stable aggregates (WSA) proportions in different residue treatments

Residues Solutions Report - Recommendations (Condition 8.4.17) – Update March 2013
7
R. Courtney
Bare
Residue
1 yr old
restored
residue
10 yr old
restored
residue
‘Natural’
Soil
Sand (%) 13.3 68.9 69.5 67.7
Silt (%) 45.4 20.3 22.8 29.1
Clay (%) 41.4 10.9 7.8 3.1
Texture Silty clay Sandy loam Sandy loam Sandy loam
pH 10.1 8.2 7.4 7.3
EC (mS/cm) 3.1 0.96 0.36 0.33
Particle density (g cm−3
) 3.42 2.6 3.2 2.68
Bulk density (g cm−3
) 1.34 0.81 1.1 0.87
Porosity (%) 59 69 65 67
(Macro) Aggregate Index (WSA) 27 71 97 97
Mean diameter dispersed
microaggregates (<53 µm )
9 12 19 23
Table 2. Selected physico-chemical properties of the bauxite residue treatments (bare,
unamended residue and restored residue over time).

Residues Solutions Report - Recommendations (Condition 8.4.17) – Update March 2013
8
R. Courtney
Plate 2. Examples of residue lacking of structure with increased erodibility risk in
unamended residue (right) and formation of soil structure in restored
residue (left)

Residues Solutions Report - Recommendations (Condition 8.4.17) – Update March 2013
9
R. Courtney
Closure - Revegetation
8. It is likely that the sustainability of the proposed re-vegetation on a stable,
naturally draining residue deposit will be dependent on several key issues.
Further experimentation is required to examine the sustainability of the
revegetation by:
8a. Ensuring that there are sufficient nutrients for the re-vegetation and that the
cycling of nutrients develops to a self-sustaining level enabling input of new
nutrient sources to be minimized. A review of the cycling demands of these
nutrients, amendments and the relationship with the surface water quality is
required.
Nutrient supply
Findings from the BRDA trials and international literature review on unamended residue are
summarised. Organic matter (organic C, total N) content of unamended bauxite residues is
very low and N additions as inorganic fertilizer and/or organic waste need to be applied.
Extractable, plant-available P levels are also very low and Deficiencies of Ca, Mg and K can
also occur in unamended residue since the dominant exchangeable cation is Na.
Micronutrient fertilizer additions (particularly Zn, Cu, and Mn) are also required. A review
of international literature on bauxite residue restoration yields findings in agreement with
findings here.
Furthermore, results and recent international residue literature has cited the shortcomings of
total elemental analysis and some standard agronomic soil tests for application on mine
residues, including bauxite residue. Comparison of standard soil tests for assessing nutrient
availability in amended residue is ongoing.
e.g Plant available Phosphorous in; Courtney, R. and Harrington, T. (2010) Assessment of
plant-available phosphorus in a fine textured sodic substrate. Ecological Engineering. 36:
542-547
Nutrient supply through organic matter additions with supplemental inorganic fertilisers is
the standard practice for revegetation of the BRDA.
In order to test the effectiveness of amendments at promoting revegetation, bauxite residue
was amended with varying rates of compost to increase fertility (0, 60, 80 and 120 t ha-1
) and
gypsum to reduce sodicity (0, 40 and 90 t ha-1
). Amended residue was sown with Holcus
lanatus, a perennial grass. Following a 1-year growth period, substrate properties, plant
performance and plant nutrient uptake were assessed. Compost application substantially
increased substrate N, P, K and Mn concentrations, while gypsum application greatly reduced
sodicity and improved nutrient uptake for Mn and P. Compost amendment was essential for
sustainable plant growth. Foliar deficiencies in N, P and Mg may persist with lower compost
application rates, requiring the addition of supplemental fertiliser for healthy plant growth.
Whilst land application of organic wastes (biosolids) can supply appreciable N and P, nutrient
levels in amended residues will depend on the type of waste applied and application rate.
With sufficient organic amendment, plant nutrient content in restored residue are within
typical ranges reported for grasslands (Table 4).

Residues Solutions Report - Recommendations (Condition 8.4.17) – Update March 2013
10
R. Courtney
Table 3. Selected residue substrate parameters for different treatments and
desired range for plant growth
Amended
Unamended SMC
0 t ha-1
SMC
60 t
ha-1
SMC
120 t
ha-1
Desired
range
N (g kg-1
) P (mg kg
-1) C (%) Mn (mg kg
-1)
Zn (mg kg-1
) Cu (mg kg
-1)
n.d
<5
n.d
n.s
n.s
n.s
n.d
<5
0.96
0.34
0.31
0.25
0.05
6.9
1.6
1.14
1.12
0.36
0.10
9.1
2.3
2.27
2.27
0.54
1-5
0.2-2
0.1-2.5
SMC = Spent Mushroom Compost;
n.d not determined – below range, n.s. not sampled
Table 4. Nutrient range in Holcus lanatus growing on restored residue and typical
range for grasslands.
Bauxite
Residue
Range
Typical
range**
N (%)
Ca (%)
P (%)
K (%)
S (%)
Mg (%)
Zn (mg /kg)
1.5 – 3
0.57 – 0.93
0.27 – 0.40
2.2 – 4.5
0.23 – 0.38
0.13 – 0.19
15.6 - 29.2
1 – 5
0.33 – 0.73
0.1 – 0.6
2.16 - 4.01
0.15 – 0.6
0.08 – 0.26
10-14

Residues Solutions Report - Recommendations (Condition 8.4.17) – Update March 2013
11
R. Courtney
Nutrient cycling and soil biota
Nutrient cycling in the restored residue is being assessed through physico-chemical
parameters such as nutrient pools in the residue and plant content and biological assays
including soil biota and plant litter decomposition, microbial communities, enzyme activity,
and carbon respiration. Plant Ca content for two species over a five year monitoring period is
shown below (Figure 4).
H lanatus T pratense0.00
0.25
0.50
0.75
1.00
1.25
1.50
1.75Yr 1
Yr 2
Yr 5
Ca (
%)
Figure 4. Ca concentration in Holcus lanatus and Trifolium pratense growing in
amended and restored residue over a five year period.
Nutrient cycling within the restored residue areas is demonstrated through the use of
litterbags. Here, plant litter is placed within mesh of varying aperture size permitting or
excluding entry of soil biota. Loss of mass within the litterbag infers consumption and
degradation of the plant litter by the soil biological community. Plate 3 (below) illustrates the
litterbag methodology. Litterbags are employed in the restoration treatments (including bare
residue) and differences sites and seasonal variations are assessed. Results in Figure 5 are
seasonal averages for 2012. The decrease in plant litter mass placed on bare residue is
explained by its attraction to the invertebrates established in restored areas. Significant
increase is observed within one year of restoration, illustrating rapid colonisation by soil
biota. The older restored site has significantly highest mass loss as a result of supporting a
more diverse soil biota community (Figures 6 and 7).
Keystone soil biology species indicative of stable ecosystems have been identified in
revegetated residue e.g. certain earthworm/ soil nematode groups. Factors controlling the
colonisation and survival in the bauxite residue are being assessed.

Residues Solutions Report - Recommendations (Condition 8.4.17) – Update March 2013
12
R. Courtney
Plate 3. Plant Litter experiment. Aperture sizes permit entry of macro-
invertebrates.
% m
as
s l
os
s p
er d
ay
0
1
2
3
B a re R e s id u e
1 y r o ld re s to re d re s id u e
1 0 y r o ld re s to re d re s id u e
Figure 5. Plant litter mass loss (decomposition) in the different residue restoration
treatments

Residues Solutions Report - Recommendations (Condition 8.4.17) – Update March 2013
13
R. Courtney
No
. o
f S
pe
cie
s
Sp
r ing
Su
mm
er
Au
tum
n
Win
ter
0
5
1 0
1 5
2 0
B a re R e s id u e
1 y r o ld re s to re d re s id u e
1 0 y r o ld re s to re d re s id u e
Figure 6. Macroinvertebrate diversity in the bauxite residue treatments.
D e h y r o g e n a s e a c tiv ity
TP
F m
g/d
wt(
g)
0
5 0
1 0 0
1 5 0
2 0 0
B e ta g lu c o s id a s e a c t iv ty
0
5
1 0
1 5
2 0
2 5
B a re R e s id u e
1 y r o ld re s to re d re s id u e
1 0 y r o ld re s to re d re s id u e
Figure 7. Increasing microbial activity over time indicating nutrient cycling.
Functional potential of microbial communities in the residue was evaluated by measuring
extracellular enzyme activities. Dehydrogenase activity, which reflects overall microbial
activity in the residue substrate, and â-glucosidase activity is related to the carbon cycle, and
fulfils a central role in the cycling of organic matter. Activity of both enzymes is negligible
in bare residue. Amendment of residue and sustained plant growth leads to increase over
time in the respective enzymes activity illustrating microbial function and nutrient cycling.
Limiting factors to enzyme activity and restoration management techniques to promote
activity is an ongoing area of research on the BRDA.

Residues Solutions Report - Recommendations (Condition 8.4.17) – Update March 2013
14
R. Courtney
8b. Ensuring that there is a suitable post-closure monitoring and control within
the overall Closure Plan to address nutrient needs, erosion control, prevention
of burrowing animals and controlled human access.
A post-closure monitoring programme is being developed for assessing success of residue
restoration in the Closure Plan
A monitoring programme that will assess the functioning ability of the restored residue has
been developed. The following ‘Completion criteria’ will be periodically assessed and,
where necessary, management intervention implemented. A sampling and monitoring
programme is now in place that assesses the success of the residue restoration. Key
components include;
i. Vegetation establishment, survival and succession
ii. Vegetation productivity, sustained growth and structure
development;
iii. Soil fauna colonisation and habitat development;
iv. Ecosystem processes such as soil development and nutrient
cycling,
v. Colonisation of specific fauna groups that are involved in these
processes
vi. Microbiological studies e.g. colonisation by mycorrhizal fungi and
microbial biomass
vii. Ecosystem recovery
For example, collated data on residue Ca, ESP, pH, organic content and microbial biomass
alongside micro and macro aggregate content will be used to assess erosion resistance.

Residues Solutions Report - Recommendations (Condition 8.4.17) – Update March 2013
15
R. Courtney
Post closure
9. The current design does provide some flexibility in the post-closure land-use. It
should be emphasised that the proposal of a land-use supporting ‘Amenity’ is a
minimum objective. The potential exists for limited carbon-capture or fodder
cropping given sufficient time and organic resources to construct a suitable
growing zone on the residue surface. Further investigation into both the carbon
capture (Carbon dioxide capture in grasses) and fodder cropping (harvesting of
vegetation to supplement off site livestock feed) is recommended.
Fodder crop
A field trial was used to investigate the potential for fodder crops to be grown on the
amended residue. On residue exhibiting pH <8.2 and ESP < 9 alongside nutrient supply a
Lolium perenne/ Trifolium repens grassland mix was seeded. Following a growing season, a
one-cut assessment of its fodder quality was determined. A range of values are shown
(Table 5).
Parameter Range
Dry Matter Content (%)
Total Crude protein (%)
MAD Fibre (%)
Digestibility (D value)
Metabolisable energy (MJ/kg)
Digestible crude protein
(g/kg)
11.5 - 17.6
18.8 - 28.4
22.4 – 25
72 – 75
11.3 - 11.8
133 - 219
Table 5. Fodder quality of vegetation harvested from amended and seeded residue
Compared to typical values determined for Irish fodder crops. Fodder quality from amended
residue is summarized. It has very high crude protein content and a reasonable digestibility.
These results compare to excellent grass silage of 20-30 % DM, 15-16 % crude protein and
75-79 % DMD, good grass silage of 20-25% DM, 14% crude protein and 72-75 % DMD,
average grass silage of 20-25 % DM, 11% crude protein and 64-69 % DMD, and to well-
managed grazed grass of 11-18 % DM, 16-24 % crude protein and 75-82 % DMD.
Additional analyses have not found any elevated levels of plant aluminum, iron or sodium
content that would be detrimental to fodder quality.
Other
Biomass
The potential for biomass crops to be grown on the amended residue exists. Several species,
Alnus, Betula, and Salix have successfully colonized the restored residue surface. This has
been on residue restored for ‘amenity’ land-use. In order to promote high yields of these
crops supplemental nutrients and management are required. Due to trial size restrictions on
the operating BRDA it has not been possible to pursue this.

Residues Solutions Report - Recommendations (Condition 8.4.17) – Update March 2013
16
R. Courtney
Alternative uses of residue
10. AAL needs to remain engaged in the industry evaluation and development of
alternative use applications of bauxite residue (this progress should also be
shared with the community). This should continue to be funded via AMIRA and
other alumina focused research groupings. However, it is recommended that AAL
consider:
10a. Funding of regionally focused research for direct, local applications
of bauxite residue alternative uses. This would preferably utilise local
research institutions and local businesses. If executed correctly this
approach can be used as part of the community engagement program
and generate value where currently only a liability is evident.
10b. A market research review of the competing products to potential
bauxite residue applications and identify potential commercially
viable projects or products. A market driven approach allows the
identification of opportunities that research efforts can be directed at
rather than researching an application that cannot be applied. The
essence is to let the market demand for bauxite residue drive the
approach.
10c. Engaging with EPA to confirm a regulatory pathway for the
development of alternative use applications.
10d. Utilising product development techniques, develop the “Path to
Market” and base the economics of the venture on a “profitless”
business concept where the “negative” current value of bauxite
residue drives a cost recovery approach thereby maximising profit
opportunities for downstream businesses and minimising liability for
AAL.
10e. Assessing the potential for application of residue in an un-neutralized
form to high volume low value applications. If this is not feasible then
application with neutralized residue may be the only means. As bauxite
residue is a resource of limited but sustaining value consideration
should be given as to how the BRDA could be accessed for recovery of
bauxite residue for alternative uses. Re-mining for re-use applications
could be considered as a viable means of gradually eliminating the
BRDA as a structure if a commercially sustainable re-use of the
residue is developed.
Globally less than 2% of bauxite residue is reused or further processed. The industry is now
committed to improving this rate with a target of 20% reuse within the next decade.
Aughinish will participate in this industry driven collaboration to explore effective routes for
bauxite residue utilization.
High volume applications of bauxite residue within the confines of Ireland will be limiting
with land application of modified residue being the most likely option. This has been
conducted in other jurisdictions eg. Sardinia where bauxite residue is used for treating acid
generating mine wastes. Feasibility of replicating such a practice with the inclusion of
regulatory bodies can be explored.

Residues Solutions Report - Recommendations (Condition 8.4.17) – Update March 2013
17
R. Courtney
11. Consider the merits of operating a batch bauxite residue neutralization operation
at the BRDA to allow harvesting, treatment and controlled re-use of the current
un-neutralized bauxite residue deposit. Should process sand cease to be employed
beneficially in the BRDA…adopt the process sand investigation approach of
Cooling & Jameson (2004) to define the characteristics needed to develop a
sustainable end-use for process sand. These include:
Full characterisation of process sand – physical, chemical properties;
Assess the need for neutralization of sand – Confirm the presence of bound
soda or whether further washing will be sufficient;
Conduct parallel tests on sub-grade or filter material – by engaging local
civil engineering group/university etc.
Confirm the total composition/leachate testing of process sand such that
leachate quality is fully understood and accepted by EPA; and
Discuss with EPA what aspects they would need to see in process sand
such that they could classify it as an inert material.
At present it is not anticipated that residue sand will be reused or further processed as it is an
important component of the amendment procedure of the surface residue for restoration. The
amount of residue sand required for closure of the BRDA has increased with the amended
zone now increased to 1 m depth (Condition 8.4.21).