august-september 2019 · 2019-10-30 · ⓒfiskars group 2019 aug-sep 2019 22. strategic business...
TRANSCRIPT

Investorpresentation
August-September 2019

Agenda
• Fiskars Group in brief• Strategy• Segments• Financials• Appendices
Aug-Sep 2019ⓒ Fiskars Group 2019 2

Fiskars Group in brief
ⓒ Fiskars Group 2019
ⓒ Fiskars Group 2019 4
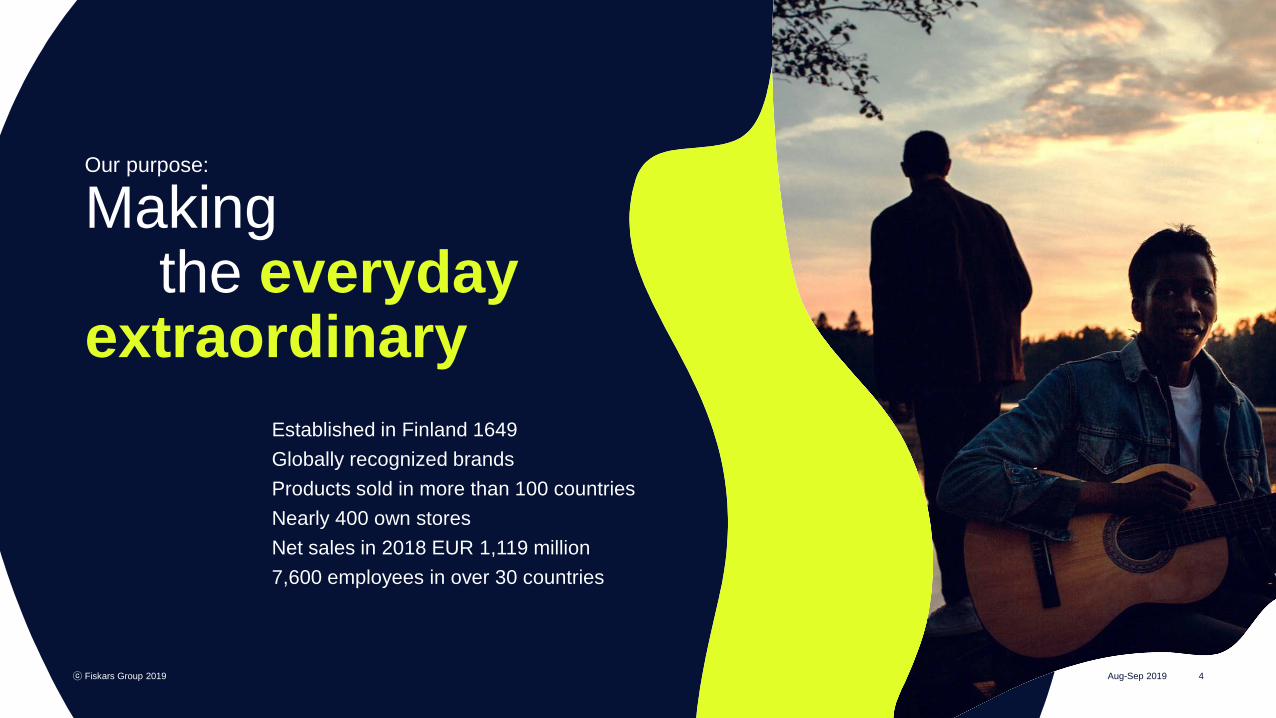
Our purpose:
Makingthe everyday
extraordinaryEstablished in Finland 1649Globally recognized brandsProducts sold in more than 100 countriesNearly 400 own storesNet sales in 2018 EUR 1,119 million7,600 employees in over 30 countries
Aug-Sep 2019

34%
9%9%8%
8%
7%
25%
Fiskars Royal CopenhagenWaterford IittalaGerber WedgwoodOthers
NET SALES SPLIT BY BRAND NET SALES SPLIT BY GEOGRAPHY
47%
40%
13%
Europe Americas Asia-Pacific
ⓒ Fiskars Group 2019 5
Fiskars Group in 2018
Aug-Sep 2019

Net sales by segment
Aug-Sep 2019ⓒ Fiskars Group 2019 6
Dinnerware Drinkware
Interior Other
Gardening School, office & craft
Outdoor
Watering Cooking Fixing
FUNCTIONAL LIVING
€585.2m €529.6m
52% 48%
Key categories
FUNCTIONAL LIVING

Strong brand portfolio
ⓒ Fiskars Group 2019 7Aug-Sep 2019
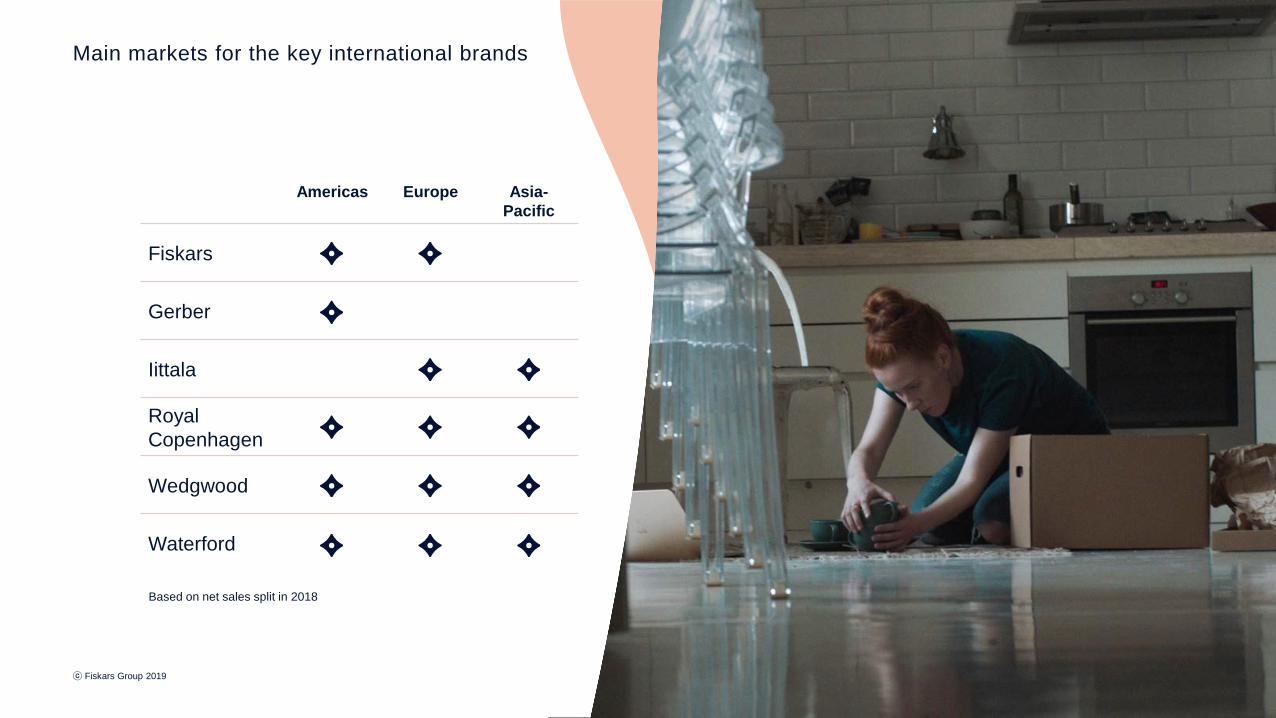
Main markets for the key international brands
ⓒ Fiskars Group 2019 8
Americas Europe Asia-Pacific
Fiskars
Gerber
Iittala
Royal Copenhagen
Wedgwood
Waterford
Based on net sales split in 2018
Aug-Sep 2019Aug-Sep 2019

Our locations
Aug-Sep 2019ⓒ Fiskars Group 2019 9
Manufacturing locations
Distribution centers

Our strategic priorities
Aug-Sep 2019ⓒ Fiskars Group 2019 10

Strategy
ⓒ Fiskars Group 2019
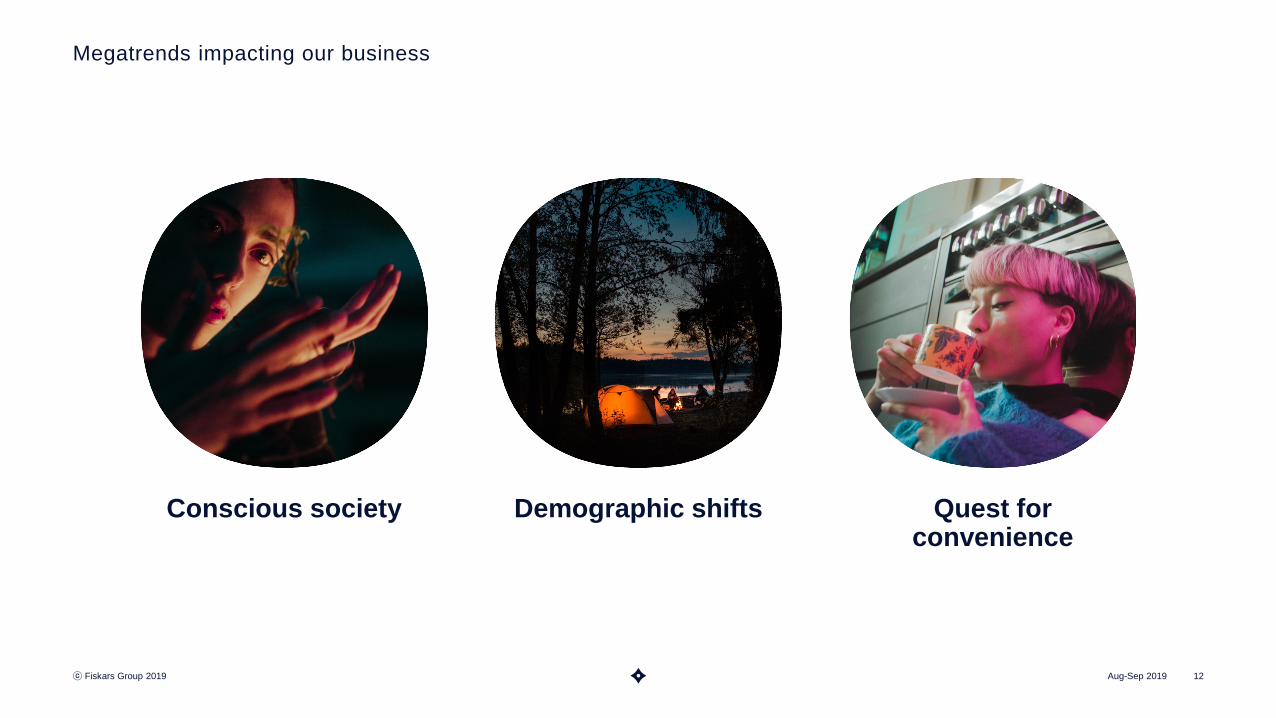
Megatrends impacting our business
Conscious society Demographic shifts
ⓒ Fiskars Group 2019 12
Quest for convenience
Aug-Sep 2019

Aug-Sep 2019ⓒ Fiskars Group 2019 13
Fiskars Group vision
Creating a positive, lasting
impact on ourquality of life

creating change
celebrating the everyday
growing with compassion
We are making the everyday extraordinary by…
Fiskars Group values
Aug-Sep 2019ⓒ Fiskars Group 2019 14

Aug-Sep 2019ⓒ Fiskars Group 2019 15
Inspiring people
Growing business
Exciting consumers
Improving performance
Our strategic priorities

Aug-Sep 2019ⓒ Fiskars Group 2019 16
Our approach to sustainability
For Fiskars Group, sustainable business is integral in building long-term economic success.
We work towards our vision to have a positive, lasting impact on our quality of life by acting as a responsible business and pushing ourselves forward in creating positive change.
We see opportunities in embedding sustainability even deeper into our business strategy to provide people meaningful experiences and to make the everyday extraordinary.

SBU Functional
ⓒ Fiskars Group 2019
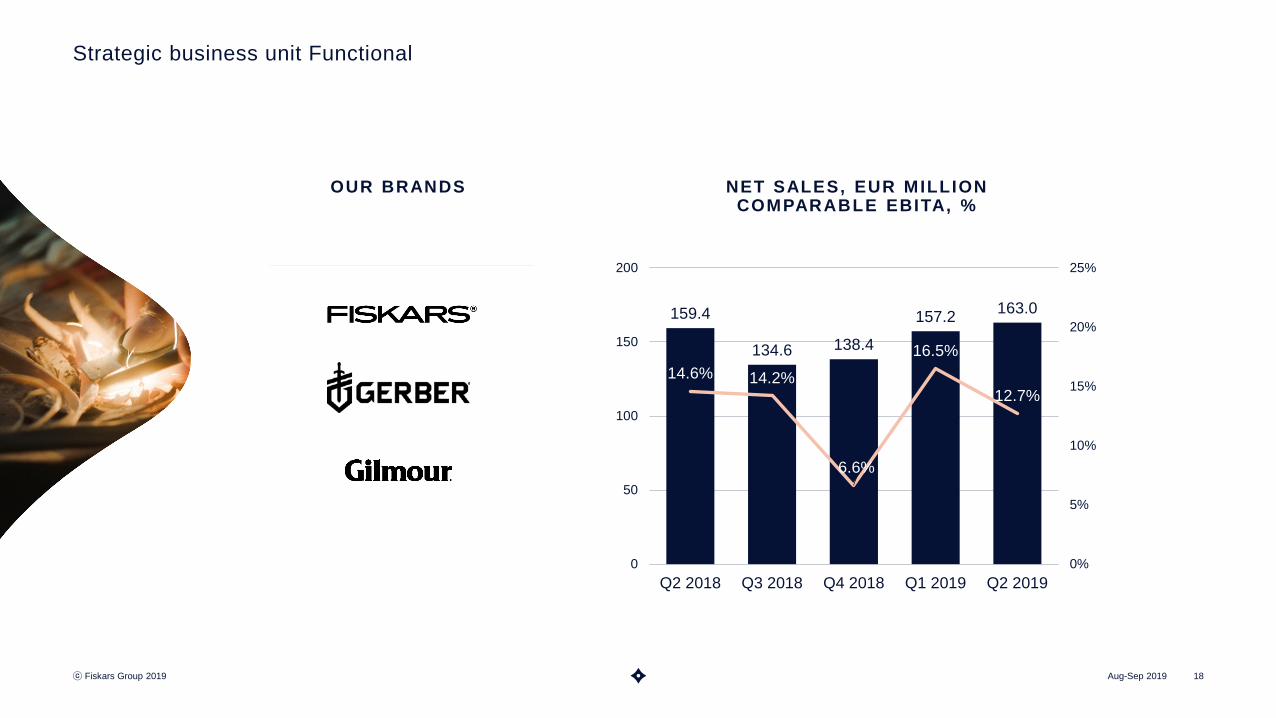
Strategic business unit Functional
OUR BRANDS
Aug-Sep 2019ⓒ Fiskars Group 2019 18
NET SALES, EUR MILLION COMPARABLE EBITA, %
159.4
134.6 138.4
157.2 163.0
14.6% 14.2%
6.6%
16.5%
12.7%
0%
5%
10%
15%
20%
25%
0
50
100
150
200
Q2 2018 Q3 2018 Q4 2018 Q1 2019 Q2 2019
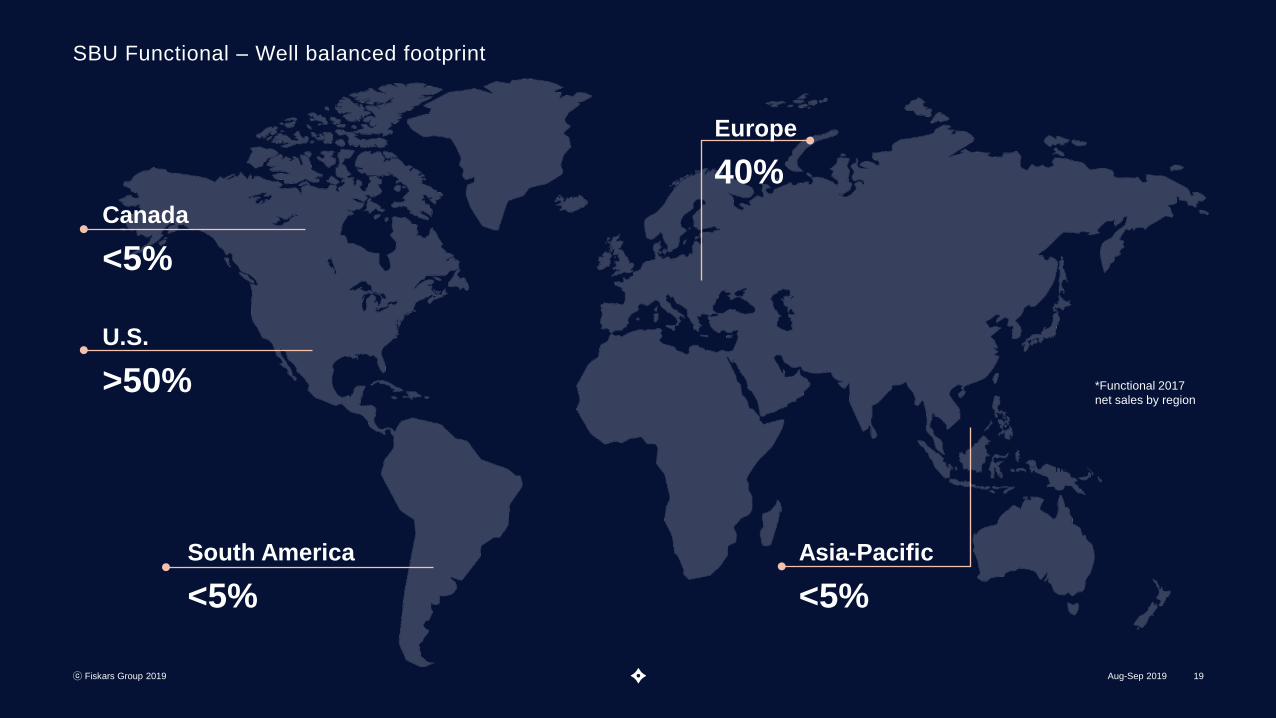
SBU Functional – Well balanced footprint
Aug-Sep 2019ⓒ Fiskars Group 2019 19
U.S.
>50%
South America
<5%
Canada
<5%
Europe
40%
Asia-Pacific
<5%
*Functional 2017 net sales by region
*Functional 2017 net sales by region

SBU Functional – Category split
ⓒ Fiskars Group 2019 20
18% School, office& craft (SOC)
2%Fixing
10% Cooking
13% Watering
13%Outdoor
45% Gardening
*Functional 2017 net sales by category
Aug-Sep 2019

SBU Functional – Sales channels
Aug-Sep 2019ⓒ Fiskars Group 2019 21
Distribution fully through
indirect channels
Work with some of the
largest retailers globally
Strong trade partnerships is one of our
strengths
E-commerce• Total indirect e-commerce: >5% of 2017 net sales• Share of total e-commerce higher in the Americas than other markets
SBU Living
ⓒ Fiskars Group 2019 22Aug-Sep 2019

Strategic business unit Living
OUR BRANDS
Aug-Sep 2019ⓒ Fiskars Group 2019 23
NET SALES, EUR MILLION COMPARABLE EBITA, %
112.4120
184.7
110.5101.3
2.1%
7.3%
23.0%
2.9%
-0.5%
-5%
0%
5%
10%
15%
20%
25%
30%
0
50
100
150
200
Q2 2018 Q3 2018 Q4 2018 Q1 2019 Q2 2019
English and Crystal Living
Scandinavian Living

SBU Living – Well balanced footprint
Aug-Sep 2019ⓒ Fiskars Group 2019 24Risto Gaggl 12.6.2019ⓒ Fiskars Group 2019. Company confidential. 24
U.S.
22%
Europe
52%
Asia-Pacific
26%
*Living 2017 net sales by region
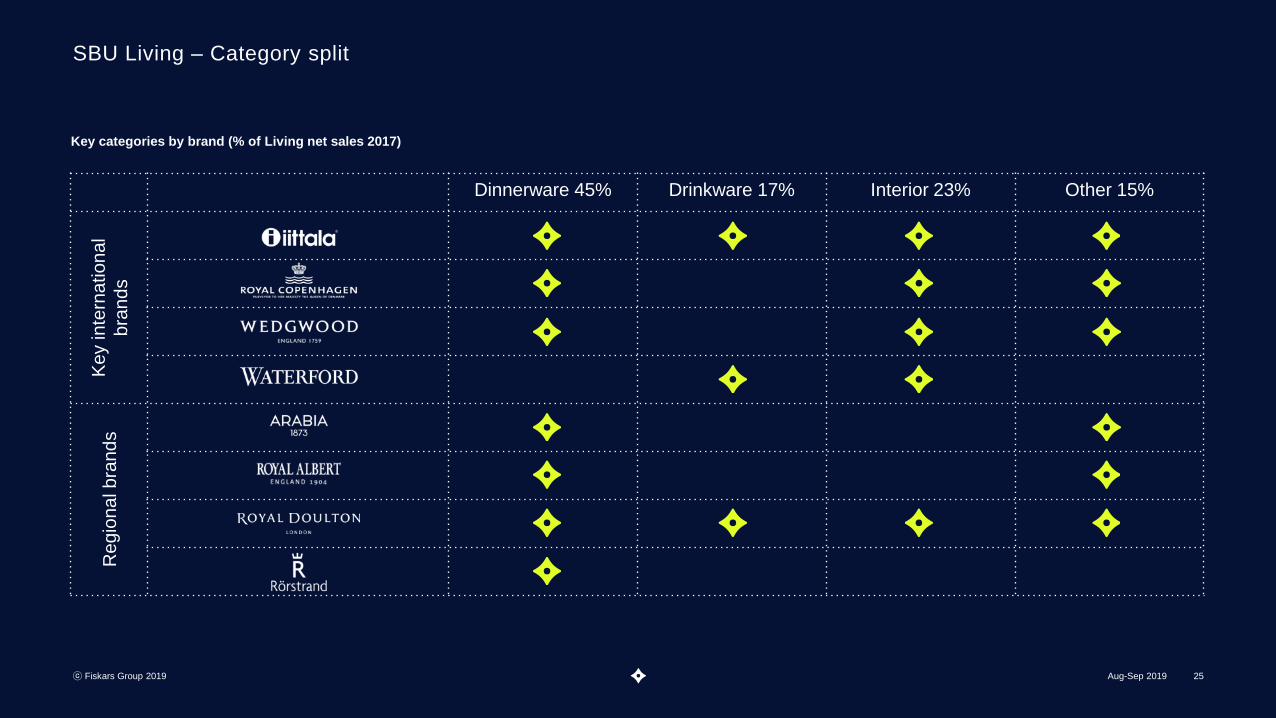
SBU Living – Category split
ⓒ Fiskars Group 2019 25
Dinnerware 45% Drinkware 17% Interior 23% Other 15%
Key
inte
rnat
iona
lbr
ands
Reg
iona
lbra
nds
Key categories by brand (% of Living net sales 2017)
Aug-Sep 2019

SBU Living – Sales channels
Aug-Sep 2019ⓒ Fiskars Group 2019 26
Total e-commerce: ~15%
SHARE OF 2017 NET SALES
Direct: ~33%
Wholesale: ~60%
Hospitality: >5%
Direct channel includes our own:
• Stores (8% of total number of locations)
• Shop-in-shops (64%)• Outlets (28%)
• E-commerce
Indirect e-commerce represents those customers who are operating on online basis only or sell a significant value of our business through e-commerce platforms

New business models
Circular economy is part of Fiskars Group’s sustainability program, and the aim is to find new business opportunities based on it. Circular economy means a new way of thinking in which consumption is based on sharing, renting, recycling, and using services, instead of owning products and manufacturing new ones.The first of new adopted concepts is Vintage, where we buy and sell used Iittala and Arabia-branded tableware. The concept is being rolled out in Finland during 2019.Other concepts are being reviewed as well.
Aug-Sep 2019ⓒ Fiskars Group 2019 27
Financials
ⓒ Fiskars Group 2019

660716 743 748
799 768
1,1071,205 1,186
1,119
33.5%35.4% 35.0%
36.7%
40.9% 41.0%38.7%
42.5% 43.2% 43.4%
25%
30%
35%
40%
45%
50%
55%
60%
0
200
400
600
800
1,000
1,200
1,400
2009 2010 2011 2012 2013 2014 2015 2016 2017 2018
Group net sales and profitability development
Aug-Sep 2019ⓒ Fiskars Group 2019 29
Net sales, EUR million Comparable gross margin Net sales CAGR
+6%
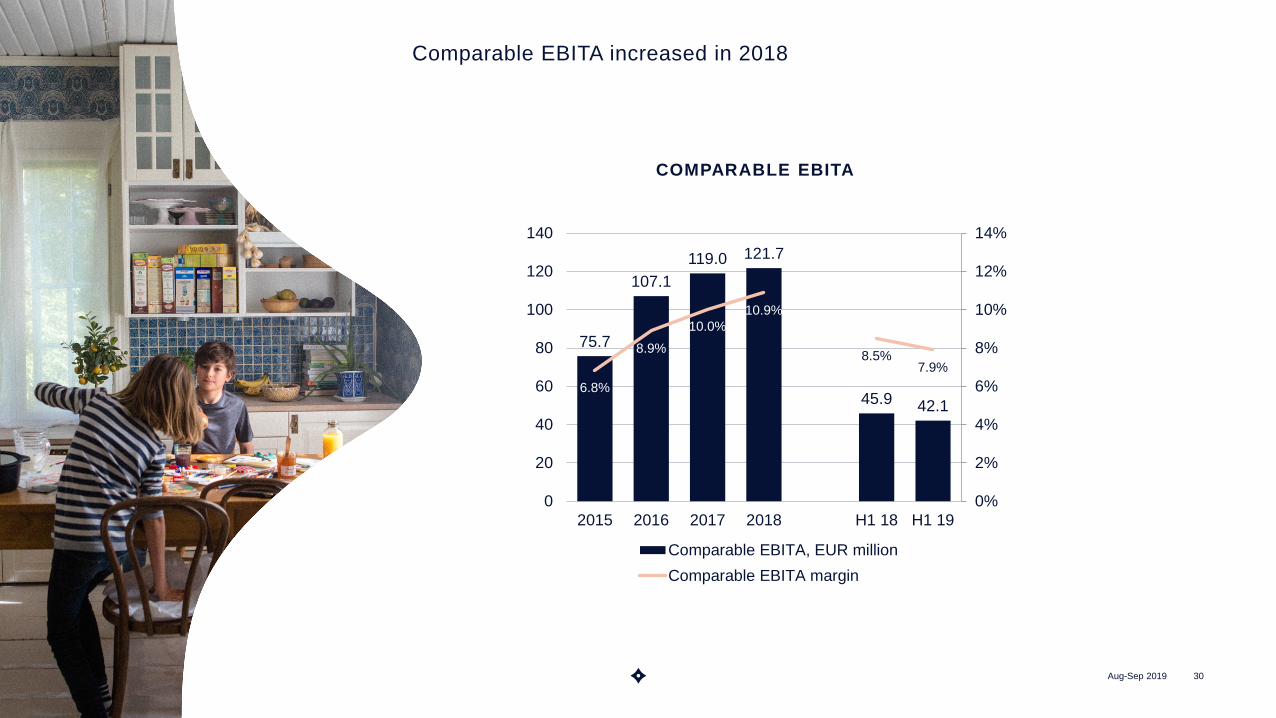
Comparable EBITA increased in 2018
COMPARABLE EBITA
Aug-Sep 2019 30
75.7
107.1119.0 121.7
45.9 42.16.8%
8.9%10.0%
10.9%
8.5%7.9%
0%
2%
4%
6%
8%
10%
12%
14%
0
20
40
60
80
100
120
140
2015 2016 2017 2018 H1 18 H1 19
Comparable EBITA, EUR millionComparable EBITA margin

14% 14% 12% 12%
11% 10%11%
16%
Q1 Q2 Q3 Q4
Functional Living
19% 17%11%
3%
4%2%
11%32%
Q1 Q2 Q3 Q4
Functional Living
NET SALES COMPARABLE EBITA
ⓒ Fiskars Group 2019 31
Seasonalities creating balanced income profile
Seasonal distribution by quarter and business (average 2016-18). Percentages as share of total full year group figures
Aug-Sep 2019

0
10,000
20,000
30,000
40,000
50,000
60,000
70,000
80,000
0
5,000
10,000
15,000
20,000
25,000
30,000
35,000
40,000
45,000
2007 2008 2009 2010 2011 2012 2013 2014 2015 2016 2017 2018
Number of Stock Keeping Units Net sales / SKU, EUR
ⓒ Fiskars Group 2019 32
SKU reduction ongoing
Number of Stock Keeping Units (SKU)
Sales / SKU, EUR
Royal Copenhagen
acquired
WWRD acquired
Nelson and Gilmour acquired
Targeting to reach the previous high in sales / SKU
Aug-Sep 2019

-51.9
32.54.9
64.6
-36.2
39.1 40.3
77.5
-46.4
48.624.8
103.5
-39.2
42.7 41.1
92.2
-25.8
48.1
-100
-50
0
50
100
150
200
Q1 15 Q2 15 Q3 15 Q4 15 Q1 16 Q2 16 Q3 16 Q4 16 Q1 17 Q2 17 Q3 17 Q4 17 Q1 18 Q2 18 Q3 18 Q4 18 Q1 19 Q2 19
Quarterly Rolling 12m
ⓒ Fiskars Group 2019 33
Cash flow has improved
Cash flow from operating activities before financial items and taxes EUR million
Aug-Sep 2019

28.5
42.8
37.4 38.8
43.8
17.8
29.4
0
5
10
15
20
25
30
35
40
45
50
2014 2015 2016 2017 2018 H1 18 H1 19
35.032.4
37.6
32.8
46.2
19.8 18.5
4.6%
2.9% 3.1% 2.8%
4.1%
0%
2%
4%
6%
8%
10%
12%
14%
0
5
10
15
20
25
30
35
40
45
50
2014 2015 2016 2017 2018 Q1 18 Q1 19
Capex as % of sales
DEPRECIATION, AMORTIZATION AND IMPAIRMENT, EUR MILLION
CAPEX, EUR MILLION
ⓒ Fiskars Group 2019 34
Capital expenditure increased in 2018 due to a factory expansion
Depreciation increased as a
result of IFRS 16
Aug-Sep 2019

152.0 148.0135.0
206.6
278.0
0
50
100
150
200
250
300
2016 2017 2018 Q2 18 Q2 19
69% 69% 70% 68%
56%
12% 12% 11%
17%
37%
0%
5%
10%
15%
20%
25%
30%
35%
40%
0%
10%
20%
30%
40%
50%
60%
70%
80%
2016 2017 2018 Q2 18 Q2 19
Equity ratio Net gearing
NET DEBT, EUR MILLION NET GEARING AND EQUITY RATIO
Aug-Sep 2019ⓒ Fiskars Group 2019 35
IFRS 16 impacting balance sheet
Excluding IFRS 16-impact and Wärtsilä share distribution:
Equity ratio: 71%Net gearing 14%
IFRS 16-impact (yoy) EUR 104 million

Long-term financial targets
Aug-Sep 2019ⓒ Fiskars Group 2019 36
Growth
The average annual net sales growth to exceed 5%, through a combination of organic growth and targeted acquisitions
Profitability
EBITA margin to reach 12%
Capital structure
Net gearing* below 100%
Dividend
Fiskars aims to distribute a stable, over time increasing dividend, to be paid biannually
-5.6% YoY-2.4% YoY (comparable)
10.1% 11% EUR 0.54 per share, paid in two installments of EUR 0.27 per share. Additionally, a distribution of Wärtsilä shares held by Fiskars Group
2018
**Net gearing ratio is the ratio of interest-bearing debt, less interest-bearing receivables and cash and bank equivalents, divided by total equity

Outlook for 2019 (updated on May 17, 2019)
In 2019, Fiskars expects the Group's comparable net sales to be at the same level as in 2018 (unchanged) and comparable EBITA to be below the previous year’s level (previously: at the same level).
The outlook is influenced by the company’s investments in growth initiatives that are expected to add sustainable value in the long-term. In addition, there are continued material risks relating to changes in the operating environment, e.g. Brexit and potential further increases to the U.S. tariffs. An unfavorable outcome of these risks might have a significant impact on the comparable net sales and comparable EBITA. Furthermore, fluctuations in currency rates might also have a considerable impact on comparable EBITA.
Comparable net sales excludes the impact of exchange rates, acquisitions and divestments. Items affecting comparability in EBITA include restructuring costs, impairment charges, integration related costs, acquisitions and divestments, and gain and loss from the sale of businesses.
ⓒ Fiskars Group 2019 37Aug-Sep 2019
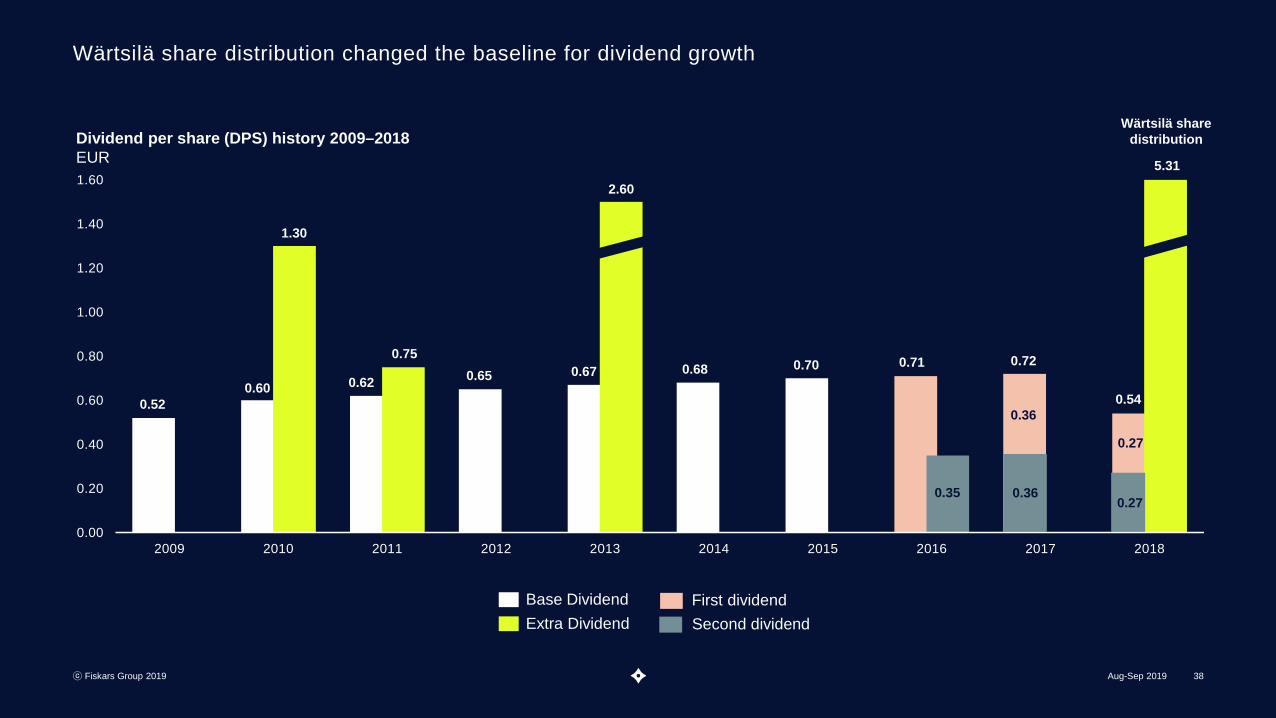
Wärtsilä share distribution changed the baseline for dividend growth
ⓒ Fiskars Group 2019 38
0.00
0.20
0.40
0.60
0.80
1.00
1.20
1.40
1.60
2009 2010 2011 2012 2013 2014 2015 2016 2017 2018
Dividend per share (DPS) history 2009–2018EUR
Extra DividendBase Dividend
0.71
0.35
First dividendSecond dividend
0.520.60
1.30
0.62
0.750.65
2.60
0.67 0.68 0.70 0.72
0.36
0.27
0.27
Wärtsilä share distribution
0.36
0.54
5.31
Aug-Sep 2019

Appendices
ⓒ Fiskars Group 2019 39Aug-Sep 2019

Largest shareholders as of July 31, 2019
ⓒ Fiskars Group 2019 40
# Shareholder name Number of shares % of shares and votes1 Virala Oy Ab 12,650,000 15.44
2 Holdix Oy Ab 10,165,537 12.41
3 Turret Oy Ab 9,330,961 11.39
4 Bergsrådinnan Sophie von Julins Foundation 2,556,000 3.12
5 Oy Julius Tallberg Ab 2,554,350 3.12
6 Varma Mutual Pension Insurance Company 2,469,326 3.01
7 Gripenberg Gerda Margareta Lindsay Dödsbo 1,974,000 2.41
8 Ehrnrooth Jacob Robert Göran 1,626,929 1.99
9 von Julin Sofia Margareta dödsbo 1,560,000 1.90
10 Ehrnrooth Sophia 1,558,630 1.90
10 largest shareholders, total 46,445,733 56.71Other shareholders 35,459,509 43.29
Total 81,905,242 100.00
Data supplied by Euroland
Aug-Sep 2019

Shareholder structure as of July 31, 2019
Aug-Sep 2019 41
Data supplied by Euroland
Sector Number of shareholders
% of total shareholders
Number of shares
% of shares and votes
Private companies 652 2.89% 26788963 32.71%
Households 21,499 95.29% 30,539,606 37.29%
Financial and insurance institutions 43 0.19% 12099507 14.77%
Public sector and non-profit organizations 240 1.07% 10148272 12.39%
Nominee registered and non-Finnish holders 128 0.57% 2328894 2.84%
Total 81,905,242 100.00
32.7%
37.3%
14.8%
12.4%2.8%
Private companies
Households
Financial and insuranceinstitutionsPublic sector and non-profitorganizationsNominee registered and non-Finnish holders

Fiskars Group Leadership Team
ⓒ Fiskars Group 2019 42
Jaana TuominenPresident & CEO
Interim President, SBU Living
Sari PohjonenChief Financial Officer
Deputy to the CEO
Risto GagglChief Supply Chain Officer
Michael HalakPresident, SBU Functional
Tuomas HyyryläinenChief Growth Officer
Niklas LindholmChief Human Resources
Officer
Maija TaimiSVP, Corporate
Communications and Sustainability
Päivi TimonenGeneral Counsel
Aug-Sep 2019

Board of Directors
ⓒ Fiskars Group 2019 43
Paul EhrnroothChairman
Jyri LuomakoskiVice Chairman
Albert Ehrnrooth Louise Fromond
Inka Mero Fabian Månsson Peter Sjölander Ritva Sotamaa
Aug-Sep 2019

Disclaimer
ⓒ Fiskars Group 2019 44
This presentation contains forward-looking statements that reflect management’s current views with respect to certain future events and potential financial performance. Although Fiskars believes that the expectations reflected in such forward-looking statements are reasonable, no assurance can be given that such expectations will prove to have been correct. Accordingly, results could differ materially from those set out in the forward-looking statements as a result of various factors.
Important factors that may cause such a difference for Fiskars include, but are not limited to: (i) the macroeconomic development and consumer confidence in the key markets, (ii) change in the competitive climate, (iii) change in the regulatory environment and other government actions, (iv) change in interest rate and foreign exchange rate levels, and (v) internal operating factors.
This presentation does not imply that Fiskars has undertaken to revise these forward-looking statements, beyond what is required by applicable law or applicable stock exchange regulations if and when circumstances arise that will lead to changes compared to the date when these statements were provided.
Aug-Sep 2019

Aug-Sep 2019ⓒ Fiskars Group 2019 45
Makingthe everyday
extraordinary