augusta university medical center...augusta university medical center 10/1/2016 - 12/31/2016...
TRANSCRIPT
Augusta University Medical CenterAugusta, GA | Client 1913
OUTPATIENT SERVICES REPORT
10/1/2016 - 12/31/2016
Number of Your Patients in This Report: 998
Number of Patients in All Facility DB: 718,864Number of Centers in All Facility DB: 1,243Number of Units in All Facility DB: 26,762
Number of Patients in AHA Region 4: 96,813Number of Centers in AHA Region 4: 220Number of Units in AHA Region 4: 3,502
Number of Patients in COTH Peer Group: 15,868Number of Centers in COTH Peer Group: 15Number of Units in COTH Peer Group: 816
Press Ganey Associates, Inc.404 Columbia Place
South Bend, IN 466011.800.232.8032
© Copyright 2017, Press Ganey Associates, Inc.

Augusta University Medical Center 10/1/2016 - 12/31/2016
OUTPATIENT SERVICES REPORTOUTPATIENT SERVICES REPORTTable of Contents
1.0 Demographic Profile of Respondents 6
2.1 Overall Mean Trend Analysis 8
2.2 Overall Percentile Rank Trend Analysis 8
2.3 Overall Analysis by Questionnaire Sections 9
2.4 Overall Mean/Rank Analysis Across Sections 9
3.0 Question Analysis 10
4.0 Number of Facilities Asking Non-Standard Questions 11
5.0 Top Box Analysis 12
6.0 Comparison of Question Scores (All Items) 14
7.1 All Facility DB Percentile Rank by Question 15
7.2 Hospitals in AHA Region 4 Percentile Rank by Question 16
7.3 Council of Teaching Peer Group Percentile Rank by Question 17
8.0 Correlation Coefficients 18
9.0 Priority Index (Internal) 19
10.1 Priority Index (All Facility DB) 20
10.2 Priority Index (Hospitals in AHA Region 4) 21
10.3 Priority Index (Council of Teaching Peer Group) 22
11.1 All Facility DB Percentile Scores 23
11.2 Hospitals in AHA Region 4 Percentile Scores 24
11.3 Council of Teaching Peer Group Percentile Scores 25
12.1.1 Registration Section Mean Trend Analysis 26
12.1.2 Registration Section Percentile Rank Trend Analysis 26
12.1.3 Registration Section Analysis 27
12.1.4 Registration Section Mean/Rank Analysis 27
12.2.1 Facility Section Mean Trend Analysis 28
12.2.2 Facility Section Percentile Rank Trend Analysis 28
12.2.3 Facility Section Analysis 29
12.2.4 Facility Section Mean/Rank Analysis 29
12.3.1 Test or Treatment Section Mean Trend Analysis 30
12.3.2 Test or Treatment Section Percentile Rank Trend Analysis 30
12.3.3 Test or Treatment Section Analysis 31
12.3.4 Test or Treatment Section Mean/Rank Analysis 31
12.4.1 Personal Issues Section Mean Trend Analysis 32
12.4.2 Personal Issues Section Percentile Rank Trend Analysis 32
12.4.3 Personal Issues Section Analysis 33
12.4.4 Personal Issues Section Mean/Rank Analysis 33
12.5.1 Overall Assessment Section Mean Trend Analysis 35
12.5.2 Overall Assessment Section Percentile Rank Trend Analysis 35
12.5.3 Overall Assessment Section Analysis 36
Continued...
Find solutions, learn best practices, and networkwith colleagues in other health care organizations
https://www.pressganey.com/forumhttp://www.pressganey.com
2

Augusta University Medical Center 10/1/2016 - 12/31/2016
OUTPATIENT SERVICES REPORTOUTPATIENT SERVICES REPORTTable of Contents
12.5.4 Overall Assessment Section Mean/Rank Analysis 36
13.0 Comparative Analysis by Unit 37
14.0 Unit Analysis 38
15.1.1 Mean Trend Analysis - Acc Lab 42
15.1.2 Top Box Analysis - Acc Lab 42
15.1.3 Question Analysis - Acc Lab 43
15.2.1 Mean Trend Analysis - Cardiac Diagnostics 44
15.2.2 Top Box Analysis - Cardiac Diagnostics 44
15.2.3 Question Analysis - Cardiac Diagnostics 45
15.3.1 Mean Trend Analysis - Eeg 46
15.3.2 Top Box Analysis - Eeg 46
15.3.3 Question Analysis - Eeg 47
15.4.1 Mean Trend Analysis - Emg 48
15.4.2 Top Box Analysis - Emg 48
15.4.3 Question Analysis - Emg 49
15.5.1 Mean Trend Analysis - Endoscopy 50
15.5.2 Top Box Analysis - Endoscopy 50
15.5.3 Question Analysis - Endoscopy 51
15.6.1 Mean Trend Analysis - Gamma Knife 52
15.6.2 Top Box Analysis - Gamma Knife 52
15.6.3 Question Analysis - Gamma Knife 53
15.7.1 Mean Trend Analysis - Grtc 54
15.7.2 Top Box Analysis - Grtc 54
15.7.3 Question Analysis - Grtc 55
15.8.1 Mean Trend Analysis - Mammography 56
15.8.2 Top Box Analysis - Mammography 56
15.8.3 Question Analysis - Mammography 57
15.9.1 Mean Trend Analysis - Ob Ultrasound 58
15.9.2 Top Box Analysis - Ob Ultrasound 58
15.9.3 Question Analysis - Ob Ultrasound 59
15.10.1 Mean Trend Analysis - Occupational Therapy 60
15.10.2 Top Box Analysis - Occupational Therapy 60
15.10.3 Question Analysis - Occupational Therapy 61
15.12.1 Mean Trend Analysis - Peds Radiology 62
15.12.2 Top Box Analysis - Peds Radiology 62
15.12.3 Question Analysis - Peds Radiology 63
15.14.1 Mean Trend Analysis - Radiology - Acc/Scc 64
15.14.2 Top Box Analysis - Radiology - Acc/Scc 64
15.14.3 Question Analysis - Radiology - Acc/Scc 65
Continued...
Find solutions, learn best practices, and networkwith colleagues in other health care organizations
https://www.pressganey.com/forumhttp://www.pressganey.com
3
Augusta University Medical Center 10/1/2016 - 12/31/2016
OUTPATIENT SERVICES REPORTOUTPATIENT SERVICES REPORTTable of Contents
15.15.1 Mean Trend Analysis - Radiology - Hospital 66
15.15.2 Top Box Analysis - Radiology - Hospital 66
15.15.3 Question Analysis - Radiology - Hospital 67
15.16.1 Mean Trend Analysis - Sleep Center 68
15.16.2 Top Box Analysis - Sleep Center 68
15.16.3 Question Analysis - Sleep Center 69
15.17.1 Mean Trend Analysis - Speech 70
15.17.2 Top Box Analysis - Speech 70
15.17.3 Question Analysis - Speech 71
15.18.1 Mean Trend Analysis - West Wheeler Imaging 72
15.18.2 Top Box Analysis - West Wheeler Imaging 72
15.18.3 Question Analysis - West Wheeler Imaging 73
15.19.1 Mean Trend Analysis - West Wheeler Occupational 74
15.19.2 Top Box Analysis - West Wheeler Occupational 74
15.19.3 Question Analysis - West Wheeler Occupational 75
15.20.1 Mean Trend Analysis - West Wheeler Physical The 76
15.20.2 Top Box Analysis - West Wheeler Physical The 76
15.20.3 Question Analysis - West Wheeler Physical The 77
15.21.1 Mean Trend Analysis - West Wheeler Sports Rehab 78
15.21.2 Top Box Analysis - West Wheeler Sports Rehab 78
15.21.3 Question Analysis - West Wheeler Sports Rehab 79
16.0 Category Analysis 80
17.1 CAT:DIAG IMAGE Service Analysis 81
17.2 CAT:DIAG IMAGE Question Analysis 82
17.3 CAT:DIAG TEST Service Analysis 83
17.4 CAT:DIAG TEST Question Analysis 84
17.5 CAT:TREAT/THER Service Analysis 85
17.6 CAT:TREAT/THER Question Analysis 86
17.7 CAT:PROGRAMS Question Analysis 87
18.0 Comparative Analysis by Service 88
19.0 Service Analysis 89
20.1.1 Mean Trend Analysis - Cardio/Cardiac Testing 92
20.1.2 Percentile Rank Trend Analysis - Cardio/Cardiac Testing 92
20.1.3 Question Analysis - Cardio/Cardiac Testing 93
20.2.1 Mean Trend Analysis - EEG 94
20.2.2 Percentile Rank Trend Analysis - EEG 94
20.2.3 Question Analysis - EEG 95
20.3.1 Mean Trend Analysis - Endoscopy 96
20.3.2 Percentile Rank Trend Analysis - Endoscopy 96
Continued...
Find solutions, learn best practices, and networkwith colleagues in other health care organizations
https://www.pressganey.com/forumhttp://www.pressganey.com
4
Augusta University Medical Center 10/1/2016 - 12/31/2016
OUTPATIENT SERVICES REPORTOUTPATIENT SERVICES REPORTTable of Contents
20.3.3 Question Analysis - Endoscopy 97
20.4.1 Mean Trend Analysis - Lab 98
20.4.2 Percentile Rank Trend Analysis - Lab 98
20.4.3 Question Analysis - Lab 99
20.5.1 Mean Trend Analysis - Mammography 100
20.5.2 Percentile Rank Trend Analysis - Mammography 100
20.5.3 Question Analysis - Mammography 101
20.6.1 Mean Trend Analysis - Phys/Occ/Spch Thpy 102
20.6.2 Percentile Rank Trend Analysis - Phys/Occ/Spch Thpy 102
20.6.3 Question Analysis - Phys/Occ/Spch Thpy 103
20.7.1 Mean Trend Analysis - Physical Therapy 104
20.7.2 Percentile Rank Trend Analysis - Physical Therapy 104
20.7.3 Question Analysis - Physical Therapy 105
20.9.1 Mean Trend Analysis - Radiation Onc/Therapy 106
20.9.2 Percentile Rank Trend Analysis - Radiation Onc/Therapy 106
20.9.3 Question Analysis - Radiation Onc/Therapy 107
20.10.1 Mean Trend Analysis - Radiology 108
20.10.2 Percentile Rank Trend Analysis - Radiology 108
20.10.3 Question Analysis - Radiology 109
20.11.1 Mean Trend Analysis - Rehab Services 110
20.11.2 Percentile Rank Trend Analysis - Rehab Services 110
20.11.3 Question Analysis - Rehab Services 111
20.12.1 Mean Trend Analysis - Sleep Disorders 112
20.12.2 Percentile Rank Trend Analysis - Sleep Disorders 112
20.12.3 Question Analysis - Sleep Disorders 113
20.13.1 Mean Trend Analysis - Ultrasound 114
20.13.2 Percentile Rank Trend Analysis - Ultrasound 114
20.13.3 Question Analysis - Ultrasound 115
20.14.1 Mean Trend Analysis - X-Ray 116
20.14.2 Percentile Rank Trend Analysis - X-Ray 116
20.14.3 Question Analysis - X-Ray 117
21.0 Facility Statistical Analysis 118
22.0 Question Key 119
23.0 Facilities in the Database 120
Find solutions, learn best practices, and networkwith colleagues in other health care organizations
https://www.pressganey.com/forumhttp://www.pressganey.com
5

Augusta University Medical Center 10/1/2016 - 12/31/2016
OUTPATIENT SERVICES REPORTOUTPATIENT SERVICES REPORT1.0 Demographic Profile of Respondents
This section provides demographic information about the individuals who responded to your survey for the current and last report periods. Theinformation comes from the "Background Questions" section of your questionnaire or from your data uploads. Compare the Demographic Profile ofRespondents to your eligible population. Generally, the respondent demographic profile will approximate the actual profile of your patients. Alsocheck for differences in the distribution of each question's responses between the current and last report periods. Differences may signal changes inyour patient base. Question Last Period This Period
Response n % n % Last Period This PeriodSex
337 37 403 40Male
580 63 600 60Female
917 1,003Total 37%
63%
40%
60%
Question Last Period This PeriodResponse n % n % Last Period This Period
Age
62 8 85 90-17 Yrs
28 3 51 518-34 Yrs
72 9 92 935-49 Yrs
295 36 323 3350-64 Yrs
308 38 369 3765-79 Yrs
55 7 70 780+ Yrs
820 990Total36%
38%
33%
37%
Continued...
n Number of responses Percentages may not total 100% due to rounding
Find solutions, learn best practices, and networkFor an overview of how to interpret this report page,with colleagues in other health care organizationsclick or visit the following Web page:
https://www.pressganey.com/forumhttp://www.pressganey.com/gti/gti1.htm
6

Augusta University Medical Center 10/1/2016 - 12/31/2016
OUTPATIENT SERVICES REPORTOUTPATIENT SERVICES REPORT1.0 Demographic Profile of Respondents
Question Last Period This PeriodResponse n % n % Last Period This Period
Language of survey
698 99 998 100English
5 1 5 0Spanish
703 1,003Total
99% 100%
Question Last Period This PeriodResponse n % n % Last Period This Period
Length of stay
903 99 998 1001
7 1 3 02-3
4 0 2 04-7
914 1,003Total
99% 100%
Question Last Period This PeriodResponse n % n % Last Period This Period
Method of distribution
917 100 1,003 100Paper
917 1,003Total
100% 100%
n Number of responses Percentages may not total 100% due to rounding
Find solutions, learn best practices, and networkFor an overview of how to interpret this report page,with colleagues in other health care organizationsclick or visit the following Web page:
https://www.pressganey.com/forumhttp://www.pressganey.com/gti/gti1.htm
7
Augusta University Medical Center 10/1/2016 - 12/31/2016
OUTPATIENT SERVICES REPORTOUTPATIENT SERVICES REPORT2.1 Overall Mean Trend Analysis
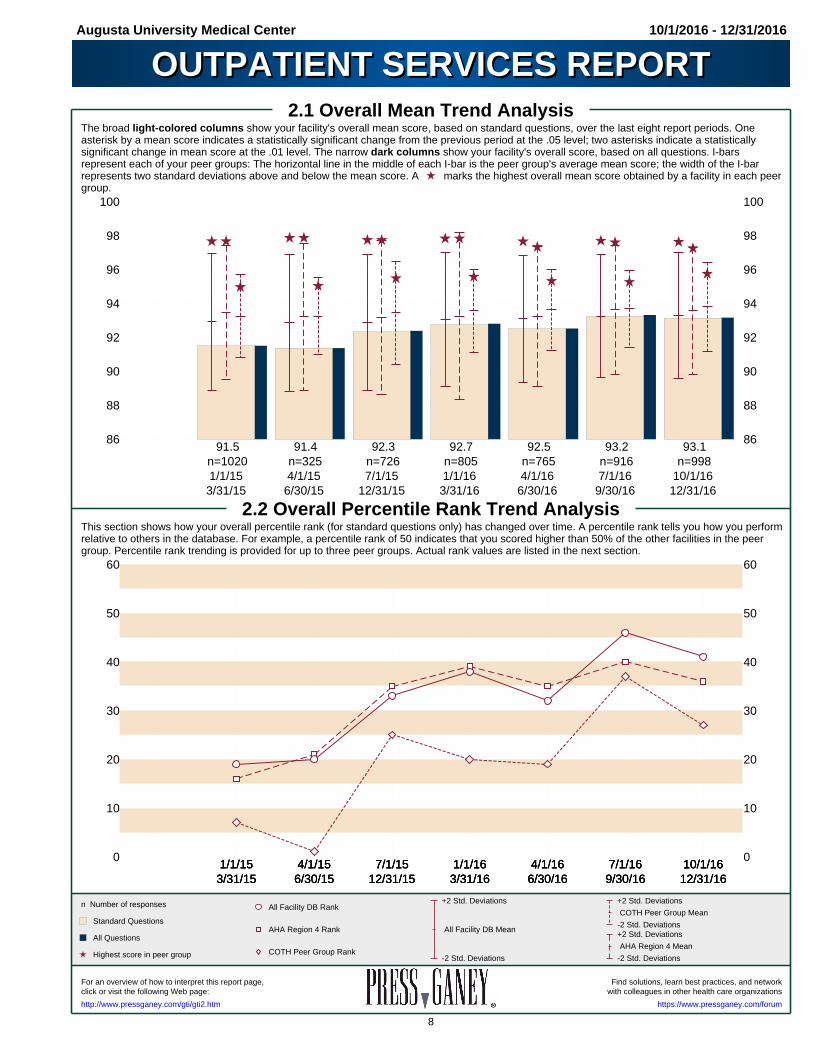
The broad light-colored columns show your facility's overall mean score, based on standard questions, over the last eight report periods. Oneasterisk by a mean score indicates a statistically significant change from the previous period at the .05 level; two asterisks indicate a statisticallysignificant change in mean score at the .01 level. The narrow dark columns show your facility's overall score, based on all questions. I-barsrepresent each of your peer groups: The horizontal line in the middle of each I-bar is the peer group's average mean score; the width of the I-barrepresents two standard deviations above and below the mean score. A marks the highest overall mean score obtained by a facility in each peergroup.
86 86
88 88
90 90
92 92
94 94
96 96
98 98
100 100
91.5n=10201/1/15
3/31/15
91.4n=3254/1/15
6/30/15
92.3n=7267/1/15
12/31/15
92.7n=8051/1/163/31/16
92.5n=7654/1/166/30/16
93.2n=9167/1/169/30/16
93.1n=998
10/1/1612/31/16
2.2 Overall Percentile Rank Trend AnalysisThis section shows how your overall percentile rank (for standard questions only) has changed over time. A percentile rank tells you how you performrelative to others in the database. For example, a percentile rank of 50 indicates that you scored higher than 50% of the other facilities in the peergroup. Percentile rank trending is provided for up to three peer groups. Actual rank values are listed in the next section.
0 0
10 10
20 20
30 30
40 40
50 50
60 60
1/1/153/31/151/1/153/31/151/1/153/31/15
4/1/156/30/154/1/156/30/154/1/156/30/15
7/1/1512/31/157/1/15
12/31/157/1/15
12/31/151/1/163/31/161/1/163/31/161/1/163/31/16
4/1/166/30/164/1/166/30/164/1/166/30/16
7/1/169/30/167/1/169/30/167/1/169/30/16
10/1/1612/31/1610/1/1612/31/1610/1/1612/31/16
Standard Questions
All Questions
Highest score in peer group
n Number of responses +2 Std. Deviations
-2 Std. Deviations
COTH Peer Group Mean
+2 Std. Deviations
-2 Std. Deviations
AHA Region 4 Mean
All Facility DB Rank
AHA Region 4 Rank
COTH Peer Group Rank
+2 Std. Deviations
-2 Std. Deviations
All Facility DB Mean
Find solutions, learn best practices, and networkFor an overview of how to interpret this report page,with colleagues in other health care organizationsclick or visit the following Web page:
https://www.pressganey.com/forumhttp://www.pressganey.com/gti/gti2.htm
8
Augusta University Medical Center 10/1/2016 - 12/31/2016
OUTPATIENT SERVICES REPORTOUTPATIENT SERVICES REPORT2.3 Overall Analysis by Questionnaire Sections
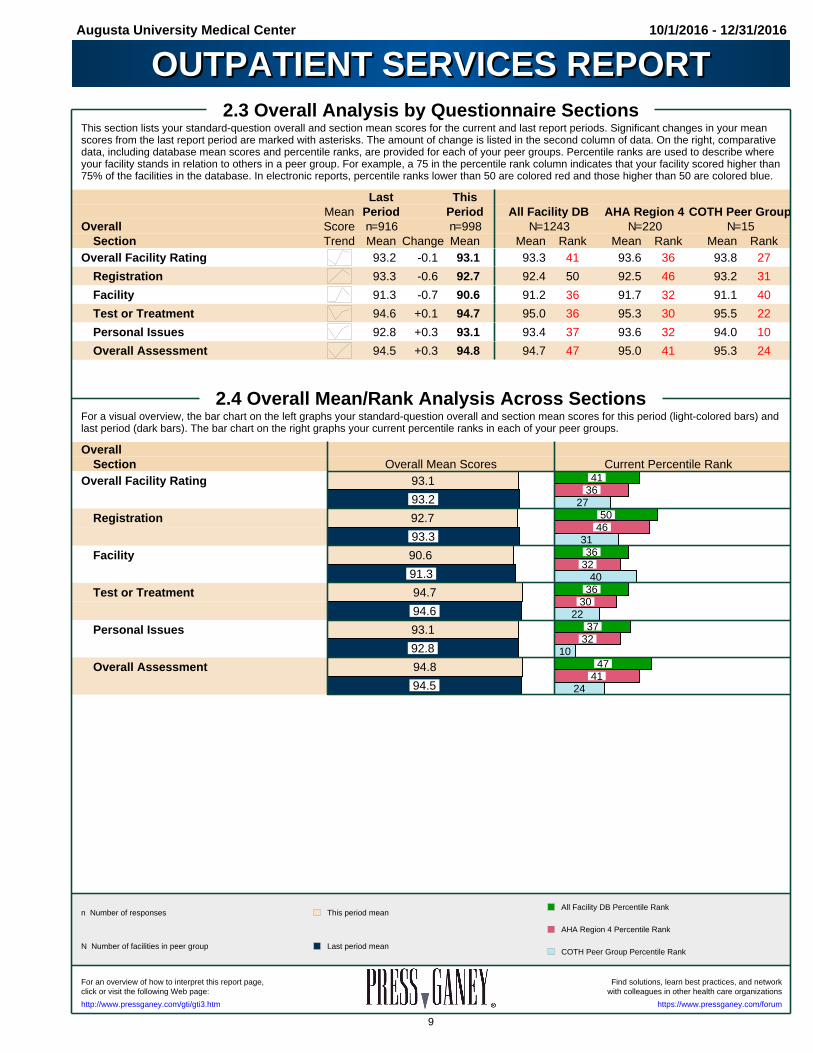
This section lists your standard-question overall and section mean scores for the current and last report periods. Significant changes in your meanscores from the last report period are marked with asterisks. The amount of change is listed in the second column of data. On the right, comparativedata, including database mean scores and percentile ranks, are provided for each of your peer groups. Percentile ranks are used to describe whereyour facility stands in relation to others in a peer group. For example, a 75 in the percentile rank column indicates that your facility scored higher than75% of the facilities in the database. In electronic reports, percentile ranks lower than 50 are colored red and those higher than 50 are colored blue.
Last ThisMean Period Period All Facility DB AHA Region 4 COTH Peer Group
Overall Score n=916 n=998 N=1243 N=220 N=15Section Trend Mean Change Mean Mean Rank Mean Rank Mean Rank
Overall Facility Rating 93.2 -0.1 93.1 93.3 41 93.6 36 93.8 27
Registration 93.3 -0.6 92.7 92.4 50 92.5 46 93.2 31
Facility 91.3 -0.7 90.6 91.2 36 91.7 32 91.1 40
Test or Treatment 94.6 +0.1 94.7 95.0 36 95.3 30 95.5 22
Personal Issues 92.8 +0.3 93.1 93.4 37 93.6 32 94.0 10
Overall Assessment 94.5 +0.3 94.8 94.7 47 95.0 41 95.3 24
2.4 Overall Mean/Rank Analysis Across SectionsFor a visual overview, the bar chart on the left graphs your standard-question overall and section mean scores for this period (light-colored bars) andlast period (dark bars). The bar chart on the right graphs your current percentile ranks in each of your peer groups. Overall
Section Overall Mean Scores Current Percentile RankOverall Facility Rating 93.1
93.2
41 36
27
Registration 92.7
93.3
50 46
31
Facility 90.6
91.3
36 32
40
Test or Treatment 94.7
94.6
36 30
22
Personal Issues 93.1
92.8
37 32
10
Overall Assessment 94.8
94.5
47 41
24
n Number of responses
N Number of facilities in peer group
All Facility DB Percentile Rank
AHA Region 4 Percentile Rank
COTH Peer Group Percentile Rank
This period mean
Last period mean
Find solutions, learn best practices, and networkFor an overview of how to interpret this report page,with colleagues in other health care organizationsclick or visit the following Web page:
https://www.pressganey.com/forumhttp://www.pressganey.com/gti/gti3.htm
9

Augusta University Medical Center 10/1/2016 - 12/31/2016
OUTPATIENT SERVICES REPORTOUTPATIENT SERVICES REPORT3.0 Question Analysis
This section lists detailed information about your individual question, section, and overall scores. Only facilities with seven or more responses arereported. Significant changes in mean scores from the previous report period are marked with asterisks. The amount of change is listed in the secondcolumn of data. Questions appearing in bold italics are among your facility's top ten priorities (based on your Internal Priority Index); superscriptsindicate the priority number. Comparative data are provided on the right. To ensure confidentiality, data for questions are provided only when thequestions are asked by seven or more facilities. Greater than (>) and less than (<) symbols are used to flag mean scores that fall above or below apeer group's mean score by one or two standard deviations. Percentile ranks describe where you stand in relation to other facilities in a peer group.In electronic reports, percentile ranks lower than 50 are colored red and those higher than 50 are colored blue.
Last This All AHA COTHOverall Mean Period Period Facility DB Region 4 Peer Group
Section Score n=916 n=998 N=1243 N=220 N=15n Question Trend Mean Change Mean Mean Rank Mean Rank Mean Rank
Overall Facility Rating 93.2 -0.1 93.1 93.3 41 93.6 36 93.8 27
Overall Facility Rating †† 93.3 -0.1 93.2
Registration 93.3 -0.6 92.7 92.4 50 92.5 46 93.2 31
989 Helpfulness of registration person 94.0 -0.2 93.8 93.6 49 93.9 40 94.1 37
980 Ease of the registration process 94.2 -0.7 93.5 93.3 48 93.6 41 94.2 20
981 Waiting time in registration 7 92.0 -1.2 90.8 90.2 51 89.9 55 91.3 38
Facility 91.3 -0.7 90.6 91.2 36 91.7 32 91.1 40
993 Comfort of waiting area 91.8 -0.8 91.0 90.0 63 90.3 58 90.4 47
987 Ease of finding your way around 88.5 -0.8 87.7 89.9 20 < 90.7 16 88.8 38
987 Cleanliness of facility 93.6* -0.4 93.2 93.8 33 94.2 30 94.1 34
Test or Treatment 94.6 +0.1 94.7 95.0 36 95.3 30 95.5 22
991 Friendliness of staff 95.8 +0.3 96.1 96.2 42 96.4 37 96.7 21
985 Explanations given by staff 94.6 -0.3 94.3 94.5 37 94.8 32 95.1 21
991 Skill of techs/therapists/nurses 95.7 -0.2 95.5 95.7 39 96.0 34 96.1 13
989 Staff concern for comfort 94.6 +0.2 94.8 94.7 45 95.0 40 95.3 26
964 Staff's concern/questions worries 8 92.9 +0.4 93.3 94.4 20 94.7 16 < 94.7 6
Personal Issues 92.8 +0.3 93.1 93.4 37 93.6 32 94.0 10
Personal Issues †† 93.2 +0.0 93.2
970 Our concern for privacy 93.5 +0.1 93.6 93.7 40 94.1 33 94.4 14
962 Our sensitivity to your needs 1 92.8 +0.1 92.9 93.4 32 93.7 29 < 94.2 9
905 Response to concerns/complaints 2 92.7 +0.0 92.7 93.2 33 93.4 30 < 93.8 9
891 Family able to participate decision † 3 93.7 -0.8 92.9 N<7 N/A N<7 N/A N<7 N/A
945 Staff explained roles in care † 5 93.3 -0.3 93.0 93.0 38 N<7 N/A N<7 N/A
842 Staff supported family throughout † 6 93.9 -0.6 93.3 93.2 33 N<7 N/A N<7 N/A
852 Staff respected having family with † 94.8 -0.8 94.0 93.3 67 N<7 N/A N<7 N/A
910 Staff sensitivity to your needs † 3 93.4 -0.1 93.3 N<7 N/A N<7 N/A N<7 N/A
Overall Assessment 94.5 +0.3 94.8 94.7 47 95.0 41 95.3 24
971 Staff worked together provide care 8 94.7 +0.1 94.8 94.7 47 94.9 42 95.2 27
979 Overall rating of care 8 94.5 +0.7 95.2 95.0 48 95.3 42 95.7 37
975 Likelihood of recommending 94.6 +0.0 94.6 94.6 45 94.9 37 95.4 24
* Significantly different at .05 level< 1 standard deviation below peer group mean† Non-standard question†† Includes non-standard questions
n Number of responsesN Number of facilities in peer group
N<7 Fewer than 7 facilities
Top ten priority (based on Internal Priority Index)
Find solutions, learn best practices, and networkFor an overview of how to interpret this report page,with colleagues in other health care organizationsclick or visit the following Web page:
https://www.pressganey.com/forumhttp://www.pressganey.com/gti/gti4.htm
10
Augusta University Medical Center 10/1/2016 - 12/31/2016
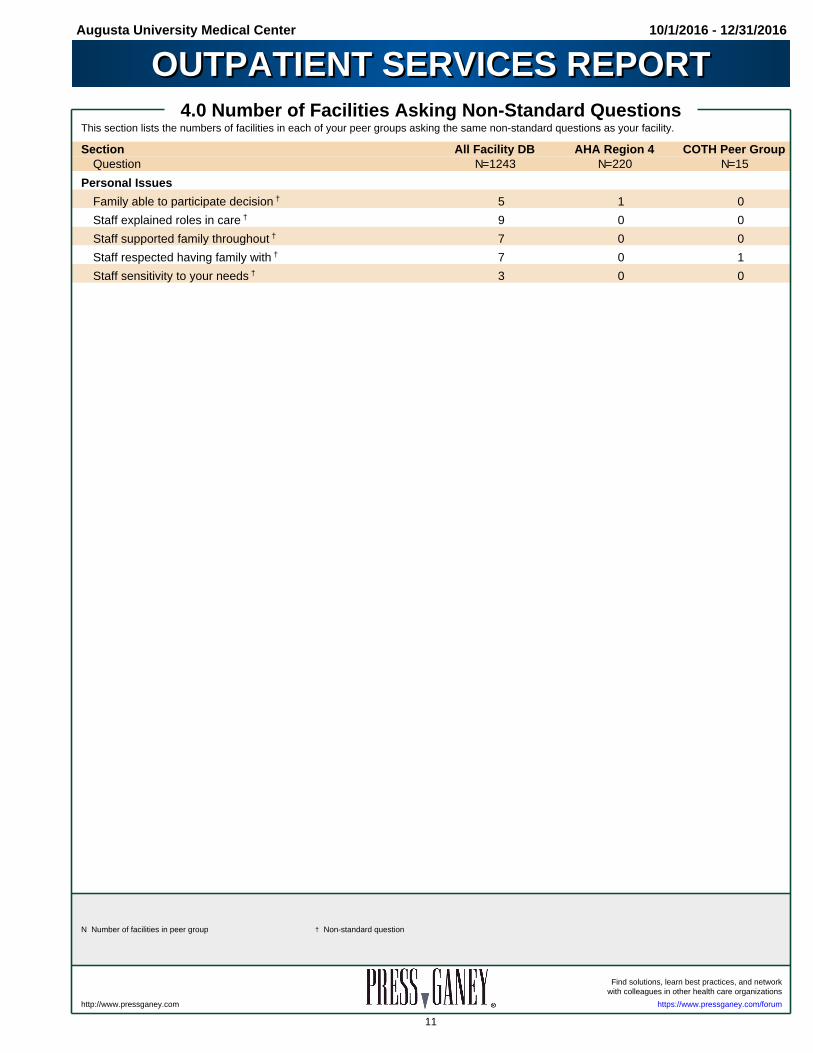
OUTPATIENT SERVICES REPORTOUTPATIENT SERVICES REPORT4.0 Number of Facilities Asking Non-Standard Questions
This section lists the numbers of facilities in each of your peer groups asking the same non-standard questions as your facility. Section All Facility DB AHA Region 4 COTH Peer Group
Question N=1243 N=220 N=15
Personal Issues
Family able to participate decision † 5 1 0
Staff explained roles in care † 9 0 0
Staff supported family throughout † 7 0 0
Staff respected having family with † 7 0 1
Staff sensitivity to your needs † 3 0 0
N Number of facilities in peer group † Non-standard question
Find solutions, learn best practices, and networkwith colleagues in other health care organizations
https://www.pressganey.com/forumhttp://www.pressganey.com
11
Augusta University Medical Center 10/1/2016 - 12/31/2016
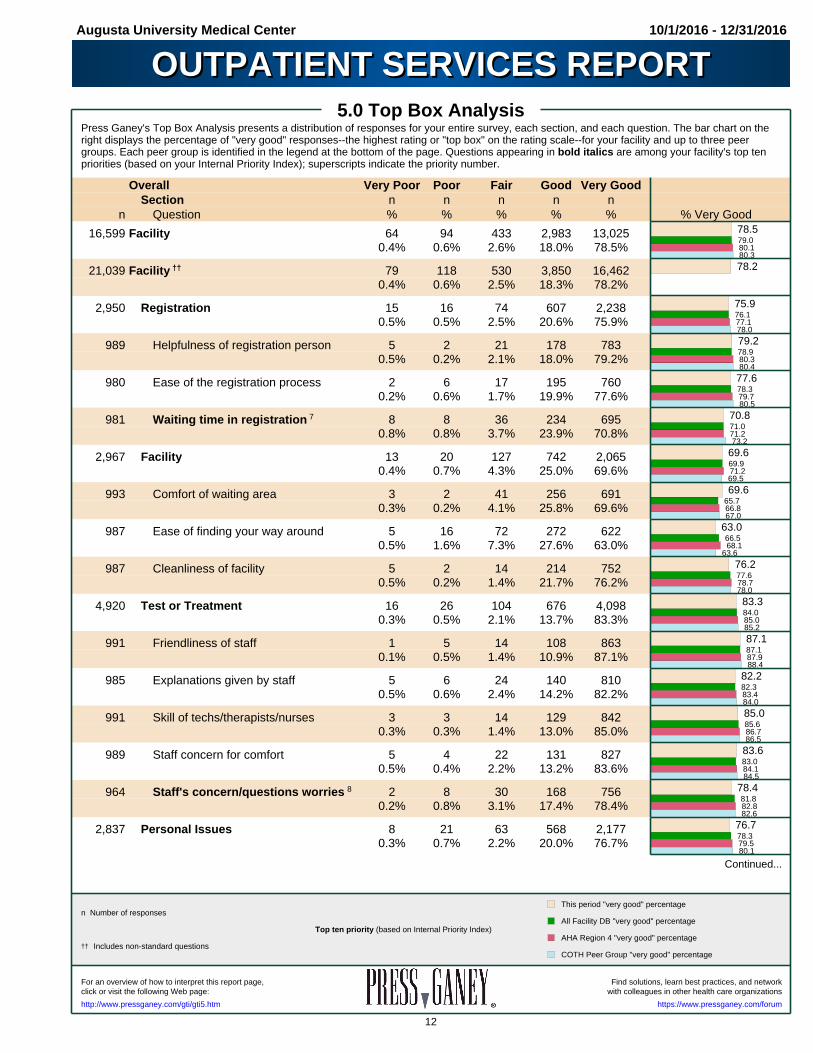
OUTPATIENT SERVICES REPORTOUTPATIENT SERVICES REPORT5.0 Top Box Analysis
Press Ganey's Top Box Analysis presents a distribution of responses for your entire survey, each section, and each question. The bar chart on theright displays the percentage of "very good" responses--the highest rating or "top box" on the rating scale--for your facility and up to three peergroups. Each peer group is identified in the legend at the bottom of the page. Questions appearing in bold italics are among your facility's top tenpriorities (based on your Internal Priority Index); superscripts indicate the priority number.
Overall Very Poor Poor Fair Good Very GoodSection n n n n n
n Question % % % % % % Very Good
16,599 Facility 64 94 433 2,983 13,0250.4% 0.6% 2.6% 18.0% 78.5%
78.579.080.180.3
21,039 Facility †† 79 118 530 3,850 16,4620.4% 0.6% 2.5% 18.3% 78.2%
78.2
2,950 Registration 15 16 74 607 2,2380.5% 0.5% 2.5% 20.6% 75.9%
75.976.177.178.0
989 Helpfulness of registration person 5 2 21 178 7830.5% 0.2% 2.1% 18.0% 79.2%
79.278.980.380.4
980 Ease of the registration process 2 6 17 195 7600.2% 0.6% 1.7% 19.9% 77.6%
77.678.379.780.5
981 Waiting time in registration 7 8 8 36 234 6950.8% 0.8% 3.7% 23.9% 70.8%
70.871.071.273.2
2,967 Facility 13 20 127 742 2,0650.4% 0.7% 4.3% 25.0% 69.6%
69.669.971.269.5
993 Comfort of waiting area 3 2 41 256 6910.3% 0.2% 4.1% 25.8% 69.6%
69.665.766.867.0
987 Ease of finding your way around 5 16 72 272 6220.5% 1.6% 7.3% 27.6% 63.0%
63.066.568.1
63.6
987 Cleanliness of facility 5 2 14 214 7520.5% 0.2% 1.4% 21.7% 76.2%
76.277.678.778.0
4,920 Test or Treatment 16 26 104 676 4,0980.3% 0.5% 2.1% 13.7% 83.3%
83.384.085.085.2
991 Friendliness of staff 1 5 14 108 8630.1% 0.5% 1.4% 10.9% 87.1%
87.187.187.988.4
985 Explanations given by staff 5 6 24 140 8100.5% 0.6% 2.4% 14.2% 82.2%
82.282.383.484.0
991 Skill of techs/therapists/nurses 3 3 14 129 8420.3% 0.3% 1.4% 13.0% 85.0%
85.085.686.786.5
989 Staff concern for comfort 5 4 22 131 8270.5% 0.4% 2.2% 13.2% 83.6%
83.683.084.184.5
964 Staff's concern/questions worries 8 2 8 30 168 7560.2% 0.8% 3.1% 17.4% 78.4%
78.481.882.882.6
2,837 Personal Issues 8 21 63 568 2,1770.3% 0.7% 2.2% 20.0% 76.7%
76.778.379.580.1
Continued...
†† Includes non-standard questions
n Number of responsesThis period "very good" percentage
All Facility DB "very good" percentage
AHA Region 4 "very good" percentage
COTH Peer Group "very good" percentage
Top ten priority (based on Internal Priority Index)
Find solutions, learn best practices, and networkFor an overview of how to interpret this report page,with colleagues in other health care organizationsclick or visit the following Web page:
https://www.pressganey.com/forumhttp://www.pressganey.com/gti/gti5.htm
12

Augusta University Medical Center 10/1/2016 - 12/31/2016
OUTPATIENT SERVICES REPORTOUTPATIENT SERVICES REPORT5.0 Top Box Analysis
Overall Very Poor Poor Fair Good Very GoodSection n n n n n
n Question % % % % % % Very Good
7,277 Personal Issues †† 23 45 160 1,435 5,6140.3% 0.6% 2.2% 19.7% 77.1%
77.1
970 Our concern for privacy 2 2 16 204 7460.2% 0.2% 1.6% 21.0% 76.9%
76.978.179.579.9
962 Our sensitivity to your needs 1 2 8 29 184 7390.2% 0.8% 3.0% 19.1% 76.8%
76.878.579.680.4
905 Response to concerns/complaints 2 4 11 18 180 6920.4% 1.2% 2.0% 19.9% 76.5%
76.578.379.580.0
891 Family able to participate decision † 3 3 5 20 185 6780.3% 0.6% 2.2% 20.8% 76.1%
76.1
945 Staff explained roles in care † 5 4 5 28 179 7290.4% 0.5% 3.0% 18.9% 77.1%
77.176.8
842 Staff supported family throughout † 6 2 4 19 167 6500.2% 0.5% 2.3% 19.8% 77.2%
77.277.4
852 Staff respected having family with † 2 3 10 169 6680.2% 0.4% 1.2% 19.8% 78.4%
78.478.4
910 Staff sensitivity to your needs † 3 4 7 20 167 7120.4% 0.8% 2.2% 18.4% 78.2%
78.2
2,925 Overall Assessment 12 11 65 390 2,4470.4% 0.4% 2.2% 13.3% 83.7%
83.783.284.485.3
971 Staff worked together provide care 8 2 2 25 139 8030.2% 0.2% 2.6% 14.3% 82.7%
82.782.083.384.0
979 Overall rating of care 8 2 3 20 131 8230.2% 0.3% 2.0% 13.4% 84.1%
84.183.784.985.8
975 Likelihood of recommending 8 6 20 120 8210.8% 0.6% 2.1% 12.3% 84.2%
84.283.885.186.0
† Non-standard question
†† Includes non-standard questions
n Number of responses This period "very good" percentage
All Facility DB "very good" percentage
AHA Region 4 "very good" percentage
COTH Peer Group "very good" percentage
Top ten priority (based on Internal Priority Index)
Find solutions, learn best practices, and networkFor an overview of how to interpret this report page,with colleagues in other health care organizationsclick or visit the following Web page:
https://www.pressganey.com/forumhttp://www.pressganey.com/gti/gti5.htm
13

Augusta University Medical Center 10/1/2016 - 12/31/2016
OUTPATIENT SERVICES REPORTOUTPATIENT SERVICES REPORT6.0 Comparison of Question Scores (All Items)
This section lists your current period's mean scores for each question in descending order. The order of questions is listed in parentheses after themean scores. To ensure reliability, only the order of questions answered by at least 40% of your respondents is presented. On the right your facility'soverall score is graphed as a vertical line in the bar chart of your mean scores. Questions appearing in bold italics are among your facility's top tenpriorities (based on your Internal Priority Index); superscripts indicate the priority number.
Your OverallQuestion Mean Facility RatingFriendliness of staff 96.1 (1)
Skill of techs/therapists/nurses 95.5 (2)
Overall rating of care 8 95.2 (3)
Staff concern for comfort 94.8 (4)
Staff worked together provide care 8 94.8 (4)
Likelihood of recommending 94.6 (6)
Explanations given by staff 94.3 (7)
Staff respected having family with † 94.0 (8)
Helpfulness of registration person 93.8 (9)
Our concern for privacy 93.6 (10)
Ease of the registration process 93.5 (11)
Staff supported family throughout † 6 93.3 (12)
Staff sensitivity to your needs † 3 93.3 (13)
Staff's concern/questions worries 8 93.3 (14)
Cleanliness of facility 93.2 (15)
Staff explained roles in care † 5 93.0 (16)
Family able to participate decision † 3 92.9 (17)
Our sensitivity to your needs 1 92.9 (18)
Response to concerns/complaints 2 92.7 (19)
Comfort of waiting area 91.0 (20)
Waiting time in registration 7 90.8 (21)
Ease of finding your way around 87.7 (22)
80 85 90 95 100
† Non-standard question
(Order) From highest to lowest mean score
Top ten priority (based on Internal Priority Index)
Find solutions, learn best practices, and networkFor an overview of how to interpret this report page,with colleagues in other health care organizationsclick or visit the following Web page:
https://www.pressganey.com/forumhttp://www.pressganey.com/gti/gti6.htm
14
Augusta University Medical Center 10/1/2016 - 12/31/2016
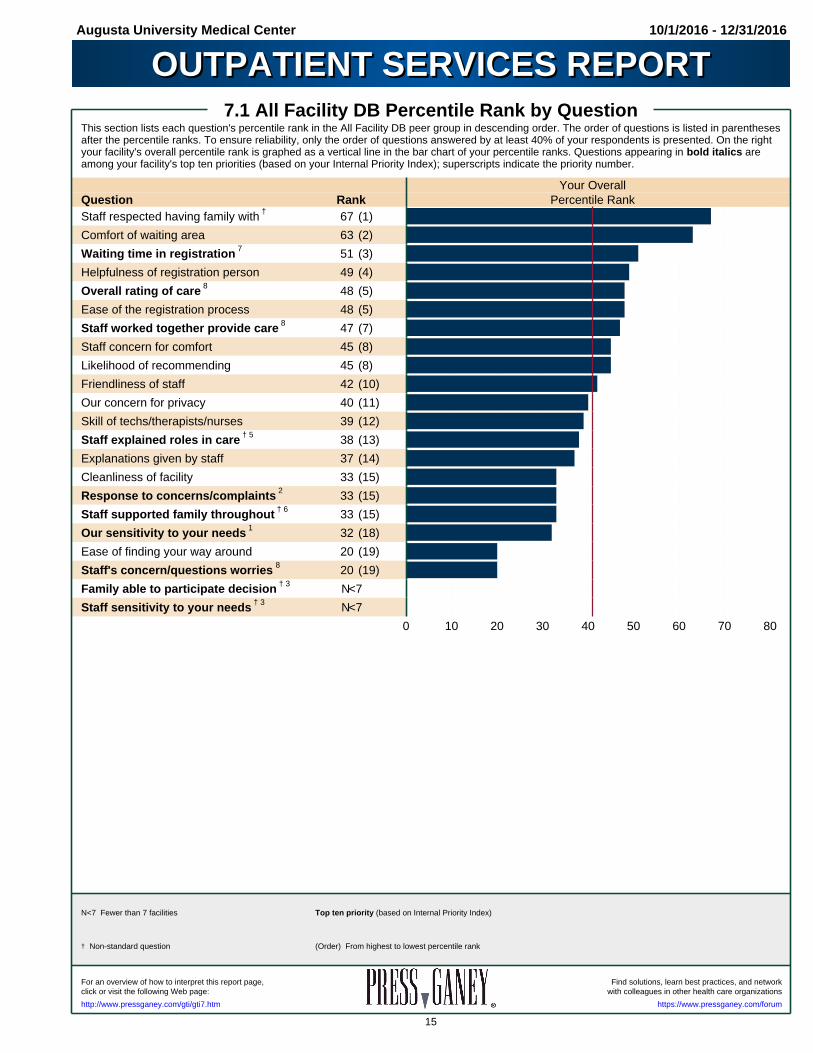
OUTPATIENT SERVICES REPORTOUTPATIENT SERVICES REPORT7.1 All Facility DB Percentile Rank by Question
This section lists each question's percentile rank in the All Facility DB peer group in descending order. The order of questions is listed in parenthesesafter the percentile ranks. To ensure reliability, only the order of questions answered by at least 40% of your respondents is presented. On the rightyour facility's overall percentile rank is graphed as a vertical line in the bar chart of your percentile ranks. Questions appearing in bold italics areamong your facility's top ten priorities (based on your Internal Priority Index); superscripts indicate the priority number.
Your OverallQuestion Rank Percentile RankStaff respected having family with † 67 (1)
Comfort of waiting area 63 (2)
Waiting time in registration 7 51 (3)
Helpfulness of registration person 49 (4)
Overall rating of care 8 48 (5)
Ease of the registration process 48 (5)
Staff worked together provide care 8 47 (7)
Staff concern for comfort 45 (8)
Likelihood of recommending 45 (8)
Friendliness of staff 42 (10)
Our concern for privacy 40 (11)
Skill of techs/therapists/nurses 39 (12)
Staff explained roles in care † 5 38 (13)
Explanations given by staff 37 (14)
Cleanliness of facility 33 (15)
Response to concerns/complaints 2 33 (15)
Staff supported family throughout † 6 33 (15)
Our sensitivity to your needs 1 32 (18)
Ease of finding your way around 20 (19)
Staff's concern/questions worries 8 20 (19)
Family able to participate decision † 3 N<7
Staff sensitivity to your needs † 3 N<7
0 10 20 30 40 50 60 70 80
N<7 Fewer than 7 facilities
† Non-standard question (Order) From highest to lowest percentile rank
Top ten priority (based on Internal Priority Index)
Find solutions, learn best practices, and networkFor an overview of how to interpret this report page,with colleagues in other health care organizationsclick or visit the following Web page:
https://www.pressganey.com/forumhttp://www.pressganey.com/gti/gti7.htm
15
Augusta University Medical Center 10/1/2016 - 12/31/2016
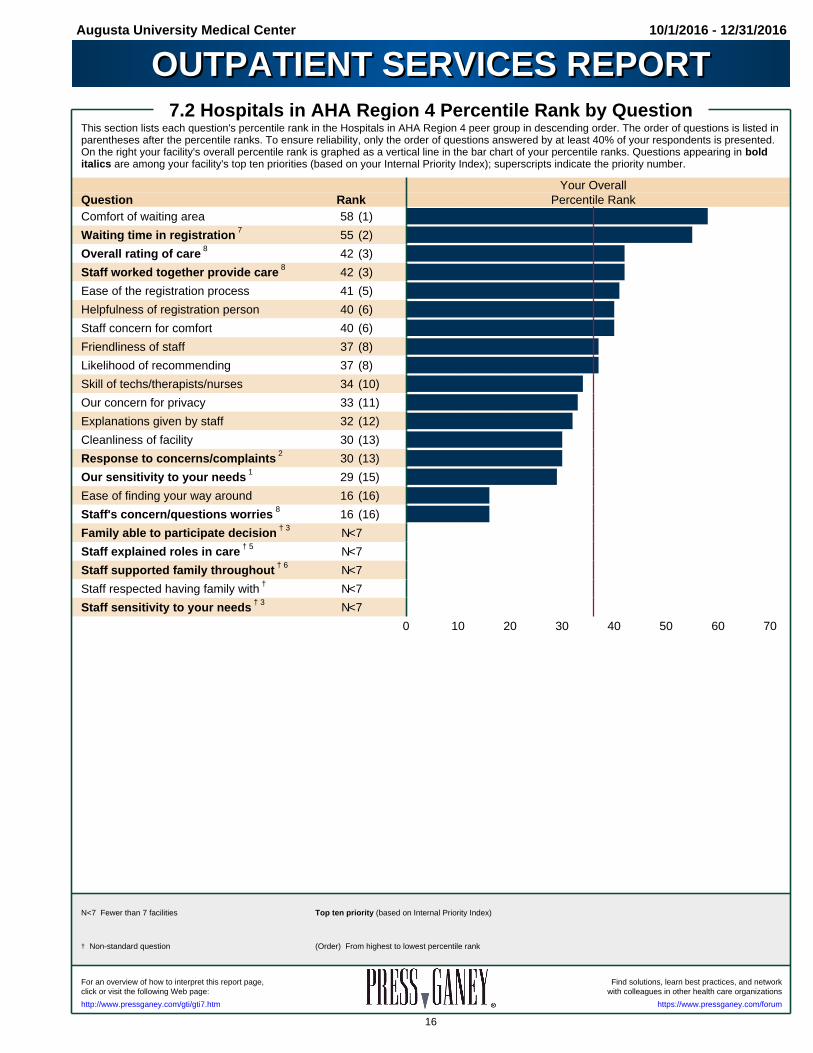
OUTPATIENT SERVICES REPORTOUTPATIENT SERVICES REPORT7.2 Hospitals in AHA Region 4 Percentile Rank by Question
This section lists each question's percentile rank in the Hospitals in AHA Region 4 peer group in descending order. The order of questions is listed inparentheses after the percentile ranks. To ensure reliability, only the order of questions answered by at least 40% of your respondents is presented.On the right your facility's overall percentile rank is graphed as a vertical line in the bar chart of your percentile ranks. Questions appearing in bolditalics are among your facility's top ten priorities (based on your Internal Priority Index); superscripts indicate the priority number.
Your OverallQuestion Rank Percentile RankComfort of waiting area 58 (1)
Waiting time in registration 7 55 (2)
Overall rating of care 8 42 (3)
Staff worked together provide care 8 42 (3)
Ease of the registration process 41 (5)
Helpfulness of registration person 40 (6)
Staff concern for comfort 40 (6)
Friendliness of staff 37 (8)
Likelihood of recommending 37 (8)
Skill of techs/therapists/nurses 34 (10)
Our concern for privacy 33 (11)
Explanations given by staff 32 (12)
Cleanliness of facility 30 (13)
Response to concerns/complaints 2 30 (13)
Our sensitivity to your needs 1 29 (15)
Ease of finding your way around 16 (16)
Staff's concern/questions worries 8 16 (16)
Family able to participate decision † 3 N<7
Staff explained roles in care † 5 N<7
Staff supported family throughout † 6 N<7
Staff respected having family with † N<7
Staff sensitivity to your needs † 3 N<7
0 10 20 30 40 50 60 70
N<7 Fewer than 7 facilities
† Non-standard question (Order) From highest to lowest percentile rank
Top ten priority (based on Internal Priority Index)
Find solutions, learn best practices, and networkFor an overview of how to interpret this report page,with colleagues in other health care organizationsclick or visit the following Web page:
https://www.pressganey.com/forumhttp://www.pressganey.com/gti/gti7.htm
16
Augusta University Medical Center 10/1/2016 - 12/31/2016
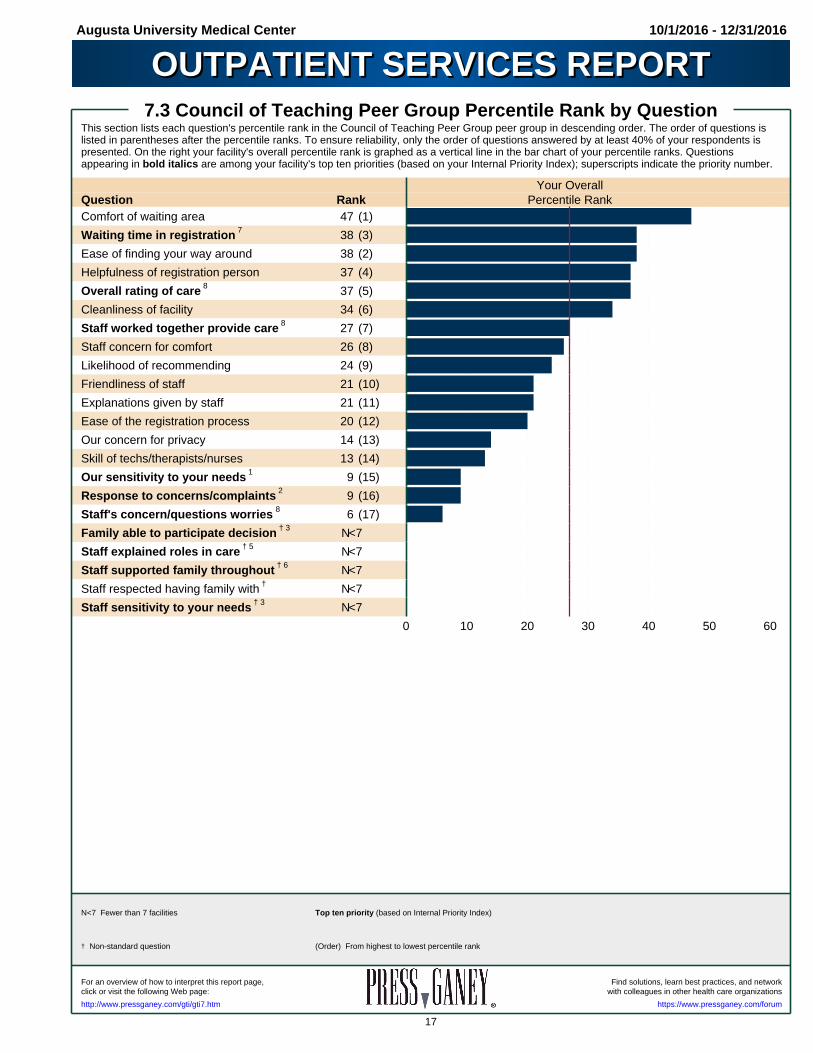
OUTPATIENT SERVICES REPORTOUTPATIENT SERVICES REPORT7.3 Council of Teaching Peer Group Percentile Rank by Question
This section lists each question's percentile rank in the Council of Teaching Peer Group peer group in descending order. The order of questions islisted in parentheses after the percentile ranks. To ensure reliability, only the order of questions answered by at least 40% of your respondents ispresented. On the right your facility's overall percentile rank is graphed as a vertical line in the bar chart of your percentile ranks. Questionsappearing in bold italics are among your facility's top ten priorities (based on your Internal Priority Index); superscripts indicate the priority number.
Your OverallQuestion Rank Percentile RankComfort of waiting area 47 (1)
Waiting time in registration 7 38 (3)
Ease of finding your way around 38 (2)
Helpfulness of registration person 37 (4)
Overall rating of care 8 37 (5)
Cleanliness of facility 34 (6)
Staff worked together provide care 8 27 (7)
Staff concern for comfort 26 (8)
Likelihood of recommending 24 (9)
Friendliness of staff 21 (10)
Explanations given by staff 21 (11)
Ease of the registration process 20 (12)
Our concern for privacy 14 (13)
Skill of techs/therapists/nurses 13 (14)
Our sensitivity to your needs 1 9 (15)
Response to concerns/complaints 2 9 (16)
Staff's concern/questions worries 8 6 (17)
Family able to participate decision † 3 N<7
Staff explained roles in care † 5 N<7
Staff supported family throughout † 6 N<7
Staff respected having family with † N<7
Staff sensitivity to your needs † 3 N<7
0 10 20 30 40 50 60
N<7 Fewer than 7 facilities
† Non-standard question (Order) From highest to lowest percentile rank
Top ten priority (based on Internal Priority Index)
Find solutions, learn best practices, and networkFor an overview of how to interpret this report page,with colleagues in other health care organizationsclick or visit the following Web page:
https://www.pressganey.com/forumhttp://www.pressganey.com/gti/gti7.htm
17
Augusta University Medical Center 10/1/2016 - 12/31/2016
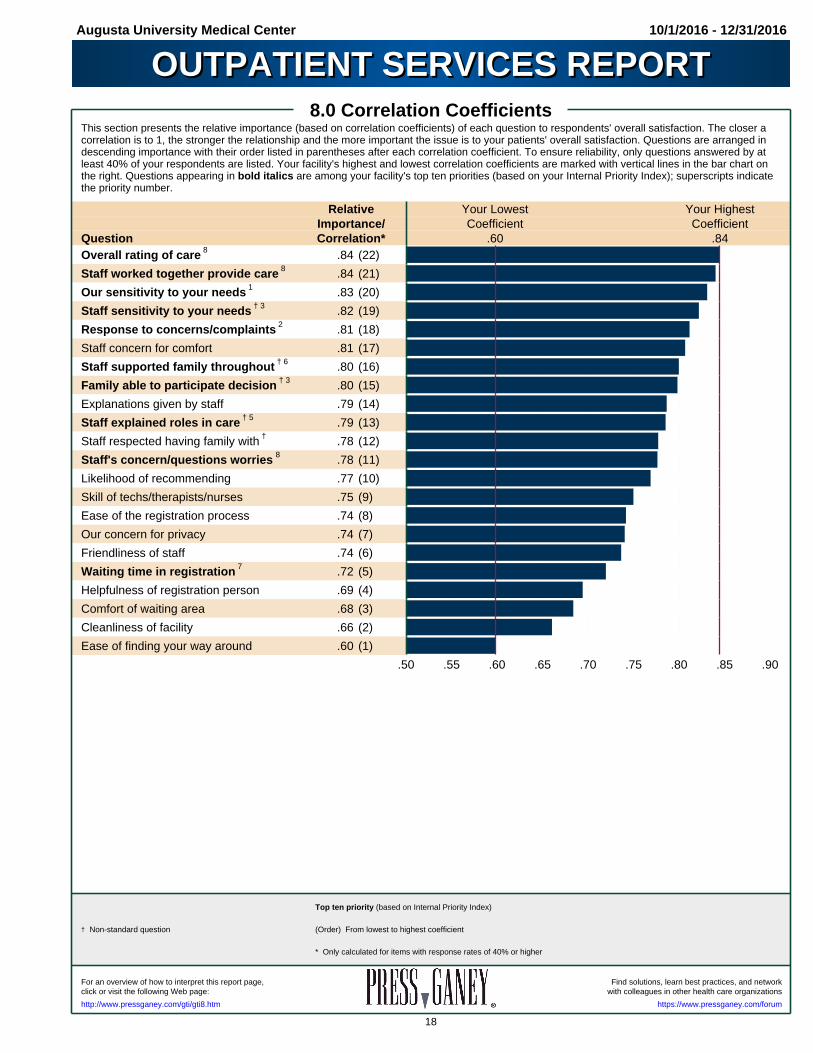
OUTPATIENT SERVICES REPORTOUTPATIENT SERVICES REPORT8.0 Correlation Coefficients
This section presents the relative importance (based on correlation coefficients) of each question to respondents' overall satisfaction. The closer acorrelation is to 1, the stronger the relationship and the more important the issue is to your patients' overall satisfaction. Questions are arranged indescending importance with their order listed in parentheses after each correlation coefficient. To ensure reliability, only questions answered by atleast 40% of your respondents are listed. Your facility's highest and lowest correlation coefficients are marked with vertical lines in the bar chart onthe right. Questions appearing in bold italics are among your facility's top ten priorities (based on your Internal Priority Index); superscripts indicatethe priority number.
Relative Your Lowest Your HighestImportance/ Coefficient Coefficient
Question Correlation* .60 .84Overall rating of care 8 .84 (22)
Staff worked together provide care 8 .84 (21)
Our sensitivity to your needs 1 .83 (20)
Staff sensitivity to your needs † 3 .82 (19)
Response to concerns/complaints 2 .81 (18)
Staff concern for comfort .81 (17)
Staff supported family throughout † 6 .80 (16)
Family able to participate decision † 3 .80 (15)
Explanations given by staff .79 (14)
Staff explained roles in care † 5 .79 (13)
Staff respected having family with † .78 (12)
Staff's concern/questions worries 8 .78 (11)
Likelihood of recommending .77 (10)
Skill of techs/therapists/nurses .75 (9)
Ease of the registration process .74 (8)
Our concern for privacy .74 (7)
Friendliness of staff .74 (6)
Waiting time in registration 7 .72 (5)
Helpfulness of registration person .69 (4)
Comfort of waiting area .68 (3)
Cleanliness of facility .66 (2)
Ease of finding your way around .60 (1)
.50 .55 .60 .65 .70 .75 .80 .85 .90
† Non-standard question (Order) From lowest to highest coefficient
* Only calculated for items with response rates of 40% or higher
Top ten priority (based on Internal Priority Index)
Find solutions, learn best practices, and networkFor an overview of how to interpret this report page,with colleagues in other health care organizationsclick or visit the following Web page:
https://www.pressganey.com/forumhttp://www.pressganey.com/gti/gti8.htm
18

Augusta University Medical Center 10/1/2016 - 12/31/2016
OUTPATIENT SERVICES REPORTOUTPATIENT SERVICES REPORT9.0 Priority Index (Internal)
The Internal Priority Index combines information about your facility's performance and the relative importance of each question to respondents'overall satisfaction. Higher priority is given to those issues that are relatively important to respondents (high correlation coefficients) and that youscored low on (low mean scores). Questions are listed in decreasing priority. Pay particular attention to questions that are consistently among yourtop ten priorities. Questions that are among this period's top ten priorities appear in bold italics in this and previous sections of the report. Current Previous Periods Mean CorrelationOrder Order Top 10 Question Score Coefficient Priority Index
1 2 7 Our sensitivity to your needs 92.9 (18) .83 (20) 18 20 38
2 1 7 Response to concerns/complaints 92.7 (19) .81 (18) 19 18 37
3 5 5 Staff sensitivity to your needs † 93.3 (13) .82 (19) 13 19 32
3 8 3 Family able to participate decision † 92.9 (17) .80 (15) 17 15 32
5 3 3 Staff explained roles in care † 93.0 (16) .79 (13) 16 13 29
6 10 4 Staff supported family throughout † 93.3 (12) .80 (16) 12 16 28
7 13 1 Waiting time in registration 90.8 (21) .72 (5) 21 5 26
8 4 2 Staff's concern/questions worries 93.3 (14) .78 (11) 14 11 25
8 5 7 Overall rating of care 95.2 (3) .84 (22) 3 22 25
8 9 3 Staff worked together provide care 94.8 (4) .84 (21) 4 21 25
11 7 - Comfort of waiting area 91.0 (20) .68 (3) 20 3 23
11 10 - Ease of finding your way around 87.7 (22) .60 (1) 22 23
13 15 - Explanations given by staff 94.3 (7) .79 (14) 7 14 21
13 15 - Staff concern for comfort 94.8 (4) .81 (17) 4 17 21
15 15 - Staff respected having family with † 94.0 (8) .78 (12) 8 12 20
16 19 - Ease of the registration process 93.5 (11) .74 (8) 11 8 19
17 13 - Our concern for privacy 93.6 (10) .74 (7) 10 7 17
17 15 - Cleanliness of facility 93.2 (15) .66 (2) 15 17
19 10 - Likelihood of recommending 94.6 (6) .77 (10) 6 10 16
20 19 - Helpfulness of registration person 93.8 (9) .69 (4) 9 4 13
21 22 - Skill of techs/therapists/nurses 95.5 (2) .75 (9) 9 11
22 21 - Friendliness of staff 96.1 (1) .74 (6) 6 7
† Non-standard question
Mean score order
Correlation coefficient order
(Order) From highest to lowest mean score
(Order) From lowest to highest coefficient
Periods Top 10 - Consecutive reporting periods in the top 10
Top ten priority (based on Internal Priority Index)
Find solutions, learn best practices, and networkFor an overview of how to interpret this report page,with colleagues in other health care organizationsclick or visit the following Web page:
https://www.pressganey.com/forumhttp://www.pressganey.com/gti/gti9.htm
19
Augusta University Medical Center 10/1/2016 - 12/31/2016
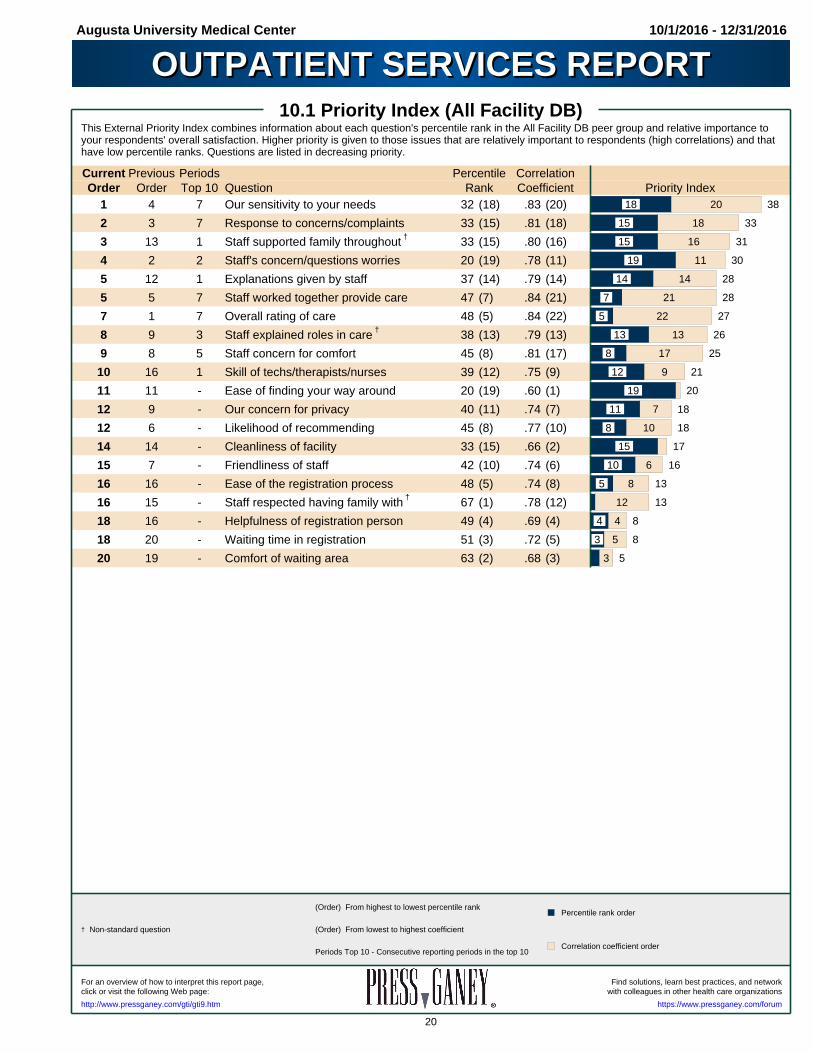
OUTPATIENT SERVICES REPORTOUTPATIENT SERVICES REPORT10.1 Priority Index (All Facility DB)
This External Priority Index combines information about each question's percentile rank in the All Facility DB peer group and relative importance toyour respondents' overall satisfaction. Higher priority is given to those issues that are relatively important to respondents (high correlations) and thathave low percentile ranks. Questions are listed in decreasing priority. Current Previous Periods Percentile CorrelationOrder Order Top 10 Question Rank Coefficient Priority Index
1 4 7 Our sensitivity to your needs 32 (18) .83 (20) 18 20 38
2 3 7 Response to concerns/complaints 33 (15) .81 (18) 15 18 33
3 13 1 Staff supported family throughout † 33 (15) .80 (16) 15 16 31
4 2 2 Staff's concern/questions worries 20 (19) .78 (11) 19 11 30
5 12 1 Explanations given by staff 37 (14) .79 (14) 14 14 28
5 5 7 Staff worked together provide care 47 (7) .84 (21) 7 21 28
7 1 7 Overall rating of care 48 (5) .84 (22) 5 22 27
8 9 3 Staff explained roles in care † 38 (13) .79 (13) 13 13 26
9 8 5 Staff concern for comfort 45 (8) .81 (17) 8 17 25
10 16 1 Skill of techs/therapists/nurses 39 (12) .75 (9) 12 9 21
11 11 - Ease of finding your way around 20 (19) .60 (1) 19 20
12 9 - Our concern for privacy 40 (11) .74 (7) 11 7 18
12 6 - Likelihood of recommending 45 (8) .77 (10) 8 10 18
14 14 - Cleanliness of facility 33 (15) .66 (2) 15 17
15 7 - Friendliness of staff 42 (10) .74 (6) 10 6 16
16 16 - Ease of the registration process 48 (5) .74 (8) 5 8 13
16 15 - Staff respected having family with † 67 (1) .78 (12) 12 13
18 16 - Helpfulness of registration person 49 (4) .69 (4) 4 4 8
18 20 - Waiting time in registration 51 (3) .72 (5) 3 5 8
20 19 - Comfort of waiting area 63 (2) .68 (3) 3 5
† Non-standard question
Percentile rank order
Correlation coefficient order
(Order) From highest to lowest percentile rank
(Order) From lowest to highest coefficient
Periods Top 10 - Consecutive reporting periods in the top 10
Find solutions, learn best practices, and networkFor an overview of how to interpret this report page,with colleagues in other health care organizationsclick or visit the following Web page:
https://www.pressganey.com/forumhttp://www.pressganey.com/gti/gti9.htm
20
Augusta University Medical Center 10/1/2016 - 12/31/2016
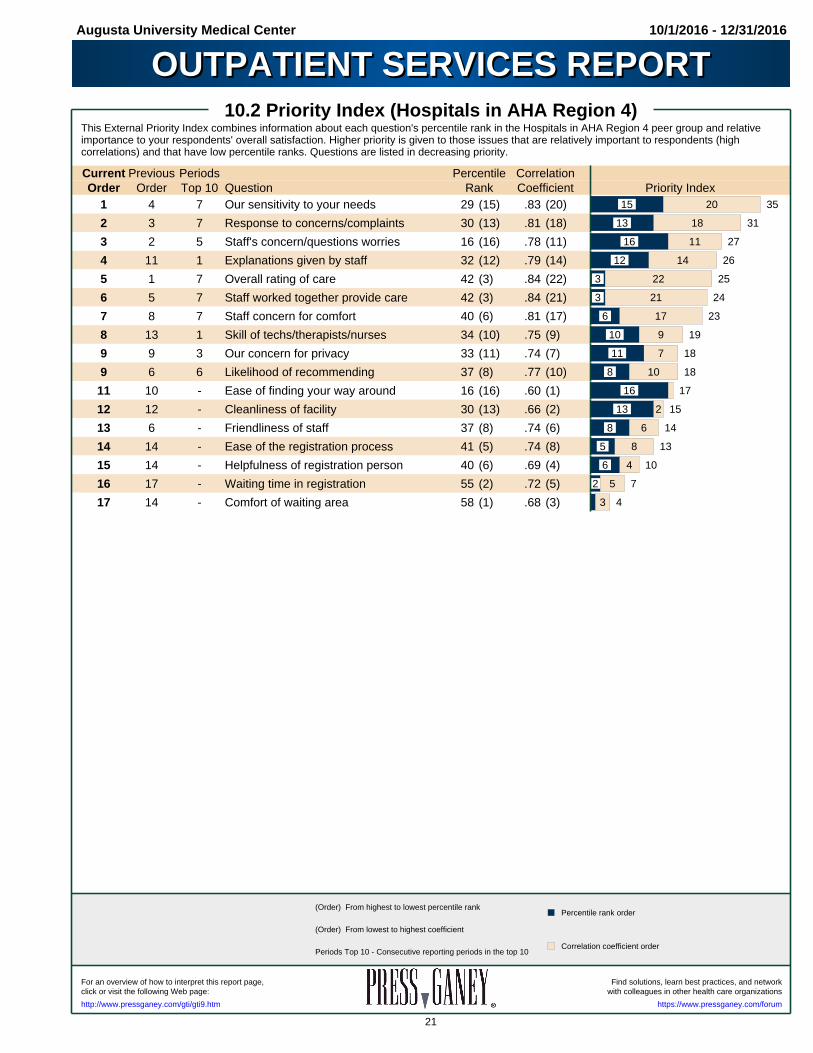
OUTPATIENT SERVICES REPORTOUTPATIENT SERVICES REPORT10.2 Priority Index (Hospitals in AHA Region 4)
This External Priority Index combines information about each question's percentile rank in the Hospitals in AHA Region 4 peer group and relativeimportance to your respondents' overall satisfaction. Higher priority is given to those issues that are relatively important to respondents (highcorrelations) and that have low percentile ranks. Questions are listed in decreasing priority. Current Previous Periods Percentile CorrelationOrder Order Top 10 Question Rank Coefficient Priority Index
1 4 7 Our sensitivity to your needs 29 (15) .83 (20) 15 20 35
2 3 7 Response to concerns/complaints 30 (13) .81 (18) 13 18 31
3 2 5 Staff's concern/questions worries 16 (16) .78 (11) 16 11 27
4 11 1 Explanations given by staff 32 (12) .79 (14) 12 14 26
5 1 7 Overall rating of care 42 (3) .84 (22) 3 22 25
6 5 7 Staff worked together provide care 42 (3) .84 (21) 3 21 24
7 8 7 Staff concern for comfort 40 (6) .81 (17) 6 17 23
8 13 1 Skill of techs/therapists/nurses 34 (10) .75 (9) 10 9 19
9 9 3 Our concern for privacy 33 (11) .74 (7) 11 7 18
9 6 6 Likelihood of recommending 37 (8) .77 (10) 8 10 18
11 10 - Ease of finding your way around 16 (16) .60 (1) 16 17
12 12 - Cleanliness of facility 30 (13) .66 (2) 13 2 15
13 6 - Friendliness of staff 37 (8) .74 (6) 8 6 14
14 14 - Ease of the registration process 41 (5) .74 (8) 5 8 13
15 14 - Helpfulness of registration person 40 (6) .69 (4) 6 4 10
16 17 - Waiting time in registration 55 (2) .72 (5) 2 5 7
17 14 - Comfort of waiting area 58 (1) .68 (3) 3 4
Percentile rank order
Correlation coefficient order
(Order) From highest to lowest percentile rank
(Order) From lowest to highest coefficient
Periods Top 10 - Consecutive reporting periods in the top 10
Find solutions, learn best practices, and networkFor an overview of how to interpret this report page,with colleagues in other health care organizationsclick or visit the following Web page:
https://www.pressganey.com/forumhttp://www.pressganey.com/gti/gti9.htm
21

Augusta University Medical Center 10/1/2016 - 12/31/2016
OUTPATIENT SERVICES REPORTOUTPATIENT SERVICES REPORT10.3 Priority Index (Council of Teaching Peer Group)
This External Priority Index combines information about each question's percentile rank in the Council of Teaching Peer Group peer group andrelative importance to your respondents' overall satisfaction. Higher priority is given to those issues that are relatively important to respondents (highcorrelations) and that have low percentile ranks. Questions are listed in decreasing priority. Current Previous Periods Percentile CorrelationOrder Order Top 10 Question Rank Coefficient Priority Index
1 4 7 Our sensitivity to your needs 9 (15) .83 (20) 15 20 35
2 3 7 Response to concerns/complaints 9 (16) .81 (18) 16 18 34
3 5 7 Staff worked together provide care 27 (7) .84 (21) 7 21 28
3 1 7 Staff's concern/questions worries 6 (17) .78 (11) 17 11 28
5 1 7 Overall rating of care 37 (5) .84 (22) 5 22 27
6 7 2 Explanations given by staff 21 (11) .79 (14) 11 14 25
6 10 7 Staff concern for comfort 26 (8) .81 (17) 8 17 25
8 11 1 Skill of techs/therapists/nurses 13 (14) .75 (9) 14 9 23
9 7 7 Our concern for privacy 14 (13) .74 (7) 13 7 20
9 12 1 Ease of the registration process 20 (12) .74 (8) 12 8 20
11 6 - Likelihood of recommending 24 (9) .77 (10) 9 10 19
12 7 - Friendliness of staff 21 (10) .74 (6) 10 6 16
13 14 - Helpfulness of registration person 37 (4) .69 (4) 4 4 8
13 17 - Waiting time in registration 38 (3) .72 (5) 3 5 8
13 13 - Cleanliness of facility 34 (6) .66 (2) 6 2 8
16 14 - Comfort of waiting area 47 (1) .68 (3) 3 4
17 16 - Ease of finding your way around 38 (2) .60 (1) 2 3
Percentile rank order
Correlation coefficient order
(Order) From highest to lowest percentile rank
(Order) From lowest to highest coefficient
Periods Top 10 - Consecutive reporting periods in the top 10
Find solutions, learn best practices, and networkFor an overview of how to interpret this report page,with colleagues in other health care organizationsclick or visit the following Web page:
https://www.pressganey.com/forumhttp://www.pressganey.com/gti/gti9.htm
22
Augusta University Medical Center 10/1/2016 - 12/31/2016
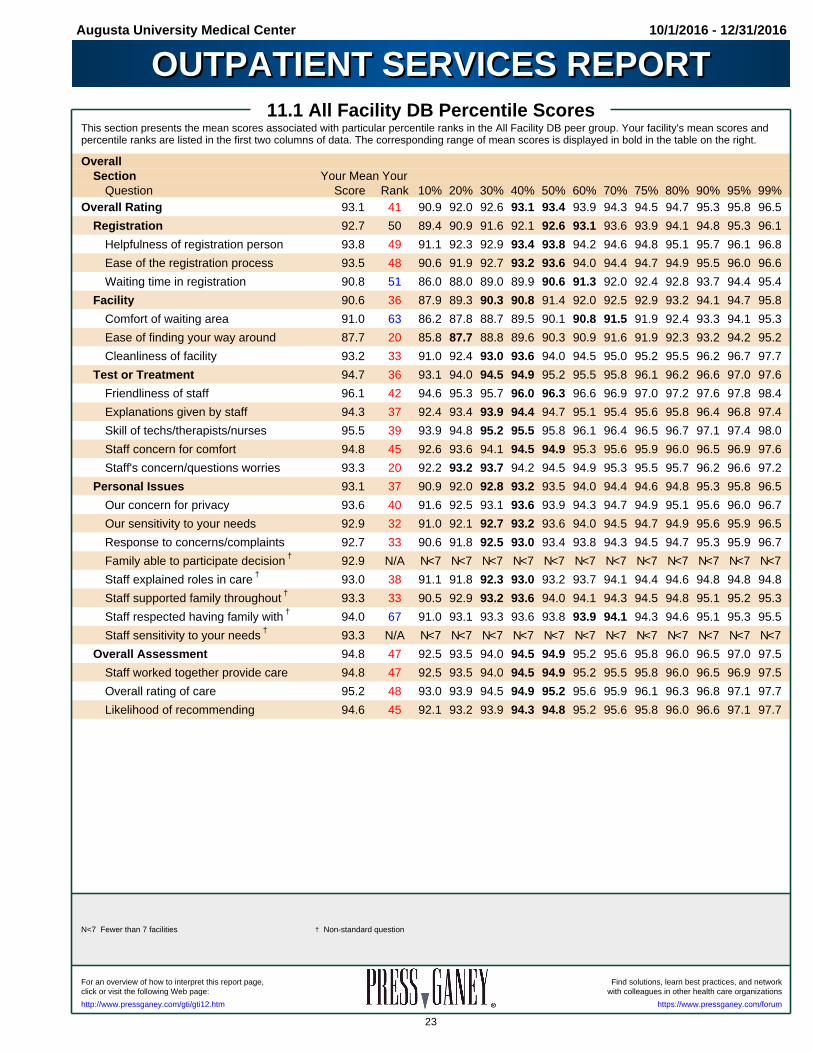
OUTPATIENT SERVICES REPORTOUTPATIENT SERVICES REPORT11.1 All Facility DB Percentile Scores
This section presents the mean scores associated with particular percentile ranks in the All Facility DB peer group. Your facility's mean scores andpercentile ranks are listed in the first two columns of data. The corresponding range of mean scores is displayed in bold in the table on the right. Overall
Section Your Mean YourQuestion Score Rank 10% 20% 30% 40% 50% 60% 70% 75% 80% 90% 95% 99%
Overall Rating 93.1 41 90.9 92.0 92.6 93.1 93.4 93.9 94.3 94.5 94.7 95.3 95.8 96.5
Registration 92.7 50 89.4 90.9 91.6 92.1 92.6 93.1 93.6 93.9 94.1 94.8 95.3 96.1
Helpfulness of registration person 93.8 49 91.1 92.3 92.9 93.4 93.8 94.2 94.6 94.8 95.1 95.7 96.1 96.8
Ease of the registration process 93.5 48 90.6 91.9 92.7 93.2 93.6 94.0 94.4 94.7 94.9 95.5 96.0 96.6
Waiting time in registration 90.8 51 86.0 88.0 89.0 89.9 90.6 91.3 92.0 92.4 92.8 93.7 94.4 95.4
Facility 90.6 36 87.9 89.3 90.3 90.8 91.4 92.0 92.5 92.9 93.2 94.1 94.7 95.8
Comfort of waiting area 91.0 63 86.2 87.8 88.7 89.5 90.1 90.8 91.5 91.9 92.4 93.3 94.1 95.3
Ease of finding your way around 87.7 20 85.8 87.7 88.8 89.6 90.3 90.9 91.6 91.9 92.3 93.2 94.2 95.2
Cleanliness of facility 93.2 33 91.0 92.4 93.0 93.6 94.0 94.5 95.0 95.2 95.5 96.2 96.7 97.7
Test or Treatment 94.7 36 93.1 94.0 94.5 94.9 95.2 95.5 95.8 96.1 96.2 96.6 97.0 97.6
Friendliness of staff 96.1 42 94.6 95.3 95.7 96.0 96.3 96.6 96.9 97.0 97.2 97.6 97.8 98.4
Explanations given by staff 94.3 37 92.4 93.4 93.9 94.4 94.7 95.1 95.4 95.6 95.8 96.4 96.8 97.4
Skill of techs/therapists/nurses 95.5 39 93.9 94.8 95.2 95.5 95.8 96.1 96.4 96.5 96.7 97.1 97.4 98.0
Staff concern for comfort 94.8 45 92.6 93.6 94.1 94.5 94.9 95.3 95.6 95.9 96.0 96.5 96.9 97.6
Staff's concern/questions worries 93.3 20 92.2 93.2 93.7 94.2 94.5 94.9 95.3 95.5 95.7 96.2 96.6 97.2
Personal Issues 93.1 37 90.9 92.0 92.8 93.2 93.5 94.0 94.4 94.6 94.8 95.3 95.8 96.5
Our concern for privacy 93.6 40 91.6 92.5 93.1 93.6 93.9 94.3 94.7 94.9 95.1 95.6 96.0 96.7
Our sensitivity to your needs 92.9 32 91.0 92.1 92.7 93.2 93.6 94.0 94.5 94.7 94.9 95.6 95.9 96.5
Response to concerns/complaints 92.7 33 90.6 91.8 92.5 93.0 93.4 93.8 94.3 94.5 94.7 95.3 95.9 96.7
Family able to participate decision † 92.9 N/A N<7 N<7 N<7 N<7 N<7 N<7 N<7 N<7 N<7 N<7 N<7 N<7
Staff explained roles in care † 93.0 38 91.1 91.8 92.3 93.0 93.2 93.7 94.1 94.4 94.6 94.8 94.8 94.8
Staff supported family throughout † 93.3 33 90.5 92.9 93.2 93.6 94.0 94.1 94.3 94.5 94.8 95.1 95.2 95.3
Staff respected having family with † 94.0 67 91.0 93.1 93.3 93.6 93.8 93.9 94.1 94.3 94.6 95.1 95.3 95.5
Staff sensitivity to your needs † 93.3 N/A N<7 N<7 N<7 N<7 N<7 N<7 N<7 N<7 N<7 N<7 N<7 N<7
Overall Assessment 94.8 47 92.5 93.5 94.0 94.5 94.9 95.2 95.6 95.8 96.0 96.5 97.0 97.5
Staff worked together provide care 94.8 47 92.5 93.5 94.0 94.5 94.9 95.2 95.5 95.8 96.0 96.5 96.9 97.5
Overall rating of care 95.2 48 93.0 93.9 94.5 94.9 95.2 95.6 95.9 96.1 96.3 96.8 97.1 97.7
Likelihood of recommending 94.6 45 92.1 93.2 93.9 94.3 94.8 95.2 95.6 95.8 96.0 96.6 97.1 97.7
N<7 Fewer than 7 facilities † Non-standard question
Find solutions, learn best practices, and networkFor an overview of how to interpret this report page,with colleagues in other health care organizationsclick or visit the following Web page:
https://www.pressganey.com/forumhttp://www.pressganey.com/gti/gti12.htm
23

Augusta University Medical Center 10/1/2016 - 12/31/2016
OUTPATIENT SERVICES REPORTOUTPATIENT SERVICES REPORT11.2 Hospitals in AHA Region 4 Percentile Scores
This section presents the mean scores associated with particular percentile ranks in the Hospitals in AHA Region 4 peer group. Your facility's meanscores and percentile ranks are listed in the first two columns of data. The corresponding range of mean scores is displayed in bold in the table onthe right. Overall
Section Your Mean YourQuestion Score Rank 10% 20% 30% 40% 50% 60% 70% 75% 80% 90% 95% 99%
Overall Rating 93.1 36 90.9 92.1 92.7 93.2 93.7 94.1 94.6 94.9 95.2 95.9 96.3 96.7
Registration 92.7 46 89.2 90.5 91.4 92.3 92.7 93.2 93.8 94.2 94.5 95.3 95.8 96.3
Helpfulness of registration person 93.8 40 91.2 92.6 93.3 93.8 94.2 94.5 95.0 95.3 95.5 96.1 96.6 97.8
Ease of the registration process 93.5 41 90.6 91.8 92.9 93.4 93.9 94.3 94.9 95.1 95.3 96.0 96.4 97.2
Waiting time in registration 90.8 55 85.7 87.5 88.6 89.7 90.3 91.0 91.9 92.6 93.0 94.1 94.7 95.3
Facility 90.6 32 88.1 89.4 90.4 91.2 91.8 92.4 93.1 93.5 93.9 94.9 95.6 96.2
Comfort of waiting area 91.0 58 85.8 87.5 88.7 89.6 90.4 91.3 92.3 92.6 92.8 93.9 95.0 95.9
Ease of finding your way around 87.7 16 87.0 88.3 89.2 90.0 90.8 91.5 92.3 92.8 93.2 94.5 95.0 95.9
Cleanliness of facility 93.2 30 91.0 92.4 93.2 93.8 94.3 94.9 95.4 95.5 95.8 96.9 97.4 98.1
Test or Treatment 94.7 30 93.4 94.3 94.7 95.1 95.4 95.7 96.1 96.3 96.5 97.0 97.3 97.6
Friendliness of staff 96.1 37 94.8 95.4 95.9 96.2 96.5 96.7 97.1 97.3 97.6 97.9 98.1 98.6
Explanations given by staff 94.3 32 92.7 93.5 94.2 94.6 94.9 95.3 95.7 96.0 96.2 96.8 97.0 97.5
Skill of techs/therapists/nurses 95.5 34 94.3 95.0 95.4 95.7 96.0 96.4 96.8 97.0 97.1 97.5 97.7 98.1
Staff concern for comfort 94.8 40 92.9 93.7 94.4 94.8 95.1 95.5 95.9 96.0 96.3 96.9 97.2 97.8
Staff's concern/questions worries 93.3 16 92.6 93.5 93.9 94.4 94.8 95.0 95.5 95.7 96.0 96.6 96.9 97.5
Personal Issues 93.1 32 90.9 92.2 92.9 93.4 93.7 94.2 94.7 95.0 95.2 95.7 96.2 96.5
Our concern for privacy 93.6 33 91.8 92.8 93.4 93.8 94.2 94.6 95.0 95.3 95.5 96.0 96.4 96.9
Our sensitivity to your needs 92.9 29 91.0 92.2 93.0 93.3 93.7 94.3 94.7 94.9 95.2 95.8 96.2 96.6
Response to concerns/complaints 92.7 30 90.2 91.8 92.6 93.2 93.5 94.1 94.7 94.9 95.1 95.8 96.3 96.9
Family able to participate decision † 92.9 N/A N<7 N<7 N<7 N<7 N<7 N<7 N<7 N<7 N<7 N<7 N<7 N<7
Staff explained roles in care † 93.0 N/A N<7 N<7 N<7 N<7 N<7 N<7 N<7 N<7 N<7 N<7 N<7 N<7
Staff supported family throughout † 93.3 N/A N<7 N<7 N<7 N<7 N<7 N<7 N<7 N<7 N<7 N<7 N<7 N<7
Staff respected having family with † 94.0 N/A N<7 N<7 N<7 N<7 N<7 N<7 N<7 N<7 N<7 N<7 N<7 N<7
Staff sensitivity to your needs † 93.3 N/A N<7 N<7 N<7 N<7 N<7 N<7 N<7 N<7 N<7 N<7 N<7 N<7
Overall Assessment 94.8 41 92.5 93.6 94.2 94.7 95.2 95.6 96.0 96.2 96.3 97.0 97.4 97.8
Staff worked together provide care 94.8 42 92.7 93.8 94.3 94.7 95.1 95.5 95.8 96.0 96.2 96.9 97.2 97.7
Overall rating of care 95.2 42 92.9 94.0 94.6 95.1 95.4 95.8 96.2 96.5 96.6 97.1 97.5 98.0
Likelihood of recommending 94.6 37 91.9 93.4 94.0 94.6 95.1 95.6 96.0 96.2 96.5 97.1 97.5 97.9
N<7 Fewer than 7 facilities † Non-standard question
Find solutions, learn best practices, and networkFor an overview of how to interpret this report page,with colleagues in other health care organizationsclick or visit the following Web page:
https://www.pressganey.com/forumhttp://www.pressganey.com/gti/gti12.htm
24

Augusta University Medical Center 10/1/2016 - 12/31/2016
OUTPATIENT SERVICES REPORTOUTPATIENT SERVICES REPORT11.3 Council of Teaching Peer Group Percentile Scores
This section presents the mean scores associated with particular percentile ranks in the Council of Teaching Peer Group peer group. Your facility'smean scores and percentile ranks are listed in the first two columns of data. The corresponding range of mean scores is displayed in bold in the tableon the right. Overall
Section Your Mean YourQuestion Score Rank 10% 20% 30% 40% 50% 60% 70% 75% 80% 90% 95% 99%
Overall Rating 93.1 27 92.1 92.6 93.3 93.5 93.7 94.4 94.7 94.7 94.8 95.3 95.7 95.7
Registration 92.7 31 90.9 92.1 92.6 93.1 93.5 93.7 94.0 94.2 94.4 94.9 95.4 95.8
Helpfulness of registration person 93.8 37 92.3 93.0 93.7 94.1 94.6 94.7 94.8 94.9 95.0 95.4 95.9 96.4
Ease of the registration process 93.5 20 92.1 93.5 93.9 94.1 94.3 94.6 94.7 94.7 94.8 96.0 96.6 96.6
Waiting time in registration 90.8 38 88.0 89.3 90.5 90.8 91.8 92.2 92.7 92.7 92.8 93.9 94.1 94.5
Facility 90.6 40 88.0 88.6 89.2 90.6 92.0 92.2 92.6 92.9 93.1 93.3 93.7 94.3
Comfort of waiting area 91.0 47 87.1 88.1 89.2 90.1 91.1 91.6 92.1 92.4 92.6 92.6 93.2 93.8
Ease of finding your way around 87.7 38 84.8 85.1 86.5 88.2 89.8 90.1 90.4 90.7 91.0 92.3 93.0 94.2
Cleanliness of facility 93.2 34 91.9 92.3 92.9 93.6 94.1 95.0 95.3 95.4 95.5 96.1 96.4 96.5
Test or Treatment 94.7 22 94.5 94.6 95.4 95.5 95.7 95.9 96.3 96.3 96.3 96.4 96.5 96.7
Friendliness of staff 96.1 21 95.6 96.0 96.5 96.7 96.8 96.9 97.0 97.1 97.2 97.5 97.6 97.8
Explanations given by staff 94.3 21 93.9 94.2 94.8 95.1 95.6 95.7 95.8 95.9 95.9 96.1 96.4 96.8
Skill of techs/therapists/nurses 95.5 13 95.4 95.6 95.9 96.0 96.0 96.5 96.5 96.6 96.7 96.9 97.0 97.2
Staff concern for comfort 94.8 26 94.1 94.4 95.1 95.4 95.5 95.7 96.0 96.2 96.4 96.5 96.6 96.6
Staff's concern/questions worries 93.3 6 93.5 94.1 94.6 94.8 94.8 94.8 95.0 95.3 95.6 95.8 95.9 96.1
Personal Issues 93.1 10 93.0 93.3 93.5 93.6 93.8 94.4 94.6 94.7 94.9 95.6 95.7 95.7
Our concern for privacy 93.6 14 93.3 93.7 93.9 94.1 94.4 94.5 94.7 94.9 95.2 95.9 96.0 96.2
Our sensitivity to your needs 92.9 9 92.9 93.4 93.5 93.7 94.0 94.6 94.9 94.9 95.0 95.7 95.8 95.9
Response to concerns/complaints 92.7 9 92.7 93.2 93.4 93.5 93.8 94.2 94.4 94.6 94.8 95.1 95.3 95.4
Family able to participate decision † 92.9 N/A N<7 N<7 N<7 N<7 N<7 N<7 N<7 N<7 N<7 N<7 N<7 N<7
Staff explained roles in care † 93.0 N/A N<7 N<7 N<7 N<7 N<7 N<7 N<7 N<7 N<7 N<7 N<7 N<7
Staff supported family throughout † 93.3 N/A N<7 N<7 N<7 N<7 N<7 N<7 N<7 N<7 N<7 N<7 N<7 N<7
Staff respected having family with † 94.0 N/A N<7 N<7 N<7 N<7 N<7 N<7 N<7 N<7 N<7 N<7 N<7 N<7
Staff sensitivity to your needs † 93.3 N/A N<7 N<7 N<7 N<7 N<7 N<7 N<7 N<7 N<7 N<7 N<7 N<7
Overall Assessment 94.8 24 93.8 94.6 94.9 95.2 95.3 95.7 96.1 96.2 96.3 96.6 96.8 97.1
Staff worked together provide care 94.8 27 93.5 94.5 94.9 95.0 95.3 95.6 95.9 96.0 96.2 96.4 96.6 97.1
Overall rating of care 95.2 37 94.3 94.9 95.2 95.4 95.8 96.1 96.4 96.5 96.5 96.7 97.0 97.1
Likelihood of recommending 94.6 24 93.4 94.3 95.0 95.1 95.3 95.7 96.2 96.4 96.6 96.8 97.1 97.2
N<7 Fewer than 7 facilities † Non-standard question
Find solutions, learn best practices, and networkFor an overview of how to interpret this report page,with colleagues in other health care organizationsclick or visit the following Web page:
https://www.pressganey.com/forumhttp://www.pressganey.com/gti/gti12.htm
25

Augusta University Medical Center 10/1/2016 - 12/31/2016
OUTPATIENT SERVICES REPORTOUTPATIENT SERVICES REPORT12.1.1 Registration Section Mean Trend Analysis
The broad light-colored columns show your facility's mean score for standard questions in the Registration section. One asterisk by a mean scoreindicates a statistically significant change from the previous period at the .05 level; two asterisks indicate a statistically significant change in meanscore at the .01 level. The narrow dark columns show your facility's score for all questions in the Registration section. I-bars represent each of yourpeer groups: The horizontal line in the middle of each I-bar is the peer group's average section mean score; the width of the I-bar represents twostandard deviations above and below the mean score. A marks the highest section mean score obtained by a facility in each peer group.
82 82
84 84
86 86
88 88
90 90
92 92
94 94
96 96
98 98
100 100
91.3n=10071/1/15
3/31/15
91.6n=3204/1/15
6/30/15
91.9n=7157/1/15
12/31/15
91.7n=8011/1/163/31/16
92.5n=7564/1/166/30/16
93.3n=9067/1/169/30/16
92.7n=993
10/1/1612/31/16
12.1.2 Registration Section Percentile Rank Trend AnalysisThis section shows how your overall percentile rank for the Registration section's standard questions has changed over time. A percentile rank tellsyou how you perform relative to others in the database. For example, a percentile rank of 50 indicates that you scored higher than 50% of the otherfacilities in the peer group for this section. Percentile rank trending is provided for up to three peer groups.
10 10
20 20
30 30
40 40
50 50
60 60
70 70
80 80
1/1/153/31/151/1/153/31/151/1/153/31/15
4/1/156/30/154/1/156/30/154/1/156/30/15
7/1/1512/31/157/1/15
12/31/157/1/15
12/31/151/1/163/31/161/1/163/31/161/1/163/31/16
4/1/166/30/164/1/166/30/164/1/166/30/16
7/1/169/30/167/1/169/30/167/1/169/30/16
10/1/1612/31/1610/1/1612/31/1610/1/1612/31/16
Standard Questions
All Questions
Highest score in peer group
n Number of responses +2 Std. Deviations
-2 Std. Deviations
COTH Peer Group Mean
+2 Std. Deviations
-2 Std. Deviations
AHA Region 4 Mean
All Facility DB Rank
AHA Region 4 Rank
COTH Peer Group Rank
+2 Std. Deviations
-2 Std. Deviations
All Facility DB Mean
Find solutions, learn best practices, and networkFor an overview of how to interpret this report page,with colleagues in other health care organizationsclick or visit the following Web page:
https://www.pressganey.com/forumhttp://www.pressganey.com/gti/gti13.htm
26
Augusta University Medical Center 10/1/2016 - 12/31/2016
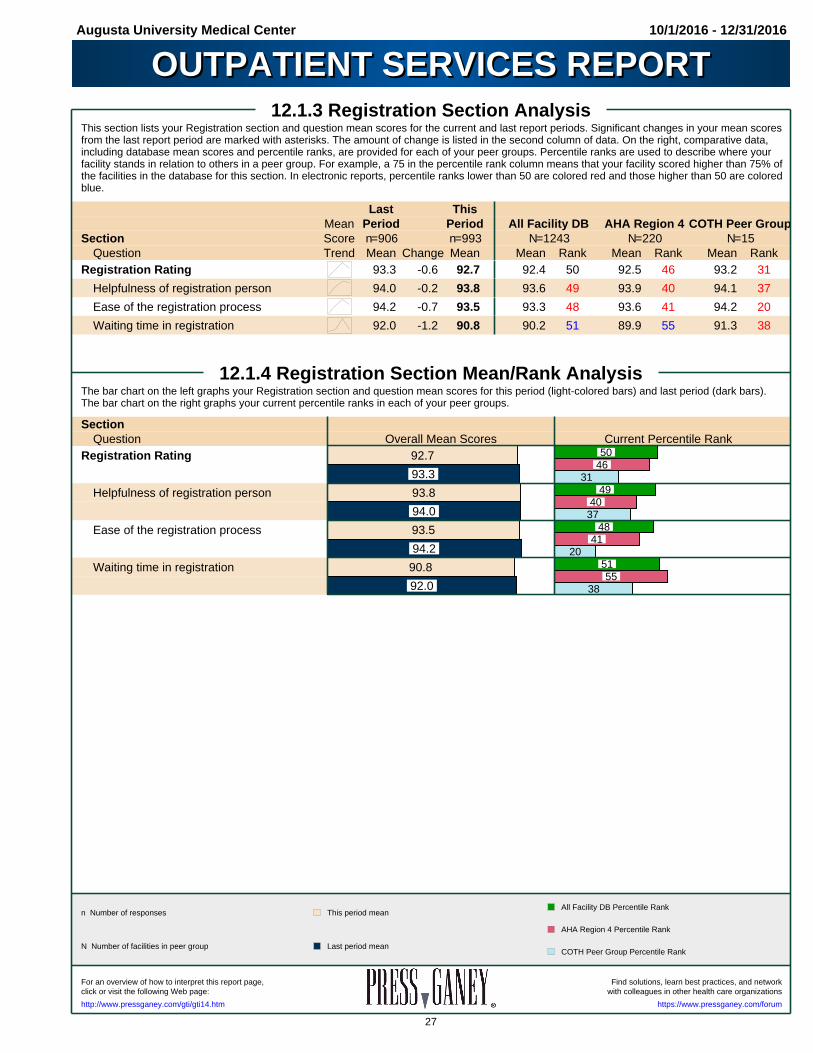
OUTPATIENT SERVICES REPORTOUTPATIENT SERVICES REPORT12.1.3 Registration Section Analysis
This section lists your Registration section and question mean scores for the current and last report periods. Significant changes in your mean scoresfrom the last report period are marked with asterisks. The amount of change is listed in the second column of data. On the right, comparative data,including database mean scores and percentile ranks, are provided for each of your peer groups. Percentile ranks are used to describe where yourfacility stands in relation to others in a peer group. For example, a 75 in the percentile rank column means that your facility scored higher than 75% ofthe facilities in the database for this section. In electronic reports, percentile ranks lower than 50 are colored red and those higher than 50 are coloredblue.
Last ThisMean Period Period All Facility DB AHA Region 4 COTH Peer Group
Section Score n=906 n=993 N=1243 N=220 N=15Question Trend Mean Change Mean Mean Rank Mean Rank Mean Rank
Registration Rating 93.3 -0.6 92.7 92.4 50 92.5 46 93.2 31
Helpfulness of registration person 94.0 -0.2 93.8 93.6 49 93.9 40 94.1 37
Ease of the registration process 94.2 -0.7 93.5 93.3 48 93.6 41 94.2 20
Waiting time in registration 92.0 -1.2 90.8 90.2 51 89.9 55 91.3 38
12.1.4 Registration Section Mean/Rank AnalysisThe bar chart on the left graphs your Registration section and question mean scores for this period (light-colored bars) and last period (dark bars).The bar chart on the right graphs your current percentile ranks in each of your peer groups. Section
Question Overall Mean Scores Current Percentile RankRegistration Rating 92.7
93.3
50 46
31
Helpfulness of registration person 93.8
94.0
49 40 37
Ease of the registration process 93.5
94.2
48 41
20
Waiting time in registration 90.8
92.0
51 55
38
n Number of responses
N Number of facilities in peer group
All Facility DB Percentile Rank
AHA Region 4 Percentile Rank
COTH Peer Group Percentile Rank
This period mean
Last period mean
Find solutions, learn best practices, and networkFor an overview of how to interpret this report page,with colleagues in other health care organizationsclick or visit the following Web page:
https://www.pressganey.com/forumhttp://www.pressganey.com/gti/gti14.htm
27

Augusta University Medical Center 10/1/2016 - 12/31/2016
OUTPATIENT SERVICES REPORTOUTPATIENT SERVICES REPORT12.2.1 Facility Section Mean Trend Analysis
The broad light-colored columns show your facility's mean score for standard questions in the Facility section. One asterisk by a mean scoreindicates a statistically significant change from the previous period at the .05 level; two asterisks indicate a statistically significant change in meanscore at the .01 level. The narrow dark columns show your facility's score for all questions in the Facility section. I-bars represent each of your peergroups: The horizontal line in the middle of each I-bar is the peer group's average section mean score; the width of the I-bar represents two standarddeviations above and below the mean score. A marks the highest section mean score obtained by a facility in each peer group.
82 82
84 84
86 86
88 88
90 90
92 92
94 94
96 96
98 98
100 100
87.7n=10121/1/15
3/31/15
87.2n=3234/1/15
6/30/15
89.5*n=7247/1/15
12/31/15
90.1n=8041/1/163/31/16
90.1n=7644/1/166/30/16
91.3n=9147/1/169/30/16
90.6n=997
10/1/1612/31/16
12.2.2 Facility Section Percentile Rank Trend AnalysisThis section shows how your overall percentile rank for the Facility section's standard questions has changed over time. A percentile rank tells youhow you perform relative to others in the database. For example, a percentile rank of 50 indicates that you scored higher than 50% of the otherfacilities in the peer group for this section. Percentile rank trending is provided for up to three peer groups.
0 0
10 10
20 20
30 30
40 40
50 50
60 60
1/1/153/31/151/1/153/31/151/1/153/31/15
4/1/156/30/154/1/156/30/154/1/156/30/15
7/1/1512/31/157/1/15
12/31/157/1/15
12/31/151/1/163/31/161/1/163/31/161/1/163/31/16
4/1/166/30/164/1/166/30/164/1/166/30/16
7/1/169/30/167/1/169/30/167/1/169/30/16
10/1/1612/31/1610/1/1612/31/1610/1/1612/31/16
* Sig. different from previous period (p<.05)
Standard Questions
All Questions
Highest score in peer group
n Number of responses +2 Std. Deviations
-2 Std. Deviations
COTH Peer Group Mean
+2 Std. Deviations
-2 Std. Deviations
AHA Region 4 Mean
All Facility DB Rank
AHA Region 4 Rank
COTH Peer Group Rank
+2 Std. Deviations
-2 Std. Deviations
All Facility DB Mean
Find solutions, learn best practices, and networkFor an overview of how to interpret this report page,with colleagues in other health care organizationsclick or visit the following Web page:
https://www.pressganey.com/forumhttp://www.pressganey.com/gti/gti13.htm
28

Augusta University Medical Center 10/1/2016 - 12/31/2016
OUTPATIENT SERVICES REPORTOUTPATIENT SERVICES REPORT12.2.3 Facility Section Analysis
This section lists your Facility section and question mean scores for the current and last report periods. Significant changes in your mean scores fromthe last report period are marked with asterisks. The amount of change is listed in the second column of data. On the right, comparative data,including database mean scores and percentile ranks, are provided for each of your peer groups. Percentile ranks are used to describe where yourfacility stands in relation to others in a peer group. For example, a 75 in the percentile rank column means that your facility scored higher than 75% ofthe facilities in the database for this section. In electronic reports, percentile ranks lower than 50 are colored red and those higher than 50 are coloredblue.
Last ThisMean Period Period All Facility DB AHA Region 4 COTH Peer Group
Section Score n=914 n=997 N=1243 N=220 N=15Question Trend Mean Change Mean Mean Rank Mean Rank Mean Rank
Facility Rating 91.3 -0.7 90.6 91.2 36 91.7 32 91.1 40
Comfort of waiting area 91.8 -0.8 91.0 90.0 63 90.3 58 90.4 47
Ease of finding your way around 88.5 -0.8 87.7 89.9 20 < 90.7 16 88.8 38
Cleanliness of facility 93.6* -0.4 93.2 93.8 33 94.2 30 94.1 34
12.2.4 Facility Section Mean/Rank AnalysisThe bar chart on the left graphs your Facility section and question mean scores for this period (light-colored bars) and last period (dark bars). The barchart on the right graphs your current percentile ranks in each of your peer groups. Section
Question Overall Mean Scores Current Percentile RankFacility Rating 90.6
91.3
36 32
40
Comfort of waiting area 91.0
91.8
63 58
47
Ease of finding your way around 87.7
88.5
20 16
38
Cleanliness of facility 93.2
93.6
33 30
34
* Significantly different at .05 level
< 1 standard deviation below peer group mean
n Number of responses
N Number of facilities in peer group
All Facility DB Percentile Rank
AHA Region 4 Percentile Rank
COTH Peer Group Percentile Rank
This period mean
Last period mean
Find solutions, learn best practices, and networkFor an overview of how to interpret this report page,with colleagues in other health care organizationsclick or visit the following Web page:
https://www.pressganey.com/forumhttp://www.pressganey.com/gti/gti14.htm
29

Augusta University Medical Center 10/1/2016 - 12/31/2016
OUTPATIENT SERVICES REPORTOUTPATIENT SERVICES REPORT12.3.1 Test or Treatment Section Mean Trend Analysis
The broad light-colored columns show your facility's mean score for standard questions in the Test or Treatment section. One asterisk by a meanscore indicates a statistically significant change from the previous period at the .05 level; two asterisks indicate a statistically significant change inmean score at the .01 level. The narrow dark columns show your facility's score for all questions in the Test or Treatment section. I-bars representeach of your peer groups: The horizontal line in the middle of each I-bar is the peer group's average section mean score; the width of the I-barrepresents two standard deviations above and below the mean score. A marks the highest section mean score obtained by a facility in eachpeer group.
88 88
90 90
92 92
94 94
96 96
98 98
100 100
93.6n=10101/1/15
3/31/15
93.8n=3224/1/15
6/30/15
94.4n=7257/1/15
12/31/15
94.9n=8031/1/163/31/16
94.2n=7624/1/166/30/16
94.6n=9157/1/169/30/16
94.7n=998
10/1/1612/31/16
12.3.2 Test or Treatment Section Percentile Rank Trend AnalysisThis section shows how your overall percentile rank for the Test or Treatment section's standard questions has changed over time. A percentile ranktells you how you perform relative to others in the database. For example, a percentile rank of 50 indicates that you scored higher than 50% of theother facilities in the peer group for this section. Percentile rank trending is provided for up to three peer groups.
0 0
10 10
20 20
30 30
40 40
50 50
60 60
1/1/153/31/151/1/153/31/151/1/153/31/15
4/1/156/30/154/1/156/30/154/1/156/30/15
7/1/1512/31/157/1/15
12/31/157/1/15
12/31/151/1/163/31/161/1/163/31/161/1/163/31/16
4/1/166/30/164/1/166/30/164/1/166/30/16
7/1/169/30/167/1/169/30/167/1/169/30/16
10/1/1612/31/1610/1/1612/31/1610/1/1612/31/16
Standard Questions
All Questions
Highest score in peer group
n Number of responses +2 Std. Deviations
-2 Std. Deviations
COTH Peer Group Mean
+2 Std. Deviations
-2 Std. Deviations
AHA Region 4 Mean
All Facility DB Rank
AHA Region 4 Rank
COTH Peer Group Rank
+2 Std. Deviations
-2 Std. Deviations
All Facility DB Mean
Find solutions, learn best practices, and networkFor an overview of how to interpret this report page,with colleagues in other health care organizationsclick or visit the following Web page:
https://www.pressganey.com/forumhttp://www.pressganey.com/gti/gti13.htm
30
Augusta University Medical Center 10/1/2016 - 12/31/2016
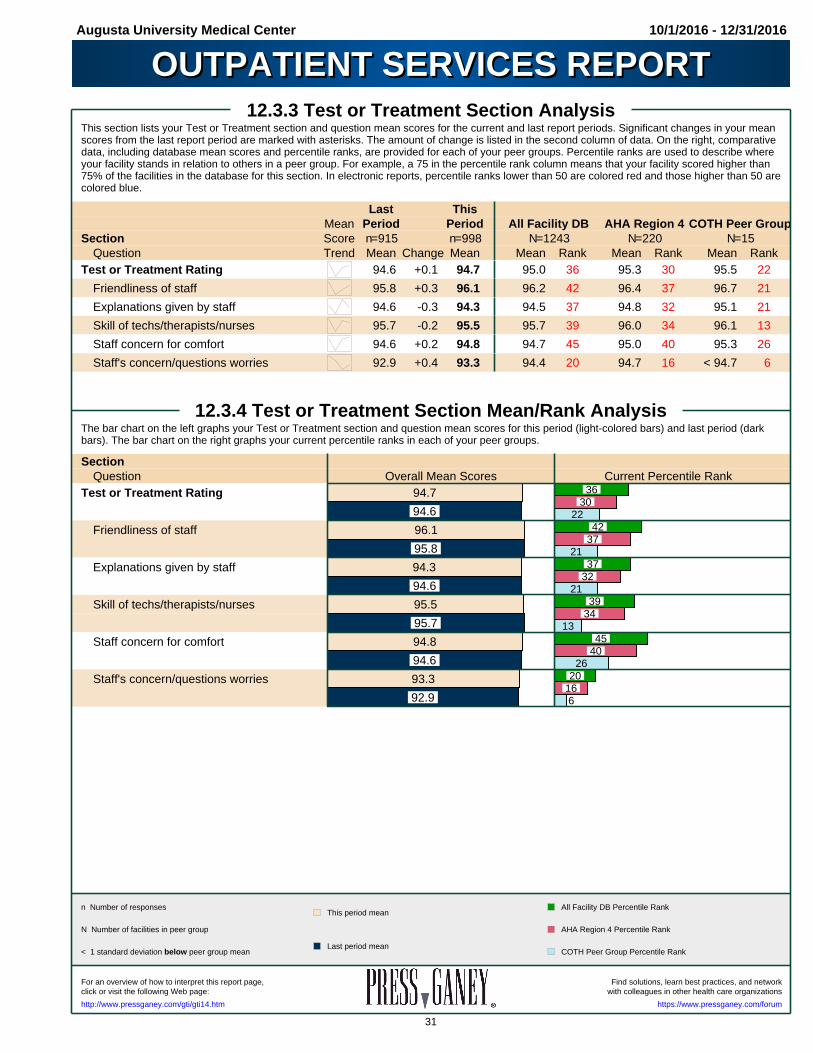
OUTPATIENT SERVICES REPORTOUTPATIENT SERVICES REPORT12.3.3 Test or Treatment Section Analysis
This section lists your Test or Treatment section and question mean scores for the current and last report periods. Significant changes in your meanscores from the last report period are marked with asterisks. The amount of change is listed in the second column of data. On the right, comparativedata, including database mean scores and percentile ranks, are provided for each of your peer groups. Percentile ranks are used to describe whereyour facility stands in relation to others in a peer group. For example, a 75 in the percentile rank column means that your facility scored higher than75% of the facilities in the database for this section. In electronic reports, percentile ranks lower than 50 are colored red and those higher than 50 arecolored blue.
Last ThisMean Period Period All Facility DB AHA Region 4 COTH Peer Group
Section Score n=915 n=998 N=1243 N=220 N=15Question Trend Mean Change Mean Mean Rank Mean Rank Mean Rank
Test or Treatment Rating 94.6 +0.1 94.7 95.0 36 95.3 30 95.5 22
Friendliness of staff 95.8 +0.3 96.1 96.2 42 96.4 37 96.7 21
Explanations given by staff 94.6 -0.3 94.3 94.5 37 94.8 32 95.1 21
Skill of techs/therapists/nurses 95.7 -0.2 95.5 95.7 39 96.0 34 96.1 13
Staff concern for comfort 94.6 +0.2 94.8 94.7 45 95.0 40 95.3 26
Staff's concern/questions worries 92.9 +0.4 93.3 94.4 20 94.7 16 < 94.7 6
12.3.4 Test or Treatment Section Mean/Rank AnalysisThe bar chart on the left graphs your Test or Treatment section and question mean scores for this period (light-colored bars) and last period (darkbars). The bar chart on the right graphs your current percentile ranks in each of your peer groups. Section
Question Overall Mean Scores Current Percentile RankTest or Treatment Rating 94.7
94.6
36 30
22
Friendliness of staff 96.1
95.8
42 37
21
Explanations given by staff 94.3
94.6
37 32
21
Skill of techs/therapists/nurses 95.5
95.7
39 34
13
Staff concern for comfort 94.8
94.6
45 40
26
Staff's concern/questions worries 93.3
92.9
20 16
6
< 1 standard deviation below peer group mean
n Number of responses
N Number of facilities in peer group
All Facility DB Percentile Rank
AHA Region 4 Percentile Rank
COTH Peer Group Percentile Rank
This period mean
Last period mean
Find solutions, learn best practices, and networkFor an overview of how to interpret this report page,with colleagues in other health care organizationsclick or visit the following Web page:
https://www.pressganey.com/forumhttp://www.pressganey.com/gti/gti14.htm
31

Augusta University Medical Center 10/1/2016 - 12/31/2016
OUTPATIENT SERVICES REPORTOUTPATIENT SERVICES REPORT12.4.1 Personal Issues Section Mean Trend Analysis
The broad light-colored columns show your facility's mean score for standard questions in the Personal Issues section. One asterisk by a meanscore indicates a statistically significant change from the previous period at the .05 level; two asterisks indicate a statistically significant change inmean score at the .01 level. The narrow dark columns show your facility's score for all questions in the Personal Issues section. I-bars representeach of your peer groups: The horizontal line in the middle of each I-bar is the peer group's average section mean score; the width of the I-barrepresents two standard deviations above and below the mean score. A marks the highest section mean score obtained by a facility in eachpeer group.
86 86
88 88
90 90
92 92
94 94
96 96
98 98
100 100
91.2n=10051/1/15
3/31/15
91.0n=3184/1/15
6/30/15
92.3n=7077/1/15
12/31/15
92.8n=7811/1/163/31/16
92.1n=7534/1/166/30/16
92.8n=8967/1/169/30/16
93.1n=975
10/1/1612/31/16
12.4.2 Personal Issues Section Percentile Rank Trend AnalysisThis section shows how your overall percentile rank for the Personal Issues section's standard questions has changed over time. A percentile ranktells you how you perform relative to others in the database. For example, a percentile rank of 50 indicates that you scored higher than 50% of theother facilities in the peer group for this section. Percentile rank trending is provided for up to three peer groups.
0 0
10 10
20 20
30 30
40 40
50 50
1/1/153/31/151/1/153/31/151/1/153/31/15
4/1/156/30/154/1/156/30/154/1/156/30/15
7/1/1512/31/157/1/15
12/31/157/1/15
12/31/151/1/163/31/161/1/163/31/161/1/163/31/16
4/1/166/30/164/1/166/30/164/1/166/30/16
7/1/169/30/167/1/169/30/167/1/169/30/16
10/1/1612/31/1610/1/1612/31/1610/1/1612/31/16
Standard Questions
All Questions
Highest score in peer group
n Number of responses +2 Std. Deviations
-2 Std. Deviations
COTH Peer Group Mean
+2 Std. Deviations
-2 Std. Deviations
AHA Region 4 Mean
All Facility DB Rank
AHA Region 4 Rank
COTH Peer Group Rank
+2 Std. Deviations
-2 Std. Deviations
All Facility DB Mean
Find solutions, learn best practices, and networkFor an overview of how to interpret this report page,with colleagues in other health care organizationsclick or visit the following Web page:
https://www.pressganey.com/forumhttp://www.pressganey.com/gti/gti13.htm
32

Augusta University Medical Center 10/1/2016 - 12/31/2016
OUTPATIENT SERVICES REPORTOUTPATIENT SERVICES REPORT12.4.3 Personal Issues Section Analysis
This section lists your Personal Issues section and question mean scores for the current and last report periods. Significant changes in your meanscores from the last report period are marked with asterisks. The amount of change is listed in the second column of data. On the right, comparativedata, including database mean scores and percentile ranks, are provided for each of your peer groups. Percentile ranks are used to describe whereyour facility stands in relation to others in a peer group. For example, a 75 in the percentile rank column means that your facility scored higher than75% of the facilities in the database for this section. In electronic reports, percentile ranks lower than 50 are colored red and those higher than 50 arecolored blue.
Last ThisMean Period Period All Facility DB AHA Region 4 COTH Peer Group
Section Score n=896 n=975 N=1243 N=220 N=15Question Trend Mean Change Mean Mean Rank Mean Rank Mean Rank
Personal Issues Rating 92.8 +0.3 93.1 93.4 37 93.6 32 94.0 10
Personal Issues Rating †† 93.2 +0.0 93.2
Our concern for privacy 93.5 +0.1 93.6 93.7 40 94.1 33 94.4 14
Our sensitivity to your needs 92.8 +0.1 92.9 93.4 32 93.7 29 < 94.2 9
Response to concerns/complaints 92.7 +0.0 92.7 93.2 33 93.4 30 < 93.8 9
Family able to participate decision † 93.7 -0.8 92.9 N<7 N/A N<7 N/A N<7 N/A
Staff explained roles in care † 93.3 -0.3 93.0 93.0 38 N<7 N/A N<7 N/A
Staff supported family throughout † 93.9 -0.6 93.3 93.2 33 N<7 N/A N<7 N/A
Staff respected having family with † 94.8 -0.8 94.0 93.3 67 N<7 N/A N<7 N/A
Staff sensitivity to your needs † 93.4 -0.1 93.3 N<7 N/A N<7 N/A N<7 N/A
12.4.4 Personal Issues Section Mean/Rank AnalysisThe bar chart on the left graphs your Personal Issues section and question mean scores for this period (light-colored bars) and last period (darkbars). The bar chart on the right graphs your current percentile ranks in each of your peer groups. Section
Question Overall Mean Scores Current Percentile RankPersonal Issues Rating 93.1
92.8
37 32
10
Personal Issues Rating †† 93.2
93.2
Our concern for privacy 93.6
93.5
40 33
14
Our sensitivity to your needs 92.9
92.8
32 29
9
Response to concerns/complaints 92.7
92.7
33 30
9
Family able to participate decision † 92.9
93.7
Staff explained roles in care † 93.0
93.3
38
Staff supported family throughout † 93.3
93.9
33
Continued...
< 1 standard deviation below peer group mean<< 2 standard deviations below peer group mean† Non-standard question†† Includes non-standard questions
n Number of responsesN Number of facilities in peer group
All Facility DB Percentile Rank
AHA Region 4 Percentile Rank
COTH Peer Group Percentile RankN<7 Fewer than 7 facilities
This period mean
Last period mean
Find solutions, learn best practices, and networkFor an overview of how to interpret this report page,with colleagues in other health care organizationsclick or visit the following Web page:
https://www.pressganey.com/forumhttp://www.pressganey.com/gti/gti14.htm
33
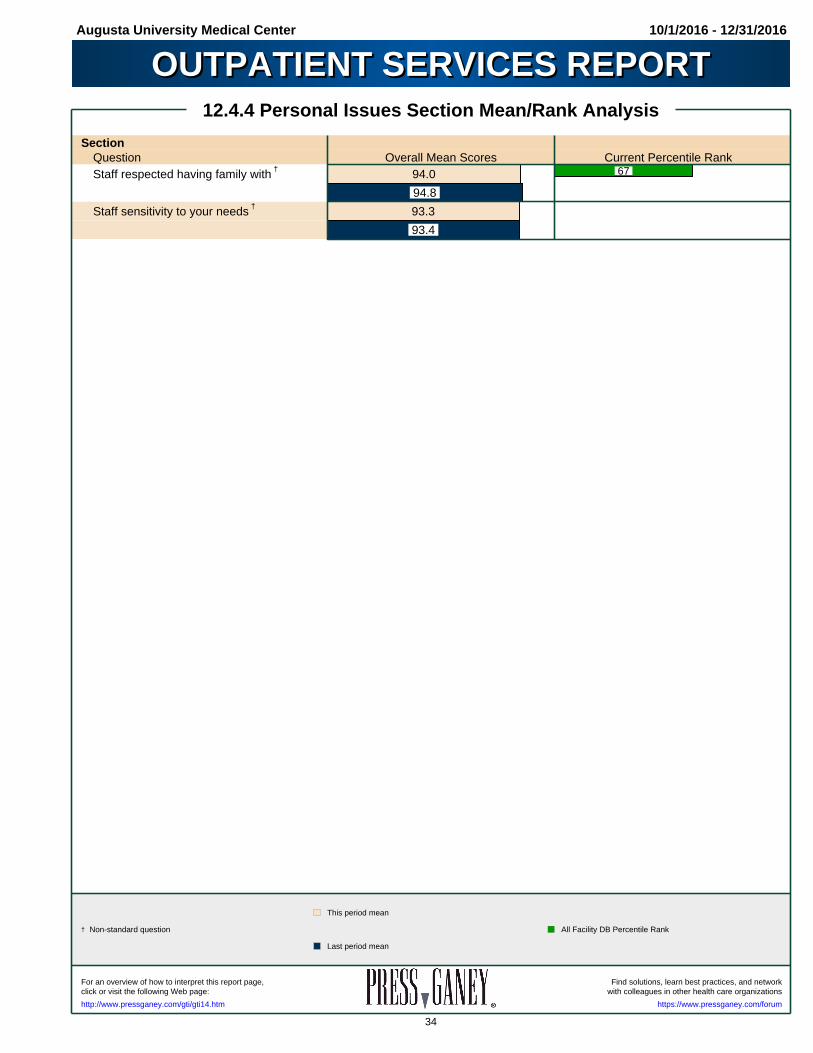
Augusta University Medical Center 10/1/2016 - 12/31/2016
OUTPATIENT SERVICES REPORTOUTPATIENT SERVICES REPORT12.4.4 Personal Issues Section Mean/Rank Analysis
SectionQuestion Overall Mean Scores Current Percentile RankStaff respected having family with † 94.0
94.8
67
Staff sensitivity to your needs † 93.3
93.4
† Non-standard question All Facility DB Percentile Rank
This period mean
Last period mean
Find solutions, learn best practices, and networkFor an overview of how to interpret this report page,with colleagues in other health care organizationsclick or visit the following Web page:
https://www.pressganey.com/forumhttp://www.pressganey.com/gti/gti14.htm
34
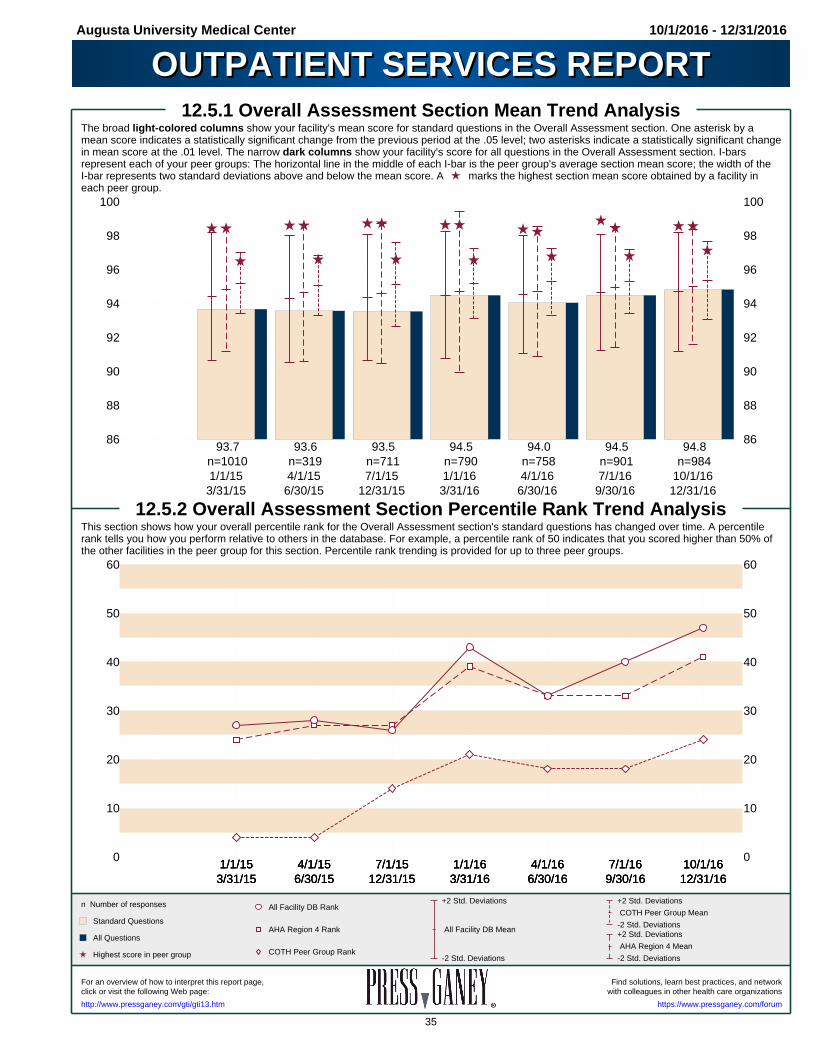
Augusta University Medical Center 10/1/2016 - 12/31/2016
OUTPATIENT SERVICES REPORTOUTPATIENT SERVICES REPORT12.5.1 Overall Assessment Section Mean Trend Analysis
The broad light-colored columns show your facility's mean score for standard questions in the Overall Assessment section. One asterisk by amean score indicates a statistically significant change from the previous period at the .05 level; two asterisks indicate a statistically significant changein mean score at the .01 level. The narrow dark columns show your facility's score for all questions in the Overall Assessment section. I-barsrepresent each of your peer groups: The horizontal line in the middle of each I-bar is the peer group's average section mean score; the width of theI-bar represents two standard deviations above and below the mean score. A marks the highest section mean score obtained by a facility ineach peer group.
86 86
88 88
90 90
92 92
94 94
96 96
98 98
100 100
93.7n=10101/1/15
3/31/15
93.6n=3194/1/15
6/30/15
93.5n=7117/1/15
12/31/15
94.5n=7901/1/163/31/16
94.0n=7584/1/166/30/16
94.5n=9017/1/169/30/16
94.8n=984
10/1/1612/31/16
12.5.2 Overall Assessment Section Percentile Rank Trend AnalysisThis section shows how your overall percentile rank for the Overall Assessment section's standard questions has changed over time. A percentilerank tells you how you perform relative to others in the database. For example, a percentile rank of 50 indicates that you scored higher than 50% ofthe other facilities in the peer group for this section. Percentile rank trending is provided for up to three peer groups.
0 0
10 10
20 20
30 30
40 40
50 50
60 60
1/1/153/31/151/1/153/31/151/1/153/31/15
4/1/156/30/154/1/156/30/154/1/156/30/15
7/1/1512/31/157/1/15
12/31/157/1/15
12/31/151/1/163/31/161/1/163/31/161/1/163/31/16
4/1/166/30/164/1/166/30/164/1/166/30/16
7/1/169/30/167/1/169/30/167/1/169/30/16
10/1/1612/31/1610/1/1612/31/1610/1/1612/31/16
Standard Questions
All Questions
Highest score in peer group
n Number of responses +2 Std. Deviations
-2 Std. Deviations
COTH Peer Group Mean
+2 Std. Deviations
-2 Std. Deviations
AHA Region 4 Mean
All Facility DB Rank
AHA Region 4 Rank
COTH Peer Group Rank
+2 Std. Deviations
-2 Std. Deviations
All Facility DB Mean
Find solutions, learn best practices, and networkFor an overview of how to interpret this report page,with colleagues in other health care organizationsclick or visit the following Web page:
https://www.pressganey.com/forumhttp://www.pressganey.com/gti/gti13.htm
35
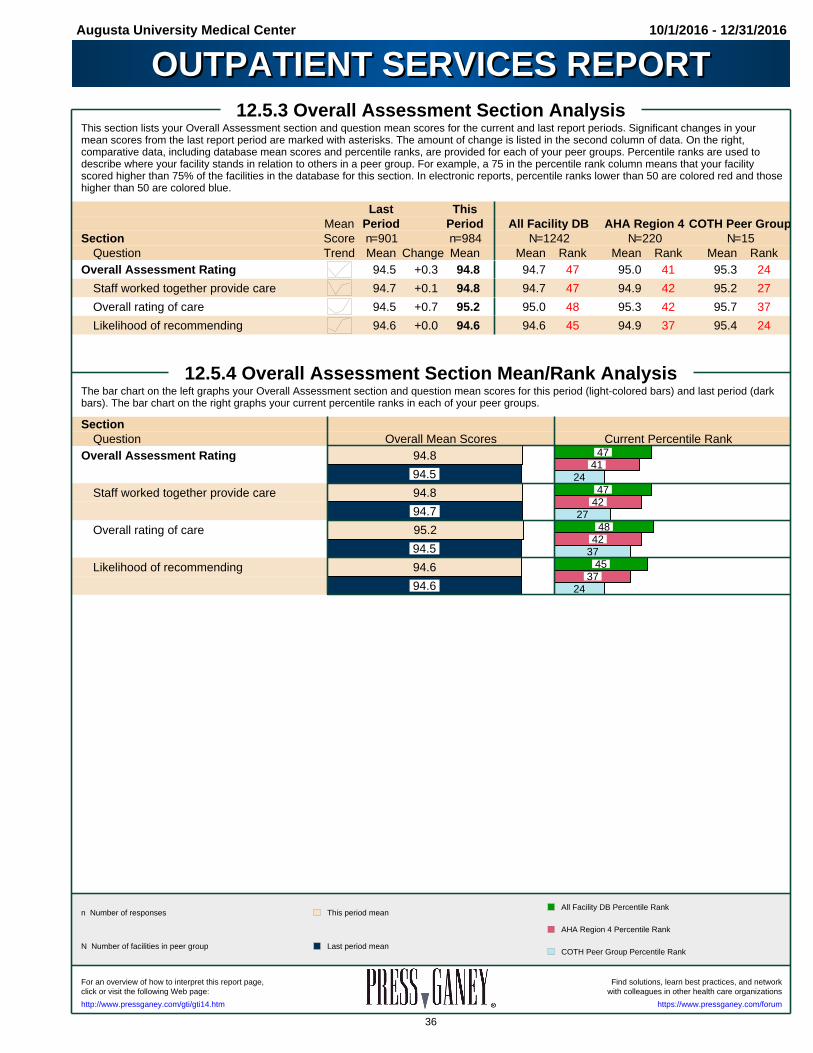
Augusta University Medical Center 10/1/2016 - 12/31/2016
OUTPATIENT SERVICES REPORTOUTPATIENT SERVICES REPORT12.5.3 Overall Assessment Section Analysis
This section lists your Overall Assessment section and question mean scores for the current and last report periods. Significant changes in yourmean scores from the last report period are marked with asterisks. The amount of change is listed in the second column of data. On the right,comparative data, including database mean scores and percentile ranks, are provided for each of your peer groups. Percentile ranks are used todescribe where your facility stands in relation to others in a peer group. For example, a 75 in the percentile rank column means that your facilityscored higher than 75% of the facilities in the database for this section. In electronic reports, percentile ranks lower than 50 are colored red and thosehigher than 50 are colored blue.
Last ThisMean Period Period All Facility DB AHA Region 4 COTH Peer Group
Section Score n=901 n=984 N=1242 N=220 N=15Question Trend Mean Change Mean Mean Rank Mean Rank Mean Rank
Overall Assessment Rating 94.5 +0.3 94.8 94.7 47 95.0 41 95.3 24
Staff worked together provide care 94.7 +0.1 94.8 94.7 47 94.9 42 95.2 27
Overall rating of care 94.5 +0.7 95.2 95.0 48 95.3 42 95.7 37
Likelihood of recommending 94.6 +0.0 94.6 94.6 45 94.9 37 95.4 24
12.5.4 Overall Assessment Section Mean/Rank AnalysisThe bar chart on the left graphs your Overall Assessment section and question mean scores for this period (light-colored bars) and last period (darkbars). The bar chart on the right graphs your current percentile ranks in each of your peer groups. Section
Question Overall Mean Scores Current Percentile RankOverall Assessment Rating 94.8
94.5
47 41
24
Staff worked together provide care 94.8
94.7
47 42
27
Overall rating of care 95.2
94.5
48 42 37
Likelihood of recommending 94.6
94.6
45 37
24
n Number of responses
N Number of facilities in peer group
All Facility DB Percentile Rank
AHA Region 4 Percentile Rank
COTH Peer Group Percentile Rank
This period mean
Last period mean
Find solutions, learn best practices, and networkFor an overview of how to interpret this report page,with colleagues in other health care organizationsclick or visit the following Web page:
https://www.pressganey.com/forumhttp://www.pressganey.com/gti/gti14.htm
36

Augusta University Medical Center 10/1/2016 - 12/31/2016
OUTPATIENT SERVICES REPORTOUTPATIENT SERVICES REPORT13.0 Comparative Analysis by Unit
This section lists each unit alphabetically and provides historical mean scores for the last four report periods. The chart on the right allows you toidentify which units performed significantly differently from your facility as a whole. The vertical line drawn down the middle of the I-bars representsyour current standard-item overall facility mean score; the actual score is listed above the dotted line. The I-bars represent a range of plus or minus 2sigma for each unit around the facility mean. I-bars will be wider for units having more variability or fewer respondents and narrower for units havingless variability or more respondents. If a unit's mean score falls to the left of its I-bar ( ), then the unit's mean score is significantly lower than thefacility's mean score; if it falls to the right ( ), it is significantly higher than the facility's mean score.
Mean ScoreMean 1/1/16 4/1/16 7/1/16 10/1/16 of YourScore 3/31/16 6/30/16 9/30/16 12/31/16 Facility
n Unit Trend Mean Mean Mean Mean 93.171 Acc Lab 93.8 90.8 94.3 92.3
56 Cardiac Diagnostics 92.6 93.8 91.8 90.2
16 Eeg 89.2 80.4 88.0 90.6
66 Emg 93.1 92.7 92.3 91.8
68 Endoscopy 92.8 93.5 91.8 94.3
10 Gamma Knife 99.2 87.3 98.7 98.3
89 Grtc 94.4 96.3 95.0 94.1
104 Mammography 96.3 95.2 95.3 96.2
15 Ob Ultrasound 87.2 81.6 87.5 94.5
8 Occupational Therapy 91.4 97.2 97.5 91.6
2 Peds Pulmonary Function L n<7 n<7 n<7 n<7
14 Peds Radiology 91.6 94.3 90.0 95.0
5 Physical Therapy n<7 93.1 95.3 n<7
107 Radiology - Acc/Scc 94.2 89.6 92.0 93.7
73 Radiology - Hospital 90.0 90.5 90.9 91.6
42 Sleep Center 88.1 93.4 92.7 90.5
33 Speech 92.3 98.6 94.3 94.9
75 West Wheeler Imaging 89.7 90.5 91.4 89.0
22 West Wheeler Occupational 96.3 91.6 97.0 89.1*
54 West Wheeler Physical The 92.7 93.5 95.0 95.8
68 West Wheeler Sports Rehab 93.5 96.6 96.1 94.9
* Significantly different at .05 level
n<7 Fewer than 7 responses
n Number of responses
Lower Control Limit -2 sigma
Upper Control Limit +2 sigma
Mean score of your Facility
Significantly higher than Facility mean score
Not significantly different from Facility mean score
Significantly lower than Facility mean score
Find solutions, learn best practices, and networkFor an overview of how to interpret this report page,with colleagues in other health care organizationsclick or visit the following Web page:
https://www.pressganey.com/forumhttp://www.pressganey.com/gti/gti15.htm
37
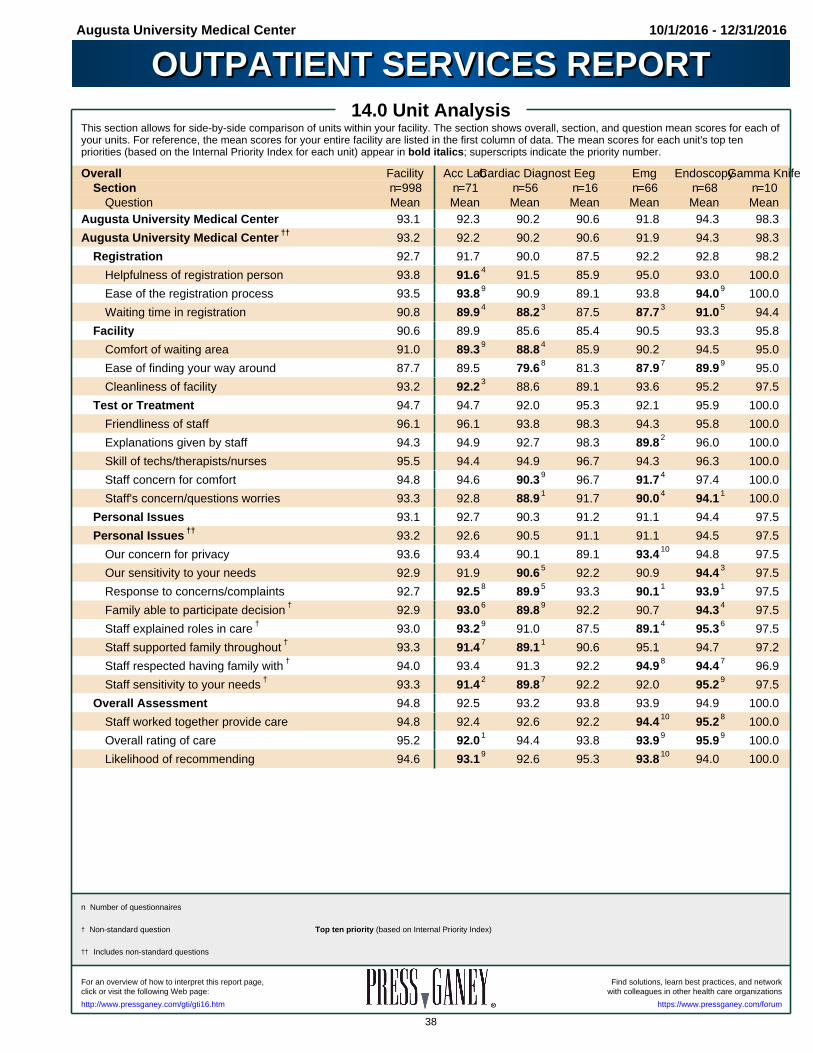
Augusta University Medical Center 10/1/2016 - 12/31/2016
OUTPATIENT SERVICES REPORTOUTPATIENT SERVICES REPORT14.0 Unit Analysis
This section allows for side-by-side comparison of units within your facility. The section shows overall, section, and question mean scores for each ofyour units. For reference, the mean scores for your entire facility are listed in the first column of data. The mean scores for each unit's top tenpriorities (based on the Internal Priority Index for each unit) appear in bold italics; superscripts indicate the priority number. Overall Facility Acc LabCardiac Diagnost Eeg Emg EndoscopyGamma Knife
Section n=998 n=71 n=56 n=16 n=66 n=68 n=10Question Mean Mean Mean Mean Mean Mean Mean
Augusta University Medical Center 93.1 92.3 90.2 90.6 91.8 94.3 98.3
Augusta University Medical Center †† 93.2 92.2 90.2 90.6 91.9 94.3 98.3
Registration 92.7 91.7 90.0 87.5 92.2 92.8 98.2
Helpfulness of registration person 93.8 91.6 4 91.5 85.9 95.0 93.0 100.0
Ease of the registration process 93.5 93.8 9 90.9 89.1 93.8 94.0 9 100.0
Waiting time in registration 90.8 89.9 4 88.2 3 87.5 87.7 3 91.0 5 94.4
Facility 90.6 89.9 85.6 85.4 90.5 93.3 95.8
Comfort of waiting area 91.0 89.3 9 88.8 4 85.9 90.2 94.5 95.0
Ease of finding your way around 87.7 89.5 79.6 8 81.3 87.9 7 89.9 9 95.0
Cleanliness of facility 93.2 92.2 3 88.6 89.1 93.6 95.2 97.5
Test or Treatment 94.7 94.7 92.0 95.3 92.1 95.9 100.0
Friendliness of staff 96.1 96.1 93.8 98.3 94.3 95.8 100.0
Explanations given by staff 94.3 94.9 92.7 98.3 89.8 2 96.0 100.0
Skill of techs/therapists/nurses 95.5 94.4 94.9 96.7 94.3 96.3 100.0
Staff concern for comfort 94.8 94.6 90.3 9 96.7 91.7 4 97.4 100.0
Staff's concern/questions worries 93.3 92.8 88.9 1 91.7 90.0 4 94.1 1 100.0
Personal Issues 93.1 92.7 90.3 91.2 91.1 94.4 97.5
Personal Issues †† 93.2 92.6 90.5 91.1 91.1 94.5 97.5
Our concern for privacy 93.6 93.4 90.1 89.1 93.4 10 94.8 97.5
Our sensitivity to your needs 92.9 91.9 90.6 5 92.2 90.9 94.4 3 97.5
Response to concerns/complaints 92.7 92.5 8 89.9 5 93.3 90.1 1 93.9 1 97.5
Family able to participate decision † 92.9 93.0 6 89.8 9 92.2 90.7 94.3 4 97.5
Staff explained roles in care † 93.0 93.2 9 91.0 87.5 89.1 4 95.3 6 97.5
Staff supported family throughout † 93.3 91.4 7 89.1 1 90.6 95.1 94.7 97.2
Staff respected having family with † 94.0 93.4 91.3 92.2 94.9 8 94.4 7 96.9
Staff sensitivity to your needs † 93.3 91.4 2 89.8 7 92.2 92.0 95.2 9 97.5
Overall Assessment 94.8 92.5 93.2 93.8 93.9 94.9 100.0
Staff worked together provide care 94.8 92.4 92.6 92.2 94.4 10 95.2 8 100.0
Overall rating of care 95.2 92.0 1 94.4 93.8 93.9 9 95.9 9 100.0
Likelihood of recommending 94.6 93.1 9 92.6 95.3 93.8 10 94.0 100.0
† Non-standard question
†† Includes non-standard questions
n Number of questionnaires
Top ten priority (based on Internal Priority Index)
Find solutions, learn best practices, and networkFor an overview of how to interpret this report page,with colleagues in other health care organizationsclick or visit the following Web page:
https://www.pressganey.com/forumhttp://www.pressganey.com/gti/gti16.htm
38

Augusta University Medical Center 10/1/2016 - 12/31/2016
OUTPATIENT SERVICES REPORTOUTPATIENT SERVICES REPORT14.0 Unit Analysis
Overall Facility Grtc MammographyOb UltrasoundOccupational ThePeds Pulmonary FPeds RadiologySection n=998 n=89 n=104 n=15 n=8 n<7 n=14
Question Mean Mean Mean Mean Mean Mean MeanAugusta University Medical Center 93.1 94.1 96.2 94.5 91.6 n<7 95.0
Augusta University Medical Center †† 93.2 94.0 96.1 94.3 92.1 n<7 94.8
Registration 92.7 93.4 96.4 93.3 86.5 n<7 90.5
Helpfulness of registration person 93.8 94.0 97.6 95.0 87.5 n<7 92.9
Ease of the registration process 93.5 93.5 8 96.5 96.7 87.5 n<7 91.1
Waiting time in registration 90.8 92.6 10 95.5 88.3 84.4 n<7 87.5
Facility 90.6 91.5 94.8 92.2 89.6 n<7 93.5
Comfort of waiting area 91.0 91.8 7 96.3 93.3 90.6 n<7 96.4
Ease of finding your way around 87.7 89.3 4 91.9 10 90.0 87.5 n<7 87.5
Cleanliness of facility 93.2 93.5 96.1 93.3 90.6 n<7 96.4
Test or Treatment 94.7 95.7 96.8 95.3 94.4 n<7 96.3
Friendliness of staff 96.1 97.1 97.8 94.6 93.8 n<7 98.2
Explanations given by staff 94.3 94.9 96.8 95.0 93.8 n<7 96.4
Skill of techs/therapists/nurses 95.5 96.1 98.3 98.3 96.9 n<7 98.2
Staff concern for comfort 94.8 96.6 96.3 96.7 93.8 n<7 96.4
Staff's concern/questions worries 93.3 94.0 96.2 91.7 93.8 n<7 91.7
Personal Issues 93.1 93.8 95.8 95.6 90.6 n<7 97.0
Personal Issues †† 93.2 93.3 95.5 94.4 93.0 n<7 96.0
Our concern for privacy 93.6 94.4 95.6 3 96.7 93.8 n<7 96.4
Our sensitivity to your needs 92.9 93.0 2 95.8 6 95.0 90.6 n<7 96.2
Response to concerns/complaints 92.7 94.1 6 95.4 2 95.0 87.5 n<7 98.2
Family able to participate decision † 92.9 93.5 5 94.9 4 92.9 93.8 n<7 94.6
Staff explained roles in care † 93.0 90.8 2 95.1 4 91.7 96.9 n<7 96.2
Staff supported family throughout † 93.3 94.6 10 93.9 7 96.2 93.8 n<7 96.4
Staff respected having family with † 94.0 93.8 93.9 1 96.2 93.8 n<7 92.9
Staff sensitivity to your needs † 93.3 93.4 1 95.9 7 92.9 93.8 n<7 96.2
Overall Assessment 94.8 96.1 97.7 96.1 96.9 n<7 97.6
Staff worked together provide care 94.8 95.2 9 97.5 9 96.7 96.9 n<7 96.4
Overall rating of care 95.2 96.4 98.0 95.0 96.9 n<7 98.2
Likelihood of recommending 94.6 96.6 97.4 96.7 96.9 n<7 98.2
n<7 Fewer than 7 responses
† Non-standard question
†† Includes non-standard questions
n Number of questionnaires
Top ten priority (based on Internal Priority Index)
Find solutions, learn best practices, and networkFor an overview of how to interpret this report page,with colleagues in other health care organizationsclick or visit the following Web page:
https://www.pressganey.com/forumhttp://www.pressganey.com/gti/gti16.htm
39
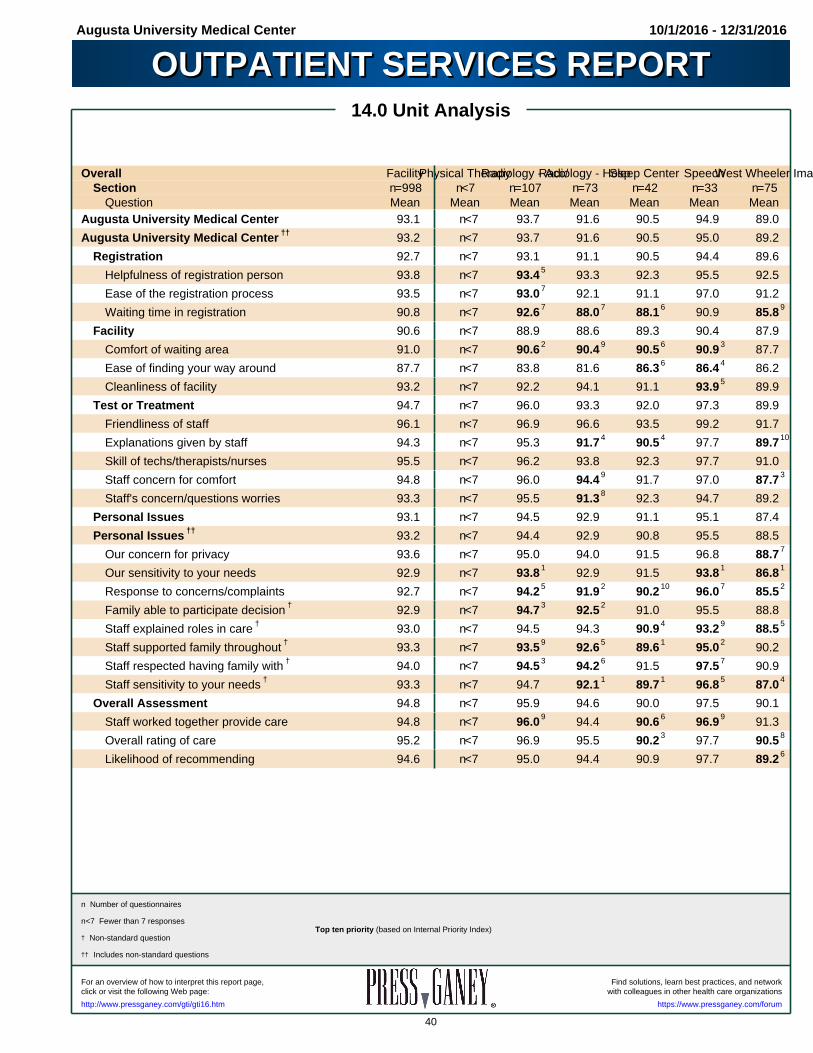
Augusta University Medical Center 10/1/2016 - 12/31/2016
OUTPATIENT SERVICES REPORTOUTPATIENT SERVICES REPORT14.0 Unit Analysis
Overall FacilityPhysical TherapyRadiology - Acc/Radiology - HospSleep Center SpeechWest Wheeler ImaSection n=998 n<7 n=107 n=73 n=42 n=33 n=75
Question Mean Mean Mean Mean Mean Mean MeanAugusta University Medical Center 93.1 n<7 93.7 91.6 90.5 94.9 89.0
Augusta University Medical Center †† 93.2 n<7 93.7 91.6 90.5 95.0 89.2
Registration 92.7 n<7 93.1 91.1 90.5 94.4 89.6
Helpfulness of registration person 93.8 n<7 93.4 5 93.3 92.3 95.5 92.5
Ease of the registration process 93.5 n<7 93.0 7 92.1 91.1 97.0 91.2
Waiting time in registration 90.8 n<7 92.6 7 88.0 7 88.1 6 90.9 85.8 9
Facility 90.6 n<7 88.9 88.6 89.3 90.4 87.9
Comfort of waiting area 91.0 n<7 90.6 2 90.4 9 90.5 6 90.9 3 87.7
Ease of finding your way around 87.7 n<7 83.8 81.6 86.3 6 86.4 4 86.2
Cleanliness of facility 93.2 n<7 92.2 94.1 91.1 93.9 5 89.9
Test or Treatment 94.7 n<7 96.0 93.3 92.0 97.3 89.9
Friendliness of staff 96.1 n<7 96.9 96.6 93.5 99.2 91.7
Explanations given by staff 94.3 n<7 95.3 91.7 4 90.5 4 97.7 89.7 10
Skill of techs/therapists/nurses 95.5 n<7 96.2 93.8 92.3 97.7 91.0
Staff concern for comfort 94.8 n<7 96.0 94.4 9 91.7 97.0 87.7 3
Staff's concern/questions worries 93.3 n<7 95.5 91.3 8 92.3 94.7 89.2
Personal Issues 93.1 n<7 94.5 92.9 91.1 95.1 87.4
Personal Issues †† 93.2 n<7 94.4 92.9 90.8 95.5 88.5
Our concern for privacy 93.6 n<7 95.0 94.0 91.5 96.8 88.7 7
Our sensitivity to your needs 92.9 n<7 93.8 1 92.9 91.5 93.8 1 86.8 1
Response to concerns/complaints 92.7 n<7 94.2 5 91.9 2 90.2 10 96.0 7 85.5 2
Family able to participate decision † 92.9 n<7 94.7 3 92.5 2 91.0 95.5 88.8
Staff explained roles in care † 93.0 n<7 94.5 94.3 90.9 4 93.2 9 88.5 5
Staff supported family throughout † 93.3 n<7 93.5 9 92.6 5 89.6 1 95.0 2 90.2
Staff respected having family with † 94.0 n<7 94.5 3 94.2 6 91.5 97.5 7 90.9
Staff sensitivity to your needs † 93.3 n<7 94.7 92.1 1 89.7 1 96.8 5 87.0 4
Overall Assessment 94.8 n<7 95.9 94.6 90.0 97.5 90.1
Staff worked together provide care 94.8 n<7 96.0 9 94.4 90.6 6 96.9 9 91.3
Overall rating of care 95.2 n<7 96.9 95.5 90.2 3 97.7 90.5 8
Likelihood of recommending 94.6 n<7 95.0 94.4 90.9 97.7 89.2 6
n<7 Fewer than 7 responses
† Non-standard question
†† Includes non-standard questions
n Number of questionnaires
Top ten priority (based on Internal Priority Index)
Find solutions, learn best practices, and networkFor an overview of how to interpret this report page,with colleagues in other health care organizationsclick or visit the following Web page:
https://www.pressganey.com/forumhttp://www.pressganey.com/gti/gti16.htm
40

Augusta University Medical Center 10/1/2016 - 12/31/2016
OUTPATIENT SERVICES REPORTOUTPATIENT SERVICES REPORT14.0 Unit Analysis
Overall FacilityWest Wheeler OccWest Wheeler PhyWest Wheeler SpoSection n=998 n=22 n=54 n=68
Question Mean Mean Mean MeanAugusta University Medical Center 93.1 89.1 95.8 94.9
Augusta University Medical Center †† 93.2 89.4 95.9 95.1
Registration 92.7 88.3 96.3 94.0
Helpfulness of registration person 93.8 90.9 96.8 94.1 3
Ease of the registration process 93.5 88.6 96.7 93.9 7
Waiting time in registration 90.8 85.2 95.3 94.4
Facility 90.6 86.0 93.5 92.8
Comfort of waiting area 91.0 81.8 91.2 90.4 8
Ease of finding your way around 87.7 86.4 93.5 7 93.3 9
Cleanliness of facility 93.2 89.8 96.2 3 95.2
Test or Treatment 94.7 93.6 97.1 96.5
Friendliness of staff 96.1 94.3 97.7 97.8
Explanations given by staff 94.3 93.2 96.3 95.9 6
Skill of techs/therapists/nurses 95.5 94.3 97.7 96.0 5
Staff concern for comfort 94.8 94.3 98.2 97.1
Staff's concern/questions worries 93.3 91.7 95.8 96.2 9
Personal Issues 93.1 88.1 95.2 94.0
Personal Issues †† 93.2 89.5 95.7 95.2
Our concern for privacy 93.6 92.1 94.3 10 92.5
Our sensitivity to your needs 92.9 86.9 95.8 6 95.1 4
Response to concerns/complaints 92.7 85.0 95.4 5 94.4 1
Family able to participate decision † 92.9 85.5 94.3 1 95.0 2
Staff explained roles in care † 93.0 90.9 96.0 2 95.5 9
Staff supported family throughout † 93.3 90.6 95.0 7 96.4
Staff respected having family with † 94.0 92.2 95.8 3 96.2
Staff sensitivity to your needs † 93.3 92.9 96.6 7 96.1
Overall Assessment 94.8 89.4 96.8 97.0
Staff worked together provide care 94.8 89.8 96.8 96.9
Overall rating of care 95.2 90.9 96.8 97.0
Likelihood of recommending 94.6 87.5 96.8 97.0
† Non-standard question
†† Includes non-standard questions
n Number of questionnaires
Top ten priority (based on Internal Priority Index)
Find solutions, learn best practices, and networkFor an overview of how to interpret this report page,with colleagues in other health care organizationsclick or visit the following Web page:
https://www.pressganey.com/forumhttp://www.pressganey.com/gti/gti16.htm
41
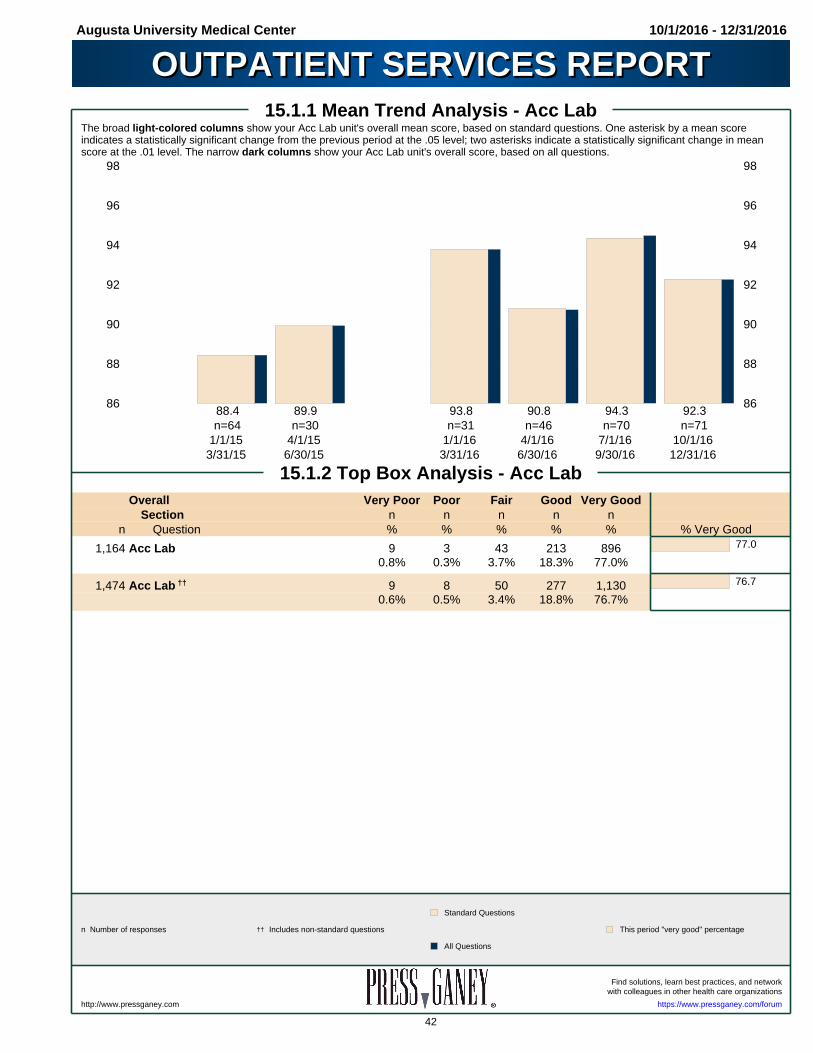
Augusta University Medical Center 10/1/2016 - 12/31/2016
OUTPATIENT SERVICES REPORTOUTPATIENT SERVICES REPORT15.1.1 Mean Trend Analysis - Acc Lab
The broad light-colored columns show your Acc Lab unit's overall mean score, based on standard questions. One asterisk by a mean scoreindicates a statistically significant change from the previous period at the .05 level; two asterisks indicate a statistically significant change in meanscore at the .01 level. The narrow dark columns show your Acc Lab unit's overall score, based on all questions.
86 86
88 88
90 90
92 92
94 94
96 96
98 98
88.4n=64
1/1/153/31/15
89.9n=30
4/1/156/30/15
93.8n=31
1/1/163/31/16
90.8n=46
4/1/166/30/16
94.3n=70
7/1/169/30/16
92.3n=71
10/1/1612/31/16
15.1.2 Top Box Analysis - Acc LabOverall Very Poor Poor Fair Good Very Good
Section n n n n nn Question % % % % % % Very Good
1,164 Acc Lab 9 3 43 213 8960.8% 0.3% 3.7% 18.3% 77.0%
77.0
1,474 Acc Lab †† 9 8 50 277 1,1300.6% 0.5% 3.4% 18.8% 76.7%
76.7
n Number of responses This period "very good" percentage†† Includes non-standard questions
Standard Questions
All Questions
Find solutions, learn best practices, and networkwith colleagues in other health care organizations
https://www.pressganey.com/forumhttp://www.pressganey.com
42

Augusta University Medical Center 10/1/2016 - 12/31/2016
OUTPATIENT SERVICES REPORTOUTPATIENT SERVICES REPORT15.1.3 Question Analysis - Acc Lab
This section lists detailed information about individual question, section, and overall mean scores for the Acc Lab unit. Only units with seven or moreresponses are reported. Significant changes in mean scores from the previous report period are marked with asterisks. The amount of change islisted in the second column of data. Internal comparative data are provided on the right; external benchmarks are not available because units arepotentially unique to your facility. The "Internal Rating" column indicates whether each unit mean score is statistically different from the facility's as awhole. It is important to note that these calculations take into account the variability within a unit's data as well as the number of responses (n)represented by the unit's mean score. Items having less variability or a greater number of responses are more likely to show significant differencesfrom the facility's mean score. If 30 or more questionnaires were returned for this unit, questions representing its top ten priorities (based on thisunit's Internal Priority Index) will appear in bold italics; superscripts indicate the priority number.
Last ThisOverall Mean Period Period Facility
Section Score n=70 n=71 Mean Internaln Question Trend Mean Change Mean Score Rating
Overall Acc Lab Rating 94.3 -2.0 92.3 93.1
Overall Acc Lab Rating †† 94.5 -2.3 92.2 93.2
Registration 92.6 -0.9 91.7 92.7
71 Helpfulness of registration person 4 93.4 -1.8 91.6 93.8
69 Ease of the registration process 9 94.3 -0.5 93.8 93.5
69 Waiting time in registration 4 90.2 -0.3 89.9 90.8
Facility 92.9* -3.0 89.9 90.6
70 Comfort of waiting area 9 94.9* -5.6 89.3* 91.0
69 Ease of finding your way around 91.3 -1.8 89.5 87.7
67 Cleanliness of facility 3 92.8 -0.6 92.2 93.2
Test or Treatment 95.8 -1.1 94.7 94.7
71 Friendliness of staff 96.7 -0.6 96.1 96.1
68 Explanations given by staff 96.0 -1.1 94.9 94.3
71 Skill of techs/therapists/nurses 95.7 -1.3 94.4 95.5
70 Staff concern for comfort 95.7 -1.1 94.6 94.8
66 Staff's concern/questions worries 95.0 -2.2 92.8 93.3
Personal Issues 94.3 -1.6 92.7 93.1
Personal Issues †† 95.0* -2.4 92.6 93.2
68 Our concern for privacy 93.6 -0.2 93.4 93.6
68 Our sensitivity to your needs 94.3 -2.4 91.9 92.9
60 Response to concerns/complaints 8 94.9 -2.4 92.5 92.7
61 Family able to participate decision † 6 94.4 -1.4 93.0 92.9
66 Staff explained roles in care † 9 95.3 -2.1 93.2 93.0
61 Staff supported family throughout † 7 94.7 -3.3 91.4 93.3
61 Staff respected having family with † 96.8 -3.4 93.4 94.0
61 Staff sensitivity to your needs † 2 95.8* -4.4 91.4 93.3
Overall Assessment 95.9 -3.4 92.5 94.8
69 Staff worked together provide care 95.3 -2.9 92.4 94.8
69 Overall rating of care 1 96.4 -4.4 92.0* 95.2
69 Likelihood of recommending 9 96.0 -2.9 93.1 94.6
* Significantly different at .05 level
† Non-standard question
†† Includes non-standard questions
n Number of responses
Not significantly different from Facility mean scoreTop ten priority (based on Internal Priority Index)
Find solutions, learn best practices, and networkFor an overview of how to interpret this report page,with colleagues in other health care organizationsclick or visit the following Web page:
https://www.pressganey.com/forumhttp://www.pressganey.com/gti/gti17.htm
43
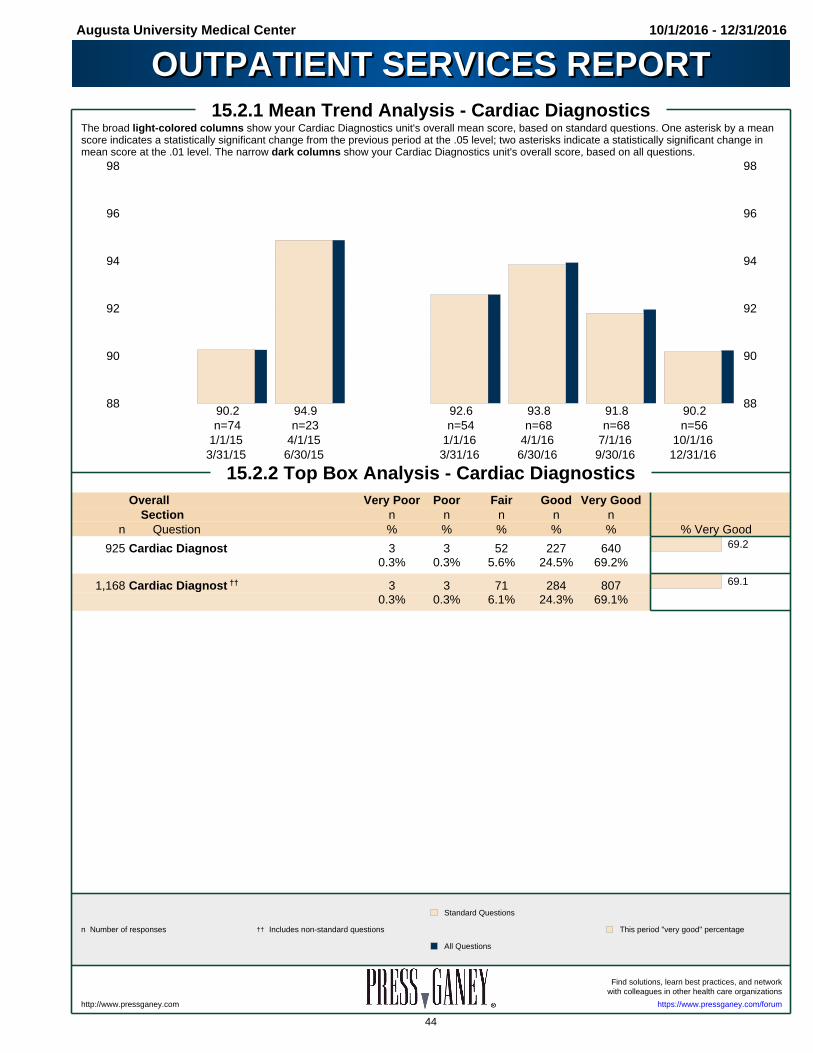
Augusta University Medical Center 10/1/2016 - 12/31/2016
OUTPATIENT SERVICES REPORTOUTPATIENT SERVICES REPORT15.2.1 Mean Trend Analysis - Cardiac Diagnostics
The broad light-colored columns show your Cardiac Diagnostics unit's overall mean score, based on standard questions. One asterisk by a meanscore indicates a statistically significant change from the previous period at the .05 level; two asterisks indicate a statistically significant change inmean score at the .01 level. The narrow dark columns show your Cardiac Diagnostics unit's overall score, based on all questions.
88 88
90 90
92 92
94 94
96 96
98 98
90.2n=74
1/1/153/31/15
94.9n=23
4/1/156/30/15
92.6n=54
1/1/163/31/16
93.8n=68
4/1/166/30/16
91.8n=68
7/1/169/30/16
90.2n=56
10/1/1612/31/16
15.2.2 Top Box Analysis - Cardiac DiagnosticsOverall Very Poor Poor Fair Good Very Good
Section n n n n nn Question % % % % % % Very Good
925 Cardiac Diagnost 3 3 52 227 6400.3% 0.3% 5.6% 24.5% 69.2%
69.2
1,168 Cardiac Diagnost †† 3 3 71 284 8070.3% 0.3% 6.1% 24.3% 69.1%
69.1
n Number of responses This period "very good" percentage†† Includes non-standard questions
Standard Questions
All Questions
Find solutions, learn best practices, and networkwith colleagues in other health care organizations
https://www.pressganey.com/forumhttp://www.pressganey.com
44
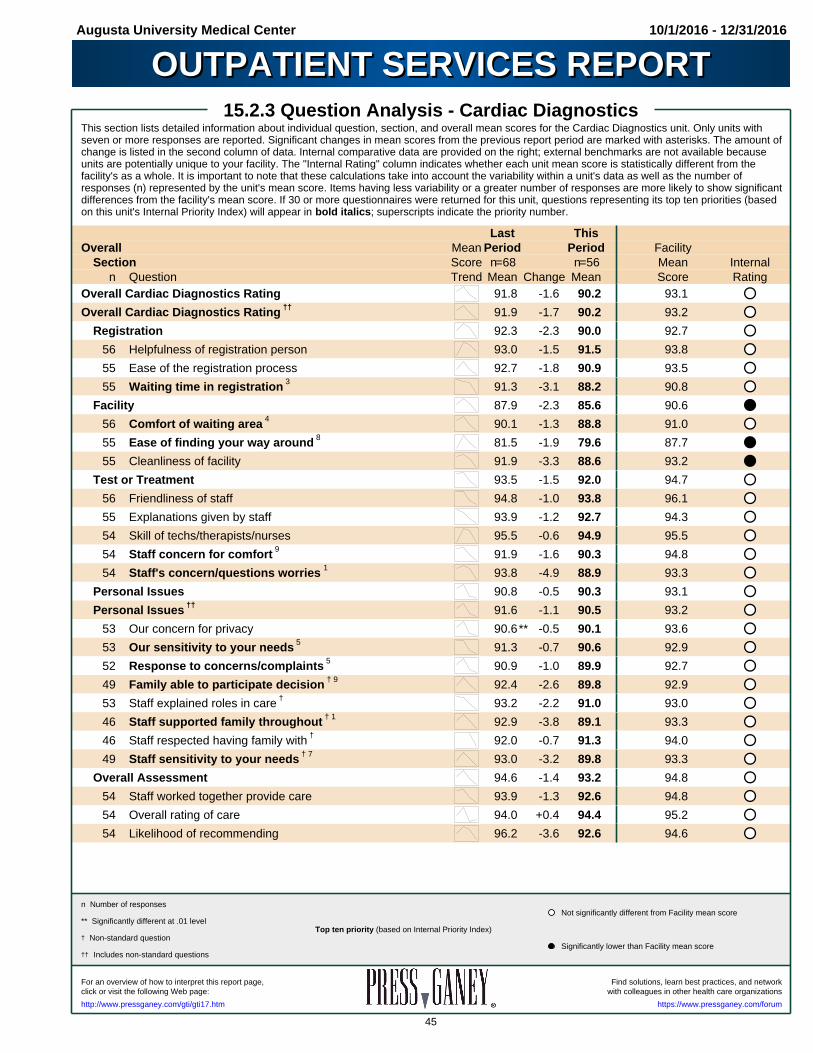
Augusta University Medical Center 10/1/2016 - 12/31/2016
OUTPATIENT SERVICES REPORTOUTPATIENT SERVICES REPORT15.2.3 Question Analysis - Cardiac Diagnostics
This section lists detailed information about individual question, section, and overall mean scores for the Cardiac Diagnostics unit. Only units withseven or more responses are reported. Significant changes in mean scores from the previous report period are marked with asterisks. The amount ofchange is listed in the second column of data. Internal comparative data are provided on the right; external benchmarks are not available becauseunits are potentially unique to your facility. The "Internal Rating" column indicates whether each unit mean score is statistically different from thefacility's as a whole. It is important to note that these calculations take into account the variability within a unit's data as well as the number ofresponses (n) represented by the unit's mean score. Items having less variability or a greater number of responses are more likely to show significantdifferences from the facility's mean score. If 30 or more questionnaires were returned for this unit, questions representing its top ten priorities (basedon this unit's Internal Priority Index) will appear in bold italics; superscripts indicate the priority number.
Last ThisOverall Mean Period Period Facility
Section Score n=68 n=56 Mean Internaln Question Trend Mean Change Mean Score Rating
Overall Cardiac Diagnostics Rating 91.8 -1.6 90.2 93.1
Overall Cardiac Diagnostics Rating †† 91.9 -1.7 90.2 93.2
Registration 92.3 -2.3 90.0 92.7
56 Helpfulness of registration person 93.0 -1.5 91.5 93.8
55 Ease of the registration process 92.7 -1.8 90.9 93.5
55 Waiting time in registration 3 91.3 -3.1 88.2 90.8
Facility 87.9 -2.3 85.6 90.6
56 Comfort of waiting area 4 90.1 -1.3 88.8 91.0
55 Ease of finding your way around 8 81.5 -1.9 79.6 87.7
55 Cleanliness of facility 91.9 -3.3 88.6 93.2
Test or Treatment 93.5 -1.5 92.0 94.7
56 Friendliness of staff 94.8 -1.0 93.8 96.1
55 Explanations given by staff 93.9 -1.2 92.7 94.3
54 Skill of techs/therapists/nurses 95.5 -0.6 94.9 95.5
54 Staff concern for comfort 9 91.9 -1.6 90.3 94.8
54 Staff's concern/questions worries 1 93.8 -4.9 88.9 93.3
Personal Issues 90.8 -0.5 90.3 93.1
Personal Issues †† 91.6 -1.1 90.5 93.2
53 Our concern for privacy 90.6** -0.5 90.1 93.6
53 Our sensitivity to your needs 5 91.3 -0.7 90.6 92.9
52 Response to concerns/complaints 5 90.9 -1.0 89.9 92.7
49 Family able to participate decision † 9 92.4 -2.6 89.8 92.9
53 Staff explained roles in care † 93.2 -2.2 91.0 93.0
46 Staff supported family throughout † 1 92.9 -3.8 89.1 93.3
46 Staff respected having family with † 92.0 -0.7 91.3 94.0
49 Staff sensitivity to your needs † 7 93.0 -3.2 89.8 93.3
Overall Assessment 94.6 -1.4 93.2 94.8
54 Staff worked together provide care 93.9 -1.3 92.6 94.8
54 Overall rating of care 94.0 +0.4 94.4 95.2
54 Likelihood of recommending 96.2 -3.6 92.6 94.6
** Significantly different at .01 level
† Non-standard question
†† Includes non-standard questions
n Number of responsesNot significantly different from Facility mean score
Significantly lower than Facility mean score
Top ten priority (based on Internal Priority Index)
Find solutions, learn best practices, and networkFor an overview of how to interpret this report page,with colleagues in other health care organizationsclick or visit the following Web page:
https://www.pressganey.com/forumhttp://www.pressganey.com/gti/gti17.htm
45
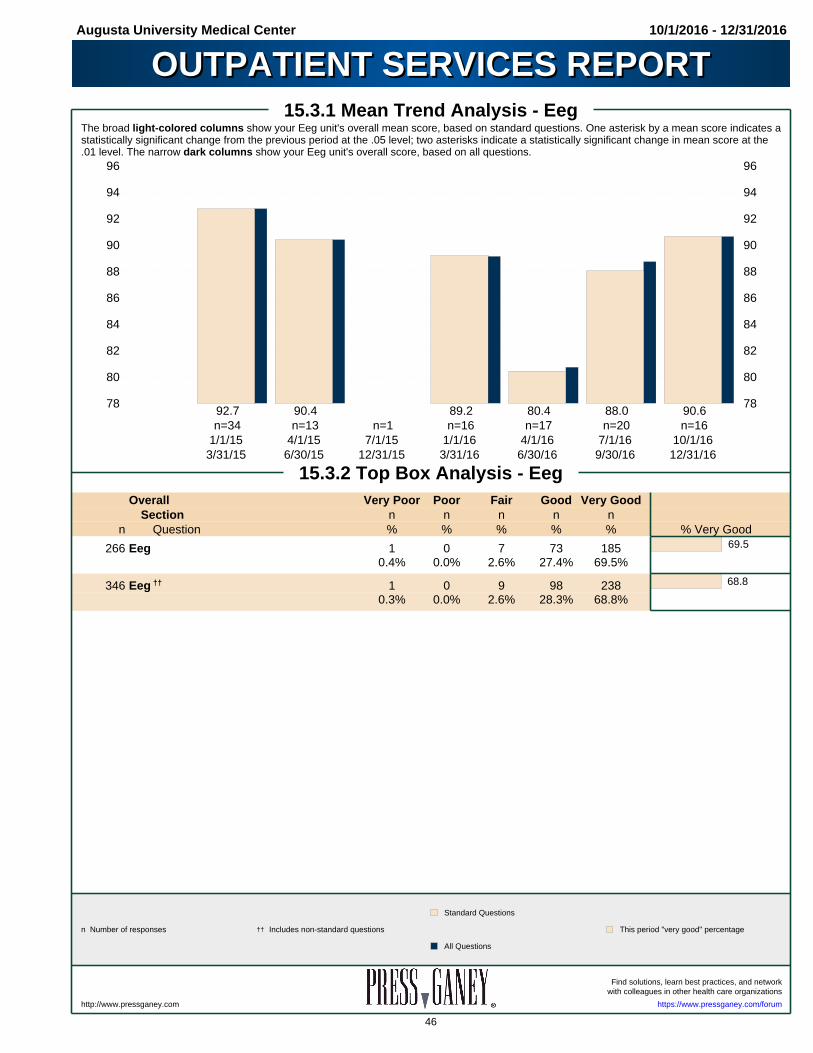
Augusta University Medical Center 10/1/2016 - 12/31/2016
OUTPATIENT SERVICES REPORTOUTPATIENT SERVICES REPORT15.3.1 Mean Trend Analysis - Eeg
The broad light-colored columns show your Eeg unit's overall mean score, based on standard questions. One asterisk by a mean score indicates astatistically significant change from the previous period at the .05 level; two asterisks indicate a statistically significant change in mean score at the.01 level. The narrow dark columns show your Eeg unit's overall score, based on all questions.
78 78
80 80
82 82
84 84
86 86
88 88
90 90
92 92
94 94
96 96
92.7n=34
1/1/153/31/15
90.4n=13
4/1/156/30/15
n=17/1/15
12/31/15
89.2n=16
1/1/163/31/16
80.4n=17
4/1/166/30/16
88.0n=20
7/1/169/30/16
90.6n=16
10/1/1612/31/16
15.3.2 Top Box Analysis - EegOverall Very Poor Poor Fair Good Very Good
Section n n n n nn Question % % % % % % Very Good
266 Eeg 1 0 7 73 1850.4% 0.0% 2.6% 27.4% 69.5%
69.5
346 Eeg †† 1 0 9 98 2380.3% 0.0% 2.6% 28.3% 68.8%
68.8
n Number of responses This period "very good" percentage†† Includes non-standard questions
Standard Questions
All Questions
Find solutions, learn best practices, and networkwith colleagues in other health care organizations
https://www.pressganey.com/forumhttp://www.pressganey.com
46

Augusta University Medical Center 10/1/2016 - 12/31/2016
OUTPATIENT SERVICES REPORTOUTPATIENT SERVICES REPORT15.3.3 Question Analysis - Eeg
This section lists detailed information about individual question, section, and overall mean scores for the Eeg unit. Only units with seven or moreresponses are reported. Significant changes in mean scores from the previous report period are marked with asterisks. The amount of change islisted in the second column of data. Internal comparative data are provided on the right; external benchmarks are not available because units arepotentially unique to your facility. The "Internal Rating" column indicates whether each unit mean score is statistically different from the facility's as awhole. It is important to note that these calculations take into account the variability within a unit's data as well as the number of responses (n)represented by the unit's mean score. Items having less variability or a greater number of responses are more likely to show significant differencesfrom the facility's mean score. If 30 or more questionnaires were returned for this unit, questions representing its top ten priorities (based on thisunit's Internal Priority Index) will appear in bold italics; superscripts indicate the priority number.
Last ThisOverall Mean Period Period Facility
Section Score n=20 n=16 Mean Internaln Question Trend Mean Change Mean Score Rating
Overall Eeg Rating 88.0 +2.6 90.6 93.1
Overall Eeg Rating †† 88.7 +1.9 90.6 93.2
Registration 86.5 +1.0 87.5 92.7
16 Helpfulness of registration person 88.2 -2.3 85.9 93.8
16 Ease of the registration process 85.0 +4.1 89.1 93.5
16 Waiting time in registration 86.3 +1.2 87.5 90.8
Facility 82.1 +3.3 85.4 90.6
16 Comfort of waiting area 86.3 -0.4 85.9 91.0
16 Ease of finding your way around 71.3 +10.0 81.3 87.7
16 Cleanliness of facility 88.8 +0.3 89.1 93.2
Test or Treatment 90.8 +4.5 95.3 94.7
15 Friendliness of staff 91.3 +7.0 98.3 96.1
15 Explanations given by staff 93.8 +4.5 98.3 94.3
15 Skill of techs/therapists/nurses 92.5 +4.2 96.7 95.5
15 Staff concern for comfort 92.1 +4.6 96.7 94.8
15 Staff's concern/questions worries 83.3 +8.4 91.7 93.3
Personal Issues 91.7 -0.5 91.2 93.1
Personal Issues †† 93.4* -2.3 91.1 93.2
16 Our concern for privacy 92.7 -3.6 89.1 93.6
16 Our sensitivity to your needs 88.2 +4.0 92.2 92.9
15 Response to concerns/complaints 94.1* -0.8 93.3 92.7
16 Family able to participate decision † 97.1** -4.9 92.2 92.9
16 Staff explained roles in care † 96.9** -9.4 87.5* 93.0
16 Staff supported family throughout † 96.4 -5.8 90.6 93.3
16 Staff respected having family with † 96.9 -4.7 92.2 94.0
16 Staff sensitivity to your needs † 93.8 -1.6 92.2 93.3
Overall Assessment 92.1 +1.7 93.8 94.8
16 Staff worked together provide care 92.5 -0.3 92.2 94.8
16 Overall rating of care 92.5 +1.3 93.8 95.2
16 Likelihood of recommending 90.8 +4.5 95.3 94.6
n Number of responses
Significantly higher than Facility mean score
Not significantly different from Facility mean score
* Significantly different at .05 level
** Significantly different at .01 level
† Non-standard question
†† Includes non-standard questions
Find solutions, learn best practices, and networkFor an overview of how to interpret this report page,with colleagues in other health care organizationsclick or visit the following Web page:
https://www.pressganey.com/forumhttp://www.pressganey.com/gti/gti17.htm
47

Augusta University Medical Center 10/1/2016 - 12/31/2016
OUTPATIENT SERVICES REPORTOUTPATIENT SERVICES REPORT15.4.1 Mean Trend Analysis - Emg
The broad light-colored columns show your Emg unit's overall mean score, based on standard questions. One asterisk by a mean score indicatesa statistically significant change from the previous period at the .05 level; two asterisks indicate a statistically significant change in mean score at the.01 level. The narrow dark columns show your Emg unit's overall score, based on all questions.
86 86
88 88
90 90
92 92
94 94
96 96
92.0n=1161/1/15
3/31/15
89.2n=32
4/1/156/30/15
n=37/1/15
12/31/15
93.1n=52
1/1/163/31/16
92.7n=62
4/1/166/30/16
92.3n=72
7/1/169/30/16
91.8n=66
10/1/1612/31/16
15.4.2 Top Box Analysis - EmgOverall Very Poor Poor Fair Good Very Good
Section n n n n nn Question % % % % % % Very Good
1,095 Emg 6 9 41 216 8230.5% 0.8% 3.7% 19.7% 75.2%
75.2
1,393 Emg †† 9 11 48 276 1,0490.6% 0.8% 3.4% 19.8% 75.3%
75.3
n Number of responses This period "very good" percentage†† Includes non-standard questions
Standard Questions
All Questions
Find solutions, learn best practices, and networkwith colleagues in other health care organizations
https://www.pressganey.com/forumhttp://www.pressganey.com
48

Augusta University Medical Center 10/1/2016 - 12/31/2016
OUTPATIENT SERVICES REPORTOUTPATIENT SERVICES REPORT15.4.3 Question Analysis - Emg
This section lists detailed information about individual question, section, and overall mean scores for the Emg unit. Only units with seven or moreresponses are reported. Significant changes in mean scores from the previous report period are marked with asterisks. The amount of change islisted in the second column of data. Internal comparative data are provided on the right; external benchmarks are not available because units arepotentially unique to your facility. The "Internal Rating" column indicates whether each unit mean score is statistically different from the facility's as awhole. It is important to note that these calculations take into account the variability within a unit's data as well as the number of responses (n)represented by the unit's mean score. Items having less variability or a greater number of responses are more likely to show significant differencesfrom the facility's mean score. If 30 or more questionnaires were returned for this unit, questions representing its top ten priorities (based on thisunit's Internal Priority Index) will appear in bold italics; superscripts indicate the priority number.
Last ThisOverall Mean Period Period Facility
Section Score n=72 n=66 Mean Internaln Question Trend Mean Change Mean Score Rating
Overall Emg Rating 92.3 -0.5 91.8 93.1
Overall Emg Rating †† 92.3 -0.4 91.9 93.2
Registration 94.0 -1.8 92.2 92.7
65 Helpfulness of registration person 96.4 -1.4 95.0 93.8
64 Ease of the registration process 94.7 -0.9 93.8 93.5
65 Waiting time in registration 3 90.9 -3.2 87.7 90.8
Facility 88.7 +1.8 90.5 90.6
66 Comfort of waiting area 89.8 +0.4 90.2 91.0
66 Ease of finding your way around 7 85.0* +2.9 87.9 87.7
66 Cleanliness of facility 91.2 +2.4 93.6 93.2
Test or Treatment 94.7 -2.6 92.1 94.7
66 Friendliness of staff 96.9 -2.6 94.3 96.1
64 Explanations given by staff 2 93.6 -3.8 89.8 94.3
66 Skill of techs/therapists/nurses 96.1 -1.8 94.3 95.5
66 Staff concern for comfort 4 95.1 -3.4 91.7 94.8
65 Staff's concern/questions worries 4 92.5 -2.5 90.0 93.3
Personal Issues 91.5 -0.4 91.1 93.1
Personal Issues †† 91.6 -0.5 91.1 93.2
64 Our concern for privacy 10 93.3 +0.1 93.4 93.6
63 Our sensitivity to your needs 91.1 -0.2 90.9 92.9
58 Response to concerns/complaints 1 89.5 +0.6 90.1 92.7
62 Family able to participate decision † 91.7 -1.0 90.7 92.9
62 Staff explained roles in care † 4 92.1 -3.0 89.1 93.0
56 Staff supported family throughout † 90.7 +4.4 95.1 93.3
59 Staff respected having family with † 8 93.0 +1.9 94.9 94.0
59 Staff sensitivity to your needs † 88.5 +3.5 92.0 93.3
Overall Assessment 91.9 +2.0 93.9 94.8
62 Staff worked together provide care 10 93.6 +0.8 94.4 94.8
65 Overall rating of care 9 91.4 +2.5 93.9 95.2
64 Likelihood of recommending 10 90.6 +3.2 93.8 94.6
* Significantly different at .05 level
† Non-standard question
†† Includes non-standard questions
n Number of responses
Not significantly different from Facility mean scoreTop ten priority (based on Internal Priority Index)
Find solutions, learn best practices, and networkFor an overview of how to interpret this report page,with colleagues in other health care organizationsclick or visit the following Web page:
https://www.pressganey.com/forumhttp://www.pressganey.com/gti/gti17.htm
49

Augusta University Medical Center 10/1/2016 - 12/31/2016
OUTPATIENT SERVICES REPORTOUTPATIENT SERVICES REPORT15.5.1 Mean Trend Analysis - Endoscopy
The broad light-colored columns show your Endoscopy unit's overall mean score, based on standard questions. One asterisk by a mean scoreindicates a statistically significant change from the previous period at the .05 level; two asterisks indicate a statistically significant change in meanscore at the .01 level. The narrow dark columns show your Endoscopy unit's overall score, based on all questions.
88 88
90 90
92 92
94 94
96 96
98 98
91.7n=36
1/1/153/31/15
n=54/1/15
6/30/15
92.8n=59
1/1/163/31/16
93.5n=47
4/1/166/30/16
91.8n=68
7/1/169/30/16
94.3n=68
10/1/1612/31/16
15.5.2 Top Box Analysis - EndoscopyOverall Very Poor Poor Fair Good Very Good
Section n n n n nn Question % % % % % % Very Good
1,144 Endoscopy 3 14 26 148 9530.3% 1.2% 2.3% 12.9% 83.3%
83.3
1,474 Endoscopy †† 3 19 28 198 1,2260.2% 1.3% 1.9% 13.4% 83.2%
83.2
n Number of responses This period "very good" percentage†† Includes non-standard questions
Standard Questions
All Questions
Find solutions, learn best practices, and networkwith colleagues in other health care organizations
https://www.pressganey.com/forumhttp://www.pressganey.com
50

Augusta University Medical Center 10/1/2016 - 12/31/2016
OUTPATIENT SERVICES REPORTOUTPATIENT SERVICES REPORT15.5.3 Question Analysis - Endoscopy
This section lists detailed information about individual question, section, and overall mean scores for the Endoscopy unit. Only units with seven ormore responses are reported. Significant changes in mean scores from the previous report period are marked with asterisks. The amount of changeis listed in the second column of data. Internal comparative data are provided on the right; external benchmarks are not available because units arepotentially unique to your facility. The "Internal Rating" column indicates whether each unit mean score is statistically different from the facility's as awhole. It is important to note that these calculations take into account the variability within a unit's data as well as the number of responses (n)represented by the unit's mean score. Items having less variability or a greater number of responses are more likely to show significant differencesfrom the facility's mean score. If 30 or more questionnaires were returned for this unit, questions representing its top ten priorities (based on thisunit's Internal Priority Index) will appear in bold italics; superscripts indicate the priority number.
Last ThisOverall Mean Period Period Facility
Section Score n=68 n=68 Mean Internaln Question Trend Mean Change Mean Score Rating
Overall Endoscopy Rating 91.8 +2.5 94.3 93.1
Overall Endoscopy Rating †† 91.9 +2.4 94.3 93.2
Registration 91.4 +1.4 92.8 92.7
68 Helpfulness of registration person 90.1 +2.9 93.0 93.8
67 Ease of the registration process 9 94.0 +0.0 94.0 93.5
67 Waiting time in registration 5 90.7 +0.3 91.0 90.8
Facility 90.9 +2.4 93.3 90.6
68 Comfort of waiting area 93.4 +1.1 94.5 91.0
67 Ease of finding your way around 9 85.1 +4.8 89.9 87.7
68 Cleanliness of facility 94.0 +1.2 95.2 93.2
Test or Treatment 93.4 +2.5 95.9 94.7
66 Friendliness of staff 94.8 +1.0 95.8 96.1
68 Explanations given by staff 92.8 +3.2 96.0 94.3
68 Skill of techs/therapists/nurses 95.8 +0.5 96.3 95.5
68 Staff concern for comfort 92.9 +4.5 97.4 94.8
68 Staff's concern/questions worries 1 91.8 +2.3 94.1 93.3
Personal Issues 91.6 +2.8 94.4 93.1
Personal Issues †† 92.1 +2.4 94.5 93.2
67 Our concern for privacy 93.5 +1.3 94.8 93.6
67 Our sensitivity to your needs 3 91.4 +3.0 94.4 92.9
66 Response to concerns/complaints 1 90.1 +3.8 93.9 92.7
66 Family able to participate decision † 4 93.2 +1.1 94.3 92.9
64 Staff explained roles in care † 6 92.1 +3.2 95.3 93.0
66 Staff supported family throughout † 92.4 +2.3 94.7 93.3
67 Staff respected having family with † 7 94.9 -0.5 94.4 94.0
67 Staff sensitivity to your needs † 9 91.7 +3.5 95.2 93.3
Overall Assessment 93.1 +1.8 94.9 94.8
67 Staff worked together provide care 8 93.8 +1.4 95.2 94.8
67 Overall rating of care 9 93.7 +2.2 95.9 95.2
67 Likelihood of recommending 92.3 +1.7 94.0 94.6
† Non-standard question
†† Includes non-standard questions
n Number of responsesSignificantly higher than Facility mean score
Not significantly different from Facility mean score
Top ten priority (based on Internal Priority Index)
Find solutions, learn best practices, and networkFor an overview of how to interpret this report page,with colleagues in other health care organizationsclick or visit the following Web page:
https://www.pressganey.com/forumhttp://www.pressganey.com/gti/gti17.htm
51
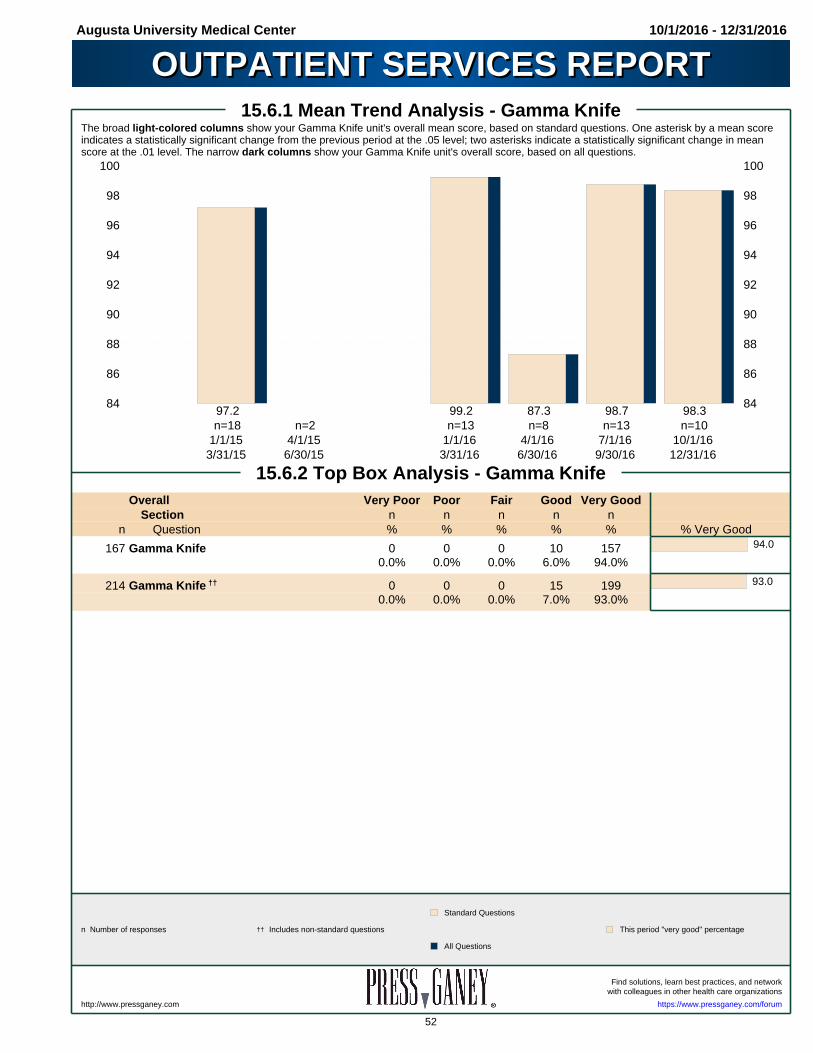
Augusta University Medical Center 10/1/2016 - 12/31/2016
OUTPATIENT SERVICES REPORTOUTPATIENT SERVICES REPORT15.6.1 Mean Trend Analysis - Gamma Knife
The broad light-colored columns show your Gamma Knife unit's overall mean score, based on standard questions. One asterisk by a mean scoreindicates a statistically significant change from the previous period at the .05 level; two asterisks indicate a statistically significant change in meanscore at the .01 level. The narrow dark columns show your Gamma Knife unit's overall score, based on all questions.
84 84
86 86
88 88
90 90
92 92
94 94
96 96
98 98
100 100
97.2n=18
1/1/153/31/15
n=24/1/15
6/30/15
99.2n=13
1/1/163/31/16
87.3n=8
4/1/166/30/16
98.7n=13
7/1/169/30/16
98.3n=10
10/1/1612/31/16
15.6.2 Top Box Analysis - Gamma KnifeOverall Very Poor Poor Fair Good Very Good
Section n n n n nn Question % % % % % % Very Good
167 Gamma Knife 0 0 0 10 1570.0% 0.0% 0.0% 6.0% 94.0%
94.0
214 Gamma Knife †† 0 0 0 15 1990.0% 0.0% 0.0% 7.0% 93.0%
93.0
n Number of responses This period "very good" percentage†† Includes non-standard questions
Standard Questions
All Questions
Find solutions, learn best practices, and networkwith colleagues in other health care organizations
https://www.pressganey.com/forumhttp://www.pressganey.com
52

Augusta University Medical Center 10/1/2016 - 12/31/2016
OUTPATIENT SERVICES REPORTOUTPATIENT SERVICES REPORT15.6.3 Question Analysis - Gamma Knife
This section lists detailed information about individual question, section, and overall mean scores for the Gamma Knife unit. Only units with seven ormore responses are reported. Significant changes in mean scores from the previous report period are marked with asterisks. The amount of changeis listed in the second column of data. Internal comparative data are provided on the right; external benchmarks are not available because units arepotentially unique to your facility. The "Internal Rating" column indicates whether each unit mean score is statistically different from the facility's as awhole. It is important to note that these calculations take into account the variability within a unit's data as well as the number of responses (n)represented by the unit's mean score. Items having less variability or a greater number of responses are more likely to show significant differencesfrom the facility's mean score. If 30 or more questionnaires were returned for this unit, questions representing its top ten priorities (based on thisunit's Internal Priority Index) will appear in bold italics; superscripts indicate the priority number.
Last ThisOverall Mean Period Period Facility
Section Score n=13 n=10 Mean Internaln Question Trend Mean Change Mean Score Rating
Overall Gamma Knife Rating 98.7 -0.4 98.3 93.1
Overall Gamma Knife Rating †† 98.7 -0.4 98.3 93.2
Registration 97.9 +0.3 98.2 92.7
9 Helpfulness of registration person 97.9 +2.1 100.0 93.8
9 Ease of the registration process 97.9 +2.1 100.0 93.5
9 Waiting time in registration 97.9 -3.5 94.4 90.8
Facility 95.8 +0.0 95.8 90.6
10 Comfort of waiting area 97.9 -2.9 95.0 91.0
10 Ease of finding your way around 90.4 +4.6 95.0 87.7
10 Cleanliness of facility 100.0 -2.5 97.5 93.2
Test or Treatment 100.0 +0.0 100.0 94.7
10 Friendliness of staff 100.0 +0.0 100.0 96.1
10 Explanations given by staff 100.0 +0.0 100.0 94.3
10 Skill of techs/therapists/nurses 100.0 +0.0 100.0 95.5
10 Staff concern for comfort 100.0 +0.0 100.0 94.8
10 Staff's concern/questions worries 100.0 +0.0 100.0 93.3
Personal Issues 100.0 -2.5 97.5 93.1
Personal Issues †† 100.0 -2.5 97.5 93.2
10 Our concern for privacy 100.0 -2.5 97.5 93.6
10 Our sensitivity to your needs 100.0 -2.5 97.5 92.9
10 Response to concerns/complaints 100.0 -2.5 97.5 92.7
10 Family able to participate decision † 100.0 -2.5 97.5 92.9
10 Staff explained roles in care † 100.0 -2.5 97.5 93.0
9 Staff supported family throughout † 100.0 -2.8 97.2 93.3
8 Staff respected having family with † 100.0 -3.1 96.9 94.0
10 Staff sensitivity to your needs † 100.0 -2.5 97.5 93.3
Overall Assessment 100.0 +0.0 100.0 94.8
10 Staff worked together provide care 100.0 +0.0 100.0 94.8
10 Overall rating of care 100.0 +0.0 100.0 95.2
10 Likelihood of recommending 100.0 +0.0 100.0 94.6
† Non-standard question
†† Includes non-standard questions
n Number of responsesSignificantly higher than Facility mean score
Not significantly different from Facility mean score
Find solutions, learn best practices, and networkFor an overview of how to interpret this report page,with colleagues in other health care organizationsclick or visit the following Web page:
https://www.pressganey.com/forumhttp://www.pressganey.com/gti/gti17.htm
53

Augusta University Medical Center 10/1/2016 - 12/31/2016
OUTPATIENT SERVICES REPORTOUTPATIENT SERVICES REPORT15.7.1 Mean Trend Analysis - Grtc
The broad light-colored columns show your Grtc unit's overall mean score, based on standard questions. One asterisk by a mean score indicates astatistically significant change from the previous period at the .05 level; two asterisks indicate a statistically significant change in mean score at the.01 level. The narrow dark columns show your Grtc unit's overall score, based on all questions.
90 90
92 92
94 94
96 96
98 98
100 100
93.3n=25
1/1/153/31/15
n=64/1/15
6/30/15
94.4n=89
1/1/163/31/16
96.3n=41
4/1/166/30/16
95.0n=63
7/1/169/30/16
94.1n=89
10/1/1612/31/16
15.7.2 Top Box Analysis - GrtcOverall Very Poor Poor Fair Good Very Good
Section n n n n nn Question % % % % % % Very Good
1,500 Grtc 0 0 13 316 1,1710.0% 0.0% 0.9% 21.1% 78.1%
78.1
1,912 Grtc †† 0 1 16 419 1,4760.0% 0.1% 0.8% 21.9% 77.2%
77.2
n Number of responses This period "very good" percentage†† Includes non-standard questions
Standard Questions
All Questions
Find solutions, learn best practices, and networkwith colleagues in other health care organizations
https://www.pressganey.com/forumhttp://www.pressganey.com
54
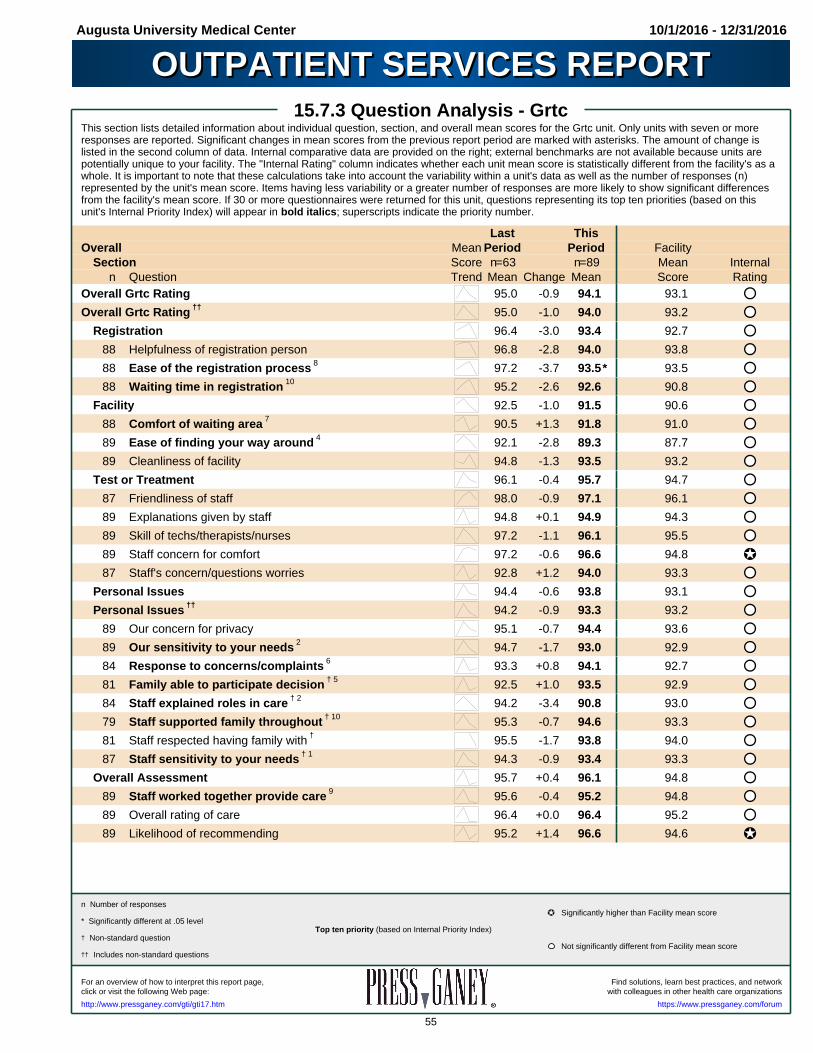
Augusta University Medical Center 10/1/2016 - 12/31/2016
OUTPATIENT SERVICES REPORTOUTPATIENT SERVICES REPORT15.7.3 Question Analysis - Grtc
This section lists detailed information about individual question, section, and overall mean scores for the Grtc unit. Only units with seven or moreresponses are reported. Significant changes in mean scores from the previous report period are marked with asterisks. The amount of change islisted in the second column of data. Internal comparative data are provided on the right; external benchmarks are not available because units arepotentially unique to your facility. The "Internal Rating" column indicates whether each unit mean score is statistically different from the facility's as awhole. It is important to note that these calculations take into account the variability within a unit's data as well as the number of responses (n)represented by the unit's mean score. Items having less variability or a greater number of responses are more likely to show significant differencesfrom the facility's mean score. If 30 or more questionnaires were returned for this unit, questions representing its top ten priorities (based on thisunit's Internal Priority Index) will appear in bold italics; superscripts indicate the priority number.
Last ThisOverall Mean Period Period Facility
Section Score n=63 n=89 Mean Internaln Question Trend Mean Change Mean Score Rating
Overall Grtc Rating 95.0 -0.9 94.1 93.1
Overall Grtc Rating †† 95.0 -1.0 94.0 93.2
Registration 96.4 -3.0 93.4 92.7
88 Helpfulness of registration person 96.8 -2.8 94.0 93.8
88 Ease of the registration process 8 97.2 -3.7 93.5* 93.5
88 Waiting time in registration 10 95.2 -2.6 92.6 90.8
Facility 92.5 -1.0 91.5 90.6
88 Comfort of waiting area 7 90.5 +1.3 91.8 91.0
89 Ease of finding your way around 4 92.1 -2.8 89.3 87.7
89 Cleanliness of facility 94.8 -1.3 93.5 93.2
Test or Treatment 96.1 -0.4 95.7 94.7
87 Friendliness of staff 98.0 -0.9 97.1 96.1
89 Explanations given by staff 94.8 +0.1 94.9 94.3
89 Skill of techs/therapists/nurses 97.2 -1.1 96.1 95.5
89 Staff concern for comfort 97.2 -0.6 96.6 94.8
87 Staff's concern/questions worries 92.8 +1.2 94.0 93.3
Personal Issues 94.4 -0.6 93.8 93.1
Personal Issues †† 94.2 -0.9 93.3 93.2
89 Our concern for privacy 95.1 -0.7 94.4 93.6
89 Our sensitivity to your needs 2 94.7 -1.7 93.0 92.9
84 Response to concerns/complaints 6 93.3 +0.8 94.1 92.7
81 Family able to participate decision † 5 92.5 +1.0 93.5 92.9
84 Staff explained roles in care † 2 94.2 -3.4 90.8 93.0
79 Staff supported family throughout † 10 95.3 -0.7 94.6 93.3
81 Staff respected having family with † 95.5 -1.7 93.8 94.0
87 Staff sensitivity to your needs † 1 94.3 -0.9 93.4 93.3
Overall Assessment 95.7 +0.4 96.1 94.8
89 Staff worked together provide care 9 95.6 -0.4 95.2 94.8
89 Overall rating of care 96.4 +0.0 96.4 95.2
89 Likelihood of recommending 95.2 +1.4 96.6 94.6
* Significantly different at .05 level
† Non-standard question
†† Includes non-standard questions
n Number of responsesSignificantly higher than Facility mean score
Not significantly different from Facility mean score
Top ten priority (based on Internal Priority Index)
Find solutions, learn best practices, and networkFor an overview of how to interpret this report page,with colleagues in other health care organizationsclick or visit the following Web page:
https://www.pressganey.com/forumhttp://www.pressganey.com/gti/gti17.htm
55

Augusta University Medical Center 10/1/2016 - 12/31/2016
OUTPATIENT SERVICES REPORTOUTPATIENT SERVICES REPORT15.8.1 Mean Trend Analysis - Mammography
The broad light-colored columns show your Mammography unit's overall mean score, based on standard questions. One asterisk by a mean scoreindicates a statistically significant change from the previous period at the .05 level; two asterisks indicate a statistically significant change in meanscore at the .01 level. The narrow dark columns show your Mammography unit's overall score, based on all questions.
92 92
94 94
96 96
98 98
100 100
95.1n=1311/1/15
3/31/15
96.4n=47
4/1/156/30/15
n=17/1/15
12/31/15
96.3n=71
1/1/163/31/16
95.2n=89
4/1/166/30/16
95.3n=78
7/1/169/30/16
96.2n=104
10/1/1612/31/16
15.8.2 Top Box Analysis - MammographyOverall Very Poor Poor Fair Good Very Good
Section n n n n nn Question % % % % % % Very Good
1,688 Mammography 0 3 9 215 1,4610.0% 0.2% 0.5% 12.7% 86.6%
86.6
2,083 Mammography †† 0 3 11 293 1,7760.0% 0.1% 0.5% 14.1% 85.3%
85.3
n Number of responses This period "very good" percentage†† Includes non-standard questions
Standard Questions
All Questions
Find solutions, learn best practices, and networkwith colleagues in other health care organizations
https://www.pressganey.com/forumhttp://www.pressganey.com
56
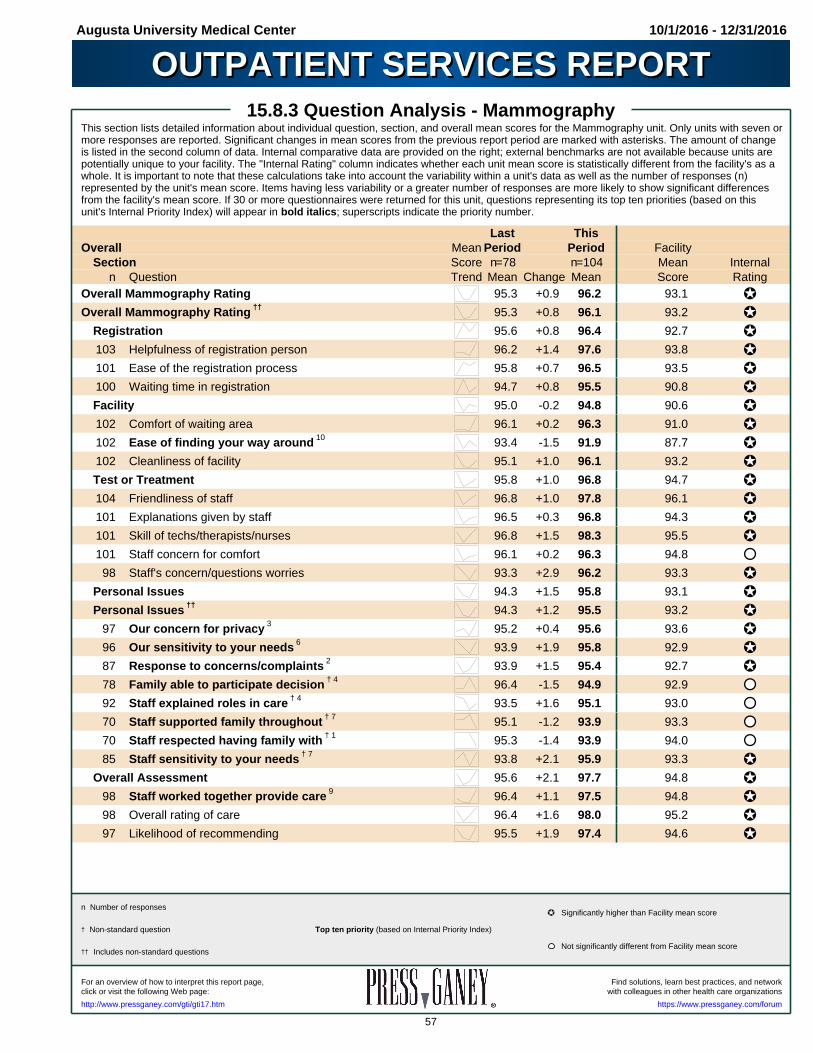
Augusta University Medical Center 10/1/2016 - 12/31/2016
OUTPATIENT SERVICES REPORTOUTPATIENT SERVICES REPORT15.8.3 Question Analysis - Mammography
This section lists detailed information about individual question, section, and overall mean scores for the Mammography unit. Only units with seven ormore responses are reported. Significant changes in mean scores from the previous report period are marked with asterisks. The amount of changeis listed in the second column of data. Internal comparative data are provided on the right; external benchmarks are not available because units arepotentially unique to your facility. The "Internal Rating" column indicates whether each unit mean score is statistically different from the facility's as awhole. It is important to note that these calculations take into account the variability within a unit's data as well as the number of responses (n)represented by the unit's mean score. Items having less variability or a greater number of responses are more likely to show significant differencesfrom the facility's mean score. If 30 or more questionnaires were returned for this unit, questions representing its top ten priorities (based on thisunit's Internal Priority Index) will appear in bold italics; superscripts indicate the priority number.
Last ThisOverall Mean Period Period Facility
Section Score n=78 n=104 Mean Internaln Question Trend Mean Change Mean Score Rating
Overall Mammography Rating 95.3 +0.9 96.2 93.1
Overall Mammography Rating †† 95.3 +0.8 96.1 93.2
Registration 95.6 +0.8 96.4 92.7
103 Helpfulness of registration person 96.2 +1.4 97.6 93.8
101 Ease of the registration process 95.8 +0.7 96.5 93.5
100 Waiting time in registration 94.7 +0.8 95.5 90.8
Facility 95.0 -0.2 94.8 90.6
102 Comfort of waiting area 96.1 +0.2 96.3 91.0
102 Ease of finding your way around 10 93.4 -1.5 91.9 87.7
102 Cleanliness of facility 95.1 +1.0 96.1 93.2
Test or Treatment 95.8 +1.0 96.8 94.7
104 Friendliness of staff 96.8 +1.0 97.8 96.1
101 Explanations given by staff 96.5 +0.3 96.8 94.3
101 Skill of techs/therapists/nurses 96.8 +1.5 98.3 95.5
101 Staff concern for comfort 96.1 +0.2 96.3 94.8
98 Staff's concern/questions worries 93.3 +2.9 96.2 93.3
Personal Issues 94.3 +1.5 95.8 93.1
Personal Issues †† 94.3 +1.2 95.5 93.2
97 Our concern for privacy 3 95.2 +0.4 95.6 93.6
96 Our sensitivity to your needs 6 93.9 +1.9 95.8 92.9
87 Response to concerns/complaints 2 93.9 +1.5 95.4 92.7
78 Family able to participate decision † 4 96.4 -1.5 94.9 92.9
92 Staff explained roles in care † 4 93.5 +1.6 95.1 93.0
70 Staff supported family throughout † 7 95.1 -1.2 93.9 93.3
70 Staff respected having family with † 1 95.3 -1.4 93.9 94.0
85 Staff sensitivity to your needs † 7 93.8 +2.1 95.9 93.3
Overall Assessment 95.6 +2.1 97.7 94.8
98 Staff worked together provide care 9 96.4 +1.1 97.5 94.8
98 Overall rating of care 96.4 +1.6 98.0 95.2
97 Likelihood of recommending 95.5 +1.9 97.4 94.6
† Non-standard question
†† Includes non-standard questions
n Number of responsesSignificantly higher than Facility mean score
Not significantly different from Facility mean score
Top ten priority (based on Internal Priority Index)
Find solutions, learn best practices, and networkFor an overview of how to interpret this report page,with colleagues in other health care organizationsclick or visit the following Web page:
https://www.pressganey.com/forumhttp://www.pressganey.com/gti/gti17.htm
57

Augusta University Medical Center 10/1/2016 - 12/31/2016
OUTPATIENT SERVICES REPORTOUTPATIENT SERVICES REPORT15.9.1 Mean Trend Analysis - Ob Ultrasound
The broad light-colored columns show your Ob Ultrasound unit's overall mean score, based on standard questions. One asterisk by a mean scoreindicates a statistically significant change from the previous period at the .05 level; two asterisks indicate a statistically significant change in meanscore at the .01 level. The narrow dark columns show your Ob Ultrasound unit's overall score, based on all questions.
76 76
78 78
80 80
82 82
84 84
86 86
88 88
90 90
92 92
94 94
96 96
98 98
90.4n=27
1/1/153/31/15
79.8n=7
4/1/156/30/15
n=17/1/15
12/31/15
87.2n=14
1/1/163/31/16
81.6n=19
4/1/166/30/16
87.5n=12
7/1/169/30/16
94.5n=15
10/1/1612/31/16
15.9.2 Top Box Analysis - Ob UltrasoundOverall Very Poor Poor Fair Good Very Good
Section n n n n nn Question % % % % % % Very Good
254 Ob Ultrasound 0 3 6 34 2110.0% 1.2% 2.4% 13.4% 83.1%
83.1
323 Ob Ultrasound †† 0 3 9 45 2660.0% 0.9% 2.8% 13.9% 82.4%
82.4
n Number of responses This period "very good" percentage†† Includes non-standard questions
Standard Questions
All Questions
Find solutions, learn best practices, and networkwith colleagues in other health care organizations
https://www.pressganey.com/forumhttp://www.pressganey.com
58
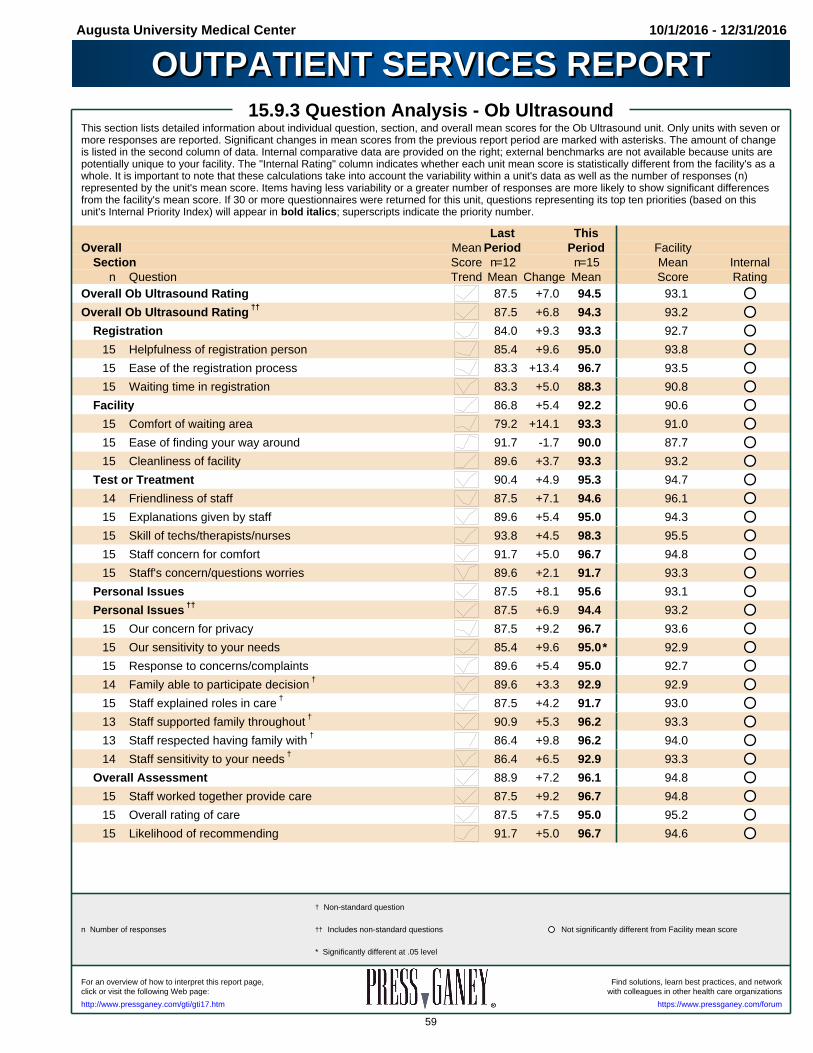
Augusta University Medical Center 10/1/2016 - 12/31/2016
OUTPATIENT SERVICES REPORTOUTPATIENT SERVICES REPORT15.9.3 Question Analysis - Ob Ultrasound
This section lists detailed information about individual question, section, and overall mean scores for the Ob Ultrasound unit. Only units with seven ormore responses are reported. Significant changes in mean scores from the previous report period are marked with asterisks. The amount of changeis listed in the second column of data. Internal comparative data are provided on the right; external benchmarks are not available because units arepotentially unique to your facility. The "Internal Rating" column indicates whether each unit mean score is statistically different from the facility's as awhole. It is important to note that these calculations take into account the variability within a unit's data as well as the number of responses (n)represented by the unit's mean score. Items having less variability or a greater number of responses are more likely to show significant differencesfrom the facility's mean score. If 30 or more questionnaires were returned for this unit, questions representing its top ten priorities (based on thisunit's Internal Priority Index) will appear in bold italics; superscripts indicate the priority number.
Last ThisOverall Mean Period Period Facility
Section Score n=12 n=15 Mean Internaln Question Trend Mean Change Mean Score Rating
Overall Ob Ultrasound Rating 87.5 +7.0 94.5 93.1
Overall Ob Ultrasound Rating †† 87.5 +6.8 94.3 93.2
Registration 84.0 +9.3 93.3 92.7
15 Helpfulness of registration person 85.4 +9.6 95.0 93.8
15 Ease of the registration process 83.3 +13.4 96.7 93.5
15 Waiting time in registration 83.3 +5.0 88.3 90.8
Facility 86.8 +5.4 92.2 90.6
15 Comfort of waiting area 79.2 +14.1 93.3 91.0
15 Ease of finding your way around 91.7 -1.7 90.0 87.7
15 Cleanliness of facility 89.6 +3.7 93.3 93.2
Test or Treatment 90.4 +4.9 95.3 94.7
14 Friendliness of staff 87.5 +7.1 94.6 96.1
15 Explanations given by staff 89.6 +5.4 95.0 94.3
15 Skill of techs/therapists/nurses 93.8 +4.5 98.3 95.5
15 Staff concern for comfort 91.7 +5.0 96.7 94.8
15 Staff's concern/questions worries 89.6 +2.1 91.7 93.3
Personal Issues 87.5 +8.1 95.6 93.1
Personal Issues †† 87.5 +6.9 94.4 93.2
15 Our concern for privacy 87.5 +9.2 96.7 93.6
15 Our sensitivity to your needs 85.4 +9.6 95.0* 92.9
15 Response to concerns/complaints 89.6 +5.4 95.0 92.7
14 Family able to participate decision † 89.6 +3.3 92.9 92.9
15 Staff explained roles in care † 87.5 +4.2 91.7 93.0
13 Staff supported family throughout † 90.9 +5.3 96.2 93.3
13 Staff respected having family with † 86.4 +9.8 96.2 94.0
14 Staff sensitivity to your needs † 86.4 +6.5 92.9 93.3
Overall Assessment 88.9 +7.2 96.1 94.8
15 Staff worked together provide care 87.5 +9.2 96.7 94.8
15 Overall rating of care 87.5 +7.5 95.0 95.2
15 Likelihood of recommending 91.7 +5.0 96.7 94.6
n Number of responses Not significantly different from Facility mean score
* Significantly different at .05 level
† Non-standard question
†† Includes non-standard questions
Find solutions, learn best practices, and networkFor an overview of how to interpret this report page,with colleagues in other health care organizationsclick or visit the following Web page:
https://www.pressganey.com/forumhttp://www.pressganey.com/gti/gti17.htm
59

Augusta University Medical Center 10/1/2016 - 12/31/2016
OUTPATIENT SERVICES REPORTOUTPATIENT SERVICES REPORT15.10.1 Mean Trend Analysis - Occupational Therapy
The broad light-colored columns show your Occupational Therapy unit's overall mean score, based on standard questions. One asterisk by amean score indicates a statistically significant change from the previous period at the .05 level; two asterisks indicate a statistically significant changein mean score at the .01 level. The narrow dark columns show your Occupational Therapy unit's overall score, based on all questions.
88 88
90 90
92 92
94 94
96 96
98 98
100 100
91.9n=25
1/1/153/31/15
94.5n=9
4/1/156/30/15
n=17/1/15
12/31/15
91.4n=10
1/1/163/31/16
97.2n=10
4/1/166/30/16
97.5n=11
7/1/169/30/16
91.6n=8
10/1/1612/31/16
15.10.2 Top Box Analysis - Occupational TherapyOverall Very Poor Poor Fair Good Very Good
Section n n n n nn Question % % % % % % Very Good
136 Occupational The 0 0 9 26 1010.0% 0.0% 6.6% 19.1% 74.3%
74.3
176 Occupational The †† 0 0 11 31 1340.0% 0.0% 6.3% 17.6% 76.1%
76.1
n Number of responses This period "very good" percentage†† Includes non-standard questions
Standard Questions
All Questions
Find solutions, learn best practices, and networkwith colleagues in other health care organizations
https://www.pressganey.com/forumhttp://www.pressganey.com
60
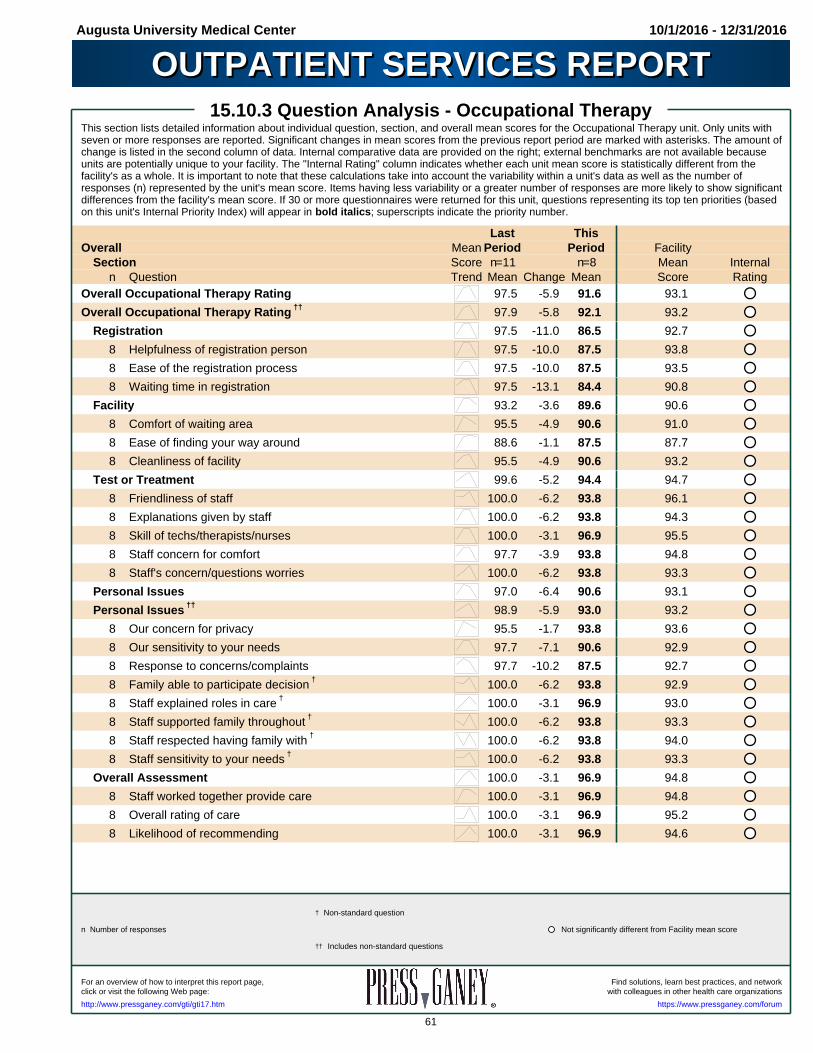
Augusta University Medical Center 10/1/2016 - 12/31/2016
OUTPATIENT SERVICES REPORTOUTPATIENT SERVICES REPORT15.10.3 Question Analysis - Occupational Therapy
This section lists detailed information about individual question, section, and overall mean scores for the Occupational Therapy unit. Only units withseven or more responses are reported. Significant changes in mean scores from the previous report period are marked with asterisks. The amount ofchange is listed in the second column of data. Internal comparative data are provided on the right; external benchmarks are not available becauseunits are potentially unique to your facility. The "Internal Rating" column indicates whether each unit mean score is statistically different from thefacility's as a whole. It is important to note that these calculations take into account the variability within a unit's data as well as the number ofresponses (n) represented by the unit's mean score. Items having less variability or a greater number of responses are more likely to show significantdifferences from the facility's mean score. If 30 or more questionnaires were returned for this unit, questions representing its top ten priorities (basedon this unit's Internal Priority Index) will appear in bold italics; superscripts indicate the priority number.
Last ThisOverall Mean Period Period Facility
Section Score n=11 n=8 Mean Internaln Question Trend Mean Change Mean Score Rating
Overall Occupational Therapy Rating 97.5 -5.9 91.6 93.1
Overall Occupational Therapy Rating †† 97.9 -5.8 92.1 93.2
Registration 97.5 -11.0 86.5 92.7
8 Helpfulness of registration person 97.5 -10.0 87.5 93.8
8 Ease of the registration process 97.5 -10.0 87.5 93.5
8 Waiting time in registration 97.5 -13.1 84.4 90.8
Facility 93.2 -3.6 89.6 90.6
8 Comfort of waiting area 95.5 -4.9 90.6 91.0
8 Ease of finding your way around 88.6 -1.1 87.5 87.7
8 Cleanliness of facility 95.5 -4.9 90.6 93.2
Test or Treatment 99.6 -5.2 94.4 94.7
8 Friendliness of staff 100.0 -6.2 93.8 96.1
8 Explanations given by staff 100.0 -6.2 93.8 94.3
8 Skill of techs/therapists/nurses 100.0 -3.1 96.9 95.5
8 Staff concern for comfort 97.7 -3.9 93.8 94.8
8 Staff's concern/questions worries 100.0 -6.2 93.8 93.3
Personal Issues 97.0 -6.4 90.6 93.1
Personal Issues †† 98.9 -5.9 93.0 93.2
8 Our concern for privacy 95.5 -1.7 93.8 93.6
8 Our sensitivity to your needs 97.7 -7.1 90.6 92.9
8 Response to concerns/complaints 97.7 -10.2 87.5 92.7
8 Family able to participate decision † 100.0 -6.2 93.8 92.9
8 Staff explained roles in care † 100.0 -3.1 96.9 93.0
8 Staff supported family throughout † 100.0 -6.2 93.8 93.3
8 Staff respected having family with † 100.0 -6.2 93.8 94.0
8 Staff sensitivity to your needs † 100.0 -6.2 93.8 93.3
Overall Assessment 100.0 -3.1 96.9 94.8
8 Staff worked together provide care 100.0 -3.1 96.9 94.8
8 Overall rating of care 100.0 -3.1 96.9 95.2
8 Likelihood of recommending 100.0 -3.1 96.9 94.6
n Number of responses Not significantly different from Facility mean score
† Non-standard question
†† Includes non-standard questions
Find solutions, learn best practices, and networkFor an overview of how to interpret this report page,with colleagues in other health care organizationsclick or visit the following Web page:
https://www.pressganey.com/forumhttp://www.pressganey.com/gti/gti17.htm
61
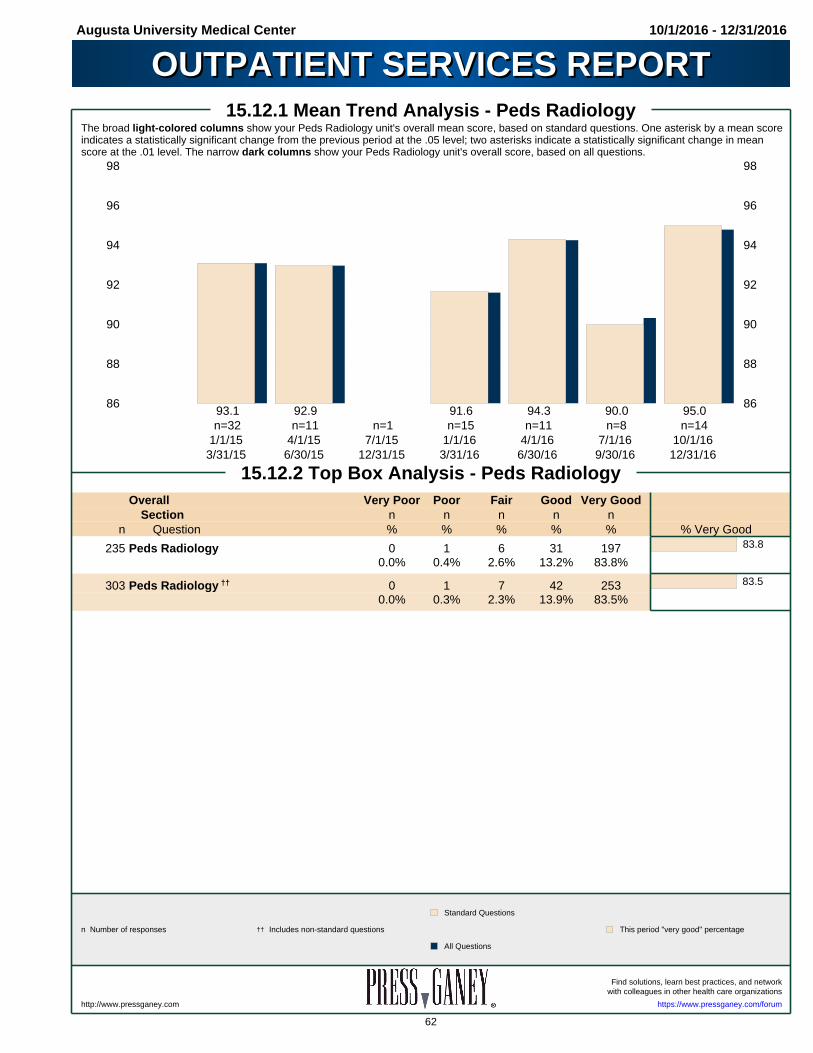
Augusta University Medical Center 10/1/2016 - 12/31/2016
OUTPATIENT SERVICES REPORTOUTPATIENT SERVICES REPORT15.12.1 Mean Trend Analysis - Peds Radiology
The broad light-colored columns show your Peds Radiology unit's overall mean score, based on standard questions. One asterisk by a mean scoreindicates a statistically significant change from the previous period at the .05 level; two asterisks indicate a statistically significant change in meanscore at the .01 level. The narrow dark columns show your Peds Radiology unit's overall score, based on all questions.
86 86
88 88
90 90
92 92
94 94
96 96
98 98
93.1n=32
1/1/153/31/15
92.9n=11
4/1/156/30/15
n=17/1/15
12/31/15
91.6n=15
1/1/163/31/16
94.3n=11
4/1/166/30/16
90.0n=8
7/1/169/30/16
95.0n=14
10/1/1612/31/16
15.12.2 Top Box Analysis - Peds RadiologyOverall Very Poor Poor Fair Good Very Good
Section n n n n nn Question % % % % % % Very Good
235 Peds Radiology 0 1 6 31 1970.0% 0.4% 2.6% 13.2% 83.8%
83.8
303 Peds Radiology †† 0 1 7 42 2530.0% 0.3% 2.3% 13.9% 83.5%
83.5
n Number of responses This period "very good" percentage†† Includes non-standard questions
Standard Questions
All Questions
Find solutions, learn best practices, and networkwith colleagues in other health care organizations
https://www.pressganey.com/forumhttp://www.pressganey.com
62
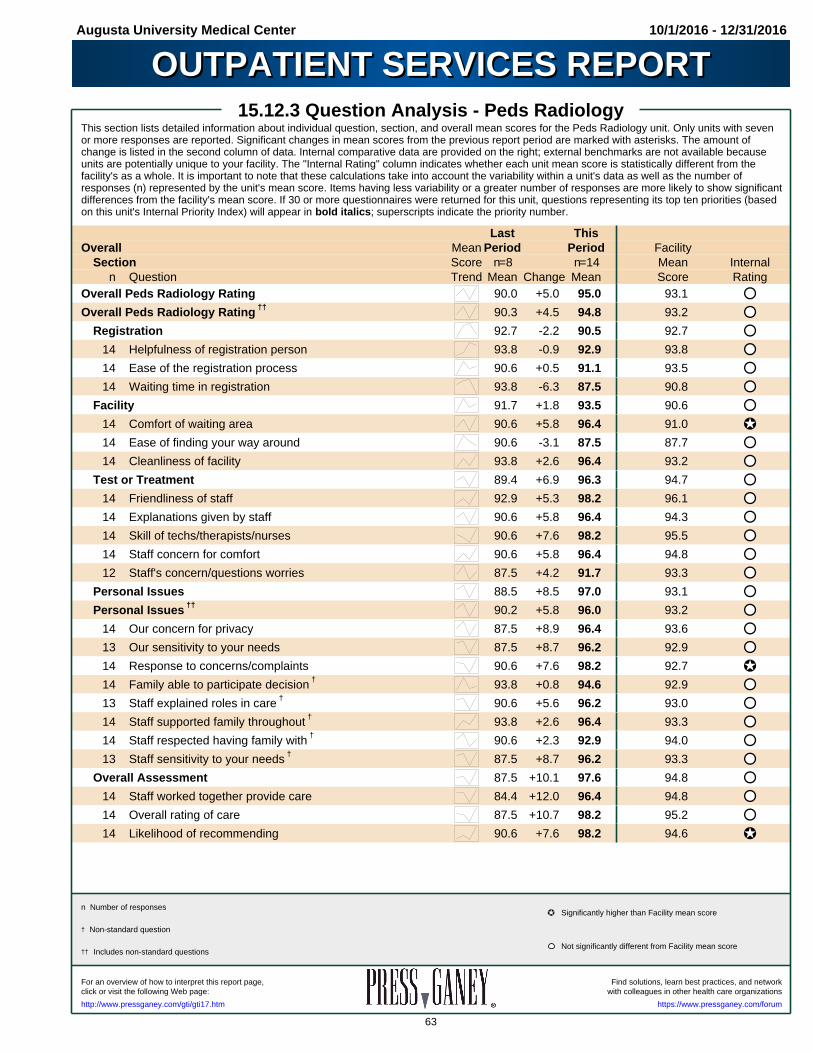
Augusta University Medical Center 10/1/2016 - 12/31/2016
OUTPATIENT SERVICES REPORTOUTPATIENT SERVICES REPORT15.12.3 Question Analysis - Peds Radiology
This section lists detailed information about individual question, section, and overall mean scores for the Peds Radiology unit. Only units with sevenor more responses are reported. Significant changes in mean scores from the previous report period are marked with asterisks. The amount ofchange is listed in the second column of data. Internal comparative data are provided on the right; external benchmarks are not available becauseunits are potentially unique to your facility. The "Internal Rating" column indicates whether each unit mean score is statistically different from thefacility's as a whole. It is important to note that these calculations take into account the variability within a unit's data as well as the number ofresponses (n) represented by the unit's mean score. Items having less variability or a greater number of responses are more likely to show significantdifferences from the facility's mean score. If 30 or more questionnaires were returned for this unit, questions representing its top ten priorities (basedon this unit's Internal Priority Index) will appear in bold italics; superscripts indicate the priority number.
Last ThisOverall Mean Period Period Facility
Section Score n=8 n=14 Mean Internaln Question Trend Mean Change Mean Score Rating
Overall Peds Radiology Rating 90.0 +5.0 95.0 93.1
Overall Peds Radiology Rating †† 90.3 +4.5 94.8 93.2
Registration 92.7 -2.2 90.5 92.7
14 Helpfulness of registration person 93.8 -0.9 92.9 93.8
14 Ease of the registration process 90.6 +0.5 91.1 93.5
14 Waiting time in registration 93.8 -6.3 87.5 90.8
Facility 91.7 +1.8 93.5 90.6
14 Comfort of waiting area 90.6 +5.8 96.4 91.0
14 Ease of finding your way around 90.6 -3.1 87.5 87.7
14 Cleanliness of facility 93.8 +2.6 96.4 93.2
Test or Treatment 89.4 +6.9 96.3 94.7
14 Friendliness of staff 92.9 +5.3 98.2 96.1
14 Explanations given by staff 90.6 +5.8 96.4 94.3
14 Skill of techs/therapists/nurses 90.6 +7.6 98.2 95.5
14 Staff concern for comfort 90.6 +5.8 96.4 94.8
12 Staff's concern/questions worries 87.5 +4.2 91.7 93.3
Personal Issues 88.5 +8.5 97.0 93.1
Personal Issues †† 90.2 +5.8 96.0 93.2
14 Our concern for privacy 87.5 +8.9 96.4 93.6
13 Our sensitivity to your needs 87.5 +8.7 96.2 92.9
14 Response to concerns/complaints 90.6 +7.6 98.2 92.7
14 Family able to participate decision † 93.8 +0.8 94.6 92.9
13 Staff explained roles in care † 90.6 +5.6 96.2 93.0
14 Staff supported family throughout † 93.8 +2.6 96.4 93.3
14 Staff respected having family with † 90.6 +2.3 92.9 94.0
13 Staff sensitivity to your needs † 87.5 +8.7 96.2 93.3
Overall Assessment 87.5 +10.1 97.6 94.8
14 Staff worked together provide care 84.4 +12.0 96.4 94.8
14 Overall rating of care 87.5 +10.7 98.2 95.2
14 Likelihood of recommending 90.6 +7.6 98.2 94.6
† Non-standard question
†† Includes non-standard questions
n Number of responsesSignificantly higher than Facility mean score
Not significantly different from Facility mean score
Find solutions, learn best practices, and networkFor an overview of how to interpret this report page,with colleagues in other health care organizationsclick or visit the following Web page:
https://www.pressganey.com/forumhttp://www.pressganey.com/gti/gti17.htm
63
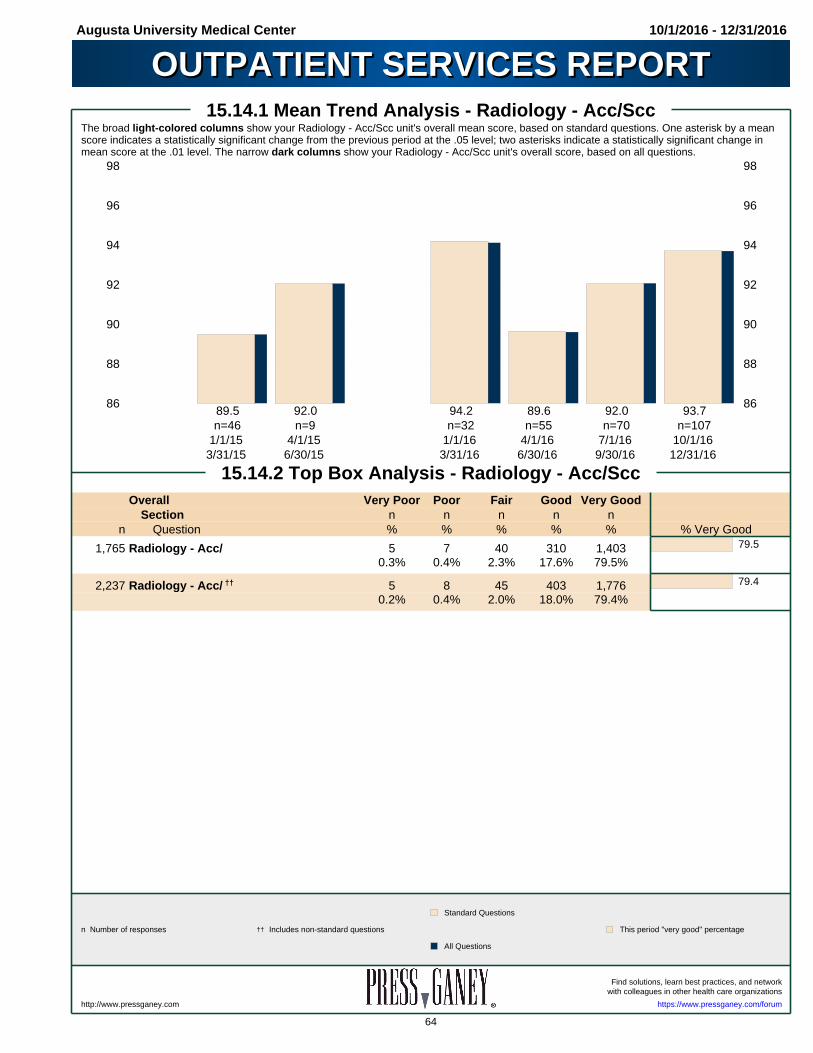
Augusta University Medical Center 10/1/2016 - 12/31/2016
OUTPATIENT SERVICES REPORTOUTPATIENT SERVICES REPORT15.14.1 Mean Trend Analysis - Radiology - Acc/Scc
The broad light-colored columns show your Radiology - Acc/Scc unit's overall mean score, based on standard questions. One asterisk by a meanscore indicates a statistically significant change from the previous period at the .05 level; two asterisks indicate a statistically significant change inmean score at the .01 level. The narrow dark columns show your Radiology - Acc/Scc unit's overall score, based on all questions.
86 86
88 88
90 90
92 92
94 94
96 96
98 98
89.5n=46
1/1/153/31/15
92.0n=9
4/1/156/30/15
94.2n=32
1/1/163/31/16
89.6n=55
4/1/166/30/16
92.0n=70
7/1/169/30/16
93.7n=107
10/1/1612/31/16
15.14.2 Top Box Analysis - Radiology - Acc/SccOverall Very Poor Poor Fair Good Very Good
Section n n n n nn Question % % % % % % Very Good
1,765 Radiology - Acc/ 5 7 40 310 1,4030.3% 0.4% 2.3% 17.6% 79.5%
79.5
2,237 Radiology - Acc/ †† 5 8 45 403 1,7760.2% 0.4% 2.0% 18.0% 79.4%
79.4
n Number of responses This period "very good" percentage†† Includes non-standard questions
Standard Questions
All Questions
Find solutions, learn best practices, and networkwith colleagues in other health care organizations
https://www.pressganey.com/forumhttp://www.pressganey.com
64
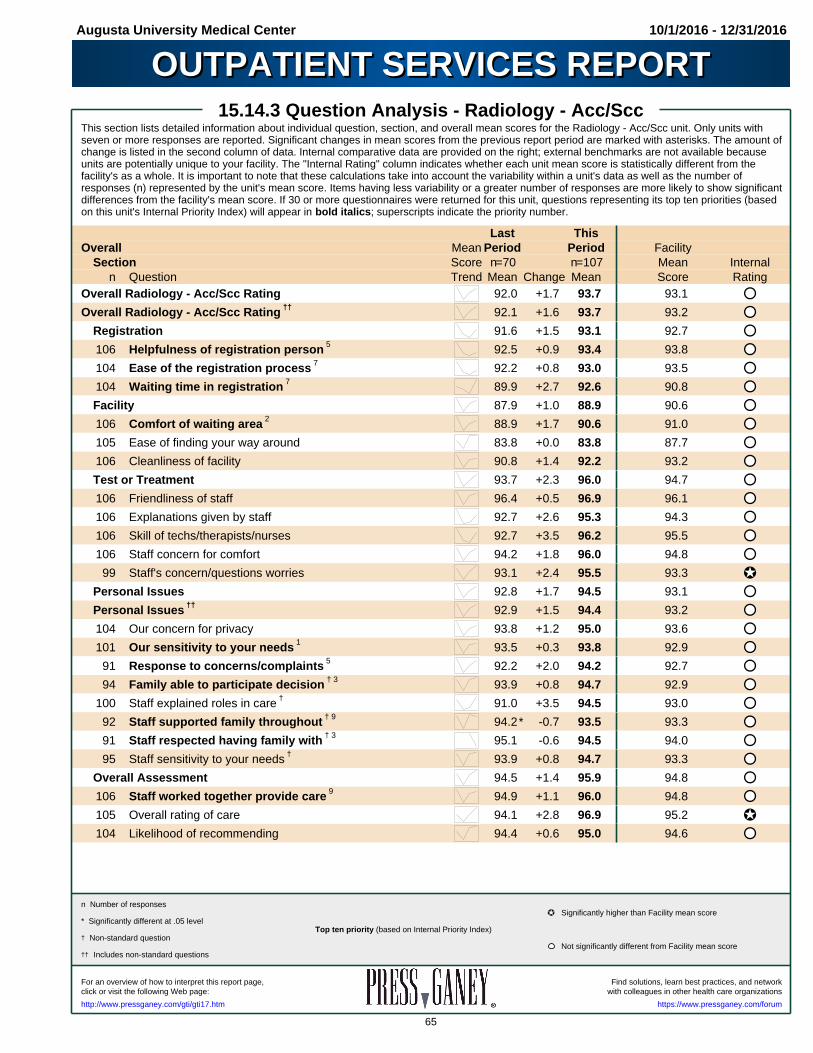
Augusta University Medical Center 10/1/2016 - 12/31/2016
OUTPATIENT SERVICES REPORTOUTPATIENT SERVICES REPORT15.14.3 Question Analysis - Radiology - Acc/Scc
This section lists detailed information about individual question, section, and overall mean scores for the Radiology - Acc/Scc unit. Only units withseven or more responses are reported. Significant changes in mean scores from the previous report period are marked with asterisks. The amount ofchange is listed in the second column of data. Internal comparative data are provided on the right; external benchmarks are not available becauseunits are potentially unique to your facility. The "Internal Rating" column indicates whether each unit mean score is statistically different from thefacility's as a whole. It is important to note that these calculations take into account the variability within a unit's data as well as the number ofresponses (n) represented by the unit's mean score. Items having less variability or a greater number of responses are more likely to show significantdifferences from the facility's mean score. If 30 or more questionnaires were returned for this unit, questions representing its top ten priorities (basedon this unit's Internal Priority Index) will appear in bold italics; superscripts indicate the priority number.
Last ThisOverall Mean Period Period Facility
Section Score n=70 n=107 Mean Internaln Question Trend Mean Change Mean Score Rating
Overall Radiology - Acc/Scc Rating 92.0 +1.7 93.7 93.1
Overall Radiology - Acc/Scc Rating †† 92.1 +1.6 93.7 93.2
Registration 91.6 +1.5 93.1 92.7
106 Helpfulness of registration person 5 92.5 +0.9 93.4 93.8
104 Ease of the registration process 7 92.2 +0.8 93.0 93.5
104 Waiting time in registration 7 89.9 +2.7 92.6 90.8
Facility 87.9 +1.0 88.9 90.6
106 Comfort of waiting area 2 88.9 +1.7 90.6 91.0
105 Ease of finding your way around 83.8 +0.0 83.8 87.7
106 Cleanliness of facility 90.8 +1.4 92.2 93.2
Test or Treatment 93.7 +2.3 96.0 94.7
106 Friendliness of staff 96.4 +0.5 96.9 96.1
106 Explanations given by staff 92.7 +2.6 95.3 94.3
106 Skill of techs/therapists/nurses 92.7 +3.5 96.2 95.5
106 Staff concern for comfort 94.2 +1.8 96.0 94.8
99 Staff's concern/questions worries 93.1 +2.4 95.5 93.3
Personal Issues 92.8 +1.7 94.5 93.1
Personal Issues †† 92.9 +1.5 94.4 93.2
104 Our concern for privacy 93.8 +1.2 95.0 93.6
101 Our sensitivity to your needs 1 93.5 +0.3 93.8 92.9
91 Response to concerns/complaints 5 92.2 +2.0 94.2 92.7
94 Family able to participate decision † 3 93.9 +0.8 94.7 92.9
100 Staff explained roles in care † 91.0 +3.5 94.5 93.0
92 Staff supported family throughout † 9 94.2* -0.7 93.5 93.3
91 Staff respected having family with † 3 95.1 -0.6 94.5 94.0
95 Staff sensitivity to your needs † 93.9 +0.8 94.7 93.3
Overall Assessment 94.5 +1.4 95.9 94.8
106 Staff worked together provide care 9 94.9 +1.1 96.0 94.8
105 Overall rating of care 94.1 +2.8 96.9 95.2
104 Likelihood of recommending 94.4 +0.6 95.0 94.6
* Significantly different at .05 level
† Non-standard question
†† Includes non-standard questions
n Number of responsesSignificantly higher than Facility mean score
Not significantly different from Facility mean score
Top ten priority (based on Internal Priority Index)
Find solutions, learn best practices, and networkFor an overview of how to interpret this report page,with colleagues in other health care organizationsclick or visit the following Web page:
https://www.pressganey.com/forumhttp://www.pressganey.com/gti/gti17.htm
65

Augusta University Medical Center 10/1/2016 - 12/31/2016
OUTPATIENT SERVICES REPORTOUTPATIENT SERVICES REPORT15.15.1 Mean Trend Analysis - Radiology - Hospital
The broad light-colored columns show your Radiology - Hospital unit's overall mean score, based on standard questions. One asterisk by a meanscore indicates a statistically significant change from the previous period at the .05 level; two asterisks indicate a statistically significant change inmean score at the .01 level. The narrow dark columns show your Radiology - Hospital unit's overall score, based on all questions.
86 86
88 88
90 90
92 92
94 94
89.9n=92
1/1/153/31/15
90.1n=15
4/1/156/30/15
90.0n=40
1/1/163/31/16
90.5n=62
4/1/166/30/16
90.9n=61
7/1/169/30/16
91.6n=73
10/1/1612/31/16
15.15.2 Top Box Analysis - Radiology - HospitalOverall Very Poor Poor Fair Good Very Good
Section n n n n nn Question % % % % % % Very Good
1,213 Radiology - Hosp 8 17 37 213 9380.7% 1.4% 3.1% 17.6% 77.3%
77.3
1,530 Radiology - Hosp †† 9 21 46 266 1,1880.6% 1.4% 3.0% 17.4% 77.6%
77.6
n Number of responses This period "very good" percentage†† Includes non-standard questions
Standard Questions
All Questions
Find solutions, learn best practices, and networkwith colleagues in other health care organizations
https://www.pressganey.com/forumhttp://www.pressganey.com
66

Augusta University Medical Center 10/1/2016 - 12/31/2016
OUTPATIENT SERVICES REPORTOUTPATIENT SERVICES REPORT15.15.3 Question Analysis - Radiology - Hospital
This section lists detailed information about individual question, section, and overall mean scores for the Radiology - Hospital unit. Only units withseven or more responses are reported. Significant changes in mean scores from the previous report period are marked with asterisks. The amount ofchange is listed in the second column of data. Internal comparative data are provided on the right; external benchmarks are not available becauseunits are potentially unique to your facility. The "Internal Rating" column indicates whether each unit mean score is statistically different from thefacility's as a whole. It is important to note that these calculations take into account the variability within a unit's data as well as the number ofresponses (n) represented by the unit's mean score. Items having less variability or a greater number of responses are more likely to show significantdifferences from the facility's mean score. If 30 or more questionnaires were returned for this unit, questions representing its top ten priorities (basedon this unit's Internal Priority Index) will appear in bold italics; superscripts indicate the priority number.
Last ThisOverall Mean Period Period Facility
Section Score n=61 n=73 Mean Internaln Question Trend Mean Change Mean Score Rating
Overall Radiology - Hospital Rating 90.9 +0.7 91.6 93.1
Overall Radiology - Hospital Rating †† 90.9 +0.7 91.6 93.2
Registration 91.7 -0.6 91.1 92.7
71 Helpfulness of registration person 92.6 +0.7 93.3 93.8
73 Ease of the registration process 93.2 -1.1 92.1 93.5
73 Waiting time in registration 7 90.3 -2.3 88.0 90.8
Facility 89.6 -1.0 88.6 90.6
73 Comfort of waiting area 9 91.8 -1.4 90.4 91.0
72 Ease of finding your way around 86.2 -4.6 81.6 87.7
72 Cleanliness of facility 91.5 +2.6 94.1 93.2
Test or Treatment 91.5 +1.8 93.3 94.7
73 Friendliness of staff 92.5 +4.1 96.6 96.1
72 Explanations given by staff 4 91.7 +0.0 91.7 94.3
73 Skill of techs/therapists/nurses 95.3 -1.5 93.8 95.5
72 Staff concern for comfort 9 92.2 +2.2 94.4 94.8
72 Staff's concern/questions worries 8 89.7 +1.6 91.3 93.3
Personal Issues 90.2 +2.7 92.9 93.1
Personal Issues †† 90.3 +2.6 92.9 93.2
71 Our concern for privacy 93.1 +0.9 94.0 93.6
70 Our sensitivity to your needs 89.7 +3.2 92.9 92.9
62 Response to concerns/complaints 2 90.1 +1.8 91.9 92.7
63 Family able to participate decision † 2 91.4 +1.1 92.5 92.9
70 Staff explained roles in care † 91.7 +2.6 94.3 93.0
61 Staff supported family throughout † 5 91.3 +1.3 92.6 93.3
60 Staff respected having family with † 6 93.3 +0.9 94.2 94.0
63 Staff sensitivity to your needs † 1 90.7 +1.4 92.1 93.3
Overall Assessment 92.4 +2.2 94.6 94.8
71 Staff worked together provide care 93.0 +1.4 94.4 94.8
72 Overall rating of care 93.0 +2.5 95.5 95.2
71 Likelihood of recommending 92.7 +1.7 94.4 94.6
† Non-standard question
†† Includes non-standard questions
n Number of responsesNot significantly different from Facility mean score
Significantly lower than Facility mean score
Top ten priority (based on Internal Priority Index)
Find solutions, learn best practices, and networkFor an overview of how to interpret this report page,with colleagues in other health care organizationsclick or visit the following Web page:
https://www.pressganey.com/forumhttp://www.pressganey.com/gti/gti17.htm
67

Augusta University Medical Center 10/1/2016 - 12/31/2016
OUTPATIENT SERVICES REPORTOUTPATIENT SERVICES REPORT15.16.1 Mean Trend Analysis - Sleep Center
The broad light-colored columns show your Sleep Center unit's overall mean score, based on standard questions. One asterisk by a mean scoreindicates a statistically significant change from the previous period at the .05 level; two asterisks indicate a statistically significant change in meanscore at the .01 level. The narrow dark columns show your Sleep Center unit's overall score, based on all questions.
86 86
88 88
90 90
92 92
94 94
96 96
93.3n=35
1/1/153/31/15
90.1n=9
4/1/156/30/15
88.1n=57
1/1/163/31/16
93.4n=43
4/1/166/30/16
92.7n=49
7/1/169/30/16
90.5n=42
10/1/1612/31/16
15.16.2 Top Box Analysis - Sleep CenterOverall Very Poor Poor Fair Good Very Good
Section n n n n nn Question % % % % % % Very Good
707 Sleep Center 10 8 28 139 5221.4% 1.1% 4.0% 19.7% 73.8%
73.8
900 Sleep Center †† 15 11 35 169 6701.7% 1.2% 3.9% 18.8% 74.4%
74.4
n Number of responses This period "very good" percentage†† Includes non-standard questions
Standard Questions
All Questions
Find solutions, learn best practices, and networkwith colleagues in other health care organizations
https://www.pressganey.com/forumhttp://www.pressganey.com
68

Augusta University Medical Center 10/1/2016 - 12/31/2016
OUTPATIENT SERVICES REPORTOUTPATIENT SERVICES REPORT15.16.3 Question Analysis - Sleep Center
This section lists detailed information about individual question, section, and overall mean scores for the Sleep Center unit. Only units with seven ormore responses are reported. Significant changes in mean scores from the previous report period are marked with asterisks. The amount of changeis listed in the second column of data. Internal comparative data are provided on the right; external benchmarks are not available because units arepotentially unique to your facility. The "Internal Rating" column indicates whether each unit mean score is statistically different from the facility's as awhole. It is important to note that these calculations take into account the variability within a unit's data as well as the number of responses (n)represented by the unit's mean score. Items having less variability or a greater number of responses are more likely to show significant differencesfrom the facility's mean score. If 30 or more questionnaires were returned for this unit, questions representing its top ten priorities (based on thisunit's Internal Priority Index) will appear in bold italics; superscripts indicate the priority number.
Last ThisOverall Mean Period Period Facility
Section Score n=49 n=42 Mean Internaln Question Trend Mean Change Mean Score Rating
Overall Sleep Center Rating 92.7 -2.2 90.5 93.1
Overall Sleep Center Rating †† 92.8 -2.3 90.5 93.2
Registration 93.9 -3.4 90.5 92.7
42 Helpfulness of registration person 93.9 -1.6 92.3 93.8
42 Ease of the registration process 95.0 -3.9 91.1 93.5
42 Waiting time in registration 6 92.8 -4.7 88.1 90.8
Facility 91.4 -2.1 89.3 90.6
42 Comfort of waiting area 6 92.2 -1.7 90.5 91.0
42 Ease of finding your way around 6 88.8 -2.5 86.3 87.7
42 Cleanliness of facility 93.4 -2.3 91.1 93.2
Test or Treatment 94.1 -2.1 92.0 94.7
42 Friendliness of staff 93.9 -0.4 93.5 96.1
42 Explanations given by staff 4 96.9 -6.4 90.5* 94.3
42 Skill of techs/therapists/nurses 96.4 -4.1 92.3 95.5
42 Staff concern for comfort 92.9 -1.2 91.7 94.8
42 Staff's concern/questions worries 89.7 +2.6 92.3 93.3
Personal Issues 92.1 -1.0 91.1 93.1
Personal Issues †† 92.5 -1.7 90.8 93.2
41 Our concern for privacy 94.8 -3.3 91.5 93.6
41 Our sensitivity to your needs 93.6 -2.1 91.5 92.9
41 Response to concerns/complaints 10 90.4 -0.2 90.2 92.7
39 Family able to participate decision † 92.4 -1.4 91.0 92.9
41 Staff explained roles in care † 4 94.8 -3.9 90.9 93.0
36 Staff supported family throughout † 1 93.4 -3.8 89.6 93.3
38 Staff respected having family with † 94.9 -3.4 91.5 94.0
39 Staff sensitivity to your needs † 1 91.3 -1.6 89.7 93.3
Overall Assessment 93.2 -3.2 90.0 94.8
40 Staff worked together provide care 6 94.2 -3.6 90.6 94.8
41 Overall rating of care 3 93.8 -3.6 90.2 95.2
41 Likelihood of recommending 93.6 -2.7 90.9 94.6
* Significantly different at .05 level
† Non-standard question
†† Includes non-standard questions
n Number of responses
Not significantly different from Facility mean scoreTop ten priority (based on Internal Priority Index)
Find solutions, learn best practices, and networkFor an overview of how to interpret this report page,with colleagues in other health care organizationsclick or visit the following Web page:
https://www.pressganey.com/forumhttp://www.pressganey.com/gti/gti17.htm
69

Augusta University Medical Center 10/1/2016 - 12/31/2016
OUTPATIENT SERVICES REPORTOUTPATIENT SERVICES REPORT15.17.1 Mean Trend Analysis - Speech
The broad light-colored columns show your Speech unit's overall mean score, based on standard questions. One asterisk by a mean scoreindicates a statistically significant change from the previous period at the .05 level; two asterisks indicate a statistically significant change in meanscore at the .01 level. The narrow dark columns show your Speech unit's overall score, based on all questions.
90 90
92 92
94 94
96 96
98 98
100 100
93.2n=18
1/1/153/31/15
n=64/1/15
6/30/15
92.3n=26
1/1/163/31/16
98.6*n=19
4/1/166/30/16
94.3n=22
7/1/169/30/16
94.9n=33
10/1/1612/31/16
15.17.2 Top Box Analysis - SpeechOverall Very Poor Poor Fair Good Very Good
Section n n n n nn Question % % % % % % Very Good
555 Speech 1 2 17 61 4740.2% 0.4% 3.1% 11.0% 85.4%
85.4
712 Speech †† 1 3 20 80 6080.1% 0.4% 2.8% 11.2% 85.4%
85.4
n Number of responses This period "very good" percentage* Sig. different from previous period (p<.05)
†† Includes non-standard questions
Standard Questions
All Questions
Find solutions, learn best practices, and networkwith colleagues in other health care organizations
https://www.pressganey.com/forumhttp://www.pressganey.com
70

Augusta University Medical Center 10/1/2016 - 12/31/2016
OUTPATIENT SERVICES REPORTOUTPATIENT SERVICES REPORT15.17.3 Question Analysis - Speech
This section lists detailed information about individual question, section, and overall mean scores for the Speech unit. Only units with seven or moreresponses are reported. Significant changes in mean scores from the previous report period are marked with asterisks. The amount of change islisted in the second column of data. Internal comparative data are provided on the right; external benchmarks are not available because units arepotentially unique to your facility. The "Internal Rating" column indicates whether each unit mean score is statistically different from the facility's as awhole. It is important to note that these calculations take into account the variability within a unit's data as well as the number of responses (n)represented by the unit's mean score. Items having less variability or a greater number of responses are more likely to show significant differencesfrom the facility's mean score. If 30 or more questionnaires were returned for this unit, questions representing its top ten priorities (based on thisunit's Internal Priority Index) will appear in bold italics; superscripts indicate the priority number.
Last ThisOverall Mean Period Period Facility
Section Score n=22 n=33 Mean Internaln Question Trend Mean Change Mean Score Rating
Overall Speech Rating 94.3 +0.6 94.9 93.1
Overall Speech Rating †† 94.4 +0.6 95.0 93.2
Registration 94.4* +0.0 94.4 92.7
33 Helpfulness of registration person 95.2 +0.3 95.5 93.8
33 Ease of the registration process 95.2* +1.8 97.0 93.5
33 Waiting time in registration 92.5* -1.6 90.9 90.8
Facility 91.7 -1.3 90.4 90.6
33 Comfort of waiting area 3 93.2 -2.3 90.9 91.0
33 Ease of finding your way around 4 87.5 -1.1 86.4 87.7
33 Cleanliness of facility 5 94.3 -0.4 93.9 93.2
Test or Treatment 96.2 +1.1 97.3 94.7
33 Friendliness of staff 97.6 +1.6 99.2 96.1
33 Explanations given by staff 96.6 +1.1 97.7 94.3
33 Skill of techs/therapists/nurses 96.4 +1.3 97.7 95.5
33 Staff concern for comfort 96.6 +0.4 97.0 94.8
33 Staff's concern/questions worries 94.3 +0.4 94.7 93.3
Personal Issues 94.7 +0.4 95.1 93.1
Personal Issues †† 94.9 +0.6 95.5 93.2
31 Our concern for privacy 95.5 +1.3 96.8 93.6
32 Our sensitivity to your needs 1 94.3 -0.5 93.8 92.9
31 Response to concerns/complaints 7 94.7 +1.3 96.0 92.7
33 Family able to participate decision † 93.4 +2.1 95.5 92.9
33 Staff explained roles in care † 9 95.5 -2.3 93.2 93.0
30 Staff supported family throughout † 2 96.1 -1.1 95.0 93.3
30 Staff respected having family with † 7 96.1 +1.4 97.5 94.0
31 Staff sensitivity to your needs † 5 95.0 +1.8 96.8 93.3
Overall Assessment 94.3 +3.2 97.5 94.8
32 Staff worked together provide care 9 94.3 +2.6 96.9 94.8
33 Overall rating of care 94.3 +3.4 97.7 95.2
33 Likelihood of recommending 94.3 +3.4 97.7 94.6
* Significantly different at .05 level
† Non-standard question
†† Includes non-standard questions
n Number of responsesSignificantly higher than Facility mean score
Not significantly different from Facility mean score
Top ten priority (based on Internal Priority Index)
Find solutions, learn best practices, and networkFor an overview of how to interpret this report page,with colleagues in other health care organizationsclick or visit the following Web page:
https://www.pressganey.com/forumhttp://www.pressganey.com/gti/gti17.htm
71
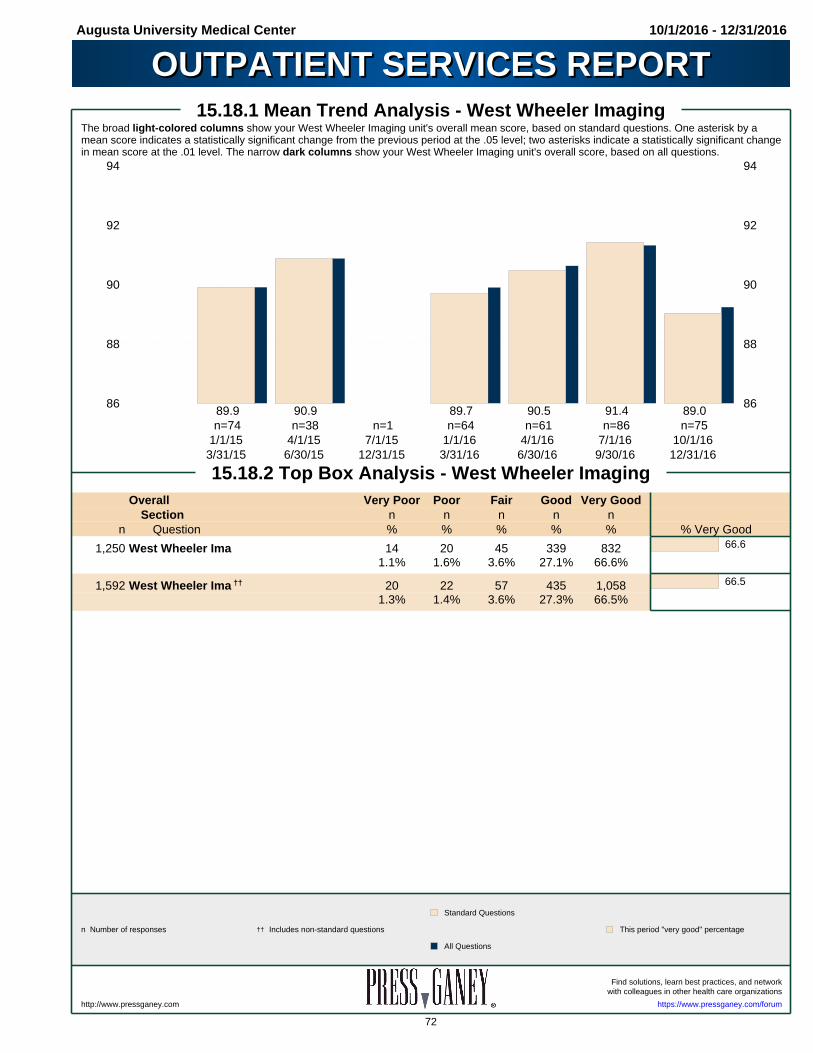
Augusta University Medical Center 10/1/2016 - 12/31/2016
OUTPATIENT SERVICES REPORTOUTPATIENT SERVICES REPORT15.18.1 Mean Trend Analysis - West Wheeler Imaging
The broad light-colored columns show your West Wheeler Imaging unit's overall mean score, based on standard questions. One asterisk by amean score indicates a statistically significant change from the previous period at the .05 level; two asterisks indicate a statistically significant changein mean score at the .01 level. The narrow dark columns show your West Wheeler Imaging unit's overall score, based on all questions.
86 86
88 88
90 90
92 92
94 94
89.9n=74
1/1/153/31/15
90.9n=38
4/1/156/30/15
n=17/1/15
12/31/15
89.7n=64
1/1/163/31/16
90.5n=61
4/1/166/30/16
91.4n=86
7/1/169/30/16
89.0n=75
10/1/1612/31/16
15.18.2 Top Box Analysis - West Wheeler ImagingOverall Very Poor Poor Fair Good Very Good
Section n n n n nn Question % % % % % % Very Good
1,250 West Wheeler Ima 14 20 45 339 8321.1% 1.6% 3.6% 27.1% 66.6%
66.6
1,592 West Wheeler Ima †† 20 22 57 435 1,0581.3% 1.4% 3.6% 27.3% 66.5%
66.5
n Number of responses This period "very good" percentage†† Includes non-standard questions
Standard Questions
All Questions
Find solutions, learn best practices, and networkwith colleagues in other health care organizations
https://www.pressganey.com/forumhttp://www.pressganey.com
72
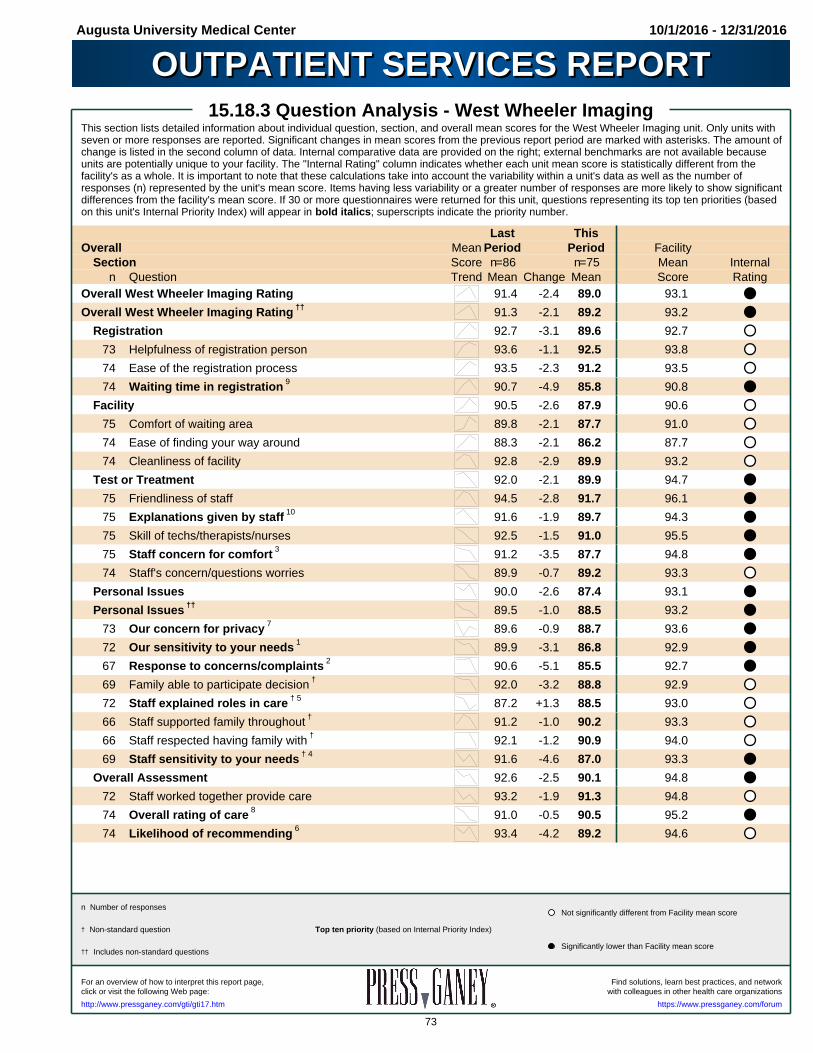
Augusta University Medical Center 10/1/2016 - 12/31/2016
OUTPATIENT SERVICES REPORTOUTPATIENT SERVICES REPORT15.18.3 Question Analysis - West Wheeler Imaging
This section lists detailed information about individual question, section, and overall mean scores for the West Wheeler Imaging unit. Only units withseven or more responses are reported. Significant changes in mean scores from the previous report period are marked with asterisks. The amount ofchange is listed in the second column of data. Internal comparative data are provided on the right; external benchmarks are not available becauseunits are potentially unique to your facility. The "Internal Rating" column indicates whether each unit mean score is statistically different from thefacility's as a whole. It is important to note that these calculations take into account the variability within a unit's data as well as the number ofresponses (n) represented by the unit's mean score. Items having less variability or a greater number of responses are more likely to show significantdifferences from the facility's mean score. If 30 or more questionnaires were returned for this unit, questions representing its top ten priorities (basedon this unit's Internal Priority Index) will appear in bold italics; superscripts indicate the priority number.
Last ThisOverall Mean Period Period Facility
Section Score n=86 n=75 Mean Internaln Question Trend Mean Change Mean Score Rating
Overall West Wheeler Imaging Rating 91.4 -2.4 89.0 93.1
Overall West Wheeler Imaging Rating †† 91.3 -2.1 89.2 93.2
Registration 92.7 -3.1 89.6 92.7
73 Helpfulness of registration person 93.6 -1.1 92.5 93.8
74 Ease of the registration process 93.5 -2.3 91.2 93.5
74 Waiting time in registration 9 90.7 -4.9 85.8 90.8
Facility 90.5 -2.6 87.9 90.6
75 Comfort of waiting area 89.8 -2.1 87.7 91.0
74 Ease of finding your way around 88.3 -2.1 86.2 87.7
74 Cleanliness of facility 92.8 -2.9 89.9 93.2
Test or Treatment 92.0 -2.1 89.9 94.7
75 Friendliness of staff 94.5 -2.8 91.7 96.1
75 Explanations given by staff 10 91.6 -1.9 89.7 94.3
75 Skill of techs/therapists/nurses 92.5 -1.5 91.0 95.5
75 Staff concern for comfort 3 91.2 -3.5 87.7 94.8
74 Staff's concern/questions worries 89.9 -0.7 89.2 93.3
Personal Issues 90.0 -2.6 87.4 93.1
Personal Issues †† 89.5 -1.0 88.5 93.2
73 Our concern for privacy 7 89.6 -0.9 88.7 93.6
72 Our sensitivity to your needs 1 89.9 -3.1 86.8 92.9
67 Response to concerns/complaints 2 90.6 -5.1 85.5 92.7
69 Family able to participate decision † 92.0 -3.2 88.8 92.9
72 Staff explained roles in care † 5 87.2 +1.3 88.5 93.0
66 Staff supported family throughout † 91.2 -1.0 90.2 93.3
66 Staff respected having family with † 92.1 -1.2 90.9 94.0
69 Staff sensitivity to your needs † 4 91.6 -4.6 87.0 93.3
Overall Assessment 92.6 -2.5 90.1 94.8
72 Staff worked together provide care 93.2 -1.9 91.3 94.8
74 Overall rating of care 8 91.0 -0.5 90.5 95.2
74 Likelihood of recommending 6 93.4 -4.2 89.2 94.6
† Non-standard question
†† Includes non-standard questions
n Number of responsesNot significantly different from Facility mean score
Significantly lower than Facility mean score
Top ten priority (based on Internal Priority Index)
Find solutions, learn best practices, and networkFor an overview of how to interpret this report page,with colleagues in other health care organizationsclick or visit the following Web page:
https://www.pressganey.com/forumhttp://www.pressganey.com/gti/gti17.htm
73

Augusta University Medical Center 10/1/2016 - 12/31/2016
OUTPATIENT SERVICES REPORTOUTPATIENT SERVICES REPORT15.19.1 Mean Trend Analysis - West Wheeler Occupational
The broad light-colored columns show your West Wheeler Occupational unit's overall mean score, based on standard questions. One asterisk by amean score indicates a statistically significant change from the previous period at the .05 level; two asterisks indicate a statistically significant changein mean score at the .01 level. The narrow dark columns show your West Wheeler Occupational unit's overall score, based on all questions.
86 86
88 88
90 90
92 92
94 94
96 96
98 98
100 100
n=41/1/15
3/31/15
n=24/1/15
6/30/15
96.3n=17
1/1/163/31/16
91.6n=27
4/1/166/30/16
97.0n=23
7/1/169/30/16
89.1*n=22
10/1/1612/31/16
15.19.2 Top Box Analysis - West Wheeler OccupationalOverall Very Poor Poor Fair Good Very Good
Section n n n n nn Question % % % % % % Very Good
370 West Wheeler Occ 4 4 25 76 2611.1% 1.1% 6.8% 20.5% 70.5%
70.5
464 West Wheeler Occ †† 4 4 33 96 3270.9% 0.9% 7.1% 20.7% 70.5%
70.5
n Number of responses This period "very good" percentage* Sig. different from previous period (p<.05)
†† Includes non-standard questions
Standard Questions
All Questions
Find solutions, learn best practices, and networkwith colleagues in other health care organizations
https://www.pressganey.com/forumhttp://www.pressganey.com
74
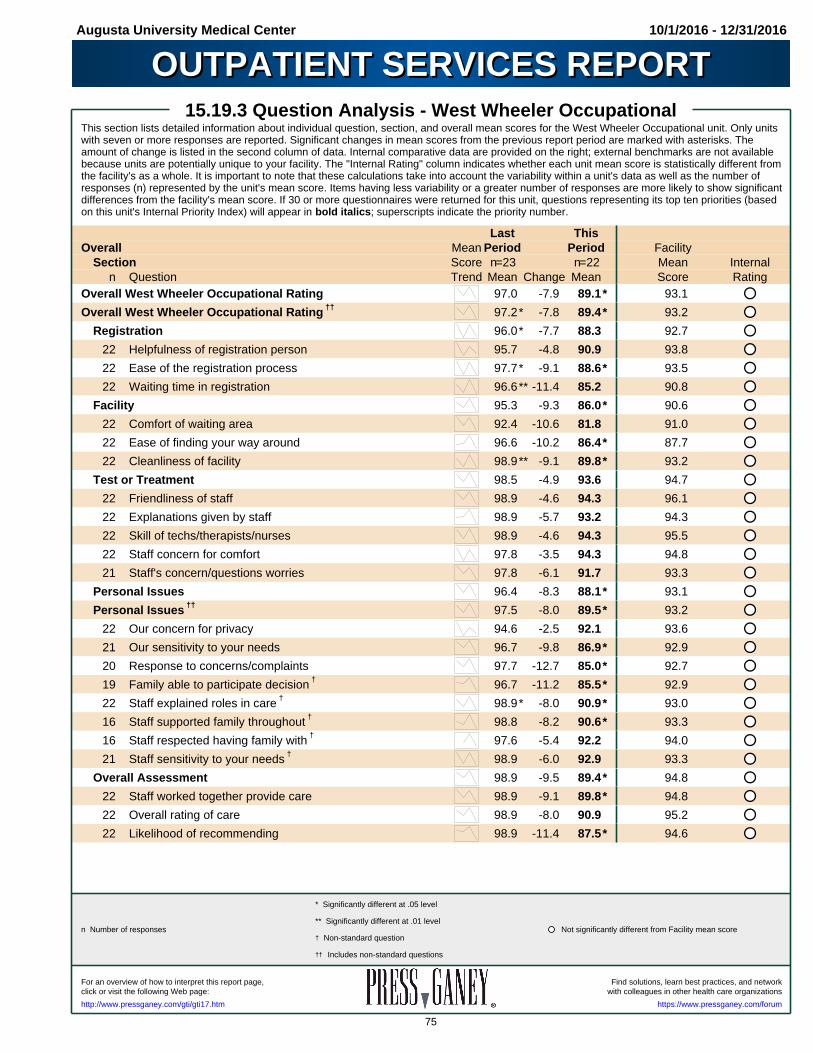
Augusta University Medical Center 10/1/2016 - 12/31/2016
OUTPATIENT SERVICES REPORTOUTPATIENT SERVICES REPORT15.19.3 Question Analysis - West Wheeler Occupational
This section lists detailed information about individual question, section, and overall mean scores for the West Wheeler Occupational unit. Only unitswith seven or more responses are reported. Significant changes in mean scores from the previous report period are marked with asterisks. Theamount of change is listed in the second column of data. Internal comparative data are provided on the right; external benchmarks are not availablebecause units are potentially unique to your facility. The "Internal Rating" column indicates whether each unit mean score is statistically different fromthe facility's as a whole. It is important to note that these calculations take into account the variability within a unit's data as well as the number ofresponses (n) represented by the unit's mean score. Items having less variability or a greater number of responses are more likely to show significantdifferences from the facility's mean score. If 30 or more questionnaires were returned for this unit, questions representing its top ten priorities (basedon this unit's Internal Priority Index) will appear in bold italics; superscripts indicate the priority number.
Last ThisOverall Mean Period Period Facility
Section Score n=23 n=22 Mean Internaln Question Trend Mean Change Mean Score Rating
Overall West Wheeler Occupational Rating 97.0 -7.9 89.1* 93.1
Overall West Wheeler Occupational Rating †† 97.2* -7.8 89.4* 93.2
Registration 96.0* -7.7 88.3 92.7
22 Helpfulness of registration person 95.7 -4.8 90.9 93.8
22 Ease of the registration process 97.7* -9.1 88.6* 93.5
22 Waiting time in registration 96.6** -11.4 85.2 90.8
Facility 95.3 -9.3 86.0* 90.6
22 Comfort of waiting area 92.4 -10.6 81.8 91.0
22 Ease of finding your way around 96.6 -10.2 86.4* 87.7
22 Cleanliness of facility 98.9** -9.1 89.8* 93.2
Test or Treatment 98.5 -4.9 93.6 94.7
22 Friendliness of staff 98.9 -4.6 94.3 96.1
22 Explanations given by staff 98.9 -5.7 93.2 94.3
22 Skill of techs/therapists/nurses 98.9 -4.6 94.3 95.5
22 Staff concern for comfort 97.8 -3.5 94.3 94.8
21 Staff's concern/questions worries 97.8 -6.1 91.7 93.3
Personal Issues 96.4 -8.3 88.1* 93.1
Personal Issues †† 97.5 -8.0 89.5* 93.2
22 Our concern for privacy 94.6 -2.5 92.1 93.6
21 Our sensitivity to your needs 96.7 -9.8 86.9* 92.9
20 Response to concerns/complaints 97.7 -12.7 85.0* 92.7
19 Family able to participate decision † 96.7 -11.2 85.5* 92.9
22 Staff explained roles in care † 98.9* -8.0 90.9* 93.0
16 Staff supported family throughout † 98.8 -8.2 90.6* 93.3
16 Staff respected having family with † 97.6 -5.4 92.2 94.0
21 Staff sensitivity to your needs † 98.9 -6.0 92.9 93.3
Overall Assessment 98.9 -9.5 89.4* 94.8
22 Staff worked together provide care 98.9 -9.1 89.8* 94.8
22 Overall rating of care 98.9 -8.0 90.9 95.2
22 Likelihood of recommending 98.9 -11.4 87.5* 94.6
n Number of responses Not significantly different from Facility mean score
* Significantly different at .05 level
** Significantly different at .01 level
† Non-standard question
†† Includes non-standard questions
Find solutions, learn best practices, and networkFor an overview of how to interpret this report page,with colleagues in other health care organizationsclick or visit the following Web page:
https://www.pressganey.com/forumhttp://www.pressganey.com/gti/gti17.htm
75

Augusta University Medical Center 10/1/2016 - 12/31/2016
OUTPATIENT SERVICES REPORTOUTPATIENT SERVICES REPORT15.20.1 Mean Trend Analysis - West Wheeler Physical The
The broad light-colored columns show your West Wheeler Physical The unit's overall mean score, based on standard questions. One asterisk by amean score indicates a statistically significant change from the previous period at the .05 level; two asterisks indicate a statistically significant changein mean score at the .01 level. The narrow dark columns show your West Wheeler Physical The unit's overall score, based on all questions.
88 88
90 90
92 92
94 94
96 96
98 98
91.0n=11
1/1/153/31/15
n=34/1/15
6/30/15
92.7n=53
1/1/163/31/16
93.5n=36
4/1/166/30/16
95.0n=37
7/1/169/30/16
95.8n=54
10/1/1612/31/16
15.20.2 Top Box Analysis - West Wheeler Physical TheOverall Very Poor Poor Fair Good Very Good
Section n n n n nn Question % % % % % % Very Good
913 West Wheeler Phy 0 0 9 130 7740.0% 0.0% 1.0% 14.2% 84.8%
84.8
1,145 West Wheeler Phy †† 0 0 11 167 9670.0% 0.0% 1.0% 14.6% 84.5%
84.5
n Number of responses This period "very good" percentage†† Includes non-standard questions
Standard Questions
All Questions
Find solutions, learn best practices, and networkwith colleagues in other health care organizations
https://www.pressganey.com/forumhttp://www.pressganey.com
76

Augusta University Medical Center 10/1/2016 - 12/31/2016
OUTPATIENT SERVICES REPORTOUTPATIENT SERVICES REPORT15.20.3 Question Analysis - West Wheeler Physical The
This section lists detailed information about individual question, section, and overall mean scores for the West Wheeler Physical The unit. Only unitswith seven or more responses are reported. Significant changes in mean scores from the previous report period are marked with asterisks. Theamount of change is listed in the second column of data. Internal comparative data are provided on the right; external benchmarks are not availablebecause units are potentially unique to your facility. The "Internal Rating" column indicates whether each unit mean score is statistically different fromthe facility's as a whole. It is important to note that these calculations take into account the variability within a unit's data as well as the number ofresponses (n) represented by the unit's mean score. Items having less variability or a greater number of responses are more likely to show significantdifferences from the facility's mean score. If 30 or more questionnaires were returned for this unit, questions representing its top ten priorities (basedon this unit's Internal Priority Index) will appear in bold italics; superscripts indicate the priority number.
Last ThisOverall Mean Period Period Facility
Section Score n=37 n=54 Mean Internaln Question Trend Mean Change Mean Score Rating
Overall West Wheeler Physical The Rating 95.0 +0.8 95.8 93.1
Overall West Wheeler Physical The Rating †† 95.2 +0.7 95.9 93.2
Registration 92.8 +3.5 96.3 92.7
54 Helpfulness of registration person 93.9 +2.9 96.8 93.8
53 Ease of the registration process 93.6 +3.1 96.7 93.5
53 Waiting time in registration 91.0 +4.3 95.3 90.8
Facility 93.1 +0.4 93.5 90.6
54 Comfort of waiting area 91.9 -0.7 91.2 91.0
54 Ease of finding your way around 7 93.6 -0.1 93.5 87.7
53 Cleanliness of facility 3 94.4 +1.8 96.2 93.2
Test or Treatment 97.7 -0.6 97.1 94.7
54 Friendliness of staff 98.0 -0.3 97.7 96.1
54 Explanations given by staff 97.2 -0.9 96.3 94.3
54 Skill of techs/therapists/nurses 97.9 -0.2 97.7 95.5
54 Staff concern for comfort 97.9 +0.3 98.2 94.8
53 Staff's concern/questions worries 97.2 -1.4 95.8 93.3
Personal Issues 93.8 +1.4 95.2 93.1
Personal Issues †† 94.7 +1.0 95.7 93.2
53 Our concern for privacy 10 93.2 +1.1 94.3 93.6
54 Our sensitivity to your needs 6 93.1 +2.7 95.8 92.9
54 Response to concerns/complaints 5 95.5 -0.1 95.4 92.7
48 Family able to participate decision † 1 93.4 +0.9 94.3 92.9
50 Staff explained roles in care † 2 96.5 -0.5 96.0 93.0
40 Staff supported family throughout † 7 92.6 +2.4 95.0 93.3
42 Staff respected having family with † 3 94.6 +1.2 95.8 94.0
52 Staff sensitivity to your needs † 7 96.5 +0.1 96.6 93.3
Overall Assessment 97.5 -0.7 96.8 94.8
54 Staff worked together provide care 97.2 -0.4 96.8 94.8
54 Overall rating of care 98.0 -1.2 96.8 95.2
54 Likelihood of recommending 97.3 -0.5 96.8 94.6
† Non-standard question
†† Includes non-standard questions
n Number of responsesSignificantly higher than Facility mean score
Not significantly different from Facility mean score
Top ten priority (based on Internal Priority Index)
Find solutions, learn best practices, and networkFor an overview of how to interpret this report page,with colleagues in other health care organizationsclick or visit the following Web page:
https://www.pressganey.com/forumhttp://www.pressganey.com/gti/gti17.htm
77
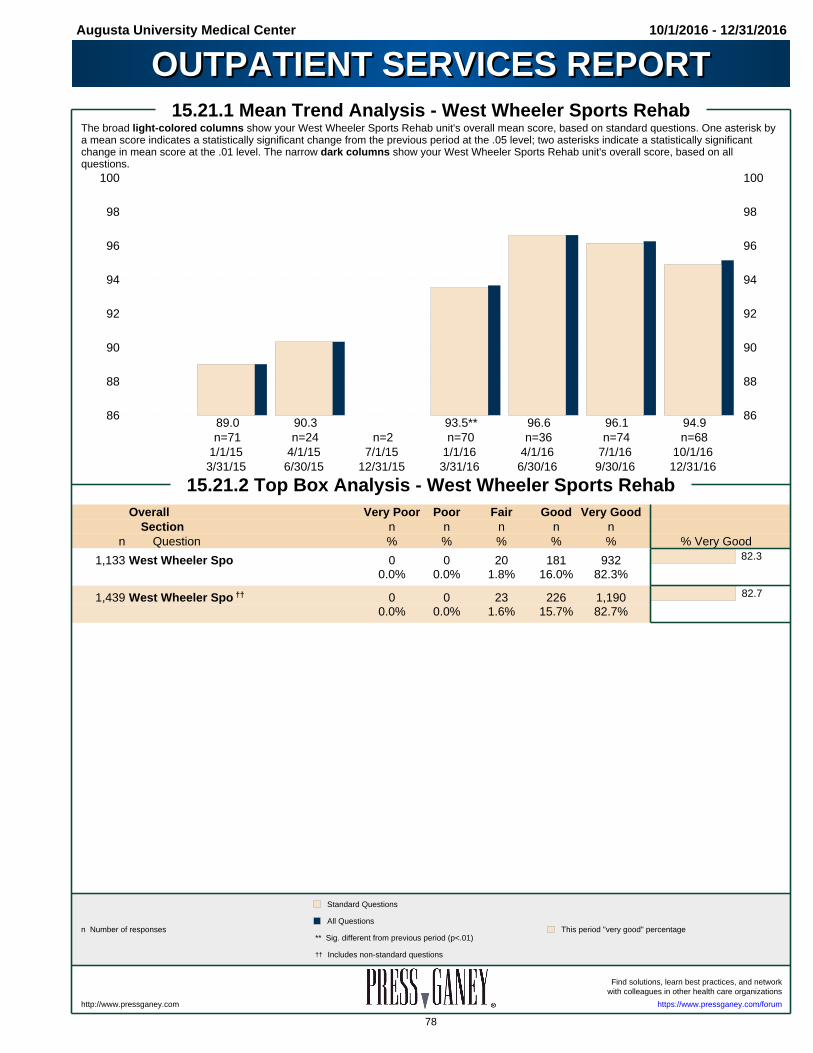
Augusta University Medical Center 10/1/2016 - 12/31/2016
OUTPATIENT SERVICES REPORTOUTPATIENT SERVICES REPORT15.21.1 Mean Trend Analysis - West Wheeler Sports Rehab
The broad light-colored columns show your West Wheeler Sports Rehab unit's overall mean score, based on standard questions. One asterisk bya mean score indicates a statistically significant change from the previous period at the .05 level; two asterisks indicate a statistically significantchange in mean score at the .01 level. The narrow dark columns show your West Wheeler Sports Rehab unit's overall score, based on allquestions.
86 86
88 88
90 90
92 92
94 94
96 96
98 98
100 100
89.0n=71
1/1/153/31/15
90.3n=24
4/1/156/30/15
n=27/1/15
12/31/15
93.5**n=70
1/1/163/31/16
96.6n=36
4/1/166/30/16
96.1n=74
7/1/169/30/16
94.9n=68
10/1/1612/31/16
15.21.2 Top Box Analysis - West Wheeler Sports RehabOverall Very Poor Poor Fair Good Very Good
Section n n n n nn Question % % % % % % Very Good
1,133 West Wheeler Spo 0 0 20 181 9320.0% 0.0% 1.8% 16.0% 82.3%
82.3
1,439 West Wheeler Spo †† 0 0 23 226 1,1900.0% 0.0% 1.6% 15.7% 82.7%
82.7
n Number of responses This period "very good" percentage** Sig. different from previous period (p<.01)
†† Includes non-standard questions
Standard Questions
All Questions
Find solutions, learn best practices, and networkwith colleagues in other health care organizations
https://www.pressganey.com/forumhttp://www.pressganey.com
78

Augusta University Medical Center 10/1/2016 - 12/31/2016
OUTPATIENT SERVICES REPORTOUTPATIENT SERVICES REPORT15.21.3 Question Analysis - West Wheeler Sports Rehab
This section lists detailed information about individual question, section, and overall mean scores for the West Wheeler Sports Rehab unit. Only unitswith seven or more responses are reported. Significant changes in mean scores from the previous report period are marked with asterisks. Theamount of change is listed in the second column of data. Internal comparative data are provided on the right; external benchmarks are not availablebecause units are potentially unique to your facility. The "Internal Rating" column indicates whether each unit mean score is statistically different fromthe facility's as a whole. It is important to note that these calculations take into account the variability within a unit's data as well as the number ofresponses (n) represented by the unit's mean score. Items having less variability or a greater number of responses are more likely to show significantdifferences from the facility's mean score. If 30 or more questionnaires were returned for this unit, questions representing its top ten priorities (basedon this unit's Internal Priority Index) will appear in bold italics; superscripts indicate the priority number.
Last ThisOverall Mean Period Period Facility
Section Score n=74 n=68 Mean Internaln Question Trend Mean Change Mean Score Rating
Overall West Wheeler Sports Rehab Rating 96.1 -1.2 94.9 93.1
Overall West Wheeler Sports Rehab Rating †† 96.2 -1.1 95.1 93.2
Registration 94.9 -0.9 94.0 92.7
68 Helpfulness of registration person 3 95.3 -1.2 94.1 93.8
66 Ease of the registration process 7 95.5 -1.6 93.9 93.5
67 Waiting time in registration 94.4 +0.0 94.4 90.8
Facility 96.0 -3.2 92.8 90.6
68 Comfort of waiting area 8 94.6 -4.2 90.4 91.0
67 Ease of finding your way around 9 95.3 -2.0 93.3 87.7
68 Cleanliness of facility 98.0 -2.8 95.2 93.2
Test or Treatment 97.3 -0.8 96.5 94.7
68 Friendliness of staff 97.6 +0.2 97.8 96.1
67 Explanations given by staff 6 97.0 -1.1 95.9 94.3
68 Skill of techs/therapists/nurses 5 98.3 -2.3 96.0 95.5
68 Staff concern for comfort 97.3 -0.2 97.1 94.8
65 Staff's concern/questions worries 9 96.2 +0.0 96.2 93.3
Personal Issues 95.8 -1.8 94.0 93.1
Personal Issues †† 96.4 -1.2 95.2 93.2
67 Our concern for privacy 95.9 -3.4 92.5 93.6
66 Our sensitivity to your needs 4 95.3 -0.2 95.1 92.9
63 Response to concerns/complaints 1 96.6 -2.2 94.4 92.7
60 Family able to participate decision † 2 96.2 -1.2 95.0 92.9
67 Staff explained roles in care † 9 95.6 -0.1 95.5 93.0
56 Staff supported family throughout † 97.5 -1.1 96.4 93.3
59 Staff respected having family with † 97.9 -1.7 96.2 94.0
64 Staff sensitivity to your needs † 96.5 -0.4 96.1 93.3
Overall Assessment 96.6 +0.4 97.0 94.8
65 Staff worked together provide care 96.5 +0.4 96.9 94.8
66 Overall rating of care 96.3 +0.7 97.0 95.2
66 Likelihood of recommending 96.9 +0.1 97.0 94.6
† Non-standard question
†† Includes non-standard questions
n Number of responsesSignificantly higher than Facility mean score
Not significantly different from Facility mean score
Top ten priority (based on Internal Priority Index)
Find solutions, learn best practices, and networkFor an overview of how to interpret this report page,with colleagues in other health care organizationsclick or visit the following Web page:
https://www.pressganey.com/forumhttp://www.pressganey.com/gti/gti17.htm
79
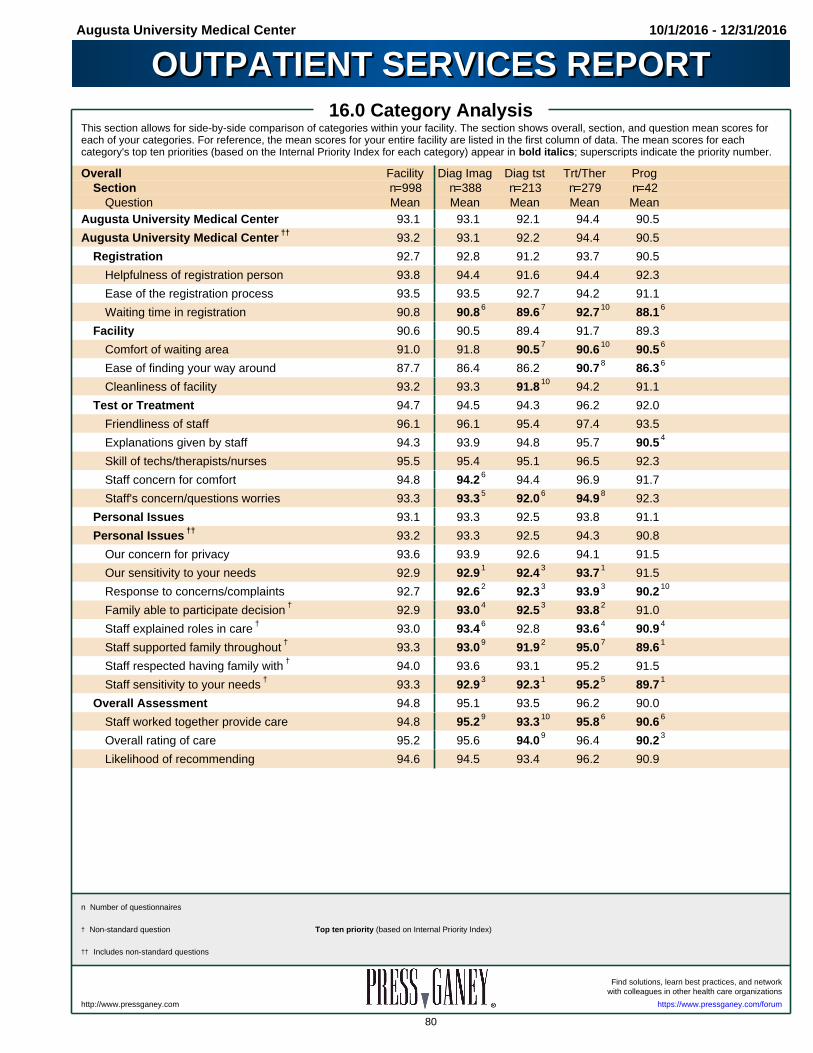
Augusta University Medical Center 10/1/2016 - 12/31/2016
OUTPATIENT SERVICES REPORTOUTPATIENT SERVICES REPORT16.0 Category Analysis
This section allows for side-by-side comparison of categories within your facility. The section shows overall, section, and question mean scores foreach of your categories. For reference, the mean scores for your entire facility are listed in the first column of data. The mean scores for eachcategory's top ten priorities (based on the Internal Priority Index for each category) appear in bold italics; superscripts indicate the priority number. Overall Facility Diag Imag Diag tst Trt/Ther Prog
Section n=998 n=388 n=213 n=279 n=42Question Mean Mean Mean Mean Mean
Augusta University Medical Center 93.1 93.1 92.1 94.4 90.5
Augusta University Medical Center †† 93.2 93.1 92.2 94.4 90.5
Registration 92.7 92.8 91.2 93.7 90.5
Helpfulness of registration person 93.8 94.4 91.6 94.4 92.3
Ease of the registration process 93.5 93.5 92.7 94.2 91.1
Waiting time in registration 90.8 90.8 6 89.6 7 92.7 10 88.1 6
Facility 90.6 90.5 89.4 91.7 89.3
Comfort of waiting area 91.0 91.8 90.5 7 90.6 10 90.5 6
Ease of finding your way around 87.7 86.4 86.2 90.7 8 86.3 6
Cleanliness of facility 93.2 93.3 91.8 10 94.2 91.1
Test or Treatment 94.7 94.5 94.3 96.2 92.0
Friendliness of staff 96.1 96.1 95.4 97.4 93.5
Explanations given by staff 94.3 93.9 94.8 95.7 90.5 4
Skill of techs/therapists/nurses 95.5 95.4 95.1 96.5 92.3
Staff concern for comfort 94.8 94.2 6 94.4 96.9 91.7
Staff's concern/questions worries 93.3 93.3 5 92.0 6 94.9 8 92.3
Personal Issues 93.1 93.3 92.5 93.8 91.1
Personal Issues †† 93.2 93.3 92.5 94.3 90.8
Our concern for privacy 93.6 93.9 92.6 94.1 91.5
Our sensitivity to your needs 92.9 92.9 1 92.4 3 93.7 1 91.5
Response to concerns/complaints 92.7 92.6 2 92.3 3 93.9 3 90.2 10
Family able to participate decision † 92.9 93.0 4 92.5 3 93.8 2 91.0
Staff explained roles in care † 93.0 93.4 6 92.8 93.6 4 90.9 4
Staff supported family throughout † 93.3 93.0 9 91.9 2 95.0 7 89.6 1
Staff respected having family with † 94.0 93.6 93.1 95.2 91.5
Staff sensitivity to your needs † 93.3 92.9 3 92.3 1 95.2 5 89.7 1
Overall Assessment 94.8 95.1 93.5 96.2 90.0
Staff worked together provide care 94.8 95.2 9 93.3 10 95.8 6 90.6 6
Overall rating of care 95.2 95.6 94.0 9 96.4 90.2 3
Likelihood of recommending 94.6 94.5 93.4 96.2 90.9
† Non-standard question
†† Includes non-standard questions
n Number of questionnaires
Top ten priority (based on Internal Priority Index)
Find solutions, learn best practices, and networkwith colleagues in other health care organizations
https://www.pressganey.com/forumhttp://www.pressganey.com
80

Augusta University Medical Center 10/1/2016 - 12/31/2016
OUTPATIENT SERVICES REPORTOUTPATIENT SERVICES REPORTCAT:DIAG IMAGE
17.1 Service AnalysisThis section allows for side-by-side comparison of services within your facility. The section shows overall, section, and question mean scores foreach of your services. For reference, the mean scores for your entire facility are listed in the first column of data. The mean scores for each service'stop ten priorities (based on the Internal Priority Index for each service) appear in bold italics; superscripts indicate the priority number. Overall Facility Mammo Radiolgy Ultra X-Ray
Section n=388 n=104 n=194 n=15 n=75Question Mean Mean Mean Mean Mean
Augusta University Medical Center 93.1 96.2 93.0 94.5 89.0
Augusta University Medical Center †† 93.1 96.1 93.0 94.3 89.2
Registration 92.8 96.4 92.1 93.3 89.6
Helpfulness of registration person 94.4 97.6 93.3 10 95.0 92.5
Ease of the registration process 93.5 96.5 92.5 3 96.7 91.2
Waiting time in registration 90.8 95.5 90.5 3 88.3 85.8 9
Facility 90.5 94.8 89.1 92.2 87.9
Comfort of waiting area 91.8 96.3 90.9 6 93.3 87.7
Ease of finding your way around 86.4 91.9 10 83.3 90.0 86.2
Cleanliness of facility 93.3 96.1 93.2 93.3 89.9
Test or Treatment 94.5 96.8 95.0 95.3 89.9
Friendliness of staff 96.1 97.8 96.9 94.6 91.7
Explanations given by staff 93.9 96.8 94.0 95.0 89.7 10
Skill of techs/therapists/nurses 95.4 98.3 95.5 98.3 91.0
Staff concern for comfort 94.2 96.3 95.4 96.7 87.7 3
Staff's concern/questions worries 93.3 96.2 93.6 6 91.7 89.2
Personal Issues 93.3 95.8 94.1 95.6 87.4
Personal Issues †† 93.3 95.5 94.0 94.4 88.5
Our concern for privacy 93.9 95.6 3 94.7 96.7 88.7 7
Our sensitivity to your needs 92.9 95.8 6 93.6 1 95.0 86.8 1
Response to concerns/complaints 92.6 95.4 2 93.7 10 95.0 85.5 2
Family able to participate decision † 93.0 94.9 4 93.9 6 92.9 88.8
Staff explained roles in care † 93.4* 95.1 4 94.5 91.7 88.5 5
Staff supported family throughout † 93.0 93.9 7 93.4 2 96.2 90.2
Staff respected having family with † 93.6 93.9 1 94.2 6 96.2 90.9
Staff sensitivity to your needs † 92.9 95.9 7 93.9 10 92.9 87.0 4
Overall Assessment 95.1 97.7 95.5 96.1 90.1
Staff worked together provide care 95.2 97.5 9 95.4 5 96.7 91.3
Overall rating of care 95.6* 98.0 96.5 95.0 90.5 8
Likelihood of recommending 94.5 97.4 95.0 96.7 89.2 6
* Significantly different at .05 level
† Non-standard question
†† Includes non-standard questions
n Number of questionnaires
Top ten priority (based on Internal Priority Index)
Find solutions, learn best practices, and networkFor an overview of how to interpret this report page,with colleagues in other health care organizationsclick or visit the following Web page:
https://www.pressganey.com/forumhttp://www.pressganey.com/gti/gti20.htm
81

Augusta University Medical Center 10/1/2016 - 12/31/2016
OUTPATIENT SERVICES REPORTOUTPATIENT SERVICES REPORTCAT:DIAG IMAGE
17.2 Question AnalysisThis section lists detailed information about your individual question, section, and overall scores. Only criteria with seven or more responses arereported. Significant changes in mean scores from the previous report period are marked with asterisks. The amount of change is listed in the secondcolumn of data. Questions appearing in bold italics are among your facility's top ten priorities (based on your Internal Priority Index); superscriptsindicate the priority number. Comparative data are provided on the right. To ensure confidentiality, data for questions are provided only when thequestions are asked by seven or more facilities. Greater than (>) and less than (<) symbols are used to flag mean scores that fall above or below apeer group's mean score by one or two standard deviations. Percentile ranks describe where you stand in relation to other facilities in a peer group.In electronic reports, percentile ranks lower than 50 are colored red and those higher than 50 are colored blue.
Last This All AHA COTHOverall Mean Period Period Facility DB Region 4 Peer Group
Section Score n=315 n=388 N=1077 N=199 N=14n Question Trend Mean Change Mean Mean Rank Mean Rank Mean Rank
Overall Facility Rating 92.2 +0.9 93.1 93.4 38 93.7 34 93.3 41
Overall Facility Rating †† 92.2 +0.9 93.1
Registration 92.7 +0.1 92.8 92.5 52 92.6 48 92.7 47
382 Helpfulness of registration person 93.5 +0.9 94.4 93.7 58 94.1 49 93.7 67
381 Ease of the registration process 93.2 +0.3 93.5 93.5 43 93.7 40 93.7 37
380 Waiting time in registration 6 91.2 -0.4 90.8 90.2 51 90.0 56 90.6 38
Facility 90.7* -0.2 90.5 91.3 33 91.8 27 90.4 46
385 Comfort of waiting area 91.1 +0.7 91.8 90.3 68 90.7 62 90.1 67
382 Ease of finding your way around 88.4* -2.0 86.4 89.7 16 < 90.6 12 87.3 39
383 Cleanliness of facility 92.6 +0.7 93.3 93.9 33 94.3 27 93.8 31
Test or Treatment 93.1 +1.4 94.5 95.2 25 95.6 17 95.0 18
386 Friendliness of staff 94.8 +1.3 96.1 96.3 34 96.6 28 96.3 24
383 Explanations given by staff 93.0 +0.9 93.9 94.8 25 95.2 18 94.6 13
384 Skill of techs/therapists/nurses 94.1 +1.3 95.4 95.8 32 96.3 25 95.7 27
383 Staff concern for comfort 6 93.3 +0.9 94.2 95.0 27 95.3 21 94.8 21
370 Staff's concern/questions worries 5 91.4 +1.9 93.3 94.5 21 94.9 16 93.8 25
Personal Issues 91.6 +1.7 93.3 93.6 37 93.8 34 93.6 35
Personal Issues †† 91.6 +1.7 93.3
374 Our concern for privacy 92.5 +1.4 93.9 94.0 42 94.2 39 94.1 34
367 Our sensitivity to your needs 1 91.5 +1.4 92.9 93.6 30 93.8 27 93.7 17
336 Response to concerns/complaints 2 91.6 +1.0 92.6 93.3 30 93.6 28 93.2 14
332 Family able to participate decision † 4 93.3 -0.3 93.0 N<7 N/A N<7 N/A N<7 N/A
362 Staff explained roles in care † 6 90.6 +2.8 93.4* 93.1 50 N<7 N/A N<7 N/A
316 Staff supported family throughout † 9 92.8 +0.2 93.0 N<7 N/A N<7 N/A N<7 N/A
314 Staff respected having family with † 93.4 +0.2 93.6 N<7 N/A N<7 N/A N<7 N/A
339 Staff sensitivity to your needs † 3 92.2 +0.7 92.9 N<7 N/A N<7 N/A N<7 N/A
Overall Assessment 93.5 +1.6 95.1 94.8 49 95.2 41 94.9 49
376 Staff worked together provide care 9 93.9 +1.3 95.2 94.7 57 95.1 50 94.8 51
378 Overall rating of care 93.2 +2.4 95.6* 95.2 56 95.5 51 95.4 56
375 Likelihood of recommending 93.9 +0.6 94.5 94.7 41 95.1 34 94.9 26
* Significantly different at .05 level< 1 standard deviation below peer group mean† Non-standard question†† Includes non-standard questions
n Number of responsesN Number of facilities in peer group
N<7 Fewer than 7 facilities
Top ten priority (based on Internal Priority Index)
Find solutions, learn best practices, and networkFor an overview of how to interpret this report page,with colleagues in other health care organizationsclick or visit the following Web page:
https://www.pressganey.com/forumhttp://www.pressganey.com/gti/gti4.htm
82
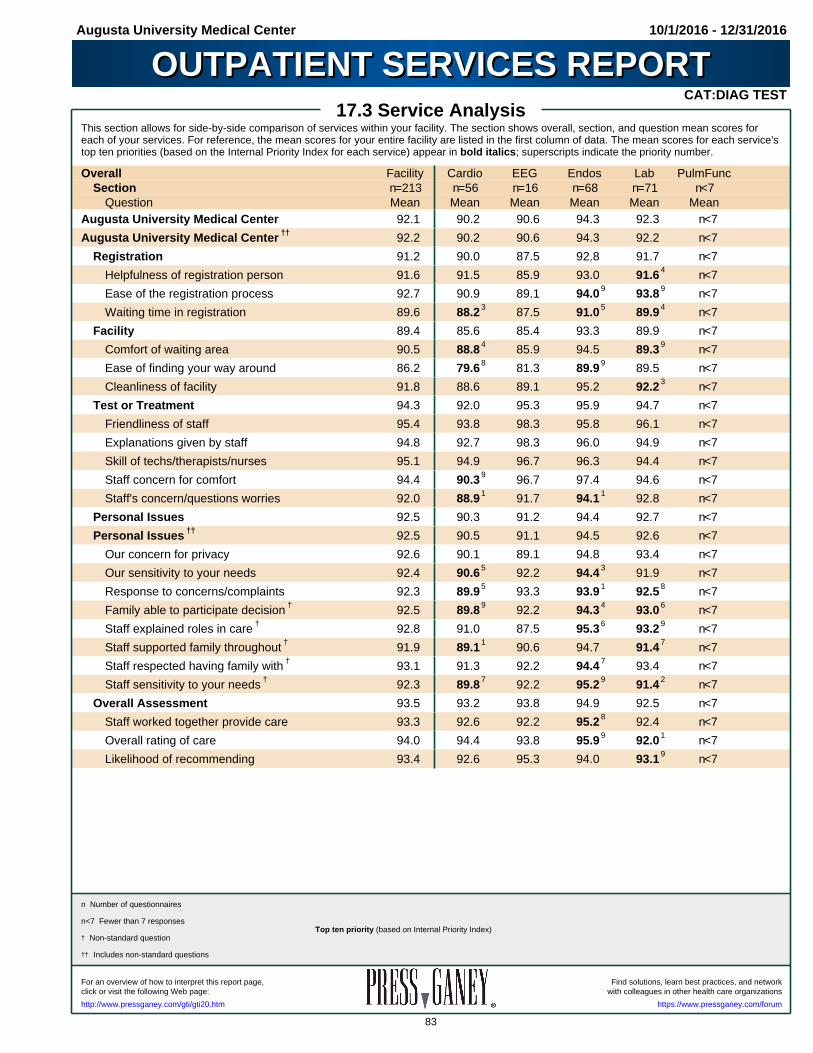
Augusta University Medical Center 10/1/2016 - 12/31/2016
OUTPATIENT SERVICES REPORTOUTPATIENT SERVICES REPORTCAT:DIAG TEST
17.3 Service AnalysisThis section allows for side-by-side comparison of services within your facility. The section shows overall, section, and question mean scores foreach of your services. For reference, the mean scores for your entire facility are listed in the first column of data. The mean scores for each service'stop ten priorities (based on the Internal Priority Index for each service) appear in bold italics; superscripts indicate the priority number. Overall Facility Cardio EEG Endos Lab PulmFunc
Section n=213 n=56 n=16 n=68 n=71 n<7Question Mean Mean Mean Mean Mean Mean
Augusta University Medical Center 92.1 90.2 90.6 94.3 92.3 n<7
Augusta University Medical Center †† 92.2 90.2 90.6 94.3 92.2 n<7
Registration 91.2 90.0 87.5 92.8 91.7 n<7
Helpfulness of registration person 91.6 91.5 85.9 93.0 91.6 4 n<7
Ease of the registration process 92.7 90.9 89.1 94.0 9 93.8 9 n<7
Waiting time in registration 89.6 88.2 3 87.5 91.0 5 89.9 4 n<7
Facility 89.4 85.6 85.4 93.3 89.9 n<7
Comfort of waiting area 90.5 88.8 4 85.9 94.5 89.3 9 n<7
Ease of finding your way around 86.2 79.6 8 81.3 89.9 9 89.5 n<7
Cleanliness of facility 91.8 88.6 89.1 95.2 92.2 3 n<7
Test or Treatment 94.3 92.0 95.3 95.9 94.7 n<7
Friendliness of staff 95.4 93.8 98.3 95.8 96.1 n<7
Explanations given by staff 94.8 92.7 98.3 96.0 94.9 n<7
Skill of techs/therapists/nurses 95.1 94.9 96.7 96.3 94.4 n<7
Staff concern for comfort 94.4 90.3 9 96.7 97.4 94.6 n<7
Staff's concern/questions worries 92.0 88.9 1 91.7 94.1 1 92.8 n<7
Personal Issues 92.5 90.3 91.2 94.4 92.7 n<7
Personal Issues †† 92.5 90.5 91.1 94.5 92.6 n<7
Our concern for privacy 92.6 90.1 89.1 94.8 93.4 n<7
Our sensitivity to your needs 92.4 90.6 5 92.2 94.4 3 91.9 n<7
Response to concerns/complaints 92.3 89.9 5 93.3 93.9 1 92.5 8 n<7
Family able to participate decision † 92.5 89.8 9 92.2 94.3 4 93.0 6 n<7
Staff explained roles in care † 92.8 91.0 87.5 95.3 6 93.2 9 n<7
Staff supported family throughout † 91.9 89.1 1 90.6 94.7 91.4 7 n<7
Staff respected having family with † 93.1 91.3 92.2 94.4 7 93.4 n<7
Staff sensitivity to your needs † 92.3 89.8 7 92.2 95.2 9 91.4 2 n<7
Overall Assessment 93.5 93.2 93.8 94.9 92.5 n<7
Staff worked together provide care 93.3 92.6 92.2 95.2 8 92.4 n<7
Overall rating of care 94.0 94.4 93.8 95.9 9 92.0 1 n<7
Likelihood of recommending 93.4 92.6 95.3 94.0 93.1 9 n<7
n<7 Fewer than 7 responses
† Non-standard question
†† Includes non-standard questions
n Number of questionnaires
Top ten priority (based on Internal Priority Index)
Find solutions, learn best practices, and networkFor an overview of how to interpret this report page,with colleagues in other health care organizationsclick or visit the following Web page:
https://www.pressganey.com/forumhttp://www.pressganey.com/gti/gti20.htm
83

Augusta University Medical Center 10/1/2016 - 12/31/2016
OUTPATIENT SERVICES REPORTOUTPATIENT SERVICES REPORTCAT:DIAG TEST
17.4 Question AnalysisThis section lists detailed information about your individual question, section, and overall scores. Only criteria with seven or more responses arereported. Significant changes in mean scores from the previous report period are marked with asterisks. The amount of change is listed in the secondcolumn of data. Questions appearing in bold italics are among your facility's top ten priorities (based on your Internal Priority Index); superscriptsindicate the priority number. Comparative data are provided on the right. To ensure confidentiality, data for questions are provided only when thequestions are asked by seven or more facilities. Greater than (>) and less than (<) symbols are used to flag mean scores that fall above or below apeer group's mean score by one or two standard deviations. Percentile ranks describe where you stand in relation to other facilities in a peer group.In electronic reports, percentile ranks lower than 50 are colored red and those higher than 50 are colored blue.
Last This All AHA COTHOverall Mean Period Period Facility DB Region 4 Peer Group
Section Score n=230 n=213 N=909 N=173 N=14n Question Trend Mean Change Mean Mean Rank Mean Rank Mean Rank
Overall Facility Rating 92.3 -0.2 92.1 92.6 35 93.0 30 < 93.9 15
Overall Facility Rating †† 92.5 -0.3 92.2
Registration 91.7 -0.5 91.2 91.6 37 91.8 35 < 93.2 18
213 Helpfulness of registration person 92.0 -0.4 91.6 93.2 21 93.7 18 < 94.0 10
209 Ease of the registration process 93.0 -0.3 92.7 92.7 40 93.0 36 94.2 15
209 Waiting time in registration 7 90.4 -0.8 89.6 89.1 46 89.0 45 91.3 27
Facility 89.9 -0.5 89.4 90.8 29 91.4 27 90.7 46
212 Comfort of waiting area 7 92.2 -1.7 90.5 89.5 57 90.0 54 89.9 60
209 Ease of finding your way around 84.9 +1.3 86.2 89.6 17 < 90.6 14 88.8 25
208 Cleanliness of facility 10 92.6 -0.8 91.8 93.4 26 93.7 23 93.7 24
Test or Treatment 93.9 +0.4 94.3 94.2 45 94.6 39 95.7 14
210 Friendliness of staff 94.9 +0.5 95.4 95.5 38 95.8 34 96.8 8
208 Explanations given by staff 94.1 +0.7 94.8 93.4 66 93.8 60 95.1 30
210 Skill of techs/therapists/nurses 95.3 -0.2 95.1 95.0 46 95.3 42 96.3 21
209 Staff concern for comfort 93.4 +1.0 94.4 93.9 53 94.3 49 95.7 15
205 Staff's concern/questions worries 6 92.7 -0.7 92.0 93.5 22 94.0 17 < 94.9 5
Personal Issues 92.3 +0.2 92.5 92.6 41 93.0 38 < 94.6 12
Personal Issues †† 93.0 -0.5 92.5
206 Our concern for privacy 92.7 -0.1 92.6 93.1 37 93.6 30 < 94.8 9
206 Our sensitivity to your needs 3 92.2 +0.2 92.4 92.7 38 93.0 34 < 94.9 9
195 Response to concerns/complaints 3 92.1 +0.2 92.3 92.4 41 92.8 35 < 94.3 13
194 Family able to participate decision † 3 93.6 -1.1 92.5 N<7 N/A N<7 N/A N<7 N/A
201 Staff explained roles in care † 93.8 -1.0 92.8 N<7 N/A N<7 N/A N<7 N/A
191 Staff supported family throughout † 2 93.5 -1.6 91.9 N<7 N/A N<7 N/A N<7 N/A
192 Staff respected having family with † 94.7 -1.6 93.1 N<7 N/A N<7 N/A N<7 N/A
195 Staff sensitivity to your needs † 1 93.5 -1.2 92.3 N<7 N/A N<7 N/A N<7 N/A
Overall Assessment 94.3 -0.8 93.5 94.0 35 94.4 33 < 95.6 6
208 Staff worked together provide care 10 94.2 -0.9 93.3 94.0 32 94.4 33 < 95.3 7
208 Overall rating of care 9 94.5 -0.5 94.0 94.3 36 94.7 32 < 95.9 7
208 Likelihood of recommending 94.5 -1.1 93.4 93.8 36 94.2 34 < 95.6 4
< 1 standard deviation below peer group meanN<7 Fewer than 7 facilities† Non-standard question†† Includes non-standard questions
n Number of responsesN Number of facilities in peer group
Top ten priority (based on Internal Priority Index)
Find solutions, learn best practices, and networkFor an overview of how to interpret this report page,with colleagues in other health care organizationsclick or visit the following Web page:
https://www.pressganey.com/forumhttp://www.pressganey.com/gti/gti4.htm
84
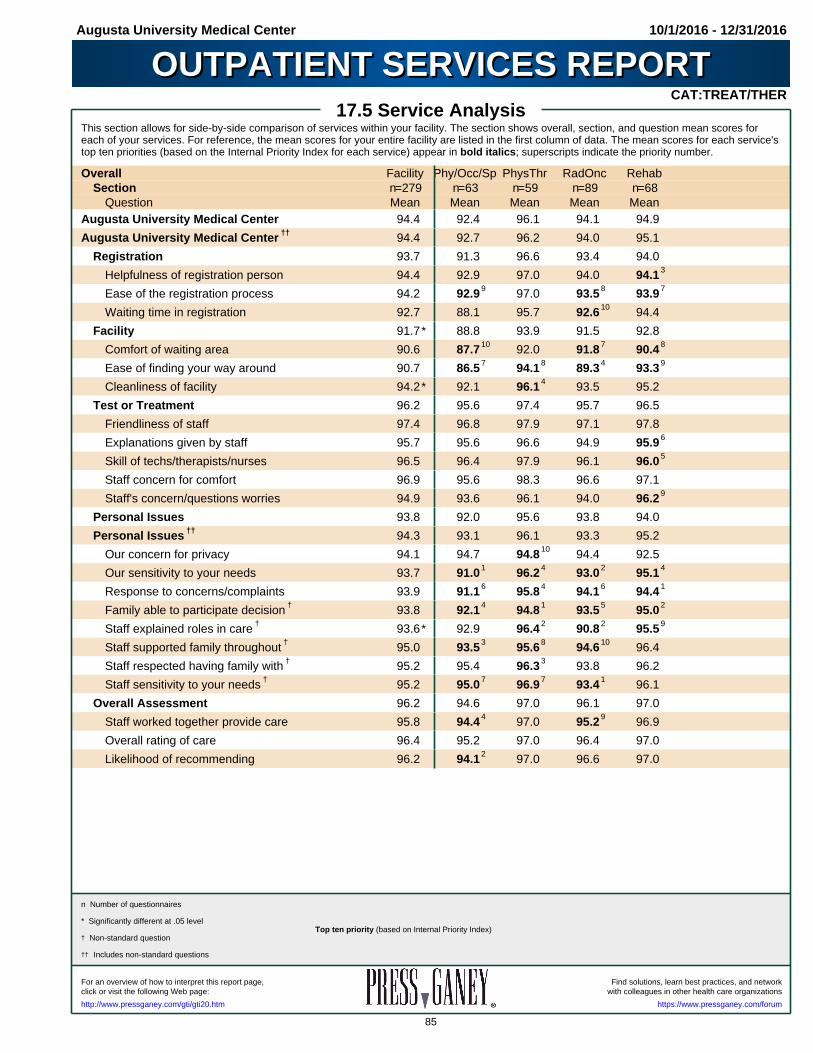
Augusta University Medical Center 10/1/2016 - 12/31/2016
OUTPATIENT SERVICES REPORTOUTPATIENT SERVICES REPORTCAT:TREAT/THER
17.5 Service AnalysisThis section allows for side-by-side comparison of services within your facility. The section shows overall, section, and question mean scores foreach of your services. For reference, the mean scores for your entire facility are listed in the first column of data. The mean scores for each service'stop ten priorities (based on the Internal Priority Index for each service) appear in bold italics; superscripts indicate the priority number. Overall Facility Phy/Occ/Sp PhysThr RadOnc Rehab
Section n=279 n=63 n=59 n=89 n=68Question Mean Mean Mean Mean Mean
Augusta University Medical Center 94.4 92.4 96.1 94.1 94.9
Augusta University Medical Center †† 94.4 92.7 96.2 94.0 95.1
Registration 93.7 91.3 96.6 93.4 94.0
Helpfulness of registration person 94.4 92.9 97.0 94.0 94.1 3
Ease of the registration process 94.2 92.9 9 97.0 93.5 8 93.9 7
Waiting time in registration 92.7 88.1 95.7 92.6 10 94.4
Facility 91.7* 88.8 93.9 91.5 92.8
Comfort of waiting area 90.6 87.7 10 92.0 91.8 7 90.4 8
Ease of finding your way around 90.7 86.5 7 94.1 8 89.3 4 93.3 9
Cleanliness of facility 94.2* 92.1 96.1 4 93.5 95.2
Test or Treatment 96.2 95.6 97.4 95.7 96.5
Friendliness of staff 97.4 96.8 97.9 97.1 97.8
Explanations given by staff 95.7 95.6 96.6 94.9 95.9 6
Skill of techs/therapists/nurses 96.5 96.4 97.9 96.1 96.0 5
Staff concern for comfort 96.9 95.6 98.3 96.6 97.1
Staff's concern/questions worries 94.9 93.6 96.1 94.0 96.2 9
Personal Issues 93.8 92.0 95.6 93.8 94.0
Personal Issues †† 94.3 93.1 96.1 93.3 95.2
Our concern for privacy 94.1 94.7 94.8 10 94.4 92.5
Our sensitivity to your needs 93.7 91.0 1 96.2 4 93.0 2 95.1 4
Response to concerns/complaints 93.9 91.1 6 95.8 4 94.1 6 94.4 1
Family able to participate decision † 93.8 92.1 4 94.8 1 93.5 5 95.0 2
Staff explained roles in care † 93.6* 92.9 96.4 2 90.8 2 95.5 9
Staff supported family throughout † 95.0 93.5 3 95.6 8 94.6 10 96.4
Staff respected having family with † 95.2 95.4 96.3 3 93.8 96.2
Staff sensitivity to your needs † 95.2 95.0 7 96.9 7 93.4 1 96.1
Overall Assessment 96.2 94.6 97.0 96.1 97.0
Staff worked together provide care 95.8 94.4 4 97.0 95.2 9 96.9
Overall rating of care 96.4 95.2 97.0 96.4 97.0
Likelihood of recommending 96.2 94.1 2 97.0 96.6 97.0
* Significantly different at .05 level
† Non-standard question
†† Includes non-standard questions
n Number of questionnaires
Top ten priority (based on Internal Priority Index)
Find solutions, learn best practices, and networkFor an overview of how to interpret this report page,with colleagues in other health care organizationsclick or visit the following Web page:
https://www.pressganey.com/forumhttp://www.pressganey.com/gti/gti20.htm
85

Augusta University Medical Center 10/1/2016 - 12/31/2016
OUTPATIENT SERVICES REPORTOUTPATIENT SERVICES REPORTCAT:TREAT/THER
17.6 Question AnalysisThis section lists detailed information about your individual question, section, and overall scores. Only criteria with seven or more responses arereported. Significant changes in mean scores from the previous report period are marked with asterisks. The amount of change is listed in the secondcolumn of data. Questions appearing in bold italics are among your facility's top ten priorities (based on your Internal Priority Index); superscriptsindicate the priority number. Comparative data are provided on the right. To ensure confidentiality, data for questions are provided only when thequestions are asked by seven or more facilities. Greater than (>) and less than (<) symbols are used to flag mean scores that fall above or below apeer group's mean score by one or two standard deviations. Percentile ranks describe where you stand in relation to other facilities in a peer group.In electronic reports, percentile ranks lower than 50 are colored red and those higher than 50 are colored blue.
Last This All AHA COTHOverall Mean Period Period Facility DB Region 4 Peer Group
Section Score n=237 n=279 N=751 N=119 N=12n Question Trend Mean Change Mean Mean Rank Mean Rank Mean Rank
Overall Facility Rating 95.6 -1.2 94.4 93.9 53 94.1 46 94.9 35
Overall Facility Rating †† 95.7 -1.3 94.4
Registration 95.2 -1.5 93.7 92.8 56 92.8 55 94.1 46
278 Helpfulness of registration person 95.6 -1.2 94.4 93.9 49 94.2 46 94.7 45
275 Ease of the registration process 96.0 -1.8 94.2 93.5 51 93.7 46 94.7 32
276 Waiting time in registration 10 94.3 -1.6 92.7 91.1 61 90.6 66 92.8 48
Facility 93.9 -2.2 91.7* 91.4 48 91.6 48 91.6 49
278 Comfort of waiting area 10 92.6 -2.0 90.6 89.8 53 89.6 62 90.6 35
278 Ease of finding your way around 8 93.2 -2.5 90.7 90.4 45 90.7 40 89.7 47
278 Cleanliness of facility 96.2* -2.0 94.2* 94.1 46 94.3 44 94.5 39
Test or Treatment 97.1 -0.9 96.2 95.8 51 96.2 38 97.2 17
277 Friendliness of staff 98.0 -0.6 97.4 96.8 56 97.1 45 98.0 23
278 Explanations given by staff 96.7 -1.0 95.7 95.3 51 95.8 40 96.9 21
279 Skill of techs/therapists/nurses 97.8 -1.3 96.5 96.2 50 96.6 43 < 97.6 19
279 Staff concern for comfort 97.4 -0.5 96.9 95.7 67 96.1 58 97.2 47
272 Staff's concern/questions worries 8 95.7 -0.8 94.9 95.4 34 95.7 29 < 96.8 1
Personal Issues 95.1 -1.3 93.8 94.0 42 94.4 37 95.2 28
Personal Issues †† 95.6 -1.3 94.3
275 Our concern for privacy 95.0 -0.9 94.1 94.1 46 94.5 38 95.1 33
275 Our sensitivity to your needs 1 95.0 -1.3 93.7 94.3 34 94.7 30 < 95.8 8
265 Response to concerns/complaints 3 95.6 -1.7 93.9 94.0 42 94.3 40 95.3 18
254 Family able to participate decision † 2 94.8 -1.0 93.8 N<7 N/A N<7 N/A N<7 N/A
269 Staff explained roles in care † 4 96.0 -2.4 93.6* N<7 N/A N<7 N/A N<7 N/A
234 Staff supported family throughout † 7 96.3 -1.3 95.0 N<7 N/A N<7 N/A N<7 N/A
241 Staff respected having family with † 96.7 -1.5 95.2 N<7 N/A N<7 N/A N<7 N/A
268 Staff sensitivity to your needs † 5 96.2 -1.0 95.2 N<7 N/A N<7 N/A N<7 N/A
Overall Assessment 96.7 -0.5 96.2 95.5 56 95.9 47 96.6 32
275 Staff worked together provide care 6 96.6 -0.8 95.8 95.5 49 95.9 44 96.5 38
277 Overall rating of care 96.8 -0.4 96.4 95.9 56 96.2 48 96.9 31
277 Likelihood of recommending 96.6 -0.4 96.2 95.4 57 96.0 49 96.4 46
* Significantly different at .05 level< 1 standard deviation below peer group mean† Non-standard question†† Includes non-standard questions
n Number of responsesN Number of facilities in peer group
N<7 Fewer than 7 facilities
Top ten priority (based on Internal Priority Index)
Find solutions, learn best practices, and networkFor an overview of how to interpret this report page,with colleagues in other health care organizationsclick or visit the following Web page:
https://www.pressganey.com/forumhttp://www.pressganey.com/gti/gti4.htm
86
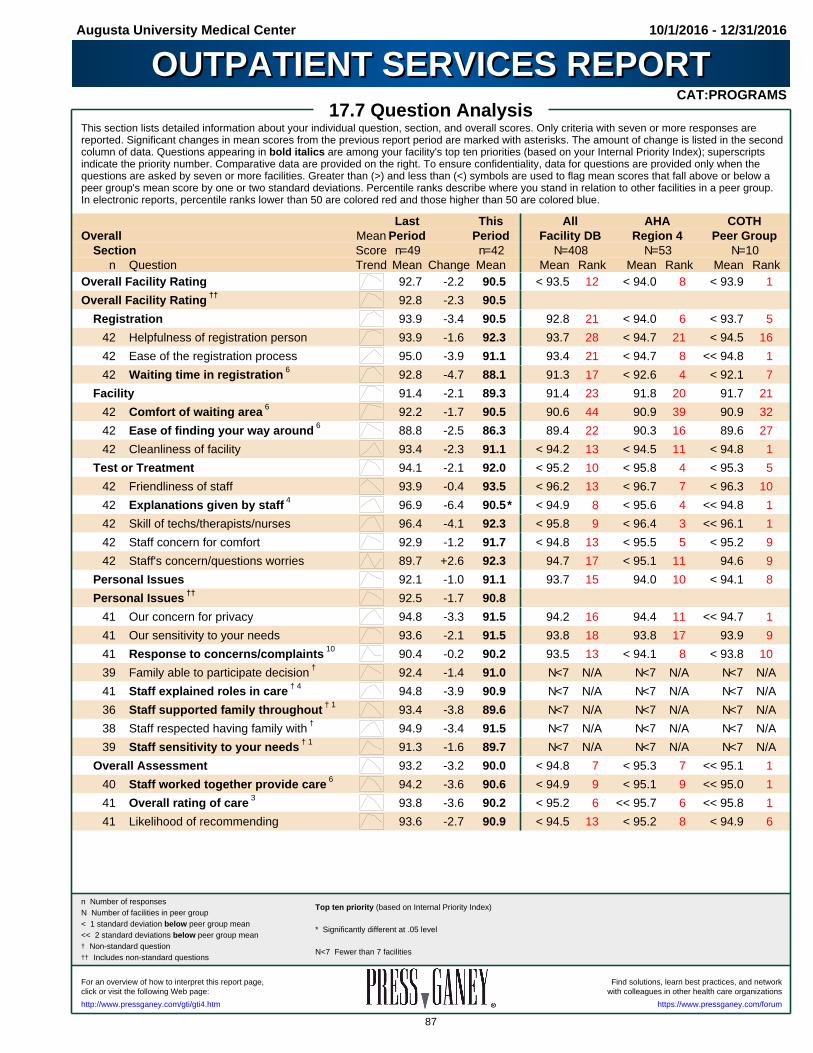
Augusta University Medical Center 10/1/2016 - 12/31/2016
OUTPATIENT SERVICES REPORTOUTPATIENT SERVICES REPORTCAT:PROGRAMS
17.7 Question AnalysisThis section lists detailed information about your individual question, section, and overall scores. Only criteria with seven or more responses arereported. Significant changes in mean scores from the previous report period are marked with asterisks. The amount of change is listed in the secondcolumn of data. Questions appearing in bold italics are among your facility's top ten priorities (based on your Internal Priority Index); superscriptsindicate the priority number. Comparative data are provided on the right. To ensure confidentiality, data for questions are provided only when thequestions are asked by seven or more facilities. Greater than (>) and less than (<) symbols are used to flag mean scores that fall above or below apeer group's mean score by one or two standard deviations. Percentile ranks describe where you stand in relation to other facilities in a peer group.In electronic reports, percentile ranks lower than 50 are colored red and those higher than 50 are colored blue.
Last This All AHA COTHOverall Mean Period Period Facility DB Region 4 Peer Group
Section Score n=49 n=42 N=408 N=53 N=10n Question Trend Mean Change Mean Mean Rank Mean Rank Mean Rank
Overall Facility Rating 92.7 -2.2 90.5 < 93.5 12 < 94.0 8 < 93.9 1
Overall Facility Rating †† 92.8 -2.3 90.5
Registration 93.9 -3.4 90.5 92.8 21 < 94.0 6 < 93.7 5
42 Helpfulness of registration person 93.9 -1.6 92.3 93.7 28 < 94.7 21 < 94.5 16
42 Ease of the registration process 95.0 -3.9 91.1 93.4 21 < 94.7 8 << 94.8 1
42 Waiting time in registration 6 92.8 -4.7 88.1 91.3 17 < 92.6 4 < 92.1 7
Facility 91.4 -2.1 89.3 91.4 23 91.8 20 91.7 21
42 Comfort of waiting area 6 92.2 -1.7 90.5 90.6 44 90.9 39 90.9 32
42 Ease of finding your way around 6 88.8 -2.5 86.3 89.4 22 90.3 16 89.6 27
42 Cleanliness of facility 93.4 -2.3 91.1 < 94.2 13 < 94.5 11 < 94.8 1
Test or Treatment 94.1 -2.1 92.0 < 95.2 10 < 95.8 4 < 95.3 5
42 Friendliness of staff 93.9 -0.4 93.5 < 96.2 13 < 96.7 7 < 96.3 10
42 Explanations given by staff 4 96.9 -6.4 90.5* < 94.9 8 < 95.6 4 << 94.8 1
42 Skill of techs/therapists/nurses 96.4 -4.1 92.3 < 95.8 9 < 96.4 3 << 96.1 1
42 Staff concern for comfort 92.9 -1.2 91.7 < 94.8 13 < 95.5 5 < 95.2 9
42 Staff's concern/questions worries 89.7 +2.6 92.3 94.7 17 < 95.1 11 94.6 9
Personal Issues 92.1 -1.0 91.1 93.7 15 94.0 10 < 94.1 8
Personal Issues †† 92.5 -1.7 90.8
41 Our concern for privacy 94.8 -3.3 91.5 94.2 16 94.4 11 << 94.7 1
41 Our sensitivity to your needs 93.6 -2.1 91.5 93.8 18 93.8 17 93.9 9
41 Response to concerns/complaints 10 90.4 -0.2 90.2 93.5 13 < 94.1 8 < 93.8 10
39 Family able to participate decision † 92.4 -1.4 91.0 N<7 N/A N<7 N/A N<7 N/A
41 Staff explained roles in care † 4 94.8 -3.9 90.9 N<7 N/A N<7 N/A N<7 N/A
36 Staff supported family throughout † 1 93.4 -3.8 89.6 N<7 N/A N<7 N/A N<7 N/A
38 Staff respected having family with † 94.9 -3.4 91.5 N<7 N/A N<7 N/A N<7 N/A
39 Staff sensitivity to your needs † 1 91.3 -1.6 89.7 N<7 N/A N<7 N/A N<7 N/A
Overall Assessment 93.2 -3.2 90.0 < 94.8 7 < 95.3 7 << 95.1 1
40 Staff worked together provide care 6 94.2 -3.6 90.6 < 94.9 9 < 95.1 9 << 95.0 1
41 Overall rating of care 3 93.8 -3.6 90.2 < 95.2 6 << 95.7 6 << 95.8 1
41 Likelihood of recommending 93.6 -2.7 90.9 < 94.5 13 < 95.2 8 < 94.9 6
< 1 standard deviation below peer group mean<< 2 standard deviations below peer group mean† Non-standard question†† Includes non-standard questions
n Number of responsesN Number of facilities in peer group
* Significantly different at .05 level
N<7 Fewer than 7 facilities
Top ten priority (based on Internal Priority Index)
Find solutions, learn best practices, and networkFor an overview of how to interpret this report page,with colleagues in other health care organizationsclick or visit the following Web page:
https://www.pressganey.com/forumhttp://www.pressganey.com/gti/gti4.htm
87

Augusta University Medical Center 10/1/2016 - 12/31/2016
OUTPATIENT SERVICES REPORTOUTPATIENT SERVICES REPORT18.0 Comparative Analysis by Service
This section lists each service alphabetically and provides historical mean scores for the last four report periods. The chart on the right allows you toidentify which services performed significantly differently from your facility as a whole. The vertical line drawn down the middle of the I-barsrepresents your current standard-item overall facility mean score; the actual score is listed above the dotted line. The I-bars represent a range of plusor minus 2 sigma for each service around the facility mean. I-bars will be wider for services having more variability or fewer respondents andnarrower for services having less variability or more respondents. If a service's mean score falls to the left of its I-bar ( ), then the service's meanscore is significantly lower than the facility's mean score; if it falls to the right ( ), it is significantly higher than the facility's mean score.
Mean ScoreMean 1/1/16 4/1/16 7/1/16 10/1/16 of YourScore 3/31/16 6/30/16 9/30/16 12/31/16 Facility
n Service Trend Mean Mean Mean Mean 93.156 Cardio/Cardiac Testing 92.6 93.8 91.8 90.2
16 EEG 89.2 80.4 88.0 90.6
68 Endoscopy 92.8 93.5 91.8 94.3
71 Lab 93.8 90.8 94.3 92.3
104 Mammography 96.3 95.2 95.3 96.2
63 Phys/Occ/Spch Thpy 93.4 95.0 96.1 92.4*
59 Physical Therapy 92.9 93.5 95.1 96.1
2 Pulmonary Func/Arterial Blood Gas n<7 n<7 n<7 n<7
89 Radiation Onc/Therapy 94.4 96.3 95.0 94.1
194 Radiology 91.8 90.5 91.4 93.0
68 Rehab Services 93.5 96.6 96.1 94.9
42 Sleep Disorders 88.1 93.4 92.7 90.5
15 Ultrasound 87.2 81.6 87.5 94.5
75 X-Ray 89.7 90.5 91.4 89.0
* Significantly different at .05 level
n<7 Fewer than 7 responses
n Number of responses
Lower Control Limit -2 sigma
Upper Control Limit +2 sigma
Mean score of your Facility
Significantly higher than Facility mean score
Not significantly different from Facility mean score
Significantly lower than Facility mean score
Find solutions, learn best practices, and networkFor an overview of how to interpret this report page,with colleagues in other health care organizationsclick or visit the following Web page:
https://www.pressganey.com/forumhttp://www.pressganey.com/gti/gti19.htm
88

Augusta University Medical Center 10/1/2016 - 12/31/2016
OUTPATIENT SERVICES REPORTOUTPATIENT SERVICES REPORT19.0 Service Analysis
This section allows for side-by-side comparison of services within your facility. The section shows overall, section, and question mean scores foreach of your services. For reference, the mean scores for your entire facility are listed in the first column of data. The mean scores for each service'stop ten priorities (based on the Internal Priority Index for each service) appear in bold italics; superscripts indicate the priority number. Overall Facility Cardio EEG Endos Lab Mammo Phy/Occ/Sp
Section n=998 n=56 n=16 n=68 n=71 n=104 n=63Question Mean Mean Mean Mean Mean Mean Mean
Augusta University Medical Center 93.1 90.2 90.6 94.3 92.3 96.2 92.4
Augusta University Medical Center †† 93.2 90.2 90.6 94.3 92.2 96.1 92.7
Registration 92.7 90.0 87.5 92.8 91.7 96.4 91.3
Helpfulness of registration person 93.8 91.5 85.9 93.0 91.6 4 97.6 92.9
Ease of the registration process 93.5 90.9 89.1 94.0 9 93.8 9 96.5 92.9 9
Waiting time in registration 90.8 88.2 3 87.5 91.0 5 89.9 4 95.5 88.1
Facility 90.6 85.6 85.4 93.3 89.9 94.8 88.8
Comfort of waiting area 91.0 88.8 4 85.9 94.5 89.3 9 96.3 87.7 10
Ease of finding your way around 87.7 79.6 8 81.3 89.9 9 89.5 91.9 10 86.5 7
Cleanliness of facility 93.2 88.6 89.1 95.2 92.2 3 96.1 92.1
Test or Treatment 94.7 92.0 95.3 95.9 94.7 96.8 95.6
Friendliness of staff 96.1 93.8 98.3 95.8 96.1 97.8 96.8
Explanations given by staff 94.3 92.7 98.3 96.0 94.9 96.8 95.6
Skill of techs/therapists/nurses 95.5 94.9 96.7 96.3 94.4 98.3 96.4
Staff concern for comfort 94.8 90.3 9 96.7 97.4 94.6 96.3 95.6
Staff's concern/questions worries 93.3 88.9 1 91.7 94.1 1 92.8 96.2 93.6
Personal Issues 93.1 90.3 91.2 94.4 92.7 95.8 92.0
Personal Issues †† 93.2 90.5 91.1 94.5 92.6 95.5 93.1
Our concern for privacy 93.6 90.1 89.1 94.8 93.4 95.6 3 94.7
Our sensitivity to your needs 92.9 90.6 5 92.2 94.4 3 91.9 95.8 6 91.0 1
Response to concerns/complaints 92.7 89.9 5 93.3 93.9 1 92.5 8 95.4 2 91.1 6
Family able to participate decision † 92.9 89.8 9 92.2 94.3 4 93.0 6 94.9 4 92.1 4
Staff explained roles in care † 93.0 91.0 87.5 95.3 6 93.2 9 95.1 4 92.9
Staff supported family throughout † 93.3 89.1 1 90.6 94.7 91.4 7 93.9 7 93.5 3
Staff respected having family with † 94.0 91.3 92.2 94.4 7 93.4 93.9 1 95.4
Staff sensitivity to your needs † 93.3 89.8 7 92.2 95.2 9 91.4 2 95.9 7 95.0 7
Overall Assessment 94.8 93.2 93.8 94.9 92.5 97.7 94.6
Staff worked together provide care 94.8 92.6 92.2 95.2 8 92.4 97.5 9 94.4 4
Overall rating of care 95.2 94.4 93.8 95.9 9 92.0 1 98.0 95.2
Likelihood of recommending 94.6 92.6 95.3 94.0 93.1 9 97.4 94.1 2
† Non-standard question
†† Includes non-standard questions
n Number of questionnaires
Top ten priority (based on Internal Priority Index)
Find solutions, learn best practices, and networkFor an overview of how to interpret this report page,with colleagues in other health care organizationsclick or visit the following Web page:
https://www.pressganey.com/forumhttp://www.pressganey.com/gti/gti20.htm
89

Augusta University Medical Center 10/1/2016 - 12/31/2016
OUTPATIENT SERVICES REPORTOUTPATIENT SERVICES REPORT19.0 Service Analysis
Overall Facility PhysThr PulmFunc RadOnc Radiolgy Rehab SleepDisSection n=998 n=59 n<7 n=89 n=194 n=68 n=42
Question Mean Mean Mean Mean Mean Mean MeanAugusta University Medical Center 93.1 96.1 n<7 94.1 93.0 94.9 90.5
Augusta University Medical Center †† 93.2 96.2 n<7 94.0 93.0 95.1 90.5
Registration 92.7 96.6 n<7 93.4 92.1 94.0 90.5
Helpfulness of registration person 93.8 97.0 n<7 94.0 93.3 10 94.1 3 92.3
Ease of the registration process 93.5 97.0 n<7 93.5 8 92.5 3 93.9 7 91.1
Waiting time in registration 90.8 95.7 n<7 92.6 10 90.5 3 94.4 88.1 6
Facility 90.6 93.9 n<7 91.5 89.1 92.8 89.3
Comfort of waiting area 91.0 92.0 n<7 91.8 7 90.9 6 90.4 8 90.5 6
Ease of finding your way around 87.7 94.1 8 n<7 89.3 4 83.3 93.3 9 86.3 6
Cleanliness of facility 93.2 96.1 4 n<7 93.5 93.2 95.2 91.1
Test or Treatment 94.7 97.4 n<7 95.7 95.0 96.5 92.0
Friendliness of staff 96.1 97.9 n<7 97.1 96.9 97.8 93.5
Explanations given by staff 94.3 96.6 n<7 94.9 94.0 95.9 6 90.5 4
Skill of techs/therapists/nurses 95.5 97.9 n<7 96.1 95.5 96.0 5 92.3
Staff concern for comfort 94.8 98.3 n<7 96.6 95.4 97.1 91.7
Staff's concern/questions worries 93.3 96.1 n<7 94.0 93.6 6 96.2 9 92.3
Personal Issues 93.1 95.6 n<7 93.8 94.1 94.0 91.1
Personal Issues †† 93.2 96.1 n<7 93.3 94.0 95.2 90.8
Our concern for privacy 93.6 94.8 10 n<7 94.4 94.7 92.5 91.5
Our sensitivity to your needs 92.9 96.2 4 n<7 93.0 2 93.6 1 95.1 4 91.5
Response to concerns/complaints 92.7 95.8 4 n<7 94.1 6 93.7 10 94.4 1 90.2 10
Family able to participate decision † 92.9 94.8 1 n<7 93.5 5 93.9 6 95.0 2 91.0
Staff explained roles in care † 93.0 96.4 2 n<7 90.8 2 94.5 95.5 9 90.9 4
Staff supported family throughout † 93.3 95.6 8 n<7 94.6 10 93.4 2 96.4 89.6 1
Staff respected having family with † 94.0 96.3 3 n<7 93.8 94.2 6 96.2 91.5
Staff sensitivity to your needs † 93.3 96.9 7 n<7 93.4 1 93.9 10 96.1 89.7 1
Overall Assessment 94.8 97.0 n<7 96.1 95.5 97.0 90.0
Staff worked together provide care 94.8 97.0 n<7 95.2 9 95.4 5 96.9 90.6 6
Overall rating of care 95.2 97.0 n<7 96.4 96.5 97.0 90.2 3
Likelihood of recommending 94.6 97.0 n<7 96.6 95.0 97.0 90.9
n<7 Fewer than 7 responses
† Non-standard question
†† Includes non-standard questions
n Number of questionnaires
Top ten priority (based on Internal Priority Index)
Find solutions, learn best practices, and networkFor an overview of how to interpret this report page,with colleagues in other health care organizationsclick or visit the following Web page:
https://www.pressganey.com/forumhttp://www.pressganey.com/gti/gti20.htm
90

Augusta University Medical Center 10/1/2016 - 12/31/2016
OUTPATIENT SERVICES REPORTOUTPATIENT SERVICES REPORT19.0 Service Analysis
Overall Facility Ultra X-RaySection n=998 n=15 n=75
Question Mean Mean MeanAugusta University Medical Center 93.1 94.5 89.0
Augusta University Medical Center †† 93.2 94.3 89.2
Registration 92.7 93.3 89.6
Helpfulness of registration person 93.8 95.0 92.5
Ease of the registration process 93.5 96.7 91.2
Waiting time in registration 90.8 88.3 85.8 9
Facility 90.6 92.2 87.9
Comfort of waiting area 91.0 93.3 87.7
Ease of finding your way around 87.7 90.0 86.2
Cleanliness of facility 93.2 93.3 89.9
Test or Treatment 94.7 95.3 89.9
Friendliness of staff 96.1 94.6 91.7
Explanations given by staff 94.3 95.0 89.7 10
Skill of techs/therapists/nurses 95.5 98.3 91.0
Staff concern for comfort 94.8 96.7 87.7 3
Staff's concern/questions worries 93.3 91.7 89.2
Personal Issues 93.1 95.6 87.4
Personal Issues †† 93.2 94.4 88.5
Our concern for privacy 93.6 96.7 88.7 7
Our sensitivity to your needs 92.9 95.0 86.8 1
Response to concerns/complaints 92.7 95.0 85.5 2
Family able to participate decision † 92.9 92.9 88.8
Staff explained roles in care † 93.0 91.7 88.5 5
Staff supported family throughout † 93.3 96.2 90.2
Staff respected having family with † 94.0 96.2 90.9
Staff sensitivity to your needs † 93.3 92.9 87.0 4
Overall Assessment 94.8 96.1 90.1
Staff worked together provide care 94.8 96.7 91.3
Overall rating of care 95.2 95.0 90.5 8
Likelihood of recommending 94.6 96.7 89.2 6
† Non-standard question
†† Includes non-standard questions
n Number of questionnaires
Top ten priority (based on Internal Priority Index)
Find solutions, learn best practices, and networkFor an overview of how to interpret this report page,with colleagues in other health care organizationsclick or visit the following Web page:
https://www.pressganey.com/forumhttp://www.pressganey.com/gti/gti20.htm
91

Augusta University Medical Center 10/1/2016 - 12/31/2016
OUTPATIENT SERVICES REPORTOUTPATIENT SERVICES REPORT20.1.1 Mean Trend Analysis - Cardio/Cardiac Testing
The broad light-colored columns show your Cardio/Cardiac Testing service's overall mean score, based on standard questions. One asterisk by amean score indicates a statistically significant change from the previous period at the .05 level; two asterisks indicate a statistically significant changein mean score at the .01 level. The narrow dark columns show your Cardio/Cardiac Testing service's overall score based on all questions. I-barsrepresent each of your peer groups: The horizontal line in the middle of each I-bar is the peer group's average mean score; the width of the I-barrepresents two standard deviations above and below the mean score. A marks the highest overall mean score obtained by Cardio/CardiacTesting services in each peer group.
80 80
82 82
84 84
86 86
88 88
90 90
92 92
94 94
96 96
98 98
100 100
90.2n=74
1/1/153/31/15
94.9n=23
4/1/156/30/15
92.6n=54
1/1/163/31/16
93.8n=68
4/1/166/30/16
91.8n=68
7/1/169/30/16
90.2n=56
10/1/1612/31/16
20.1.2 Percentile Rank Trend Analysis - Cardio/Cardiac TestingThis section shows how your Cardio/Cardiac Testing service's overall percentile rank (for standard questions only) has changed over time. Apercentile rank tells you how you perform relative to others in the database. For example, a percentile rank of 50 indicates that you scored higherthan 50% of the other Cardio/Cardiac Testing services in the peer group. Percentile rank trending is provided for up to three peer groups.
0 0
10 10
20 20
30 30
40 40
50 50
60 60
70 70
80 80
90 90
100 100
1/1/153/31/151/1/153/31/151/1/153/31/15
4/1/156/30/154/1/156/30/154/1/156/30/15
1/1/163/31/161/1/163/31/161/1/163/31/16
4/1/166/30/164/1/166/30/164/1/166/30/16
7/1/169/30/167/1/169/30/167/1/169/30/16
10/1/1612/31/1610/1/1612/31/1610/1/1612/31/16
Standard Questions
All Questions
Highest score in peer group
n Number of responses +2 Std. Deviations
-2 Std. Deviations
COTH Peer Group Mean
+2 Std. Deviations
-2 Std. Deviations
AHA Region 4 Mean
All Facility DB Rank
AHA Region 4 Rank
COTH Peer Group Rank
+2 Std. Deviations
-2 Std. Deviations
All Facility DB Mean
Find solutions, learn best practices, and networkFor an overview of how to interpret this report page,with colleagues in other health care organizationsclick or visit the following Web page:
https://www.pressganey.com/forumhttp://www.pressganey.com/gti/gti21.htm
92

Augusta University Medical Center 10/1/2016 - 12/31/2016
OUTPATIENT SERVICES REPORTOUTPATIENT SERVICES REPORT20.1.3 Question Analysis - Cardio/Cardiac Testing
This section lists detailed information about your Cardio/Cardiac Testing service's individual question, section, and overall mean scores. Onlyservices with seven or more responses are reported. Significant changes in mean scores from the previous report period are marked with asterisks.The amount of change is listed in the second column of data. Comparative data are provided on the right. To ensure confidentiality, data forquestions are provided only when the questions are asked by seven or more facilities. Greater than (>) and less than (<) symbols are used to flagmean scores that fall above or below a peer group's mean score by one or two standard deviations. Percentile ranks describe where you stand inrelation to other Cardio/Cardiac Testing services in a peer group. In electronic reports, percentile ranks lower than 50 are colored red and thosehigher than 50 are colored blue. If 30 or more questionnaires were returned for this service, questions representing its top ten priorities (based on thisservice's Internal Priority Index) will appear in bold italics; superscripts indicate the priority number.
Last This All AHA COTHOverall Mean Period Period Facility DB Region 4 Peer Group
Section Score n=68 n=56 N=255 N=36 N=8n Question Trend Mean Change Mean Mean Rank Mean Rank Mean Rank
Overall Question Rating 91.8 -1.6 90.2 < 93.4 9 < 93.1 14 < 94.4 1
Overall Question Rating †† 91.9 -1.7 90.2
Registration 92.3 -2.3 90.0 92.5 17 91.8 30 < 93.7 22
56 Helpfulness of registration person 93.0 -1.5 91.5 93.6 18 93.2 25 94.3 13
55 Ease of the registration process 92.7 -1.8 90.9 93.5 16 92.7 23 < 94.6 4
55 Waiting time in registration 3 91.3 -3.1 88.2 90.5 20 89.6 31 92.0 24
Facility 87.9 -2.3 85.6 < 90.7 7 < 91.2 2 < 91.9 1
56 Comfort of waiting area 4 90.1 -1.3 88.8 90.2 31 90.4 34 91.5 25
55 Ease of finding your way around 8 81.5 -1.9 79.6 < 88.3 5 << 89.1 1 < 89.3 1
55 Cleanliness of facility 91.9 -3.3 88.6 < 93.7 6 << 94.4 2 << 94.8 1
Test or Treatment 93.5 -1.5 92.0 < 95.4 6 < 95.0 7 << 95.8 1
56 Friendliness of staff 94.8 -1.0 93.8 < 96.5 9 < 96.2 10 < 96.5 1
55 Explanations given by staff 93.9 -1.2 92.7 94.8 16 94.3 29 < 95.4 5
54 Skill of techs/therapists/nurses 95.5 -0.6 94.9 95.9 25 95.7 32 < 96.8 15
54 Staff concern for comfort 9 91.9 -1.6 90.3 << 95.3 4 << 94.8 1 << 95.7 1
54 Staff's concern/questions worries 1 93.8 -4.9 88.9 << 94.6 3 < 94.1 3 << 94.4 1
Personal Issues 90.8 -0.5 90.3 < 93.6 9 < 93.3 10 << 94.8 1
Personal Issues †† 91.6 -1.1 90.5
53 Our concern for privacy 90.6** -0.5 90.1 < 94.0 7 < 93.6 5 << 95.3 1
53 Our sensitivity to your needs 5 91.3 -0.7 90.6 < 93.6 11 93.3 15 < 95.2 1
52 Response to concerns/complaints 5 90.9 -1.0 89.9 < 93.3 13 93.1 12 < 93.9 1
49 Family able to participate decision † 9 92.4 -2.6 89.8 N<7 N/A N<7 N/A N<7 N/A
53 Staff explained roles in care † 93.2 -2.2 91.0 N<7 N/A N<7 N/A N<7 N/A
46 Staff supported family throughout † 1 92.9 -3.8 89.1 N<7 N/A N<7 N/A N<7 N/A
46 Staff respected having family with † 92.0 -0.7 91.3 N<7 N/A N<7 N/A N<7 N/A
49 Staff sensitivity to your needs † 7 93.0 -3.2 89.8 N<7 N/A N<7 N/A N<7 N/A
Overall Assessment 94.6 -1.4 93.2 95.1 18 95.0 26 << 96.1 1
54 Staff worked together provide care 93.9 -1.3 92.6 95.0 15 < 94.9 16 << 96.1 1
54 Overall rating of care 94.0 +0.4 94.4 95.4 28 95.5 35 < 96.4 2
54 Likelihood of recommending 96.2 -3.6 92.6 95.0 15 95.1 19 << 96.1 1
< 1 standard deviation below peer group mean<< 2 standard deviations below peer group mean† Non-standard question†† Includes non-standard questions
n Number of responsesN Number of facilities in peer group
** Significantly different at .01 level
N<7 Fewer than 7 facilities
Top ten priority (based on Internal Priority Index)
Find solutions, learn best practices, and networkFor an overview of how to interpret this report page,with colleagues in other health care organizationsclick or visit the following Web page:
https://www.pressganey.com/forumhttp://www.pressganey.com/gti/gti22.htm
93

Augusta University Medical Center 10/1/2016 - 12/31/2016
OUTPATIENT SERVICES REPORTOUTPATIENT SERVICES REPORT20.2.1 Mean Trend Analysis - EEG
The broad light-colored columns show your EEG service's overall mean score, based on standard questions. One asterisk by a mean scoreindicates a statistically significant change from the previous period at the .05 level; two asterisks indicate a statistically significant change in meanscore at the .01 level. The narrow dark columns show your EEG service's overall score based on all questions. I-bars represent each of your peergroups: The horizontal line in the middle of each I-bar is the peer group's average mean score; the width of the I-bar represents two standarddeviations above and below the mean score. A marks the highest overall mean score obtained by EEG services in each peer group.
78 78
80 80
82 82
84 84
86 86
88 88
90 90
92 92
94 94
96 96
98 98
100 100
92.7n=34
1/1/153/31/15
90.4n=13
4/1/156/30/15
n=17/1/15
12/31/15
89.2n=16
1/1/163/31/16
80.4n=17
4/1/166/30/16
88.0n=20
7/1/169/30/16
90.6n=16
10/1/1612/31/16
20.2.2 Percentile Rank Trend Analysis - EEGThis section shows how your EEG service's overall percentile rank (for standard questions only) has changed over time. A percentile rank tells youhow you perform relative to others in the database. For example, a percentile rank of 50 indicates that you scored higher than 50% of the other EEGservices in the peer group. Percentile rank trending is provided for up to three peer groups.
0 0
10 10
20 20
30 30
40 40
50 50
60 60
70 70
80 80
1/1/153/31/15
4/1/156/30/15
7/1/1512/31/15
1/1/163/31/16
4/1/166/30/16
7/1/169/30/16
10/1/1612/31/16
Standard Questions
All Questions
Highest score in peer group
n Number of responses +2 Std. Deviations
-2 Std. Deviations
All Facility DB MeanAll Facility DB Rank
Find solutions, learn best practices, and networkFor an overview of how to interpret this report page,with colleagues in other health care organizationsclick or visit the following Web page:
https://www.pressganey.com/forumhttp://www.pressganey.com/gti/gti21.htm
94

Augusta University Medical Center 10/1/2016 - 12/31/2016
OUTPATIENT SERVICES REPORTOUTPATIENT SERVICES REPORT20.2.3 Question Analysis - EEG
This section lists detailed information about your EEG service's individual question, section, and overall mean scores. Only services with seven ormore responses are reported. Significant changes in mean scores from the previous report period are marked with asterisks. The amount of changeis listed in the second column of data. Comparative data are provided on the right. To ensure confidentiality, data for questions are provided onlywhen the questions are asked by seven or more facilities. Greater than (>) and less than (<) symbols are used to flag mean scores that fall above orbelow a peer group's mean score by one or two standard deviations. Percentile ranks describe where you stand in relation to other EEG services in apeer group. In electronic reports, percentile ranks lower than 50 are colored red and those higher than 50 are colored blue. If 30 or morequestionnaires were returned for this service, questions representing its top ten priorities (based on this service's Internal Priority Index) will appear inbold italics; superscripts indicate the priority number.
Last This All AHA COTHOverall Mean Period Period Facility DB Region 4 Peer Group
Section Score n=20 n=16 N=24 N=3 N=3n Question Trend Mean Change Mean Mean Rank Mean Rank Mean Rank
Overall Question Rating 88.0 +2.6 90.6 91.5 30 N<7 N/A N<7 N/A
Overall Question Rating †† 88.7 +1.9 90.6
Registration 86.5 +1.0 87.5 < 91.3 13 N<7 N/A N<7 N/A
16 Helpfulness of registration person 88.2 -2.3 85.9 < 92.0 9 N<7 N/A N<7 N/A
16 Ease of the registration process 85.0 +4.1 89.1 92.1 30 N<7 N/A N<7 N/A
16 Waiting time in registration 86.3 +1.2 87.5 89.6 39 N<7 N/A N<7 N/A
Facility 82.1 +3.3 85.4 88.1 30 N<7 N/A N<7 N/A
16 Comfort of waiting area 86.3 -0.4 85.9 88.7 30 N<7 N/A N<7 N/A
16 Ease of finding your way around 71.3 +10.0 81.3 84.0 30 N<7 N/A N<7 N/A
16 Cleanliness of facility 88.8 +0.3 89.1 91.5 26 N<7 N/A N<7 N/A
Test or Treatment 90.8 +4.5 95.3 93.4 70 N<7 N/A N<7 N/A
15 Friendliness of staff 91.3 +7.0 98.3 94.9 96 N<7 N/A N<7 N/A
15 Explanations given by staff 93.8 +4.5 98.3 > 93.5 99 N<7 N/A N<7 N/A
15 Skill of techs/therapists/nurses 92.5 +4.2 96.7 93.4 82 N<7 N/A N<7 N/A
15 Staff concern for comfort 92.1 +4.6 96.7 > 92.9 95 N<7 N/A N<7 N/A
15 Staff's concern/questions worries 83.3 +8.4 91.7 92.6 31 N<7 N/A N<7 N/A
Personal Issues 91.7 -0.5 91.2 92.2 27 N<7 N/A N<7 N/A
Personal Issues †† 93.4* -2.3 91.1
16 Our concern for privacy 92.7 -3.6 89.1 < 92.6 10 N<7 N/A N<7 N/A
16 Our sensitivity to your needs 88.2 +4.0 92.2 92.3 41 N<7 N/A N<7 N/A
15 Response to concerns/complaints 94.1* -0.8 93.3 91.8 55 N<7 N/A N<7 N/A
16 Family able to participate decision † 97.1** -4.9 92.2 N<7 N/A N<7 N/A N<7 N/A
16 Staff explained roles in care † 96.9** -9.4 87.5* N<7 N/A N<7 N/A N<7 N/A
16 Staff supported family throughout † 96.4 -5.8 90.6 N<7 N/A N<7 N/A N<7 N/A
16 Staff respected having family with † 96.9 -4.7 92.2 N<7 N/A N<7 N/A N<7 N/A
16 Staff sensitivity to your needs † 93.8 -1.6 92.2 N<7 N/A N<7 N/A N<7 N/A
Overall Assessment 92.1 +1.7 93.8 92.5 45 N<7 N/A N<7 N/A
16 Staff worked together provide care 92.5 -0.3 92.2 92.6 27 N<7 N/A N<7 N/A
16 Overall rating of care 92.5 +1.3 93.8 93.1 52 N<7 N/A N<7 N/A
16 Likelihood of recommending 90.8 +4.5 95.3 92.6 76 N<7 N/A N<7 N/A
n Number of responses
N Number of facilities in peer group
* Significantly different at .05 level** Significantly different at .01 level> 1 standard deviation above peer group mean< 1 standard deviation below peer group mean† Non-standard question†† Includes non-standard questions
N<7 Fewer than 7 facilities
Find solutions, learn best practices, and networkFor an overview of how to interpret this report page,with colleagues in other health care organizationsclick or visit the following Web page:
https://www.pressganey.com/forumhttp://www.pressganey.com/gti/gti22.htm
95

Augusta University Medical Center 10/1/2016 - 12/31/2016
OUTPATIENT SERVICES REPORTOUTPATIENT SERVICES REPORT20.3.1 Mean Trend Analysis - Endoscopy
The broad light-colored columns show your Endoscopy service's overall mean score, based on standard questions. One asterisk by a mean scoreindicates a statistically significant change from the previous period at the .05 level; two asterisks indicate a statistically significant change in meanscore at the .01 level. The narrow dark columns show your Endoscopy service's overall score based on all questions. I-bars represent each of yourpeer groups: The horizontal line in the middle of each I-bar is the peer group's average mean score; the width of the I-bar represents two standarddeviations above and below the mean score. A marks the highest overall mean score obtained by Endoscopy services in each peer group.
84 84
86 86
88 88
90 90
92 92
94 94
96 96
98 98
100 100
91.7n=36
1/1/153/31/15
n=54/1/15
6/30/15
92.8n=59
1/1/163/31/16
93.5n=47
4/1/166/30/16
91.8n=68
7/1/169/30/16
94.3n=68
10/1/1612/31/16
20.3.2 Percentile Rank Trend Analysis - EndoscopyThis section shows how your Endoscopy service's overall percentile rank (for standard questions only) has changed over time. A percentile rank tellsyou how you perform relative to others in the database. For example, a percentile rank of 50 indicates that you scored higher than 50% of the otherEndoscopy services in the peer group. Percentile rank trending is provided for up to three peer groups.
0 0
10 10
20 20
30 30
40 40
50 50
60 60
70 70
80 80
90 90
100 100
1/1/153/31/151/1/153/31/15
4/1/156/30/154/1/156/30/15
1/1/163/31/161/1/163/31/16
4/1/166/30/164/1/166/30/16
7/1/169/30/167/1/169/30/16
10/1/1612/31/1610/1/1612/31/16
Standard Questions
All Questions
Highest score in peer group
n Number of responses +2 Std. Deviations
-2 Std. Deviations
AHA Region 4 Mean
All Facility DB Rank
AHA Region 4 Rank
+2 Std. Deviations
-2 Std. Deviations
All Facility DB Mean
Find solutions, learn best practices, and networkFor an overview of how to interpret this report page,with colleagues in other health care organizationsclick or visit the following Web page:
https://www.pressganey.com/forumhttp://www.pressganey.com/gti/gti21.htm
96

Augusta University Medical Center 10/1/2016 - 12/31/2016
OUTPATIENT SERVICES REPORTOUTPATIENT SERVICES REPORT20.3.3 Question Analysis - Endoscopy
This section lists detailed information about your Endoscopy service's individual question, section, and overall mean scores. Only services with sevenor more responses are reported. Significant changes in mean scores from the previous report period are marked with asterisks. The amount ofchange is listed in the second column of data. Comparative data are provided on the right. To ensure confidentiality, data for questions are providedonly when the questions are asked by seven or more facilities. Greater than (>) and less than (<) symbols are used to flag mean scores that fallabove or below a peer group's mean score by one or two standard deviations. Percentile ranks describe where you stand in relation to otherEndoscopy services in a peer group. In electronic reports, percentile ranks lower than 50 are colored red and those higher than 50 are colored blue.If 30 or more questionnaires were returned for this service, questions representing its top ten priorities (based on this service's Internal Priority Index)will appear in bold italics; superscripts indicate the priority number.
Last This All AHA COTHOverall Mean Period Period Facility DB Region 4 Peer Group
Section Score n=68 n=68 N=68 N=12 N=3n Question Trend Mean Change Mean Mean Rank Mean Rank Mean Rank
Overall Question Rating 91.8 +2.5 94.3 93.5 64 95.0 36 N<7 N/A
Overall Question Rating †† 91.9 +2.4 94.3
Registration 91.4 +1.4 92.8 92.7 46 93.3 44 N<7 N/A
68 Helpfulness of registration person 90.1 +2.9 93.0 93.5 39 93.8 33 N<7 N/A
67 Ease of the registration process 9 94.0 +0.0 94.0 94.0 51 94.7 41 N<7 N/A
67 Waiting time in registration 5 90.7 +0.3 91.0 90.5 52 91.3 45 N<7 N/A
Facility 90.9 +2.4 93.3 90.1 87 92.4 82 N<7 N/A
68 Comfort of waiting area 93.4 +1.1 94.5 > 89.0 93 > 91.3 86 N<7 N/A
67 Ease of finding your way around 9 85.1 +4.8 89.9 88.1 58 91.3 47 N<7 N/A
68 Cleanliness of facility 94.0 +1.2 95.2 93.0 75 94.6 67 N<7 N/A
Test or Treatment 93.4 +2.5 95.9 95.8 51 97.1 28 N<7 N/A
66 Friendliness of staff 94.8 +1.0 95.8 96.7 30 < 97.7 4 N<7 N/A
68 Explanations given by staff 92.8 +3.2 96.0 95.1 64 96.0 45 N<7 N/A
68 Skill of techs/therapists/nurses 95.8 +0.5 96.3 96.4 48 97.6 23 N<7 N/A
68 Staff concern for comfort 92.9 +4.5 97.4 95.7 76 97.3 49 N<7 N/A
68 Staff's concern/questions worries 1 91.8 +2.3 94.1 95.2 32 < 96.6 6 N<7 N/A
Personal Issues 91.6 +2.8 94.4 93.6 62 94.8 39 N<7 N/A
Personal Issues †† 92.1 +2.4 94.5
67 Our concern for privacy 93.5 +1.3 94.8 93.6 67 94.7 51 N<7 N/A
67 Our sensitivity to your needs 3 91.4 +3.0 94.4 93.9 50 95.1 24 N<7 N/A
66 Response to concerns/complaints 1 90.1 +3.8 93.9 93.7 45 95.2 22 N<7 N/A
66 Family able to participate decision † 4 93.2 +1.1 94.3 N<7 N/A N<7 N/A N<7 N/A
64 Staff explained roles in care † 6 92.1 +3.2 95.3 N<7 N/A N<7 N/A N<7 N/A
66 Staff supported family throughout † 92.4 +2.3 94.7 N<7 N/A N<7 N/A N<7 N/A
67 Staff respected having family with † 7 94.9 -0.5 94.4 N<7 N/A N<7 N/A N<7 N/A
67 Staff sensitivity to your needs † 9 91.7 +3.5 95.2 N<7 N/A N<7 N/A N<7 N/A
Overall Assessment 93.1 +1.8 94.9 95.7 33 < 97.2 4 N<7 N/A
67 Staff worked together provide care 8 93.8 +1.4 95.2 95.8 37 96.9 17 N<7 N/A
67 Overall rating of care 9 93.7 +2.2 95.9 96.1 49 97.4 25 N<7 N/A
67 Likelihood of recommending 92.3 +1.7 94.0 95.4 21 < 97.3 1 N<7 N/A
> 1 standard deviation above peer group mean< 1 standard deviation below peer group mean† Non-standard question†† Includes non-standard questions
n Number of responsesN Number of facilities in peer group
N<7 Fewer than 7 facilities
Top ten priority (based on Internal Priority Index)
Find solutions, learn best practices, and networkFor an overview of how to interpret this report page,with colleagues in other health care organizationsclick or visit the following Web page:
https://www.pressganey.com/forumhttp://www.pressganey.com/gti/gti22.htm
97
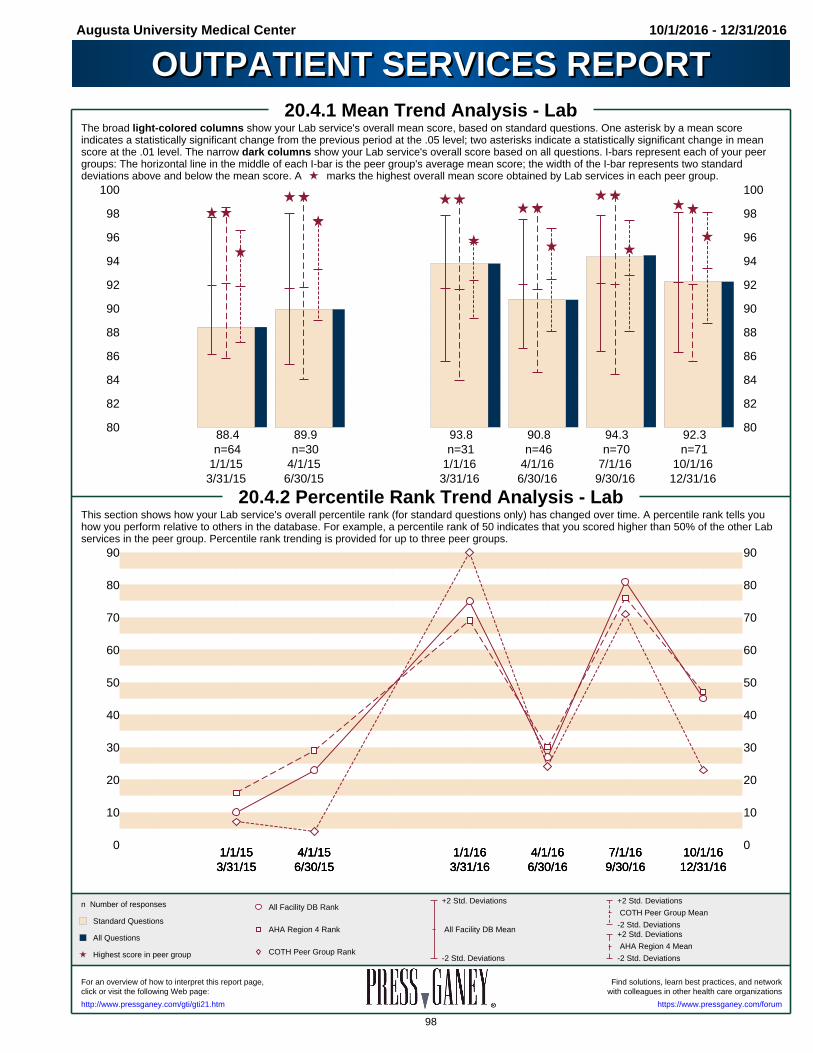
Augusta University Medical Center 10/1/2016 - 12/31/2016
OUTPATIENT SERVICES REPORTOUTPATIENT SERVICES REPORT20.4.1 Mean Trend Analysis - Lab
The broad light-colored columns show your Lab service's overall mean score, based on standard questions. One asterisk by a mean scoreindicates a statistically significant change from the previous period at the .05 level; two asterisks indicate a statistically significant change in meanscore at the .01 level. The narrow dark columns show your Lab service's overall score based on all questions. I-bars represent each of your peergroups: The horizontal line in the middle of each I-bar is the peer group's average mean score; the width of the I-bar represents two standarddeviations above and below the mean score. A marks the highest overall mean score obtained by Lab services in each peer group.
80 80
82 82
84 84
86 86
88 88
90 90
92 92
94 94
96 96
98 98
100 100
88.4n=64
1/1/153/31/15
89.9n=30
4/1/156/30/15
93.8n=31
1/1/163/31/16
90.8n=46
4/1/166/30/16
94.3n=70
7/1/169/30/16
92.3n=71
10/1/1612/31/16
20.4.2 Percentile Rank Trend Analysis - LabThis section shows how your Lab service's overall percentile rank (for standard questions only) has changed over time. A percentile rank tells youhow you perform relative to others in the database. For example, a percentile rank of 50 indicates that you scored higher than 50% of the other Labservices in the peer group. Percentile rank trending is provided for up to three peer groups.
0 0
10 10
20 20
30 30
40 40
50 50
60 60
70 70
80 80
90 90
1/1/153/31/151/1/153/31/151/1/153/31/15
4/1/156/30/154/1/156/30/154/1/156/30/15
1/1/163/31/161/1/163/31/161/1/163/31/16
4/1/166/30/164/1/166/30/164/1/166/30/16
7/1/169/30/167/1/169/30/167/1/169/30/16
10/1/1612/31/1610/1/1612/31/1610/1/1612/31/16
Standard Questions
All Questions
Highest score in peer group
n Number of responses +2 Std. Deviations
-2 Std. Deviations
COTH Peer Group Mean
+2 Std. Deviations
-2 Std. Deviations
AHA Region 4 Mean
All Facility DB Rank
AHA Region 4 Rank
COTH Peer Group Rank
+2 Std. Deviations
-2 Std. Deviations
All Facility DB Mean
Find solutions, learn best practices, and networkFor an overview of how to interpret this report page,with colleagues in other health care organizationsclick or visit the following Web page:
https://www.pressganey.com/forumhttp://www.pressganey.com/gti/gti21.htm
98
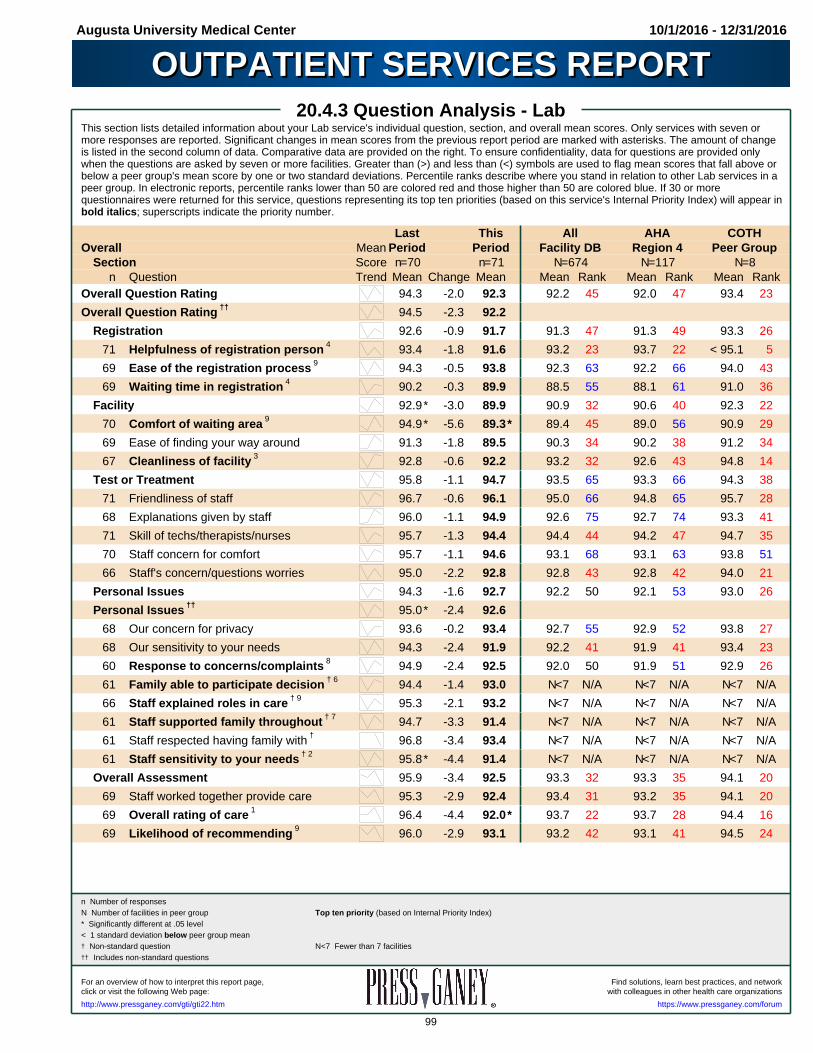
Augusta University Medical Center 10/1/2016 - 12/31/2016
OUTPATIENT SERVICES REPORTOUTPATIENT SERVICES REPORT20.4.3 Question Analysis - Lab
This section lists detailed information about your Lab service's individual question, section, and overall mean scores. Only services with seven ormore responses are reported. Significant changes in mean scores from the previous report period are marked with asterisks. The amount of changeis listed in the second column of data. Comparative data are provided on the right. To ensure confidentiality, data for questions are provided onlywhen the questions are asked by seven or more facilities. Greater than (>) and less than (<) symbols are used to flag mean scores that fall above orbelow a peer group's mean score by one or two standard deviations. Percentile ranks describe where you stand in relation to other Lab services in apeer group. In electronic reports, percentile ranks lower than 50 are colored red and those higher than 50 are colored blue. If 30 or morequestionnaires were returned for this service, questions representing its top ten priorities (based on this service's Internal Priority Index) will appear inbold italics; superscripts indicate the priority number.
Last This All AHA COTHOverall Mean Period Period Facility DB Region 4 Peer Group
Section Score n=70 n=71 N=674 N=117 N=8n Question Trend Mean Change Mean Mean Rank Mean Rank Mean Rank
Overall Question Rating 94.3 -2.0 92.3 92.2 45 92.0 47 93.4 23
Overall Question Rating †† 94.5 -2.3 92.2
Registration 92.6 -0.9 91.7 91.3 47 91.3 49 93.3 26
71 Helpfulness of registration person 4 93.4 -1.8 91.6 93.2 23 93.7 22 < 95.1 5
69 Ease of the registration process 9 94.3 -0.5 93.8 92.3 63 92.2 66 94.0 43
69 Waiting time in registration 4 90.2 -0.3 89.9 88.5 55 88.1 61 91.0 36
Facility 92.9* -3.0 89.9 90.9 32 90.6 40 92.3 22
70 Comfort of waiting area 9 94.9* -5.6 89.3* 89.4 45 89.0 56 90.9 29
69 Ease of finding your way around 91.3 -1.8 89.5 90.3 34 90.2 38 91.2 34
67 Cleanliness of facility 3 92.8 -0.6 92.2 93.2 32 92.6 43 94.8 14
Test or Treatment 95.8 -1.1 94.7 93.5 65 93.3 66 94.3 38
71 Friendliness of staff 96.7 -0.6 96.1 95.0 66 94.8 65 95.7 28
68 Explanations given by staff 96.0 -1.1 94.9 92.6 75 92.7 74 93.3 41
71 Skill of techs/therapists/nurses 95.7 -1.3 94.4 94.4 44 94.2 47 94.7 35
70 Staff concern for comfort 95.7 -1.1 94.6 93.1 68 93.1 63 93.8 51
66 Staff's concern/questions worries 95.0 -2.2 92.8 92.8 43 92.8 42 94.0 21
Personal Issues 94.3 -1.6 92.7 92.2 50 92.1 53 93.0 26
Personal Issues †† 95.0* -2.4 92.6
68 Our concern for privacy 93.6 -0.2 93.4 92.7 55 92.9 52 93.8 27
68 Our sensitivity to your needs 94.3 -2.4 91.9 92.2 41 91.9 41 93.4 23
60 Response to concerns/complaints 8 94.9 -2.4 92.5 92.0 50 91.9 51 92.9 26
61 Family able to participate decision † 6 94.4 -1.4 93.0 N<7 N/A N<7 N/A N<7 N/A
66 Staff explained roles in care † 9 95.3 -2.1 93.2 N<7 N/A N<7 N/A N<7 N/A
61 Staff supported family throughout † 7 94.7 -3.3 91.4 N<7 N/A N<7 N/A N<7 N/A
61 Staff respected having family with † 96.8 -3.4 93.4 N<7 N/A N<7 N/A N<7 N/A
61 Staff sensitivity to your needs † 2 95.8* -4.4 91.4 N<7 N/A N<7 N/A N<7 N/A
Overall Assessment 95.9 -3.4 92.5 93.3 32 93.3 35 94.1 20
69 Staff worked together provide care 95.3 -2.9 92.4 93.4 31 93.2 35 94.1 20
69 Overall rating of care 1 96.4 -4.4 92.0* 93.7 22 93.7 28 94.4 16
69 Likelihood of recommending 9 96.0 -2.9 93.1 93.2 42 93.1 41 94.5 24
* Significantly different at .05 level< 1 standard deviation below peer group mean† Non-standard question†† Includes non-standard questions
n Number of responsesN Number of facilities in peer group
N<7 Fewer than 7 facilities
Top ten priority (based on Internal Priority Index)
Find solutions, learn best practices, and networkFor an overview of how to interpret this report page,with colleagues in other health care organizationsclick or visit the following Web page:
https://www.pressganey.com/forumhttp://www.pressganey.com/gti/gti22.htm
99

Augusta University Medical Center 10/1/2016 - 12/31/2016
OUTPATIENT SERVICES REPORTOUTPATIENT SERVICES REPORT20.5.1 Mean Trend Analysis - Mammography
The broad light-colored columns show your Mammography service's overall mean score, based on standard questions. One asterisk by a meanscore indicates a statistically significant change from the previous period at the .05 level; two asterisks indicate a statistically significant change inmean score at the .01 level. The narrow dark columns show your Mammography service's overall score based on all questions. I-bars representeach of your peer groups: The horizontal line in the middle of each I-bar is the peer group's average mean score; the width of the I-bar representstwo standard deviations above and below the mean score. A marks the highest overall mean score obtained by Mammography services in eachpeer group.
88 88
90 90
92 92
94 94
96 96
98 98
100 100
95.1n=1311/1/15
3/31/15
96.4n=47
4/1/156/30/15
n=17/1/15
12/31/15
96.3n=71
1/1/163/31/16
95.2n=89
4/1/166/30/16
95.3n=78
7/1/169/30/16
96.2n=104
10/1/1612/31/16
20.5.2 Percentile Rank Trend Analysis - MammographyThis section shows how your Mammography service's overall percentile rank (for standard questions only) has changed over time. A percentile ranktells you how you perform relative to others in the database. For example, a percentile rank of 50 indicates that you scored higher than 50% of theother Mammography services in the peer group. Percentile rank trending is provided for up to three peer groups.
10 10
20 20
30 30
40 40
50 50
60 60
70 70
80 80
90 90
100 100
1/1/153/31/151/1/153/31/151/1/153/31/15
4/1/156/30/154/1/156/30/154/1/156/30/15
7/1/1512/31/157/1/15
12/31/157/1/15
12/31/151/1/163/31/161/1/163/31/161/1/163/31/16
4/1/166/30/164/1/166/30/164/1/166/30/16
7/1/169/30/167/1/169/30/167/1/169/30/16
10/1/1612/31/1610/1/1612/31/1610/1/1612/31/16
Standard Questions
All Questions
Highest score in peer group
n Number of responses +2 Std. Deviations
-2 Std. Deviations
COTH Peer Group Mean
+2 Std. Deviations
-2 Std. Deviations
AHA Region 4 Mean
All Facility DB Rank
AHA Region 4 Rank
COTH Peer Group Rank
+2 Std. Deviations
-2 Std. Deviations
All Facility DB Mean
Find solutions, learn best practices, and networkFor an overview of how to interpret this report page,with colleagues in other health care organizationsclick or visit the following Web page:
https://www.pressganey.com/forumhttp://www.pressganey.com/gti/gti21.htm
100

Augusta University Medical Center 10/1/2016 - 12/31/2016
OUTPATIENT SERVICES REPORTOUTPATIENT SERVICES REPORT20.5.3 Question Analysis - Mammography
This section lists detailed information about your Mammography service's individual question, section, and overall mean scores. Only services withseven or more responses are reported. Significant changes in mean scores from the previous report period are marked with asterisks. The amount ofchange is listed in the second column of data. Comparative data are provided on the right. To ensure confidentiality, data for questions are providedonly when the questions are asked by seven or more facilities. Greater than (>) and less than (<) symbols are used to flag mean scores that fallabove or below a peer group's mean score by one or two standard deviations. Percentile ranks describe where you stand in relation to otherMammography services in a peer group. In electronic reports, percentile ranks lower than 50 are colored red and those higher than 50 are coloredblue. If 30 or more questionnaires were returned for this service, questions representing its top ten priorities (based on this service's Internal PriorityIndex) will appear in bold italics; superscripts indicate the priority number.
Last This All AHA COTHOverall Mean Period Period Facility DB Region 4 Peer Group
Section Score n=78 n=104 N=669 N=142 N=8n Question Trend Mean Change Mean Mean Rank Mean Rank Mean Rank
Overall Question Rating 95.3 +0.9 96.2 94.9 73 95.2 66 95.1 79
Overall Question Rating †† 95.3 +0.8 96.1
Registration 95.6 +0.8 96.4 93.9 86 94.3 85 > 94.4 99
103 Helpfulness of registration person 96.2 +1.4 97.6 > 94.8 91 > 95.3 89 > 95.2 98
101 Ease of the registration process 95.8 +0.7 96.5 94.8 77 95.2 74 94.6 99
100 Waiting time in registration 94.7 +0.8 95.5 92.2 83 92.3 84 > 93.6 95
Facility 95.0 -0.2 94.8 93.5 66 93.9 60 93.5 50
102 Comfort of waiting area 96.1 +0.2 96.3 > 92.6 91 > 92.8 91 > 92.6 99
102 Ease of finding your way around 10 93.4 -1.5 91.9 92.5 38 93.2 28 92.5 38
102 Cleanliness of facility 95.1 +1.0 96.1 95.4 58 95.7 54 95.5 54
Test or Treatment 95.8 +1.0 96.8 96.4 55 96.5 50 96.2 64
104 Friendliness of staff 96.8 +1.0 97.8 97.2 62 97.4 55 > 97.1 93
101 Explanations given by staff 96.5 +0.3 96.8 96.2 57 96.3 56 96.3 70
101 Skill of techs/therapists/nurses 96.8 +1.5 98.3 96.9 78 97.1 72 > 96.8 99
101 Staff concern for comfort 96.1 +0.2 96.3 96.1 49 96.2 47 96.0 50
98 Staff's concern/questions worries 93.3 +2.9 96.2 95.8 51 95.9 51 94.9 73
Personal Issues 94.3 +1.5 95.8 95.0 60 95.1 60 95.2 55
Personal Issues †† 94.3 +1.2 95.5
97 Our concern for privacy 3 95.2 +0.4 95.6 95.3 49 95.4 47 95.5 47
96 Our sensitivity to your needs 6 93.9 +1.9 95.8 95.0 61 95.1 64 95.2 60
87 Response to concerns/complaints 2 93.9 +1.5 95.4 94.9 55 95.2 51 95.0 59
78 Family able to participate decision † 4 96.4 -1.5 94.9 N<7 N/A N<7 N/A N<7 N/A
92 Staff explained roles in care † 4 93.5 +1.6 95.1 N<7 N/A N<7 N/A N<7 N/A
70 Staff supported family throughout † 7 95.1 -1.2 93.9 N<7 N/A N<7 N/A N<7 N/A
70 Staff respected having family with † 1 95.3 -1.4 93.9 N<7 N/A N<7 N/A N<7 N/A
85 Staff sensitivity to your needs † 7 93.8 +2.1 95.9 N<7 N/A N<7 N/A N<7 N/A
Overall Assessment 95.6 +2.1 97.7 96.1 79 96.4 75 > 96.3 99
98 Staff worked together provide care 9 96.4 +1.1 97.5 95.9 78 96.1 75 > 96.2 99
98 Overall rating of care 96.4 +1.6 98.0 96.4 80 96.6 79 > 96.7 99
97 Likelihood of recommending 95.5 +1.9 97.4 96.1 72 96.6 69 96.3 97
> 1 standard deviation above peer group meanN<7 Fewer than 7 facilities† Non-standard question†† Includes non-standard questions
n Number of responsesN Number of facilities in peer group
Top ten priority (based on Internal Priority Index)
Find solutions, learn best practices, and networkFor an overview of how to interpret this report page,with colleagues in other health care organizationsclick or visit the following Web page:
https://www.pressganey.com/forumhttp://www.pressganey.com/gti/gti22.htm
101

Augusta University Medical Center 10/1/2016 - 12/31/2016
OUTPATIENT SERVICES REPORTOUTPATIENT SERVICES REPORT20.6.1 Mean Trend Analysis - Phys/Occ/Spch Thpy
The broad light-colored columns show your Phys/Occ/Spch Thpy service's overall mean score, based on standard questions. One asterisk by amean score indicates a statistically significant change from the previous period at the .05 level; two asterisks indicate a statistically significant changein mean score at the .01 level. The narrow dark columns show your Phys/Occ/Spch Thpy service's overall score based on all questions. I-barsrepresent each of your peer groups: The horizontal line in the middle of each I-bar is the peer group's average mean score; the width of the I-barrepresents two standard deviations above and below the mean score. A marks the highest overall mean score obtained by Phys/Occ/Spch Thpyservices in each peer group.
84 84
86 86
88 88
90 90
92 92
94 94
96 96
98 98
100 100
92.8n=47
1/1/153/31/15
91.1n=17
4/1/156/30/15
n=17/1/15
12/31/15
93.4n=53
1/1/163/31/16
95.0n=56
4/1/166/30/16
96.1n=56
7/1/169/30/16
92.4*n=63
10/1/1612/31/16
20.6.2 Percentile Rank Trend Analysis - Phys/Occ/Spch ThpyThis section shows how your Phys/Occ/Spch Thpy service's overall percentile rank (for standard questions only) has changed over time. A percentilerank tells you how you perform relative to others in the database. For example, a percentile rank of 50 indicates that you scored higher than 50% ofthe other Phys/Occ/Spch Thpy services in the peer group. Percentile rank trending is provided for up to three peer groups.
20 20
30 30
40 40
50 50
60 60
70 70
80 80
90 90
100 100
1/1/153/31/15
4/1/156/30/15
7/1/1512/31/15
1/1/163/31/16
4/1/166/30/16
7/1/169/30/16
10/1/1612/31/16
* Sig. different from previous period (p<.05)
Standard Questions
All Questions
Highest score in peer group
n Number of responses +2 Std. Deviations
-2 Std. Deviations
All Facility DB MeanAll Facility DB Rank
Find solutions, learn best practices, and networkFor an overview of how to interpret this report page,with colleagues in other health care organizationsclick or visit the following Web page:
https://www.pressganey.com/forumhttp://www.pressganey.com/gti/gti21.htm
102

Augusta University Medical Center 10/1/2016 - 12/31/2016
OUTPATIENT SERVICES REPORTOUTPATIENT SERVICES REPORT20.6.3 Question Analysis - Phys/Occ/Spch Thpy
This section lists detailed information about your Phys/Occ/Spch Thpy service's individual question, section, and overall mean scores. Only serviceswith seven or more responses are reported. Significant changes in mean scores from the previous report period are marked with asterisks. Theamount of change is listed in the second column of data. Comparative data are provided on the right. To ensure confidentiality, data for questions areprovided only when the questions are asked by seven or more facilities. Greater than (>) and less than (<) symbols are used to flag mean scores thatfall above or below a peer group's mean score by one or two standard deviations. Percentile ranks describe where you stand in relation to otherPhys/Occ/Spch Thpy services in a peer group. In electronic reports, percentile ranks lower than 50 are colored red and those higher than 50 arecolored blue. If 30 or more questionnaires were returned for this service, questions representing its top ten priorities (based on this service's InternalPriority Index) will appear in bold italics; superscripts indicate the priority number.
Last This All AHA COTHOverall Mean Period Period Facility DB Region 4 Peer Group
Section Score n=56 n=63 N=40 N=5 N=0n Question Trend Mean Change Mean Mean Rank Mean Rank Mean Rank
Overall Question Rating 96.1 -3.7 92.4* 93.7 33 N<7 N/A
Overall Question Rating †† 96.2 -3.5 92.7*
Registration 95.7 -4.4 91.3* 92.7 29 N<7 N/A
63 Helpfulness of registration person 95.8 -2.9 92.9 93.7 34 N<7 N/A
63 Ease of the registration process 9 96.7 -3.8 92.9 93.1 40 N<7 N/A
63 Waiting time in registration 95.2 -7.1 88.1* 91.2 29 N<7 N/A
Facility 93.5 -4.7 88.8 91.1 28 N<7 N/A
63 Comfort of waiting area 10 93.3 -5.6 87.7 88.2 46 N<7 N/A
63 Ease of finding your way around 7 91.4 -4.9 86.5 < 91.3 10 N<7 N/A
63 Cleanliness of facility 96.4 -4.3 92.1 93.8 23 N<7 N/A
Test or Treatment 97.8 -2.2 95.6 95.9 46 N<7 N/A
63 Friendliness of staff 98.6 -1.8 96.8 97.1 46 N<7 N/A
63 Explanations given by staff 98.2 -2.6 95.6 94.8 54 N<7 N/A
63 Skill of techs/therapists/nurses 98.2 -1.8 96.4 96.6 41 N<7 N/A
63 Staff concern for comfort 97.3 -1.7 95.6 95.8 45 N<7 N/A
62 Staff's concern/questions worries 96.9 -3.3 93.6 95.4 24 N<7 N/A
Personal Issues 95.8 -3.8 92.0 93.8 26 N<7 N/A
Personal Issues †† 96.8 -3.7 93.1*
61 Our concern for privacy 95.1 -0.4 94.7 93.7 69 N<7 N/A
61 Our sensitivity to your needs 1 96.0 -5.0 91.0 < 94.1 18 N<7 N/A
59 Response to concerns/complaints 6 96.6 -5.5 91.1 93.8 21 N<7 N/A
60 Family able to participate decision † 4 96.2 -4.1 92.1 N<7 N/A N<7 N/A
63 Staff explained roles in care † 97.8 -4.9 92.9* N<7 N/A N<7 N/A
54 Staff supported family throughout † 3 98.0 -4.5 93.5 N<7 N/A N<7 N/A
54 Staff respected having family with † 97.6 -2.2 95.4 N<7 N/A N<7 N/A
60 Staff sensitivity to your needs † 7 97.7 -2.7 95.0 N<7 N/A N<7 N/A
Overall Assessment 97.3 -2.7 94.6 95.5 28 N<7 N/A
62 Staff worked together provide care 4 97.3 -2.9 94.4 95.7 28 N<7 N/A
63 Overall rating of care 97.3 -2.1 95.2 95.7 32 N<7 N/A
63 Likelihood of recommending 2 97.3 -3.2 94.1 95.3 34 N<7 N/A
* Significantly different at .05 level< 1 standard deviation below peer group mean† Non-standard question†† Includes non-standard questions
n Number of responsesN Number of facilities in peer group
N<7 Fewer than 7 facilities
Top ten priority (based on Internal Priority Index)
Find solutions, learn best practices, and networkFor an overview of how to interpret this report page,with colleagues in other health care organizationsclick or visit the following Web page:
https://www.pressganey.com/forumhttp://www.pressganey.com/gti/gti22.htm
103

Augusta University Medical Center 10/1/2016 - 12/31/2016
OUTPATIENT SERVICES REPORTOUTPATIENT SERVICES REPORT20.7.1 Mean Trend Analysis - Physical Therapy
The broad light-colored columns show your Physical Therapy service's overall mean score, based on standard questions. One asterisk by a meanscore indicates a statistically significant change from the previous period at the .05 level; two asterisks indicate a statistically significant change inmean score at the .01 level. The narrow dark columns show your Physical Therapy service's overall score based on all questions. I-bars representeach of your peer groups: The horizontal line in the middle of each I-bar is the peer group's average mean score; the width of the I-bar representstwo standard deviations above and below the mean score. A marks the highest overall mean score obtained by Physical Therapy services ineach peer group.
84 84
86 86
88 88
90 90
92 92
94 94
96 96
98 98
100 100
87.6n=18
1/1/153/31/15
n=34/1/15
6/30/15
92.9n=59
1/1/163/31/16
93.5n=43
4/1/166/30/16
95.1n=44
7/1/169/30/16
96.1n=59
10/1/1612/31/16
20.7.2 Percentile Rank Trend Analysis - Physical TherapyThis section shows how your Physical Therapy service's overall percentile rank (for standard questions only) has changed over time. A percentilerank tells you how you perform relative to others in the database. For example, a percentile rank of 50 indicates that you scored higher than 50% ofthe other Physical Therapy services in the peer group. Percentile rank trending is provided for up to three peer groups.
0 0
10 10
20 20
30 30
40 40
50 50
60 60
70 70
80 80
90 90
1/1/153/31/151/1/153/31/151/1/153/31/15
4/1/156/30/154/1/156/30/154/1/156/30/15
1/1/163/31/161/1/163/31/16
4/1/166/30/164/1/166/30/16
7/1/169/30/167/1/169/30/16
10/1/1612/31/1610/1/1612/31/16
Standard Questions
All Questions
Highest score in peer group
n Number of responses +2 Std. Deviations
-2 Std. Deviations
COTH Peer Group Mean
+2 Std. Deviations
-2 Std. Deviations
AHA Region 4 Mean
All Facility DB Rank
AHA Region 4 Rank
+2 Std. Deviations
-2 Std. Deviations
All Facility DB Mean
Find solutions, learn best practices, and networkFor an overview of how to interpret this report page,with colleagues in other health care organizationsclick or visit the following Web page:
https://www.pressganey.com/forumhttp://www.pressganey.com/gti/gti21.htm
104

Augusta University Medical Center 10/1/2016 - 12/31/2016
OUTPATIENT SERVICES REPORTOUTPATIENT SERVICES REPORT20.7.3 Question Analysis - Physical Therapy
This section lists detailed information about your Physical Therapy service's individual question, section, and overall mean scores. Only services withseven or more responses are reported. Significant changes in mean scores from the previous report period are marked with asterisks. The amount ofchange is listed in the second column of data. Comparative data are provided on the right. To ensure confidentiality, data for questions are providedonly when the questions are asked by seven or more facilities. Greater than (>) and less than (<) symbols are used to flag mean scores that fallabove or below a peer group's mean score by one or two standard deviations. Percentile ranks describe where you stand in relation to other PhysicalTherapy services in a peer group. In electronic reports, percentile ranks lower than 50 are colored red and those higher than 50 are colored blue. If30 or more questionnaires were returned for this service, questions representing its top ten priorities (based on this service's Internal Priority Index)will appear in bold italics; superscripts indicate the priority number.
Last This All AHA COTHOverall Mean Period Period Facility DB Region 4 Peer Group
Section Score n=44 n=59 N=258 N=31 N=4n Question Trend Mean Change Mean Mean Rank Mean Rank Mean Rank
Overall Question Rating 95.1 +1.0 96.1 94.5 75 95.2 68 N<7 N/A
Overall Question Rating †† 95.2 +1.0 96.2
Registration 93.4 +3.2 96.6 93.4 88 94.4 77 N<7 N/A
59 Helpfulness of registration person 94.3 +2.7 97.0 94.3 86 95.2 78 N<7 N/A
58 Ease of the registration process 94.1 +2.9 97.0 93.9 86 95.0 76 N<7 N/A
58 Waiting time in registration 91.9 +3.8 95.7 92.2 84 93.4 65 N<7 N/A
Facility 93.1 +0.8 93.9 92.0 69 92.9 60 N<7 N/A
59 Comfort of waiting area 91.5 +0.5 92.0 89.9 70 90.6 61 N<7 N/A
59 Ease of finding your way around 8 93.5 +0.6 94.1 91.9 70 93.0 52 N<7 N/A
58 Cleanliness of facility 4 94.8 +1.3 96.1 94.4 71 95.5 60 N<7 N/A
Test or Treatment 97.4 +0.0 97.4 96.5 64 96.9 51 N<7 N/A
59 Friendliness of staff 97.7 +0.2 97.9 97.4 57 97.6 56 N<7 N/A
59 Explanations given by staff 97.1 -0.5 96.6 95.8 59 96.4 42 N<7 N/A
59 Skill of techs/therapists/nurses 97.1 +0.8 97.9 96.9 66 97.5 51 N<7 N/A
59 Staff concern for comfort 97.7 +0.6 98.3 96.6 77 97.4 56 N<7 N/A
58 Staff's concern/questions worries 97.1 -1.0 96.1 96.2 42 96.5 37 N<7 N/A
Personal Issues 94.0 +1.6 95.6 94.5 67 95.3 57 N<7 N/A
Personal Issues †† 94.9 +1.2 96.1
58 Our concern for privacy 10 93.2 +1.6 94.8 94.2 57 95.1 40 N<7 N/A
59 Our sensitivity to your needs 4 93.6 +2.6 96.2 94.8 70 95.6 54 N<7 N/A
59 Response to concerns/complaints 4 95.6 +0.2 95.8 94.9 60 95.3 46 N<7 N/A
53 Family able to participate decision † 1 93.9 +0.9 94.8 N<7 N/A N<7 N/A N<7 N/A
55 Staff explained roles in care † 2 97.0 -0.6 96.4 N<7 N/A N<7 N/A N<7 N/A
45 Staff supported family throughout † 8 93.4 +2.2 95.6 N<7 N/A N<7 N/A N<7 N/A
47 Staff respected having family with † 3 95.0 +1.3 96.3 N<7 N/A N<7 N/A N<7 N/A
57 Staff sensitivity to your needs † 7 96.5 +0.4 96.9 N<7 N/A N<7 N/A N<7 N/A
Overall Assessment 97.4 -0.4 97.0 96.1 61 96.6 52 N<7 N/A
59 Staff worked together provide care 97.1 -0.1 97.0 96.0 60 96.6 47 N<7 N/A
59 Overall rating of care 97.7 -0.7 97.0 96.4 56 96.8 50 N<7 N/A
59 Likelihood of recommending 97.2 -0.2 97.0 96.1 58 96.5 53 N<7 N/A
N<7 Fewer than 7 facilities
† Non-standard question
†† Includes non-standard questions
n Number of responses
N Number of facilities in peer group
Top ten priority (based on Internal Priority Index)
Find solutions, learn best practices, and networkFor an overview of how to interpret this report page,with colleagues in other health care organizationsclick or visit the following Web page:
https://www.pressganey.com/forumhttp://www.pressganey.com/gti/gti22.htm
105

Augusta University Medical Center 10/1/2016 - 12/31/2016
OUTPATIENT SERVICES REPORTOUTPATIENT SERVICES REPORT20.9.1 Mean Trend Analysis - Radiation Onc/Therapy
The broad light-colored columns show your Radiation Onc/Therapy service's overall mean score, based on standard questions. One asterisk by amean score indicates a statistically significant change from the previous period at the .05 level; two asterisks indicate a statistically significant changein mean score at the .01 level. The narrow dark columns show your Radiation Onc/Therapy service's overall score based on all questions. I-barsrepresent each of your peer groups: The horizontal line in the middle of each I-bar is the peer group's average mean score; the width of the I-barrepresents two standard deviations above and below the mean score. A marks the highest overall mean score obtained by RadiationOnc/Therapy services in each peer group.
88 88
90 90
92 92
94 94
96 96
98 98
100 100
93.3n=25
1/1/153/31/15
n=64/1/15
6/30/15
94.4n=89
1/1/163/31/16
96.3n=41
4/1/166/30/16
95.0n=63
7/1/169/30/16
94.1n=89
10/1/1612/31/16
20.9.2 Percentile Rank Trend Analysis - Radiation Onc/TherapyThis section shows how your Radiation Onc/Therapy service's overall percentile rank (for standard questions only) has changed over time. Apercentile rank tells you how you perform relative to others in the database. For example, a percentile rank of 50 indicates that you scored higherthan 50% of the other Radiation Onc/Therapy services in the peer group. Percentile rank trending is provided for up to three peer groups.
0 0
10 10
20 20
30 30
40 40
50 50
60 60
70 70
80 80
90 90
100 100
1/1/153/31/151/1/153/31/151/1/153/31/15
4/1/156/30/154/1/156/30/154/1/156/30/15
1/1/163/31/161/1/163/31/161/1/163/31/16
4/1/166/30/164/1/166/30/164/1/166/30/16
7/1/169/30/167/1/169/30/16
10/1/1612/31/1610/1/1612/31/16
Standard Questions
All Questions
Highest score in peer group
n Number of responses +2 Std. Deviations
-2 Std. Deviations
COTH Peer Group Mean
+2 Std. Deviations
-2 Std. Deviations
AHA Region 4 Mean
All Facility DB Rank
AHA Region 4 Rank
+2 Std. Deviations
-2 Std. Deviations
All Facility DB Mean
Find solutions, learn best practices, and networkFor an overview of how to interpret this report page,with colleagues in other health care organizationsclick or visit the following Web page:
https://www.pressganey.com/forumhttp://www.pressganey.com/gti/gti21.htm
106
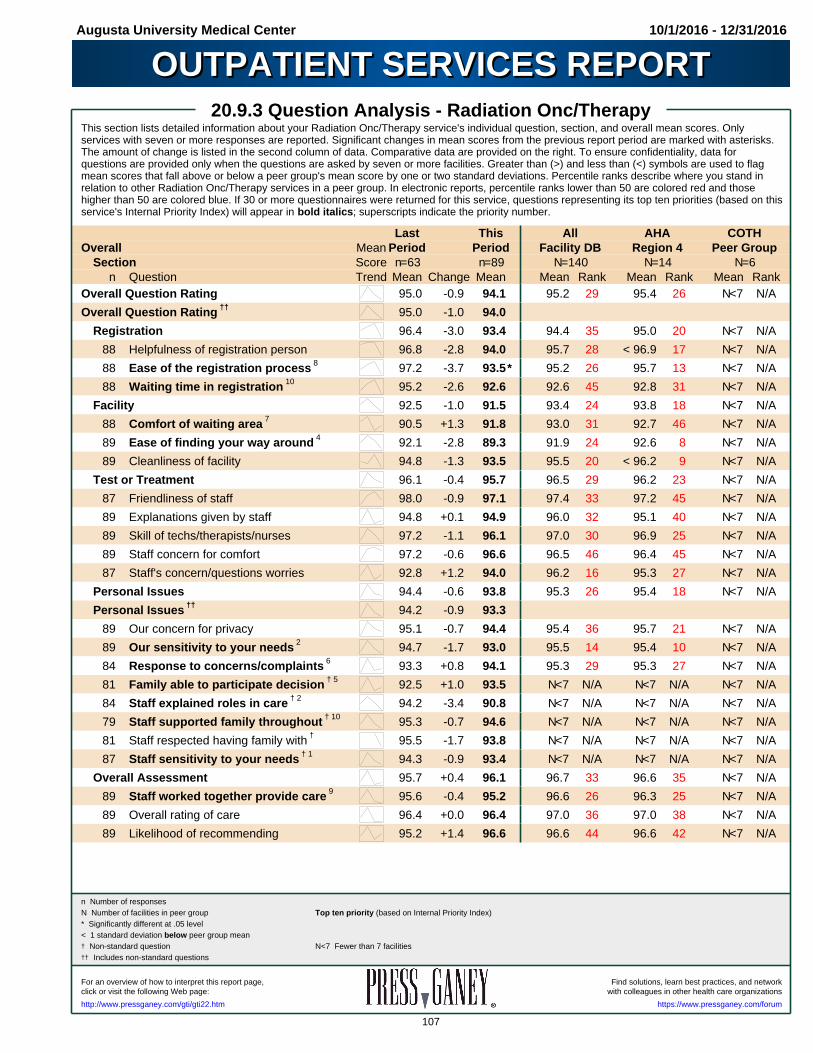
Augusta University Medical Center 10/1/2016 - 12/31/2016
OUTPATIENT SERVICES REPORTOUTPATIENT SERVICES REPORT20.9.3 Question Analysis - Radiation Onc/Therapy
This section lists detailed information about your Radiation Onc/Therapy service's individual question, section, and overall mean scores. Onlyservices with seven or more responses are reported. Significant changes in mean scores from the previous report period are marked with asterisks.The amount of change is listed in the second column of data. Comparative data are provided on the right. To ensure confidentiality, data forquestions are provided only when the questions are asked by seven or more facilities. Greater than (>) and less than (<) symbols are used to flagmean scores that fall above or below a peer group's mean score by one or two standard deviations. Percentile ranks describe where you stand inrelation to other Radiation Onc/Therapy services in a peer group. In electronic reports, percentile ranks lower than 50 are colored red and thosehigher than 50 are colored blue. If 30 or more questionnaires were returned for this service, questions representing its top ten priorities (based on thisservice's Internal Priority Index) will appear in bold italics; superscripts indicate the priority number.
Last This All AHA COTHOverall Mean Period Period Facility DB Region 4 Peer Group
Section Score n=63 n=89 N=140 N=14 N=6n Question Trend Mean Change Mean Mean Rank Mean Rank Mean Rank
Overall Question Rating 95.0 -0.9 94.1 95.2 29 95.4 26 N<7 N/A
Overall Question Rating †† 95.0 -1.0 94.0
Registration 96.4 -3.0 93.4 94.4 35 95.0 20 N<7 N/A
88 Helpfulness of registration person 96.8 -2.8 94.0 95.7 28 < 96.9 17 N<7 N/A
88 Ease of the registration process 8 97.2 -3.7 93.5* 95.2 26 95.7 13 N<7 N/A
88 Waiting time in registration 10 95.2 -2.6 92.6 92.6 45 92.8 31 N<7 N/A
Facility 92.5 -1.0 91.5 93.4 24 93.8 18 N<7 N/A
88 Comfort of waiting area 7 90.5 +1.3 91.8 93.0 31 92.7 46 N<7 N/A
89 Ease of finding your way around 4 92.1 -2.8 89.3 91.9 24 92.6 8 N<7 N/A
89 Cleanliness of facility 94.8 -1.3 93.5 95.5 20 < 96.2 9 N<7 N/A
Test or Treatment 96.1 -0.4 95.7 96.5 29 96.2 23 N<7 N/A
87 Friendliness of staff 98.0 -0.9 97.1 97.4 33 97.2 45 N<7 N/A
89 Explanations given by staff 94.8 +0.1 94.9 96.0 32 95.1 40 N<7 N/A
89 Skill of techs/therapists/nurses 97.2 -1.1 96.1 97.0 30 96.9 25 N<7 N/A
89 Staff concern for comfort 97.2 -0.6 96.6 96.5 46 96.4 45 N<7 N/A
87 Staff's concern/questions worries 92.8 +1.2 94.0 96.2 16 95.3 27 N<7 N/A
Personal Issues 94.4 -0.6 93.8 95.3 26 95.4 18 N<7 N/A
Personal Issues †† 94.2 -0.9 93.3
89 Our concern for privacy 95.1 -0.7 94.4 95.4 36 95.7 21 N<7 N/A
89 Our sensitivity to your needs 2 94.7 -1.7 93.0 95.5 14 95.4 10 N<7 N/A
84 Response to concerns/complaints 6 93.3 +0.8 94.1 95.3 29 95.3 27 N<7 N/A
81 Family able to participate decision † 5 92.5 +1.0 93.5 N<7 N/A N<7 N/A N<7 N/A
84 Staff explained roles in care † 2 94.2 -3.4 90.8 N<7 N/A N<7 N/A N<7 N/A
79 Staff supported family throughout † 10 95.3 -0.7 94.6 N<7 N/A N<7 N/A N<7 N/A
81 Staff respected having family with † 95.5 -1.7 93.8 N<7 N/A N<7 N/A N<7 N/A
87 Staff sensitivity to your needs † 1 94.3 -0.9 93.4 N<7 N/A N<7 N/A N<7 N/A
Overall Assessment 95.7 +0.4 96.1 96.7 33 96.6 35 N<7 N/A
89 Staff worked together provide care 9 95.6 -0.4 95.2 96.6 26 96.3 25 N<7 N/A
89 Overall rating of care 96.4 +0.0 96.4 97.0 36 97.0 38 N<7 N/A
89 Likelihood of recommending 95.2 +1.4 96.6 96.6 44 96.6 42 N<7 N/A
* Significantly different at .05 level< 1 standard deviation below peer group mean† Non-standard question†† Includes non-standard questions
n Number of responsesN Number of facilities in peer group
N<7 Fewer than 7 facilities
Top ten priority (based on Internal Priority Index)
Find solutions, learn best practices, and networkFor an overview of how to interpret this report page,with colleagues in other health care organizationsclick or visit the following Web page:
https://www.pressganey.com/forumhttp://www.pressganey.com/gti/gti22.htm
107
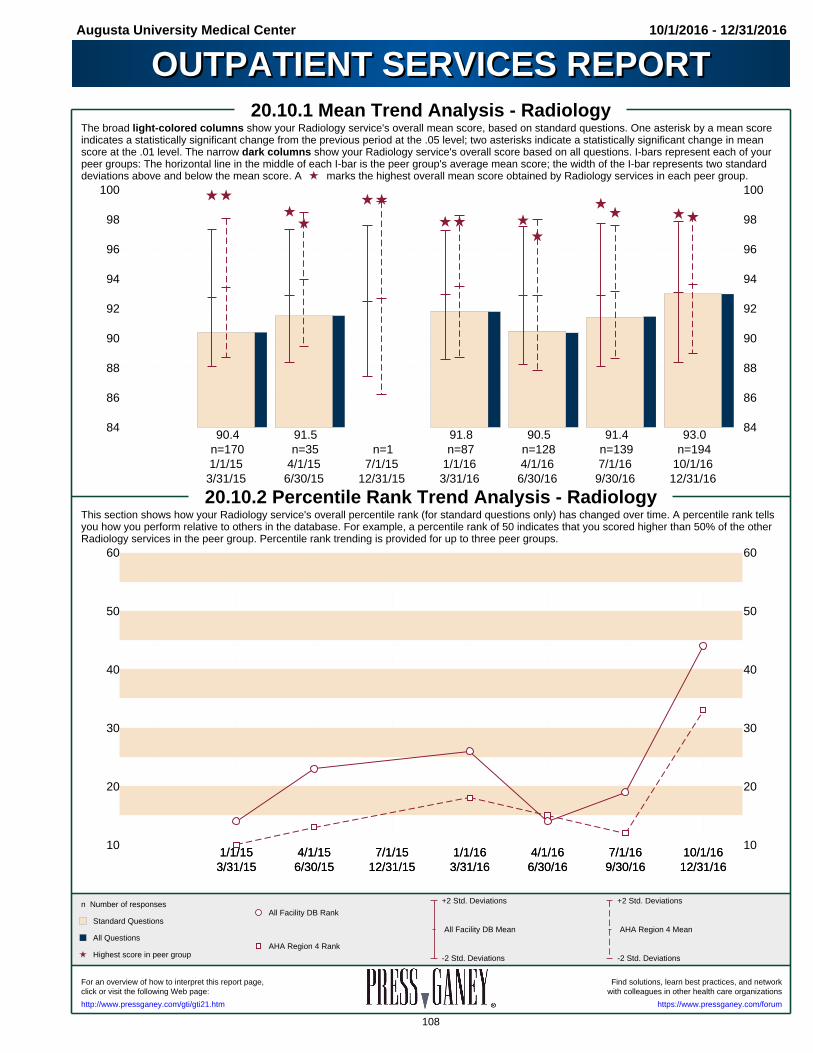
Augusta University Medical Center 10/1/2016 - 12/31/2016
OUTPATIENT SERVICES REPORTOUTPATIENT SERVICES REPORT20.10.1 Mean Trend Analysis - Radiology
The broad light-colored columns show your Radiology service's overall mean score, based on standard questions. One asterisk by a mean scoreindicates a statistically significant change from the previous period at the .05 level; two asterisks indicate a statistically significant change in meanscore at the .01 level. The narrow dark columns show your Radiology service's overall score based on all questions. I-bars represent each of yourpeer groups: The horizontal line in the middle of each I-bar is the peer group's average mean score; the width of the I-bar represents two standarddeviations above and below the mean score. A marks the highest overall mean score obtained by Radiology services in each peer group.
84 84
86 86
88 88
90 90
92 92
94 94
96 96
98 98
100 100
90.4n=1701/1/15
3/31/15
91.5n=35
4/1/156/30/15
n=17/1/15
12/31/15
91.8n=87
1/1/163/31/16
90.5n=1284/1/166/30/16
91.4n=1397/1/169/30/16
93.0n=194
10/1/1612/31/16
20.10.2 Percentile Rank Trend Analysis - RadiologyThis section shows how your Radiology service's overall percentile rank (for standard questions only) has changed over time. A percentile rank tellsyou how you perform relative to others in the database. For example, a percentile rank of 50 indicates that you scored higher than 50% of the otherRadiology services in the peer group. Percentile rank trending is provided for up to three peer groups.
10 10
20 20
30 30
40 40
50 50
60 60
1/1/153/31/151/1/153/31/15
4/1/156/30/154/1/156/30/15
7/1/1512/31/157/1/15
12/31/151/1/163/31/161/1/163/31/16
4/1/166/30/164/1/166/30/16
7/1/169/30/167/1/169/30/16
10/1/1612/31/1610/1/1612/31/16
Standard Questions
All Questions
Highest score in peer group
n Number of responses +2 Std. Deviations
-2 Std. Deviations
AHA Region 4 Mean
All Facility DB Rank
AHA Region 4 Rank
+2 Std. Deviations
-2 Std. Deviations
All Facility DB Mean
Find solutions, learn best practices, and networkFor an overview of how to interpret this report page,with colleagues in other health care organizationsclick or visit the following Web page:
https://www.pressganey.com/forumhttp://www.pressganey.com/gti/gti21.htm
108

Augusta University Medical Center 10/1/2016 - 12/31/2016
OUTPATIENT SERVICES REPORTOUTPATIENT SERVICES REPORT20.10.3 Question Analysis - Radiology
This section lists detailed information about your Radiology service's individual question, section, and overall mean scores. Only services with sevenor more responses are reported. Significant changes in mean scores from the previous report period are marked with asterisks. The amount ofchange is listed in the second column of data. Comparative data are provided on the right. To ensure confidentiality, data for questions are providedonly when the questions are asked by seven or more facilities. Greater than (>) and less than (<) symbols are used to flag mean scores that fallabove or below a peer group's mean score by one or two standard deviations. Percentile ranks describe where you stand in relation to otherRadiology services in a peer group. In electronic reports, percentile ranks lower than 50 are colored red and those higher than 50 are colored blue. If30 or more questionnaires were returned for this service, questions representing its top ten priorities (based on this service's Internal Priority Index)will appear in bold italics; superscripts indicate the priority number.
Last This All AHA COTHOverall Mean Period Period Facility DB Region 4 Peer Group
Section Score n=139 n=194 N=518 N=81 N=5n Question Trend Mean Change Mean Mean Rank Mean Rank Mean Rank
Overall Question Rating 91.4 +1.6 93.0 93.1 44 93.6 33 N<7 N/A
Overall Question Rating †† 91.4 +1.6 93.0
Registration 91.7 +0.4 92.1 92.2 44 92.6 35 N<7 N/A
191 Helpfulness of registration person 10 92.6 +0.7 93.3 93.6 44 94.1 31 N<7 N/A
191 Ease of the registration process 3 92.5 +0.0 92.5 93.3 33 93.9 26 N<7 N/A
191 Waiting time in registration 3 90.3 +0.2 90.5 89.8 50 90.0 48 N<7 N/A
Facility 88.9 +0.2 89.1 91.0 24 91.6 24 N<7 N/A
193 Comfort of waiting area 6 90.3 +0.6 90.9 89.8 59 90.4 50 N<7 N/A
191 Ease of finding your way around 85.3 -2.0 83.3 < 89.4 10 < 90.3 6 N<7 N/A
192 Cleanliness of facility 91.3 +1.9 93.2 93.7 36 94.2 25 N<7 N/A
Test or Treatment 92.5 +2.5 95.0 94.8 46 95.3 39 N<7 N/A
193 Friendliness of staff 94.5 +2.4 96.9 96.1 65 96.5 61 N<7 N/A
192 Explanations given by staff 92.1 +1.9 94.0 94.3 38 94.8 30 N<7 N/A
193 Skill of techs/therapists/nurses 93.7 +1.8 95.5 95.5 43 95.9 34 N<7 N/A
192 Staff concern for comfort 93.2 +2.2 95.4 94.5 64 95.0 56 N<7 N/A
183 Staff's concern/questions worries 6 91.4 +2.2 93.6 94.1 38 94.7 30 N<7 N/A
Personal Issues 91.4 +2.7 94.1 93.3 61 93.8 49 N<7 N/A
Personal Issues †† 91.6 +2.4 94.0
189 Our concern for privacy 93.1 +1.6 94.7 93.7 65 94.3 53 N<7 N/A
184 Our sensitivity to your needs 1 91.5 +2.1 93.6 93.3 51 93.7 44 N<7 N/A
167 Response to concerns/complaints 10 91.2 +2.5 93.7 93.0 57 93.4 49 N<7 N/A
171 Family able to participate decision † 6 92.9 +1.0 93.9 N<7 N/A N<7 N/A N<7 N/A
183 Staff explained roles in care † 91.3 +3.2 94.5* 92.7 67 N<7 N/A N<7 N/A
167 Staff supported family throughout † 2 93.0 +0.4 93.4 N<7 N/A N<7 N/A N<7 N/A
165 Staff respected having family with † 6 94.0 +0.2 94.2 N<7 N/A N<7 N/A N<7 N/A
171 Staff sensitivity to your needs † 10 92.2 +1.7 93.9 N<7 N/A N<7 N/A N<7 N/A
Overall Assessment 93.2 +2.3 95.5 94.5 65 95.0 54 N<7 N/A
191 Staff worked together provide care 5 93.4 +2.0 95.4 94.5 64 95.0 56 N<7 N/A
191 Overall rating of care 93.2 +3.3 96.5* 94.9 79 95.3 74 N<7 N/A
189 Likelihood of recommending 93.4 +1.6 95.0 94.4 53 94.8 43 N<7 N/A
* Significantly different at .05 level< 1 standard deviation below peer group mean† Non-standard question†† Includes non-standard questions
n Number of responsesN Number of facilities in peer group
N<7 Fewer than 7 facilities
Top ten priority (based on Internal Priority Index)
Find solutions, learn best practices, and networkFor an overview of how to interpret this report page,with colleagues in other health care organizationsclick or visit the following Web page:
https://www.pressganey.com/forumhttp://www.pressganey.com/gti/gti22.htm
109

Augusta University Medical Center 10/1/2016 - 12/31/2016
OUTPATIENT SERVICES REPORTOUTPATIENT SERVICES REPORT20.11.1 Mean Trend Analysis - Rehab Services
The broad light-colored columns show your Rehab Services service's overall mean score, based on standard questions. One asterisk by a meanscore indicates a statistically significant change from the previous period at the .05 level; two asterisks indicate a statistically significant change inmean score at the .01 level. The narrow dark columns show your Rehab Services service's overall score based on all questions. I-bars representeach of your peer groups: The horizontal line in the middle of each I-bar is the peer group's average mean score; the width of the I-bar representstwo standard deviations above and below the mean score. A marks the highest overall mean score obtained by Rehab Services services in eachpeer group.
84 84
86 86
88 88
90 90
92 92
94 94
96 96
98 98
100 100
89.0n=71
1/1/153/31/15
90.3n=24
4/1/156/30/15
n=27/1/15
12/31/15
93.5**n=70
1/1/163/31/16
96.6n=36
4/1/166/30/16
96.1n=74
7/1/169/30/16
94.9n=68
10/1/1612/31/16
20.11.2 Percentile Rank Trend Analysis - Rehab ServicesThis section shows how your Rehab Services service's overall percentile rank (for standard questions only) has changed over time. A percentile ranktells you how you perform relative to others in the database. For example, a percentile rank of 50 indicates that you scored higher than 50% of theother Rehab Services services in the peer group. Percentile rank trending is provided for up to three peer groups.
0 0
10 10
20 20
30 30
40 40
50 50
60 60
70 70
80 80
90 90
100 100
1/1/153/31/151/1/153/31/15
4/1/156/30/154/1/156/30/15
7/1/1512/31/157/1/15
12/31/151/1/163/31/161/1/163/31/16
4/1/166/30/164/1/166/30/16
7/1/169/30/167/1/169/30/16
10/1/1612/31/1610/1/1612/31/16
** Sig. different from previous period (p<.01)
Standard Questions
All Questions
Highest score in peer group
n Number of responses +2 Std. Deviations
-2 Std. Deviations
AHA Region 4 Mean
All Facility DB Rank
AHA Region 4 Rank
+2 Std. Deviations
-2 Std. Deviations
All Facility DB Mean
Find solutions, learn best practices, and networkFor an overview of how to interpret this report page,with colleagues in other health care organizationsclick or visit the following Web page:
https://www.pressganey.com/forumhttp://www.pressganey.com/gti/gti21.htm
110

Augusta University Medical Center 10/1/2016 - 12/31/2016
OUTPATIENT SERVICES REPORTOUTPATIENT SERVICES REPORT20.11.3 Question Analysis - Rehab Services
This section lists detailed information about your Rehab Services service's individual question, section, and overall mean scores. Only services withseven or more responses are reported. Significant changes in mean scores from the previous report period are marked with asterisks. The amount ofchange is listed in the second column of data. Comparative data are provided on the right. To ensure confidentiality, data for questions are providedonly when the questions are asked by seven or more facilities. Greater than (>) and less than (<) symbols are used to flag mean scores that fallabove or below a peer group's mean score by one or two standard deviations. Percentile ranks describe where you stand in relation to other RehabServices services in a peer group. In electronic reports, percentile ranks lower than 50 are colored red and those higher than 50 are colored blue. If30 or more questionnaires were returned for this service, questions representing its top ten priorities (based on this service's Internal Priority Index)will appear in bold italics; superscripts indicate the priority number.
Last This All AHA COTHOverall Mean Period Period Facility DB Region 4 Peer Group
Section Score n=74 n=68 N=116 N=21 N=3n Question Trend Mean Change Mean Mean Rank Mean Rank Mean Rank
Overall Question Rating 96.1 -1.2 94.9 93.8 64 94.2 55 N<7 N/A
Overall Question Rating †† 96.2 -1.1 95.1
Registration 94.9 -0.9 94.0 92.4 65 92.5 65 N<7 N/A
68 Helpfulness of registration person 3 95.3 -1.2 94.1 93.4 55 93.5 52 N<7 N/A
66 Ease of the registration process 7 95.5 -1.6 93.9 93.0 56 93.1 48 N<7 N/A
67 Waiting time in registration 94.4 +0.0 94.4 > 90.8 84 > 90.9 96 N<7 N/A
Facility 96.0 -3.2 92.8 91.3 68 91.7 74 N<7 N/A
68 Comfort of waiting area 8 94.6 -4.2 90.4 88.9 61 88.8 75 N<7 N/A
67 Ease of finding your way around 9 95.3 -2.0 93.3 91.3 68 92.5 64 N<7 N/A
68 Cleanliness of facility 98.0 -2.8 95.2 93.8 65 94.0 68 N<7 N/A
Test or Treatment 97.3 -0.8 96.5 96.1 55 96.4 49 N<7 N/A
68 Friendliness of staff 97.6 +0.2 97.8 97.0 58 97.2 47 N<7 N/A
67 Explanations given by staff 6 97.0 -1.1 95.9 95.5 54 96.0 45 N<7 N/A
68 Skill of techs/therapists/nurses 5 98.3 -2.3 96.0 96.5 34 96.7 35 N<7 N/A
68 Staff concern for comfort 97.3 -0.2 97.1 96.0 60 96.1 58 N<7 N/A
65 Staff's concern/questions worries 9 96.2 +0.0 96.2 95.6 53 95.9 47 N<7 N/A
Personal Issues 95.8 -1.8 94.0 93.9 49 94.3 40 N<7 N/A
Personal Issues †† 96.4 -1.2 95.2
67 Our concern for privacy 95.9 -3.4 92.5 93.7 32 94.1 29 N<7 N/A
66 Our sensitivity to your needs 4 95.3 -0.2 95.1 94.3 59 94.7 47 N<7 N/A
63 Response to concerns/complaints 1 96.6 -2.2 94.4 94.1 54 94.5 44 N<7 N/A
60 Family able to participate decision † 2 96.2 -1.2 95.0 N<7 N/A N<7 N/A N<7 N/A
67 Staff explained roles in care † 9 95.6 -0.1 95.5 N<7 N/A N<7 N/A N<7 N/A
56 Staff supported family throughout † 97.5 -1.1 96.4 N<7 N/A N<7 N/A N<7 N/A
59 Staff respected having family with † 97.9 -1.7 96.2 N<7 N/A N<7 N/A N<7 N/A
64 Staff sensitivity to your needs † 96.5 -0.4 96.1 N<7 N/A N<7 N/A N<7 N/A
Overall Assessment 96.6 +0.4 97.0 95.6 69 96.2 55 N<7 N/A
65 Staff worked together provide care 96.5 +0.4 96.9 95.5 68 96.2 57 N<7 N/A
66 Overall rating of care 96.3 +0.7 97.0 95.9 66 96.5 52 N<7 N/A
66 Likelihood of recommending 96.9 +0.1 97.0 95.6 68 96.2 63 N<7 N/A
> 1 standard deviation above peer group meanN<7 Fewer than 7 facilities† Non-standard question†† Includes non-standard questions
n Number of responsesN Number of facilities in peer group
Top ten priority (based on Internal Priority Index)
Find solutions, learn best practices, and networkFor an overview of how to interpret this report page,with colleagues in other health care organizationsclick or visit the following Web page:
https://www.pressganey.com/forumhttp://www.pressganey.com/gti/gti22.htm
111

Augusta University Medical Center 10/1/2016 - 12/31/2016
OUTPATIENT SERVICES REPORTOUTPATIENT SERVICES REPORT20.12.1 Mean Trend Analysis - Sleep Disorders
The broad light-colored columns show your Sleep Disorders service's overall mean score, based on standard questions. One asterisk by a meanscore indicates a statistically significant change from the previous period at the .05 level; two asterisks indicate a statistically significant change inmean score at the .01 level. The narrow dark columns show your Sleep Disorders service's overall score based on all questions. I-bars representeach of your peer groups: The horizontal line in the middle of each I-bar is the peer group's average mean score; the width of the I-bar representstwo standard deviations above and below the mean score. A marks the highest overall mean score obtained by Sleep Disorders services in eachpeer group.
78 78
80 80
82 82
84 84
86 86
88 88
90 90
92 92
94 94
96 96
98 98
100 100
93.3n=35
1/1/153/31/15
90.1n=9
4/1/156/30/15
88.1n=57
1/1/163/31/16
93.4n=43
4/1/166/30/16
92.7n=49
7/1/169/30/16
90.5n=42
10/1/1612/31/16
20.12.2 Percentile Rank Trend Analysis - Sleep DisordersThis section shows how your Sleep Disorders service's overall percentile rank (for standard questions only) has changed over time. A percentile ranktells you how you perform relative to others in the database. For example, a percentile rank of 50 indicates that you scored higher than 50% of theother Sleep Disorders services in the peer group. Percentile rank trending is provided for up to three peer groups.
0 0
10 10
20 20
30 30
40 40
50 50
60 60
1/1/153/31/151/1/153/31/15
4/1/156/30/154/1/156/30/154/1/156/30/15
1/1/163/31/161/1/163/31/16
4/1/166/30/164/1/166/30/16
7/1/169/30/167/1/169/30/167/1/169/30/16
10/1/1612/31/1610/1/1612/31/16
Standard Questions
All Questions
Highest score in peer group
n Number of responses +2 Std. Deviations
-2 Std. Deviations
COTH Peer Group Mean
+2 Std. Deviations
-2 Std. Deviations
AHA Region 4 Mean
All Facility DB Rank
AHA Region 4 Rank
+2 Std. Deviations
-2 Std. Deviations
All Facility DB Mean
Find solutions, learn best practices, and networkFor an overview of how to interpret this report page,with colleagues in other health care organizationsclick or visit the following Web page:
https://www.pressganey.com/forumhttp://www.pressganey.com/gti/gti21.htm
112

Augusta University Medical Center 10/1/2016 - 12/31/2016
OUTPATIENT SERVICES REPORTOUTPATIENT SERVICES REPORT20.12.3 Question Analysis - Sleep Disorders
This section lists detailed information about your Sleep Disorders service's individual question, section, and overall mean scores. Only services withseven or more responses are reported. Significant changes in mean scores from the previous report period are marked with asterisks. The amount ofchange is listed in the second column of data. Comparative data are provided on the right. To ensure confidentiality, data for questions are providedonly when the questions are asked by seven or more facilities. Greater than (>) and less than (<) symbols are used to flag mean scores that fallabove or below a peer group's mean score by one or two standard deviations. Percentile ranks describe where you stand in relation to other SleepDisorders services in a peer group. In electronic reports, percentile ranks lower than 50 are colored red and those higher than 50 are colored blue. If30 or more questionnaires were returned for this service, questions representing its top ten priorities (based on this service's Internal Priority Index)will appear in bold italics; superscripts indicate the priority number.
Last This All AHA COTHOverall Mean Period Period Facility DB Region 4 Peer Group
Section Score n=49 n=42 N=189 N=24 N=6n Question Trend Mean Change Mean Mean Rank Mean Rank Mean Rank
Overall Question Rating 92.7 -2.2 90.5 93.2 17 < 94.6 5 N<7 N/A
Overall Question Rating †† 92.8 -2.3 90.5
Registration 93.9 -3.4 90.5 92.8 20 << 94.9 3 N<7 N/A
42 Helpfulness of registration person 93.9 -1.6 92.3 93.2 31 < 95.2 12 N<7 N/A
42 Ease of the registration process 95.0 -3.9 91.1 93.1 25 < 95.0 8 N<7 N/A
42 Waiting time in registration 6 92.8 -4.7 88.1 92.2 15 << 94.5 3 N<7 N/A
Facility 91.4 -2.1 89.3 90.7 33 92.3 19 N<7 N/A
42 Comfort of waiting area 6 92.2 -1.7 90.5 90.2 49 91.5 29 N<7 N/A
42 Ease of finding your way around 6 88.8 -2.5 86.3 88.5 33 90.5 19 N<7 N/A
42 Cleanliness of facility 93.4 -2.3 91.1 93.7 21 < 94.9 11 N<7 N/A
Test or Treatment 94.1 -2.1 92.0 95.1 13 < 96.1 9 N<7 N/A
42 Friendliness of staff 93.9 -0.4 93.5 96.0 17 << 97.4 3 N<7 N/A
42 Explanations given by staff 4 96.9 -6.4 90.5* < 95.1 9 < 95.8 5 N<7 N/A
42 Skill of techs/therapists/nurses 96.4 -4.1 92.3 < 95.7 13 << 96.9 5 N<7 N/A
42 Staff concern for comfort 92.9 -1.2 91.7 94.7 17 < 95.8 10 N<7 N/A
42 Staff's concern/questions worries 89.7 +2.6 92.3 94.5 22 < 95.1 15 N<7 N/A
Personal Issues 92.1 -1.0 91.1 93.7 19 < 94.6 12 N<7 N/A
Personal Issues †† 92.5 -1.7 90.8
41 Our concern for privacy 94.8 -3.3 91.5 94.2 19 < 94.8 19 N<7 N/A
41 Our sensitivity to your needs 93.6 -2.1 91.5 93.6 22 < 94.5 11 N<7 N/A
41 Response to concerns/complaints 10 90.4 -0.2 90.2 93.5 15 < 94.3 11 N<7 N/A
39 Family able to participate decision † 92.4 -1.4 91.0 N<7 N/A N<7 N/A N<7 N/A
41 Staff explained roles in care † 4 94.8 -3.9 90.9 N<7 N/A N<7 N/A N<7 N/A
36 Staff supported family throughout † 1 93.4 -3.8 89.6 N<7 N/A N<7 N/A N<7 N/A
38 Staff respected having family with † 94.9 -3.4 91.5 N<7 N/A N<7 N/A N<7 N/A
39 Staff sensitivity to your needs † 1 91.3 -1.6 89.7 N<7 N/A N<7 N/A N<7 N/A
Overall Assessment 93.2 -3.2 90.0 < 94.3 13 << 96.0 2 N<7 N/A
40 Staff worked together provide care 6 94.2 -3.6 90.6 < 94.6 14 < 95.9 7 N<7 N/A
41 Overall rating of care 3 93.8 -3.6 90.2 < 95.0 10 << 96.4 2 N<7 N/A
41 Likelihood of recommending 93.6 -2.7 90.9 93.6 19 < 95.8 4 N<7 N/A
< 1 standard deviation below peer group mean<< 2 standard deviations below peer group mean† Non-standard question†† Includes non-standard questions
n Number of responsesN Number of facilities in peer group
* Significantly different at .05 level
N<7 Fewer than 7 facilities
Top ten priority (based on Internal Priority Index)
Find solutions, learn best practices, and networkFor an overview of how to interpret this report page,with colleagues in other health care organizationsclick or visit the following Web page:
https://www.pressganey.com/forumhttp://www.pressganey.com/gti/gti22.htm
113

Augusta University Medical Center 10/1/2016 - 12/31/2016
OUTPATIENT SERVICES REPORTOUTPATIENT SERVICES REPORT20.13.1 Mean Trend Analysis - Ultrasound
The broad light-colored columns show your Ultrasound service's overall mean score, based on standard questions. One asterisk by a mean scoreindicates a statistically significant change from the previous period at the .05 level; two asterisks indicate a statistically significant change in meanscore at the .01 level. The narrow dark columns show your Ultrasound service's overall score based on all questions. I-bars represent each of yourpeer groups: The horizontal line in the middle of each I-bar is the peer group's average mean score; the width of the I-bar represents two standarddeviations above and below the mean score. A marks the highest overall mean score obtained by Ultrasound services in each peer group.
76 76
78 78
80 80
82 82
84 84
86 86
88 88
90 90
92 92
94 94
96 96
98 98
100 100
90.4n=27
1/1/153/31/15
79.8n=7
4/1/156/30/15
n=17/1/15
12/31/15
87.2n=14
1/1/163/31/16
81.6n=19
4/1/166/30/16
87.5n=12
7/1/169/30/16
94.5n=15
10/1/1612/31/16
20.13.2 Percentile Rank Trend Analysis - UltrasoundThis section shows how your Ultrasound service's overall percentile rank (for standard questions only) has changed over time. A percentile rank tellsyou how you perform relative to others in the database. For example, a percentile rank of 50 indicates that you scored higher than 50% of the otherUltrasound services in the peer group. Percentile rank trending is provided for up to three peer groups.
0 0
10 10
20 20
30 30
40 40
50 50
60 60
70 70
80 80
90 90
1/1/153/31/151/1/153/31/151/1/153/31/15
4/1/156/30/154/1/156/30/154/1/156/30/15
7/1/1512/31/157/1/15
12/31/157/1/15
12/31/151/1/163/31/161/1/163/31/161/1/163/31/16
4/1/166/30/164/1/166/30/164/1/166/30/16
7/1/169/30/167/1/169/30/167/1/169/30/16
10/1/1612/31/1610/1/1612/31/1610/1/1612/31/16
Standard Questions
All Questions
Highest score in peer group
n Number of responses +2 Std. Deviations
-2 Std. Deviations
COTH Peer Group Mean
+2 Std. Deviations
-2 Std. Deviations
AHA Region 4 Mean
All Facility DB Rank
AHA Region 4 Rank
COTH Peer Group Rank
+2 Std. Deviations
-2 Std. Deviations
All Facility DB Mean
Find solutions, learn best practices, and networkFor an overview of how to interpret this report page,with colleagues in other health care organizationsclick or visit the following Web page:
https://www.pressganey.com/forumhttp://www.pressganey.com/gti/gti21.htm
114

Augusta University Medical Center 10/1/2016 - 12/31/2016
OUTPATIENT SERVICES REPORTOUTPATIENT SERVICES REPORT20.13.3 Question Analysis - Ultrasound
This section lists detailed information about your Ultrasound service's individual question, section, and overall mean scores. Only services with sevenor more responses are reported. Significant changes in mean scores from the previous report period are marked with asterisks. The amount ofchange is listed in the second column of data. Comparative data are provided on the right. To ensure confidentiality, data for questions are providedonly when the questions are asked by seven or more facilities. Greater than (>) and less than (<) symbols are used to flag mean scores that fallabove or below a peer group's mean score by one or two standard deviations. Percentile ranks describe where you stand in relation to otherUltrasound services in a peer group. In electronic reports, percentile ranks lower than 50 are colored red and those higher than 50 are colored blue. If30 or more questionnaires were returned for this service, questions representing its top ten priorities (based on this service's Internal Priority Index)will appear in bold italics; superscripts indicate the priority number.
Last This All AHA COTHOverall Mean Period Period Facility DB Region 4 Peer Group
Section Score n=12 n=15 N=707 N=136 N=12n Question Trend Mean Change Mean Mean Rank Mean Rank Mean Rank
Overall Question Rating 87.5 +7.0 94.5 92.6 74 93.0 67 93.5 77
Overall Question Rating †† 87.5 +6.8 94.3
Registration 84.0 +9.3 93.3 91.9 64 92.0 57 93.2 63
15 Helpfulness of registration person 85.4 +9.6 95.0 93.2 69 93.6 62 94.1 64
15 Ease of the registration process 83.3 +13.4 96.7 > 93.1 88 93.3 85 94.2 89
15 Waiting time in registration 83.3 +5.0 88.3 89.4 35 89.3 36 91.2 9
Facility 86.8 +5.4 92.2 90.5 66 91.4 54 90.7 60
15 Comfort of waiting area 79.2 +14.1 93.3 89.4 82 90.3 75 90.7 86
15 Ease of finding your way around 91.7 -1.7 90.0 88.9 55 89.9 43 88.5 60
15 Cleanliness of facility 89.6 +3.7 93.3 93.2 47 93.9 38 93.4 36
Test or Treatment 90.4 +4.9 95.3 94.4 58 94.8 47 95.2 37
14 Friendliness of staff 87.5 +7.1 94.6 95.7 25 96.0 21 96.6 19
15 Explanations given by staff 89.6 +5.4 95.0 93.6 62 94.1 57 94.9 43
15 Skill of techs/therapists/nurses 93.8 +4.5 98.3 > 95.3 90 95.7 88 > 95.8 99
15 Staff concern for comfort 91.7 +5.0 96.7 94.1 79 94.6 75 95.2 67
15 Staff's concern/questions worries 89.6 +2.1 91.7 93.4 24 93.9 22 < 93.7 15
Personal Issues 87.5 +8.1 95.6 92.7 83 92.9 76 94.0 75
Personal Issues †† 87.5 +6.9 94.4
15 Our concern for privacy 87.5 +9.2 96.7 > 93.3 90 > 93.4 89 > 94.2 82
15 Our sensitivity to your needs 85.4 +9.6 95.0* 92.7 77 93.0 72 94.2 68
15 Response to concerns/complaints 89.6 +5.4 95.0 92.4 76 92.4 66 94.0 62
14 Family able to participate decision † 89.6 +3.3 92.9 N<7 N/A N<7 N/A N<7 N/A
15 Staff explained roles in care † 87.5 +4.2 91.7 N<7 N/A N<7 N/A N<7 N/A
13 Staff supported family throughout † 90.9 +5.3 96.2 N<7 N/A N<7 N/A N<7 N/A
13 Staff respected having family with † 86.4 +9.8 96.2 N<7 N/A N<7 N/A N<7 N/A
14 Staff sensitivity to your needs † 86.4 +6.5 92.9 N<7 N/A N<7 N/A N<7 N/A
Overall Assessment 88.9 +7.2 96.1 94.0 74 94.3 66 95.1 65
15 Staff worked together provide care 87.5 +9.2 96.7 93.9 82 94.4 76 94.6 86
15 Overall rating of care 87.5 +7.5 95.0 94.5 51 94.8 42 95.6 21
15 Likelihood of recommending 91.7 +5.0 96.7 93.8 80 94.1 72 95.2 64
n Number of responses
N Number of facilities in peer group * Significantly different at .05 level
> 1 standard deviation above peer group mean< 1 standard deviation below peer group mean
N<7 Fewer than 7 facilities
† Non-standard question†† Includes non-standard questions
Find solutions, learn best practices, and networkFor an overview of how to interpret this report page,with colleagues in other health care organizationsclick or visit the following Web page:
https://www.pressganey.com/forumhttp://www.pressganey.com/gti/gti22.htm
115

Augusta University Medical Center 10/1/2016 - 12/31/2016
OUTPATIENT SERVICES REPORTOUTPATIENT SERVICES REPORT20.14.1 Mean Trend Analysis - X-Ray
The broad light-colored columns show your X-Ray service's overall mean score, based on standard questions. One asterisk by a mean scoreindicates a statistically significant change from the previous period at the .05 level; two asterisks indicate a statistically significant change in meanscore at the .01 level. The narrow dark columns show your X-Ray service's overall score based on all questions. I-bars represent each of your peergroups: The horizontal line in the middle of each I-bar is the peer group's average mean score; the width of the I-bar represents two standarddeviations above and below the mean score. A marks the highest overall mean score obtained by X-Ray services in each peer group.
84 84
86 86
88 88
90 90
92 92
94 94
96 96
98 98
100 100
89.9n=74
1/1/153/31/15
90.9n=38
4/1/156/30/15
n=17/1/15
12/31/15
89.7n=64
1/1/163/31/16
90.5n=61
4/1/166/30/16
91.4n=86
7/1/169/30/16
89.0n=75
10/1/1612/31/16
20.14.2 Percentile Rank Trend Analysis - X-RayThis section shows how your X-Ray service's overall percentile rank (for standard questions only) has changed over time. A percentile rank tells youhow you perform relative to others in the database. For example, a percentile rank of 50 indicates that you scored higher than 50% of the otherX-Ray services in the peer group. Percentile rank trending is provided for up to three peer groups.
0 0
10 10
20 20
30 30
40 40
1/1/153/31/151/1/153/31/151/1/153/31/15
4/1/156/30/154/1/156/30/154/1/156/30/15
7/1/1512/31/157/1/15
12/31/157/1/15
12/31/151/1/163/31/161/1/163/31/161/1/163/31/16
4/1/166/30/164/1/166/30/164/1/166/30/16
7/1/169/30/167/1/169/30/167/1/169/30/16
10/1/1612/31/1610/1/1612/31/1610/1/1612/31/16
Standard Questions
All Questions
Highest score in peer group
n Number of responses +2 Std. Deviations
-2 Std. Deviations
COTH Peer Group Mean
+2 Std. Deviations
-2 Std. Deviations
AHA Region 4 Mean
All Facility DB Rank
AHA Region 4 Rank
COTH Peer Group Rank
+2 Std. Deviations
-2 Std. Deviations
All Facility DB Mean
Find solutions, learn best practices, and networkFor an overview of how to interpret this report page,with colleagues in other health care organizationsclick or visit the following Web page:
https://www.pressganey.com/forumhttp://www.pressganey.com/gti/gti21.htm
116

Augusta University Medical Center 10/1/2016 - 12/31/2016
OUTPATIENT SERVICES REPORTOUTPATIENT SERVICES REPORT20.14.3 Question Analysis - X-Ray
This section lists detailed information about your X-Ray service's individual question, section, and overall mean scores. Only services with seven ormore responses are reported. Significant changes in mean scores from the previous report period are marked with asterisks. The amount of changeis listed in the second column of data. Comparative data are provided on the right. To ensure confidentiality, data for questions are provided onlywhen the questions are asked by seven or more facilities. Greater than (>) and less than (<) symbols are used to flag mean scores that fall above orbelow a peer group's mean score by one or two standard deviations. Percentile ranks describe where you stand in relation to other X-Ray services ina peer group. In electronic reports, percentile ranks lower than 50 are colored red and those higher than 50 are colored blue. If 30 or morequestionnaires were returned for this service, questions representing its top ten priorities (based on this service's Internal Priority Index) will appear inbold italics; superscripts indicate the priority number.
Last This All AHA COTHOverall Mean Period Period Facility DB Region 4 Peer Group
Section Score n=86 n=75 N=422 N=78 N=11n Question Trend Mean Change Mean Mean Rank Mean Rank Mean Rank
Overall Question Rating 91.4 -2.4 89.0 < 92.8 8 < 93.5 4 << 93.2 1
Overall Question Rating †† 91.3 -2.1 89.2
Registration 92.7 -3.1 89.6 91.9 21 92.2 17 < 92.7 1
73 Helpfulness of registration person 93.6 -1.1 92.5 93.5 28 93.8 26 93.9 17
74 Ease of the registration process 93.5 -2.3 91.2 93.0 25 93.4 25 < 93.5 8
74 Waiting time in registration 9 90.7 -4.9 85.8 89.2 17 89.4 17 << 90.7 1
Facility 90.5 -2.6 87.9 90.8 18 < 91.7 15 89.6 19
75 Comfort of waiting area 89.8 -2.1 87.7 89.8 23 90.4 22 89.3 15
74 Ease of finding your way around 88.3 -2.1 86.2 89.3 21 < 90.6 15 86.8 51
74 Cleanliness of facility 92.8 -2.9 89.9 < 93.4 12 < 94.0 10 < 92.9 10
Test or Treatment 92.0 -2.1 89.9 < 94.7 4 << 95.4 2 << 95.0 1
75 Friendliness of staff 94.5 -2.8 91.7 < 95.9 5 << 96.5 2 << 96.3 1
75 Explanations given by staff 10 91.6 -1.9 89.7 < 94.3 5 < 95.0 3 << 94.5 1
75 Skill of techs/therapists/nurses 92.5 -1.5 91.0 < 95.3 5 << 96.0 3 << 95.8 1
75 Staff concern for comfort 3 91.2 -3.5 87.7 << 94.2 3 << 95.0 1 << 94.4 1
74 Staff's concern/questions worries 89.9 -0.7 89.2 < 93.8 7 < 94.7 6 << 93.9 1
Personal Issues 90.0 -2.6 87.4 < 92.9 5 << 93.6 3 << 93.6 1
Personal Issues †† 89.5 -1.0 88.5
73 Our concern for privacy 7 89.6 -0.9 88.7 < 93.3 6 < 93.9 7 << 93.9 1
72 Our sensitivity to your needs 1 89.9 -3.1 86.8 << 92.9 4 << 93.6 3 << 93.9 1
67 Response to concerns/complaints 2 90.6 -5.1 85.5 << 92.7 2 << 93.4 2 << 93.3 1
69 Family able to participate decision † 92.0 -3.2 88.8 N<7 N/A N<7 N/A N<7 N/A
72 Staff explained roles in care † 5 87.2 +1.3 88.5 N<7 N/A N<7 N/A N<7 N/A
66 Staff supported family throughout † 91.2 -1.0 90.2 N<7 N/A N<7 N/A N<7 N/A
66 Staff respected having family with † 92.1 -1.2 90.9 N<7 N/A N<7 N/A N<7 N/A
69 Staff sensitivity to your needs † 4 91.6 -4.6 87.0 N<7 N/A N<7 N/A N<7 N/A
Overall Assessment 92.6 -2.5 90.1 < 94.2 8 < 94.8 6 << 94.9 1
72 Staff worked together provide care 93.2 -1.9 91.3 < 94.1 14 < 94.8 9 << 94.7 1
74 Overall rating of care 8 91.0 -0.5 90.5 < 94.5 7 < 95.2 5 << 95.4 1
74 Likelihood of recommending 6 93.4 -4.2 89.2 < 94.1 6 < 94.7 4 << 94.9 1
< 1 standard deviation below peer group mean<< 2 standard deviations below peer group mean† Non-standard question†† Includes non-standard questions
n Number of responsesN Number of facilities in peer group
N<7 Fewer than 7 facilities
Top ten priority (based on Internal Priority Index)
Find solutions, learn best practices, and networkFor an overview of how to interpret this report page,with colleagues in other health care organizationsclick or visit the following Web page:
https://www.pressganey.com/forumhttp://www.pressganey.com/gti/gti22.htm
117
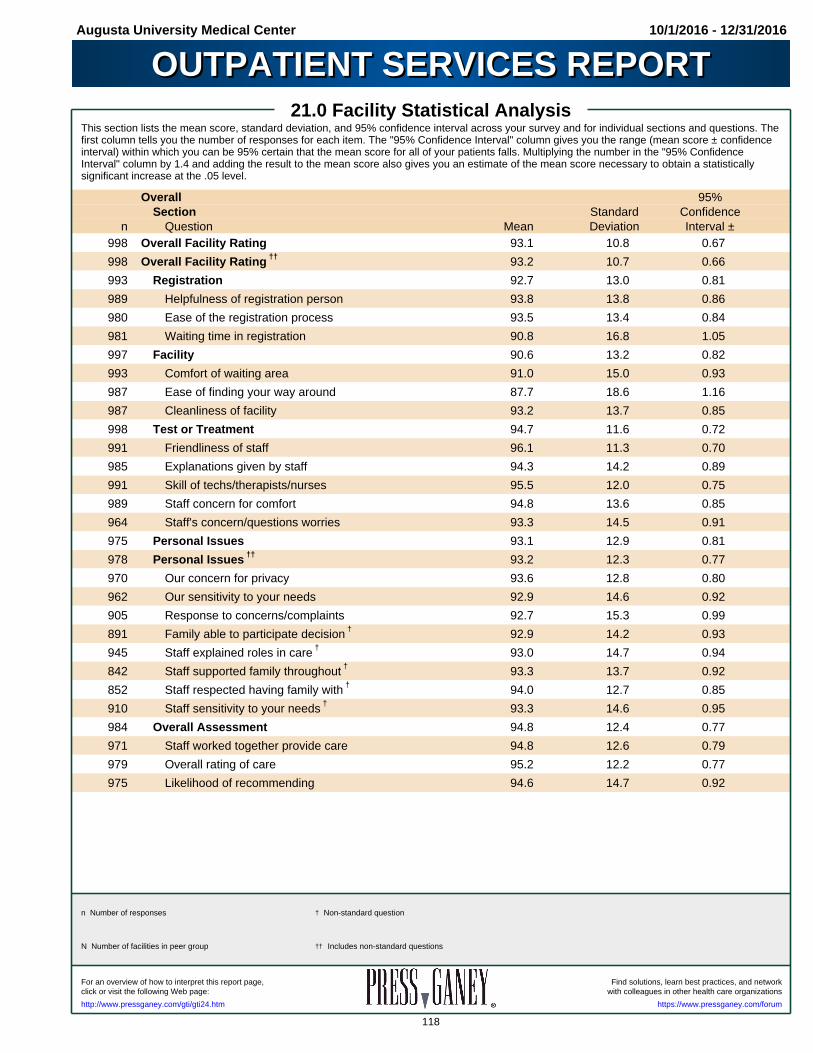
Augusta University Medical Center 10/1/2016 - 12/31/2016
OUTPATIENT SERVICES REPORTOUTPATIENT SERVICES REPORT21.0 Facility Statistical Analysis
This section lists the mean score, standard deviation, and 95% confidence interval across your survey and for individual sections and questions. Thefirst column tells you the number of responses for each item. The "95% Confidence Interval" column gives you the range (mean score ± confidenceinterval) within which you can be 95% certain that the mean score for all of your patients falls. Multiplying the number in the "95% ConfidenceInterval" column by 1.4 and adding the result to the mean score also gives you an estimate of the mean score necessary to obtain a statisticallysignificant increase at the .05 level.
Overall 95%Section Standard Confidence
n Question Mean Deviation Interval ±998 Overall Facility Rating 93.1 10.8 0.67
998 Overall Facility Rating †† 93.2 10.7 0.66
993 Registration 92.7 13.0 0.81
989 Helpfulness of registration person 93.8 13.8 0.86
980 Ease of the registration process 93.5 13.4 0.84
981 Waiting time in registration 90.8 16.8 1.05
997 Facility 90.6 13.2 0.82
993 Comfort of waiting area 91.0 15.0 0.93
987 Ease of finding your way around 87.7 18.6 1.16
987 Cleanliness of facility 93.2 13.7 0.85
998 Test or Treatment 94.7 11.6 0.72
991 Friendliness of staff 96.1 11.3 0.70
985 Explanations given by staff 94.3 14.2 0.89
991 Skill of techs/therapists/nurses 95.5 12.0 0.75
989 Staff concern for comfort 94.8 13.6 0.85
964 Staff's concern/questions worries 93.3 14.5 0.91
975 Personal Issues 93.1 12.9 0.81
978 Personal Issues †† 93.2 12.3 0.77
970 Our concern for privacy 93.6 12.8 0.80
962 Our sensitivity to your needs 92.9 14.6 0.92
905 Response to concerns/complaints 92.7 15.3 0.99
891 Family able to participate decision † 92.9 14.2 0.93
945 Staff explained roles in care † 93.0 14.7 0.94
842 Staff supported family throughout † 93.3 13.7 0.92
852 Staff respected having family with † 94.0 12.7 0.85
910 Staff sensitivity to your needs † 93.3 14.6 0.95
984 Overall Assessment 94.8 12.4 0.77
971 Staff worked together provide care 94.8 12.6 0.79
979 Overall rating of care 95.2 12.2 0.77
975 Likelihood of recommending 94.6 14.7 0.92
n Number of responses
N Number of facilities in peer group
† Non-standard question
†† Includes non-standard questions
Find solutions, learn best practices, and networkFor an overview of how to interpret this report page,with colleagues in other health care organizationsclick or visit the following Web page:
https://www.pressganey.com/forumhttp://www.pressganey.com/gti/gti24.htm
118

Augusta University Medical Center 10/1/2016 - 12/31/2016
OUTPATIENT SERVICES REPORTOUTPATIENT SERVICES REPORT22.0 Question Key
This section lists the report labels and preferred wording of questions used in your survey. Due to space constraints, abbreviated questions, or labels,are used in this report. Section
Report Label Survey QuestionRegistration
Helpfulness of registration person Helpfulness of the person at the registration desk
Ease of the registration process Ease of the registration process
Waiting time in registration Waiting time in registration
Facility
Comfort of waiting area Comfort of the waiting area
Ease of finding your way around Ease of finding your way around
Cleanliness of facility Cleanliness of the facility
Test or Treatment
Friendliness of staff Friendliness/courtesy of the staff who provided your test or treatment
Explanations given by staff Explanation from the staff about would happen during your test or treatment
Skill of techs/therapists/nurses Skill of the staff who provided your test or treatment
Staff concern for comfort Staff concern for your comfort
Staff's concern/questions worries Staff's concern for your questions and worries
Personal Issues
Our concern for privacy Our concern for your privacy
Our sensitivity to your needs Our sensitivity to your needs
Response to concerns/complaints Response to concerns/complaints made during your visit
Family able to participate decision † Degree to which you and your family were able to participate in decisions about
your care
Staff explained roles in care † How well staff explained their roles in your care
Staff supported family throughout † Degree to which the staff supported your family throughout your healthcare
experience
Staff respected having family with † Degree to which your choices were respected to have family members/friends
with you during your care
Staff sensitivity to your needs † Staff's sensitivity and responsiveness to your special/individual needs
Overall Assessment
Staff worked together provide care How well staff worked together to provide care
Overall rating of care Overall rating of care received during your visit
Likelihood of recommending Likelihood of your recommending our facility to others
† Non-standard question
Find solutions, learn best practices, and networkwith colleagues in other health care organizations
https://www.pressganey.com/forumhttp://www.pressganey.com
119

Augusta University Medical Center 10/1/2016 - 12/31/2016
OUTPATIENT SERVICES REPORTOUTPATIENT SERVICES REPORT23.0 Facilities in the Database
This section lists the facilities receiving a report like yours in the current report period. Superscripts are used to identify the facilities in each of yourcomparison or peer groups.
Number of AHAFacility City, State Procedures RegionABQ Health Partners1 Albuquerque, NM - 8
AHN Health and Wellness Pavillion1 Wexford, PA - 2
AMITA Adventist Med Ctr Hinsdale1 Hinsdale, IL 29,712 5
Abbott Northwestern Hospital1 Minneapolis, MN 500,000 6
Abington Health - Lansdale Hospital1 Lansdale, PA - 2
Abington Memorial Hospital1 Abington, PA - 2
Acadia General Hospital1 Crowley, LA - 7
Adena Regional Medical Center1 Chillicothe, OH 379,163 5
Adirondack Health1 Saranac Lake, NY 50,000 2
Advocate BroMenn Medical Center1 Normal, IL 60,000 5
Advocate Children's Hospital1 Oak Lawn, IL 113,150 5
Advocate Christ Medical Center1 Oak Lawn, IL 325,886 5
Advocate Dreyer Medical Clinic1 Aurora, IL 25,000 5
Advocate Eureka Hospital1 Eureka, IL 16,000 5
Advocate Good Shepherd Hospital1 Barrington, IL 103,000 5
Advocate Illinois Masonic M. C.1 Chicago, IL 338,000 5
Advocate Lutheran General Hospital13 Park Ridge, IL 225,800 5
Advocate South Suburban Hospital1 Hazel Crest, IL 75,000 5
Advocate Trinity Hospital1 Chicago, IL 138,971 5
Aiken Regional Site: 212 Aiken, SC 86,163 4
Akron Children's Hospital1 Akron, OH - 5
Akron General Outpatient Services1 Akron, OH 27,414 5
Alamance Regional Medical Center1 Burlington, NC 49,313 3
Alameda Health System1 Oakland, CA - 9
Alaska Regional Hospital1 Anchorage, AK 34,000 -
All Children's Hospital1 St. Petersburg, FL - 4
Allegan General Hospital1 Allegan, MI 265,327 5
Allegheny General Hospital1 Pittsburgh, PA - 2
Allegheny Valley Hospital1 Natrona Heights, PA - 2
Allegiance Health1 Jackson, MI 110,000 5
Allen Memorial Hospital1 Waterloo, IA 239,205 6
Allenmore Hospital1 Tacoma, WA 51,099 9
Anderson1 Cincinnati, OH - 5
Anne Arundel Medical Center1 Annapolis, MD 384,644 3
Annie Penn Hospital1 Reidsville, NC 52,043 3
Appleton Medical Center1 Appleton, WI - 5
Armstrong County Memorial Hospital1 Kitanning, PA - 2
Continued...
1 All Facility DB
2 Hospitals in AHA Region 4
3 Council of Teaching Peer Group
Find solutions, learn best practices, and networkFor an overview of how to interpret this report page,with colleagues in other health care organizationsclick or visit the following Web page:
https://www.pressganey.com/forumhttp://www.pressganey.com/gti/gti25.htm
120
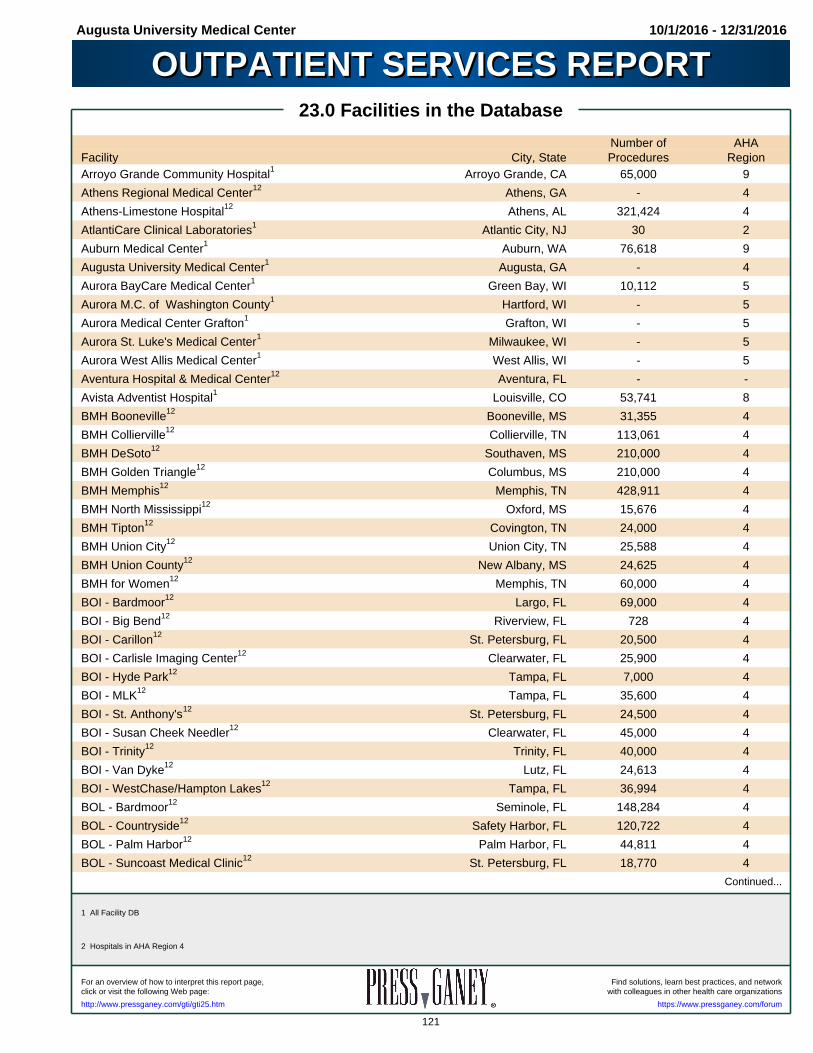
Augusta University Medical Center 10/1/2016 - 12/31/2016
OUTPATIENT SERVICES REPORTOUTPATIENT SERVICES REPORT23.0 Facilities in the Database
Number of AHAFacility City, State Procedures RegionArroyo Grande Community Hospital1 Arroyo Grande, CA 65,000 9
Athens Regional Medical Center12 Athens, GA - 4
Athens-Limestone Hospital12 Athens, AL 321,424 4
AtlantiCare Clinical Laboratories1 Atlantic City, NJ 30 2
Auburn Medical Center1 Auburn, WA 76,618 9
Augusta University Medical Center1 Augusta, GA - 4
Aurora BayCare Medical Center1 Green Bay, WI 10,112 5
Aurora M.C. of Washington County1 Hartford, WI - 5
Aurora Medical Center Grafton1 Grafton, WI - 5
Aurora St. Luke's Medical Center1 Milwaukee, WI - 5
Aurora West Allis Medical Center1 West Allis, WI - 5
Aventura Hospital & Medical Center12 Aventura, FL - -
Avista Adventist Hospital1 Louisville, CO 53,741 8
BMH Booneville12 Booneville, MS 31,355 4
BMH Collierville12 Collierville, TN 113,061 4
BMH DeSoto12 Southaven, MS 210,000 4
BMH Golden Triangle12 Columbus, MS 210,000 4
BMH Memphis12 Memphis, TN 428,911 4
BMH North Mississippi12 Oxford, MS 15,676 4
BMH Tipton12 Covington, TN 24,000 4
BMH Union City12 Union City, TN 25,588 4
BMH Union County12 New Albany, MS 24,625 4
BMH for Women12 Memphis, TN 60,000 4
BOI - Bardmoor 12 Largo, FL 69,000 4
BOI - Big Bend 12 Riverview, FL 728 4
BOI - Carillon 12 St. Petersburg, FL 20,500 4
BOI - Carlisle Imaging Center 12 Clearwater, FL 25,900 4
BOI - Hyde Park 12 Tampa, FL 7,000 4
BOI - MLK 12 Tampa, FL 35,600 4
BOI - St. Anthony's 12 St. Petersburg, FL 24,500 4
BOI - Susan Cheek Needler 12 Clearwater, FL 45,000 4
BOI - Trinity 12 Trinity, FL 40,000 4
BOI - Van Dyke 12 Lutz, FL 24,613 4
BOI - WestChase/Hampton Lakes 12 Tampa, FL 36,994 4
BOL - Bardmoor12 Seminole, FL 148,284 4
BOL - Countryside12 Safety Harbor, FL 120,722 4
BOL - Palm Harbor12 Palm Harbor, FL 44,811 4
BOL - Suncoast Medical Clinic12 St. Petersburg, FL 18,770 4
Continued...
1 All Facility DB
2 Hospitals in AHA Region 4
Find solutions, learn best practices, and networkFor an overview of how to interpret this report page,with colleagues in other health care organizationsclick or visit the following Web page:
https://www.pressganey.com/forumhttp://www.pressganey.com/gti/gti25.htm
121
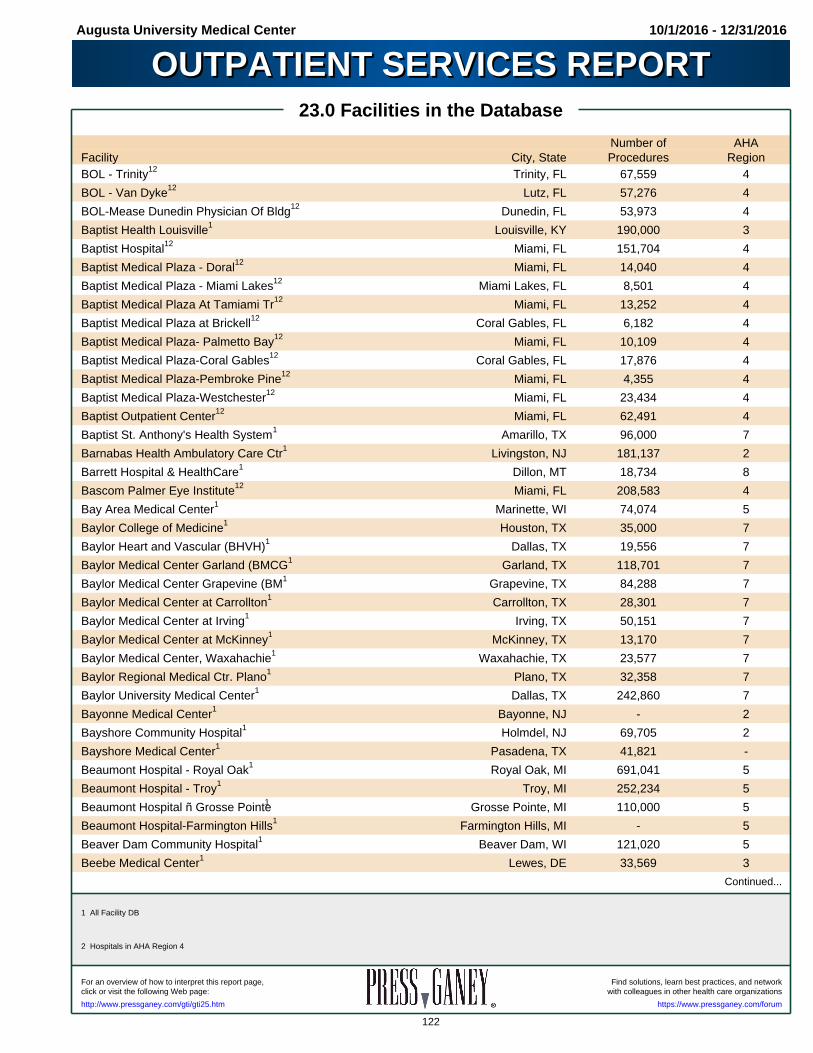
Augusta University Medical Center 10/1/2016 - 12/31/2016
OUTPATIENT SERVICES REPORTOUTPATIENT SERVICES REPORT23.0 Facilities in the Database
Number of AHAFacility City, State Procedures RegionBOL - Trinity12 Trinity, FL 67,559 4
BOL - Van Dyke 12 Lutz, FL 57,276 4
BOL-Mease Dunedin Physician Of Bldg12 Dunedin, FL 53,973 4
Baptist Health Louisville1 Louisville, KY 190,000 3
Baptist Hospital12 Miami, FL 151,704 4
Baptist Medical Plaza - Doral12 Miami, FL 14,040 4
Baptist Medical Plaza - Miami Lakes12 Miami Lakes, FL 8,501 4
Baptist Medical Plaza At Tamiami Tr12 Miami, FL 13,252 4
Baptist Medical Plaza at Brickell12 Coral Gables, FL 6,182 4
Baptist Medical Plaza- Palmetto Bay12 Miami, FL 10,109 4
Baptist Medical Plaza-Coral Gables12 Coral Gables, FL 17,876 4
Baptist Medical Plaza-Pembroke Pine12 Miami, FL 4,355 4
Baptist Medical Plaza-Westchester12 Miami, FL 23,434 4
Baptist Outpatient Center12 Miami, FL 62,491 4
Baptist St. Anthony's Health System1 Amarillo, TX 96,000 7
Barnabas Health Ambulatory Care Ctr1 Livingston, NJ 181,137 2
Barrett Hospital & HealthCare1 Dillon, MT 18,734 8
Bascom Palmer Eye Institute12 Miami, FL 208,583 4
Bay Area Medical Center1 Marinette, WI 74,074 5
Baylor College of Medicine1 Houston, TX 35,000 7
Baylor Heart and Vascular (BHVH)1 Dallas, TX 19,556 7
Baylor Medical Center Garland (BMCG1 Garland, TX 118,701 7
Baylor Medical Center Grapevine (BM1 Grapevine, TX 84,288 7
Baylor Medical Center at Carrollton1 Carrollton, TX 28,301 7
Baylor Medical Center at Irving1 Irving, TX 50,151 7
Baylor Medical Center at McKinney1 McKinney, TX 13,170 7
Baylor Medical Center, Waxahachie1 Waxahachie, TX 23,577 7
Baylor Regional Medical Ctr. Plano1 Plano, TX 32,358 7
Baylor University Medical Center1 Dallas, TX 242,860 7
Bayonne Medical Center1 Bayonne, NJ - 2
Bayshore Community Hospital1 Holmdel, NJ 69,705 2
Bayshore Medical Center1 Pasadena, TX 41,821 -
Beaumont Hospital - Royal Oak1 Royal Oak, MI 691,041 5
Beaumont Hospital - Troy1 Troy, MI 252,234 5
Beaumont Hospital ñ Grosse Pointe1 Grosse Pointe, MI 110,000 5
Beaumont Hospital-Farmington Hills1 Farmington Hills, MI - 5
Beaver Dam Community Hospital1 Beaver Dam, WI 121,020 5
Beebe Medical Center1 Lewes, DE 33,569 3
Continued...
1 All Facility DB
2 Hospitals in AHA Region 4
Find solutions, learn best practices, and networkFor an overview of how to interpret this report page,with colleagues in other health care organizationsclick or visit the following Web page:
https://www.pressganey.com/forumhttp://www.pressganey.com/gti/gti25.htm
122

Augusta University Medical Center 10/1/2016 - 12/31/2016
OUTPATIENT SERVICES REPORTOUTPATIENT SERVICES REPORT23.0 Facilities in the Database
Number of AHAFacility City, State Procedures RegionBelton Regional Medical Center1 Belton, MO 24,226 -
Belvidere Medical Center1 Belvidere, IL 14,404 5
Berkeley Medical Center- Site 21 Martinsburg, WV 130,000 3
Berkshire Medical Center1 Pittsfield, MA 106,403 1
Beth Israel Deaconess Hospital- Nee1 Needham, MA 42,318 1
Beth Israel Deaconess Medical Cntr.1 Boston, MA 221,340 1
Bethesda Butler Hospital1 Hamilton, OH 13,800 5
Bethesda North Hospital1 Cincinnati, OH 106,244 5
Betsy Johnson Hospital1 Dunn, NC 36,224 3
Blake Medical Center12 Bradenton, FL 2,700 -
Blanchard Valley Health System1 Findlay, OH 220,878 5
Blessing Hospital1 Quincy, IL 163,317 5
Blodgett Campus - Spectrum Health1 Grand Rapids, MI - 5
Boca Raton Regional Hospital12 Boca Raton, FL 140,000 4
Bon Secours Community Hospital1 Port Jervis, NY - 2
Boston Children's Hospital1 Boston, MA - 1
Boston Medical Center1 Boston, MA 544,986 1
Bradford Regional Medical Center1 Bradford, PA 1,298,000 2
Brandon Regional Hospital12 Brandon, FL 139,712 -
Brazosport Regional Health System1 Lake Jackson, TX 250,275 7
Brigham City Community Hospital1 Brigham City, UT 17,500 -
Brigham and Women's Faulkner Hosp1 Boston, MA 149,654 1
Brigham and Women's Hospital1 Boston, MA 335,764 1
Broadlawns Medical Center1 Des Moines, IA 168,512 6
Bronson Battle Creek1 Battle Creek, MI 112,284 5
Bronson Methodist Hospital1 Kalamazoo, MI 462,473 5
Bryn Mawr Hospital1 Bryn Mawr, PA 90,135 2
Buchanan County Health Center1 Independence, IA 26,912 6
Bucyrus Community Hospital1 Bucyrus, OH 35,956 5
Buffalo Hospital1 Buffalo, MN 180,000 6
Burgess Health Center1 Onawa, IA 25,000 6
Butterworth Campus-Spectrum Hlth1 Grand Rapids, MI 700,000 5
CGH Medical Center1 Sterling, IL 114,680 5
CHRISTUS Santa Rosa - New Braunfels1 New Braunfels, TX 31,132 7
CHRISTUS Santa Rosa Westover Hills1 San Antonio, TX 1,600 7
CHRISTUS Schumpert Highland Medical1 Shreveport, LA 36,165 7
CHRISTUS Spohn Hospital Kleberg1 Kingsville, TX - 7
CHRISTUS Spohn Hospital Shoreline1 Corpus Christi, TX - 7
Continued...
1 All Facility DB
2 Hospitals in AHA Region 4
Find solutions, learn best practices, and networkFor an overview of how to interpret this report page,with colleagues in other health care organizationsclick or visit the following Web page:
https://www.pressganey.com/forumhttp://www.pressganey.com/gti/gti25.htm
123

Augusta University Medical Center 10/1/2016 - 12/31/2016
OUTPATIENT SERVICES REPORTOUTPATIENT SERVICES REPORT23.0 Facilities in the Database
Number of AHAFacility City, State Procedures RegionCHRISTUS St. Elizabeth1 Beaumont, TX - 7
CHRISTUS St. Frances Cabrini1 Alexandria, LA - 7
CHRISTUS St. Mary1 Port Arthur, TX - 7
CHRISTUS St. Michael1 Texarkana, TX - 7
CHRISTUS St. Patrick1 Lake Charles, LA - 7
CHRISTUS St. Vincent1 Santa Fe, NM 88,872 8
CHS Blue Ridge1 Morganton, NC 86,318 3
CHS Cleveland1 Shelby, NC 82,000 3
CHS Lincoln1 Lincolnton, NC 2,500 3
CHS NorthEast1 Concord, NC 272,004 3
CHS Pineville1 Charlotte, NC 54,000 3
CHS Stanly1 Albemarle, NC 393,091 3
CHS Union1 Monroe, NC 83,401 3
CHS University1 Charlotte, NC 76,215 3
CVPH Medical Center1 Plattsburgh, NY 618,175 2
Cabell Huntington Hospital1 Huntington, WV - 3
Cache Valley Hospital1 North Logan, UT - -
Cambridge Medical Center1 Cambridge, MN 49,000 6
Camden-Clark Medical Center1 Parkersburg, WV 843,741 3
Canonsburg Hospital1 Canonsburg, PA - 2
Cape Cod Hospital1 Hyannis, MA 100,001 1
Cape Fear Valley1 Fayetteville, NC 299,000 3
Capital Regional Medical Center12 Tallahassee, FL 6,737 -
Cardiac Testing Sites1 Cincinnati, OH - 5
Carilion Roanoke Memorial Hospital1 Roanoke, VA - 3
Carle Foundation Hospital1 Urbana, IL - 5
CarolinaEast Health System1 New Bern, NC 200,121 3
Carolinas Medical Center1 Charlotte, NC 51,924 3
Carolinas Medical Center-Mercy1 Charlotte, NC 17,801 3
Carroll County Memorial Hospital1 Carrollton, MO 243 6
Cartersville Medical Center12 Cartersville, GA 255,913 -
Cass Regional Medical Center1 Harrisonville, MO 90,000 -
Castle Rock Adventist Health Campus1 Castle Rock, CO 25,650 8
Catawba Valley Medical Center1 Hickory, NC 45,206 3
Cayuga Medical Center at Ithaca1 Ithaca, NY 338,197 2
Centennial Medical Plaza1 Centennial, CO 12,182 -
Centerpoint Medical Center1 Independence, MO 140,000 -
Centra Medical Group1 Lynchburg, PA - 2
Continued...
1 All Facility DB
2 Hospitals in AHA Region 4
Find solutions, learn best practices, and networkFor an overview of how to interpret this report page,with colleagues in other health care organizationsclick or visit the following Web page:
https://www.pressganey.com/forumhttp://www.pressganey.com/gti/gti25.htm
124

Augusta University Medical Center 10/1/2016 - 12/31/2016
OUTPATIENT SERVICES REPORTOUTPATIENT SERVICES REPORT23.0 Facilities in the Database
Number of AHAFacility City, State Procedures RegionCentraCare Health - Monticello1 Monticello, MN 13,261 6
CentraCare Health- Long Prairie1 Long Prairie, MN 105,438 6
CentraCare Health- Melrose1 Melrose, MN 25,945 6
CentraCare Health- Paynesville1 Paynesville, MN 35,331 6
CentraState Healthcare System1 Freehold, NJ - 2
Central Delivery System Radiology1 Albuquerque, NM - 8
Central DuPage Hospital1 Winfield, IL 821,543 5
Central Florida Regional Hospital12 Sanford, FL - -
Central Iowa Healthcare1 Marshalltown, IA 62,000 6
Chandler Regional Hospital1 Chandler, AZ - 8
Cheshire Medical Center1 Keene, NH 459,309 1
Children's Hospital of Philadelphia1 Philadelphia, PA 203,855 2
Children's Hospital of The King's D1 Norfolk, VA 484,707 3
Children's Specialized Hospital1 Mountainside, NJ - 2
Chilton Medical Center1 Pompton Plains, NJ - 2
Chippenham Hospital1 Richmond, VA 10,818 -
Christiana Care - Christiana1 Wilmington, DE - 3
Christiana Care - Christiana Site 21 Wilmington, DE 100,000 3
Citizens Medical Center1 Victoria, TX - 7
Citrus Memorial Hospital12 Inverness, FL 211,942 -
Clear Lake Radiology BDC1 Webster, TX 19,882 -
Clear Lake Regional Medical Center1 Webster, TX 33,626 -
Clement J. Zablocki Veterans Affair1 Milwaukee, WI - 5
Cleveland Clinic1 Cleveland, OH 171,400 5
Cleveland Clinic Florida12 Weston, FL 256,000 4
Clinton Hospital1 Clinton, MA - 1
Coliseum Medical Centers12 Macon, GA 33,929 -
Coliseum Northside Hospital12 Macon, GA 3,646 -
Colleton Medical Center12 Walterboro, SC - -
Columbia Physician Practices-East1 New York, NY 49,695 2
Columbus Regional Healthcare System1 Whiteville, NC 10,237 3
Columbus Regional Hospital1 Columbus, IN 157,244 5
Community Hospital1 Oklahoma City, OK 12,000 7
Community Hospital (The)1 Munster, IN 249,063 5
Community Medical Center, Inc.1 Missoula, MT - 8
Community Memorial Hospital1 Sumner, IA 10,001 6
Concord Hospital1 Concord, NH - 1
Concord Imaging Center1 Concord, NH 30,000 1
Continued...
1 All Facility DB
2 Hospitals in AHA Region 4
Find solutions, learn best practices, and networkFor an overview of how to interpret this report page,with colleagues in other health care organizationsclick or visit the following Web page:
https://www.pressganey.com/forumhttp://www.pressganey.com/gti/gti25.htm
125

Augusta University Medical Center 10/1/2016 - 12/31/2016
OUTPATIENT SERVICES REPORTOUTPATIENT SERVICES REPORT23.0 Facilities in the Database
Number of AHAFacility City, State Procedures RegionCondell Medical Center1 Libertyville, IL 10,001 5
Conroe Regional Medical Center1 Conroe, TX 113,034 -
Conway Medical Center12 Conway, SC 39,700 4
Conway Regional Medical Ctr, Inc.1 Conway, AR 154,557 7
Cookeville Regional Medical Center1 Cookeville, TN - 4
Cooper University Health Care1 Camden, NJ - 2
Corning Hospital1 Corning, NY 120,001 2
Corona Regional Site: 21 Corona, CA - 9
Cortland Regional Medical Center1 Cortland, NY - 2
Covenant Healthcare1 Saginaw, MI - 5
Covenant Healthcare Physical Med.1 Saginaw, MI 141,724 5
Covenant Imaging and Diagnostic1 Saginaw, MI 110,640 5
Cox Medical Center Branson1 Branson, MO - 6
Cox Medical Center Springfield1 Springfield, MO - 6
Crawford Memorial Hospital1 Robinson, IL 44,911 5
Cumberland Healthcare1 Cumberland, WI 7,703 5
Cuyuna Regional Medical Center1 Crosby, MN 25,182 6
DCH Regional Medical Center12 Tuscaloosa, AL 284,099 4
Dallas County Hospital1 Perry, IA 29,999 6
Davie Medical Center1 Mocksville, NC 6,073 3
DePaul Hospital-St. Louis1 Bridgeton, MO 106,650 6
DePaul Medical Center1 Norfolk, VA - 3
Deaconess Gateway Hospital1 Newburgh, IN 63,718 5
Deaconess Hospital1 Evansville, IN 447,625 5
Decatur Morgan Hospital - Decatur C12 Decatur, AL 442,565 4
Del Sol Medical Center1 El Paso, TX - -
Delnor Hospital1 Geneva, IL 148,000 5
Denton Regional Medical Center1 Denton, TX 101,493 -
Desert Radiologists1 Las Vegas, NV 1,300,000 9
Diagnostic Center at West Kendall12 Miami, FL 12,279 4
Dignity Health Medical Foundation -1 San Francisco, CA 160,000 9
District One Hospital1 Faribault, MN 78,500 6
Doctors Hospital1 Columbus, OH 296,241 5
Doctors Hospital12 Coral Gables, FL 42,455 4
Doctors Hospital Of Augusta12 Augusta, GA 6,951 -
Doctors Hospital Of Sarasota12 Sarasota, FL 3,900 -
Doctors Hospital Site: 21 Laredo, TX 66,854 7
Dominican Hospital of Santa Cruz1 Henderson, NV 143,193 9
Continued...
1 All Facility DB
2 Hospitals in AHA Region 4
Find solutions, learn best practices, and networkFor an overview of how to interpret this report page,with colleagues in other health care organizationsclick or visit the following Web page:
https://www.pressganey.com/forumhttp://www.pressganey.com/gti/gti25.htm
126

Augusta University Medical Center 10/1/2016 - 12/31/2016
OUTPATIENT SERVICES REPORTOUTPATIENT SERVICES REPORT23.0 Facilities in the Database
Number of AHAFacility City, State Procedures RegionDoylestown Hospital1 Doylestown, PA 110,545 2
Dr. P. Phillips Hospital12 Orlando, FL 11,040 4
Dublin Methodist Hospital1 Dublin, OH 43,000 5
Duke Raleigh Hospital1 Raleigh, NC 46,000 3
Duke Regional Hospital1 Durham, NC 52,143 3
Duke University Hospital13 Durham, NC - 3
Dupage Medical Group- Corp1 Downers Grove, IL - 5
East Houston Regional Medical Cente1 Houston, TX - -
East Jefferson General Hospital1 Metairie, LA 202,539 7
Eastern Idaho Regional Medical Ctr1 Idaho Falls, ID - -
Eastern Maine Medical Center1 Bangor, ME - 1
Eastside Medical Center12 Shellville, GA 89,705 -
Ector County Hospital District/Medi1 Odessa, TX - 7
Edward Hospital1 Naperville, IL 276,129 5
Eisenhower Medical Center1 Rancho Mirage, CA 419,199 9
El Camino Hospital Mountain View1 Mountain View, CA 60,500 9
El Paso Children's Hospital1 El Paso, TX 10,000 7
Elkhart General Hospital1 Elkhart, IN 150,767 5
Elmhurst Memorial Hospital1 Elmhurst, IL 1,100,000 5
Emerson Hospital1 Concord, MA 583,578 1
Emory Johns Creek Hospital12 Duluth, GA - 4
Emory University Hospital123 Atlanta, GA 935,793 4
Emory University Hospital Midtown123 Atlanta, GA 1,665,490 4
Englewood Community Hospital12 Englewood, Fl 19,175 -
Ephrata Community Hospital1 Ephrata, PA 634,614 2
Euclid Hospital1 Euclid, OH 150,000 5
Evangelical Community Hospital1 Lewisburg, PA 279,403 2
Evanston Hospital (The)1 Evanston, IL 2,962,004 5
Everett Clinic (The)1 Everett, WA - 9
EvergreenHealth1 Kirkland, WA 101,377 9
FHN Memorial Hospital1 Freeport, IL - 5
Faculty Physicians, Inc.1 Baltimore, MD - 3
Fairfield Medical Center1 Lancaster, OH 803,467 5
Fairview Hospital1 Great Barrington, MA 22,336 1
Fairview Hospital1 Cleveland, OH 160,000 5
Fairview Park Hospital12 Dublin, GA 32,918 -
Faith Regional Health Services1 Norfolk, NE - 6
Falmouth Hospital1 Falmouth, MA 100,001 1
Continued...
1 All Facility DB
2 Hospitals in AHA Region 4
3 Council of Teaching Peer Group
Find solutions, learn best practices, and networkFor an overview of how to interpret this report page,with colleagues in other health care organizationsclick or visit the following Web page:
https://www.pressganey.com/forumhttp://www.pressganey.com/gti/gti25.htm
127

Augusta University Medical Center 10/1/2016 - 12/31/2016
OUTPATIENT SERVICES REPORTOUTPATIENT SERVICES REPORT23.0 Facilities in the Database
Number of AHAFacility City, State Procedures RegionFawcett Memorial Hospital12 Port Charlotte, FL 30,289 -
Fayette Medical Center12 Fayette, AL 38,205 4
Finley Hospital1 Dubuque, IA 50,000 6
Firelands Regional Medical Center1 Sandusky, OH 250,001 5
Fisher-Titus Medical Center1 Norwalk, OH - 5
Flagstaff Medical Center1 Flagstaff, AZ - 8
Florida Hospital Altamonte12 Altamonte Springs, FL 72,553 4
Florida Hospital Apopka12 Apopka, FL 18,199 4
Florida Hospital Celebration Health12 Celebration, FL 66,546 4
Florida Hospital DeLand12 DeLand, FL 11,797 4
Florida Hospital East Orlando12 Orlando, FL 77,566 4
Florida Hospital Fish Memorial12 Orange City, FL 18,150 4
Florida Hospital Heartland Med Ctr12 Sebring, FL 58,837 4
Florida Hospital Kissimmee12 Kissimmee, FL 12,890 4
Florida Hospital Memorial Med Ctr12 Daytona Beach, FL 798,484 4
Florida Hospital New Smyrna12 New Smyna Beach, FL - 4
Florida Hospital North Pinellas12 Tarpon Springs, FL 36,840 4
Florida Hospital Orlando12 Orlando, FL 144,376 4
Florida Hospital Tampa12 Tampa, FL - 4
Florida Hospital Waterman12 Tavares, FL 157,262 4
Florida Hospital Wesley Chapel12 Wesley Chapel, FL 2,930 4
Florida Hospital Zephyrhills12 Zephyrhills, FL 29,800 4
Florida Radiology Imaging12 Orlando, FL 84,000 4
Floyd Medical Center12 Rome, GA 108,323 4
Forbes Regional Hospital1 Monroeville, PA 150,181 2
Fort Hamilton Hospital1 Hamiliton, OH 24,805 5
Fort Madison Community Hospital1 Fort Madison, IA 39,996 6
Fort Walton Beach Medical Center12 Fort- Walton Beach, FL 78,000 -
Fort Wright1 Cincinnati, OH - 5
Fox Chase Cancer Center1 Philadelphia, PA 119,811 2
Franciscan Health - Rensselaer1 Rensselaer, IN 941 5
Franciscan Health Crawfordsville1 Crawfordville, IN - 5
Franciscan Health Crown Point1 Crown Point, IN 86,953 5
Franciscan Health Dyer1 Dyer, IN 424,758 5
Franciscan Health Hammond1 Hammond, IN 418,652 5
Franciscan Health Indianapolis1 Indianapolis, IN 74,018 5
Franciscan Health Lafayette East1 Lafayette, IN 109,062 5
Franciscan Health Michigan City1 Michigan City, IN 215,791 5
Continued...
1 All Facility DB
2 Hospitals in AHA Region 4
Find solutions, learn best practices, and networkFor an overview of how to interpret this report page,with colleagues in other health care organizationsclick or visit the following Web page:
https://www.pressganey.com/forumhttp://www.pressganey.com/gti/gti25.htm
128
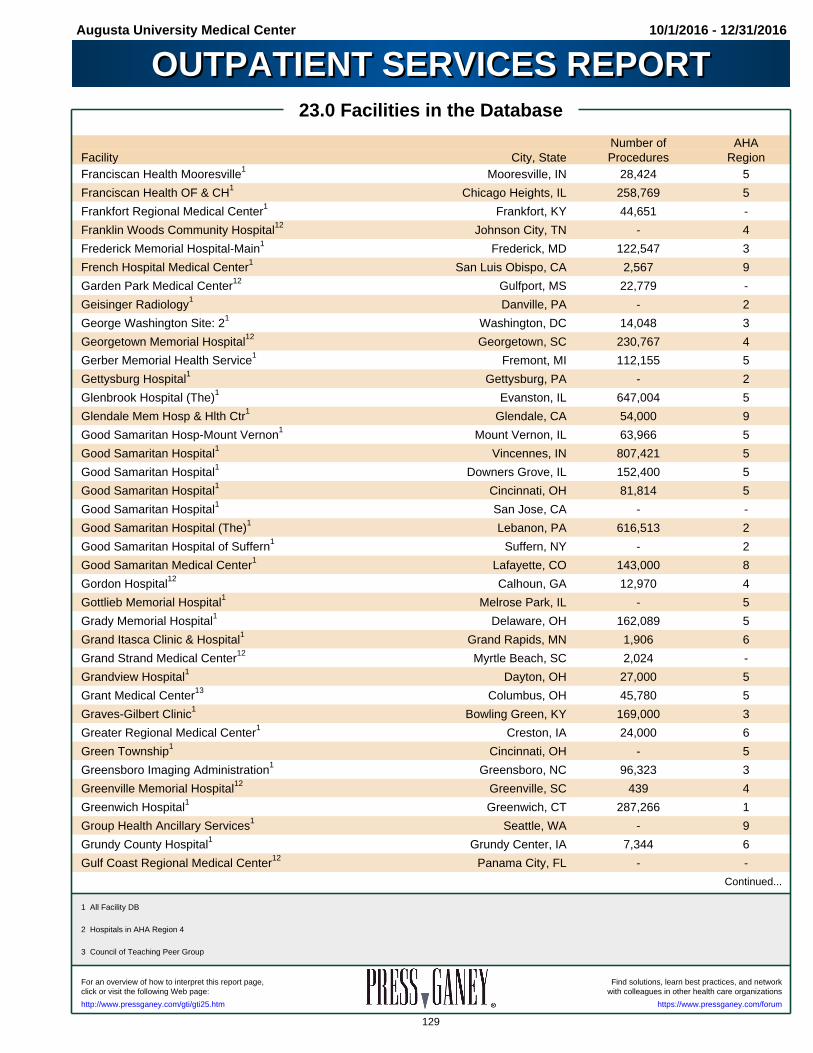
Augusta University Medical Center 10/1/2016 - 12/31/2016
OUTPATIENT SERVICES REPORTOUTPATIENT SERVICES REPORT23.0 Facilities in the Database
Number of AHAFacility City, State Procedures RegionFranciscan Health Mooresville1 Mooresville, IN 28,424 5
Franciscan Health OF & CH1 Chicago Heights, IL 258,769 5
Frankfort Regional Medical Center1 Frankfort, KY 44,651 -
Franklin Woods Community Hospital12 Johnson City, TN - 4
Frederick Memorial Hospital-Main1 Frederick, MD 122,547 3
French Hospital Medical Center1 San Luis Obispo, CA 2,567 9
Garden Park Medical Center12 Gulfport, MS 22,779 -
Geisinger Radiology1 Danville, PA - 2
George Washington Site: 21 Washington, DC 14,048 3
Georgetown Memorial Hospital12 Georgetown, SC 230,767 4
Gerber Memorial Health Service1 Fremont, MI 112,155 5
Gettysburg Hospital1 Gettysburg, PA - 2
Glenbrook Hospital (The)1 Evanston, IL 647,004 5
Glendale Mem Hosp & Hlth Ctr1 Glendale, CA 54,000 9
Good Samaritan Hosp-Mount Vernon1 Mount Vernon, IL 63,966 5
Good Samaritan Hospital1 Vincennes, IN 807,421 5
Good Samaritan Hospital1 Downers Grove, IL 152,400 5
Good Samaritan Hospital1 Cincinnati, OH 81,814 5
Good Samaritan Hospital1 San Jose, CA - -
Good Samaritan Hospital (The)1 Lebanon, PA 616,513 2
Good Samaritan Hospital of Suffern1 Suffern, NY - 2
Good Samaritan Medical Center1 Lafayette, CO 143,000 8
Gordon Hospital12 Calhoun, GA 12,970 4
Gottlieb Memorial Hospital1 Melrose Park, IL - 5
Grady Memorial Hospital1 Delaware, OH 162,089 5
Grand Itasca Clinic & Hospital1 Grand Rapids, MN 1,906 6
Grand Strand Medical Center12 Myrtle Beach, SC 2,024 -
Grandview Hospital1 Dayton, OH 27,000 5
Grant Medical Center13 Columbus, OH 45,780 5
Graves-Gilbert Clinic1 Bowling Green, KY 169,000 3
Greater Regional Medical Center1 Creston, IA 24,000 6
Green Township1 Cincinnati, OH - 5
Greensboro Imaging Administration1 Greensboro, NC 96,323 3
Greenville Memorial Hospital12 Greenville, SC 439 4
Greenwich Hospital1 Greenwich, CT 287,266 1
Group Health Ancillary Services1 Seattle, WA - 9
Grundy County Hospital1 Grundy Center, IA 7,344 6
Gulf Coast Regional Medical Center12 Panama City, FL - -
Continued...
1 All Facility DB
2 Hospitals in AHA Region 4
3 Council of Teaching Peer Group
Find solutions, learn best practices, and networkFor an overview of how to interpret this report page,with colleagues in other health care organizationsclick or visit the following Web page:
https://www.pressganey.com/forumhttp://www.pressganey.com/gti/gti25.htm
129

Augusta University Medical Center 10/1/2016 - 12/31/2016
OUTPATIENT SERVICES REPORTOUTPATIENT SERVICES REPORT23.0 Facilities in the Database
Number of AHAFacility City, State Procedures RegionGwinnett Medical Center12 Lawrenceville, GA 170,000 4
Gwinnett Medical Center- Duluth12 Duluth, GA 42,500 4
HPMC Occupational Medical Services1 Richland, WA - 9
HSF Ambulatory12 Birmingham, AL 110,189 4
Hackensack University M.C.1 Hackensack, NJ 500,000 2
Hanger Prosthetics and Orthotics1 Bethesda, MD 600,000 3
Hanover Hospital1 Hanover, PA 773,641 2
Harbor Medical Associates1 South Weymouth, MA - 1
Hardin Memorial Hospital1 Kenton, OH 896 5
Hardin Memorial Hospital1 Elizabethtown, KY - 3
Harrington Memorial Hospital1 Southbridge, MA 188,000 1
Harrisburg Medical Center1 Harrisburg, IL 100,000 5
Heart Hospital Baylor Plano (The)1 Plano, TX 25,062 7
Heart Hospital Of Austin1 Austin, TX 5,000 -
Heart Hospital at Deaconess Gateway1 Newburgh, IN 3,883 5
Heart of the Rockies Regional Medic1 Salida, CO - 8
Helen Devos Children's Hospital1 Grand Rapids, MI - 5
Hendricks Regional Health1 Danville, IN - 5
Henrico Doctors' Hospital1 Richmond, VA 75,906 -
Henry County Medical Center12 Paris, TN 182,148 4
Henry Ford Health Ctr. - Brownstown1 Brownstown Township, MI 26,000 5
Henry Ford Macomb Hospital1 Clinton Township, MI 109,728 5
Henry Ford Medical Group1 Detroit, MI - 5
Henry Ford West Bloomfield Hospital1 West Bloomfield, MI 35,000 5
Henry Ford Wyandotte Hospital1 Wyandotte, MI 50,000 5
Henry Mayo Newhall Hospital1 Valencia, CA 69,939 9
Heritage Valley Beaver1 Beaver, PA 361,104 2
Heritage Valley Sewickley1 Sewickley, PA 175,793 2
Herrin Hospital1 Herrin, IL 89,315 5
Higgins General Hospital12 Bremen, GA 237,294 4
High Tech Medical Park1 Palos Heights, IL 60,000 5
Highland Hospital1 Rochester, NY 36,180 2
Highland Park Hospital1 Highland Park, IL 555,202 5
Hillcrest Hospital1 Cleveland, OH 250,000 5
Hillsboro Area Hospital1 Hillsboro, IL 32,974 5
Hoag Memorial Hospital Presbyterian1 Newport Beach, CA 346,813 9
Hoboken University Medical Center1 Hoboken, NJ - 2
Holy Cross Hospital-Fort Lauderdale12 Fort Lauderdale, FL - 4
Continued...
1 All Facility DB
2 Hospitals in AHA Region 4
Find solutions, learn best practices, and networkFor an overview of how to interpret this report page,with colleagues in other health care organizationsclick or visit the following Web page:
https://www.pressganey.com/forumhttp://www.pressganey.com/gti/gti25.htm
130
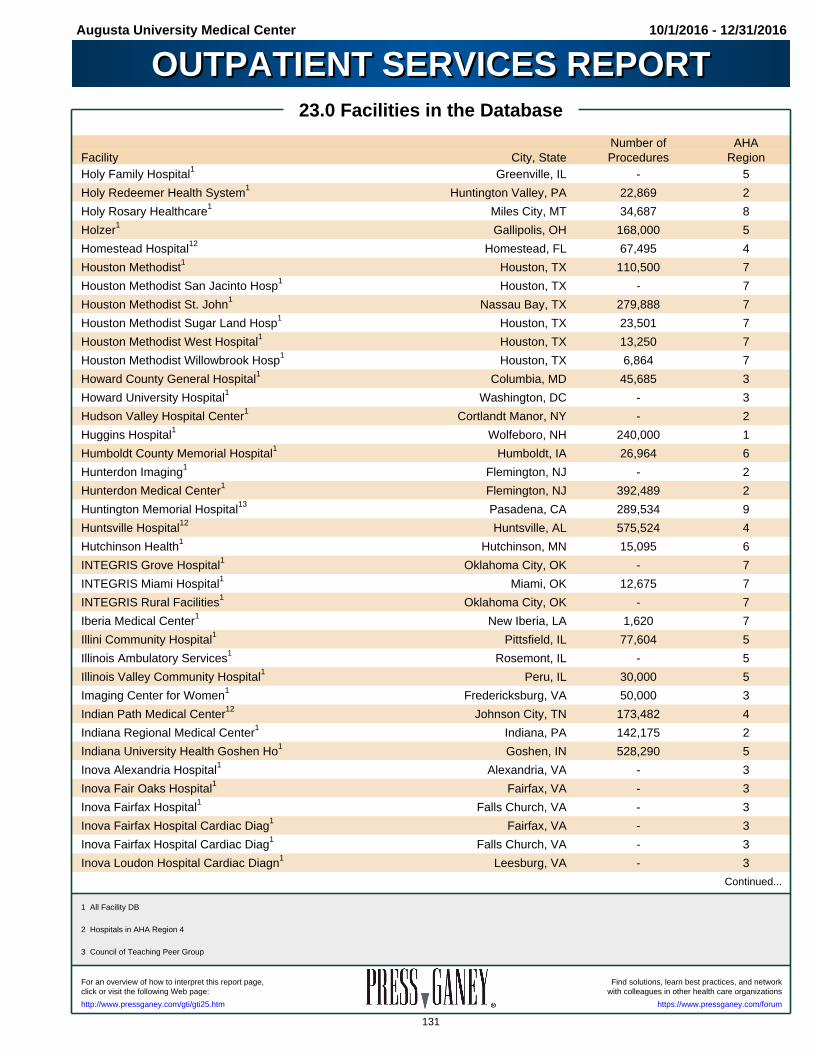
Augusta University Medical Center 10/1/2016 - 12/31/2016
OUTPATIENT SERVICES REPORTOUTPATIENT SERVICES REPORT23.0 Facilities in the Database
Number of AHAFacility City, State Procedures RegionHoly Family Hospital1 Greenville, IL - 5
Holy Redeemer Health System1 Huntington Valley, PA 22,869 2
Holy Rosary Healthcare1 Miles City, MT 34,687 8
Holzer1 Gallipolis, OH 168,000 5
Homestead Hospital12 Homestead, FL 67,495 4
Houston Methodist1 Houston, TX 110,500 7
Houston Methodist San Jacinto Hosp1 Houston, TX - 7
Houston Methodist St. John1 Nassau Bay, TX 279,888 7
Houston Methodist Sugar Land Hosp1 Houston, TX 23,501 7
Houston Methodist West Hospital1 Houston, TX 13,250 7
Houston Methodist Willowbrook Hosp1 Houston, TX 6,864 7
Howard County General Hospital1 Columbia, MD 45,685 3
Howard University Hospital1 Washington, DC - 3
Hudson Valley Hospital Center1 Cortlandt Manor, NY - 2
Huggins Hospital1 Wolfeboro, NH 240,000 1
Humboldt County Memorial Hospital1 Humboldt, IA 26,964 6
Hunterdon Imaging1 Flemington, NJ - 2
Hunterdon Medical Center1 Flemington, NJ 392,489 2
Huntington Memorial Hospital13 Pasadena, CA 289,534 9
Huntsville Hospital12 Huntsville, AL 575,524 4
Hutchinson Health1 Hutchinson, MN 15,095 6
INTEGRIS Grove Hospital1 Oklahoma City, OK - 7
INTEGRIS Miami Hospital1 Miami, OK 12,675 7
INTEGRIS Rural Facilities1 Oklahoma City, OK - 7
Iberia Medical Center1 New Iberia, LA 1,620 7
Illini Community Hospital1 Pittsfield, IL 77,604 5
Illinois Ambulatory Services1 Rosemont, IL - 5
Illinois Valley Community Hospital1 Peru, IL 30,000 5
Imaging Center for Women1 Fredericksburg, VA 50,000 3
Indian Path Medical Center12 Johnson City, TN 173,482 4
Indiana Regional Medical Center1 Indiana, PA 142,175 2
Indiana University Health Goshen Ho1 Goshen, IN 528,290 5
Inova Alexandria Hospital1 Alexandria, VA - 3
Inova Fair Oaks Hospital1 Fairfax, VA - 3
Inova Fairfax Hospital1 Falls Church, VA - 3
Inova Fairfax Hospital Cardiac Diag1 Fairfax, VA - 3
Inova Fairfax Hospital Cardiac Diag1 Falls Church, VA - 3
Inova Loudon Hospital Cardiac Diagn1 Leesburg, VA - 3
Continued...
1 All Facility DB
2 Hospitals in AHA Region 4
3 Council of Teaching Peer Group
Find solutions, learn best practices, and networkFor an overview of how to interpret this report page,with colleagues in other health care organizationsclick or visit the following Web page:
https://www.pressganey.com/forumhttp://www.pressganey.com/gti/gti25.htm
131
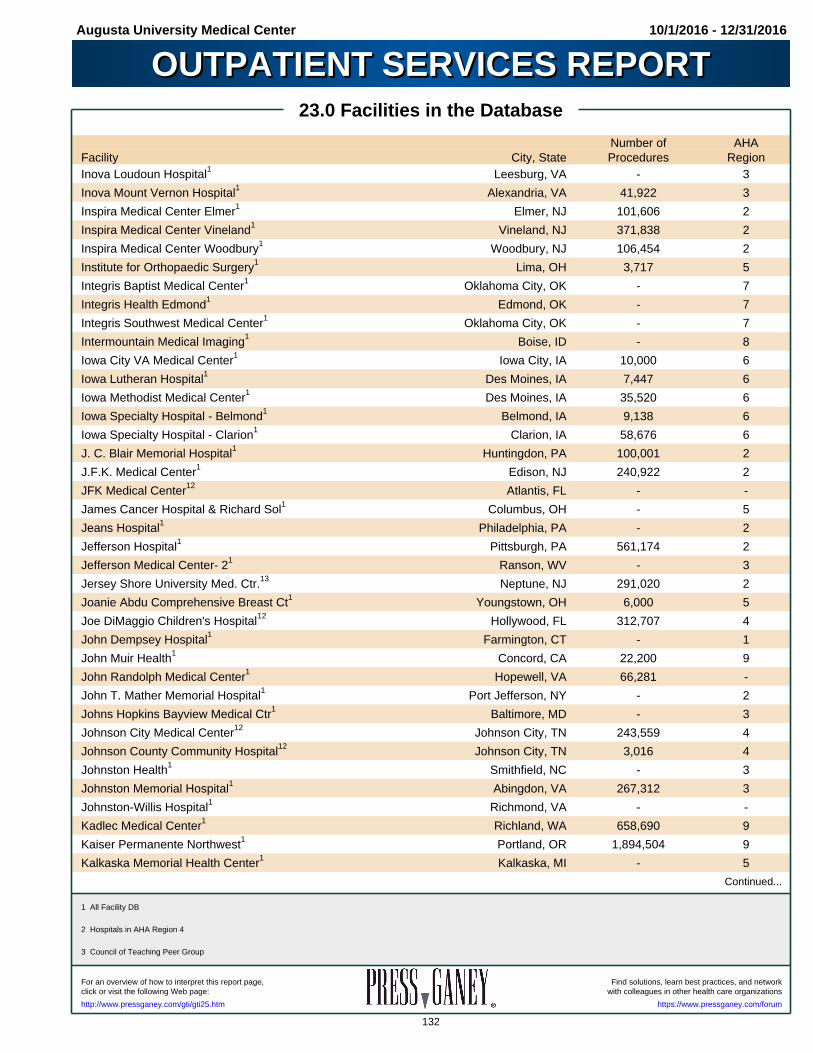
Augusta University Medical Center 10/1/2016 - 12/31/2016
OUTPATIENT SERVICES REPORTOUTPATIENT SERVICES REPORT23.0 Facilities in the Database
Number of AHAFacility City, State Procedures RegionInova Loudoun Hospital1 Leesburg, VA - 3
Inova Mount Vernon Hospital1 Alexandria, VA 41,922 3
Inspira Medical Center Elmer1 Elmer, NJ 101,606 2
Inspira Medical Center Vineland1 Vineland, NJ 371,838 2
Inspira Medical Center Woodbury1 Woodbury, NJ 106,454 2
Institute for Orthopaedic Surgery1 Lima, OH 3,717 5
Integris Baptist Medical Center1 Oklahoma City, OK - 7
Integris Health Edmond1 Edmond, OK - 7
Integris Southwest Medical Center1 Oklahoma City, OK - 7
Intermountain Medical Imaging1 Boise, ID - 8
Iowa City VA Medical Center1 Iowa City, IA 10,000 6
Iowa Lutheran Hospital1 Des Moines, IA 7,447 6
Iowa Methodist Medical Center1 Des Moines, IA 35,520 6
Iowa Specialty Hospital - Belmond 1 Belmond, IA 9,138 6
Iowa Specialty Hospital - Clarion 1 Clarion, IA 58,676 6
J. C. Blair Memorial Hospital1 Huntingdon, PA 100,001 2
J.F.K. Medical Center1 Edison, NJ 240,922 2
JFK Medical Center12 Atlantis, FL - -
James Cancer Hospital & Richard Sol1 Columbus, OH - 5
Jeans Hospital1 Philadelphia, PA - 2
Jefferson Hospital1 Pittsburgh, PA 561,174 2
Jefferson Medical Center- 21 Ranson, WV - 3
Jersey Shore University Med. Ctr.13 Neptune, NJ 291,020 2
Joanie Abdu Comprehensive Breast Ct1 Youngstown, OH 6,000 5
Joe DiMaggio Children's Hospital12 Hollywood, FL 312,707 4
John Dempsey Hospital1 Farmington, CT - 1
John Muir Health1 Concord, CA 22,200 9
John Randolph Medical Center1 Hopewell, VA 66,281 -
John T. Mather Memorial Hospital1 Port Jefferson, NY - 2
Johns Hopkins Bayview Medical Ctr1 Baltimore, MD - 3
Johnson City Medical Center12 Johnson City, TN 243,559 4
Johnson County Community Hospital12 Johnson City, TN 3,016 4
Johnston Health1 Smithfield, NC - 3
Johnston Memorial Hospital1 Abingdon, VA 267,312 3
Johnston-Willis Hospital1 Richmond, VA - -
Kadlec Medical Center1 Richland, WA 658,690 9
Kaiser Permanente Northwest1 Portland, OR 1,894,504 9
Kalkaska Memorial Health Center1 Kalkaska, MI - 5
Continued...
1 All Facility DB
2 Hospitals in AHA Region 4
3 Council of Teaching Peer Group
Find solutions, learn best practices, and networkFor an overview of how to interpret this report page,with colleagues in other health care organizationsclick or visit the following Web page:
https://www.pressganey.com/forumhttp://www.pressganey.com/gti/gti25.htm
132

Augusta University Medical Center 10/1/2016 - 12/31/2016
OUTPATIENT SERVICES REPORTOUTPATIENT SERVICES REPORT23.0 Facilities in the Database
Number of AHAFacility City, State Procedures RegionKent General Hospital1 Dover, DE 151,000 3
Kettering Memorial Hospital13 Kettering, OH 229,028 5
King's Daughters Medical Center1 Ashland, KY 129,000 3
King's Daughters Medical Cntr Ohio1 Portsmouth, OH - 5
King's Daughters' Health1 Madison, IN 257,764 5
Kingman Regional Medical Center1 Kingman, AZ 5,732 8
Kingwood Medical Center1 Kingwood, TX 27,602 -
Kirby Hospital1 Monticello, IL 12,395 5
Kishwaukee Hospital1 DeKalb, IL 237,151 5
Knox Community Hospital1 Mount Vernon, OH - 5
Kootenai Health1 Coeur D'Alene, ID - 8
Lafayette General Medical Center1 Lafayette, LA 55,315 7
Lahey Hospital and Medical Center1 Burlington, MA 220,000 1
Lahey Outpatient Center, Danvers1 Danvers, MA 150,000 1
Lake Health1 Painesville, OH - 5
Lakeside Women's Hospital LLC1 Oklahoma City, OK 1,000 7
Lakeview Hospital1 Bountiful, UT 24,011 -
Lakewood Ranch Site: 212 Bradenton, FL 19,000 4
Lancaster General Hospital1 Lancaster, PA 800,000 2
Lankenau Medical Center1 Wynnewood, PA 107,088 2
Largo Medical Center12 Largo, FL - -
Las Colinas Medical Center1 Irving, TX 22,412 -
Las Palmas Medical Center1 El Paso, TX 236,386 -
Lee's Summit Medical Center1 Lees Summit, MO 96,832 -
Lehigh Valley Hospital13 Allentown, PA 24,747 2
Lehigh Valley Hospital - Muhlenberg1 Bethlehem, PA 119,329 2
Lehigh Valley Hospital Hazleton1 Hazleton, PA 150,000 2
LewisGale Hospital Alleghany1 Low Moor, VA 1,349 -
LewisGale Hospital Montgomery1 Blacksburg, VA 37,825 -
LewisGale Hospital Pulaski1 Pulaski, VA - -
LewisGale Medical Center1 Salem, VA 89,568 -
Lexington Medical Center12 West Columbia, SC 168,343 4
Lexington Memorial Hospital1 Lexington, NC 98,121 3
Littleton Adventist Hospital1 Littleton, CO 77,000 8
Lone Peak Hospital1 Draper, UT 10,751 -
Longmont United Hospital1 Longmont, CO 139,966 8
Los Robles Hospital and Medical Cen1 Thousand Oaks, CA 38,500 -
Lourdes Hospital1 Paducah, KY 641,433 3
Continued...
1 All Facility DB
2 Hospitals in AHA Region 4
3 Council of Teaching Peer Group
Find solutions, learn best practices, and networkFor an overview of how to interpret this report page,with colleagues in other health care organizationsclick or visit the following Web page:
https://www.pressganey.com/forumhttp://www.pressganey.com/gti/gti25.htm
133
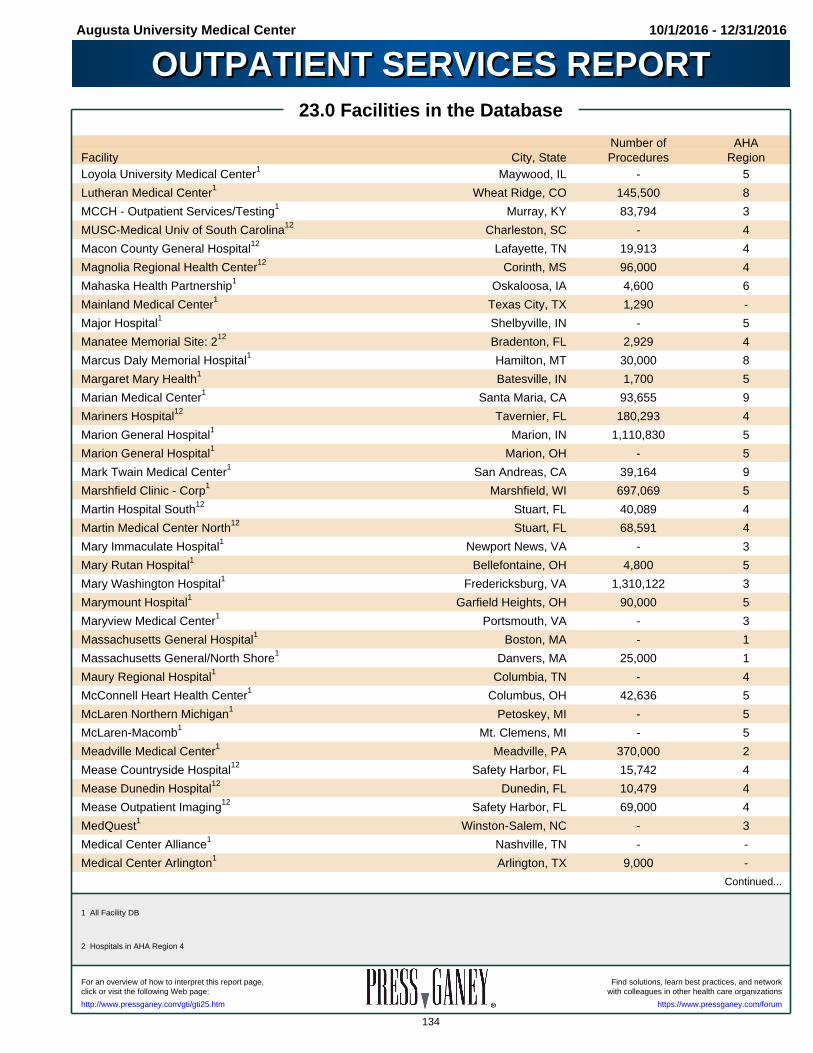
Augusta University Medical Center 10/1/2016 - 12/31/2016
OUTPATIENT SERVICES REPORTOUTPATIENT SERVICES REPORT23.0 Facilities in the Database
Number of AHAFacility City, State Procedures RegionLoyola University Medical Center1 Maywood, IL - 5
Lutheran Medical Center1 Wheat Ridge, CO 145,500 8
MCCH - Outpatient Services/Testing1 Murray, KY 83,794 3
MUSC-Medical Univ of South Carolina12 Charleston, SC - 4
Macon County General Hospital12 Lafayette, TN 19,913 4
Magnolia Regional Health Center12 Corinth, MS 96,000 4
Mahaska Health Partnership1 Oskaloosa, IA 4,600 6
Mainland Medical Center1 Texas City, TX 1,290 -
Major Hospital1 Shelbyville, IN - 5
Manatee Memorial Site: 212 Bradenton, FL 2,929 4
Marcus Daly Memorial Hospital1 Hamilton, MT 30,000 8
Margaret Mary Health1 Batesville, IN 1,700 5
Marian Medical Center1 Santa Maria, CA 93,655 9
Mariners Hospital12 Tavernier, FL 180,293 4
Marion General Hospital1 Marion, IN 1,110,830 5
Marion General Hospital1 Marion, OH - 5
Mark Twain Medical Center1 San Andreas, CA 39,164 9
Marshfield Clinic - Corp1 Marshfield, WI 697,069 5
Martin Hospital South12 Stuart, FL 40,089 4
Martin Medical Center North12 Stuart, FL 68,591 4
Mary Immaculate Hospital1 Newport News, VA - 3
Mary Rutan Hospital1 Bellefontaine, OH 4,800 5
Mary Washington Hospital1 Fredericksburg, VA 1,310,122 3
Marymount Hospital1 Garfield Heights, OH 90,000 5
Maryview Medical Center1 Portsmouth, VA - 3
Massachusetts General Hospital1 Boston, MA - 1
Massachusetts General/North Shore1 Danvers, MA 25,000 1
Maury Regional Hospital1 Columbia, TN - 4
McConnell Heart Health Center1 Columbus, OH 42,636 5
McLaren Northern Michigan1 Petoskey, MI - 5
McLaren-Macomb1 Mt. Clemens, MI - 5
Meadville Medical Center1 Meadville, PA 370,000 2
Mease Countryside Hospital12 Safety Harbor, FL 15,742 4
Mease Dunedin Hospital12 Dunedin, FL 10,479 4
Mease Outpatient Imaging 12 Safety Harbor, FL 69,000 4
MedQuest1 Winston-Salem, NC - 3
Medical Center Alliance1 Nashville, TN - -
Medical Center Arlington1 Arlington, TX 9,000 -
Continued...
1 All Facility DB
2 Hospitals in AHA Region 4
Find solutions, learn best practices, and networkFor an overview of how to interpret this report page,with colleagues in other health care organizationsclick or visit the following Web page:
https://www.pressganey.com/forumhttp://www.pressganey.com/gti/gti25.htm
134
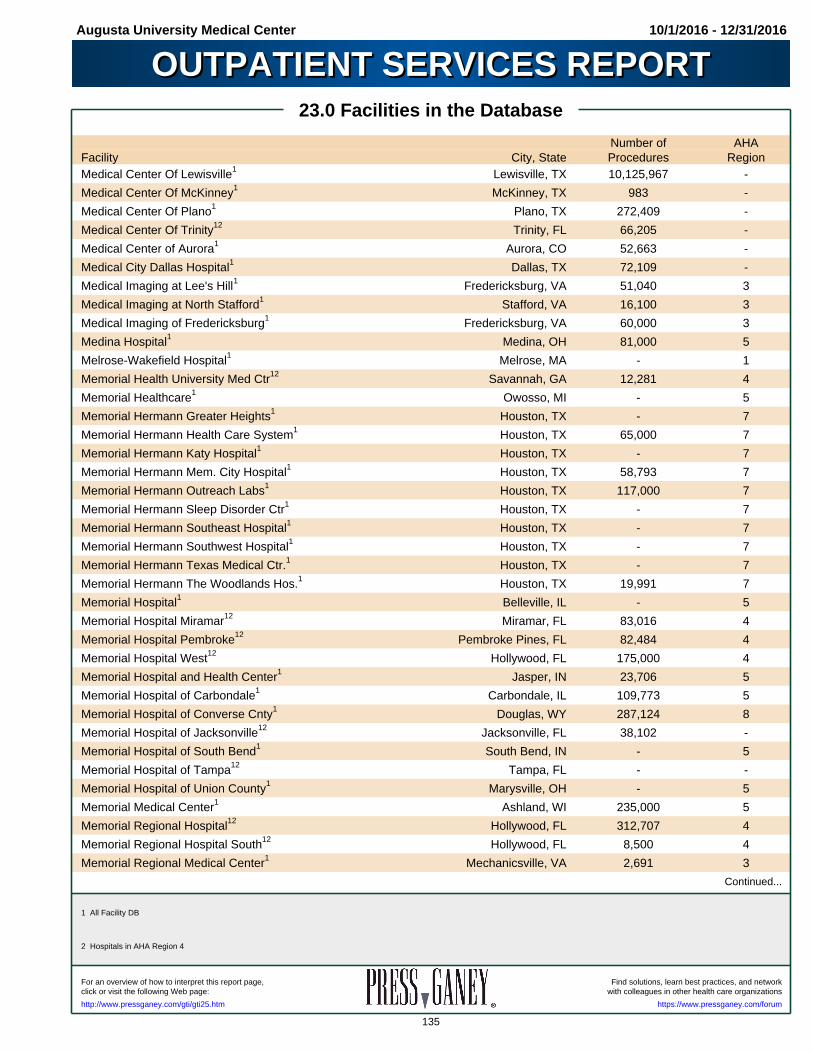
Augusta University Medical Center 10/1/2016 - 12/31/2016
OUTPATIENT SERVICES REPORTOUTPATIENT SERVICES REPORT23.0 Facilities in the Database
Number of AHAFacility City, State Procedures RegionMedical Center Of Lewisville1 Lewisville, TX 10,125,967 -
Medical Center Of McKinney1 McKinney, TX 983 -
Medical Center Of Plano1 Plano, TX 272,409 -
Medical Center Of Trinity12 Trinity, FL 66,205 -
Medical Center of Aurora1 Aurora, CO 52,663 -
Medical City Dallas Hospital1 Dallas, TX 72,109 -
Medical Imaging at Lee's Hill1 Fredericksburg, VA 51,040 3
Medical Imaging at North Stafford1 Stafford, VA 16,100 3
Medical Imaging of Fredericksburg1 Fredericksburg, VA 60,000 3
Medina Hospital1 Medina, OH 81,000 5
Melrose-Wakefield Hospital1 Melrose, MA - 1
Memorial Health University Med Ctr12 Savannah, GA 12,281 4
Memorial Healthcare1 Owosso, MI - 5
Memorial Hermann Greater Heights1 Houston, TX - 7
Memorial Hermann Health Care System1 Houston, TX 65,000 7
Memorial Hermann Katy Hospital1 Houston, TX - 7
Memorial Hermann Mem. City Hospital1 Houston, TX 58,793 7
Memorial Hermann Outreach Labs1 Houston, TX 117,000 7
Memorial Hermann Sleep Disorder Ctr1 Houston, TX - 7
Memorial Hermann Southeast Hospital1 Houston, TX - 7
Memorial Hermann Southwest Hospital1 Houston, TX - 7
Memorial Hermann Texas Medical Ctr.1 Houston, TX - 7
Memorial Hermann The Woodlands Hos.1 Houston, TX 19,991 7
Memorial Hospital1 Belleville, IL - 5
Memorial Hospital Miramar12 Miramar, FL 83,016 4
Memorial Hospital Pembroke12 Pembroke Pines, FL 82,484 4
Memorial Hospital West12 Hollywood, FL 175,000 4
Memorial Hospital and Health Center1 Jasper, IN 23,706 5
Memorial Hospital of Carbondale1 Carbondale, IL 109,773 5
Memorial Hospital of Converse Cnty1 Douglas, WY 287,124 8
Memorial Hospital of Jacksonville12 Jacksonville, FL 38,102 -
Memorial Hospital of South Bend1 South Bend, IN - 5
Memorial Hospital of Tampa12 Tampa, FL - -
Memorial Hospital of Union County1 Marysville, OH - 5
Memorial Medical Center1 Ashland, WI 235,000 5
Memorial Regional Hospital12 Hollywood, FL 312,707 4
Memorial Regional Hospital South12 Hollywood, FL 8,500 4
Memorial Regional Medical Center1 Mechanicsville, VA 2,691 3
Continued...
1 All Facility DB
2 Hospitals in AHA Region 4
Find solutions, learn best practices, and networkFor an overview of how to interpret this report page,with colleagues in other health care organizationsclick or visit the following Web page:
https://www.pressganey.com/forumhttp://www.pressganey.com/gti/gti25.htm
135

Augusta University Medical Center 10/1/2016 - 12/31/2016
OUTPATIENT SERVICES REPORTOUTPATIENT SERVICES REPORT23.0 Facilities in the Database
Number of AHAFacility City, State Procedures RegionMenorah Medical Center1 Overland Park, KS 64,934 -
Mercer Health1 Coldwater, OH 374,000 5
Mercy General Hospital1 Sacramento, CA 39,394 9
Mercy Gilbert Medical Center1 Gilbert, AZ 87,757 8
Mercy Hospital1 Iowa City, IA 82,946 6
Mercy Hospital12 MIami, FL - -
Mercy Hospital & Healthcare Center1 Moose Lake, MN 20,611 6
Mercy Hospitals1 Coon Rapids, MN 256,649 6
Mercy Medical Center1 Cedar Rapids, IA 140,000 6
Mercy Medical Center - North Iowa1 Mason City, IA 98,416 6
Mercy Medical Center - Roseburg1 Roseburg, OR 414,512 9
Mercy Medical Center Merced1 Merced, CA 109,589 9
Mercy Medical Center Mt. Shasta1 Mount Shasta, CA 128,082 9
Mercy Medical Center Redding1 Redding, CA 107,131 9
Mercy Memorial Hospital1 Monroe, MI 183,491 5
Mercy Regional M.C. - Durango1 Durango, CO - 8
Meriter UnityPoint Health1 Madison, WI - 5
Meth. LeBonheur HC-Germantown12 Germantown, TN 26,033 4
Methodist Hospital1 Henderson, KY 85,092 3
Methodist Hospital1 Philadelphia, PA 95,172 2
Methodist Hospital1 San Antonio, TX 445,521 -
Methodist Hospital System, Dallas1 Dallas, TX - 7
Methodist Hospitals Northlake Camp.1 Gary, IN - 5
Methodist Specialty & Transplant Ho1 San Antonio, TX 29,588 -
Methodist Stone Oak Hospital1 San Antonio, TX 36,646 -
Methodist Texsan Hospital1 San Antonio, TX 5,000 -
Methodist West Hospital1 West Des Moines, IA 10,000 6
Metroplex Hospital1 Killeen, TX 60,004 7
Miami Cardiac & Vascular Institute12 Miami, FL 100,000 4
Middlesex Hosp Med Ctr - Saybrook1 Middletown, CT 79,041 1
Middlesex Hospital1 Middletown, CT 132,749 1
Middlesex Hospital MC - Marlborough1 Marlborough, CT 20,437 1
Middlesex Hospital MC - Shoreline1 Essex, CT 41,602 1
Midland Memorial Hospital1 Midland, TX 50,800 7
Midtown Medical Center12 Columbus, GA - 4
Milford Hospital1 Milford, CT - 1
Milford Memorial Hospital1 Milford, DE 51,000 3
Milton Hospital1 Milton, MA - 1
Continued...
1 All Facility DB
2 Hospitals in AHA Region 4
Find solutions, learn best practices, and networkFor an overview of how to interpret this report page,with colleagues in other health care organizationsclick or visit the following Web page:
https://www.pressganey.com/forumhttp://www.pressganey.com/gti/gti25.htm
136

Augusta University Medical Center 10/1/2016 - 12/31/2016
OUTPATIENT SERVICES REPORTOUTPATIENT SERVICES REPORT23.0 Facilities in the Database
Number of AHAFacility City, State Procedures RegionMonmouth Medical Center1 Long Beach, NJ - 2
Monongalia General Hospital1 Morgantown, WV 124,113 3
Monroe Clinic (The)1 Monroe, WI 94,888 5
Monroe County Hospital - Albia1 Albia, IA 20,001 6
Montefiore Medical Center1 Bronx, NY 10,000 2
Montrose Memorial Hospital1 Montrose, CO - 8
Morgan Stanley Children's Hospital1 New York, NY 30,309 2
Morristown Medical Center1 Morristown, NJ 2,130,516 2
Morrow County Hospital1 Mt. Gilead, OH 23,342 5
Moses H. Cone Memorial Hospital1 Greensboro, NC 168,286 3
Mount Nittany Medical Center1 State College, PA 213,223 2
Mount Sinai Beth Israel1 New York, NY 17,708 2
Mountain View Hospital1 Payson, UT 161,453 -
Mountainview Hospital1 Las Vegas, NV 17,921 -
Mt. Baker Imaging, L.L.C.1 Bellingham, WA 165,000 9
Munson Healthcare Grayling Hospital1 Grayling, MI 25,111 5
Munson Medical Center1 Traverse City, MI 153,363 5
NEA Baptist Memorial Hospital1 Jonesboro, AR 188,000 7
NH Brunswick Medical Center1 Bolivia, NC - 3
NH Huntersville Medical Center1 Huntersville, NC - -
NH Matthews Medical Center1 Matthews, NC - -
NH Rowan Medical Center1 Salisbury, NC - -
NH UVA Culpeper Medical Center1 Culpeper, VA - 3
NH UVA Haymarket Medical Center1 Haymarket, VA - -
NH UVA Prince William Medical Cente1 Manassas, VA - 3
NMMC - Barnes Crossing/Crossover12 Tupelo, MS 14,410 4
NMMC - Center for Digestive Health12 Tupelo, MS 9,000 4
NMMC - Hamilton12 Hamilton, AL 14,244 4
NMMC - Iuka12 Iuka, MS 23,443 4
NMMC - Tupelo NMMC - Tupelo12 Tupelo, MS 559,000 4
NMMC - West Point12 West Point, MS 50,000 4
NYU Medical Center1 New York, NY - 2
Naples Community Hospital12 Naples, FL 180,000 4
Nash Health Care1 Rocky Mount, NC 1,083,189 3
National Jewish Medical & Research1 Denver, CO 104,200 8
Nemaha County Hospital1 Auburn, NE 16,673 6
Neosho Regional Medical Center1 Chanute, KS - 6
New Hanover Regional Medical Center1 Wilmington, NC 31,588 3
Continued...
1 All Facility DB
2 Hospitals in AHA Region 4
Find solutions, learn best practices, and networkFor an overview of how to interpret this report page,with colleagues in other health care organizationsclick or visit the following Web page:
https://www.pressganey.com/forumhttp://www.pressganey.com/gti/gti25.htm
137

Augusta University Medical Center 10/1/2016 - 12/31/2016
OUTPATIENT SERVICES REPORTOUTPATIENT SERVICES REPORT23.0 Facilities in the Database
Number of AHAFacility City, State Procedures RegionNew Ulm Medical Center1 New Ulm, MN 212,000 6
New York - Presbyterian/Columbia1 New York, NY 104,973 2
New York Hospital Queens1 Flushing, NY - 2
New York-Presbyterian/Weill Cornell1 New York, NY 8,861 2
Newton Medical Center1 Newton, NJ 160,000 2
Newton-Wellesley Hospital1 Newton, MA 1,545,398 1
Non-Oncology Infusion Center1 Seattle, WA - 9
North Austin Medical Center1 Austin, TX 58,698 -
North Cypress Medical Center1 Cypress, TX 204,981 7
North Florida Regional Medical Cent12 Gainesville, FL - -
North Hills Hospital1 North Richland Hills, TX 1,553 -
North Kansas City Hospital1 North Kansas City, MO - 6
North Memorial Health Care1 Robbinsdale, MN 120,000 6
North Oaks Medical Center1 Hammond, LA 156,000 7
North Suburban1 Thornton, CO 22,495 -
North Valley1 Whitefish, MT 62,096 8
NorthShore Offsite Outpatient Serv1 Evanston, IL 589,665 5
Northeast Vermont Regional Hospital1 St. Johnsbury, VT - 1
Northport Medical Center12 Northport, AL 68,849 4
Northridge Hospital Medical Center1 Northridge, CA 98,773 9
Northside Hospital12 Atlanta, GA - 4
Northside Hospital - Cherokee12 Canton, GA - 4
Northside Hospital - Forsyth12 Cumming, GA - 4
Northside Medical Center12 Columbus, GA 2,228 4
Northwell Health - 611 N Blvd1 Great Neck, NY 17,500 2
Northwell Health - 935 N Blvd1 Great Neck, NY 28,373 2
Northwell Health - CFAM1 Great Neck, NY - 2
Northwell Health - Garden City1 Manhasset, NY 18,112 2
Northwell Health - Glen Cove1 Glen Cove, NY - 2
Northwell Health - Great South Bay1 Great Neck, NY 16,500 2
Northwell Health - LafayetteSyosset1 Great Neck, NY - 2
Northwell Health - Lenox Hill1 Great Neck, NY 55,000 2
Northwell Health - NSUH1 Great Neck, NY - 2
Northwell Health - Reichert Family1 Manhasset, NY 12,000 2
Northwell Health - Verrazano1 Staten Island, NY 37,000 2
Northwest Community Hospital1 Arlington Heights, IL 320,950 5
Northwest Medical Center12 Margate, FL 16,737 -
Northwest Texas Site: 21 Amarillo, TX 736,758 7
Continued...
1 All Facility DB
2 Hospitals in AHA Region 4
Find solutions, learn best practices, and networkFor an overview of how to interpret this report page,with colleagues in other health care organizationsclick or visit the following Web page:
https://www.pressganey.com/forumhttp://www.pressganey.com/gti/gti25.htm
138

Augusta University Medical Center 10/1/2016 - 12/31/2016
OUTPATIENT SERVICES REPORTOUTPATIENT SERVICES REPORT23.0 Facilities in the Database
Number of AHAFacility City, State Procedures RegionNorthwestern Lake Forest Hospital1 Lake Forest, IL 129,000 5
Northwestern Medical Center1 St. Albans, VT - 1
Norton Community Hospital1 Norton, VA - 3
Nyack Hospital1 Nyack, NY 135,000 2
O'Bleness Memorial Hospital1 Athens, OH - 5
OMC - Baton Rouge1 Baton Rouge, LA 18,300 7
OSF Center for Health - Rock Cut1 Loves Park, IL 30,000 5
OSF Saint Francis Medical Center1 Peoria, IL - 5
OSF Saint James Medical Center1 Pontiac, IL 71,025 5
OSF St. Joseph Medical Center1 Bloomington, IL 135,000 5
OSU Medical Center1 Tulsa, OK - 7
OU - TCH Medical Center1 Houston, TX 627,000 7
OU - TCH West Campus1 Houston, TX 174,000 7
OU - TCH Woodlands1 The Woodlands, TX - 7
OU Children's Hospital1 Oklahoma City, OK 68,574 -
OU Medical Center1 Oklahoma City, OK 143,063 -
OU Medical Center Edmond1 Edmond, OK 37,352 -
OUMC Breast Imaging of Oklahoma1 Edmond, OK 24,000 7
Oak Hill Hospital12 Brooksville, FL 156,954 -
Oaklawn Hospital1 Marshall, MI - 5
Oakwood Hospital - Dearborn1 Dearborn, MI - 5
Ocala Regional Medical Center12 Ocala, FL 127,836 -
Ocean Medical Center1 Brick, NJ 421,034 2
Ochsner Health System1 New Orleans, LA 500,001 7
Ochsner Medical Center - Kenner1 Kenner, LA 60,500 7
Ochsner Medical Center -North Shore1 Slidell, LA 4,734 7
Ochsner Medical Center- West Bank1 Gretna, LA 3,400 7
Ochsner-Baptist Medical Center1 New Orleans, LA 10,936 7
Oconee Medical Center12 Seneca, SC 124,315 4
Ogden Regional Medical Center1 Ogden, UT - -
Ohio State University Wexner Medica1 Columbus, OH 100,000 5
Ohio Valley Hospital1 McKees Rocks, PA 2,850 2
OhioHealth Infusion Center1 Columbus, OH 1,044 5
OhioHealth Mansfield Hospital 1 Mansfield, OH - 5
OhioHealth Neighborhood Care1 Columbus, OH 350,000 5
OhioHealth Shelby Hospital1 Shelby, OH - 5
OhioHealth Sleep Services1 Worthington, OH 5,500 5
Oklahoma Surgical Hospital1 Tulsa, OK 31,912 7
Continued...
1 All Facility DB
2 Hospitals in AHA Region 4
Find solutions, learn best practices, and networkFor an overview of how to interpret this report page,with colleagues in other health care organizationsclick or visit the following Web page:
https://www.pressganey.com/forumhttp://www.pressganey.com/gti/gti25.htm
139

Augusta University Medical Center 10/1/2016 - 12/31/2016
OUTPATIENT SERVICES REPORTOUTPATIENT SERVICES REPORT23.0 Facilities in the Database
Number of AHAFacility City, State Procedures RegionOlean General Hospital1 Olean, NY 117,615 2
Opelousas General Health System1 Opelousas, LA - 7
Orange Park Medical Center12 Orange Park, FL - -
Orlando Regional Medical Center12 Orlando, FL 25,884 4
Ortoncille Area Health Services1 Ortonville, MN 650 6
Osceola Regional Medical Center12 Kissimmee, FL - -
Oswego Hospital1 Oswego, NY 152,899 2
Our Lady of Bellefonte Hospital1 Ashland, KY - 3
Our Lady of Lourdes Regional M.C.1 Lafayette, LA 36,148 7
Our Lady of The Lake Reg. M.C.1 Baton Rouge, LA 212,908 7
Outpatient Imaging Affiliates, LLC12 Franklin, TN - 4
Outpatient Services1 Lima, OH 133,554 5
Overlake Hospital Medical Center1 Bellevue, WA 98,951 9
Overland Park Regional Medical1 Overland Park, KS 43,585 -
Overlook Medical Center1 Summit, NJ 134,225 2
Palmetto Health Baptist1 Columbia, SC - 4
Palmetto Health Richland12 Columbia, SC 128,000 4
Palms West Hospital12 Loxahatchee, FL 61,000 -
Palms of Pasadena Hospital12 Saint Petersburg, FL 18,000 -
Palomar Medical Center1 Escondido, CA 66,526 9
Paoli Hospital1 Paoli, PA 84,442 2
Parham Doctors' Hospital1 Richmond, VA - -
Paris Community Hospital1 Paris, IN - 5
Park Ridge Health1 Fletcher, NC - 3
Parker Adventist Hospital1 Parker, CO - 8
Parkland Health & Hospital System1 Dallas, TX 506,625 7
Parkland Medical Center1 Derry, NH 46,987 -
Parkridge Medical Center12 Chattanooga, TN 148,300 -
Pathology/Lab Medicine1 Philadelphia, PA 155,000 2
Paul Oliver Memorial Hospital1 Frankfort, MI - 5
Pekin Hospital1 Pekin, IL 47,218 5
Penn Highlands Elk1 St. Mary's, PA 2,100,000 2
Penn Medicine CCH Radiology1 West Chester, PA 3,019 2
Penrose Hospital1 Colorado Springs, CO 115,347 8
Perry County Memorial Hospital1 Tell City, IN - 5
Phoebe Putney Memorial Hospital12 Albany, GA 718,691 4
Piedmont Atlanta Hospital12 Atlanta, GA - 4
Piedmont Fayette Hospital12 Fayetteville, GA - 4
Continued...
1 All Facility DB
2 Hospitals in AHA Region 4
Find solutions, learn best practices, and networkFor an overview of how to interpret this report page,with colleagues in other health care organizationsclick or visit the following Web page:
https://www.pressganey.com/forumhttp://www.pressganey.com/gti/gti25.htm
140
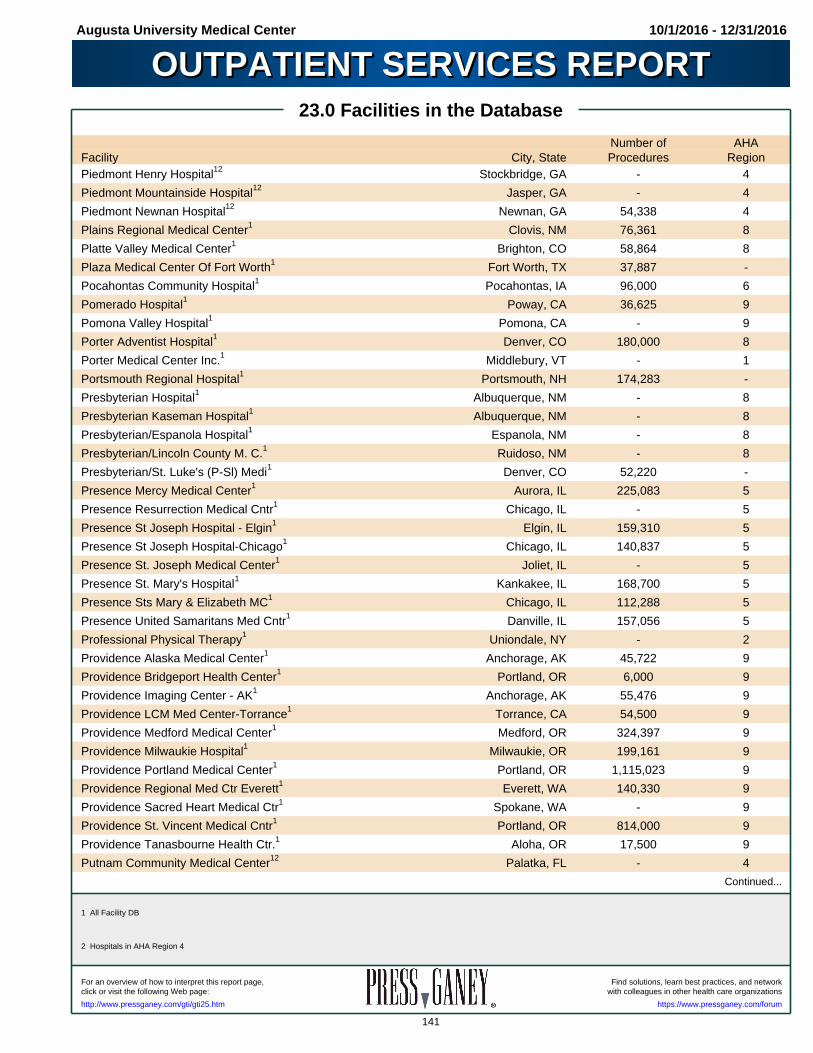
Augusta University Medical Center 10/1/2016 - 12/31/2016
OUTPATIENT SERVICES REPORTOUTPATIENT SERVICES REPORT23.0 Facilities in the Database
Number of AHAFacility City, State Procedures RegionPiedmont Henry Hospital12 Stockbridge, GA - 4
Piedmont Mountainside Hospital12 Jasper, GA - 4
Piedmont Newnan Hospital12 Newnan, GA 54,338 4
Plains Regional Medical Center1 Clovis, NM 76,361 8
Platte Valley Medical Center1 Brighton, CO 58,864 8
Plaza Medical Center Of Fort Worth1 Fort Worth, TX 37,887 -
Pocahontas Community Hospital1 Pocahontas, IA 96,000 6
Pomerado Hospital1 Poway, CA 36,625 9
Pomona Valley Hospital1 Pomona, CA - 9
Porter Adventist Hospital1 Denver, CO 180,000 8
Porter Medical Center Inc.1 Middlebury, VT - 1
Portsmouth Regional Hospital1 Portsmouth, NH 174,283 -
Presbyterian Hospital1 Albuquerque, NM - 8
Presbyterian Kaseman Hospital1 Albuquerque, NM - 8
Presbyterian/Espanola Hospital1 Espanola, NM - 8
Presbyterian/Lincoln County M. C.1 Ruidoso, NM - 8
Presbyterian/St. Luke's (P-Sl) Medi1 Denver, CO 52,220 -
Presence Mercy Medical Center1 Aurora, IL 225,083 5
Presence Resurrection Medical Cntr1 Chicago, IL - 5
Presence St Joseph Hospital - Elgin1 Elgin, IL 159,310 5
Presence St Joseph Hospital-Chicago1 Chicago, IL 140,837 5
Presence St. Joseph Medical Center1 Joliet, IL - 5
Presence St. Mary's Hospital1 Kankakee, IL 168,700 5
Presence Sts Mary & Elizabeth MC1 Chicago, IL 112,288 5
Presence United Samaritans Med Cntr1 Danville, IL 157,056 5
Professional Physical Therapy1 Uniondale, NY - 2
Providence Alaska Medical Center1 Anchorage, AK 45,722 9
Providence Bridgeport Health Center1 Portland, OR 6,000 9
Providence Imaging Center - AK1 Anchorage, AK 55,476 9
Providence LCM Med Center-Torrance1 Torrance, CA 54,500 9
Providence Medford Medical Center1 Medford, OR 324,397 9
Providence Milwaukie Hospital1 Milwaukie, OR 199,161 9
Providence Portland Medical Center1 Portland, OR 1,115,023 9
Providence Regional Med Ctr Everett1 Everett, WA 140,330 9
Providence Sacred Heart Medical Ctr1 Spokane, WA - 9
Providence St. Vincent Medical Cntr1 Portland, OR 814,000 9
Providence Tanasbourne Health Ctr.1 Aloha, OR 17,500 9
Putnam Community Medical Center12 Palatka, FL - 4
Continued...
1 All Facility DB
2 Hospitals in AHA Region 4
Find solutions, learn best practices, and networkFor an overview of how to interpret this report page,with colleagues in other health care organizationsclick or visit the following Web page:
https://www.pressganey.com/forumhttp://www.pressganey.com/gti/gti25.htm
141
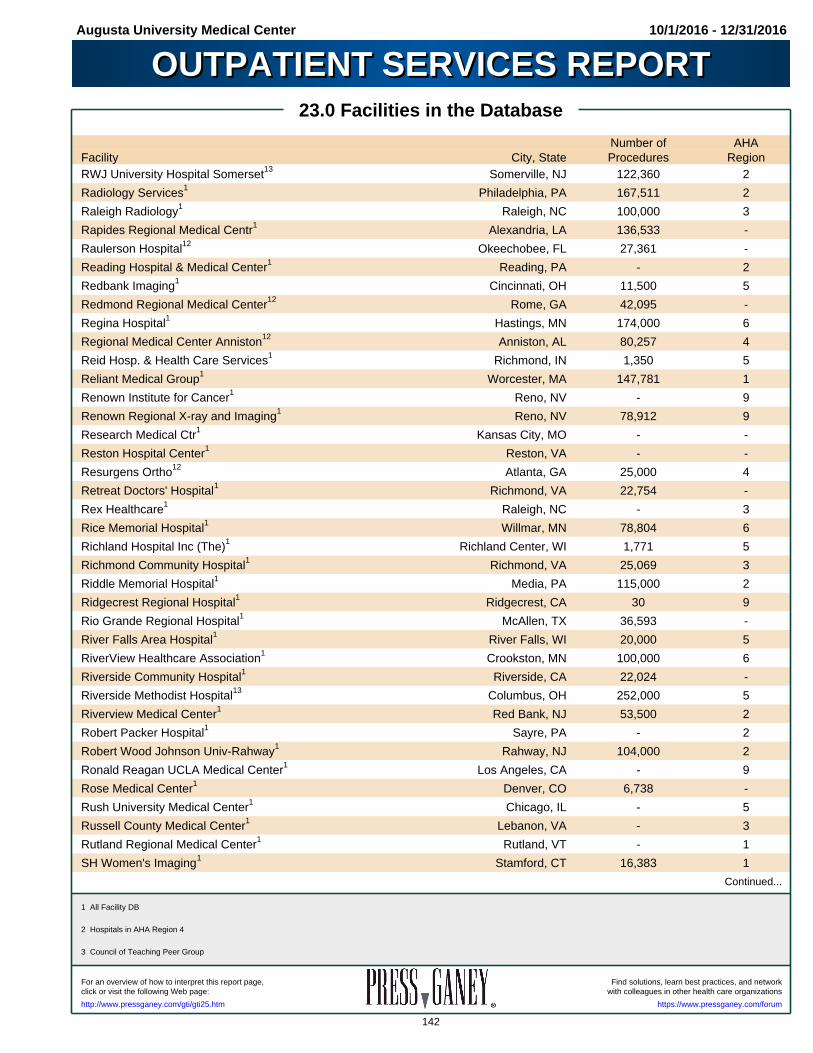
Augusta University Medical Center 10/1/2016 - 12/31/2016
OUTPATIENT SERVICES REPORTOUTPATIENT SERVICES REPORT23.0 Facilities in the Database
Number of AHAFacility City, State Procedures RegionRWJ University Hospital Somerset13 Somerville, NJ 122,360 2
Radiology Services1 Philadelphia, PA 167,511 2
Raleigh Radiology1 Raleigh, NC 100,000 3
Rapides Regional Medical Centr1 Alexandria, LA 136,533 -
Raulerson Hospital12 Okeechobee, FL 27,361 -
Reading Hospital & Medical Center1 Reading, PA - 2
Redbank Imaging1 Cincinnati, OH 11,500 5
Redmond Regional Medical Center12 Rome, GA 42,095 -
Regina Hospital1 Hastings, MN 174,000 6
Regional Medical Center Anniston12 Anniston, AL 80,257 4
Reid Hosp. & Health Care Services1 Richmond, IN 1,350 5
Reliant Medical Group1 Worcester, MA 147,781 1
Renown Institute for Cancer1 Reno, NV - 9
Renown Regional X-ray and Imaging1 Reno, NV 78,912 9
Research Medical Ctr1 Kansas City, MO - -
Reston Hospital Center1 Reston, VA - -
Resurgens Ortho12 Atlanta, GA 25,000 4
Retreat Doctors' Hospital1 Richmond, VA 22,754 -
Rex Healthcare1 Raleigh, NC - 3
Rice Memorial Hospital1 Willmar, MN 78,804 6
Richland Hospital Inc (The)1 Richland Center, WI 1,771 5
Richmond Community Hospital1 Richmond, VA 25,069 3
Riddle Memorial Hospital1 Media, PA 115,000 2
Ridgecrest Regional Hospital1 Ridgecrest, CA 30 9
Rio Grande Regional Hospital1 McAllen, TX 36,593 -
River Falls Area Hospital1 River Falls, WI 20,000 5
RiverView Healthcare Association1 Crookston, MN 100,000 6
Riverside Community Hospital1 Riverside, CA 22,024 -
Riverside Methodist Hospital13 Columbus, OH 252,000 5
Riverview Medical Center1 Red Bank, NJ 53,500 2
Robert Packer Hospital1 Sayre, PA - 2
Robert Wood Johnson Univ-Rahway1 Rahway, NJ 104,000 2
Ronald Reagan UCLA Medical Center1 Los Angeles, CA - 9
Rose Medical Center1 Denver, CO 6,738 -
Rush University Medical Center1 Chicago, IL - 5
Russell County Medical Center1 Lebanon, VA - 3
Rutland Regional Medical Center1 Rutland, VT - 1
SH Women's Imaging1 Stamford, CT 16,383 1
Continued...
1 All Facility DB
2 Hospitals in AHA Region 4
3 Council of Teaching Peer Group
Find solutions, learn best practices, and networkFor an overview of how to interpret this report page,with colleagues in other health care organizationsclick or visit the following Web page:
https://www.pressganey.com/forumhttp://www.pressganey.com/gti/gti25.htm
142

Augusta University Medical Center 10/1/2016 - 12/31/2016
OUTPATIENT SERVICES REPORTOUTPATIENT SERVICES REPORT23.0 Facilities in the Database
Number of AHAFacility City, State Procedures RegionSMC Fargo1 Fargo, ND - 6
SSM Health Saint Louis University1 Greenville, SC - 4
Sacred Heart Hospital1 Eau Claire, WI 110,591 5
Saint Agnes Medical Center-Fresno1 Fresno, CA - 9
Saint Alphonsus Boise1 Boise, ID 90,800 8
Saint Alphonsus Nampa1 Nampa, ID 84,046 8
Saint Alphonsus Ontario1 Ontario, OR 53,529 9
Saint Anthony Medical Center1 Rockford, IL 142,781 5
Saint Barnabas Medical Center1 Livingston, NJ - 2
Saint Francis Hospital and Medical1 Hartford, CT 79,544 1
Saint Francis Memorial Hospital1 San Francisco, CA 1,758 9
Saint Joseph Reg Med Ctr- Plymouth1 Plymouth, IN - 5
Saint Joseph Regional MC-Mishawaka1 Mishawaka, IN 75,751 5
Saint Joseph's of Atlanta12 Atlanta, GA - 4
Saint Mary's Hospital1 Waterbury, CT - 1
Saint Mary's Site: 21 Enid, OK 53,541 7
Saint Vincent Hospital1 Erie, PA 68,000 2
Salem Hospital1 Salem, OR 251,856 9
Salinas Valley Memorial Healthcare1 Salinas, CA 2,288 9
Sampson Regional Medical Center1 Clinton, NC 230,000 3
San Leandro Hospital Campus1 San Leandro, CA - 9
Sanford Bemidji Medical Center1 Bemidj, MN 41,847 6
Sanford USD Medical Center1 Sioux Falls, SD 46,000 6
Sanford Worthington Medical Center1 Worthington, MN 40,175 6
Santa Monica-UCLA Medical Center1 Santa Monica, CA - 9
Sarasota Memorial Hospital12 Sarasota, FL - 4
Saratoga Care1 Saratoga Springs, NY 475,635 2
Sauk Prairie Healthcare1 Prairie Du Sac, WI 27,500 5
Schneck Medical Center1 Seymour, IN 360,615 5
Scotland Memorial Hospital1 Laurinburg, NC 326,605 3
Scripps Green Hospital1 San Diego, CA 129,263 9
Scripps Memorial Hospital Encinitas1 San Diego, CA 58,585 9
Scripps Memorial Hospital La Jolla1 La Jolla, CA 105,522 9
Scripps Mercy Hospital Chula Vista1 San Diego, CA 70,308 9
Scripps Mercy Hospital San Diego1 San Diego, CA 94,953 9
Self Regional Healthcare12 Greenwood, SC 131,875 4
Sequoia Hospital1 Redwood City, CA 68,431 9
Sharp Chula Vista Medical Center1 Chula Vista, CA 113,672 9
Continued...
1 All Facility DB
2 Hospitals in AHA Region 4
Find solutions, learn best practices, and networkFor an overview of how to interpret this report page,with colleagues in other health care organizationsclick or visit the following Web page:
https://www.pressganey.com/forumhttp://www.pressganey.com/gti/gti25.htm
143
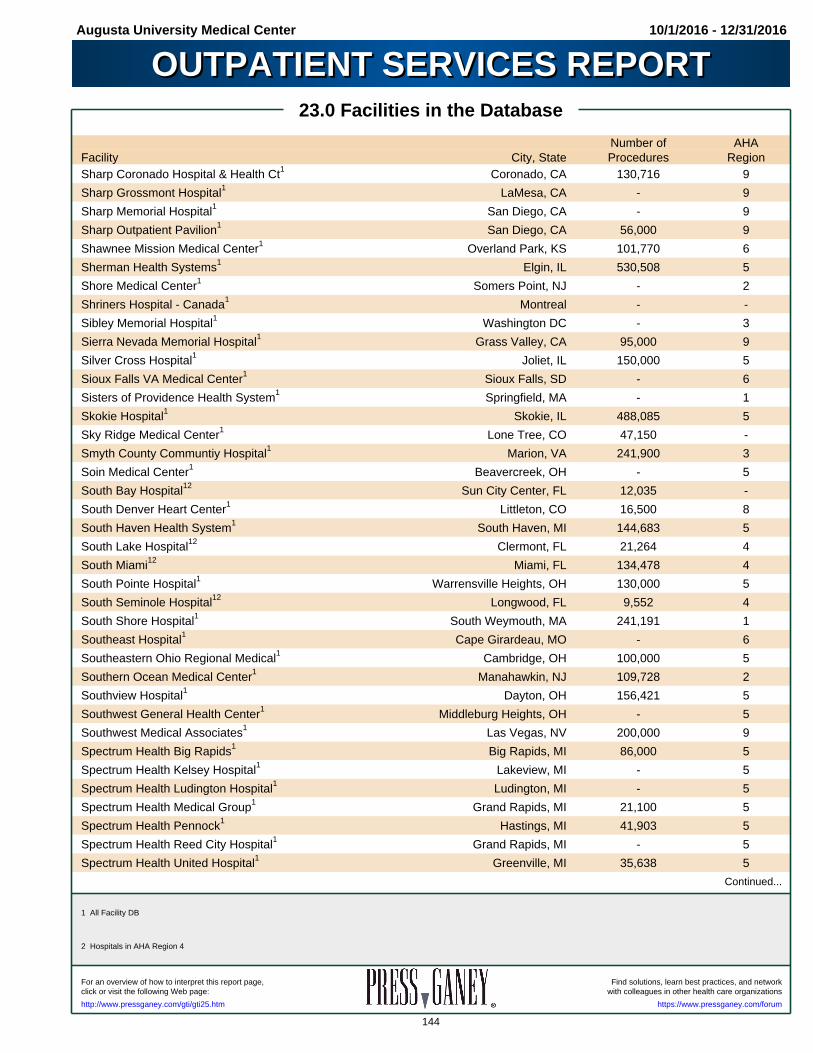
Augusta University Medical Center 10/1/2016 - 12/31/2016
OUTPATIENT SERVICES REPORTOUTPATIENT SERVICES REPORT23.0 Facilities in the Database
Number of AHAFacility City, State Procedures RegionSharp Coronado Hospital & Health Ct1 Coronado, CA 130,716 9
Sharp Grossmont Hospital1 LaMesa, CA - 9
Sharp Memorial Hospital1 San Diego, CA - 9
Sharp Outpatient Pavilion1 San Diego, CA 56,000 9
Shawnee Mission Medical Center1 Overland Park, KS 101,770 6
Sherman Health Systems1 Elgin, IL 530,508 5
Shore Medical Center1 Somers Point, NJ - 2
Shriners Hospital - Canada1 Montreal - -
Sibley Memorial Hospital1 Washington DC - 3
Sierra Nevada Memorial Hospital1 Grass Valley, CA 95,000 9
Silver Cross Hospital1 Joliet, IL 150,000 5
Sioux Falls VA Medical Center1 Sioux Falls, SD - 6
Sisters of Providence Health System1 Springfield, MA - 1
Skokie Hospital1 Skokie, IL 488,085 5
Sky Ridge Medical Center1 Lone Tree, CO 47,150 -
Smyth County Communtiy Hospital1 Marion, VA 241,900 3
Soin Medical Center1 Beavercreek, OH - 5
South Bay Hospital12 Sun City Center, FL 12,035 -
South Denver Heart Center1 Littleton, CO 16,500 8
South Haven Health System1 South Haven, MI 144,683 5
South Lake Hospital12 Clermont, FL 21,264 4
South Miami12 Miami, FL 134,478 4
South Pointe Hospital1 Warrensville Heights, OH 130,000 5
South Seminole Hospital12 Longwood, FL 9,552 4
South Shore Hospital1 South Weymouth, MA 241,191 1
Southeast Hospital1 Cape Girardeau, MO - 6
Southeastern Ohio Regional Medical1 Cambridge, OH 100,000 5
Southern Ocean Medical Center1 Manahawkin, NJ 109,728 2
Southview Hospital1 Dayton, OH 156,421 5
Southwest General Health Center1 Middleburg Heights, OH - 5
Southwest Medical Associates1 Las Vegas, NV 200,000 9
Spectrum Health Big Rapids1 Big Rapids, MI 86,000 5
Spectrum Health Kelsey Hospital1 Lakeview, MI - 5
Spectrum Health Ludington Hospital1 Ludington, MI - 5
Spectrum Health Medical Group1 Grand Rapids, MI 21,100 5
Spectrum Health Pennock1 Hastings, MI 41,903 5
Spectrum Health Reed City Hospital1 Grand Rapids, MI - 5
Spectrum Health United Hospital1 Greenville, MI 35,638 5
Continued...
1 All Facility DB
2 Hospitals in AHA Region 4
Find solutions, learn best practices, and networkFor an overview of how to interpret this report page,with colleagues in other health care organizationsclick or visit the following Web page:
https://www.pressganey.com/forumhttp://www.pressganey.com/gti/gti25.htm
144

Augusta University Medical Center 10/1/2016 - 12/31/2016
OUTPATIENT SERVICES REPORTOUTPATIENT SERVICES REPORT23.0 Facilities in the Database
Number of AHAFacility City, State Procedures RegionSpencer Municipal Hospital1 Spencer, IA 75,000 6
Spooner Health System1 Spooner, WI - 5
Spotsylvania Regional Medical1 Fredericksburg, VA 20,937 -
Springfield Clinic, LLP1 Springfield, IL 763,566 5
St Mark's Hospital1 Salt Lake City, UT 98,000 -
St Petersburg General Hospital12 Saint Petersburg, FL - -
St. Anthony Community Hospital1 Warwick, NY - 2
St. Anthony Hospital1 Oklahoma City, OK 82,382 7
St. Anthony Hospital1 Denver, CO 36,231 8
St. Anthony North Hospital1 Westminster, CO 34,664 8
St. Anthony Shawnee Hospital1 Shawnee, OK 55,000 7
St. Anthony Summit Medical Center1 Frisco, CO 7,650 8
St. Anthony's Hospital12 St. Petersburg, FL 31,997 4
St. Anthony's Medical Center1 St. Louis, MO - 6
St. Anthony's Memorial Hospital1 Effingham, IL 133,850 5
St. Catherine Hospital1 East Chicago, IN 411,619 5
St. Charlies Health System1 Bend, OR 148,000 9
St. Clair Hospital1 Pittsburgh, PA 489,637 2
St. Clare Hospital & Health Service1 Baraboo, WI 53,749 5
St. Clare Hospital-Fenton1 Kirkwood, MO 199,164 6
St. Clare Memorial Hospital1 Oconto Falls, WI 58,097 5
St. Cloud Hospital1 St. Cloud, MN 230,000 6
St. David's Georgetown1 Georgetown, TX 25,291 -
St. David's Medical Center1 Austin, TX - -
St. David's Round Rock Medical Cent1 Round Rock, TX 20,815 -
St. David's South Austin Medical Ce1 Austin, TX 236,398 -
St. Elizabeth Community Hospital1 Red Bluff, CA 67,082 9
St. Elizabeth Hospital1 Gonzales, LA 157,612 7
St. Elizabeth's Hospital1 Belleville, IL 85,502 5
St. Francis Downtown12 Greenville, SC 82,595 4
St. Francis Eastside12 Greenville, SC 84,626 4
St. Francis Health Center1 Topeka, KS 263,077 6
St. Francis Hospital1 Roslyn, NY - 2
St. Francis Hospital1 Litchfield, IL 60,000 5
St. Francis Hospital -The DeMatteis1 Roslyn, NY - 2
St. Francis Hospital of Evanston1 Evanston, IL 91,659 5
St. Francis Hospital-Maryville1 Maryville, MO 98,130 6
St. Francis Medical Center1 Monroe, LA 82,972 7
Continued...
1 All Facility DB
2 Hospitals in AHA Region 4
Find solutions, learn best practices, and networkFor an overview of how to interpret this report page,with colleagues in other health care organizationsclick or visit the following Web page:
https://www.pressganey.com/forumhttp://www.pressganey.com/gti/gti25.htm
145
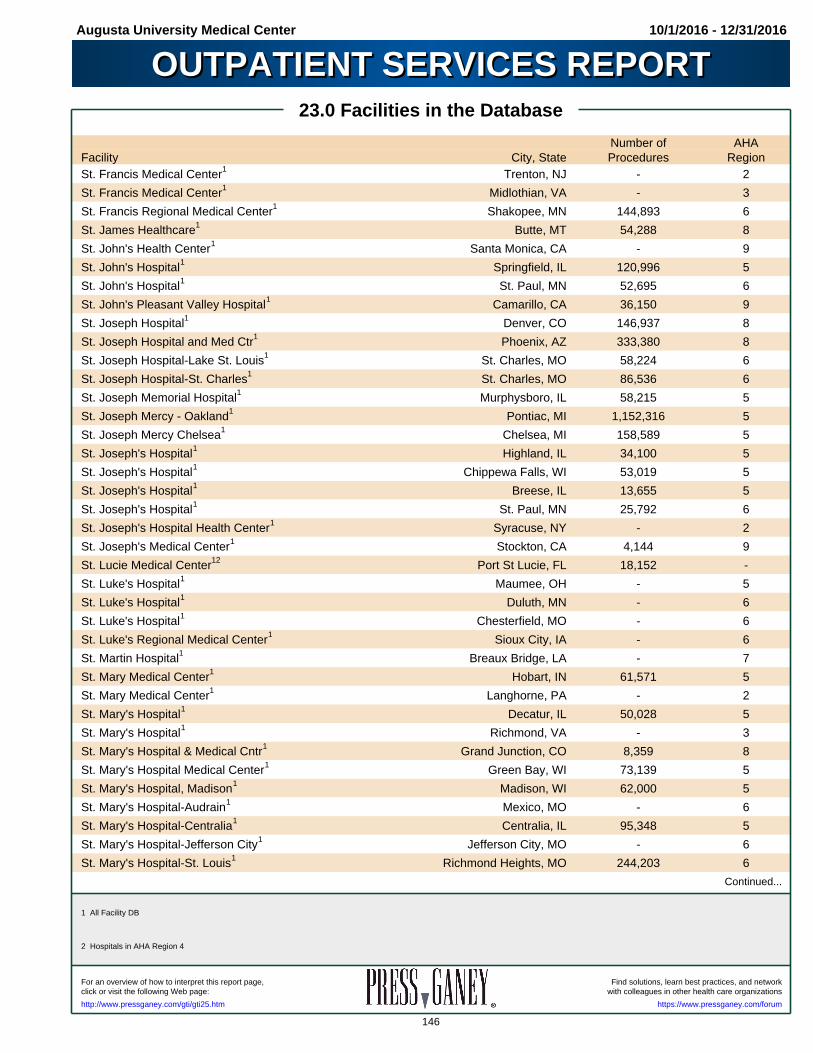
Augusta University Medical Center 10/1/2016 - 12/31/2016
OUTPATIENT SERVICES REPORTOUTPATIENT SERVICES REPORT23.0 Facilities in the Database
Number of AHAFacility City, State Procedures RegionSt. Francis Medical Center1 Trenton, NJ - 2
St. Francis Medical Center1 Midlothian, VA - 3
St. Francis Regional Medical Center1 Shakopee, MN 144,893 6
St. James Healthcare1 Butte, MT 54,288 8
St. John's Health Center1 Santa Monica, CA - 9
St. John's Hospital1 Springfield, IL 120,996 5
St. John's Hospital1 St. Paul, MN 52,695 6
St. John's Pleasant Valley Hospital1 Camarillo, CA 36,150 9
St. Joseph Hospital1 Denver, CO 146,937 8
St. Joseph Hospital and Med Ctr1 Phoenix, AZ 333,380 8
St. Joseph Hospital-Lake St. Louis1 St. Charles, MO 58,224 6
St. Joseph Hospital-St. Charles1 St. Charles, MO 86,536 6
St. Joseph Memorial Hospital1 Murphysboro, IL 58,215 5
St. Joseph Mercy - Oakland1 Pontiac, MI 1,152,316 5
St. Joseph Mercy Chelsea1 Chelsea, MI 158,589 5
St. Joseph's Hospital1 Highland, IL 34,100 5
St. Joseph's Hospital1 Chippewa Falls, WI 53,019 5
St. Joseph's Hospital1 Breese, IL 13,655 5
St. Joseph's Hospital1 St. Paul, MN 25,792 6
St. Joseph's Hospital Health Center1 Syracuse, NY - 2
St. Joseph's Medical Center1 Stockton, CA 4,144 9
St. Lucie Medical Center12 Port St Lucie, FL 18,152 -
St. Luke's Hospital1 Maumee, OH - 5
St. Luke's Hospital1 Duluth, MN - 6
St. Luke's Hospital1 Chesterfield, MO - 6
St. Luke's Regional Medical Center1 Sioux City, IA - 6
St. Martin Hospital1 Breaux Bridge, LA - 7
St. Mary Medical Center1 Hobart, IN 61,571 5
St. Mary Medical Center1 Langhorne, PA - 2
St. Mary's Hospital1 Decatur, IL 50,028 5
St. Mary's Hospital1 Richmond, VA - 3
St. Mary's Hospital & Medical Cntr1 Grand Junction, CO 8,359 8
St. Mary's Hospital Medical Center1 Green Bay, WI 73,139 5
St. Mary's Hospital, Madison1 Madison, WI 62,000 5
St. Mary's Hospital-Audrain1 Mexico, MO - 6
St. Mary's Hospital-Centralia1 Centralia, IL 95,348 5
St. Mary's Hospital-Jefferson City1 Jefferson City, MO - 6
St. Mary's Hospital-St. Louis1 Richmond Heights, MO 244,203 6
Continued...
1 All Facility DB
2 Hospitals in AHA Region 4
Find solutions, learn best practices, and networkFor an overview of how to interpret this report page,with colleagues in other health care organizationsclick or visit the following Web page:
https://www.pressganey.com/forumhttp://www.pressganey.com/gti/gti25.htm
146
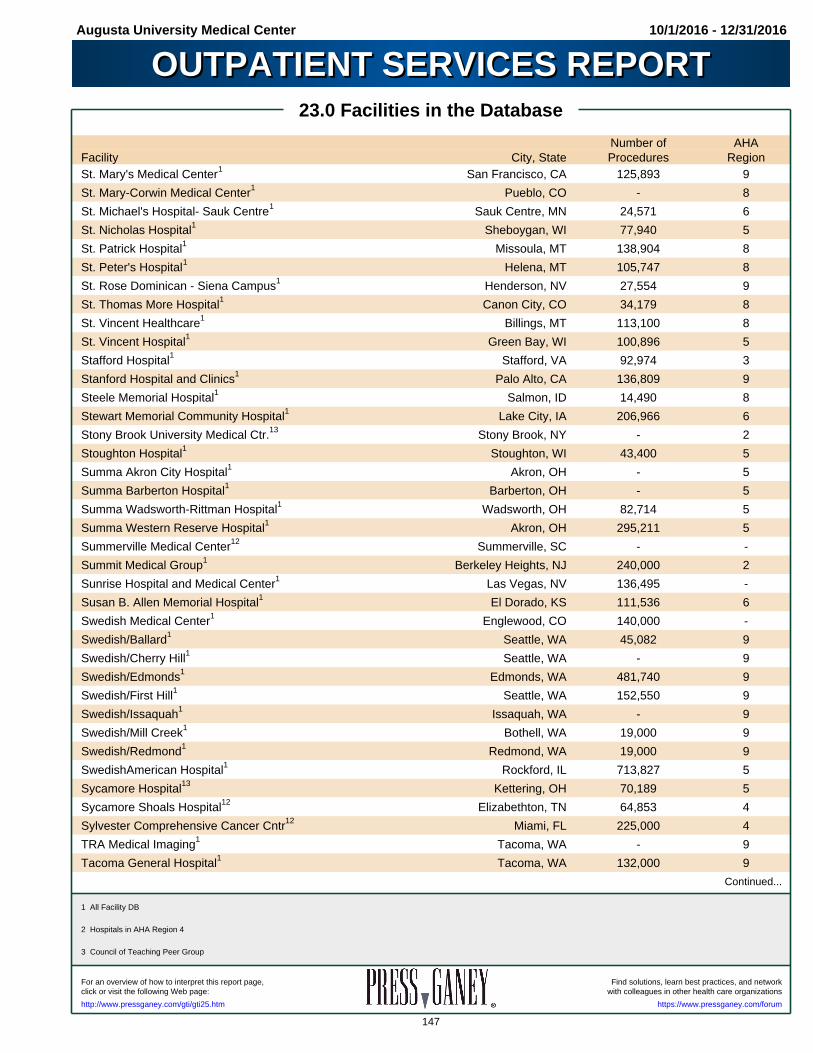
Augusta University Medical Center 10/1/2016 - 12/31/2016
OUTPATIENT SERVICES REPORTOUTPATIENT SERVICES REPORT23.0 Facilities in the Database
Number of AHAFacility City, State Procedures RegionSt. Mary's Medical Center1 San Francisco, CA 125,893 9
St. Mary-Corwin Medical Center1 Pueblo, CO - 8
St. Michael's Hospital- Sauk Centre1 Sauk Centre, MN 24,571 6
St. Nicholas Hospital1 Sheboygan, WI 77,940 5
St. Patrick Hospital1 Missoula, MT 138,904 8
St. Peter's Hospital1 Helena, MT 105,747 8
St. Rose Dominican - Siena Campus1 Henderson, NV 27,554 9
St. Thomas More Hospital1 Canon City, CO 34,179 8
St. Vincent Healthcare1 Billings, MT 113,100 8
St. Vincent Hospital1 Green Bay, WI 100,896 5
Stafford Hospital1 Stafford, VA 92,974 3
Stanford Hospital and Clinics1 Palo Alto, CA 136,809 9
Steele Memorial Hospital1 Salmon, ID 14,490 8
Stewart Memorial Community Hospital1 Lake City, IA 206,966 6
Stony Brook University Medical Ctr.13 Stony Brook, NY - 2
Stoughton Hospital1 Stoughton, WI 43,400 5
Summa Akron City Hospital1 Akron, OH - 5
Summa Barberton Hospital1 Barberton, OH - 5
Summa Wadsworth-Rittman Hospital1 Wadsworth, OH 82,714 5
Summa Western Reserve Hospital1 Akron, OH 295,211 5
Summerville Medical Center12 Summerville, SC - -
Summit Medical Group1 Berkeley Heights, NJ 240,000 2
Sunrise Hospital and Medical Center1 Las Vegas, NV 136,495 -
Susan B. Allen Memorial Hospital1 El Dorado, KS 111,536 6
Swedish Medical Center1 Englewood, CO 140,000 -
Swedish/Ballard1 Seattle, WA 45,082 9
Swedish/Cherry Hill1 Seattle, WA - 9
Swedish/Edmonds1 Edmonds, WA 481,740 9
Swedish/First Hill1 Seattle, WA 152,550 9
Swedish/Issaquah1 Issaquah, WA - 9
Swedish/Mill Creek1 Bothell, WA 19,000 9
Swedish/Redmond1 Redmond, WA 19,000 9
SwedishAmerican Hospital1 Rockford, IL 713,827 5
Sycamore Hospital13 Kettering, OH 70,189 5
Sycamore Shoals Hospital12 Elizabethton, TN 64,853 4
Sylvester Comprehensive Cancer Cntr12 Miami, FL 225,000 4
TRA Medical Imaging1 Tacoma, WA - 9
Tacoma General Hospital1 Tacoma, WA 132,000 9
Continued...
1 All Facility DB
2 Hospitals in AHA Region 4
3 Council of Teaching Peer Group
Find solutions, learn best practices, and networkFor an overview of how to interpret this report page,with colleagues in other health care organizationsclick or visit the following Web page:
https://www.pressganey.com/forumhttp://www.pressganey.com/gti/gti25.htm
147

Augusta University Medical Center 10/1/2016 - 12/31/2016
OUTPATIENT SERVICES REPORTOUTPATIENT SERVICES REPORT23.0 Facilities in the Database
Number of AHAFacility City, State Procedures RegionTahoe Forest Hospital District1 Truckee, CA 49,000 9
Takoma Regional Hospital12 Greeneville, TN 2,500 4
Tanner Medical Center - Carrollton12 Carrollton, GA 665,652 4
Tanner Medical Center - Villa Rica12 Villa Rica, GA 407,534 4
Taylor Regional Hospital1 Campbellsville, KY 374,577 3
Temple University Hospital1 Philadelphia, PA - 2
Terre Haute Regional Hospital1 Terre Haute, IN 44,253 -
Texas Health Allen1 Allen, TX 42,410 7
Texas Health Arlington Memorial1 Arlington, TX 92,776 7
Texas Health Azle1 Azle, TX 28,899 7
Texas Health Center for Diagnostics1 Plano, TX 18,788 7
Texas Health Cleburne1 Cleburne, TX 37,111 7
Texas Health Denton1 Denton, TX 30,199 7
Texas Health Flower Mound1 Flower Mound, TX 24,677 7
Texas Health Fort Worth1 Fort Worth, TX 139,172 7
Texas Health Huguley Hospital1 Burleson, TX 40,000 7
Texas Health Hurst-Euless-Bedford1 Bedford, TX 95,435 7
Texas Health Kaufman1 Kaufman, TX 35,714 7
Texas Health Plano1 Plano, TX 108,445 7
Texas Health Presbyterian-Dallas1 Dallas, TX 188,808 7
Texas Health Rockwall1 Rockwall, TX 2,600 7
Texas Health Southwest Fort Worth1 Fort Worth, TX 79,966 7
Texas Health Stephenville1 Stephenville, TX 24,356 7
Texas Orthopedic Hospital1 Houston, TX 2,500 -
Texas Spine & Joint Hospital1 Tyler, TX 53,583 7
Texoma Medical Site: 21 Denison, TX 44,725 7
The Christ Hospital1 Cincinnati, OH 133,567 5
The Emory Clinic12 Atlanta, GA - 4
The Health & Wellness Center/Doyles1 Doylestown, PA - 2
The Johns Hopkins Hospital13 Baltimore, MD 900,000 3
The MetroHealth System1 Cleveland, OH 876,873 5
The Mount Sinai Hospital1 New York, NY - 2
The Queen's Medical - West O'ahu1 Ewa Beach, HI 19,032 9
The Queen's Medical Center1 Honolulu, HI 109,285 9
The Regional Medical Center12 Orangeburg, SC 50,001 4
The Uniontown Hospital1 Uniontown, PA 161,815 2
The University of Chicago Medicine1 Chicago, IL 400,000 5
The University of Vermont Medical C1 Burlington, VT - 1
Continued...
1 All Facility DB
2 Hospitals in AHA Region 4
3 Council of Teaching Peer Group
Find solutions, learn best practices, and networkFor an overview of how to interpret this report page,with colleagues in other health care organizationsclick or visit the following Web page:
https://www.pressganey.com/forumhttp://www.pressganey.com/gti/gti25.htm
148
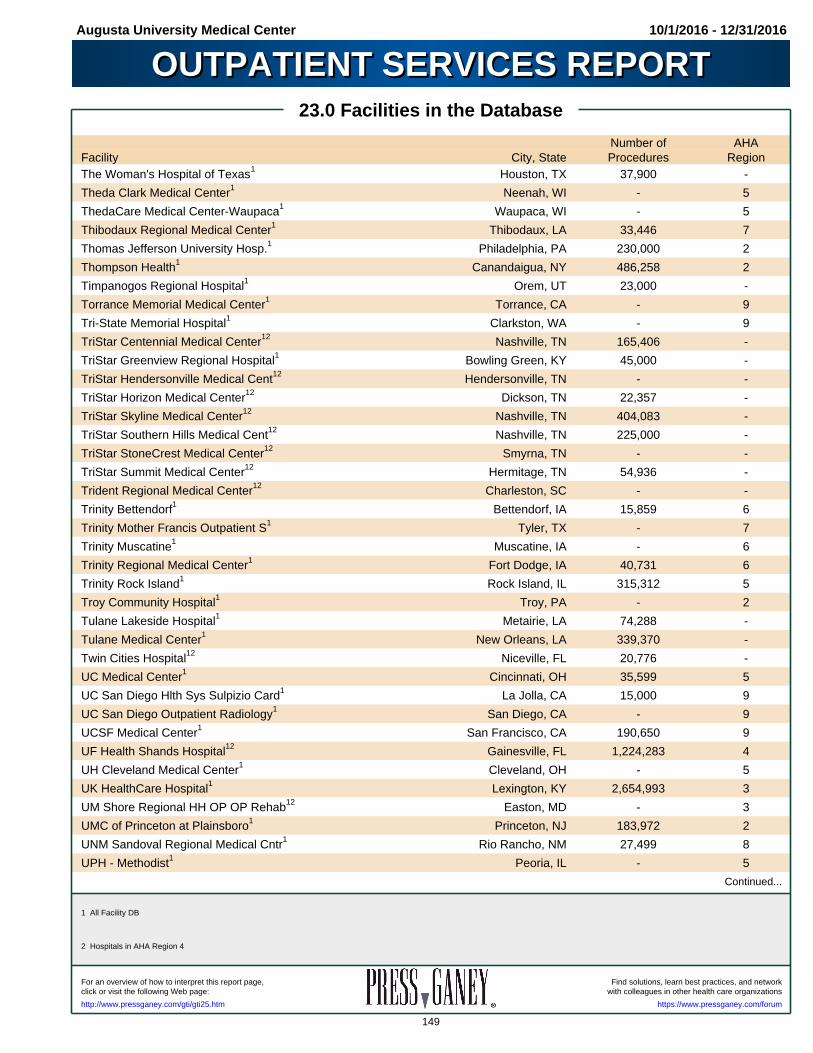
Augusta University Medical Center 10/1/2016 - 12/31/2016
OUTPATIENT SERVICES REPORTOUTPATIENT SERVICES REPORT23.0 Facilities in the Database
Number of AHAFacility City, State Procedures RegionThe Woman's Hospital of Texas1 Houston, TX 37,900 -
Theda Clark Medical Center1 Neenah, WI - 5
ThedaCare Medical Center-Waupaca1 Waupaca, WI - 5
Thibodaux Regional Medical Center1 Thibodaux, LA 33,446 7
Thomas Jefferson University Hosp.1 Philadelphia, PA 230,000 2
Thompson Health1 Canandaigua, NY 486,258 2
Timpanogos Regional Hospital1 Orem, UT 23,000 -
Torrance Memorial Medical Center1 Torrance, CA - 9
Tri-State Memorial Hospital1 Clarkston, WA - 9
TriStar Centennial Medical Center12 Nashville, TN 165,406 -
TriStar Greenview Regional Hospital1 Bowling Green, KY 45,000 -
TriStar Hendersonville Medical Cent12 Hendersonville, TN - -
TriStar Horizon Medical Center12 Dickson, TN 22,357 -
TriStar Skyline Medical Center12 Nashville, TN 404,083 -
TriStar Southern Hills Medical Cent12 Nashville, TN 225,000 -
TriStar StoneCrest Medical Center12 Smyrna, TN - -
TriStar Summit Medical Center12 Hermitage, TN 54,936 -
Trident Regional Medical Center12 Charleston, SC - -
Trinity Bettendorf1 Bettendorf, IA 15,859 6
Trinity Mother Francis Outpatient S1 Tyler, TX - 7
Trinity Muscatine1 Muscatine, IA - 6
Trinity Regional Medical Center1 Fort Dodge, IA 40,731 6
Trinity Rock Island1 Rock Island, IL 315,312 5
Troy Community Hospital1 Troy, PA - 2
Tulane Lakeside Hospital1 Metairie, LA 74,288 -
Tulane Medical Center1 New Orleans, LA 339,370 -
Twin Cities Hospital12 Niceville, FL 20,776 -
UC Medical Center1 Cincinnati, OH 35,599 5
UC San Diego Hlth Sys Sulpizio Card1 La Jolla, CA 15,000 9
UC San Diego Outpatient Radiology1 San Diego, CA - 9
UCSF Medical Center1 San Francisco, CA 190,650 9
UF Health Shands Hospital12 Gainesville, FL 1,224,283 4
UH Cleveland Medical Center1 Cleveland, OH - 5
UK HealthCare Hospital1 Lexington, KY 2,654,993 3
UM Shore Regional HH OP OP Rehab 12 Easton, MD - 3
UMC of Princeton at Plainsboro1 Princeton, NJ 183,972 2
UNM Sandoval Regional Medical Cntr1 Rio Rancho, NM 27,499 8
UPH - Methodist1 Peoria, IL - 5
Continued...
1 All Facility DB
2 Hospitals in AHA Region 4
Find solutions, learn best practices, and networkFor an overview of how to interpret this report page,with colleagues in other health care organizationsclick or visit the following Web page:
https://www.pressganey.com/forumhttp://www.pressganey.com/gti/gti25.htm
149

Augusta University Medical Center 10/1/2016 - 12/31/2016
OUTPATIENT SERVICES REPORTOUTPATIENT SERVICES REPORT23.0 Facilities in the Database
Number of AHAFacility City, State Procedures RegionUPH - Proctor1 Peoria, IL - 5
UPH - St. Luke's Hospital1 Cedar Rapids, IA 301,045 6
UPMC Centers for Rehab Services1 Pittsburgh, PA - 2
UPMC Heart and Vascular Institute1 Pittsburgh, PA - 2
UPMC Imaging1 Pittsburgh, PA 1,591,425 2
URMC - Strong1 Rochester, NY 12,000 2
URMFG1 Rochester, NY 900,000 2
USC - Norris Cancer Hospital1 Los Angeles, CA - 9
USMD1 Irving, TX - 7
UT Physician1 Houston, TX - 7
Union Hospital1 Dover, OH 85,000 5
United Hospital1 St. Paul, MN 124,683 6
United Hospital Center, Inc.1 Clarksburg, WV 415,299 3
United Regional Healthcare System1 Wichita Falls, TX 174,200 7
Unity Hospital1 Rochester, NY - 2
Unity Hospital1 Fridley, MN 65,000 6
UnityPoint Health - Jones Regional1 Anamosa, IA 49,328 6
University Hospital & Clinic1 Lafayette, LA - 7
University Hospital & Medical Ctr12 Tamarac, FL 12,800 -
University of Alabama Hospital1 Birmingham, AL - 4
University of Illinois Hospital1 Chicago, IL 288 5
University of Iowa Hospitals and Cl1 Iowa City, IA - 6
University of Maryland Baltimore Wa1 Glen Burnie, MD - 3
University of Maryland St. Joseph M1 Towson, MD - 3
University of Miami Hospital12 Miami, FL 22,744 4
University of New Mexico1 Albuquerque, NM 370,000 8
University of Tennessee M.C.123 Knoxville, TN - 4
University of Texas Medical Branch1 Galveston, TX 22,656 7
University of Texas Southwestern MC1 Dallas, TX 235,001 7
University of Utah Hospital&Clinics1 Salt Lake City, UT 84,052 8
University of Virginia Health Sys1 Charlottesville, VA 630,292 3
Unversity of Maryland Charles Regio1 La Plata, MD - 3
VA Black Hills Fort Meade1 Fort Meade, SD - 6
VA Black Hills Hot Springs1 Hot Springs, SD - 6
VA Central Iowa Health Care System1 Des Moines, IA - 6
VA Minneapolis Health Care System1 Minneapolis, MN - 6
VA Nebraska-Western Iowa Health Car1 Omaha, NE - 6
Valley Health1 Ridgewood, NJ 775,000 2
Continued...
1 All Facility DB
2 Hospitals in AHA Region 4
3 Council of Teaching Peer Group
Find solutions, learn best practices, and networkFor an overview of how to interpret this report page,with colleagues in other health care organizationsclick or visit the following Web page:
https://www.pressganey.com/forumhttp://www.pressganey.com/gti/gti25.htm
150

Augusta University Medical Center 10/1/2016 - 12/31/2016
OUTPATIENT SERVICES REPORTOUTPATIENT SERVICES REPORT23.0 Facilities in the Database
Number of AHAFacility City, State Procedures RegionValley Medical Center1 Renton, WA - 9
Valley Presbyterian Hospital1 Van Nuys, CA - 9
Valley Regional Imaging1 Fayetteville, NC 53,444 3
Valley Regional Medical Center1 Brownsville, TX 80,000 -
Valley West Hospital1 Sandwich, IL 34,200 5
ValleyCare Health System1 Livermore, CA 170,635 9
Van Wert County Hospital1 Van Wert, OH - 5
Vanderbilt Medical Group and Clinic12 Nashville, TN 40,455 4
Verde Valley Medical Center1 Cottonwood, AZ - 8
Virginia Hospital Center1 Arlington, VA 400,000 3
Virtua Health-Mem Hosp Burl County1 Mt. Holly, NJ 65,032 2
Virtua Health-Voorhees1 Voorhees, NJ 494,839 2
WVU Medical Corporation1 Morgantown, WV 14,000 3
Waccamaw Community Hospital12 Murrells Inlet, SC 66,627 4
Wake Forest University Baptist MC1 Winston-Salem, NC - 3
Warren General Hospital1 Warren, PA - 2
Washington Hospital1 Washington, PA 123,179 2
Washington Hospital HealthCare Sys1 Fremont, CA 72,420 9
Washington Regional Medical Center1 Fayetteville, AR 62,826 7
Waverly Health Center1 Waverly, IA 129,268 6
Wayne Hospital1 Greenville, OH 75,338 5
Wayne Memorial Hospital1 Honesdale, PA 377,840 2
Weill Cornell Physician Org.1 New York, NY 92,000 2
WellStar Cobb Hospital12 Austell, GA 85,226 4
WellStar Douglas Hospital12 Douglasville, GA 63,746 4
WellStar Kennestone Hospital12 Marietta, GA 92,212 4
WellStar Paulding Hospital12 Dallas, GA 9,984 4
WellStar Windy Hill Hospital12 Marietta, GA 7,898 4
Wellington Regional Site: 212 West Palm Beach, FL 37,361 4
Wentworth-Douglass Hospital1 Dover, NH - 1
Wesley Long Community Hospital1 Greensboro, NC 54,431 3
Wesley Medical Center1 Wichita, KS 48,742 -
West Chester Hospital1 West Chester, OH 153,737 5
West Florida Hospital12 Pensacola, FL 68,563 -
West Georgia Health System12 LaGrange, GA - 4
West Hills Hospital & Medical Cente1 West Hills, CA 1,146 -
West Houston Medical Center1 Houston, TX 48,500 -
West Kendall Baptist Hospital12 Miami, FL 5,700 4
Continued...
1 All Facility DB
2 Hospitals in AHA Region 4
Find solutions, learn best practices, and networkFor an overview of how to interpret this report page,with colleagues in other health care organizationsclick or visit the following Web page:
https://www.pressganey.com/forumhttp://www.pressganey.com/gti/gti25.htm
151
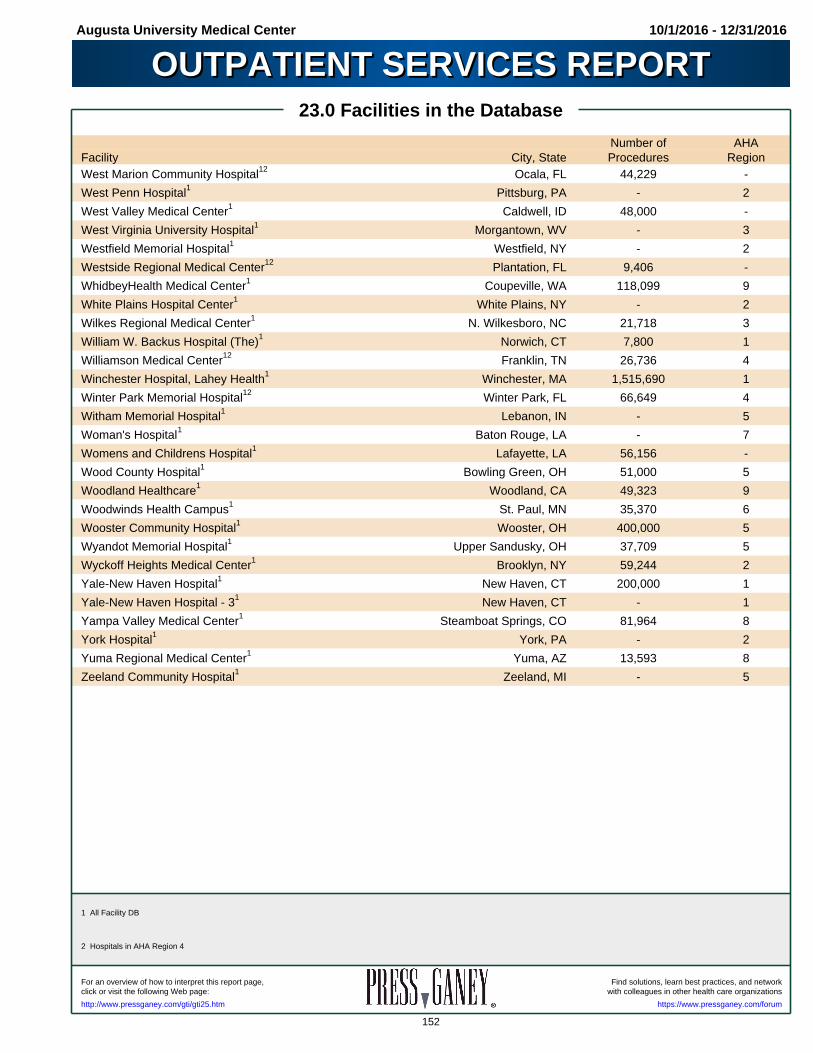
Augusta University Medical Center 10/1/2016 - 12/31/2016
OUTPATIENT SERVICES REPORTOUTPATIENT SERVICES REPORT23.0 Facilities in the Database
Number of AHAFacility City, State Procedures RegionWest Marion Community Hospital12 Ocala, FL 44,229 -
West Penn Hospital1 Pittsburg, PA - 2
West Valley Medical Center1 Caldwell, ID 48,000 -
West Virginia University Hospital1 Morgantown, WV - 3
Westfield Memorial Hospital1 Westfield, NY - 2
Westside Regional Medical Center12 Plantation, FL 9,406 -
WhidbeyHealth Medical Center1 Coupeville, WA 118,099 9
White Plains Hospital Center1 White Plains, NY - 2
Wilkes Regional Medical Center1 N. Wilkesboro, NC 21,718 3
William W. Backus Hospital (The)1 Norwich, CT 7,800 1
Williamson Medical Center12 Franklin, TN 26,736 4
Winchester Hospital, Lahey Health1 Winchester, MA 1,515,690 1
Winter Park Memorial Hospital12 Winter Park, FL 66,649 4
Witham Memorial Hospital1 Lebanon, IN - 5
Woman's Hospital1 Baton Rouge, LA - 7
Womens and Childrens Hospital1 Lafayette, LA 56,156 -
Wood County Hospital1 Bowling Green, OH 51,000 5
Woodland Healthcare1 Woodland, CA 49,323 9
Woodwinds Health Campus1 St. Paul, MN 35,370 6
Wooster Community Hospital1 Wooster, OH 400,000 5
Wyandot Memorial Hospital1 Upper Sandusky, OH 37,709 5
Wyckoff Heights Medical Center1 Brooklyn, NY 59,244 2
Yale-New Haven Hospital1 New Haven, CT 200,000 1
Yale-New Haven Hospital - 31 New Haven, CT - 1
Yampa Valley Medical Center1 Steamboat Springs, CO 81,964 8
York Hospital1 York, PA - 2
Yuma Regional Medical Center1 Yuma, AZ 13,593 8
Zeeland Community Hospital1 Zeeland, MI - 5
1 All Facility DB
2 Hospitals in AHA Region 4
Find solutions, learn best practices, and networkFor an overview of how to interpret this report page,with colleagues in other health care organizationsclick or visit the following Web page:
https://www.pressganey.com/forumhttp://www.pressganey.com/gti/gti25.htm
152