aura 2016: first australian report on antimicrobial use ... web viewaura 2016: first australian...
TRANSCRIPT

AURA 2016First Australian report on
antimicrobial use and resistance in human health
© Commonwealth of Australia 2016
This work is copyright. It may be reproduced in whole or in part for study or training purposes, subject to the inclusion of an acknowledgement of the source.
Address requests and inquiries concerning reproduction and rights for purposes other than those indicated above in writing to:
AURA – Commonwealth Programs, Australian Commission on Safety and Quality in Health Care, GPO Box 5480, Sydney NSW 2001
or email [email protected]
Suggested citation: Australian Commission on Safety and Quality in Health Care (ACSQHC). AURA 2016: first Australian report on antimicrobial use and resistance in human health. Sydney: ACSQHC, 2016.
An online version of this report can be accessed at www.safetyandquality.gov.au.
ISBN: 978-1-925224-41-2 (print) 978-1-925224-42-9 (online)
Acknowledgements
Many individuals and organisations gave their time and expertise over an extended period to this report, and the Antimicrobial Use and Resistance in Australia (AURA) project, which were undertaken by the Commission. In particular, the Commission wishes to thank the Australian Government Department of Health, the Australian Group on Antimicrobial Resistance, the National Centre for Antimicrobial Stewardship, SA Health, Queensland Health, Pathology Queensland, Sullivan Nicolaides Pathology, NPS MedicineWise, the National Neisseria Network, the Australian Mycobacterium Reference Laboratory Network, and other key experts who have provided their time and considered advice. The involvement and willingness of all concerned to share their experience and expertise are greatly appreciated.
Members of the AURA Project Reference Group are Professor John Turnidge, Dr Phillipa Binns, Professor Marilyn Cruickshank, Dr Jenny Firman, Ms Aine Heaney, Mr Duncan McKenzie, Adjunct Professor Kathy Meleady, Dr Brett Mitchell, Professor Graeme Nimmo, Dr Alicia Segrave, Professor Karin Thursky, Dr Morgyn Warner, Professor Roger Wilson and Associate Professor Leon Worth.
The members of the Commission’s AURA team are also acknowledged for their significant contribution to the development of the AURA Surveillance System and this report.
Disclaimer
This report is based on the best data and evidence available at the time of development.
Edited and produced by Biotext Pty Ltd
Contents
Contents...................................................................................................................................iii
Executive summary.................................................................................................................ix
What is antimicrobial resistance?.................................................................................ix
Key findings: antimicrobial use and appropriateness of prescribing.............................xAntimicrobial use in hospitals............................................................................xAntimicrobial use in the community – primary care.......................................xiiAntimicrobial use in the community – residential aged care facilities...........xiv
Key findings: antimicrobial resistance........................................................................xivResistance trends of concern..........................................................................xvii
Key findings: international comparisons..................................................................xviiiAntimicrobial use in hospitals......................................................................xviiiAntimicrobial use in the community............................................................xviiiAntimicrobial resistance.................................................................................xix
Future developments..................................................................................................xxii
Chapter 1 Introduction......................................................................................................1
Key messages.................................................................................................................1
1.1 Background........................................................................................................1
1.2 Importance of antimicrobial resistance..............................................................2
1.3 Cost and impact of antimicrobial resistance to individuals and the community..........................................................................................................2
1.4 Australian healthcare system context.................................................................3
1.5 Importance of surveillance.................................................................................4
1.6 Developing the Antimicrobial Use and Resistance in Australia Surveillance System...........................................................................................7Data collections contributing to the Antimicrobial Use and Resistance
in Australia Surveillance System...........................................................8
1.7 AURA 2016 report.............................................................................................9
Chapter 2 Data sources and methods.............................................................................11
Key messages...............................................................................................................11
2.1 Types of data and information collected under the Antimicrobial Use and Resistance in Australia Surveillance System............................................11
2.2 Sources of data for antimicrobial use and appropriateness..............................12
2.3 Sources of data for antimicrobial resistance....................................................13
2.4 Considerations for interpreting the data...........................................................16Contents iii
Chapter 3 Antimicrobial use and appropriateness.......................................................17
Key messages...............................................................................................................17Hospitals...........................................................................................................17Community.......................................................................................................17Residential aged care facilities.........................................................................17
3.1 Antimicrobial use in hospitals..........................................................................18Volume of antimicrobial use in hospitals.........................................................18Appropriateness of prescribing in hospitals.....................................................32Commentary.....................................................................................................39Gaps and improvements...................................................................................41
3.2 Antimicrobial use in the community – primary care.......................................42Antimicrobial use in primary care....................................................................42Appropriateness of prescribing in primary care...............................................54Commentary.....................................................................................................61Gaps and improvements...................................................................................64
3.3 Antimicrobial use in the community – residential aged care facilities............64Antimicrobial use in residential aged care.......................................................65Appropriateness of prescribing in residential aged care..................................69Commentary.....................................................................................................70Gaps and improvements...................................................................................71
Chapter 4 Antimicrobial resistance................................................................................72
Key messages...............................................................................................................72
4.1 Introduction......................................................................................................73Priority organisms for surveillance..................................................................73Data on priority organisms...............................................................................74
4.2 Acinetobacter baumannii.................................................................................79Health impact...................................................................................................79Treatment.........................................................................................................79Types and impact of resistance........................................................................79Key findings (Queensland)..............................................................................79
4.3 Enterobacteriaceae..........................................................................................81Health impact...................................................................................................81Treatment.........................................................................................................81Types and impact of resistance........................................................................82Key findings (national)....................................................................................82Jurisdictional rates............................................................................................89Additional findings from targeted surveillance................................................94
4.4 Enterococcus species.......................................................................................98Health impact...................................................................................................98Treatment.........................................................................................................99Types and impact of resistance........................................................................99
Contents iv
Key findings (national)....................................................................................99Jurisdictional rates..........................................................................................103Additional findings from targeted surveillance..............................................107
4.5 Mycobacterium tuberculosis..........................................................................110Health impact.................................................................................................110Treatment.......................................................................................................110Types and impact of resistance......................................................................110Key findings (national)..................................................................................110Jurisdictional rates..........................................................................................111National trends...............................................................................................112
4.6 Neisseria gonorrhoeae...................................................................................114Health impact.................................................................................................114Treatment.......................................................................................................114Types and impact of resistance......................................................................114Key findings (national)..................................................................................114Jurisdictional rates..........................................................................................115National trends...............................................................................................117
4.7 Neisseria meningitidis....................................................................................117Health impact.................................................................................................117Treatment.......................................................................................................118Types and impact of resistance......................................................................118Key findings (national)..................................................................................118National trends...............................................................................................119
4.8 Pseudomonas aeruginosa...............................................................................119Health impact.................................................................................................119Treatment.......................................................................................................119Types and impact of resistance......................................................................120Key findings (Queensland)............................................................................120
4.9 Salmonella species.........................................................................................122Health impact.................................................................................................122Treatment.......................................................................................................122Types and impact of resistance......................................................................122Key findings (national)..................................................................................122Additional findings from targeted surveillance on blood culture isolates
............................................................................................................124
4.10 Shigella species..............................................................................................126Health impact.................................................................................................126Treatment.......................................................................................................126Types and impact of resistance......................................................................126Key findings (Queensland)............................................................................126
4.11 Staphylococcus aureus...................................................................................127Health impact.................................................................................................127Treatment.......................................................................................................128
Contents v
Types and impact of resistance......................................................................128Key findings (national)..................................................................................128Jurisdictional rates..........................................................................................135
4.12 Streptococcus agalactiae...............................................................................141Health impact.................................................................................................141Treatment.......................................................................................................141Types and impact of resistance......................................................................141Key findings (Queensland)............................................................................141
4.13 Streptococcus pneumoniae.............................................................................142Health impact.................................................................................................142Treatment.......................................................................................................142Types and impact of resistance......................................................................142Key findings (Queensland)............................................................................143
4.14 Streptococcus pyogenes.................................................................................144Health impact.................................................................................................144Treatment.......................................................................................................145Types and impact of resistance......................................................................145Key findings (Queensland)............................................................................145
Chapter 5 International comparisons...........................................................................147
Key messages.............................................................................................................147
5.1 Antimicrobial use...........................................................................................147Community use..............................................................................................148Hospital use....................................................................................................151
5.2 Antimicrobial resistance.................................................................................153Escherichia coli..............................................................................................153Klebsiella pneumoniae...................................................................................157Staphylococcus aureus and Enterococcus faecium........................................160
5.3 Commentary...................................................................................................162
Chapter 6 Emerging issues............................................................................................164
Key messages.............................................................................................................164
6.1 Carbapenem use in Australian hospitals........................................................164Current guidelines..........................................................................................168Potential actions.............................................................................................168
6.2 Carbapenemase-producing Enterobacteriaceae and carbapenem resistance........................................................................................................169Management of carbapenemase-producing Enterobacteriaceae
infections............................................................................................169Impact and spread of carbapenemases...........................................................169International spread of carbapenemase-producing Enterobacteriaceae........170Carbapenemase-producing organisms in Australia........................................170
Contents vi
Implications for Australia..............................................................................170Potential actions.............................................................................................171
6.3 Antimicrobial use and appropriateness in surgical prophylaxis....................171Surgical National Antimicrobial Prescribing Survey.....................................171Results171Potential actions.............................................................................................172
Chapter 7 Conclusions and future developments........................................................173
Key messages.............................................................................................................173
7.1 Lessons from AURA 2016.............................................................................173
7.2 Next steps for the AURA Surveillance System.............................................175National alert system for critical antimicrobial resistances...........................175
7.3 Future AURA reports.....................................................................................177
Appendix 1 Data source description...............................................................................179
A1.1 Antimicrobial use collections............................................................................179National Antimicrobial Utilisation Surveillance Program.............................179National Antimicrobial Prescribing Survey...................................................180Pharmaceutical Benefits Scheme...................................................................181Additional data and analysis..........................................................................181MedicineInsight program...............................................................................182Report on government services 2015.............................................................183Bettering the Evaluation and Care of Health program...................................184Aged Care National Antimicrobial Prescribing Survey.................................184
A1.2 Antimicrobial resistance collections..............................................................185Australian Group on Antimicrobial Resistance.............................................185National Neisseria Network...........................................................................186National Notifiable Diseases Surveillance System........................................187OrgTRx and Pathology Queensland...............................................................188Sullivan Nicolaides Pathology.......................................................................189
Appendix 2 Priority organisms........................................................................................190
Appendix 3 Resources......................................................................................................192
A3.1 Australian reports and resources....................................................................192
A3.2 International surveillance reports...................................................................192
Appendix 4 Terminology..................................................................................................193
A4.1 Acronyms.......................................................................................................193
A4.2 Common terms...............................................................................................193
References.............................................................................................................................196Contents vii
Contents viii
Executive summary
AURA 2016: first Australian report on antimicrobial use and resistance in human health provides the most comprehensive picture of antimicrobial resistance (AMR), antimicrobial use (AU) and appropriateness of prescribing in Australia to date. It sets a baseline that will allow trends to be monitored over time. AURA 2016 also highlights areas where future work will inform action to prevent the spread of AMR.
Comprehensive, coordinated and effective surveillance of AMR and AU is a national priority. Surveillance is essential to understand the magnitude, distribution and impact of AMR and AU, as well as to identify emerging issues and trends. It allows the early detection of critical antimicrobial resistances to ensure effective action can be taken, and provides information on the effectiveness of measures designed to promote appropriate AU and contain AMR. Surveillance is a critical component of Australia’s National Antimicrobial Resistance Strategy.
The Antimicrobial Use and Resistance in Australia (AURA) Surveillance System is the new system to coordinate data from a range of sources and allow integrated analysis and reporting at a national level. The AURA Surveillance System brings together partner programs such as the Australian Group on Antimicrobial Resistance, the National Antimicrobial Prescribing Survey (NAPS), the National Antimicrobial Utilisation Surveillance Program (NAUSP) and Queensland Health’s OrgTRx system. Data is also sourced from the Pharmaceutical Benefits Scheme and the Repatriation Pharmaceutical Benefits Scheme (PBS/RPBS), NPS MedicineWise, the National Neisseria Network, the National Notifiable Diseases Surveillance System, the Report on government services 2015 and Sullivan Nicolaides Pathology.
The AURA Surveillance System will provide critical information needed by clinicians, policy makers, researchers and health system managers to target efforts to inform antimicrobial stewardship and AMR policy and program development.
What is antimicrobial resistance?
AMR is an issue of great importance for health care in Australia. AMR occurs when bacteria change to protect themselves from the effects of antimicrobials. This means that the antimicrobial can no longer eradicate or stop the growth of the bacteria. Antimicrobials can be life-saving agents in the fight against infection, but their effectiveness is diminished by AMR.
AMR has a direct impact on patient care and patient outcomes, and it is a critical and immediate challenge to health systems around the world. It increases the complexity of treatment and the duration of hospital stay, and places an additional burden on patients, healthcare providers and the healthcare system.
AMR is an international challenge. Professor Dame Sally Davies, the Chief Medical Officer for England, has highlighted that the overuse and inappropriate use of antimicrobials has resulted in increasing levels of resistance, stating that ‘resistant bugs are killing 25 000
Executive summary 9

people a year across Europe … almost the same number as die on the road in traffic accidents’.a
Chapter 1 of AURA 2016 has more information about the impacts and costs of AMR.
Key findings: antimicrobial use and appropriateness of prescribing
AU is a key driver of AMR – the more we use antimicrobials, the more likely it is that resistance will develop. Appropriate use of antimicrobials can be life-saving, but inappropriate use needs to be monitored and minimised to prevent and contain AMR. Examples of inappropriate use include prescribing antimicrobials when they are not necessary, prescribing the wrong type of antimicrobial and prescribing for the incorrect duration.
Antimicrobial use in hospitals
NAUSP data indicates that the overall use of antimicrobials in Australian hospitals peaked in 2010, and that there has been a steady decline since then. The rates of use have decreased for some classes of antimicrobials, but have increased for other classes.
In 2014, 20 agents accounted for 92% of all antibacterials used in the hospitals participating in NAUSP. The agents most commonly prescribed in hospitals were amoxicillin–clavulanate, flucloxacillin, cefazolin and amoxicillin.
Differences in prescribing rates
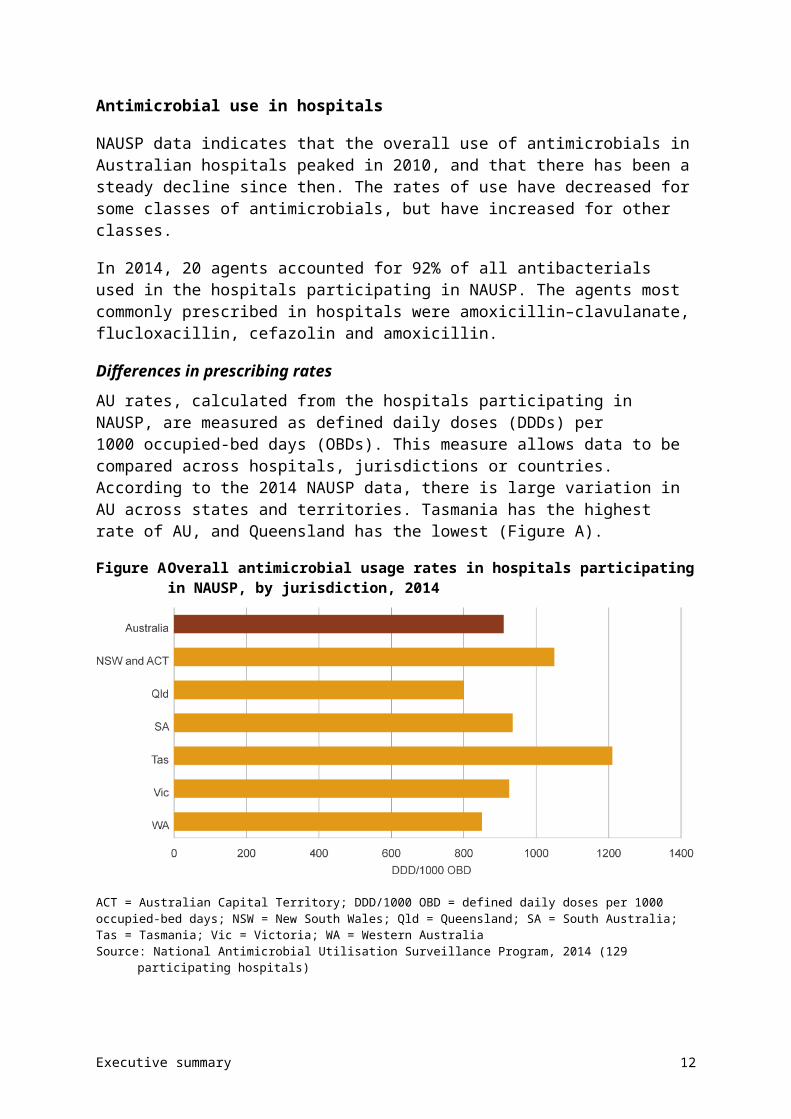
AU rates, calculated from the hospitals participating in NAUSP, are measured as defined daily doses (DDDs) per 1000 occupied-bed days (OBDs). This measure allows data to be compared across hospitals, jurisdictions or countries. According to the 2014 NAUSP data, there is large variation in AU across states and territories. Tasmania has the highest rate of AU, and Queensland has the lowest (Figure A).
a Davies SC. The drugs don’t work: a global threat. London: Penguin, 2013, p. xii.
Executive summary 10
Figure A Overall antimicrobial usage rates in hospitals participating in NAUSP, by jurisdiction, 2014
ACT = Australian Capital Territory; DDD/1000 OBD = defined daily doses per 1000 occupied-bed days; NSW = New South Wales; Qld = Queensland; SA = South Australia; Tas = Tasmania; Vic = Victoria; WA = Western Australia Source: National Antimicrobial Utilisation Surveillance Program, 2014 (129 participating hospitals)
Based on published experience in other countries, the four classes of antimicrobials most likely to drive AMR in the hospitalised population are aminoglycosides, cephalosporins, fluoroquinolones and macrolides. Over the past five years, rates of gentamicin use (the most commonly used aminoglycoside) have decreased steadily in all states and territories. Ceftriaxone (the most commonly prescribed third-generation cephalosporin) and some macrolides show a pattern of seasonal use over the past five years, reflecting their role in the treatment of lower respiratory tract infections. Rates of fluoroquinolone use over the past five years have remained relatively constant. Overall, usage rates for these four antimicrobial classes have declined in the large and medium public hospitals, and principal referral hospitals, that participate in NAUSP.
Understanding variation in prescribing rates is critical to improving the quality and appropriateness of AU. However, there is currently insufficient evidence to identify which factors are driving variation in volumes and patterns of AU in Australian hospitals.
Appropriateness of prescribing
Data from the 2014 NAPS shows that 38.4% of patients were being administered an antimicrobial on the day of the survey. Of these prescriptions, 24.3% were noncompliant with guidelines and 23% were considered to be inappropriate prescriptions. The main reasons why prescriptions were deemed to be inappropriate were that an antimicrobial was not needed, the antimicrobial chosen was incorrect (spectrum too broad), or the duration, dose or frequency of treatment was incorrect.
In 2014, the most common indications (reasons) for antimicrobial prescriptions in hospitals were:
• surgical prophylaxis (13.1%)
• community-acquired pneumonia (11.3%)
Executive summary 11
• medical prophylaxis (8.3%)
• urinary tract infections (6.7%)
• cellulitis or erysipelas (skin infections) (4.4%).
Inappropriate surgical prophylaxis (antimicrobials that are routinely prescribed to patients undergoing surgery to prevent infection during and after the procedure) is a major concern. Surgical prophylaxis is the most common reason for antimicrobial prescriptions in hospitals, and has the highest level of inappropriate use, with 40.2% of prescriptions deemed to be inappropriate. Reasons for inappropriateness included incorrect duration, dose or frequency, and situations where an antimicrobial was not required.
More information about AU in hospitals is provided in Section 3.1.
Antimicrobial use in the community – primary care
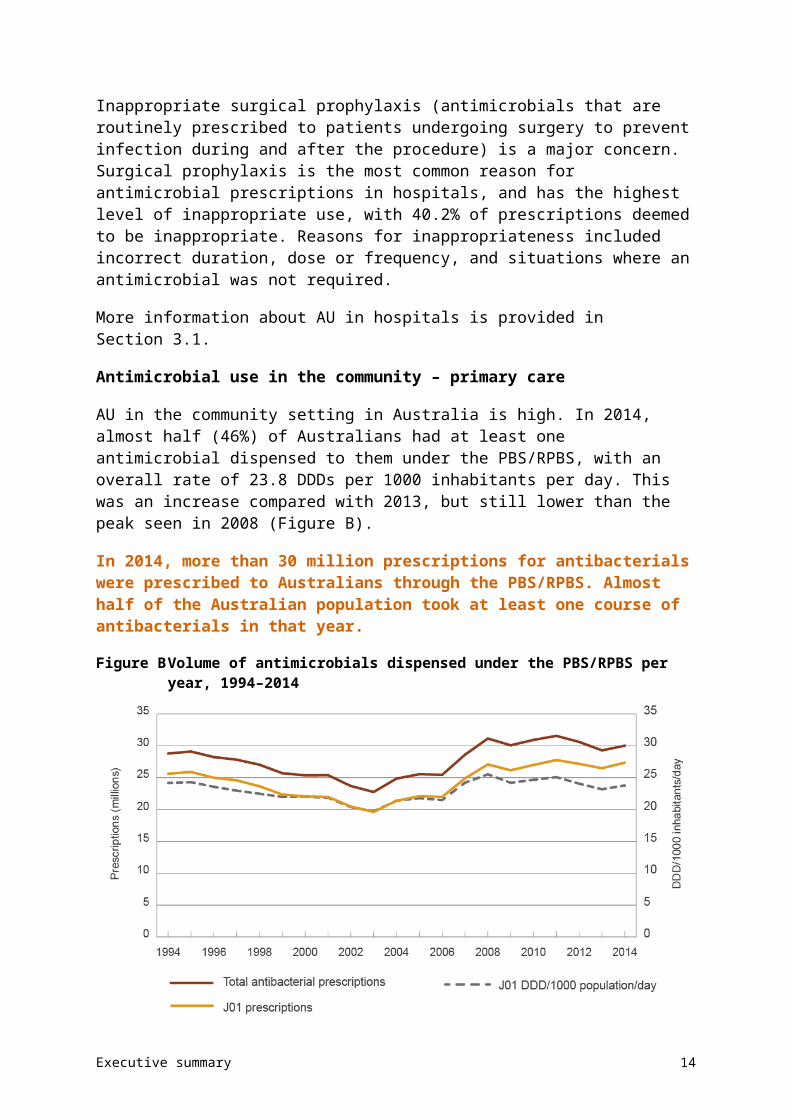
AU in the community setting in Australia is high. In 2014, almost half (46%) of Australians had at least one antimicrobial dispensed to them under the PBS/RPBS, with an overall rate of 23.8 DDDs per 1000 inhabitants per day. This was an increase compared with 2013, but still lower than the peak seen in 2008 (Figure B).
In 2014, more than 30 million prescriptions for antibacterials were prescribed to Australians through the PBS/RPBS. Almost half of the Australian population took at least one course of antibacterials in that year.
Figure B Volume of antimicrobials dispensed under the PBS/RPBS per year, 1994–2014
DDD = defined daily dose; PBS = Pharmaceutical Benefits Scheme; RPBS = Repatriation Pharmaceutical Benefits SchemeNotes:1. J01 is the ATC code for antibacterials for systemic use.2. Before April 2012, includes estimates of under co-payment and private dispensing; after April 2012, includes actual under
co-payment data, but no estimate from private dispensing. The DDD/1000 inhabitants/day excludes some items for which there is no DDD.
Source: Drug Utilisation Sub Committee database, October 2015
Executive summary 12
The 11 most commonly dispensed antimicrobials accounted for 84% of all antimicrobials dispensed in the community. Amoxicillin, cephalexin and amoxicillin–clavulanate are the most commonly prescribed antimicrobials.
Patterns of use
Antimicrobials were most often dispensed for very young people and older people. In 2014, 57% of those aged 0–4 years, 60% of those aged 65 years or over, and 74% of people aged 85 years or over were supplied at least one antimicrobial. These proportions have been consistent over several years, and AU in all age groups is higher during the winter months. Children are prescribed more extended-spectrum penicillins, and older people are prescribed more cephalosporins, macrolides and penicillin – -lactamase inhibitor combinations than other age groups.
General practitioners generate the majority of prescriptions (88%); other prescribers include medical specialists, dentists, optometrists, midwives and nurse practitioners.
Different dispensing rates were seen across the states and territories, between major cities and other regions, between different local areas, and across socioeconomic status. Generally, rates were highest in areas of lowest socioeconomic status, and decreased with increasing socioeconomic status. This is consistent with decreasing socioeconomic status being associated with poorer health and higher infection rates. However, there is currently insufficient evidence to confirm the factors that are driving geographic patterns of antimicrobial prescribing in Australia.
Appropriateness of prescribing
Of the patients participating in the NPS MedicineWise MedicineInsight program, 30% (352 318 patients) were prescribed systemic antimicrobials between 1 January and 31 December 2014. The overall rate of antimicrobial prescriptions (originals) per 100 general practitioner consultations has remained constant between 2009 and 2014. This data also shows a pattern of seasonal variation, with peaks in winter.
High volumes of antimicrobials continue to be prescribed unnecessarily for upper respiratory tract infections. More than 50% of patients who were identified as having a cold or other upper respiratory tract infection had an antimicrobial prescribed when it was not indicated. A large proportion of patients with acute tonsillitis, acute or chronic sinusitis (sinus inflammation), acute otitis media (middle ear infection) or acute bronchitis received an antimicrobial, but antimicrobial treatment should be the exception for these conditions, not routine therapy. A large proportion of antimicrobials prescribed were not those recommended by guidelines.
Reasons for inappropriate prescribing included the wrong antimicrobial and for the wrong duration. Many repeat prescriptions were also given when they were not needed.
However, according to the Report on government services 2015, the trend for inappropriate prescribing for upper respiratory tract infections is decreasing. Nationally, the proportion of acute upper respiratory tract infection presentations for which systemic antimicrobials were prescribed by general practitioners decreased from 32.8% in 2011–12 to 29.0% in 2013–14. This reflects the overall decreasing trend in most states and territories.
Executive summary 13
More information about AU in primary care is provided in Section 3.2.
Antimicrobial use in the community – residential aged care facilities
Data on AU in Australian residential aged care facilities has only recently become available as a result of a pilot study conducted in 2015 – the Aged Care National Antimicrobial Prescribing Survey (acNAPS). The results of the pilot provide a snapshot of AU and the prevalence of infection in a sample of 186 Australian residential aged care facilities, 70% of which were in Victoria.
The prevalence of residents on antimicrobial therapy on any given day was 11.3% (7.9% when topical antimicrobials were excluded). The prevalence of residents with a suspected or confirmed infection was 4.5%; of these, 72.4% were on antimicrobial therapy.
There was some variation in prevalence across the states and territories. Prescribing was highest in Western Australia (26.9%) and lowest in Queensland (6.4%). This variation cannot be explained by the prevalence of particular infections.
The most common indications for antimicrobials were unspecified skin, soft tissue or mucosal infection (17.5%), urinary tract infection: cystitis (16.7%) and lower respiratory tract infection (11.8%). Prophylaxis accounted for 22.9% of the prescriptions – these were mainly for urinary tract infections, and unspecified skin, soft tissue or mucosal infections. When comparing prophylaxis and treatment, a greater proportion of prescriptions for prophylaxis were administered for more than six months (56.1% for prophylaxis vs 24.1% for treatment).
Overall, 31.4% of antimicrobial prescriptions were started more than six months before the audit date; only 2% of these had a review or stop date documented.
Appropriateness of prescribing
In a subset of 548 prescriptions written for treatment of infection, about one in five were for residents who did not have any signs or symptoms of infection in the week before the antimicrobial start date, ascertained by history review or nurse recollection. For those who did have symptoms, only one-third met the standardised criteria for appropriate prescribing in residential aged care facilities (McGeer infection criteria).
This preliminary data points towards some unnecessary AU in residential aged care facilities. However, more data is needed from across Australia to provide a more complete picture of antimicrobial prescribing patterns in residential aged care facilities.
More information about AU in residential aged care facilities is provided in Section 3.3.
Key findings: antimicrobial resistance
Resistant bacteria, and the genes that cause resistance, can spread readily between people in the community, primary care services, hospitals and residential aged care facilities. The spread of these bacteria can have a significant impact, and it is critical that resistant bacteria with the highest risk of harm to humans are identified and monitored through surveillance, and managed appropriately.
The AURA Surveillance System reports on priority organisms that are considered to have the greatest potential for harm, are of high public health importance, or are common pathogens
Executive summary 14
where the impact of resistance is substantial in the hospital and community settings (Table A). Data is drawn from across the health system – AURA 2016 includes data on the 13 priority organisms from around 350 hospitals and day surgery services, 186 residential aged care facilities and multipurpose services, and the community.
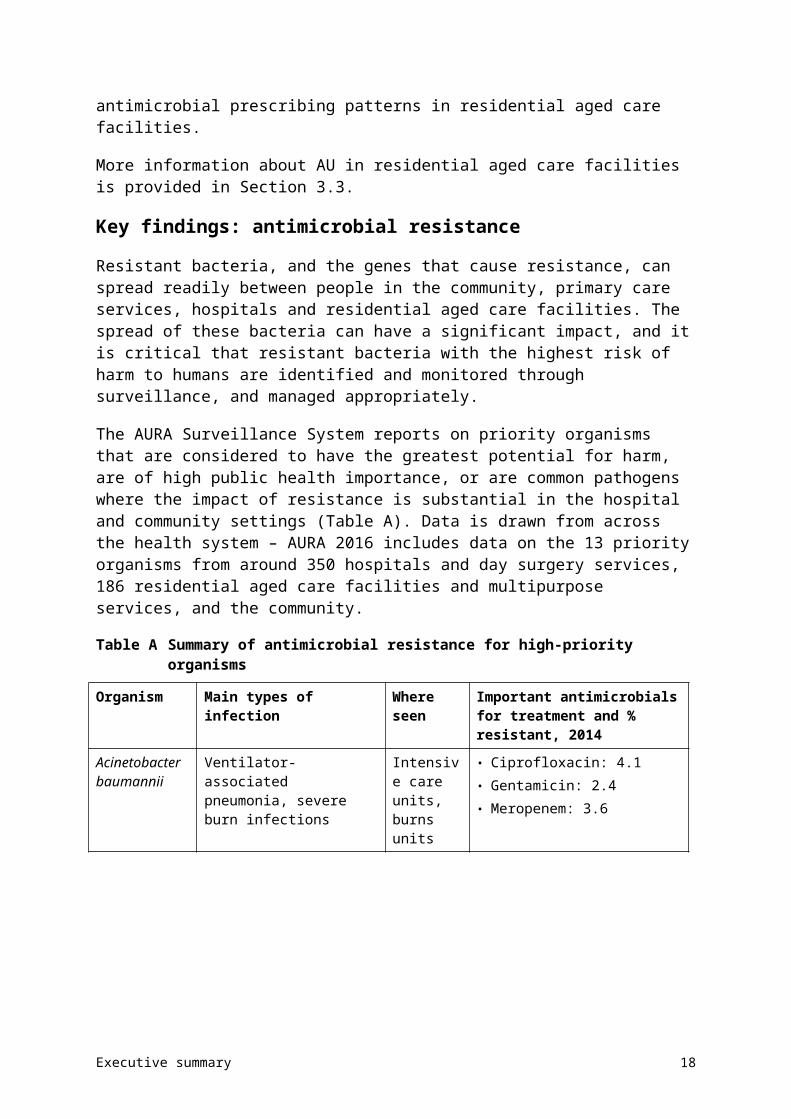
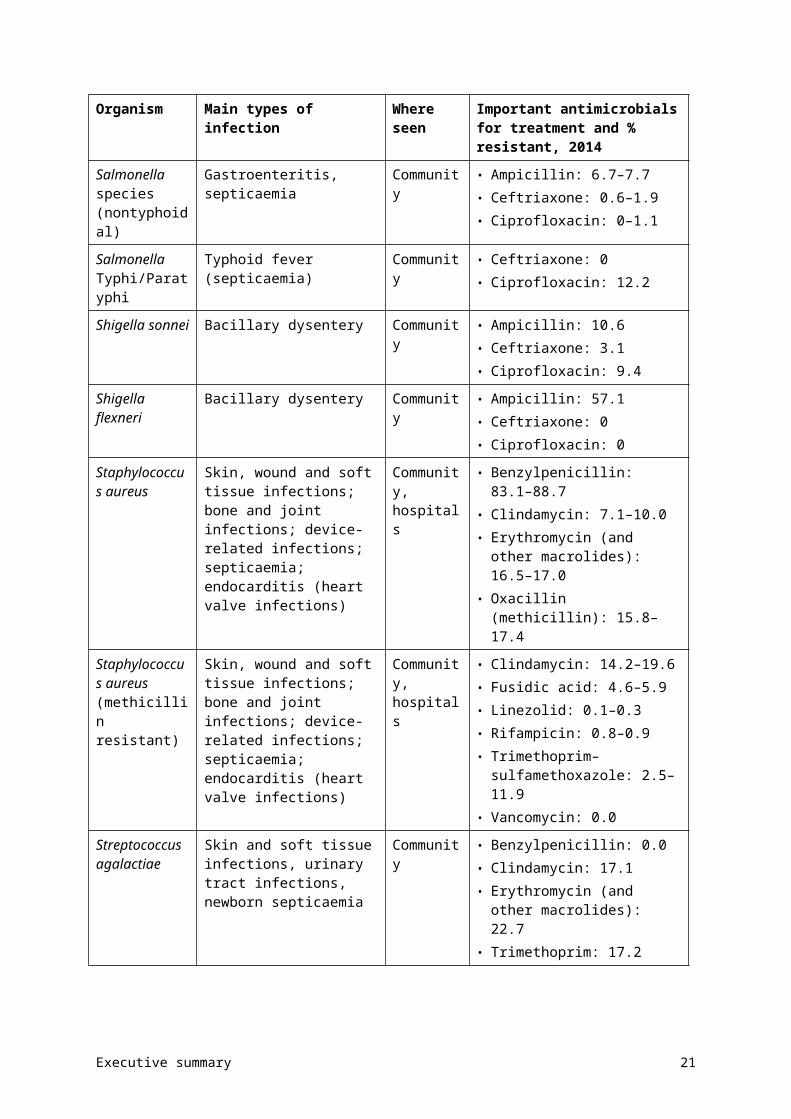
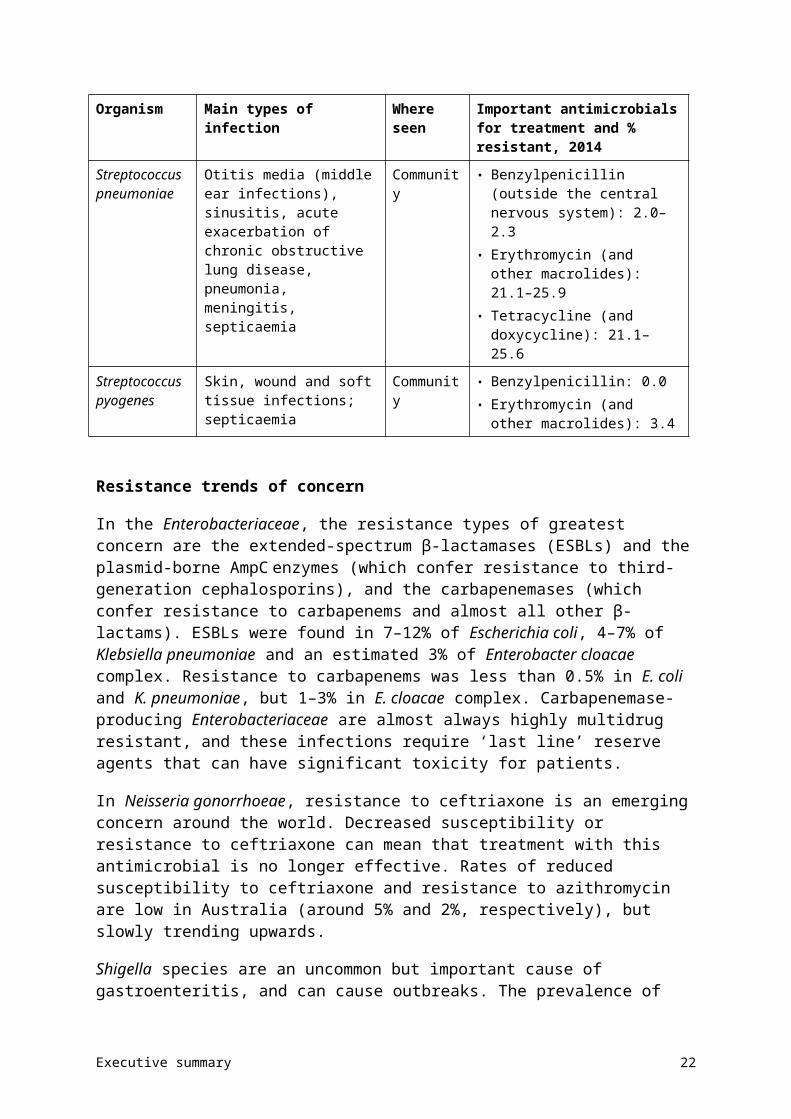
Table A Summary of antimicrobial resistance for high-priority organisms
Organism Main types of infection Where seen Important antimicrobials for treatment and % resistant, 2014
Acinetobacter baumannii
Ventilator-associated pneumonia, severe burn infections
Intensive care units, burns units
• Ciprofloxacin: 4.1• Gentamicin: 2.4• Meropenem: 3.6
Escherichia coli Urinary tract infections, biliary tract infections, other intra-abdominal infections, septicaemia
Community, hospitals
• Amoxicillin–clavulanate: 18.2–21.1
• Ampicillin/amoxicillin: 42.3–51.3
• Cefazolin: 15.2–25.0• Ceftriaxone: 5.1–12.4• Ciprofloxacin: 6.2–8.7• Gentamicin: 4.5–7.0• Piperacillin–tazobactam: 5.3–9.4• Trimethoprim: 21.0–29.4• Multidrug resistant: 13.1
Enterobacter cloacae
Urinary tract infections, other intra-abdominal infections, septicaemia
Hospitals • Ceftriaxone: 23.8–28.5• Piperacillin–tazobactam: 24.3–
32.2• Trimethoprim: 18.3–21.3• Gentamicin: 7.2–7.8• Ciprofloxacin: 3.7–5.2• Meropenem: 1.1–2.6• Multidrug resistant: 13.4
Enterococcus faecalis
Urinary tract infections, biliary tract infections, other intra-abdominal infections, septicaemia, endocarditis (heart valve infections)
Community, hospitals
• Ampicillin: 0.3–0.6• Vancomycin: 0.3–0.4
Enterococcus faecium
Urinary tract infections, biliary tract infections, other intra-abdominal infections, septicaemia
Hospitals • Ampicillin: 83.3–94.5• Linezolid: 0.2–1.1• Vancomycin: 45.7–49.9
Klebsiella pneumoniae
Urinary tract infections, other intra-abdominal infections, septicaemia
Community • Amoxicillin–clavulanate: 6.2–9.4• Ceftriaxone: 4.3–6.6• Ciprofloxacin: 4.5–6.2• Gentamicin: 3.1–4.9• Piperacillin–tazobactam: 7.6–8.9• Trimethoprim: 12.3–16.6• Multidrug resistant: 9.0
Executive summary 15
Organism Main types of infection Where seen Important antimicrobials for treatment and % resistant, 2014
Mycobacterium tuberculosis
Pulmonary tuberculosis, extrapulmonary tuberculosis
Community • Ethambutol: 1.2• Isoniazid: 8.5• Pyrazinamide: 2.1• Rifampicin: 2.4• Multidrug resistant: 1.7
Neisseria gonorrhoeae
Gonorrhoea Community • Azithromycin: 2.5• Benzylpenicillin: 28.5• Ceftriaxone: 5.4 (decreased
susceptibility)• Ciprofloxacin: 36.4
Neisseria meningitidis
Septicaemia Community • Benzylpenicillin: 15.8 (decreased susceptibility)
• Ceftriaxone: 0.0• Ciprofloxacin: 0.0• Rifampicin: 2.1
Pseudomonas aeruginosa
Urinary tract infections, burn infections, cystic fibrosis exacerbations
Community, hospitals
• Ceftazidime: 4.5• Ciprofloxacin: 6.7• Gentamicin: 5.3• Meropenem: 4.0• Piperacillin–tazobactam: 10.3
Salmonella species (nontyphoidal)
Gastroenteritis, septicaemia Community • Ampicillin: 6.7–7.7• Ceftriaxone: 0.6–1.9• Ciprofloxacin: 0–1.1
Salmonella Typhi/Paratyphi
Typhoid fever (septicaemia) Community • Ceftriaxone: 0• Ciprofloxacin: 12.2
Shigella sonnei Bacillary dysentery Community • Ampicillin: 10.6• Ceftriaxone: 3.1• Ciprofloxacin: 9.4
Shigella flexneri Bacillary dysentery Community • Ampicillin: 57.1• Ceftriaxone: 0• Ciprofloxacin: 0
Staphylococcus aureus
Skin, wound and soft tissue infections; bone and joint infections; device-related infections; septicaemia; endocarditis (heart valve infections)
Community, hospitals
• Benzylpenicillin: 83.1–88.7• Clindamycin: 7.1–10.0• Erythromycin (and other
macrolides): 16.5–17.0• Oxacillin (methicillin): 15.8–17.4
Executive summary 16
Organism Main types of infection Where seen Important antimicrobials for treatment and % resistant, 2014
Staphylococcus aureus (methicillin resistant)
Skin, wound and soft tissue infections; bone and joint infections; device-related infections; septicaemia; endocarditis (heart valve infections)
Community, hospitals
• Clindamycin: 14.2–19.6• Fusidic acid: 4.6–5.9• Linezolid: 0.1–0.3• Rifampicin: 0.8–0.9• Trimethoprim–sulfamethoxazole:
2.5–11.9• Vancomycin: 0.0
Streptococcus agalactiae
Skin and soft tissue infections, urinary tract infections, newborn septicaemia
Community • Benzylpenicillin: 0.0• Clindamycin: 17.1• Erythromycin (and other
macrolides): 22.7• Trimethoprim: 17.2
Streptococcus pneumoniae
Otitis media (middle ear infections), sinusitis, acute exacerbation of chronic obstructive lung disease, pneumonia, meningitis, septicaemia
Community • Benzylpenicillin (outside the central nervous system): 2.0–2.3
• Erythromycin (and other macrolides): 21.1–25.9
• Tetracycline (and doxycycline): 21.1–25.6
Streptococcus pyogenes
Skin, wound and soft tissue infections; septicaemia
Community • Benzylpenicillin: 0.0• Erythromycin (and other
macrolides): 3.4
Resistance trends of concern
In the Enterobacteriaceae, the resistance types of greatest concern are the extended-spectrum β-lactamases (ESBLs) and the plasmid-borne AmpC enzymes (which confer resistance to third-generation cephalosporins), and the carbapenemases (which confer resistance to carbapenems and almost all other β-lactams). ESBLs were found in 7–12% of Escherichia coli, 4–7% of Klebsiella pneumoniae and an estimated 3% of Enterobacter cloacae complex. Resistance to carbapenems was less than 0.5% in E. coli and K. pneumoniae, but 1–3% in E. cloacae complex. Carbapenemase-producing Enterobacteriaceae are almost always highly multidrug resistant, and these infections require ‘last line’ reserve agents that can have significant toxicity for patients.
In Neisseria gonorrhoeae, resistance to ceftriaxone is an emerging concern around the world. Decreased susceptibility or resistance to ceftriaxone can mean that treatment with this antimicrobial is no longer effective. Rates of reduced susceptibility to ceftriaxone and resistance to azithromycin are low in Australia (around 5% and 2%, respectively), but slowly trending upwards.
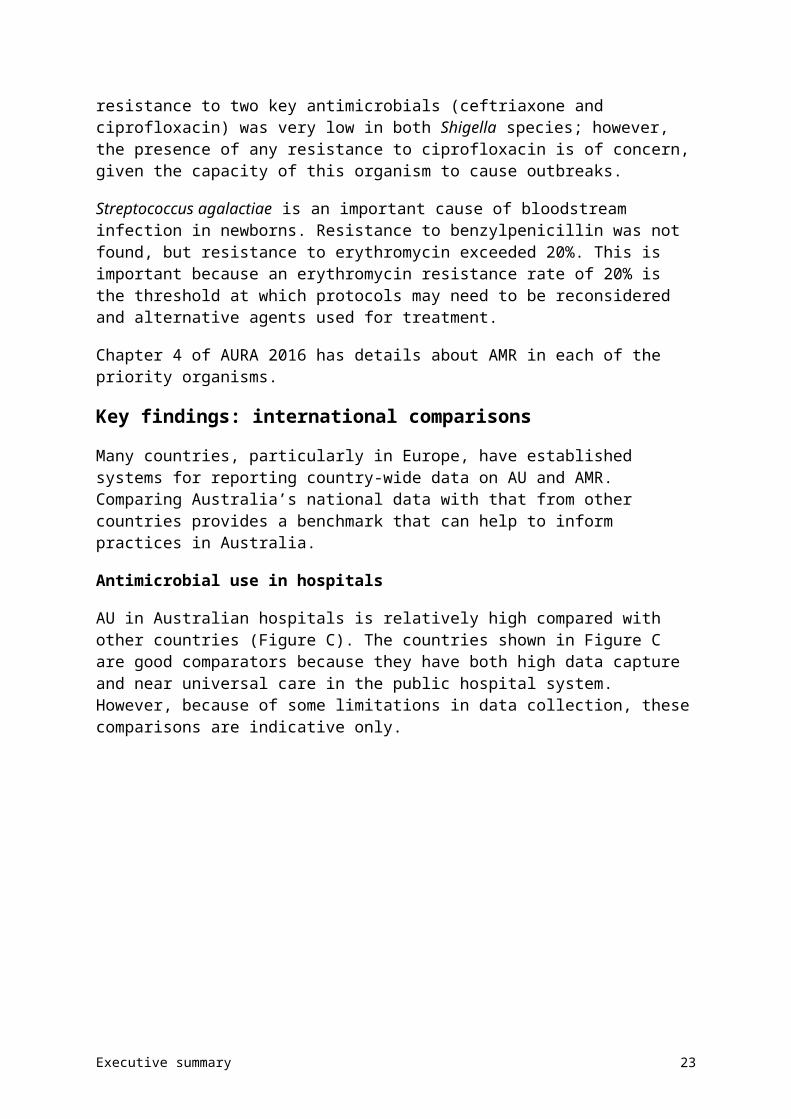
Shigella species are an uncommon but important cause of gastroenteritis, and can cause outbreaks. The prevalence of resistance to two key antimicrobials (ceftriaxone and ciprofloxacin) was very low in both Shigella species; however, the presence of any resistance to ciprofloxacin is of concern, given the capacity of this organism to cause outbreaks.
Executive summary 17
Streptococcus agalactiae is an important cause of bloodstream infection in newborns. Resistance to benzylpenicillin was not found, but resistance to erythromycin exceeded 20%. This is important because an erythromycin resistance rate of 20% is the threshold at which protocols may need to be reconsidered and alternative agents used for treatment.
Chapter 4 of AURA 2016 has details about AMR in each of the priority organisms.
Key findings: international comparisons
Many countries, particularly in Europe, have established systems for reporting country-wide data on AU and AMR. Comparing Australia’s national data with that from other countries provides a benchmark that can help to inform practices in Australia.
Antimicrobial use in hospitals
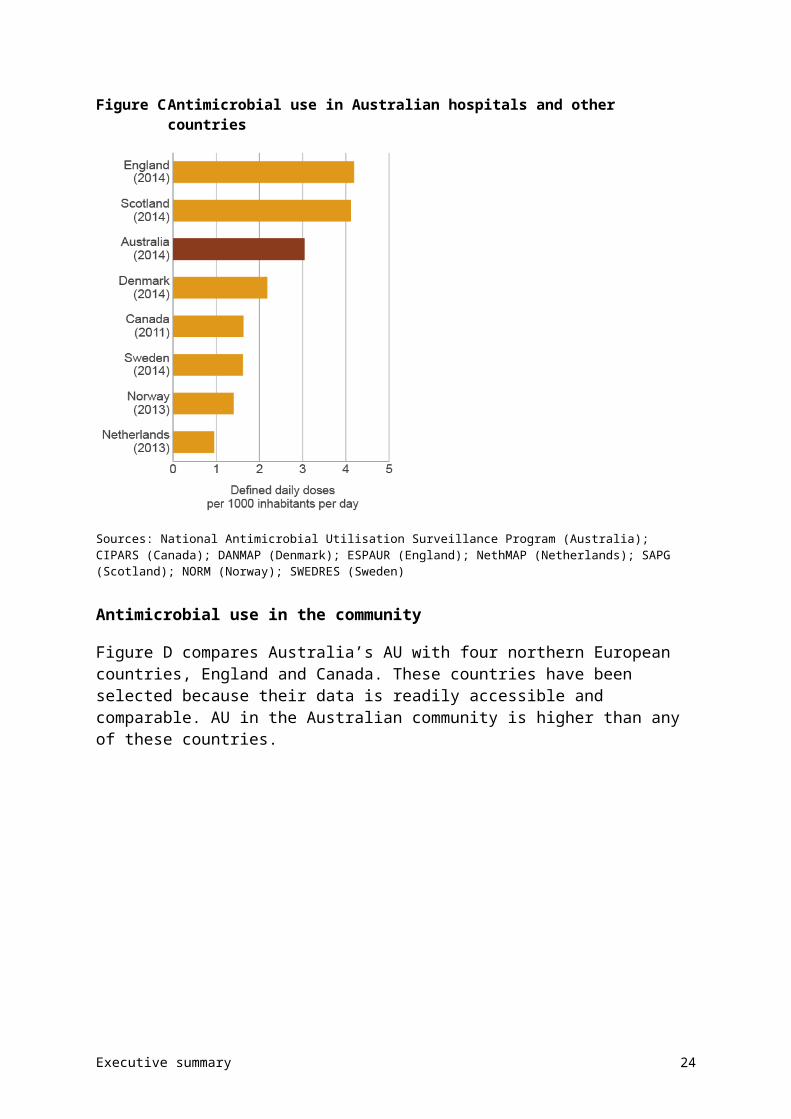
AU in Australian hospitals is relatively high compared with other countries (Figure C). The countries shown in Figure C are good comparators because they have both high data capture and near universal care in the public hospital system. However, because of some limitations in data collection, these comparisons are indicative only.
Figure C Antimicrobial use in Australian hospitals and other countries
Sources: National Antimicrobial Utilisation Surveillance Program (Australia); CIPARS (Canada); DANMAP (Denmark); ESPAUR (England); NethMAP (Netherlands); SAPG (Scotland); NORM (Norway); SWEDRES (Sweden)
Antimicrobial use in the community
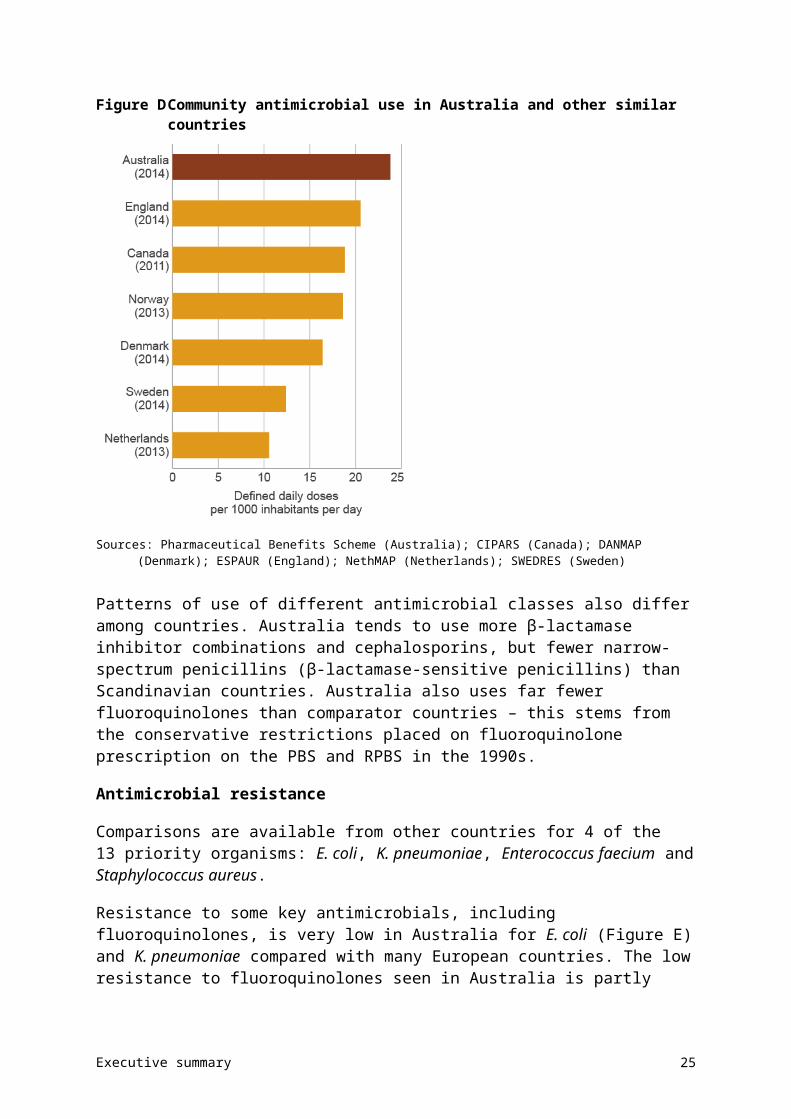
Figure D compares Australia’s AU with four northern European countries, England and Canada. These countries have been selected because their data is readily accessible and comparable. AU in the Australian community is higher than any of these countries.
Executive summary 18
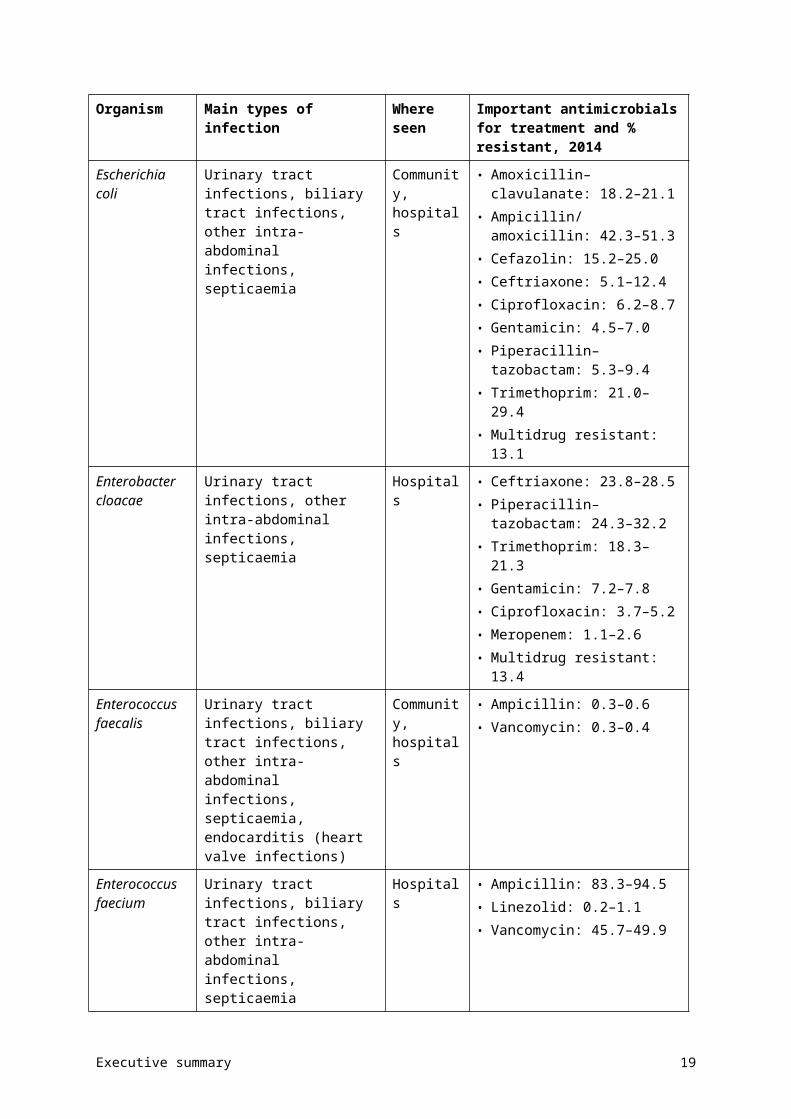
Figure D Community antimicrobial use in Australia and other similar countries
Sources: Pharmaceutical Benefits Scheme (Australia); CIPARS (Canada); DANMAP (Denmark); ESPAUR (England); NethMAP (Netherlands); SWEDRES (Sweden)
Patterns of use of different antimicrobial classes also differ among countries. Australia tends to use more β-lactamase inhibitor combinations and cephalosporins, but fewer narrow-spectrum penicillins (β-lactamase-sensitive penicillins) than Scandinavian countries. Australia also uses far fewer fluoroquinolones than comparator countries – this stems from the conservative restrictions placed on fluoroquinolone prescription on the PBS and RPBS in the 1990s.
Antimicrobial resistance
Comparisons are available from other countries for 4 of the 13 priority organisms: E. coli, K. pneumoniae, Enterococcus faecium and Staphylococcus aureus.
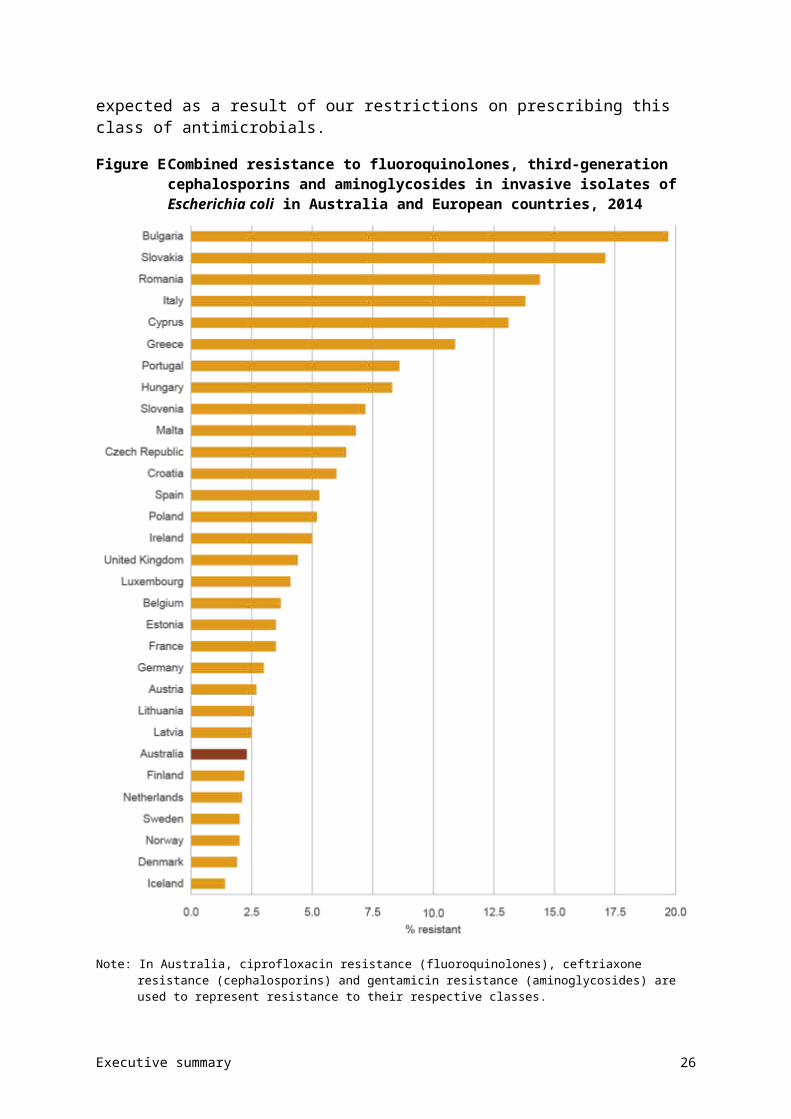
Resistance to some key antimicrobials, including fluoroquinolones, is very low in Australia for E. coli (Figure E) and K. pneumoniae compared with many European countries. The low resistance to fluoroquinolones seen in Australia is partly expected as a result of our restrictions on prescribing this class of antimicrobials.
Executive summary 19
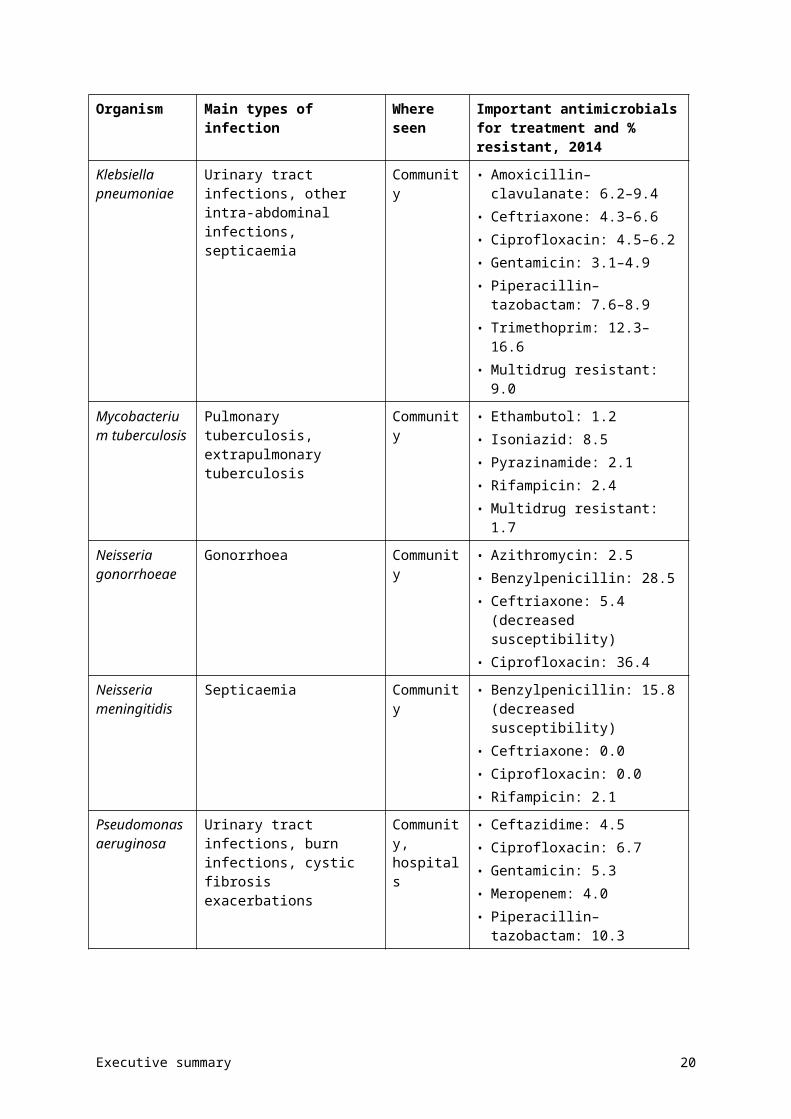
Figure E Combined resistance to fluoroquinolones, third-generation cephalosporins and aminoglycosides in invasive isolates of Escherichia coli in Australia and European countries, 2014
Note: In Australia, ciprofloxacin resistance (fluoroquinolones), ceftriaxone resistance (cephalosporins) and gentamicin resistance (aminoglycosides) are used to represent resistance to their respective classes.
Sources: Australian Group on Antimicrobial Resistance, 2014; EARS-Net 2014 (Polish data is from 2013)
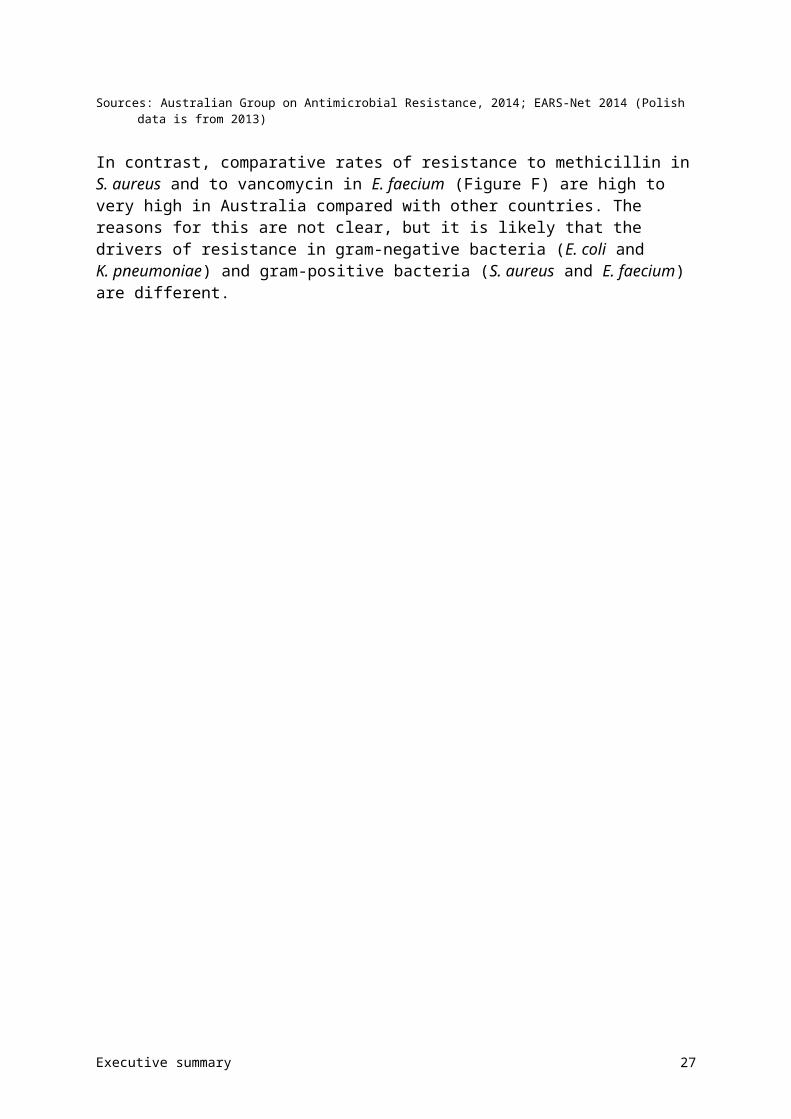
In contrast, comparative rates of resistance to methicillin in S. aureus and to vancomycin in E. faecium (Figure F) are high to very high in Australia compared with other countries. The reasons for this are not clear, but it is likely that the drivers of resistance in gram-negative
Executive summary 20
bacteria (E. coli and K. pneumoniae) and gram-positive bacteria (S. aureus and E. faecium) are different.
Figure F Vancomycin resistance in Enterococcus faecium in Australia and European countries, 2014
Sources: Australian Group on Antimicrobial Resistance, 2014; EARS-Net, 2014 (Polish data is from 2013)
Chapter 5 of AURA 2016 includes detailed information on international comparisons of AU and AMR.
Executive summary 21
Future developments
AURA 2016 demonstrates that an effective surveillance system can improve our understanding of how antimicrobials are used in Australia, and increase our knowledge of the priority organisms that are resistant to antimicrobials.
AURA 2016 provides a baseline that will allow trends to be monitored over time. It also reveals current gaps in surveillance and areas where further work is needed. The Australian Commission on Safety and Quality in Health Care is continuing to work with key stakeholders to strengthen the AURA Surveillance System, and to ensure that the data and information provided through AURA can inform action at the local, regional, state and national level to prevent and contain the spread of AMR.
In light of the findings from AURA 2016, future work in relation to surveillance will be needed to:
• improve data analysis and interpretation at the national level
• increase data coverage across geographical areas (jurisdictional, urban, regional, rural and remote areas), patient settings (primary care, residential aged care and hospitals) and hospital types
• improve data collection methods to allow better benchmarking and comparisons between hospitals
• increase participation in national data collection surveys such as NAPS, NAUSP and acNAPS
• improve data collection and reporting of AMR in all jurisdictions
• continue to monitor emerging resistances and changes in patterns of resistance, and ensure they can be rapidly identified and contained to prevent outbreaks.
Other areas that warrant further investigation or action may include:
• assessing factors that drive variation in AU and prescribing across jurisdictions
• improving appropriateness of prescribing in hospitals (particularly for surgical prophylaxis) and the community (particularly for upper respiratory tract infections)
• advancing a response to the issue of inappropriate surgical prophylaxis
• promoting the Antimicrobial Stewardship Clinical Care Standard in community and primary care.
AURA 2016 is the first report of its kind in Australia. It is anticipated that regular reports will continue to be produced, with increasing capability to provide greater reach of surveillance, along with improved analyses and data reporting. In turn, this will support the prevention and containment of AMR, and improved health outcomes for all Australians.
Executive summary 22
Chapter 1 Introduction
Key messages
• Antimicrobial resistance (AMR) has a direct impact on patient care, and is thus a critical and immediate challenge to health systems around the world.
• Comprehensive, coordinated and effective surveillance of AMR and antimicrobial use (AU) is a national priority. Surveillance data is used to inform and monitor strategies to prevent and contain AMR.
• The Antimicrobial Use and Resistance in Australia (AURA) Surveillance System is being established to coordinate eight streams of data and information, to provide a comprehensive and integrated picture of patterns and trends for AMR and AU across Australia.
• AURA 2016 is the first report of its type on AMR and AU in Australia. It includes data on organisms that are determined to be a priority for Australia, the volume of AU, the appropriateness of antimicrobial prescribing and key emerging issues for AMR, and a comparison of Australia’s situation with other countries.
AMR is one of the most significant challenges for the provision of safe, high-quality health services across the world. This chapter provides context and background to the importance of AMR as a healthcare issue, along with information about the Australian policy context and the steps taken to establish the AURA Surveillance System, the foundation for this report.
1.1 Background
In 2013, the Australian Government departments of Health and Agriculture convened a One Health Antimicrobial Resistance Colloquium, which highlighted the need for a coordinated approach to AMR, not only for human health, but across animal health and agriculture as well.1
Following the colloquium, the National Antimicrobial Resistance Prevention and Containment Steering Group was established to promote cross-sectoral collaboration. The Secretaries of both departments provided joint governance and leadership to the group, which was supported by the expertise of the Chief Veterinary Officer and the Chief Medical Officer.
The two departments are leading the efforts at the national level to respond to antimicrobial resistance (AMR), most recently by providing guidance to the development of the National Antimicrobial Resistance Strategy (the National Strategy).2 The National Strategy provides the framework for a more integrated approach to future efforts relating to AMR, and confirmed the role of enhanced, effective surveillance as a national priority in the prevention and containment of AMR.
Chapter 1: Introduction 1
A role of the Australian Commission on Safety and Quality in Health Care (the Commission) is to establish the national surveillance system for AMR and antimicrobial use (AU), known as the Antimicrobial Use and Resistance in Australia (AURA) Surveillance System. This system will collect and analyse data, coordinate reporting from existing systems, and develop reports needed to target and inform action on AMR. Although AURA will broadly support all elements of the National Strategy, two of its objectives are specifically relevant:
• Objective 1 – Increasing awareness and understanding of antimicrobial resistance, its implications and actions to combat it, through effective communication, education, and training
• Objective 3 – Develop nationally coordinated One Health surveillance of AMR and AU.
In addition to these local activities, in May 2014, the World Health Assembly adopted a resolution to develop a Global Action Plan on Antimicrobial Resistance. The Australian Government has been actively involved in shaping the Global Action Plan.
1.2 Importance of antimicrobial resistance
AMR occurs when a microorganism develops resistance to an antimicrobial that was previously an effective treatment. As a result, infections caused by resistant organisms may need to be treated with other antimicrobials, which can have more severe side effects, be more expensive or take longer to work. In some more severe cases, resistant organisms may not be able to be treated by any currently available antimicrobials.
AMR contributes to patient illness and death. It increases the complexity of treatment and the duration of hospital stay, and places a significant burden on patients, healthcare providers and the health system.3,4
International evidence consistently demonstrates the growing impact that AMR is having on human health, and studies confirm that increasing numbers of infections in healthcare facilities and in the community are caused by resistant pathogens.5 A significant contributor to increasing AMR is the inappropriate use of antimicrobials.
Slowing the rate of increasing resistance, preparing for and responding to new and emerging threats, and ensuring that antimicrobials are used appropriately are all components of the work undertaken by the Commission to ensure the safety and quality of health care in Australia.
1.3 Cost and impact of antimicrobial resistance to individuals and the community
A recent review by the London School of Hygiene and Tropical Medicine in the United Kingdom (UK) estimated the economic burden of AMR, with additional costs ranging from £5 to more than £20 000 per episode of care in hospital (equivalent to A$10 to more than A$41 200). The authors proposed that these estimates are modest, because they are largely based on the incremental costs of treating resistant infections compared with susceptible infections.6
Most studies focus on additional healthcare costs, morbidity and mortality in individual patients with a subset of resistant organisms, and tend not to consider the broader costs to
Chapter 1: Introduction 2
society and the healthcare system.6-8 The broader implications and costs include those borne by the community as a result of the reduced effectiveness of antimicrobials over time. These may include reduced productivity through extended illness, and the potential loss of ability to safely undertake advanced surgical procedures and treatments such as chemotherapy in the future.
AMR has significant impact on direct patient care. For example, people currently undergoing hip replacements receive standard prophylactic antimicrobials and experience infection rates of around 0.5–2%.6 If access to effective antimicrobials was reduced, postoperative infection rates may rise to around 40–50%, and up to 30% of these patients would die from these infections.6
Beyond the impact of reduced effectiveness of antimicrobials, there can also be substantial costs associated with failing to identify and manage outbreaks of resistant organisms in a timely way. In 1995, the cost of containing an outbreak of methicillin-resistant Staphylococcus aureus in a district general hospital in the UK was estimated to be greater than £400 000 (A$824 000).9 If this type of outbreak becomes more frequent, the cost to services and health systems could continue to escalate.
A 2014 UK review on AMR investigated the global economic cost of drug-resistant infections. The results suggested that, if the current trend of increasing AMR continues, by 2050 around 10 million people may die every year as a direct result of AMR. Gross domestic product (GDP) would decrease by 2–3.5% as a result of AMR, which would cost the world’s economies around US$100 trillion (A$140 trillion).8 This is likely to be an underestimate of the real costs of AMR, because the review focused on the impact on GDP, and did not consider social and health costs.
Regardless of the dollar amount, there is broad consensus that costs and impacts to patients, service providers and health systems relating to AMR are likely to be significant in the short to medium term because of longer treatment and recovery times, increased use of medicines, and increased risk of complications. In addition, as indicated in many reports, if antimicrobials become ineffective, a range of important treatments and healthcare services (such as surgery and chemotherapy for cancer) may no longer be a viable option, which would have a negative effect on the nature of service delivery and the effectiveness of the healthcare system in the long term.6 It is for these reasons that AMR is considered a significant threat to human health.
1.4 Australian healthcare system context
Australia’s healthcare system is multifaceted, comprising public and private sector providers, settings and participants. Healthcare providers include medical practitioners, nurses, allied and other health professionals, hospitals, clinics, and government and nongovernment agencies. These providers deliver comprehensive and complex services, from public health and primary healthcare services in the community, to emergency and acute health services in hospitals, to rehabilitation and palliative care in both settings.
Public sector health services are provided by all levels of government: local, state and territory, and the Australian Government. Private sector health service providers include private hospitals, medical practices and pharmacies. Around 70% of total health expenditure in Australia is funded by governments, with the Australian Government contributing approximately 42%, and state and territory governments 27%. The remaining 30% is made
Chapter 1: Introduction 3
up of contributions by patients (17%), private health insurers (8%) and accident compensation schemes (5%).10
Australia has a universal public health insurance scheme, Medicare, which provides all Australian citizens with access to free public hospital care, and to many diagnostic and pathology procedures.11
The Australian Government’s Pharmaceutical Benefits Scheme (PBS) and Repatriation Pharmaceutical Benefits Scheme (RPBS) provide subsidised access to a wide range of medicines for all Australians. Under the PBS/RPBS, patient contributions towards medication costs at pharmacies are capped, and there is a Safety Net Scheme to protect people with high medication needs.
Although public hospitals are funded by the state, territory and Australian governments, they are managed by state and territory governments. These provide about 70% of all hospital care.
The private sector includes the majority of doctors (general practitioners and specialists), private hospitals and day hospitals, a large diagnostic services industry, pharmacists and private health insurance funds.11 Private hospitals are increasingly providing more complex surgery in Australia.
Ownership of private hospitals is quite concentrated in Australia, with more than two-thirds of all private hospital beds owned by large for-profit or not-for-profit organisations.11 General practitioners and pharmacists are largely self-employed and funded through a combination of government subsidies such as Medicare and the Practice Incentive Program, as well as payment from patients.
Health service providers seek to improve the overall safety and quality of health care through various improvement activities. The Commission leads and develops many AMR-related initiatives, focusing on infection control, antimicrobial stewardship and medication safety programs.
The Commission developed the National Safety and Quality Health Service (NSQHS) Standards to protect the public from harm and to improve the quality of health service provision. The NSQHS Standards provide a quality assurance mechanism that tests whether relevant systems are in place to ensure that minimum standards of safety and quality are met, and improve the quality of health care in Australia. The 10 NSQHS Standards were mandated by health ministers in 2011 and provide a nationally consistent statement about the level of care consumers can expect from health service organisations.
Standard 3: Preventing and Controlling Healthcare Associated Infections requires healthcare organisations to monitor patterns of AU locally, and use this information to guide antimicrobial stewardship practices, as well as meet infection control requirements.
1.5 Importance of surveillance
Comprehensive and coordinated surveillance is a critical requirement of efforts to control AMR.4 The information generated through surveillance of AU and AMR more accurately informs and supports strategies to prevent and contain AMR. Successive international and
Chapter 1: Introduction 4
Australian reports on AMR have identified the effective coordination of national surveillance as a foundation for reducing the adverse impacts of AMR.
Box 1.1 What does surveillance do?Surveillance of antimicrobial use (AU) and antimicrobial resistance (AMR):
measures the size, burden, relative importance and, where possible, impact of AMR
measures the level of exposure (use) and the appropriateness of AU
detects critical AMRs early to ensure that effective action can be taken
enables changes in AMR and AU to be monitored, and provides information on the effectiveness of measures to control AU and contain AMR.
Use of surveillance data can also result in earlier detection and response to critical AMRs, and has the potential to reduce overall population impact in an outbreak. Broader health system benefits can also be gained, through reduced length of stay and overall improvements in bed capacity.
At the local level, health services and practitioners can use surveillance data to develop guidance and protocols that maximise the appropriate, effective and efficient use of antimicrobials.
Timely access to relevant data on AMR and AU will more effectively inform policy decisions, such as development or revision of antimicrobial prescribing guidelines, and help identify priorities for public health action, such as education campaigns or regulatory measures.
Table 1.1 provides some examples of how surveillance data for AU and AMR can be used, and the expected outcomes.
Chapter 1: Introduction 5
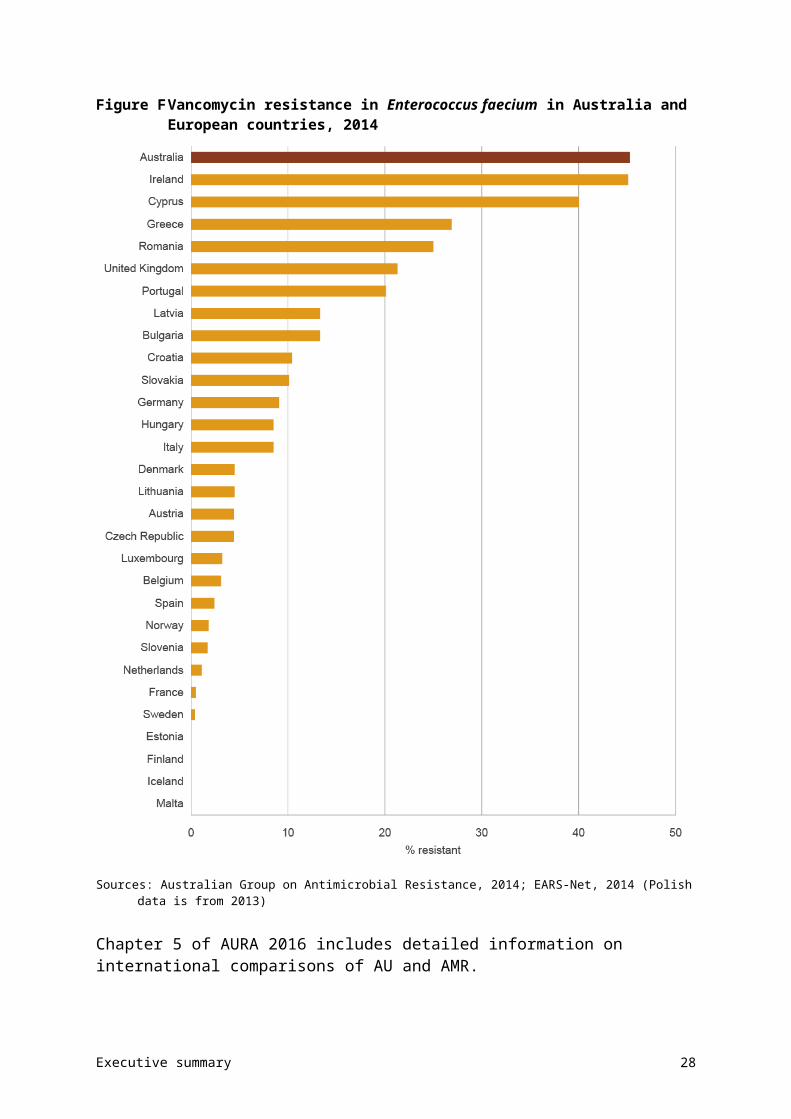
Table 1.1 Uses and outcomes of national surveillance of antimicrobial use and resistance at different health system levels
Level Use of surveillance data Impact or outcome
Global • Inform strategies to prevent and contain antimicrobial resistance, including the response to the Global Action Plan on Antimicrobial Resistance
• Coordinated efforts internationally: avoidance of duplication of effort and inefficient use of resources
National • Inform policy and program development
• Develop and revise guidelines• Inform public health priorities• Inform regulatory decisions• Coordinate, where necessary, the
response to critical antimicrobial resistances
• Coordinated and integrated efforts across Australia
• Increased awareness of antimicrobial resistance and One Health approach
State and territory • Inform policy and program development
• Develop and revise guidelines• Inform public health priorities• Inform regulatory decisions• Detect and respond to critical
antimicrobial resistances and outbreaks
• Improved knowledge of local antimicrobial resistance profiles
• Timely response to emerging resistance
• Appropriate and effective use of antimicrobials
Healthcare services
• Inform clinical practice• Inform policy development• Develop local strategies to improve
antimicrobial stewardship• Detect and respond to outbreaks of
resistant organisms
• Appropriate and effective use of antimicrobials
• Improved capacity for timely response to emerging resistance
Individual • Raise awareness of appropriate use in the community
• Appropriate use of antimicrobials as prescribed
• Decreased complications from unnecessary or inappropriate antimicrobial therapy
A lack of surveillance and effective reporting can lead to misdirected and inefficient policies and programs, and poor use of limited resources through inappropriate or inefficient therapy. Importantly, these deficits can also lead to increased morbidity and mortality if patients are given ineffective or inappropriate medicines.12
Chapter 1: Introduction 6
Box 1.2 Antimicrobial stewardshipAntimicrobial stewardship (AMS) involves a multidisciplinary approach to implementing a suite of strategies to improve the appropriate and safe use of antimicrobials by health services.13
Effective AMS strategies are comprehensive in approach and incorporate the AMS Clinical Care Standard. Key strategies include:
educating and assessing competence of prescribers
reviewing antimicrobial prescribing and providing feedback to clinicians regarding their prescribing practices
establishing an antimicrobial formulary that includes restriction rules and approval processes
ensuring that clinicians have ready access to current, evidence-based Australian therapeutic guidelines
developing point-of-care interventions to improve appropriate prescribing
measuring the performance of AMS programs
ensuring that the clinical microbiology laboratory uses selective reporting of susceptibility testing results, consistent with health service antimicrobial treatment guidelines.
AMS is a core criterion under the National Safety and Quality Health Service Standard 3: Preventing and Controlling Healthcare Associated Infections. AMS is critical to improving patient outcomes, reducing adverse effects relating to antimicrobial treatment and containing the spread of antimicrobial resistance. Implementing an AMS program requires an understanding of the rates of antimicrobial prescribing within the service. Programs in Australia – such as the National Antimicrobial Prescribing Survey, and the National Antimicrobial Utilisation and Surveillance Program – can provide this type of data, and the Antimicrobial Use and Resistance in Australia project will offer further opportunities to report across these programs.
1.6 Developing the Antimicrobial Use and Resistance in Australia Surveillance System
In 2013, the Australian Government Department of Health engaged the Commission to establish a national surveillance system for AU and AMR in human health. The Commission has undertaken wide-ranging consultation, planning and development activities to review current surveillance systems, identify the requirements of the national system, and negotiate with a range of stakeholders to build and improve surveillance infrastructure.
There have been a range of AU and AMR surveillance programs, activities, data sets and reports in Australia. AU and AMR surveillance activity occurs at the jurisdictional level in Queensland, South Australia, Tasmania, Victoria and Western Australia. These surveillance programs have considerable strengths, including in-depth subject matter expertise, high-quality information and data assets, and commitment from individuals and health organisations to sustain effective surveillance reporting for action. However, to date, there has been a lack of nationally coordinated surveillance activity.
The AURA Surveillance System will provide a comprehensive picture of patterns and trends in AU and AMR to inform clinicians; policy and program developers; health service managers and executives; and state, territory and Australian governments. These patterns and trends will guide improvements in infection control, antimicrobial stewardship and antimicrobial prescribing practices.
Chapter 1: Introduction 7
The planning phase for AURA has confirmed the key elements required for a comprehensive approach to surveillance in Australia. AURA will initiate data collection, where needed, to complement data and information from existing programs, and coordinate eight streams of data and information for AU and AMR. This data will cover both the community and acute sectors and, through the use of passive and targeted data collections, produce integrated surveillance reports about the current state of play, trends over time and, where feasible, the interrelationships between AMR and AU.
The AURA Surveillance System is being established by partnering and enhancing existing surveillance programs, and targeting specific action to improve data representativeness, accessibility and data analytics. This is complemented by the establishment of new systems where gaps in surveillance have been identified, such as an alert system for critical antimicrobial resistances. A number of publications have recently been released that report on the enhanced information from these programs on AU and AMR in the hospital, aged care and community sectors across Australia, and for public and private providers.14,15
Box 1.3 Role of the Antimicrobial Use and Resistance in Australia Surveillance System
The Antimicrobial Use and Resistance in Australia Surveillance System:
improves quality, coverage and utility of existing high-quality data collections on antimicrobial use (AU) and antimicrobial resistance (AMR)
coordinates and enhances reporting for individual data collections
provides more detailed analyses across data collections, including analysing the relationships between AU and AMR at a system level
provides systematic, coordinated and centralised national reporting on AU and AMR
establishes new data collections, where needed, such as the systematic and timely identification of the emergence of critical AMRs.
The integrated approach used by AURA, combined with partnerships with existing programs, will improve understanding of AMR, and of the type, volume and nature of AU in Australia. This is being achieved through enhanced data collection, greater standardisation, and cooperation and coordination across all jurisdictions, public and private sector hospitals, and the primary and aged care sectors.
Data collections contributing to the Antimicrobial Use and Resistance in Australia Surveillance System
The AURA Surveillance System is an integrated approach to bringing together eight streams of surveillance activity through a coordinating hub in the Commission.
Currently, four core existing surveillance programs provide the foundation to AURA:
• the Australian Group on Antimicrobial Resistance
• the National Antimicrobial Prescribing Survey
• the National Antimicrobial Utilisation Surveillance Program
• the Queensland Health OrgTRx System.
Chapter 1: Introduction 8
In addition, data is gathered from:
• the National Neisseria Network, on Neisseria gonorrhoeae and N. meningitidis
• the National Notifiable Diseases Surveillance System, on Mycobacterium tuberculosis
• the PBS and RPBS
• NPS MedicineWise
• Sullivan Nicolaides Pathology, on rates of AMR from the private sector.
Each of these programs provides valuable data on the breadth of AU and AMR surveillance. The data from these collections covers selected organisms or antimicrobials from the community and hospitals. The collections use a range of methods, sampling techniques and sources, and have largely been set up to provide data at the local or state level for specific purposes.
The coverage, capture and content of these collections have been variable. However, each of these programs is now positioned within the framework of AURA to provide an integrated and comprehensive picture of both AU and AMR in Australia over time.
1.7 AURA 2016 report
This AURA 2016 report provides a more complete picture of AU and AMR rates, and patterns and trends than has previously been available in Australia. The report provides core surveillance data, as well as describing the health impact of resistant organisms and AU. This information will support the development of action currently planned to implement the National Antimicrobial Resistance Strategy.
This report identifies key AMR issues for Australia, with information on the most frequently used antimicrobials and a designated group of priority organisms. Where available, it includes data and analyses on patterns and trends:
• on antimicrobial prescribing and dispensing in hospitals, residential aged care facilities and the community
• on the appropriateness of antimicrobial prescribing in acute care, general practice and residential aged care facilities
• to provide evidence for AMR prevention and containment strategies by all jurisdictions
• on resistance in priority organisms for key antimicrobials in acute care, residential aged care facilities and the community.
The report describes key emerging issues for AU and AMR in Australia, draws on comparisons with other countries undertaking similar surveillance, and provides commentary on the relationship between select organisms and antimicrobials.
Although the report is modelled on international reports of similar standing, it includes data on the appropriateness of AU, which has not been produced in similar overseas surveillance reports.
The 2016 report integrates data from AURA’s partner programs and organisations, and includes participation from all states and territories, and the private sector. New partnerships
Chapter 1: Introduction 9
continue to be forged to strengthen the AURA Surveillance System. Details on the data sources and the methods for individual collections can be found in Chapter 2 and Appendix 1.
The integration of data from public and private facilities, and the community, as illustrated through the data from Queensland, has not previously been undertaken. It demonstrates the ability to bring this data together in a meaningful way, and provides an indicator of what is possible with the increasing breadth of surveillance currently under way.
Work has begun, through AURA, to examine the relationship between AU and AMR in Australian hospitals. This work is ongoing, and it is expected that the results will be presented in the next national report.
The Commission thanks each of the organisations and networks contributing to the report and to the AURA Surveillance System.
Chapter 1: Introduction 10

Chapter 2 Data sources and methods
Key messages
• The Antimicrobial Use and Resistance in Australia (AURA) Surveillance System includes passive and targeted surveillance for antimicrobial use and resistance in hospitals and the community.
• Data on antimicrobial use and its appropriateness is sourced from the National Antimicrobial Prescribing Survey, the Aged Care National Antimicrobial Prescribing Survey, the National Antimicrobial Utilisation Surveillance Program, the NPS MedicineWise MedicineInsight program, the 2015 Report on government services and the Pharmaceutical Benefits Scheme.
• Data on antimicrobial resistance is sourced from the Australian Group on Antimicrobial Resistance, the Queensland Health OrgTRx system, the National Neisseria Network, the National Notifiable Diseases Surveillance System and Sullivan Nicolaides Pathology.
Coordination of data and information from various sources needs to be accompanied by detail of the data sources, methods and purpose of data collection, and any considerations when using the data. This allows effective coordination, efficient analysis and accurate reporting, to inform strategies for local, state and territory, and national health systems. Over time, this coordinated approach allows improvements to be identified and targeted.
This chapter describes the types and sources of data used in the AURA Surveillance System.
2.1 Types of data and information collected under the Antimicrobial Use and Resistance in Australia Surveillance System
This report includes data predominantly from 2014, covering the eight elements of the Antimicrobial Use and Resistance in Australia (AURA) Surveillance System. It includes data collected from both passive and targeted systems for the community and hospitals (see Figure 2.1).
A combination of passive and targeted surveillance is necessary to achieve comprehensive and effective surveillance, and support appropriate responses.
Passive surveillance is the use of data that is already collected for other purposes, to identify patterns and trends in antimicrobial resistance (AMR) and antimicrobial use (AU).
Targeted surveillance is where the primary purpose of collecting data is to identify trends and patterns in AMR and AU.
Passive surveillance is the use of data that is already collected for other purposes, to identify patterns and trends in AMR and AU. Targeted surveillance is where the primary purpose of collecting data is to identify trends and patterns in AMR and AU.
Chapter 2: Data sources and methods 11
Figure 2.1 Components of the Antimicrobial Use and Resistance in Australia (AURA) Surveillance System
GP = general practitioner; RACF = residential aged care facility
2.2 Sources of data for antimicrobial use and appropriateness
Chapter 3 describes patterns and trends in use of antimicrobials, and is based on data collected by five programs:
• The National Antimicrobial Prescribing Survey (NAPS) is an online audit performed by hospitals to assess antimicrobial prescribing practices and appropriateness of prescribing within the hospital. Data is reported nationally from this program every year, and hospitals are able to interrogate their own data and undertake benchmarking within the audit tool.
• The Aged Care National Antimicrobial Prescribing Survey (acNAPS) is a pilot program based on the NAPS model. It is an audit of antimicrobial prescribing and appropriateness of prescribing in residential aged care facilities.
• The National Antimicrobial Utilisation Surveillance Program (NAUSP) collects, analyses and reports on data on use of antimicrobials at the hospital level. Participating hospitals receive bimonthly reports of their own data, and national reports are prepared annually.
Chapter 2: Data sources and methods 12
• The NPS MedicineWise MedicineInsight program collects data on antimicrobial prescribing in general practice. Data is provided to participating general practitioners, and reported elsewhere on an ad hoc basis.
• The Pharmaceutical Benefits Scheme (PBS) and Repatriation Pharmaceutical Benefits Scheme (RPBS) allow data collection on antimicrobials dispensed under the PBS/RPBS. For this report, PBS data was obtained from the Drug Utilisation Sub Committee, which holds long-term historical PBS data.
Additional data on the appropriateness of antimicrobial use in the community was also sourced from the 2015 Report on government services.16
Together, these sources of data reflect prescriptions, use of antimicrobials and appropriateness of prescribing in public and private hospitals across Australia, as well as dispensing within the community.
2.3 Sources of data for antimicrobial resistance
Chapter 4 describes rates of resistance for priority organisms, and is based on data collected by five programs:
• The Australian Group on Antimicrobial Resistance (AGAR) collects, analyses and reports on data on priority organisms, such as Enterobacteriaceae, Enterococcus species and Staphylococcus aureus. Data is reported nationally for three AGAR programs every year.
• The Queensland Health OrgTRx system collects, analyses and reports on data on AMR in public hospitals across Queensland. Participants in OrgTRx can access their own data and run ad hoc reports within the system. There is currently no national reporting of OrgTRx data.
• The Australian National Neisseria Network (NNN) conducts the national laboratory surveillance programs for Neisseria gonorrhoeae and N. meningitidis. Data from the NNN programs is published quarterly and annually in the journal Communicable Diseases Intelligence.
• The National Notifiable Diseases Surveillance System (NNDSS) collects data on Mycobacterium tuberculosis, and data is published annually in the Communicable Diseases Intelligence journal. The Australian Mycobacterium Reference Laboratory Network (AMRLN) provides drug susceptibility data on M. tuberculosis isolates to state and territory public health units for inclusion in the NNDSS.
• Sullivan Nicolaides Pathology (SNP) collects data on AMR among organisms in the community, and acute and residential aged care facilities. Data on rates of resistance for SNP facilities has not previously been published nationally.
Table 2.1 provides a summary of the data sources, the type of surveillance undertaken, the types of data sourced, and the setting and coverage of data included in this report.
Further detail on the data sources for this report, including details of collection methodology, can be found in Appendix 1.
Chapter 2: Data sources and methods 13
Table 2.1 Data sources for the AURA 2016 report
Chapter 2: Data sources and methods 14
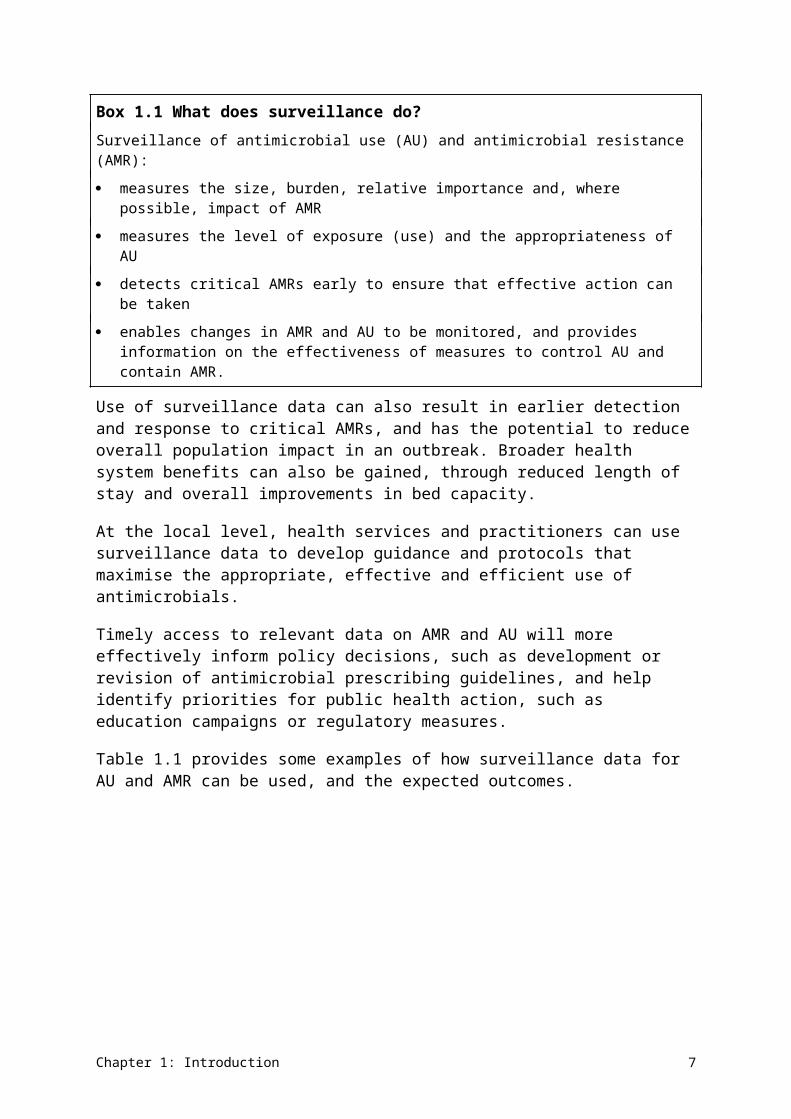
Subject Type of surveillance
Data source Type of data Setting Coverage
Antimicrobial use
Targeted – community
acNAPS Appropriateness of prescribing, prescribing pattern
Australian residential aged care facilities
National (pilot covered 186 residential aged care facilities)
Antimicrobial use
Targeted – community
MedicineInsight Appropriateness of prescribing, prescribing pattern
Australian general practice National (182 general practices)
Antimicrobial use
Targeted – community
ROGS Appropriateness of prescribing
Australian general practice National (1000 general practitioners)
Antimicrobial use
Targeted – hospital
NAPS Appropriateness of prescribing, prescribing volume
Australian public and private hospitals
National (248 hospitals; 44.2% of all hospital beds)
Antimicrobial use
Passive – community
PBS/RPBS Dispensed volumeTrends
Australian general practices and community health services
National (30 million prescriptions)
Antimicrobial use
Passive – hospital
NAUSP Dispensed volume Australian public and private hospitals
National (129 hospitals; >90% of principal referral hospitals and 82% of total beds in public hospitals with >50 beds)
Antimicrobial resistance
Targeted – community
NNDSS Rates of resistance, trends Australian general practices and community health services
National (5 reference laboratories)
Antimicrobial resistance
Targeted – community
NNN Rates of resistance, trends Australian general practices and community health services
National (9 reference laboratories)
Antimicrobial resistance
Targeted – community
AGAR Rates of resistance, 30-day all-cause mortality
Australian public and private hospitals (community onset)
National (28 laboratories)
Antimicrobial resistance
Targeted – hospital
AGAR Rates of resistance, 30-day all-cause mortality
Australian public and private hospitals (hospital onset)
National (28 laboratories)
Antimicrobial resistance
Passive – community
SNP Rates of resistance Queensland and northern New South Wales residential aged care
Queensland and northern New South Wales (583 providers)
Chapter 2: Data sources and methods 15
Subject Type of surveillance
Data source Type of data Setting Coverage
facilities
Antimicrobial resistance
Passive – community
SNP Rates of resistance Queensland and northern New South Wales community and general practices
Queensland and northern New South Wales
Antimicrobial resistance
Passive – hospital
OrgTRx Rates of resistance Queensland public hospitals and health services
Queensland (182 hospitals and health services)
Antimicrobial resistance
Passive – hospital
SNP Rates of resistance Queensland and northern New South Wales private hospitals
Queensland and northern New South Wales (163 hospitals)
acNAPS = Aged Care National Antimicrobial Prescribing Survey; AGAR = Australian Group on Antimicrobial Resistance; NAPS = National Antimicrobial Prescribing Survey; NAUSP = National Antimicrobial Utilisation Surveillance Program; NNDSS = National Notifiable Diseases Surveillance System; NNN = National Neisseria Network; OrgTRx = Queensland Health passive antimicrobial resistance surveillance system in hospitals; ROGS = Report on government services 2015; PBS/RPBS = Pharmaceutical Benefits Scheme and Repatriation Pharmaceutical Benefits Scheme; SNP = Sullivan Nicolaides Pathology
Chapter 2: Data sources and methods 16
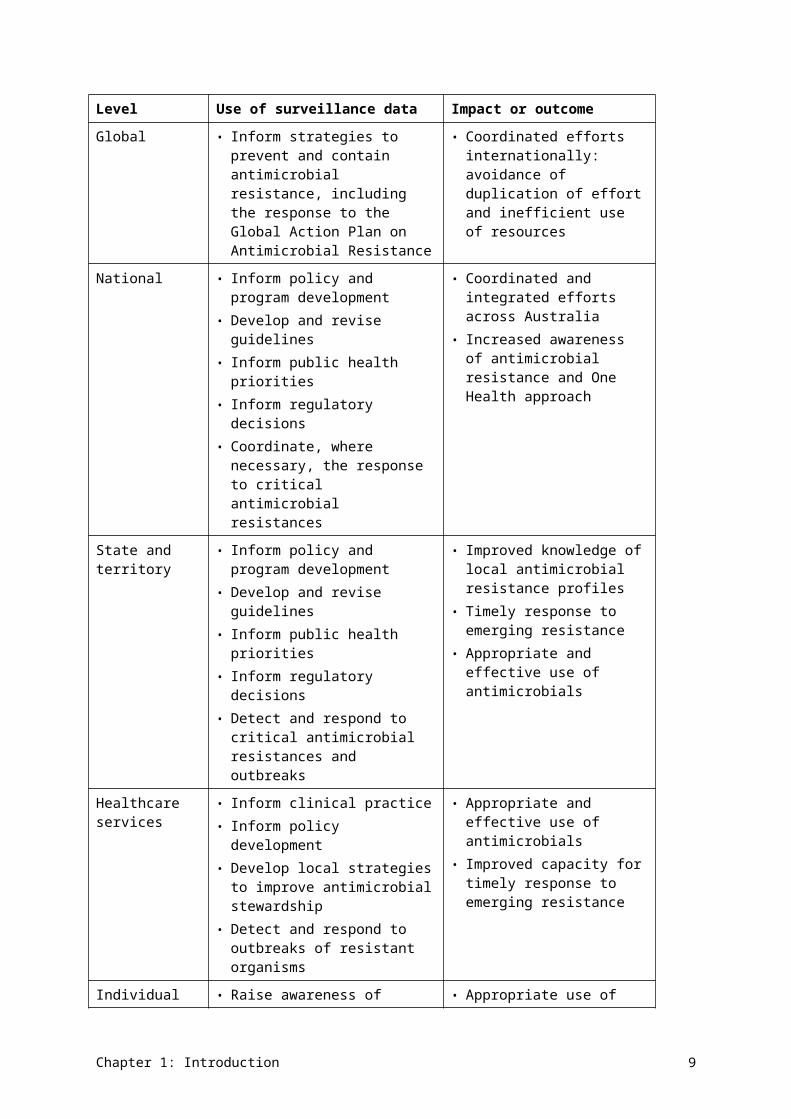
2.4 Considerations for interpreting the data
The AURA Surveillance System continues to develop the breadth and capacity of AMR and AU surveillance data for the hospital and community sectors. Although this report offers access to a range of data not previously available, a number of considerations should be noted:
• Limited data is currently available for AMR in the community, including residential aged care facilities.
• Data on AMR in public hospitals is from the OrgTRx passive surveillance system. For 2014, this includes data from public hospitals and health services from Queensland only. The OrgTRx system has recently expanded to include a large private sector laboratory service in Queensland and data captured by ACT Pathology (in the Australian Capital Territory). Further expansion of passive AMR surveillance through OrgTRx is under way, with discussions on including services in New South Wales, Tasmania, the Northern Territory and Victoria, and some other private sector laboratories. Future reports will therefore represent a greater breadth of data in this area.
• AMR data from private hospitals, residential aged care facilities and the community is from SNP. For 2014, this includes data from SNP services in Queensland and northern New South Wales only.
• The AURA Surveillance System has identified Salmonella and Shigella as priority organisms for surveillance. Data for these organisms is currently being captured through passive surveillance. The expansion of OrgTRx will increase the capacity to review and report on Salmonella and Shigella.
At this stage of development of the system, while some elements of surveillance can be analysed for trends over time, there is insufficient longitudinal data to undertake time-series analyses across the board.
Chapter 2: Data sources and methods 17
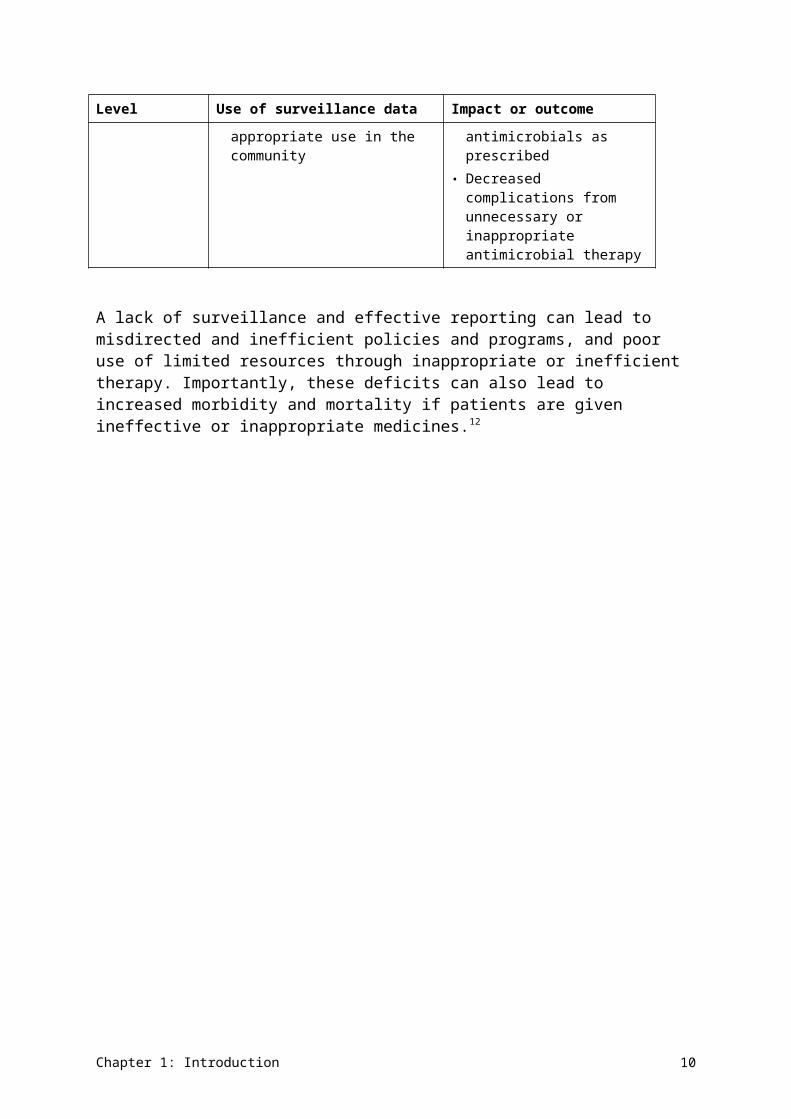
Chapter 3 Antimicrobial use and appropriateness
Key messages
Hospitals
• Antimicrobial use (AU) in hospitals has gradually declined since its peak in 2010. On any given day, 38.4% of hospital patients are prescribed antimicrobials.
• The rates of AU between states and territories vary widely, but the factors driving this variation are unclear.
• The most commonly prescribed antimicrobial classes are cephalosporins, and penicillin β-lactamase inhibitor combinations.
• From the available data overall, 23.0% of prescriptions were considered inappropriate, and 24.3% were noncompliant with guidelines. Inappropriate use was highest for respiratory tract infections and surgical prophylaxis.
Community
• AU in the community is high, with 46% of the population being dispensed at least one systemic antimicrobial prescription in 2014–15. AU was highest in children (0–9 years) and older people (65 years or over).
• Prescribing varies across states and territories, and across local areas. Prescription rates varied by 1.9–2.7 times between local areas.
• Penicillins are the most commonly prescribed therapeutic class. Amoxicillin is the most commonly prescribed antimicrobial, followed by cephalexin and amoxicillin–clavulanate.
• High volumes of antimicrobials are prescribed unnecessarily for respiratory tract infections – more than 50% of people with colds and other upper respiratory tract infections were prescribed an antimicrobial when it was not indicated.
• Some antimicrobials are prescribed more in winter, which suggests that they are potentially misused to treat colds and influenza.
Residential aged care facilities
• In residential aged care facilities, 11.3% of residents were on antimicrobial therapy, but only 4.5% had a suspected or confirmed infection.
• One in five antimicrobial prescriptions were written for residents who had no signs and symptoms of infection in the week before starting the antimicrobial.
• Of patients who did have signs of infection and were prescribed antimicrobials, only one-third of these prescriptions were appropriate.
• Antimicrobials are sometimes used unnecessarily in residential aged care facilities for urinary tract infections, and unspecified skin and soft tissue infections.
AU is a key driver of antimicrobial resistance (AMR) – the more we use antimicrobials, the more likely it is that resistance will develop. Sometimes antimicrobials are prescribed inappropriately, such as using antibacterials to treat a viral infection or prescribing
Chapter 3: Antimicrobial use and appropriateness 18
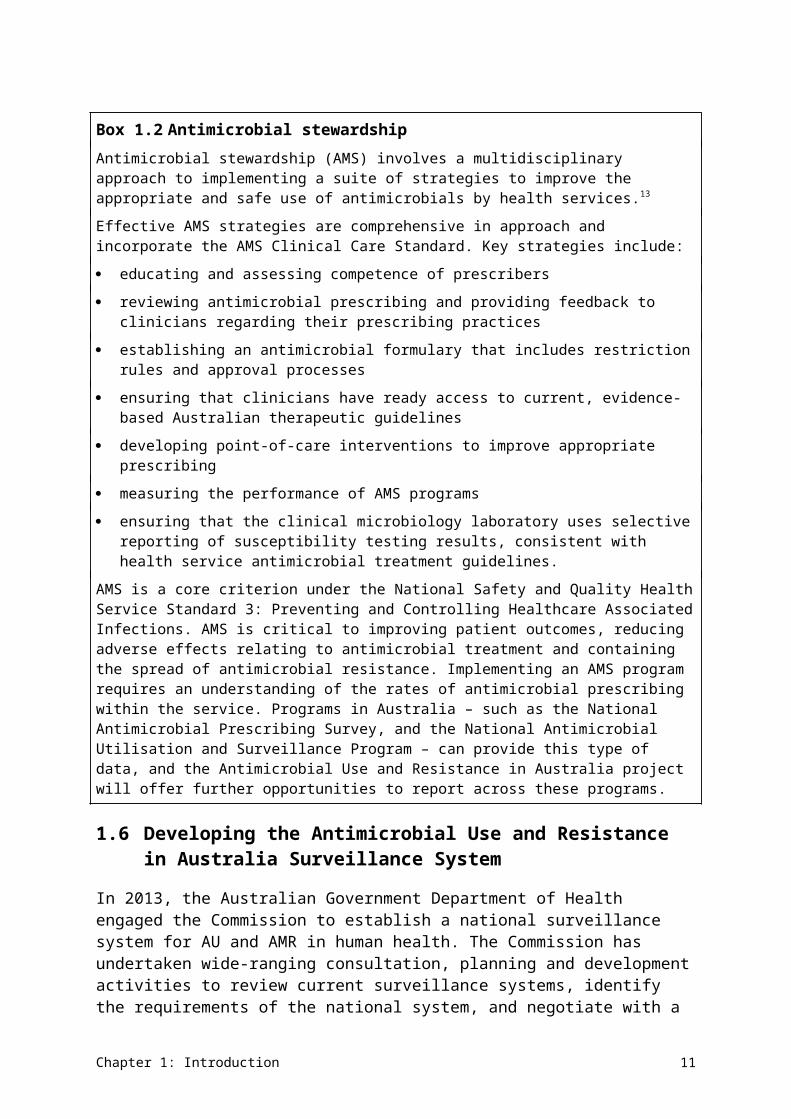
antimicrobials when they are not indicated. Surveillance of AU and appropriateness is essential to inform prevention and containment strategies for AMR.
This chapter provides data and analyses of AU, dispensing and appropriateness of prescribing in hospitals (public and private) and in the community (including residential aged care facilities).
3.1 Antimicrobial use in hospitals
Two programs in Australia provide significant data on volume of antimicrobials dispensed and the appropriateness of prescribing for patients admitted to acute hospitals: the National Antimicrobial Utilisation Surveillance Program (NAUSP) conducted by SA Health, and the National Antimicrobial Prescribing Survey (NAPS) conducted by the National Centre for Antimicrobial Stewardship.
Data on the volume of antimicrobial use (AU) in this report has been obtained from the 2014 report of the National Antimicrobial Utilisation Surveillance Program.15 It contains data from 129 Australian acute care hospitals (111 public and 18 private hospitals) from January to December 2014. This represents more than 90% of principal referral hospital beds and 82% of total beds in public hospitals that have more than 50 beds.
The NAUSP report includes historical comparisons over 5- and 10-year periods, interstate and intrastate data, and comparisons of usage rates between hospital peer groups for selected antimicrobial classes.15 Rates are expressed as defined daily doses per 1000 occupied-bed days (DDD/1000 OBD). Hospitals are classified into peer groups according to the December 2014 Australian Institute of Health and Welfare (AIHW) criteria.17
Participating hospitals contribute to NAUSP on a voluntary basis, and all Australian states and territories are generally represented in the program. However, 2014 data was not available for the Northern Territory, so this jurisdiction is omitted from some figures in this report. NAUSP does not include data on AU for children, because DDDs have not been defined for paediatric populations.
Data on the appropriateness of antimicrobial prescribing has been drawn from the 2014 NAPS, conducted between October 2014 and February 2015.14 This data assists in identifying problematic areas where prescribing frequently varies from guidelines (Therapeutic guidelines: antibiotic18 and locally endorsed guidelines).
A total of 248 hospitals (197 public and 51 private) participated in the 2014 NAPS, representing 44.2% of all public hospital beds nationally. Data was compared with that collected in 151 hospitals in 2013. Participation in NAPS is voluntary.
NAUSP reports on antibacterial use only; NAPS data also includes antifungals and antivirals.
Volume of antimicrobial use in hospitals
Total annual usage rates
The average total-hospital antimicrobial usage rate for all contributors (n = 129) was 936 DDD/1000 OBD (Figure 3.1). This is a 2.6% decrease from 2013. When new contributors (that is, hospitals that joined NAUSP since 2013) are excluded, the decrease is 1.6%.
Chapter 3: Antimicrobial use and appropriateness 19
Annual average use by individual hospitals ranged from 330 to 2040 DDD/1000 OBD, with a median annual rate of 907 DDD/1000 OBD.
Australia’s AU peaked in 2010, and has decreased gradually since then (Figure 3.1). Usage rates for aminoglycosides, fluoroquinolones, macrolides, nitroimidazoles (metronidazole) and fusidic acid have decreased. In contrast, consistent (although often small) increases in rates were seen for penicillins – β-lactamase resistant, other antimicrobials (daptomycin and linezolid), sulfamethoxazole with trimethoprim, and tetracyclines. This report uses therapeutic groupings that accord with the World Health Organization Anatomical Therapeutic Chemical (ATC) system (see AURA 2016: supplementary data).
Australia’s AU peaked in 2010, and has decreased gradually since then.
Chapter 3: Antimicrobial use and appropriateness 20
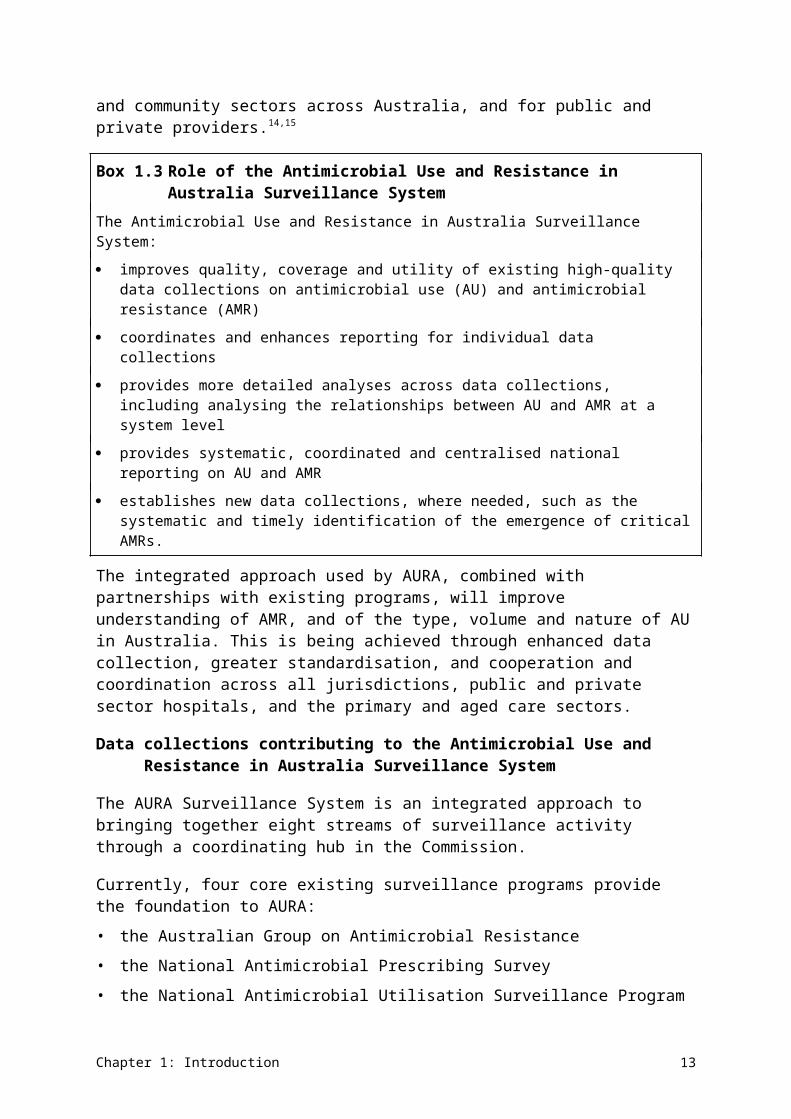
Figure 3.1 Total-hospital annual antimicrobial use in hospitals participating in the National Antimicrobial Utilisation Surveillance Program, 2005–14
DDD/1000 OBD = defined daily doses per 1000 occupied-bed days Source: National Antimicrobial Utilisation Surveillance Program report, 2014
Chapter 3: Antimicrobial use and appropriateness 21
Most commonly used antimicrobials
Twenty agents accounted for 92% of all antimicrobials used in Australian hospitals, on a DDD/1000 OBD basis (Figure 3.2). Six antimicrobials – amoxicillin–clavulanate, flucloxacillin, cefazolin, amoxicillin, doxycycline and cephalexin – represented more than 50% of use.
Twenty agents accounted for 92% of all antimicrobials used in Australian hospitals.
Highly reserved antimicrobials accounted for very small percentages of total AU – for example, linezolid (0.13%), daptomycin (0.12%) and colistin (0.08%).
For some agents, the DDDs do not align with hospital practice. Most commonly, this occurs because DDDs are defined for oral treatment, but higher doses are used parenterally in hospital practice. For example, the DDD for flucloxacillin is 2 grams, but the most common daily dose for intravenous use is 8 grams.
Figure 3.2 Top 20 antimicrobials used in Australian hospitals, 2014
Source: National Antimicrobial Utilisation Surveillance Program report, 2014
Nine of the top 10 antimicrobials reported in NAPS also appear in the NAUSP top 10 antimicrobials used (Table 3.1).
Chapter 3: Antimicrobial use and appropriateness 22
Table 3.1 Most frequently prescribed and supplied antimicrobials, as reported by the National Antimicrobial Prescribing Survey (NAPS) and the National Antimicrobial Utilisation Surveillance Program (NAUSP), 2014
Rank Most frequently prescribed (NAPS) Most frequently supplied (NAUSP)
1 Cefazolin (11.1%) Amoxicillin–clavulanate (14.3%)
2 Ceftriaxone (9.1%) Amoxicillin/ampicillin (11.1%)
3 Metronidazole (6.5%) Flucloxacillin (9.1%)
4 Piperacillin–tazobactam (6.1%) Cefazolin (8.5%)
5 Amoxicillin–clavulanate (6.0%) Doxycycline (5.7%)
6 Cephalexin (5.0%) Cephalexin (5.3%)
7 Flucloxacillin (4.5%) Piperacillin–tazobactam (4.7%)
8 Doxycycline (3.9%) Ceftriaxone (4.5%)
9 Benzylpenicillin (3.2%) Metronidazole (4.3%)
10 Amoxicillin/ampicillin (2.8%) Azithromycin (4.1%)Source: National Antimicrobial Prescribing Survey report, 2014; National Antimicrobial Utilisation Surveillance Program
report, 2014
Antimicrobial usage rates by state
Aggregated annual total-hospital antimicrobial usage rates for NAUSP contributors for 2014 are shown by state in Figure 3.3.
Jurisdictions vary in the number of contributing hospitals and the proportion of these that are private hospitals. See AURA 2016: supplementary data for a breakdown of the categories of hospitals.
There was large variation in antimicrobial classes used and usage rates between Australian states. Tasmania had the highest rate of 1228 DDD/1000 OBD, and Queensland had the lowest rate of 819 DDD/1000 OBD – a difference of more than 400 DDD/1000 OBD (Figure 3.3).
Tasmania had the highest AU rate of 1228 DDD/1000 OBD and Queensland had the lowest rate of 819 DDD/1000 OBD – a difference of more than 400 DDD/1000 OBD.
Table 3.2 lists the aggregate antibacterial usage rates by jurisdiction and AIHW peer group, excluding private and specialist women’s hospitals. Data for states with a small number of contributing hospitals should be viewed with caution because the data may not be truly representative. New South Wales and the Australian Capital Territory had the broadest range of DDDs per 1000 OBDs between hospitals. Further information on interstate comparisons of usage data can be found in the NAUSP annual report.15
Chapter 3: Antimicrobial use and appropriateness 23
Figure 3.3 Overall antimicrobial usage rates in hospitals, by jurisdiction, 2014
Chapter 3: Antimicrobial use and appropriateness 24
ACT = Australian Capital Territory; DDD/1000 OBD = defined daily doses per 1000 occupied-bed days; NSW = New South Wales; Qld = Queensland; SA = South Australia; Tas = Tasmania; Vic = Victoria; WA = Western Australia Note: Numbers of hospitals include public, private and specialist women’s hospitals.Source: National Antimicrobial Utilisation Surveillance Program report, 2014
Chapter 3: Antimicrobial use and appropriateness 25
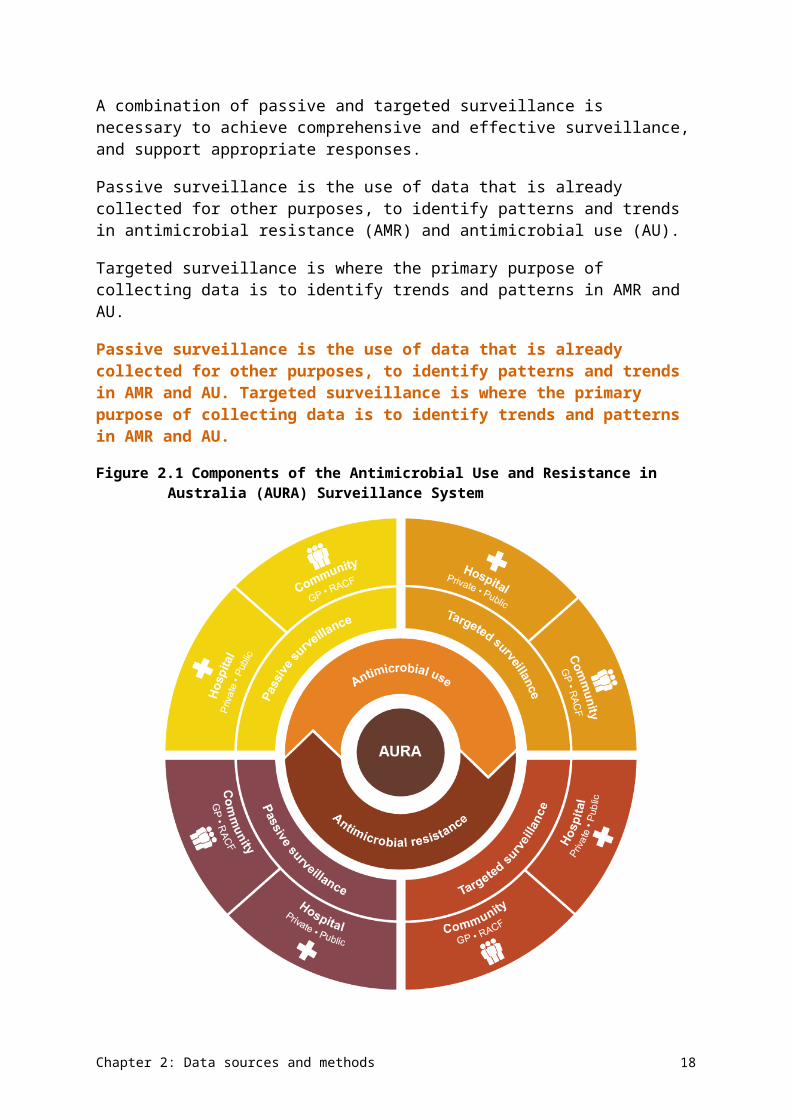
Table 3.2 Aggregate antimicrobial usage rates, by jurisdiction and Australian Institute of Health and Welfare peer group, 2014
Jurisdiction Hospitals contributing to NAUSP (number)
All hospitals (DDD/1000
OBD)
All hospitals range (DDD/1000 OBD)
Principal referral hospitals
(DDD/1000 OBD)
Large public acute hospitals
(DDD/1000 OBD)
Medium public acute hospitals
(DDD/1000 OBD)
Small public acute hospitals
(DDD/1000 OBD)
New South Wales and Australian Capital Territory
43 1089 566–2040 979.8 1150.1 1078.8 na
Queensland 22 860 504–1412 768.4 869 693.4 na
South Australia
13 922 450–1331 1050.6 975.5 894.1 819.1
Tasmania 4 1354 1182–1552 1182.4 1382.2 1345.1 na
Victoria 19 931 544–1472 939.2 1004.2 779.1 na
Western Australia
8 774 373–1004 971.6 712.2 873.6 373.4
Australia 109 933 373–2040 920.4 971.1 873.9 611.9DDD/1000 OBD = defined daily doses per 1000 occupied-bed days; na = not available; NAUSP = National Antimicrobial Utilisation Surveillance Program Note: Private hospitals and specialist women’s hospitals are not included.Source: National Antimicrobial Utilisation Surveillance Program report, 2014
Chapter 3: Antimicrobial use and appropriateness 26
Figures 3.4–3.7 show the differing patterns of AU among Australian states of individual antimicrobials in the four therapeutic classes that are most likely to drive AMR: aminoglycosides, third- and fourth-generation cephalosporins, fluoroquinolones and macrolides.
The marked decline in the usage rates of gentamicin, fluoroquinolones and cephalosporins observed in Queensland after July 2012 relates to an increase in the number of hospitals contributing to NAUSP, resulting in a smoothing of usage rates.
Gentamicin is the most commonly used aminoglycoside. Although there is some variation in use, rates have steadily decreased during the past five years in all states, which may be related to the recommendation on empiric use published in Therapeutic guidelines: antibiotic, version 14 (2010)20 (Figure 3.4). The Australian Commission on Safety and Quality in Health Care (the Commission) will work with the states and territories to review use patterns to inform antimicrobial stewardship (AMS).
Rates of gentamicin use have steadily decreased during the past five years in all states.
Figure 3.4 Aminoglycoside usage rates, by jurisdiction (3-month moving average), 2010–14
Chapter 3: Antimicrobial use and appropriateness 27
ACT = Australian Capital Territory; DDD/1000 OBD = defined daily doses per 1000 occupied-bed days Note: Tobramycin usage rates include inhaled formulations.Source: National Antimicrobial Utilisation Surveillance Program report, 2014
From information to actionUsing surveillance data to improve the use of antimicrobials for surgical prophylaxisA large acute hospital in South Australia has been participating in the National Antimicrobial Prescribing Survey (NAPS) since 2013. Each year, the hospital performs a hospital-wide audit, usually during Antibiotic Awareness Week in November. This audit identifies how the hospital uses its antimicrobials – the first step to reducing inappropriate prescribing.
The 2013 NAPS data showed that:
23% of the hospital’s documented prescriptions were inappropriate; some were suboptimal and others were inadequate (see Figure A)
43.3% of the documented prescriptions were for surgical prophylaxis, and 41.7% of patients received antimicrobials for more than 24 hours (less than 5% is considered best practice).
Table 3.6 outlines the common reasons for inappropriate prescribing.
Addressing inappropriate prescribing requires effective strategies. The hospital’s antimicrobial stewardship team reviewed the results of its 2013 NAPS data, with the following actions:
Improve weight-based dosing for surgical prophylaxis, to ensure adequate tissue antimicrobial exposures in larger patients.
Review local and national surgical prophylaxis guidelines, and provide appropriate education to junior medical staff, with the aim of reducing the duration of antimicrobial prophylaxis.
The NAPS data and the results of the strategies employed were provided as evidence to the hospital executive to gain continued support for these activities, as priorities.
Improved appropriateness of prescribing was demonstrated in the following year (Figure A).
Figure A Appropriateness of antimicrobial prescribing at the South Australian hospital, NAPS results for 2013 and 2014
In addition, the NAPS auditing process revealed that the hospital’s orthopaedic teams were prescribing three preoperative doses of antimicrobial, which had not been previously recognised. This
Chapter 3: Antimicrobial use and appropriateness 28
was promptly revised to the appropriate level of one preoperative dose, followed by two subsequent doses.
This hospital conducts the NAPS audit with increasing involvement of noninfectious diseases specialists at all levels of the facility, ensuring that a range of staff take part in the critical appraisal of antimicrobial use. This strategy has proven to be a powerful way of raising awareness of national and local antimicrobial prescribing practices, and highlighted areas requiring further education.
Ceftriaxone, the most commonly prescribed third-generation cephalosporin, shows a pattern of seasonal use, reflecting its role in the treatment of lower respiratory tract infections. Prescribing rates are lower in Queensland and Western Australia; however, use of cefepime (a fourth-generation cephalosporin) is noticeably higher in Western Australia than in other states (Figure 3.5). This result may be influenced by the smaller number of Western Australian hospitals participating in NAUSP.
Ceftriaxone, the most commonly prescribed third-generation cephalosporin, shows a pattern of seasonal use, reflecting its role in the treatment of lower respiratory tract infections.
Figure 3.5 Third- and fourth-generation cephalosporin usage rates, by jurisdiction (3-month moving average), 2010–14
Chapter 3: Antimicrobial use and appropriateness 29
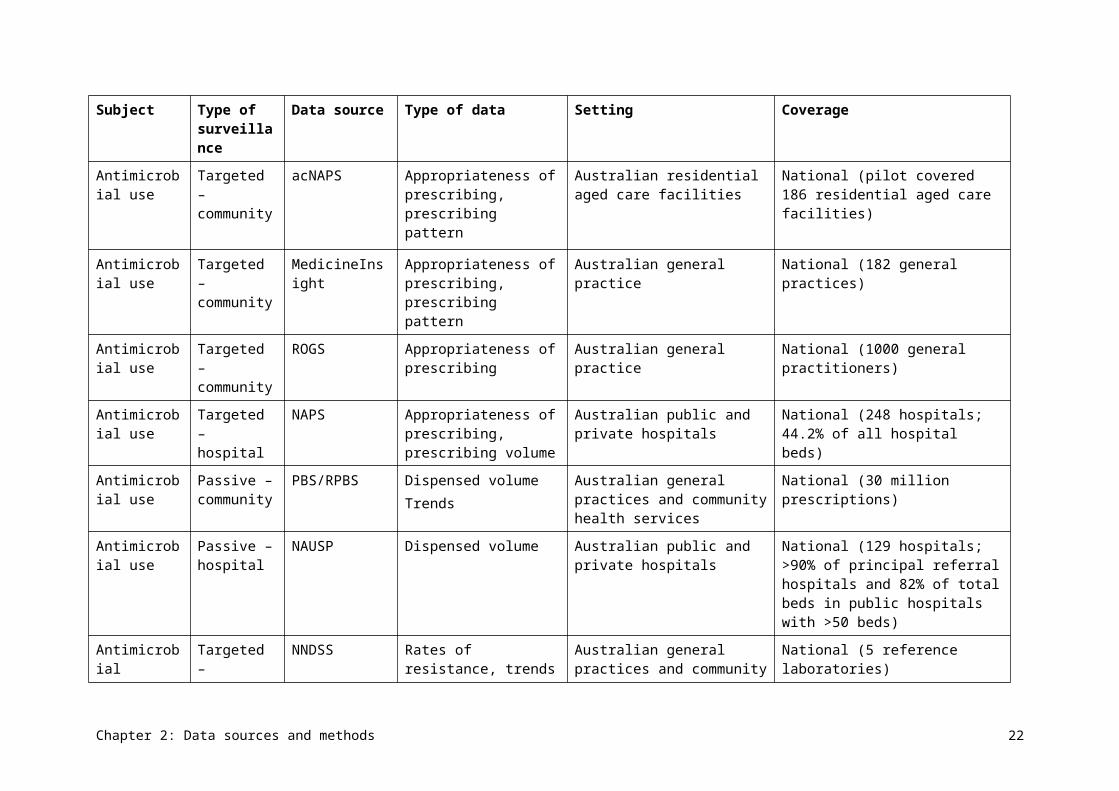
ACT = Australian Capital Territory; DDD/1000 OBD = defined daily doses per 1000 occupied-bed days Source: National Antimicrobial Utilisation Surveillance Program report, 2014
Ciprofloxacin is the most frequently used fluoroquinolone. Usage rates of norfloxacin and moxifloxacin have remained relatively constant (Figure 3.6).
Ciprofloxacin is the most frequently used fluoroquinolone.
Figure 3.6 Fluoroquinolone usage rates, by jurisdiction (3-month moving average), 2010–14
ACT = Australian Capital Territory; DDD/1000 OBD = defined daily doses per 1000 occupied-bed days Source: National Antimicrobial Utilisation Surveillance Program report, 2014
A marked seasonal variation is evident in the usage rates for the macrolides azithromycin and roxithromycin, with maximum use occurring in the winter months for treatment of atypical organisms in community-acquired pneumonia (Figure 3.7). Azithromycin is now the dominant macrolide used in Australian hospitals.
Usage rates for the macrolides azithromycin and roxithromycin show marked seasonal variation, with maximum use occurring in the winter months.
Chapter 3: Antimicrobial use and appropriateness 30
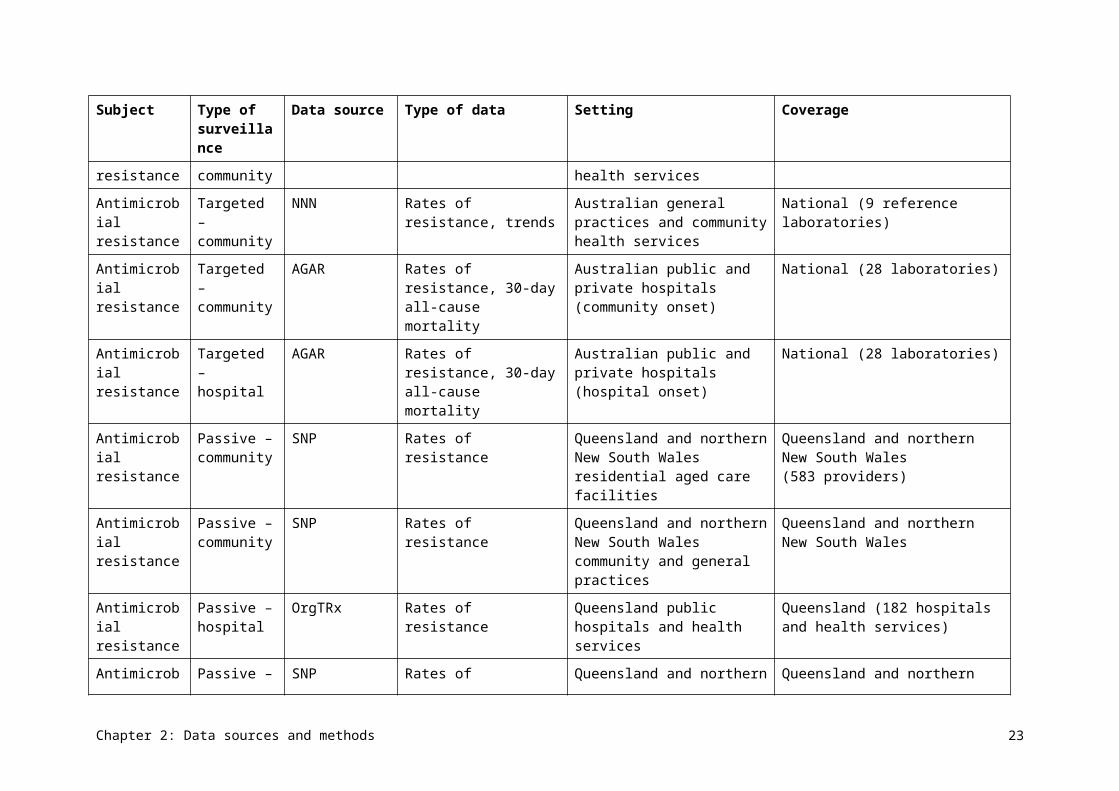
Figure 3.7 Macrolide usage rates, by jurisdiction (3-month moving average), 2010–14
ACT = Australian Capital Territory; DDD/1000 OBD = defined daily doses per 1000 occupied-bed days Source: National Antimicrobial Utilisation Surveillance Program report, 2014
Antimicrobial use by hospital peer group
Classifying hospitals by peer groupings enables hospitals to compare their data with similar institutions to identify variations in use and areas for improvement. Over time, surveillance through the Antimicrobial Use and Resistance in Australia (AURA) project and NAUSP will be able to be used to evaluate the effectiveness of interventions to improve AU.
Private hospitals were excluded from these analyses because the AIHW does not group private hospitals into these categories. Only four hospitals were in the small public acute group, and the data should not be considered representative.
All peer groups, except the small public hospitals, showed a decline in the use of aminoglycosides, third- and fourth-generation cephalosporins, fluoroquinolones and macrolides. Principal referral hospitals used less aminoglycosides, third- and fourth-generation cephalosporins, and macrolides than the large and medium public acute hospitals. However, by December 2014, prescribing rates were similar across these three peer groups. Principal referral hospitals used more fluoroquinolones than other peer groups, but also had
Chapter 3: Antimicrobial use and appropriateness 31
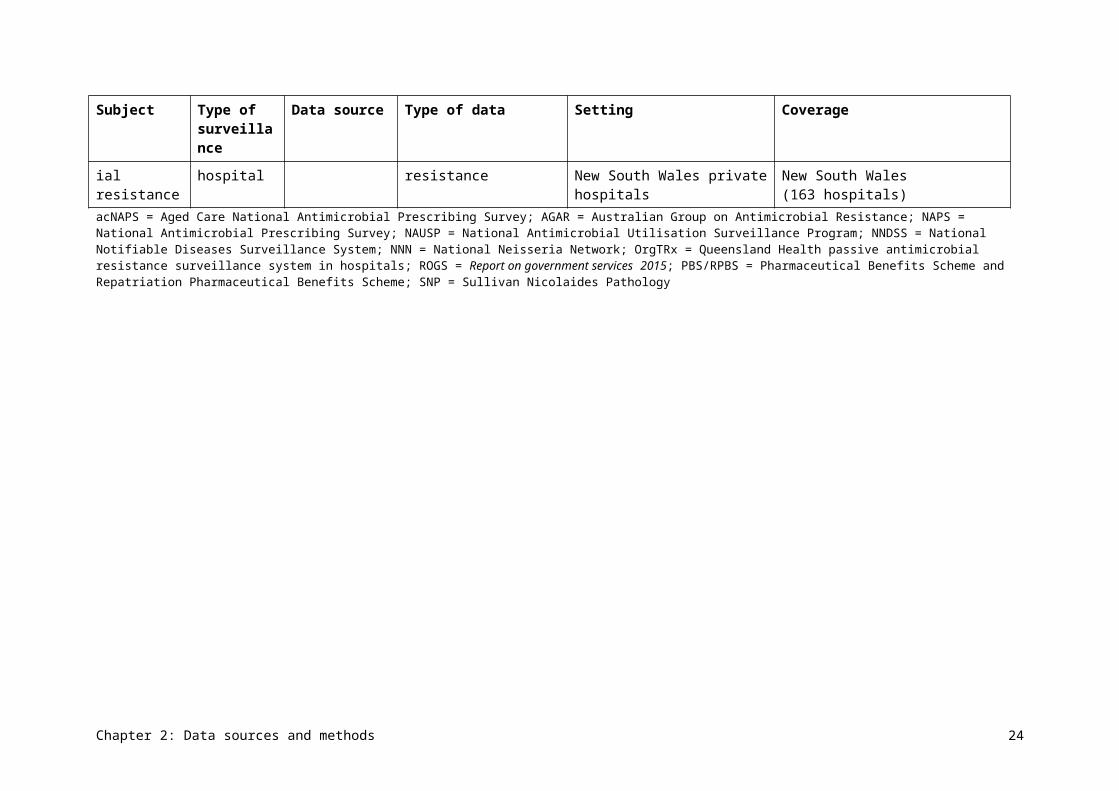
the largest decline in use. All groups showed a seasonal pattern for macrolides, with greatest use in the winter months.
All hospital peer groups, except the small public hospitals, showed a decline in the use of aminoglycosides, third- and fourth-generation cephalosporins, fluoroquinolones and macrolides.
Usage rates for aminoglycosides, third- and fourth-generation cephalosporins, fluoroquinolones and macrolides by peer group for 2010–14 are described further in Figure 3.8.
Figure 3.8 Usage rates for aminoglycosides, cephalosporins, fluoroquinolones and macrolides, by hospital peer group (3-month moving average), 2010–14
DDD/1000 OBD = defined daily doses per 1000 occupied-bed days Note: The drop in usage rates of third- and fourth-generation cephalosporins in November 2013 for the small public acute
group is related to low numbers (four hospitals) in this peer group from that year. In addition, a hospital that has very low usage rates of these agents began contributing to NAUSP in November 2013, which reduced the average usage rate.
Source: National Antimicrobial Utilisation Surveillance Program report, 2014
Because of the more complex casemix of the principal referral and large public acute hospitals, use of reserve-line agents such as colistin, daptomycin and linezolid is mostly confined to these hospitals. Usage rates for these agents have increased in the past four years, but remain low (less than 6 DDD/1000 OBD).
Chapter 3: Antimicrobial use and appropriateness 32
Appropriateness of prescribing in hospitals
In total, 19 944 prescriptions were included in NAPS 2014 for 12 634 patients. In 2013, there were 12 800 prescriptions for 7700 patients. Most hospitals (70.9%) conducted a single whole-hospital point prevalence survey or repeated point prevalence survey; other hospitals used surveys of particular wards or specialties (10.5%), randomly selected patients (9.3%), selected antimicrobials or indications (5.6%), and other methods (3.6%).
Analysis of hospitals that conducted a repeated point prevalence survey revealed the prevalence of AU to be 38.4%. This means that, on the day of the survey, 38.4% of patients were administered at least one antimicrobial. This is comparable with the values commonly cited in the literature (21.4–54.7%).19 There were no substantial differences in prevalence across the different hospital types.
On the day of the AU survey, 38.4% of hospital patients were administered at least one antimicrobial.
In hospitals, 24.3% of prescriptions were found to be noncompliant with guidelines, and 23.0% were deemed to be inappropriate. Of surgical prophylaxis prescriptions, 35.9% were continued beyond 24 hours (less than 5% is considered best practice). These findings were similar to those reported in the 2013 survey (Table 3.3). A more detailed breakdown of these results by state, peer group, remoteness and funding type is presented in AURA 2016: supplementary data.
In hospitals, 24.3% of prescriptions were found to be noncompliant with guidelines, and 23.0% were deemed to be inappropriate.
Chapter 3: Antimicrobial use and appropriateness 33
Table 3.3 Results for key indicators for all contributing facilities, 2013 and 2014
Key indicator Category Total prescriptions,
2013 (%)
Total prescriptions,
2014 (%)
Absolute change
from 2013 (%)
Relative change
from 2013 (%)
Indication documented in medical notes (best practice >95%)
na 70.9 74.0 +3.1 +4.4
Surgical prophylaxis given for >24 hours (best practice <5%)
na 41.8 35.9a –5.9 –14.1
Compliance with guidelines
Compliant with Therapeutic guidelines: antibiotic or local guidelines
59.7b 56.2b –3.5 –6.0
Compliance with guidelines
Noncompliant 23.0c 24.3c +1.3 +5.5
Compliance with guidelines
Directed therapyd na 10.4 na na
Compliance with guidelines
No guideline available
11.0 4.6 –6.4 –58.3
Compliance with guidelines
Not assessable 6.3 4.5 –1.8 –27.7
Appropriateness Appropriate (optimal and adequate)
70.8e 72.3e +1.5 +2.1
Appropriateness Inappropriate (suboptimal and inadequate)
22.9f 23.0f +0.1 +0.5
Appropriateness Not assessable 6.3 4.7 –1.6 –24.9na = not applicable a Where surgical prophylaxis was selected as the indication (2785 prescriptions)b Where compliance was assessable (15 899 prescriptions). If antimicrobial prescriptions marked ‘Directed therapy’, ‘No
guideline available’ or ‘Not assessable’ are excluded, the total prescriptions are 72.2% (2013) and 73.7% (2014).c Where compliance was assessable (15 899 prescriptions). If antimicrobial prescriptions marked ‘Directed therapy’, ‘No
guideline available’ or ‘Not assessable’ are excluded, the total prescriptions are 27.8% (2013) and 26.3% (2014).d Introduced in the 2014 survey as a new classification categorye Where appropriateness was assessable (18 998 prescriptions). If antimicrobial prescriptions marked ‘Not assessable’ are
excluded, the total prescriptions are 75.6% (2013) and 75.9% (2014).f Where appropriateness was assessable (18 998 prescriptions). If antimicrobial prescriptions marked ‘Not assessable’ are
excluded, the total prescriptions are 24.4% (2013) and 24.1% (2014).Source: National Antimicrobial Prescribing Survey report, 2014
The six most commonly prescribed antimicrobials in NAPS were cefazolin (11.1%), ceftriaxone (9.1%), metronidazole (6.5%), piperacillin–tazobactam (6.1%), amoxicillin–clavulanate (6.0%) and cephalexin (5.0%). The appropriateness of prescribing for these antimicrobials ranged from 50.1% to 76.9% (Table 3.4).
Chapter 3: Antimicrobial use and appropriateness 34
The quality of prescribing of cephalosporins was particularly poor, with 39.9% of cephalexin prescriptions (the sixth most commonly prescribed antimicrobial), 31.6% of cefazolin prescriptions and 30.6% of ceftriaxone prescriptions assessed as inappropriate. The majority of cefazolin prescriptions were for surgical prophylaxis (73.7%). Higher levels of appropriateness were seen for the narrower-spectrum antimicrobials, including flucloxacillin, benzylpenicillin, vancomycin and trimethoprim–sulfamethoxazole.
Higher levels of appropriateness were seen for the narrower spectrum antimicrobials, including flucloxacillin, benzylpenicillin, vancomycin and trimethoprim–sulfamethoxazole.
Table 3.4 Appropriateness of prescribing for the 20 most commonly prescribed antimicrobials, 2014
Rank Antimicrobial Prescriptions (number)
Appropriate (%)
Inappropriate (%)
Not assessable
(%)
1 Cefazolin 1908 66.0 31.6 2.4
2 Ceftriaxone 1558 64.8 30.6 4.6
3 Metronidazole 1114 65.8 27.7 6.5
4 Piperacillin–tazobactam 1052 76.9 19.5 3.6
5 Amoxicillin–clavulanate 1026 63.1 31.5 5.5
6 Cephalexin 853 50.1 39.9 10.1
7 Flucloxacillin 775 83.7 13.9 2.3
8 Amoxicillin/ampicillin 732 72.8 24.5 2.7
9 Doxycycline 674 74.3 21.5 4.2
10 Benzylpenicillin 556 83.8 14.7 1.4
11 Vancomycin 539 82.0 13.4 4.6
12 Azithromycin 524 64.9 32.1 3.1
13 Gentamicin 499 76.4 19.8 3.8
14 Nystatin 471 84.1 5.1 10.8
15 Ciprofloxacin 456 68.9 24.6 6.6
16 Trimethoprim–sulfamethoxazole
428 92.5 4.0 3.5
17 Trimethoprim 272 75.7 19.9 4.4
18 Clotrimazole 247 76.9 10.1 13.0
19 Valaciclovir 246 94.7 2.4 2.8
20 Fluconazole 234 88.0 6.4 5.6Note: Results only include surveys performed as a point prevalence survey, period prevalence survey or random sample
survey.Source: National Antimicrobial Prescribing Survey report, 2014
Chapter 3: Antimicrobial use and appropriateness 35
Appropriateness of indications
The most common indications for which antimicrobials were prescribed remained unchanged between 2013 and 2014. They were surgical prophylaxis (13.1%), community-acquired pneumonia (11.3%), medical prophylaxis (8.3%), urinary tract infections (6.7%) and cellulitis/erysipelas (4.4%).
In hospitals where data was collected in a suitable format for benchmarking, 23.0% of antimicrobial prescriptions (4585 prescriptions) were deemed to be inappropriate. Of these, 53.1% were suboptimal and 46.9% were inadequate. See AURA 2016: supplementary data for levels of appropriateness of prescribing for the 20 most common indications.
Table 3.5 shows the indications for which antimicrobials were the most inappropriately prescribed (more than 30% inappropriateness).
Table 3.5 Indications for which antimicrobials were most inappropriately prescribed (>30% inappropriateness), 2014
Indication Prescriptions (number)
Appropriate (%)
Inappropriate (%)
Not assessable (%)
Asthma: infective exacerbation
40 30.0 70.0 0.0
Bronchitis 75 46.7 50.7 2.7
Surgical prophylaxis 2246 56.9 40.2 2.9
COPD: infective exacerbation
552 62.3 36.8 0.9
Fever/pyrexia of unknown origin
67 50.7 34.3 14.9
Conjunctivitis 83 65.1 33.7 1.2
Bronchiectasis 107 66.4 31.8 1.9
Deep soft tissue infection 32 65.6 31.3 3.1
Pancreatitis 42 69.0 31.0 0.0
Colitis 52 67.3 30.8 1.9COPD = chronic obstructive pulmonary disease Note: Results only include surveys performed as a point prevalence survey, period prevalence survey or random sample
survey. Indications marked as ‘unknown’ or ‘other’ have been excluded. Number of prescriptions included was 15 967. For simplicity, indications with fewer than 30 prescriptions are not displayed but are included in the data analysis.
Source: National Antimicrobial Prescribing Survey report, 2014
Surgical prophylaxis remains a significant concern, with 40.2% of these prescriptions assessed as inappropriate, mainly because of incorrect duration (39.7%), incorrect dose or frequency (15.7%), or absence of an indication for an antimicrobial (22.9%). Figure 3.9 shows the agents used for surgical prophylaxis and those considered inappropriate. Although most of the inappropriate prescribing was attributable to excessive duration, some of it was attributable to inappropriate choice of agents.
Surgical prophylaxis remains a significant concern, with 40.2% of these prescriptions assessed as inappropriate.
Chapter 3: Antimicrobial use and appropriateness 36
Figure 3.9 Agents used for (A) surgical prophylaxis overall and (B) when prescribed inappropriately, 2014
Source: National Antimicrobial Prescribing Survey, 2014
As in 2013, antimicrobials for infective exacerbation of chronic obstructive pulmonary disease (COPD) were also poorly prescribed (36.8% deemed to be inappropriate), as were antimicrobials for other respiratory tract infections, including bronchitis (50.7% inappropriate) and exacerbation of asthma (70.0% inappropriate).
Reasons for inappropriateness of prescribing
Table 3.6 shows the reasons for inappropriate prescribing of those antimicrobials most inappropriately prescribed (that is, more than 30% inappropriateness). The main reasons for
Chapter 3: Antimicrobial use and appropriateness 37
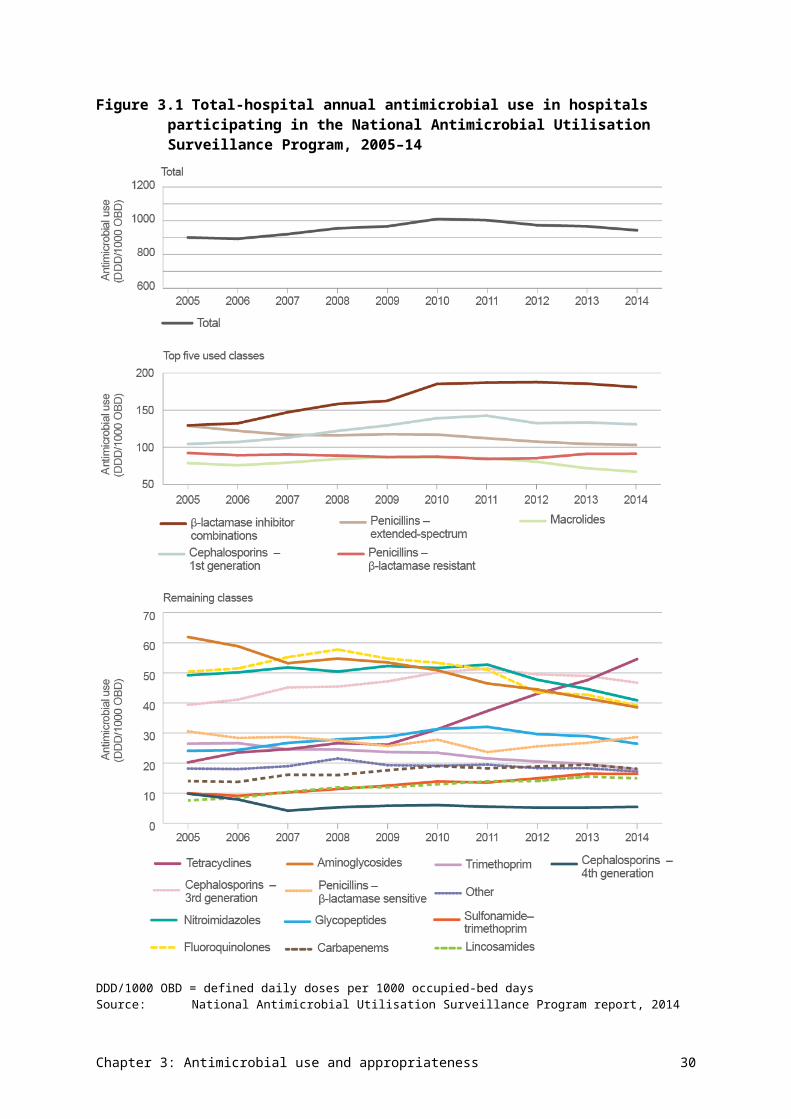
inappropriate prescribing were that an antimicrobial was not indicated, the spectrum was too broad, the duration of therapy was incorrect, or the dose or frequency was incorrect.
The main reasons for inappropriate prescribing were that an antimicrobial was not indicated, the spectrum was too broad, the duration of therapy was incorrect, or the dose or frequency was incorrect.
Table 3.6 Reasons for inappropriate prescribing, 2014
Reason Reason found (%) Reason not found (%)
Not specified (%)
Antimicrobial not indicated 26.4 47.7 25.8
Spectrum too broad 20.6 54.3 25.1
Incorrect duration 18.8 57.3 23.9
Incorrect dose or frequency 18.3 59.0 22.7
Microbiology mismatch 6.4 93.6 0.0
Spectrum too narrow 5.9 66.9 27.2
Incorrect route 4.9 70.3 24.9
Allergy mismatch 2.2 97.8 0.0Source: National Antimicrobial Prescribing Survey report, 2014
Indications with high levels of inappropriate prescribing were similar to indications with high levels of noncompliance with guidelines. See AURA 2016: supplementary data for details of compliance with guidelines for the 20 most common indications. Overall, 24.3% of antimicrobial prescriptions (4839 prescriptions) were noncompliant with guidelines. Of these, 26.7% were still deemed to be appropriate and 72.1% were inappropriate. The most common reasons for noncompliance were spectrum too broad (23.3%), antimicrobial not indicated (22.7%), incorrect dose or frequency (20.1%), and incorrect duration (16%). Surgical prophylaxis and infective exacerbation of COPD were the conditions for which prescribing was most commonly deemed to be noncompliant with guidelines.
From information to action Using surveillance data to guide antimicrobial stewardshipA large principal referral hospital in New South Wales has been participating in the National Antimicrobial Utilisation Surveillance Program (NAUSP) since 2004. The 2007–08 NAUSP report showed that, of the 27 participating hospitals, this hospital recorded one of the highest usage rates for ceftriaxone/cefotaxime.
Because NAUSP data provides a benchmark against other hospitals in the same Australian Institute of Health and Welfare peer group, the hospital could compare its prescribing practices with similar hospitals, and develop strategies to address inappropriate prescribing. These actions included using formulary restrictions that require approval from an infectious diseases specialist or a microbiologist before dispensing restricted agents.
The hospital also uses NAUSP data as a tool for evaluating the effectiveness of its antimicrobial stewardship (AMS) interventions, by analysing longitudinal use trends. The data illustrated the need for effective, sustainable AMS strategies, which led to discussions being held with the hospital’s
Chapter 3: Antimicrobial use and appropriateness 38
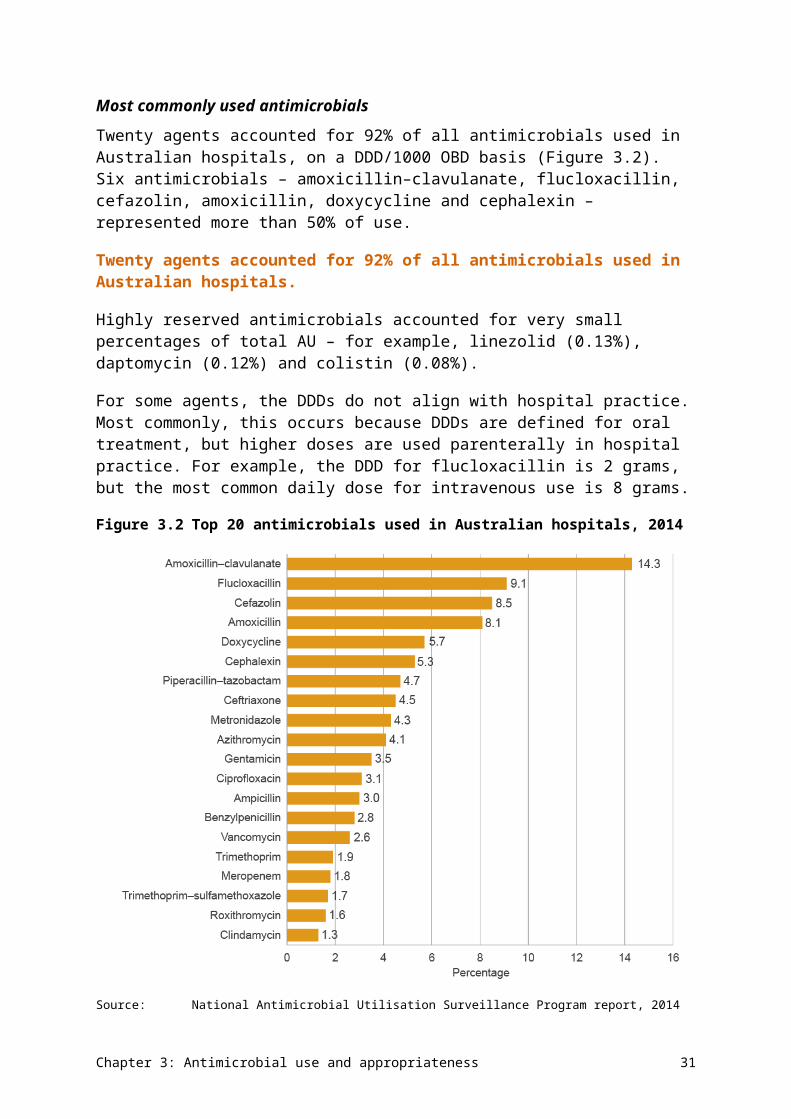
AMS committee, the hospital executive and the Local Health District. Accurate data, clearly presented using dashboards, secured the executive’s sponsorship of the AMS strategies.
Importantly, these strategies demonstrate that the hospital is meeting the requirements of Standard 3 of the National Safety and Quality Health Service Standards.
The hospital saw significant improvement in the appropriate use of ceftriaxone/cefotaxime and moxifloxacin in the following year (see Figure A).
Figure A The hospital’s use of ceftriaxone/cefotaxime and moxifloxacin, 2007–08 and 2008–09
DDD/1000 OBD = defined daily doses per 1000 occupied-bed days
Over time, other strategies were initiated, with prescriptions for broad-spectrum ceftriaxone and moxifloxacin replaced with narrow-spectrum penicillin. Sustainable improvements in use of these agents have been seen over several years (Figure B).
Chapter 3: Antimicrobial use and appropriateness 39
Figure B The hospital’s trend for broad-spectrum ceftriaxone and moxifloxacin, and narrow-spectrum penicillin, November 2005 to October 2011
AMS = antimicrobial stewardship; DDD/1000 OBD = defined daily doses per 1000 occupied-bed days
Commentary
Overall antimicrobial use
Australia’s antimicrobial consumption in hospitals has gradually declined since its peak in 2010, with a 6.4% reduction in total AU in the five years from 2010 to 2014. This can partly be explained by the voluntary nature of the data collection and the increase in the number of contributing hospitals during the period, as well as the inclusion of a larger number of medium and small hospitals with lower consumption rates.
Other factors that would have contributed to the reduction in AU seen in this data include:
• local, state and national AMS initiatives
• changes in clinical practice, and more effective adoption of recommendations in version 14 of Therapeutic guidelines: antibiotic, released in 201020
• variations in World Health Organization (WHO)–defined DDDs and the doses currently used in clinical practice (although, in most cases, variations led to falsely increased usage rates).
The largest decreases in usage rates between 2013 and 2014 were seen for the following antimicrobials (the decreases are shown in brackets):
• aminoglycosides (7.4%)
• fluoroquinolones (8.6%)
Chapter 3: Antimicrobial use and appropriateness 40
• macrolides (6.5%)
• metronidazole (8.8%).
One reason for the decrease in aminoglycoside use could be the implementation of new recommendations for empirical aminoglycoside use in Therapeutic guidelines: antibiotic, version 14 (2010), which advocates for cessation of aminoglycosides after 48–72 hours if culture results do not support their ongoing use.20 The lower usage rate for aminoglycosides in Victoria may be associated with the recommendations from a 2008 Victorian coroner’s report following a death attributed to gentamicin administration.21
Variation in antimicrobial use
There is large variation in the rate of use of antimicrobials between Australian states, both within and across different hospital peer groups. Some variation in AU is expected due to differences in factors such as casemix and local resistance patterns. Understanding variation is critical to improving the quality, value and appropriateness of AU, but there is currently insufficient evidence to identify which factors are driving variation in volumes and patterns of AU in Australian hospitals. This would be a useful area of review to optimise clinical and prescribing practice.
Understanding variation is critical to improving the quality, value and appropriateness of AU, but there is currently insufficient evidence to identify which factors are driving variation in volumes and patterns of AU in Australian hospitals.
Consumption of broader-spectrum and reserve-line antimicrobial agents is higher in settings with a more complex patient mix; usage rates across most classes of these antimicrobials are 2–3 times higher than for smaller hospitals. However, principal referral hospitals had the lowest usage rates of third- and fourth-generation cephalosporins and macrolides. These variations may reflect different prescribing practices, local susceptibility patterns and the effect of local or state AMS activities.
Twenty agents accounted for 92% of antimicrobial consumption on a DDD basis. Six antimicrobials – amoxicillin–clavulanate, flucloxacillin, cefazolin, amoxicillin, doxycycline and cephalexin – represented more than 50% of antimicrobials supplied. These findings are consistent with those of NAPS, which listed these six drugs (along with ceftriaxone, metronidazole, piperacillin–tazobactam and benzylpenicillin) in the top 10 most commonly prescribed antimicrobials.
Among antibacterial classes, penicillin – β-lactamase inhibitor combinations had the highest rate of use, followed by first-generation cephalosporins, extended-spectrum penicillins, β-lactamase-resistant penicillins and macrolides.
Macrolide antimicrobials show the most seasonal variation in usage rates, with peak use across the winter months. To a lesser degree, this trend is also observed with third-generation cephalosporins. Azithromycin is now the dominant macrolide used in Australian hospitals. The interstate variation in macrolide usage rates may be related to differing prescribing patterns for the treatment of community-acquired pneumonia.
Use of reserve-line antimicrobials has doubled in principal referral hospitals in the past four years. However, rates remain low (less than 6 DDD/1000 OBD).
Chapter 3: Antimicrobial use and appropriateness 41
Appropriateness of prescribing
Australian hospitals use more broad-spectrum agents (such as penicillin – β-lactamase inhibitor combinations and cephalosporins) than their counterparts in three northern European countries.15 Data from the 2014 NAPS shows between 50.1% and 76.9% appropriateness of prescribing for these antimicrobials. Cephalosporins were the most commonly prescribed antibacterial group in NAPS, accounting for around a quarter of AU – in particular, cefazolin (11.1%) and ceftriaxone (9.1%). The appropriateness of prescribing of oral cephalexin – the sixth most commonly prescribed antimicrobial – is a particular concern, with 39.9% of these prescriptions deemed to be inappropriate.
Overall, 23.0% of prescriptions in NAPS were considered inappropriate. The most common reasons for inappropriate prescribing were that antimicrobials were used unnecessarily for the given indication or for the required spectrum of activity. Inappropriate prescribing was very common for some respiratory infections – in particular, infective exacerbation of COPD, infective exacerbation of asthma, and bronchitis. Surgical prophylaxis and infective exacerbation of COPD were the conditions for which prescribing was most commonly deemed to be noncompliant with guidelines.
Surgical prophylaxis was the most common indication for AU, with no change since 2013. This is a significant concern, with 40.2% of prescriptions deemed to be inappropriate. The most common reasons were an inappropriately extended duration of AU (39.7%) and absence of an indication for an antimicrobial (22.9%).
Gaps and improvements
Reviewing defined daily doses
The DDD/1000 OBD measure is an accepted metric in international surveillance programs for AU rates, and enables benchmarking between institutions. However, it does not account for patient variability, actual dose administered or individual patient exposure. WHO-defined DDDs often differ from doses used in Australian clinical practice, which can either increase or decrease the DDD/1000 OBD measure. For example, the DDD for flucloxacillin is 2 grams per day (appropriate for oral use), but treatment regimens of 8 grams per day are administered intravenously for serious infections. This may partly explain why flucloxacillin had the second highest rate of use for individual antibacterials in the NAUSP data (9.1%), but was seventh highest in NAPS (4.5%).
DDD rates do not take into account the casemix or infection rates for OBDs in hospitals. This could be overcome by adjusting for the proportion of cases with pneumonia, sepsis or surgery.
A further limitation of the DDD measure is the lack of definitions for paediatric populations, in which daily doses depend on the age and weight of the child. This currently prevents incorporation of antimicrobial data relating to children into NAUSP. Further research is required to determine whether DDD/1000 OBD is a good measure for correlation with antimicrobial-associated risks.22-24 The development of a set of Australian DDDs would make the data more meaningful for local use.
Expanding reporting for NAUSP
NAUSP reports overall hospital use and intensive care use,25 as well as providing benchmarking reports of de-identified data at state level. This reporting could be improved by
Chapter 3: Antimicrobial use and appropriateness 42
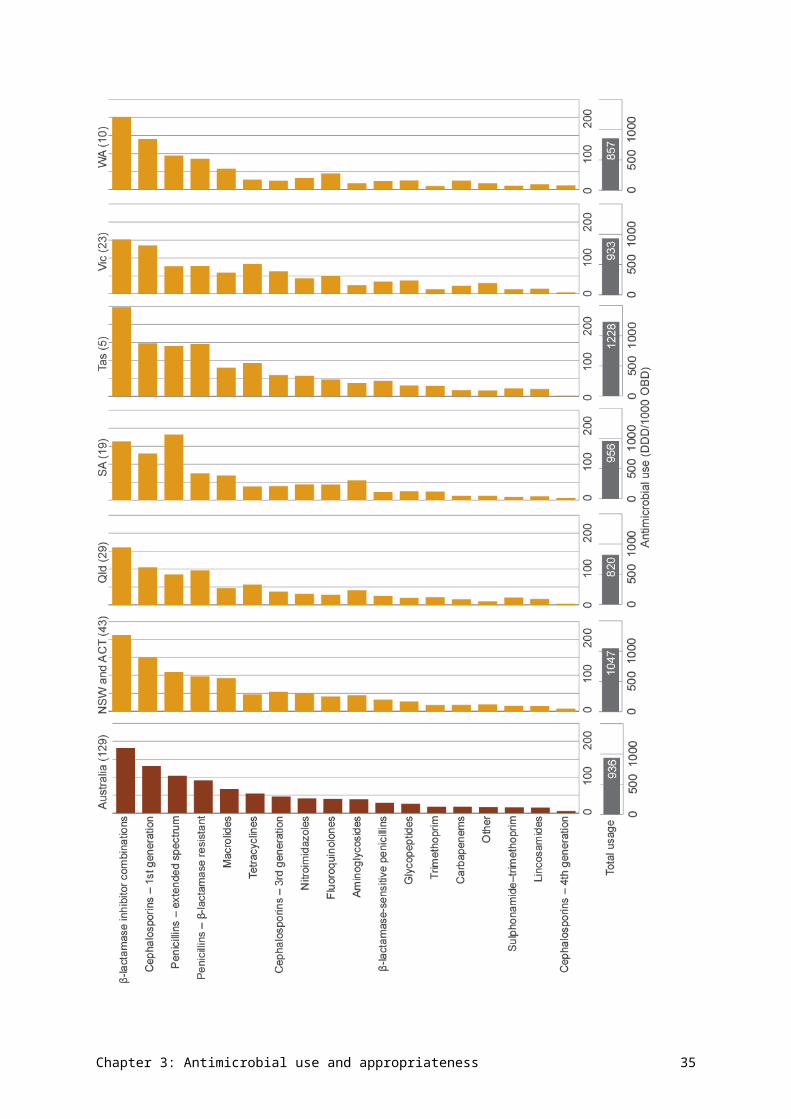
reporting at ward or unit level, particularly in areas that have higher use, such as oncology/haematology, transplant and renal units.
Currently, NAUSP collects usage data from only acute-care hospitals. As factors contributing to resistance selection are further investigated, surveillance activities conducted by NAUSP may need to be expanded to include other areas – for example, use of topical antimicrobials, and AU in outpatient settings and mental health units. Future reports may also be expanded to include antimycobacterial, antifungal and antiviral agents, which are currently being collected in the hospital NAPS.
Increasing hospital participation in NAPS and NAUSP
Benchmarking and comparison with hospitals in the same peer group, or as part of a healthcare network, can promote local analysis of prescribing practices and strategies to promote appropriate AU. Although there has been a substantial increase in hospitals contributing data in 2014 (covering 82% of acute public hospital beds) compared with 2010, inclusion of a greater number of smaller public hospitals and private hospitals will offer further opportunities to inform AMS. Specific efforts will therefore be made to increase the number of participants in these groups, providing a more accurate representation of AU and meaningful feedback to these services.
As participation in NAPS and NAUSP is voluntary, the Commission will continue to work with SA Health, the National Centre for Antimicrobial Stewardship, and states and territories to increase participation in these programs, and promote their relevance and practical use.
From information to actionImproving appropriateness of prescribing in a small rural health serviceA rural Victorian multipurpose service (MPS) uses the National Antimicrobial Prescribing Survey (NAPS) for its antimicrobial stewardship (AMS) program. This MPS is a network of three facilities that each have 15 beds or fewer, and provides integrated acute health, community health, and community and aged care residential services. It is a small healthcare provider with one infection control officer for the service.
Since there is no local pharmacist, infectious diseases specialist or on-site doctor, NAPS is at the forefront of this MPS AMS program. NAPS is used to promote benchmarking across the three sites, and compare results, share knowledge, and exchange ideas and strategies on AMS with a small network of healthcare providers in the region. The service also uses the assistance provided by the National Centre for Antimicrobial Stewardship for rural and remote facilities, including over-the-phone consultations to support audits.
The MPS used its 2014 NAPS data to provide its visiting medical officers with feedback on their prescribing practices, and successfully drove a cultural change to eliminate inappropriate prescribing, such as using ceftriaxone as a first-line drug. Both appropriateness of prescribing and compliance with Therapeutic guidelines: antibiotic increased significantly within one year (Figure A), and the service reported 100% compliance and appropriateness in the 2015 NAPS (results not yet published).
Chapter 3: Antimicrobial use and appropriateness 43
Figure A Appropriateness of antimicrobial prescribing at the Victorian multipurpose service, NAPS results for 2014 and 2015
Sources: National Antimicrobial Prescribing Survey; multipurpose service records
3.2 Antimicrobial use in the community – primary care
This section includes data on the level of AU in the community; AU stratified by age, antimicrobial class and prescriber type; variation in AU across Australia; and appropriateness of AU. Data on use in primary care primarily relates to antibacterial use.
Antimicrobial use in primary care
The volume of AU is derived from the Australian Government Department of Human Services pharmacy claim records of prescriptions dispensed under the Pharmaceutical Benefits Scheme (PBS) and Repatriation Pharmaceutical Benefits Scheme (RPBS), and the Drug Utilisation Sub Committee database. The 2014 data is from January to December 2014. It includes dispensing data on antimicrobials prescribed by general practitioners, specialists and approved nonmedical prescribers in the community, as well as prescriptions written in public hospitals for outpatients and patients on discharge from hospital, and for inpatients of private hospitals. There are some small differences in the ATC classifications used by the Drug Utilisation Sub Committee database and the PBS, resulting in a variance in total prescription numbers of around 3%.
Information on variation in prescribing across local areas, and states and territories, and according to socioeconomic status, was obtained from two sources: the Australian atlas of healthcare variation26 and the MedicineInsight program.27 MedicineInsight data was also used to identify the usage patterns of seven antimicrobials commonly used in general practice, and to assess appropriateness of prescribing against recommended treatments in Therapeutic guidelines: antibiotic20 and quality indicators developed by the European Surveillance of Antimicrobial Consumption (ESAC).28
Chapter 3: Antimicrobial use and appropriateness 44
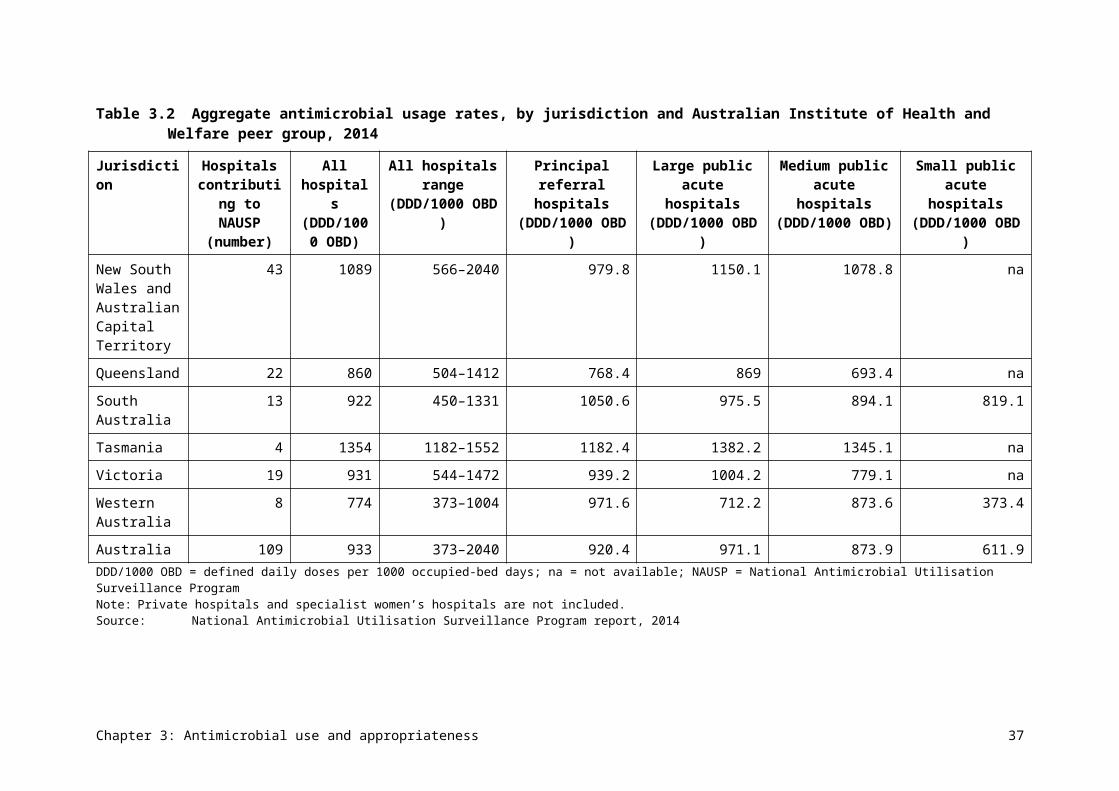
Volume of antimicrobial use
In 2014, around half (46%) of the Australian population (n = 10 718 638) had at least one antimicrobial dispensed under the PBS/RPBS. Of these, 19% had one antimicrobial dispensed, and 3.2% had more than six antimicrobial prescriptions dispensed, including repeats.
The supply of PBS/RPBS systemic antimicrobials in 2014 totalled 27 354 627 prescriptions, which equated to 23.8 DDD/1000 inhabitants/day or 1164 prescriptions/1000 inhabitants (Figure 3.10). This was a 4.4% increase in DDD/1000 inhabitants/day compared with 2013. A further 2 666 937 prescriptions were supplied for nonsystemic (topical) preparations, making a total of 30 021 564 prescriptions (1278 prescriptions/1000 inhabitants) for antimicrobials. Total antimicrobial prescriptions include all ATC codes listed in AURA 2016: supplementary data.
Figure 3.10Volume of antimicrobials dispensed under the PBS/RPBS per year, 1994–2014
DDD = defined daily dose; PBS = Pharmaceutical Benefits Scheme; RPBS = Repatriation Pharmaceutical Benefits SchemeNotes: 1. J01 is the ATC code for antibacterials for systemic use.2. Before April 2012, includes estimates of under co-payment and private dispensing; after April 2012, includes actual under
co-payment data, but no estimate from private dispensing. The DDD/1000 inhabitants/day exclude some items for which there is no DDD.
Source: Drug Utilisation Sub Committee database, October 2015
Figure 3.11 shows the distribution of classes of systemic antimicrobials dispensed in 2014. Extended-spectrum penicillins represent the largest group by number of prescriptions dispensed in 2014 (22%), followed by first-generation cephalosporins (21%) and penicillin – -lactamase inhibitor combinations (18%).
Chapter 3: Antimicrobial use and appropriateness 45
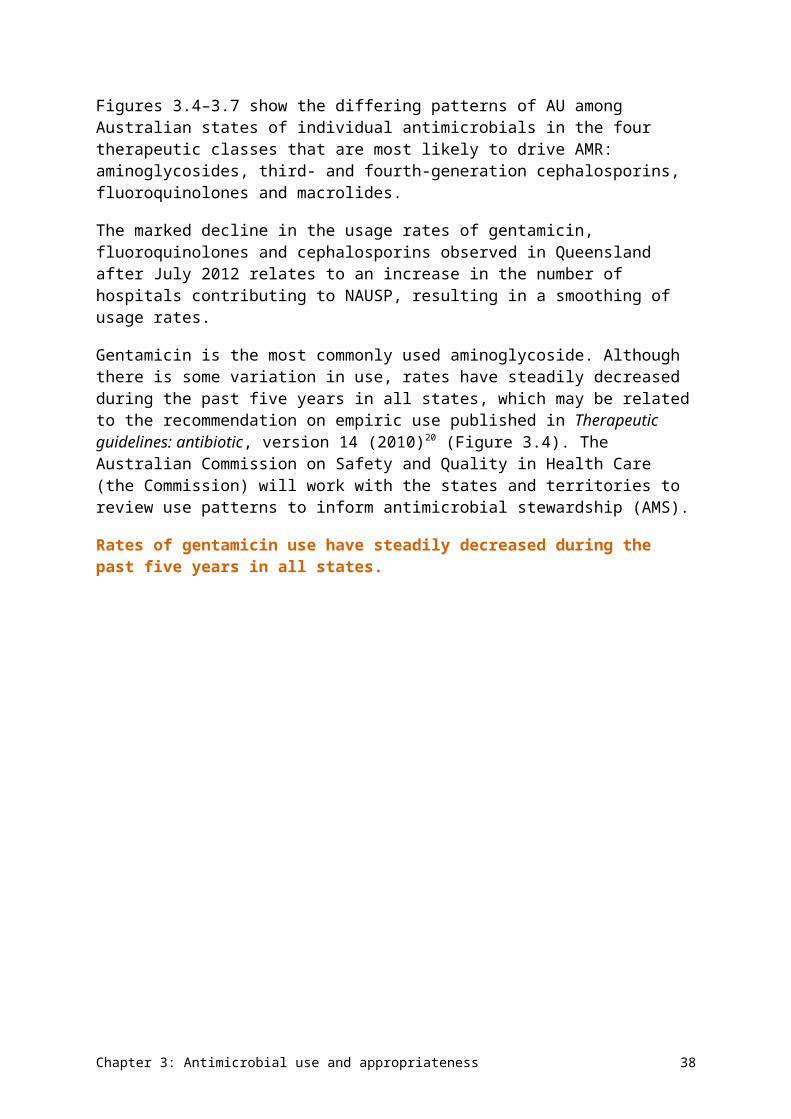
Figure 3.11Systemic antimicrobial dispensing, by class, 2014
Note: Includes actual under co-payment data, but no estimate from private dispensingSource: Department of Human Services pharmacy claim database, October 2015
The 11 most commonly dispensed antimicrobials accounted for 84% of all AU in 2014 (Table 3.7).
Table 3.7 The 11 most commonly supplied antimicrobials, by number of prescriptions, 2013 and 2014
Antimicrobial 2013 prescriptions
2014 prescriptions
2013 prescriptions/
1000 inhabitants
2014 prescriptions/
1000 inhabitants
Change, 2013 to
2014 (%)
Amoxicillin 5 665 810 5 870 123 244 249 3.5
Cephalexin 5 413 046 5 549 606 234 236 2.5
Amoxicillin–clavulanate
4 512 149 4 897 449 195 208 7.9
Roxithromycin 1 826 038 1 851 821 78 78 1.4
Doxycycline 1 804 790 1 900 200 78 80 5.0
Chloramphenicol 1 353 514 1 167 191 58 49 –16.0
Clarithromycin 932 640 949 562 40 40 1.8
Trimethoprim 899 007 920 857 38 39 2.4
Erythromycin 856 504 841 350 37 35 –1.8
Cefaclor 674 772 636 619 29 27 –6.0
Flucloxacillin 647 641 694 076 27 29 6.7
Chapter 3: Antimicrobial use and appropriateness 46
Note: Includes actual under co-payment data, but no estimate from private dispensingSource: Drug Utilisation Sub Committee database, October 2015
The large decrease in chloramphenicol prescriptions dispensed can be explained by the change in supply of eye drops and eye ointment from prescription-only to pharmacist-only in May 2010.29 Pharmacist supply is not included in the analysis.
Figure 3.12 presents the quarterly number of prescriptions for five agents, three with prominent seasonal variation (amoxicillin, amoxicillin–clavulanate and roxithromycin), and two with no seasonal variation (cephalexin and trimethoprim). The three with prominent seasonal variation are the three commonest agents dispensed for the treatment of respiratory tract infections. Cephalexin is largely used for skin and soft tissue infection, and trimethoprim is used exclusively for the treatment and prevention of lower urinary tract infections.
Figure 3.12The five most commonly supplied antimicrobials, by number of prescriptions and quarter, 1994–2014
Note: Before April 2012, includes estimates of under co-payment and private dispensing; after April 2012, includes actual under co-payment data, but no estimate from private dispensing
Source: Drug Utilisation Sub Committee database, October 2015
Chapter 3: Antimicrobial use and appropriateness 47
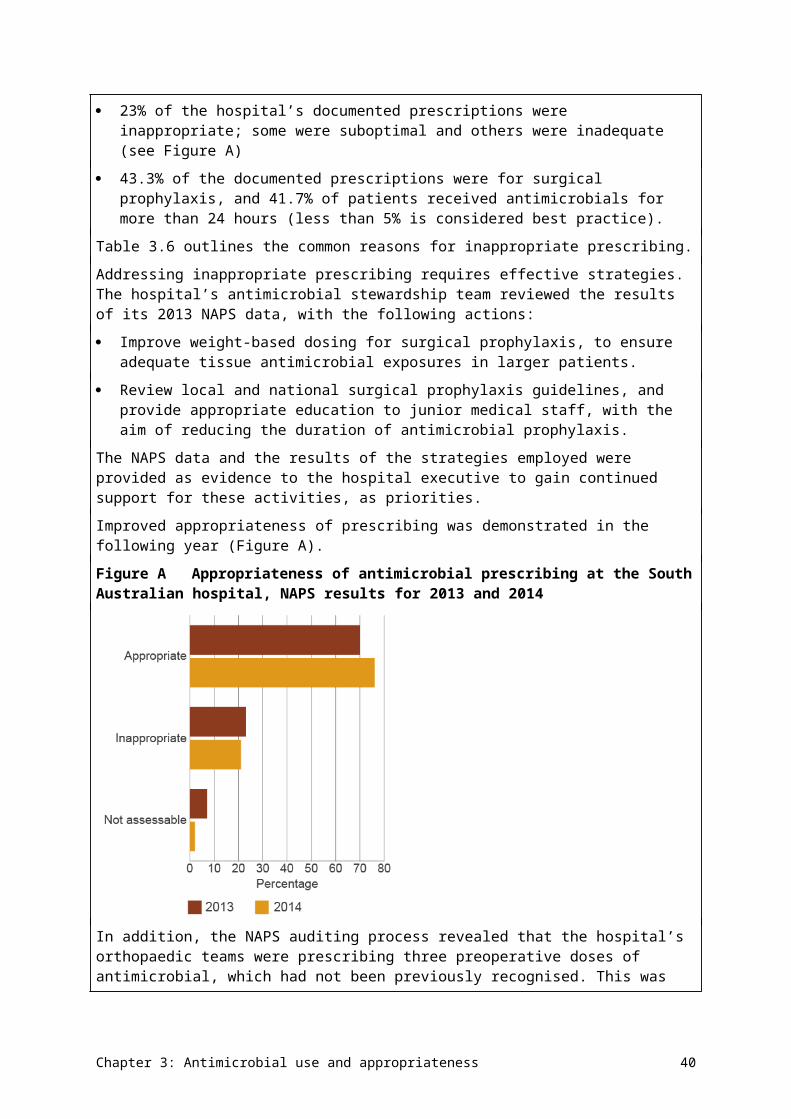
Figure 3.13The 10 most commonly supplied antimicrobials, by number of prescriptions, 1994–2014
Note: Before April 2012, includes estimates of under co-payment and private dispensing; after April 2012, includes actual under co-payment data, but no estimate from private dispensing
Source: Drug Utilisation Sub Committee database, October 2015
Averaging data over one year (four-quarter rolling average, Figure 3.13) shows the trends in the 10 most commonly supplied systemic antibacterial agents. Over the past 20 years, there have been substantial increases in the consumption of cephalexin, amoxicillin–clavulanate,
Chapter 3: Antimicrobial use and appropriateness 48
clarithromycin and trimethoprim. The increase in cephalexin consumption was initially driven by a nationally distributed warning about the potential hepatotoxicity of flucloxacillin in the early 1990s, but use of cephalexin has continued to rise even as flucloxacillin use rose again from its lowest level in 2003. Trimethoprim has slowly supplanted the trimethoprim–sulfamethoxazole combination for the treatment and prevention of urinary tract infection. Substantial decreases have occurred in the consumption of cefaclor and erythromycin. It is likely that cefaclor has fallen out of use because of its rate of adverse drug reactions in children, and the availability of other agents with paediatric formulations for the treatment of respiratory tract infection. Erythromycin use has declined as a result of increasing availability of other macrolides that are better tolerated (roxithromycin) or targeted at respiratory tract infection (clarithromycin, which was first marketed in 1998).
During this period, public hospital pharmaceutical reforms were introduced that allow public hospitals to supply outpatient and discharge prescriptions under the PBS. This may have influenced the trends of AU to a small extent. In 2013, public hospital pharmacies accounted for 1% of antimicrobial prescriptions supplied, and private hospital pharmacies a further 1%.30
Use by age
Antimicrobials were most often dispensed for very young people and older people. In 2014, 57% of those aged 0–4 years, 60% of those aged 65 years or over, and 74% of people aged 85 years or over were supplied at least one antimicrobial (Figure 3.14). These proportions have been consistent over several years. AU in all age groups is higher during the winter months.
Antimicrobials were most often dispensed for very young people and older people.
Figure 3.14Antimicrobial use, by age group, 2014
Notes: 1. Percentage of people supplied at least one PBS/RPBS antimicrobial in 2014; age standardised, based on estimated resident
population by age at 30 June 201431
2. Includes actual under co-payment data, but no estimate from private dispensingSource: Department of Human Services pharmacy claim database, October 2015
Chapter 3: Antimicrobial use and appropriateness 49
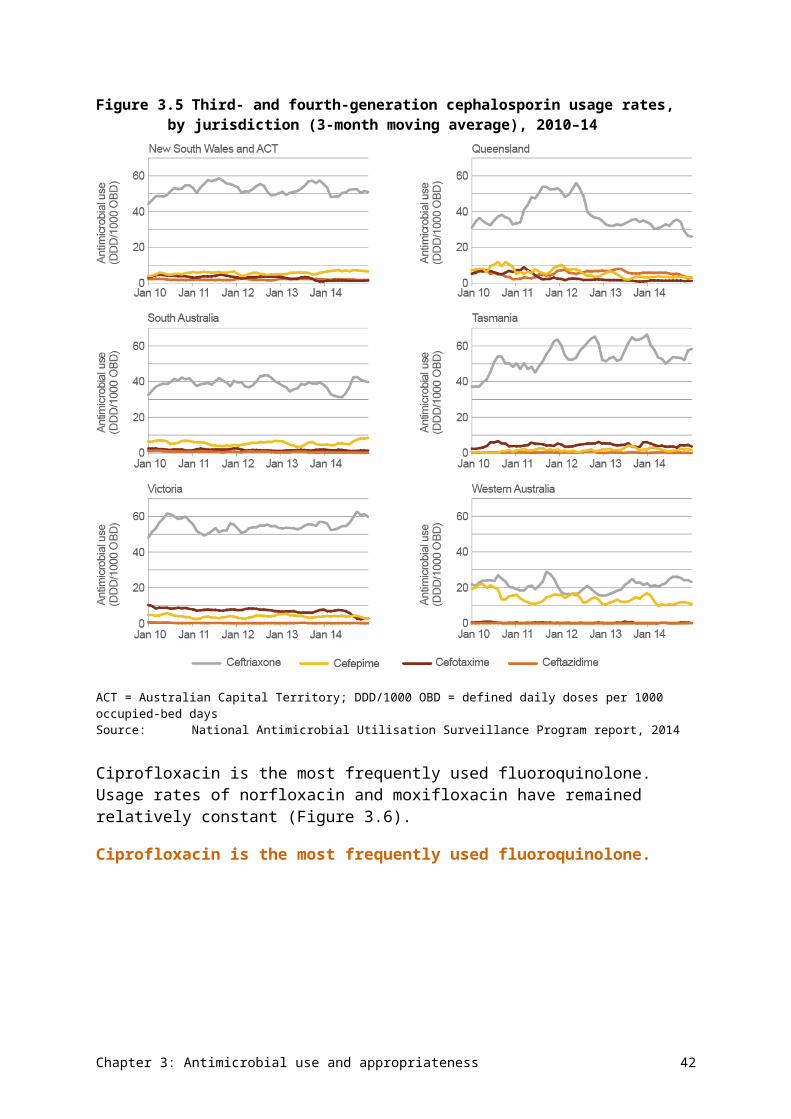
Figure 3.15 presents data on dispensing of the four highest used therapeutic groups by age group. Twice the number of children aged 0–9 years were dispensed extended-spectrum penicillins than other age groups, whereas patients older than 65 years were dispensed two to three times more first-generation cephalosporins than younger patients. A similar pattern of prescribing was seen for macrolides and penicillin – β-lactamase inhibitor combinations, with patients older than 65 years dispensed more prescriptions than younger patients. Individual figures for the 11 most commonly dispensed antimicrobials by age group are provided in AURA 2016: supplementary data.
Chapter 3: Antimicrobial use and appropriateness 50
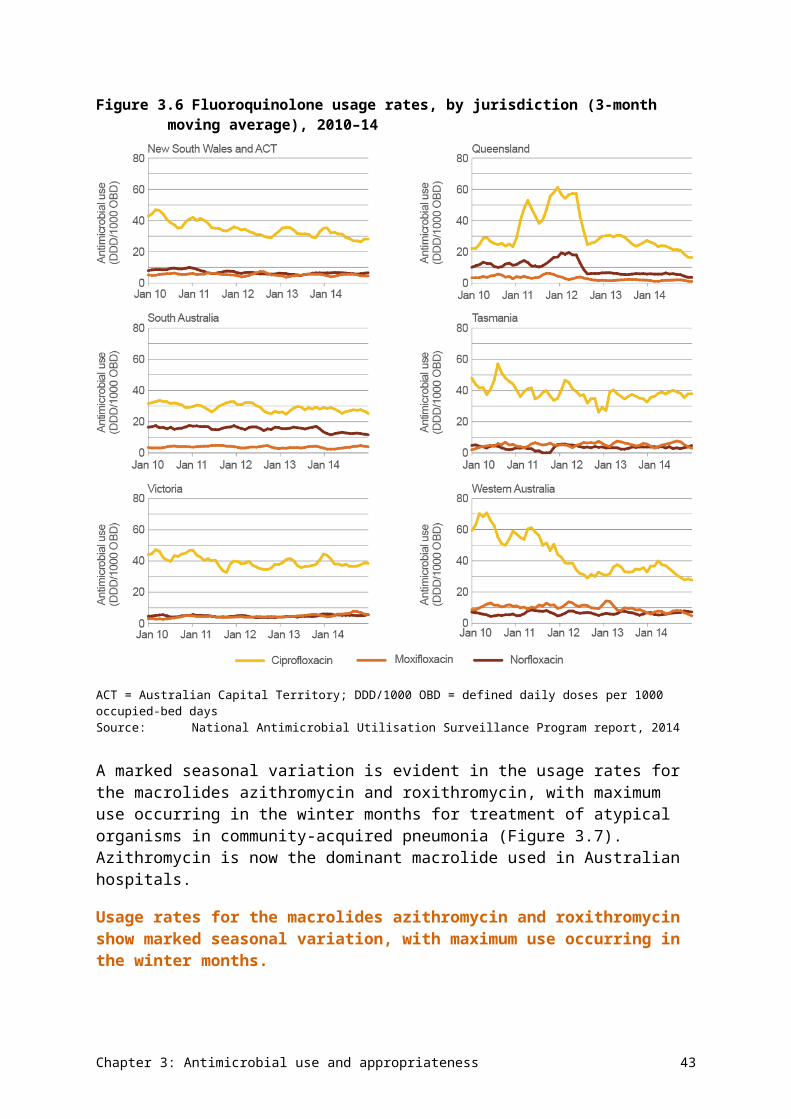
Figure 3.15Use of antimicrobial groups, by age group (3-point moving average), 2012–14
Note: Includes actual under co-payment data, but no estimate from private dispensingSource: Department of Human Services pharmacy claim database, October 2015
Chapter 3: Antimicrobial use and appropriateness 51
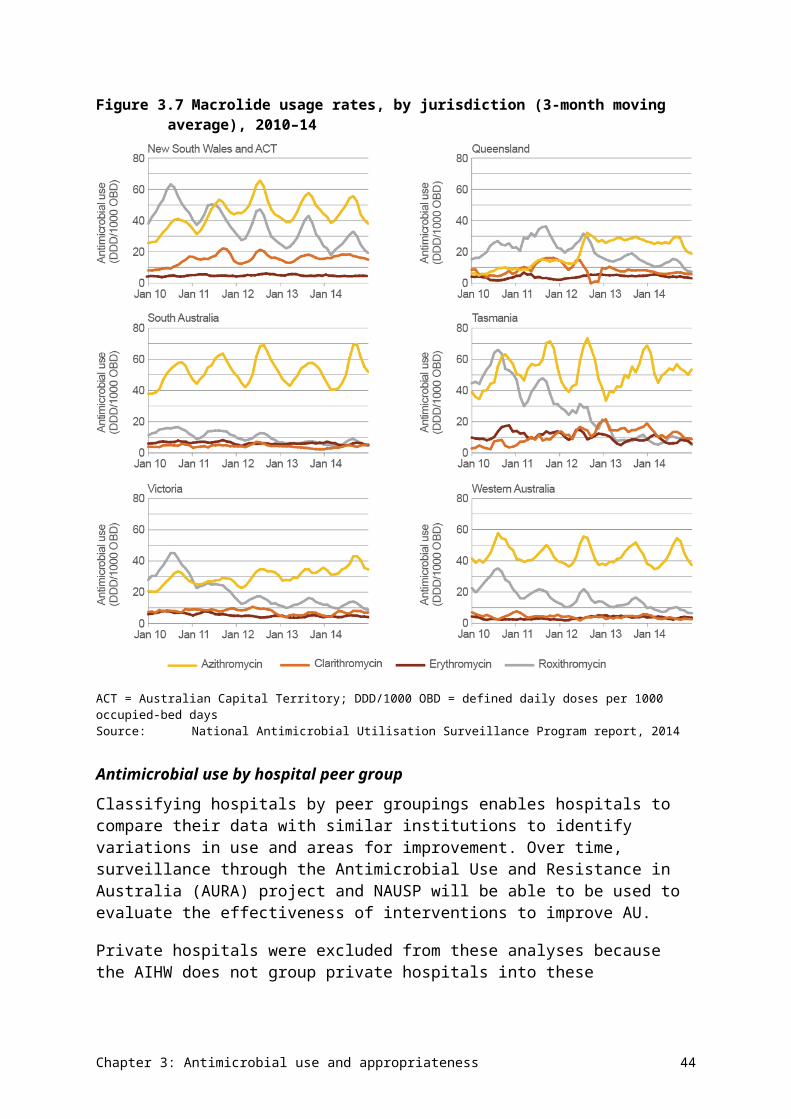
Use by therapeutic group
The relative contribution of each antimicrobial group has not changed markedly during the past 20 years (Figure 3.16). Penicillins continue to be the largest contributor to overall use (44% in 2014 compared with 46% in 1994).
Figure 3.16Systemic antimicrobial prescriptions dispensed, by therapeutic group, 1994–2014
Notes: 1. ‘Other antimicrobials’ include amphenicols and aminoglycosides.2. Before April 2012, includes estimates of under co-payment and private dispensing; after April 2012, includes actual under
co-payment data, but no estimate from private dispensingSource: Drug Utilisation Sub Committee database, October 2015
Of the penicillin and cephalosporin prescriptions dispensed in 2014, narrow-spectrum agents accounted for 8% of use, moderate-spectrum agents for 65% of use and broad-spectrum agents for 25% of use.
Chloramphenicol eye preparations dominate the supply of ophthalmic and otic antimicrobials, although combination corticosteroid and anti-infective ear drops also contribute a large proportion (Figure 3.17). Note that chloramphenicol eye drops and eye ointment have been available without a prescription as pharmacist-only supply since May 2010;29 this supply is not included in the analysis.
Chapter 3: Antimicrobial use and appropriateness 52
Figure 3.17Ophthalmic and otic antimicrobial preparations dispensed, by therapeutic group, 1994–2014
Notes:1. Before April 2012, includes estimates of under co-payment and private dispensing; after April 2012, includes actual under
co-payment data, but no estimate from private dispensing2. Chloramphenicol eye drops and eye ointment have been available without a prescription as pharmacist-only supply since
May 2010; this supply is not included in the analysis.Source: Drug Utilisation Sub Committee database, October 2015
Antimicrobial prescriptions by prescriber type
General practitioners generate the majority of prescriptions (88%). Approved nonmedical prescribers (dentists, optometrists, midwives and nurse practitioners) issued a small proportion of the total prescriptions supplied for antimicrobials in 2014 (Table 3.8).
Table 3.8 Major specialty type of prescriber for prescriptions supplied, 2014
Major specialty of prescriber Prescriptions supplied Percentage of total prescriptions
General practitioner 25 744 462 88
Other medical 2 626 783 9
Dentist 861 117 3
Nurse practitioner 25 735 <1
Optometrist 16 318 <1
Midwife 260 <1
Total 29 274 675 100Note: Includes actual under co-payment data, but no estimate from private dispensingSource: Department of Human Services pharmacy claim database, October 2015
Chapter 3: Antimicrobial use and appropriateness 53
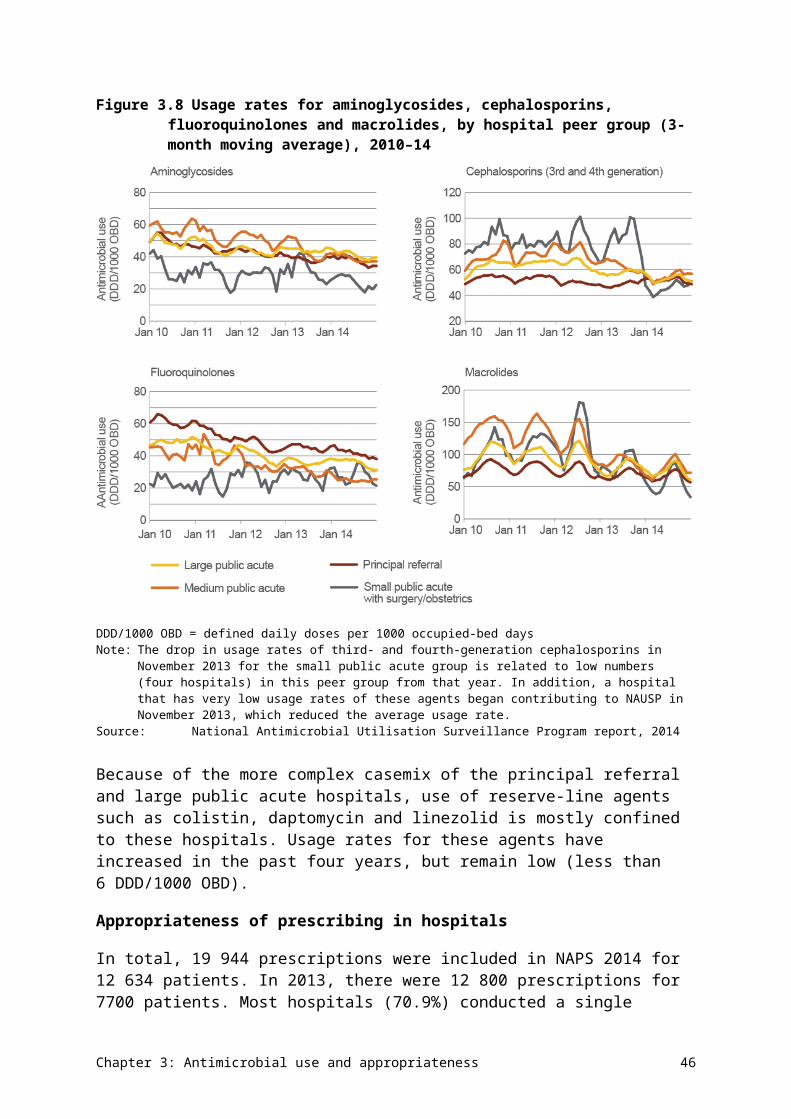
Aboriginal health services supply
The number of antimicrobial packs processed through remote area Aboriginal health services (AHSs) in 2014 was 305 195, which is 1% of the number of antimicrobial prescriptions supplied through the PBS/RPBS in the same year (n = 29 274 675). Amoxicillin was the most commonly supplied antimicrobial by AHSs in 2014 (Table 3.9). Some of the differences in commonly supplied antimicrobials in AHSs compared with the wider community are because of the prevalence of different infections in Aboriginal and Torres Strait Islander communities. For example, trachoma and uncomplicated urethritis caused by Chlamydia trachomatis are treated with azithromycin, and chronic suppurative otitis media is treated with ciprofloxacin ear drops.
Table 3.9 The 10 most commonly supplied antimicrobials in Aboriginal health services, 2014
Antimicrobial Total packs supplied
Amoxicillin 55 952
Azithromycin 36 156
Amoxicillin–clavulanate 30 442
Chloramphenicol (eye) 28 518
Cephalexin 21 343
Flucloxacillin 17 964
Ciprofloxacin (ear) 17 153
Trimethoprim–sulfamethoxazole 10 690
Roxithromycin 9 960
Dicloxacillin 8 683
Clinical variation in prescribing practice
The 2015 Australian atlas of healthcare variation 26 examines antimicrobial prescriptions dispensed through the PBS/RPBS from July 2014 to June 2015 for Australians of all ages. There was significant variation in the number of PBS/RPBS prescriptions dispensed for antimicrobials (antibacterials and antifungals) across more than 300 statistical local areas.26 After excluding outliers, antimicrobial prescription rates varied by 1.9–2.7 times between local areas.
The average number of prescriptions dispensed also varied across states and territories. Total antimicrobial dispensing varied from 1021 per 1000 inhabitants in Western Australia to 1329 per 1000 inhabitants in Queensland. Generally, rates were highest in areas of lowest socioeconomic status, and decreased with increasing socioeconomic status. This is consistent with decreasing socioeconomic status being associated with poorer health and higher infection rates. Further information on variation in antimicrobial prescribing can be obtained from the Australian atlas of healthcare variation.26
Appropriateness of prescribing in primary care
The MedicineInsight program provides information on patterns of systemic AU, as well as the demographic characteristics and risk factors of patients prescribed systemic
Chapter 3: Antimicrobial use and appropriateness 54
antimicrobials. It also assesses the appropriateness of prescribing for upper respiratory tract infections and urinary tract infections.
Thirty per cent of MedicineInsight patients (n = 352 318) were prescribed systemic antimicrobials between 1 January and 31 December 2014.32 Females and older people were more likely to receive a prescription. New South Wales had higher prescribing rates (33.8 per 100 patients) than other states (26.3–30.1 per 100 patients), and people living in major cities had higher rates of systemic antimicrobials prescribed than residents of other regions. People living in the second-most disadvantaged SEIFA (Socio-Economic Indexes for Areas) quintile had the lowest rates of antimicrobial prescribing. AURA 2016: supplementary data has more information about this topic.
The rate of antimicrobial prescriptions (originals) per 100 general practitioner consultations has remained constant from 2009 to 2014, and shows a pattern of seasonal variation (Figure 3.18). This pattern is similar to the variation seen in amoxicillin, amoxicillin–clavulanate and macrolide prescriptions, with peaks in winter and troughs in summer.
Figure 3.18Monthly rate of general practitioner prescriptions on PBS/RPBS (originals only) for systemic antimicrobials, January 2009 to December 2014
GP = general practitioner; PBS = Pharmaceutical Benefits Scheme; RPBS = Repatriation Pharmaceutical Benefits Scheme Source: MedicineInsight32
Around 30% of people prescribed an antimicrobial had an indication recorded for the prescription in their medical record. Of these people, more than 50% who had colds and other upper respiratory tract infections were prescribed an antimicrobial where none was indicated. A large proportion of patients with acute tonsillitis, acute or chronic sinusitis, acute otitis media or acute bronchitis were given an antimicrobial prescription, despite guidelines recommending that antimicrobials are not indicated as routine therapy for these conditions. A large proportion of the antimicrobials prescribed were not the first recommendation in Australian guidelines:20 this varied from 68% for sinusitis to 36% for otitis media. For some conditions, the antimicrobial prescribing rate was 3.0–4.5 times that recommended by
Chapter 3: Antimicrobial use and appropriateness 55
ESAC.33 Only prescriptions of antimicrobials for urinary tract infections or cystitis met the ESAC acceptable range for prescribing27 (Table 3.10).
Table 3.10 Patients prescribed systemic antimicrobials for select conditions, 2014
Condition Patient Number Percentage 95% CI Acceptable range (%)
Acute URTI Older than 1 year prescribed antibacterialsa
45 743 47 44–56 0–20
Acute bronchitis or bronchiolitis
Aged 18–75 years prescribed antibacterialsa
23 619 90 89–91 0–30
Acute tonsillitis Older than 1 year prescribed antibacterials
13 135 91 90–92 0–20
And prescribed TG-recommended penicillin V
6 243 48 42–54 80–100
Sinusitis (chronic or acute)
Older than 18 years prescribed antibacterials
17 300 86 84–87 0–20
And prescribed TG-recommended amoxicillin
5 607 32 29–36 80–100
Acute otitis media/myringitis
Older than 2 years prescribed antibacterials
11 387 91 90–92 0–20
And prescribed TG-recommended amoxicillin
7 154 63 59–67 80–100
Pneumonia Aged 18–65 years prescribed antibacterials
607 68 64–71 90–100
And prescribed TG-recommended antibiotic (for mild CAP – amoxicillin or doxycycline)
146 24 19–29 80–100
Cystitis or other UTI
Females older than 18 years prescribed antibacterials
18 898 94 93–95 80–100
And prescribed TG-recommended trimethoprim
8 858 47 44–49 80–100
CAP = community-acquired pneumonia; CI = confidence interval; TG = Therapeutic guidelines: antibiotic; URTI = upper respiratory tract infection; UTI = urinary tract infectiona No antibacterials recommended by Therapeutic guidelines: antibioticSource: MedicineInsight32
Patterns of use of seven antimicrobials are presented in Table 3.11, including the percentage of people prescribed each agent, the main indications for use, the incidence of repeat prescribing, and differences between PBS/RPBS and private prescriptions.
The most common indication for prescribing amoxicillin, amoxicillin–clavulanate and roxithromycin was upper respiratory tract infections (Table 3.11). Amoxicillin was also commonly prescribed for otitis media. Amoxicillin–clavulanate, roxithromycin and doxycycline accounted for a significant number of prescriptions for sinusitis, bronchitis and
Chapter 3: Antimicrobial use and appropriateness 56
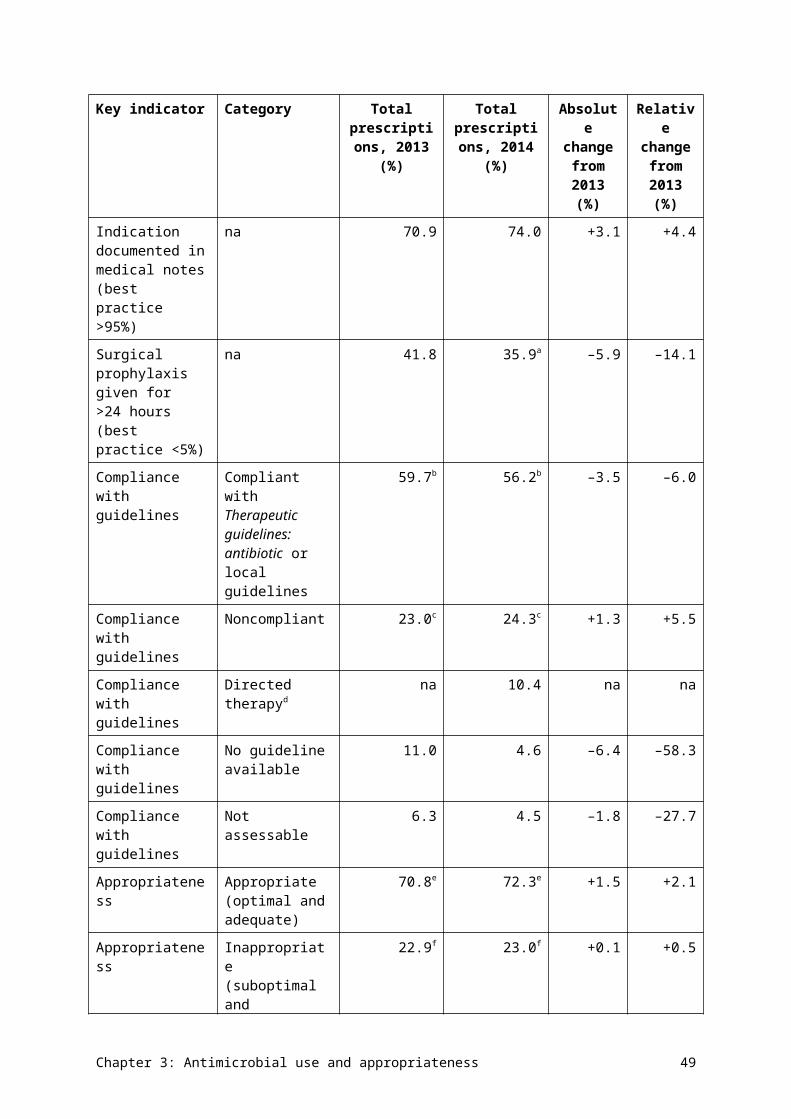
lower respiratory tract infections. Cephalexin was widely used for urinary tract infections, and skin or soft tissue infections, although it is not recommended as a first-line treatment for these indications in Therapeutic guidelines: antibiotic.20 Repeat prescriptions appear to be overprescribed in certain areas, and there was a wide variation in the proportion of repeat prescriptions for amoxicillin–clavulanate or roxithromycin for upper respiratory tract infections.
The use of private prescriptions was highest for azithromycin, ciprofloxacin and doxycycline, but, in many cases, this appeared to be appropriate. For example, doxycycline is often prescribed for malaria prophylaxis and acne treatment, and ciprofloxacin for travel. However, there is no explanation for the high proportion of private prescriptions for azithromycin for the treatment of upper respiratory tract infections.
Chapter 3: Antimicrobial use and appropriateness 57
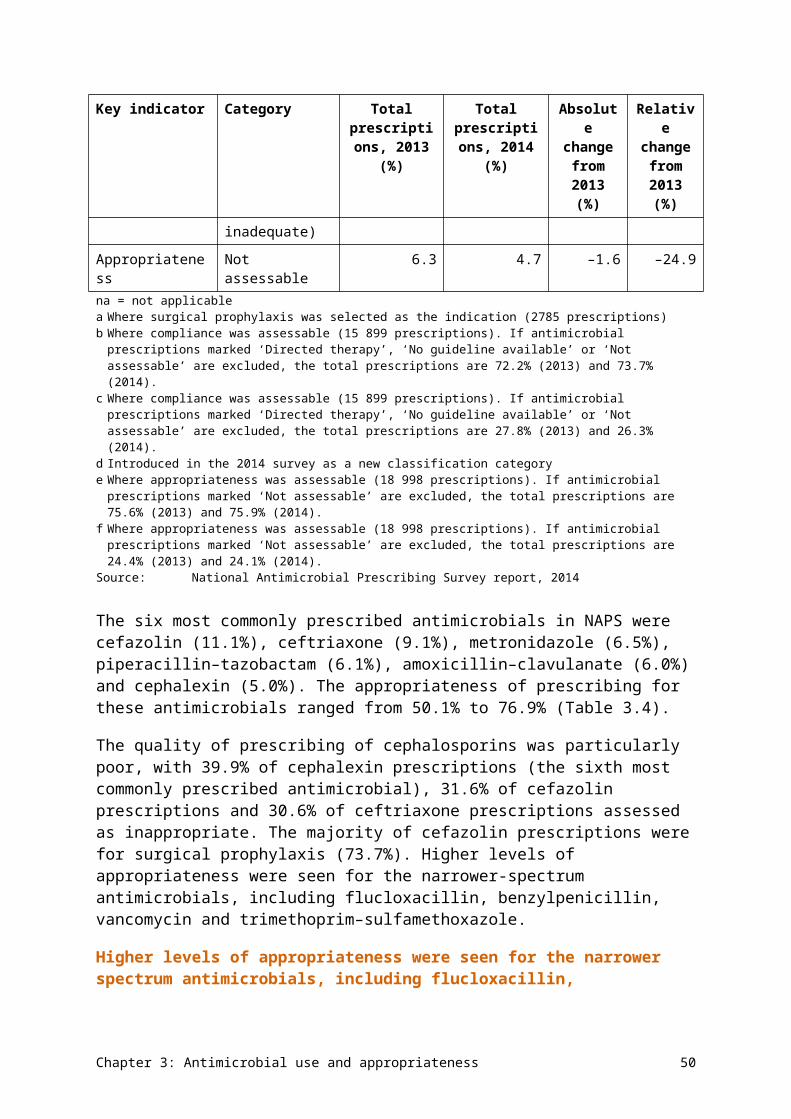
Table 3.11 Patterns of use, indications for therapy, repeat prescribing, and differences between PBS/RPBS and private prescriptions for seven antimicrobials, 2014
Chapter 3: Antimicrobial use and appropriateness 58
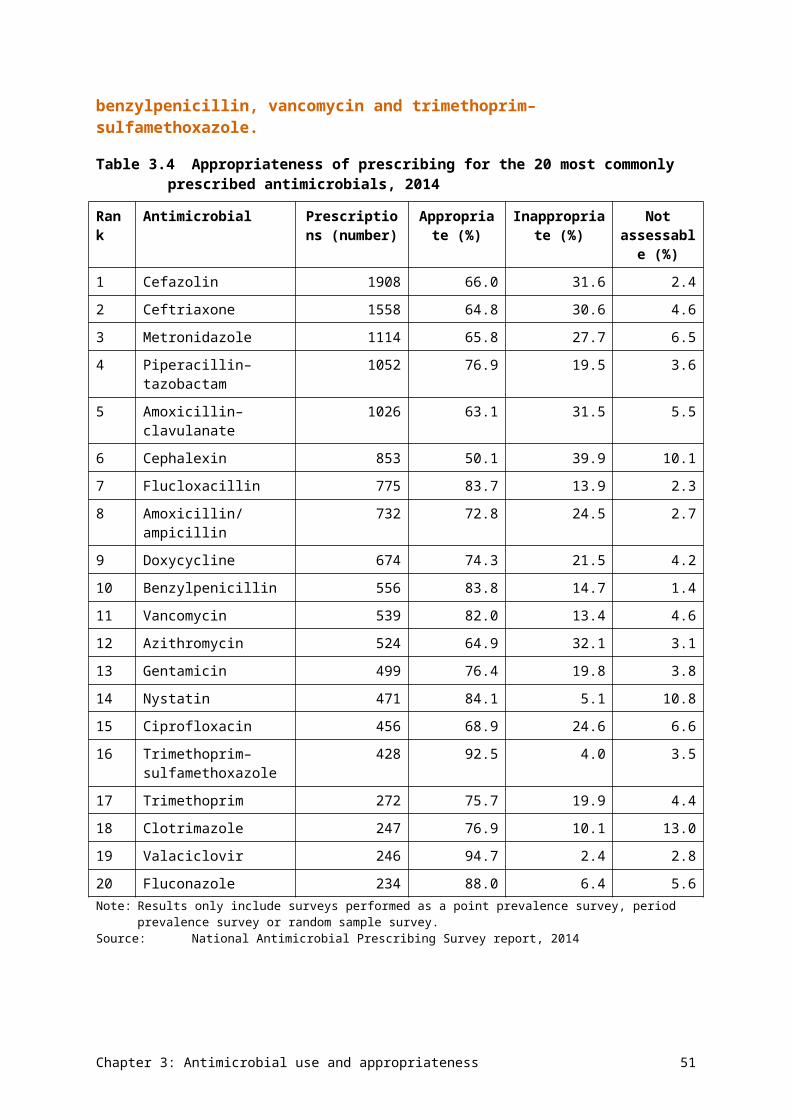
Antimicrobial (PBS/RPBS benefit)
Patients issued a prescription (%)a
Most common indications (%)
Patient cohort
Repeats prescribed
Differences between PBS/RPBS and private prescriptions
Amoxicillin (general benefit)
12.4 • URTI (30%)• Otitis media
(15%)• Nonrespiratory
infections (minority of cases)
Highest use in children, and patients with COPD or asthma
27% of prescriptions ordered with one or more repeats. Moderate variation between practices in repeats for URTI
Negligible private use
Cephalexin (general benefit)
9.8 • Skin and wound infections (35%)
• UTI (20%)• Respiratory
infections (minority of cases)
Higher use in chronic disease and elderly patients. Variation in use across states
Minority receive repeat prescriptions. Repeats more common for COPD, pneumonia, serious infections, acne, bronchitis or sinusitis
Negligible private use
Amoxicillin–clavulanate (restricted to infections resistant to amoxicillin)
7.1 • Sinusitis (15%)• Acute URTI
(14%)• Otitis media
(10%)• Skin and wound
infections (~10%)
Higher use in major cities, and patients with COPD or asthma
58% of prescriptions ordered with one or more repeats (often for COPD, sinusitis or bronchitis). Wide variation between practices in repeats for URTI
Negligible private use
Roxithromycin (general benefit)
3.4 • URTI (30%)• Lower
respiratory tract infections (13%)
• Bronchitis (12%)
Higher use in older patients, and patients with COPD or asthma. Higher use in Victoria and major cities
50% of prescriptions written with repeat. Repeats more common for COPD, tonsillitis, bronchitis or sinusitis. Wide variation in repeat prescribing across practices
Negligible private use. Private prescriptions ordered for courses of longer duration than PBS courses
Doxycycline 3.3 • PBS/RPBS use: Higher use in 50% of 14% private
Chapter 3: Antimicrobial use and appropriateness 59
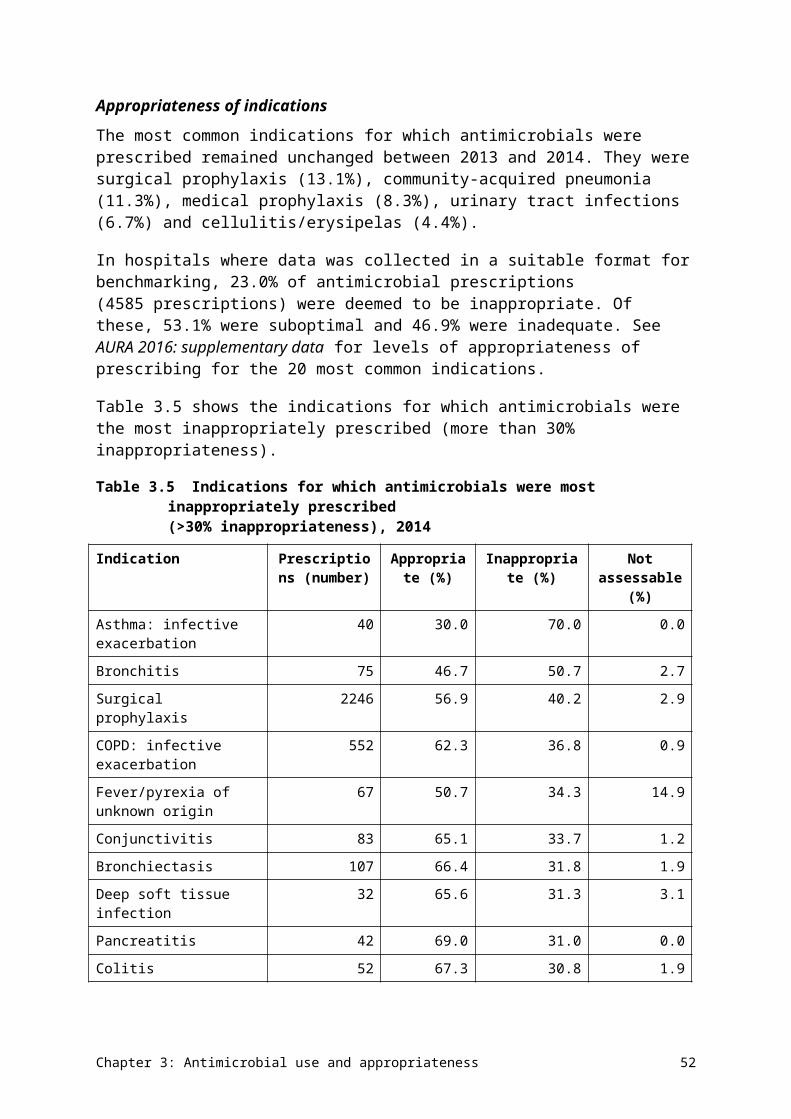
Antimicrobial (PBS/RPBS benefit)
Patients issued a prescription (%)a
Most common indications (%)
Patient cohort
Repeats prescribed
Differences between PBS/RPBS and private prescriptions
(general benefit, restricted for some indications)
acne (16%), sinusitis (14%)
• Private use: travel (74%)
15–19-year-olds, 70–85-year-olds, inner regional areas, and patients with COPD or asthma
prescriptions had repeat (commonly for acne or COPD)
use. Private prescriptions more likely to have longer duration of treatment
Azithromycin (restricted benefit)
0.7 • PBS/RPBS use: Chlamydia infections (55%); ear, eye, gastrointestinal tract and nail infections (20%)
• Private use: acute URTI (24%), travel (11%)
Highest use in 15–29-year-olds. Higher use in Western Australia, and in outer and remote areas
7% of PBS/RPBS prescriptions and 18% of private prescriptions ordered with one or more repeats
42% private use
Ciprofloxacin (restricted benefit)
0.3 • PBS/RPBS use: other infections of ear, eye, gastrointestinal tract and nail (38%); skin and wound infections (22%)
• Private use: travel (14%)
Use increased with age; highest use in >75-year-olds and patients with COPD or asthma. Lower PBS/RPBS use in Victoria and major cities. Higher private use in outer and remote areas
46% of PBS/RPBS prescriptions and 18% of private prescriptions ordered with one or more repeats
29% private prescriptions. PBS/RPBS prescriptions ordered for courses of longer duration than private prescriptions
COPD = chronic obstructive pulmonary disease; PBS = Pharmaceutical Benefits Scheme; RPBS = Repatriation Pharmaceutical Benefits Scheme; URTI = upper respiratory tract infection; UTI = urinary tract infectiona Percentage of patients who visited a general practitioner at least once, or had one or more prescriptions ordered in 2014
that were issued a prescription for the specified antimicrobialSource: MedicineInsight34
The high prescribing rates for amoxicillin, amoxicillin–clavulanate and roxithromycin for upper respiratory tract infections reported by MedicineInsight accord with the data published in the annual Report on government services (ROGS). ROGS reports on the measures of appropriateness of management of upper respiratory tract infections. These measures are:16
• filled general practice prescriptions for selected antimicrobials per 1000 inhabitants (data obtained from the PBS and RPBS on the oral antimicrobials most commonly used to treat upper respiratory tract infections – that is, phenoxymethylpenicillin, amoxicillin,
Chapter 3: Antimicrobial use and appropriateness 60
amoxicillin–clavulanate, clarithromycin, erythromcycin, roxithromycin, cefaclor, cefuroxime and doxycycline)
• proportion of visits to general practitioners for acute upper respiratory tract infections where systemic antimicrobials are prescribed.
The national aggregate number of prescriptions per 1000 inhabitants for oral antimicrobials most commonly used to treat upper respiratory tract infections was 295 in 2013–14, similar to 2012–13 (Figure 3.19). However, these antimicrobials are also prescribed for other conditions, so the rate should be interpreted with caution.
Figure 3.19Rate of prescriptions for oral antimicrobials commonly used to treat upper respiratory tract infections, by jurisdiction, 2012–14
ACT = Australian Capital Territory; NSW = New South Wales; NT = Northern Territory; Qld = Queensland; SA = South Australia; Tas = Tasmania; Vic = Victoria; WA = Western AustraliaNote: Prescriptions ordered by vocationally registered general practitioners and other medical practitioners, and dispensed.
Data is not limited to prescriptions for the treatment of upper respiratory tract infections. Data for 2012–13 is for all people and is not comparable with data for previous years, which was limited to prescriptions provided to holders of concession cards, and is reported in Report on government services 2015, Table 10A.54.16
Sources:Report on government services 2015, Table 10A.5316
The prevalence of prescriptions for oral antimicrobials commonly used to treat upper respiratory tract infections varied across states and territories (Figure 3.20). The lower rates in Western Australia and the Northern Territory may, in part, reflect other sources of supply of antimicrobials, such as AHSs (which are not included in Figure 3.20).
Fewer people presenting to general practitioners for acute upper respiratory tract infections are being prescribed systemic antimicrobials. Nationally, the proportion of such presentations for which systemic antimicrobials were prescribed by general practitioners in each 12-month period (from April to the following March) decreased from 32.8% in 2011–12 to 29.0% in 2013–14. This reflects the overall decreasing trend in most states and territories (Figure 3.20).
Chapter 3: Antimicrobial use and appropriateness 61
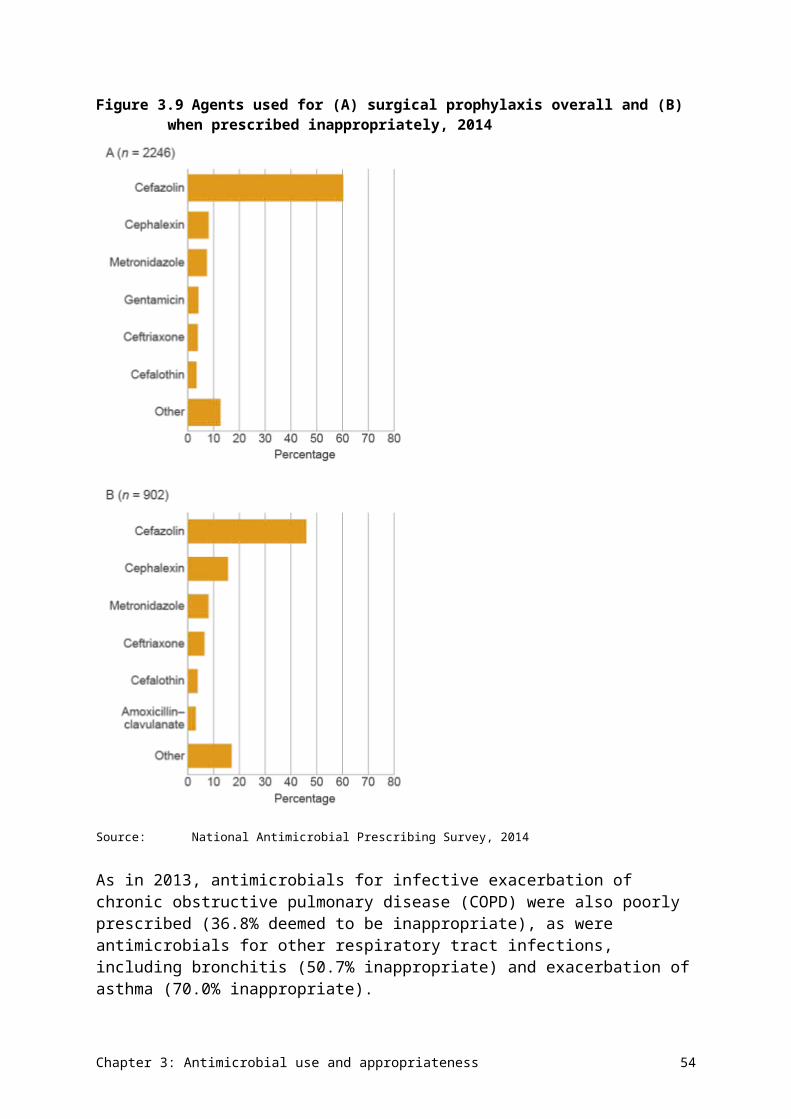
Figure 3.20Percentage of patients with acute upper respiratory tract infections prescribed a systemic antimicrobial, by jurisdiction, rolling average, 2006–14
ACT = Australian Capital Territory; NSW = New South Wales; NT = Northern Territory; Qld = Queensland; SA = South Australia; Tas = Tasmania; Vic = Victoria; WA = Western AustraliaNotes: 1. Error bars represent the 95% confidence interval associated with each point estimate. 2. Participation in the survey is voluntary. Data is not necessarily representative of the prescribing behaviour of
nonparticipating general practitioners. Sources:Report on government services 2015, Table 10A.5516
Commentary
Overall prescribing in the community
AU in the community setting in Australia is high. In 2014, 46% of the population were dispensed at least one systemic antimicrobial, with an overall rate of 23.8 DDD/1000 inhabitants/day.35 Australia’s antimicrobial prescribing rate is the eighth highest among member countries of the Organisation for Economic Co-operation and Development, and is more than double that of countries that prescribe the lowest volumes of antimicrobials.36
Although PBS/RPBS data indicates that 46% of people were dispensed an antimicrobial in 2014, MedicineInsight data indicates that 30% of patients attending a general practitioner in 2014 received a prescription for a systemic antimicrobial.32 This difference is partly because PBS/RPBS data also includes prescriptions generated by specialist doctors, nonmedical prescribers and hospitals, and because patients who infrequently attend a general practitioner clinic are excluded from MedicineInsight data. The voluntary nature of the MedicineInsight program may also select for prescribers who are more likely to follow national guidelines.
The number of antimicrobial prescriptions dispensed peaked in 2008 at 25.5 DDD/1000 inhabitants/day, which is 6.7% higher than the rate reported in 2014. However, since 2008, there has been little change in overall rates from year to year.
Chapter 3: Antimicrobial use and appropriateness 62
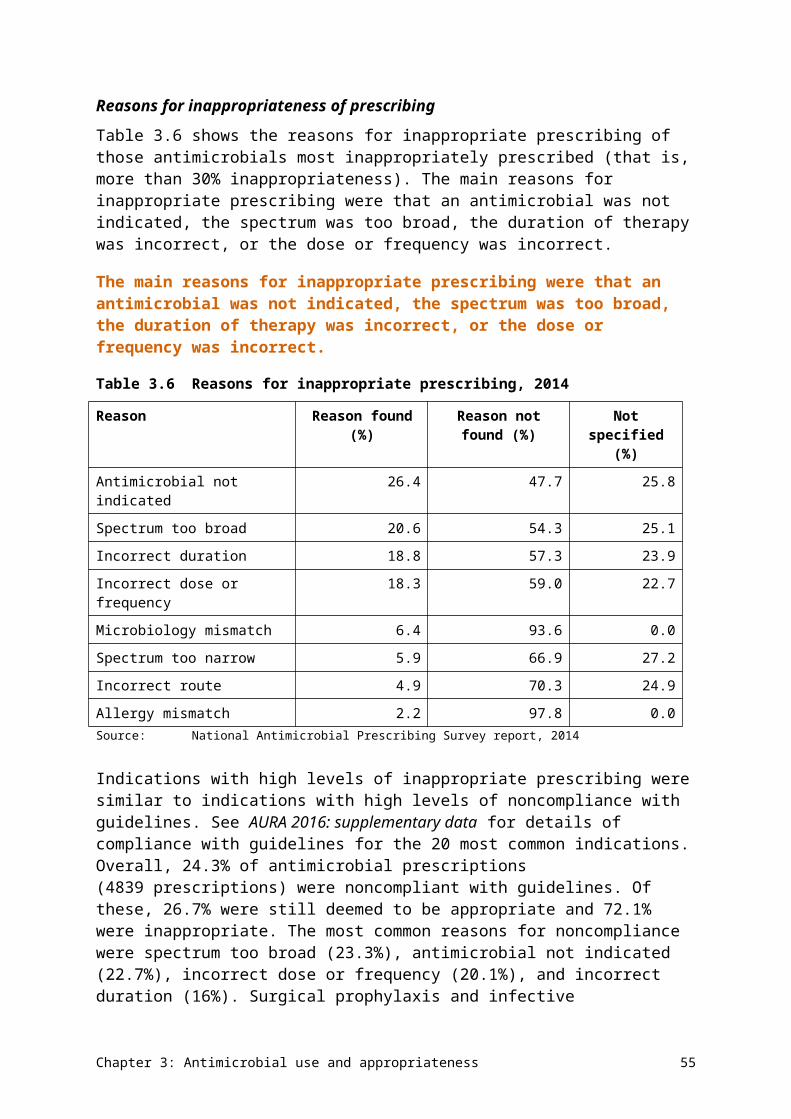
Penicillins are the most commonly prescribed antimicrobial group, and amoxicillin and amoxicillin–clavulanate are the most commonly prescribed agents in this group. There is minimal prescribing of narrow-spectrum penicillins, with flucloxacillin being the most commonly prescribed agent. The number of amoxicillin prescriptions dispensed has decreased slightly since 2008, and cephalexin and amoxicillin–clavulanate dispensings have continued to increase.
Australia places a heavy reliance on β-lactams for treating infections in the community. During the three years from July 2012 to June 2015, 69% of all prescriptions dispensed on the PBS/RPBS in Australia were for β-lactams. Only 6.1% were for narrow-spectrum penicillins, meaning that 63% of all antimicrobials dispensed were moderate- and broad-spectrum β-lactams, which are likely to generate greater selective pressure for resistance.
Variations in prescribing
The pattern of antimicrobials supplied through AHSs differed from that in the general community, in line with prevalence of infections in remote communities. Antimicrobials supplied by AHSs equated to 1% of the total PBS/RPBS supply.
Data from both MedicineInsight and the Australian atlas of healthcare variation26 indicate variations in prescribing across states and territories, between major cities and other regions, and across socioeconomic status. Greater use of antimicrobials in areas of lower socioeconomic status is consistent with the poorer health and higher infection rates associated with lower socioeconomic status. However, there is insufficient evidence to identify the factors that are driving geographic patterns of antimicrobial prescribing in Australia. The next stage of work for the Australian atlas of healthcare variation will further examine some of these issues. For many of the common bacteria involved in community-acquired infections, rates of resistance do not vary across the country.
Prescribing for upper respiratory tract infections
The proportion of acute upper respiratory tract infection presentations for which systemic antimicrobials were prescribed by general practitioners decreased from 32.8% in 2011–12 to 29.0% in 2013–14.16 This may be in response to the NPS MedicineWise antibiotic campaign that started in 2012, targeting health professionals and consumers.37 However, high volumes of antimicrobials continue to be prescribed unnecessarily for respiratory infections. More than 50% of patients who presented to a general practitioner as part of MedicineInsight, where the reason for the visit was documented as colds and other upper respiratory tract infections, had an antimicrobial prescribed where no indication was recorded. A large proportion of patients with acute tonsillitis, acute or chronic sinusitis, acute otitis media or acute bronchitis were prescribed an antimicrobial when antimicrobial treatment should be the exception, not routine therapy.32 A large proportion of antimicrobials prescribed were not those recommended by Therapeutic guidelines: antibiotic.20
High volumes of antimicrobials continue to be prescribed unnecessarily for respiratory infections.
Amoxicillin–clavulanate, the third most commonly dispensed antimicrobial in the community, is restricted on the PBS to infections where resistance to amoxicillin is suspected or proven. However, only 6% of patients who were dispensed amoxicillin–clavulanate had amoxicillin supplied in the preceding month.30 MedicineInsight data showed that around 14% of amoxicillin–clavulanate prescribing was for upper respiratory tract infections, where
Chapter 3: Antimicrobial use and appropriateness 63
antimicrobials were not indicated, and 15% was for sinusitis, where antimicrobials are only indicated in specific circumstances34 (with amoxicillin the recommended antimicrobial in Therapeutic guidelines: antibiotic).20 Thirty per cent of amoxicillin prescriptions were for upper respiratory tract infections.
The number of prescriptions dispensed between winter and summer fluctuates significantly for those agents used to treat upper respiratory tract infections. This variation is highest for amoxicillin, amoxicillin–clavulanate, macrolides and doxycycline, indicating potential misuse of these antimicrobials for the treatment of colds and influenza. This was most apparent in children in the 0–9-year cohort, where the rate of amoxicillin prescriptions dispensed was twice that of other age groups, and the seasonal variation was greater. In future, the Commission will examine opportunities for reporting by narrower age groups.
There is low use of narrow-spectrum antimicrobials within Australia. For example, only 8% of β-lactam prescriptions dispensed were narrow-spectrum agents, namely β-lactamase-sensitive penicillins. This contrasts with Scandinavian countries, where β-lactamase-sensitive penicillins were the most commonly prescribed antimicrobial class (see Chapter 5).
Prescribing by age group
Young children (0–9 years) are dispensed a greater proportion of amoxicillin, erythromycin and cefaclor than other age groups, with a significant peak in winter. This accords with NPS MedicineWise 2012 survey data that shows that more than twice as many parents would ask for antibiotics to treat their child’s cold or cough than would ask for antibiotics to treat their own cold or cough (14% vs 6%); fathers are more likely to ask than mothers (22% vs 9%).38
Older patients (65 years and over) were dispensed more cephalexin, flucloxacillin and trimethoprim than other age groups, which reflects the use of these antimicrobials in skin and soft tissue infections, and management of urinary tract infections. Cephalexin is widely used for urinary tract infections, and skin and soft tissue infections, although it is not the first choice. In skin and soft tissue infections, it may be preferred to flucloxacillin or dicloxacillin because its side-effect profile may be considered safer by prescribers. AMS activities that focus on prescribing in the elderly and the very young should be considered to reduce unnecessary and inappropriate AU in these populations.
Repeat prescriptions
Repeats are frequently ordered for commonly prescribed antimicrobials, such as amoxicillin and cephalexin, where a repeat prescription is not needed to complete a treatment course.30 In addition, 10–20% of repeat prescriptions are dispensed many months after the date of prescribing, which is unlikely to be for the same course of treatment. Reducing unnecessary repeat prescriptions could be a target for community-based AMS.
Gaps and improvements
Improving antimicrobial usage data
Since April 2012, the PBS/RPBS data on volume of antimicrobial prescriptions dispensed through the PBS/RPBS has not included antimicrobials dispensed as private prescriptions. Future reports would be improved if this information could be included.
Chapter 3: Antimicrobial use and appropriateness 64
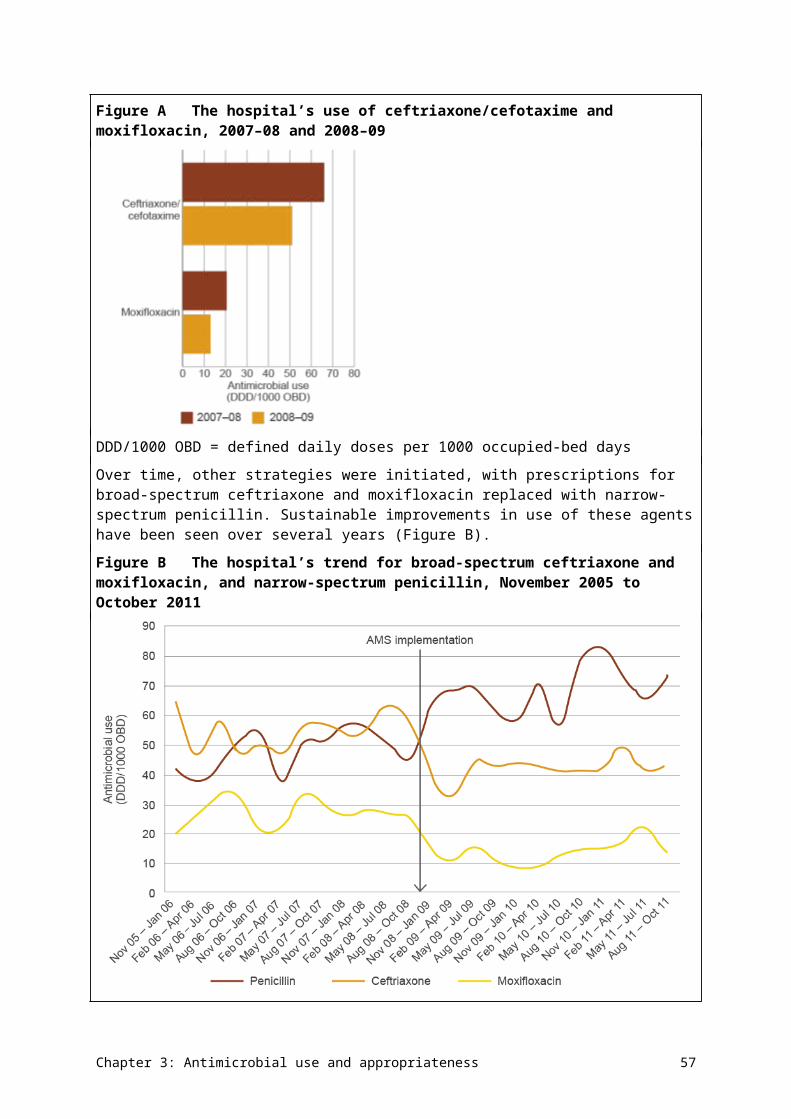
Presenting data on individual drugs as measures such as DDD/1000 inhabitants/day and prescriptions/1000 inhabitants would facilitate comparisons of AU measures in Australia with those in other countries.
Expanding the report to include an analysis of public hospital PBS/RPBS data would provide useful information on antimicrobials dispensed to outpatients and discharged patients.
In future reports, it may be useful to superimpose peak influenza years, national education programs and other national AMS interventions onto a graph of AU. This would help identify trends and points of impact that affect AU over time.30
MedicineInsight is a data set in development, and work is in progress to further develop its capabilities and capacity in data analytics and report presentation. Because only around 30% of patients had an indication recorded for their antimicrobial prescription in their medical record, treatment rates reported from MedicineInsight data are not comprehensive and may be underestimates. Increasing the proportion of clinicians who record the reason for prescribing an antimicrobial would improve the accuracy of this data.
Strengthening antimicrobial stewardship
The Antimicrobial Stewardship Clinical Care Standard contains a quality statement on documenting the indication for prescribing antimicrobials.39 The standard should be broadly promoted in community and primary care.
Setting targets for antimicrobial prescribing in the community setting has been shown to influence antimicrobial prescribing in other countries, and could be considered for adoption in Australia.
The Pharmaceutical Benefits Advisory Committee is consulting with stakeholders on PBS listings for antimicrobials to better align with clinical guidelines and minimise overuse.
3.3 Antimicrobial use in the community – residential aged care facilities
Information on AU in residential aged care facilities has not been generally available in Australia. However, recent initiatives by the National Centre for Antimicrobial Stewardship (NCAS) and Australian Infection Surveillance – Aged Care as part of the AURA project (and funded by the Commission) have provided valuable data through a pilot Aged Care National Antimicrobial Prescribing Survey (acNAPS). The results of the pilot provide a snapshot of AU and the prevalence of infection in a sample of Australian residential aged care facilities.
A total of 186 facilities contributed data to the pilot study, with representation across all states (no territories participated), remoteness areas and provider types. Victoria had the highest number of participating facilities (69.9% of total participants). The demographics of the facilities are summarised in AURA 2016: supplementary data. Data on systemic and topical use of antibacterials and antifungals is included.
Data was collected on a single day between 22 June and 31 August 2015 by trained infection control practitioners, pharmacists or nurses, in collaboration with senior clinical staff employed at the residential aged care facilities. Participation was encouraged by direct approach from the AURA project and NCAS.
Chapter 3: Antimicrobial use and appropriateness 65
Antimicrobial use in residential aged care
The prevalence of residents on antimicrobial therapy was 11.3%, and 7.9% when topical therapy was excluded.
The prevalence of residents with a suspected or confirmed infection was 4.5%; of these, 72.4% were receiving an antimicrobial on the audit day. The prevalence of AU and infection by state, remoteness and provider type are presented in Table 3.12. Prevalence of AU ranged from 6.4% in Queensland to 26.9% in Western Australia. Prescribing was highest in remote and very remote areas, and lowest in regional centres; however, these results should be interpreted with caution because the number of remote and very remote residential aged care facilities was small.
The prevalence of residents on antimicrobial therapy was 11.3%. The prevalence of residents with a suspected or confirmed infection was 4.5%.
Table 3.12a Prevalence of antimicrobial use and infection in residential aged care facilities, by state, 2015
State Facilities (number
)
Beds audited
(number)
Antimicrobial use
(number)
Antimicrobial use (%)
Infections (number)
Infections (%)
NSW 17 545 66 12.1 32 5.9
Qld 7 481 31 6.4 17 3.5
SA 8 559 99 17.7 53 9.5
Tas 6 147 19 12.9 9 6.1
Vic 130 4704 334 7.1 172 3.7
WA 18 1153 310 26.9 61 5.3
National aggregate
186 7589 859 11.3 344 4.5
NSW = New South Wales; Qld = Queensland; SA = South Australia; Tas = Tasmania; Vic = Victoria; WA = Western AustraliaSource: Aged Care National Antimicrobial Prescribing Survey, 2015
Chapter 3: Antimicrobial use and appropriateness 66
Table 3.12b Prevalence of antimicrobial use and infection in residential aged care facilities, by remoteness, 2015
Remoteness
Facilities (number
)
Beds audited (number
)
Antimicrobial use
(number)
Antimicrobial use (%)
Infections (number)
Infections (%)
Major cities 51 2881 397 13.8 127 4.4
Inner regional
81 3323 312 9.4 148 4.5
Outer regional
45 1245 123 9.9 50 4.0
Remote 8 125 25 20.0 17 13.6
Very remote
1 12 2 16.7 2 16.7
National aggregate
186 7589 859 11.3 344 4.5
Source: Aged Care National Antimicrobial Prescribing Survey, 2015
Table 3.12c Prevalence of antimicrobial use and infection in residential aged care facilities, by provider type, 2015
Provider type
Facilities (number
)
Beds audited
(number)
Antimicrobial use
(number)
Antimicrobial use (%)
Infections (number)
Infections (%)
Not for profit 37 2181 426 19.5 120 5.5
Government 141 4963 395 8.0 207 4.2
Private 8 445 38 8.5 17 3.8
National aggregate
186 7589 859 11.3 344 4.5
Source: Aged Care National Antimicrobial Prescribing Survey, 2015
A total of 975 antimicrobial prescriptions were prescribed for 824 residents.
The top five most commonly prescribed antimicrobials were cephalexin (16.7%), clotrimazole (16.5%), amoxicillin–clavulanate (6.5%), trimethoprim (6.5%) and chloramphenicol (6.4%) (Figure 3.21). Topical antimicrobials accounted for 37.0% of all antimicrobial prescriptions.
Chapter 3: Antimicrobial use and appropriateness 67
Figure 3.21The 20 most commonly prescribed antimicrobials in residential aged care facilities, as a percentage of total antimicrobial prescriptions, 2015
kenacomb = triamcinolone + neomycin + nystatin + gramicidinNote: Total number of antimicrobial prescriptions = 975Source: Aged Care National Antimicrobial Prescribing Survey, 2015
The top five most common indications (for both prophylaxis and treatment combined) were unspecified skin, soft tissue or mucosal infection (17.5%); urinary tract infection: cystitis (16.7%); lower respiratory tract infection (11.8%); tinea (8.4%); and conjunctivitis (5.2%). The indication was unknown in 5.5% of prescriptions.
The top five most common indications were unspecified skin, soft tissue or mucosal infection; urinary tract infection: cystitis; lower respiratory tract infection; tinea; and conjunctivitis.
Prophylaxis accounted for 22.9% of the prescriptions, with the most common indications being urinary tract infections (36.3%); and unspecified skin, soft tissue or mucosal infections (11.2%) (Figure 3.22).
Unspecified skin, soft tissue or mucosal infections (19.4%), lower respiratory tract infections (14.4%) and urinary tract infections (10.9%) were the most common infections treated with antimicrobials (Figure 3.23).
Chapter 3: Antimicrobial use and appropriateness 68
Figure 3.22The 10 most common prophylaxis indications in residential aged care facilities, 2015
LRTI = lower respiratory tract infection; UTI = urinary tract infectionSource: Aged Care National Antimicrobial Prescribing Survey, 2015
Figure 3.23The 10 most common treatment indications in residential aged care facilities, 2015
LRTI = lower respiratory tract infection; UTI = urinary tract infectionSource: Aged Care National Antimicrobial Prescribing Survey, 2015
There was substantial difference in the documentation of a review or stop date between orders for prophylaxis (13.0%) and treatment (41.5%), and a greater proportion of prescriptions for prophylaxis were administered for more than six months (56.1% for prophylaxis vs 24.1% for treatment).
Chapter 3: Antimicrobial use and appropriateness 69
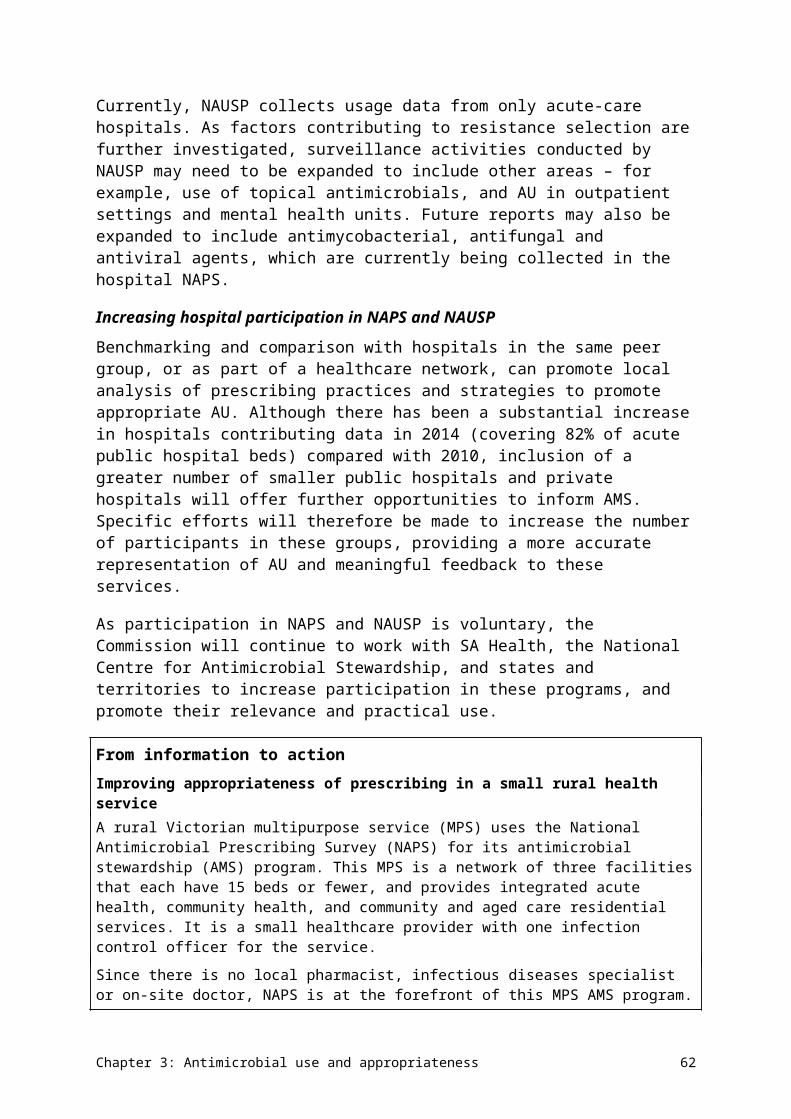
Appropriateness of prescribing in residential aged care
Overall, 31.4% of antimicrobial prescriptions were started more than six months before the audit date. Only 2% of these had a review or stop date documented.
The rate of AU was high for unspecified indications, particularly skin and soft tissue infections. The common skin and soft tissue conditions for which antimicrobial therapy is normally warranted (for example, tinea, chickenpox, cellulitis, wound infections) had been incorporated into the survey as separate standard indications, suggesting that a substantial proportion of the unspecified infections may not have warranted antimicrobial therapy.
Additional information regarding microbiology, urinary investigations and infection criteria was collected for a subset of 548 prescriptions that had a known start date, were written within six months of the audit and were not for prophylaxis. Overall, 23.9% (131/548) of these prescriptions had a microbiological sample collected in the week before the start date. This was most common for urinary tract infections (63.8%), but less common for skin, respiratory and eye conditions.
Approximately one in five prescriptions (21.7%) were prescribed for residents who did not have any signs or symptoms of infection in the week before the antimicrobial start date. For those prescriptions where signs and symptoms of infection were recorded, only 32.8% met McGeer infection criteria (standardised criteria for infection surveillance and research activities in residential aged care facilities).40 This was highest for skin, soft tissue, eye and oral infections (48.3%), followed by respiratory tract infections (30.5%) and urinary tract infections (11.9%) (Figure 3.24).
Approximately one in five prescriptions were prescribed for residents who did not have any signs or symptoms of infection.
Chapter 3: Antimicrobial use and appropriateness 70
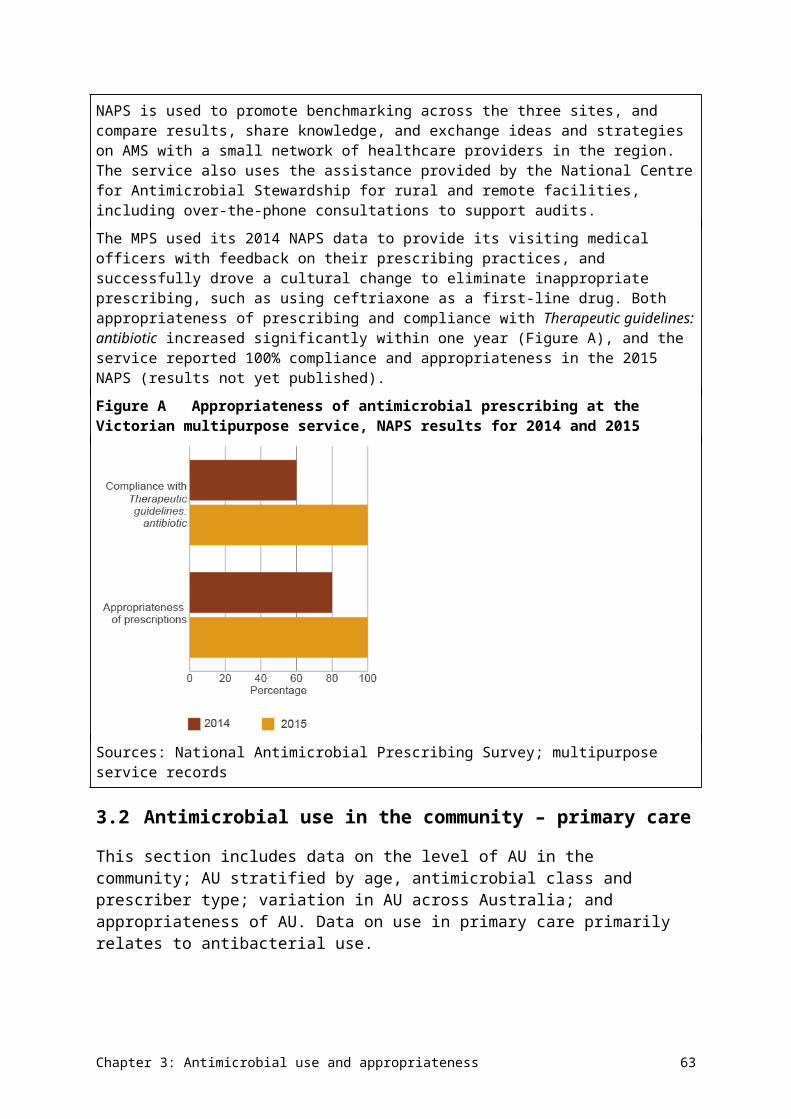
Figure 3.24Number of prescriptions that met McGeer criteria, by body system (where signs and symptoms of infection were recorded), 2015
Note: Prescriptions are counted more than once if the resident has signs or symptoms of infection for more than one body system.
Source: Aged Care National Antimicrobial Prescribing Survey, 2015
Commentary
This was the first national survey of AU in residential aged care facilities. It is not representative of AU nationally and is heavily weighted towards Victorian facilities. However, the data gives some insight into the extent and pattern of AU in Australian residential aged care facilities and provides a baseline for future surveillance.
The prevalence of residents prescribed at least one antimicrobial was 11.3%, and the prevalence of residents with a suspected or confirmed infection was 4.5%. If topical antimicrobials were excluded, the antimicrobial prevalence was 7.9%. This is higher than the 5.5% found in a 2014 Victorian survey,41 and at the high end of the range reported from other published studies (4.8–13.2%).42-52 The prevalence of infection was also slightly higher than in the Victorian study (4.5% vs 3.7%).41 Worldwide, infection rates in residential aged care facilities range from 2.1% to 16.2%.42-44,46,53-61 Only 2% of prescriptions for long-term use (more than six months of therapy) had a review or stop date.
Almost one-quarter of prescriptions (22.9%) were for prophylaxis, and urinary tract infections were the most common indication for this (36.3%).
There was some variation in the prevalence of AU across states. This variation cannot be explained by the prevalence of certain infections. The proportion of cephalexin use in residential aged care facilities was considerably higher than in the general community.
More than 20% of prescriptions for treatment in a subset of 548 residents were prescribed for residents without any signs or symptoms of infection in the week before the antimicrobial start date. For those with signs and symptoms of infection, using McGeer infection criteria as
Chapter 3: Antimicrobial use and appropriateness 71
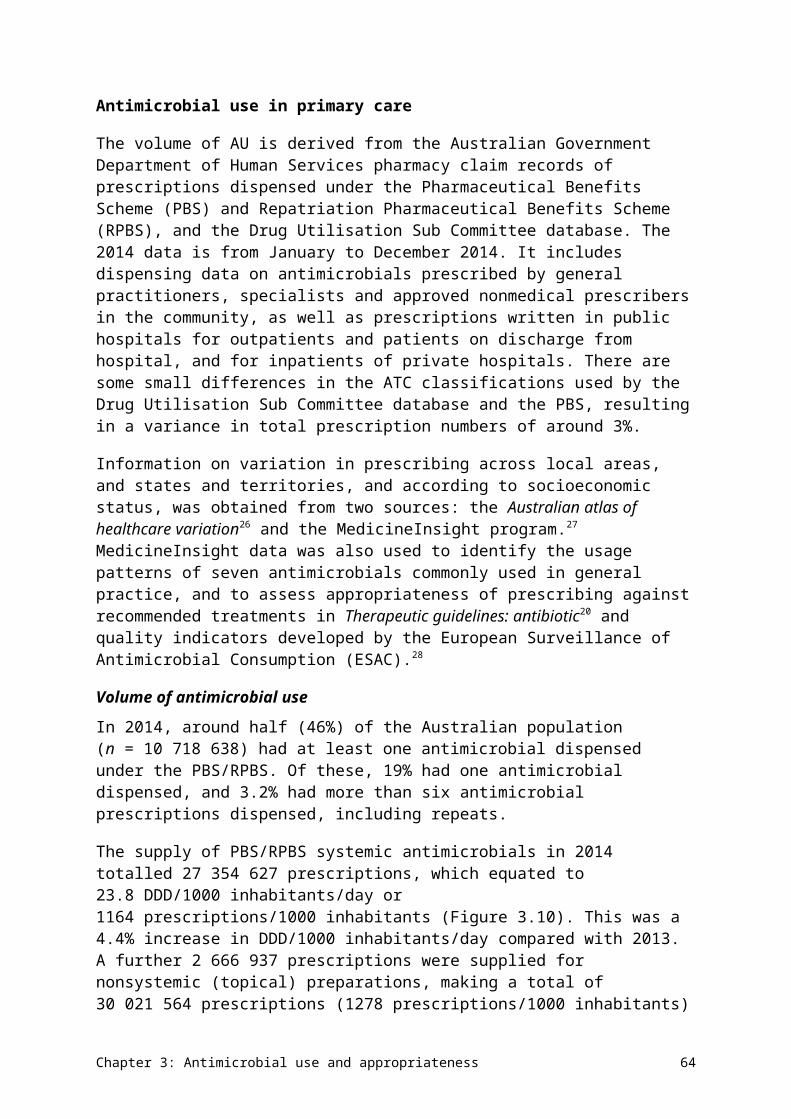
a measure of appropriateness, two-thirds of AU in these residents was not appropriate. Only 11.9% of residents with urinary tract infections, 30.5% with respiratory tract infections, and 48.3% with skin, soft tissue, eye or oral infections had infections that met the McGeer criteria.
For residents with signs and symptoms of infection, using McGeer infection criteria as a measure of appropriateness, two-thirds of AU was not appropriate.
Overall, the results indicate some unnecessary AU. Use in urinary tract infections, and unspecified skin, soft tissue and mucosal infections are potential areas of focus for improvement.
Gaps and improvements
The acNAPS is expected to be rolled out across Australia in 2016. All Australian residential aged care facilities and multipurpose services will be encouraged to participate at least annually.
Other potential improvements (subject to resources) could include:
• providing benchmarking reports and templates for communicating results at a local facility level
• educating the aged care workforce in terminology and survey methodology
• capturing more detail on unspecified infections in future surveys
• improving reporting of results.
Chapter 3: Antimicrobial use and appropriateness 72
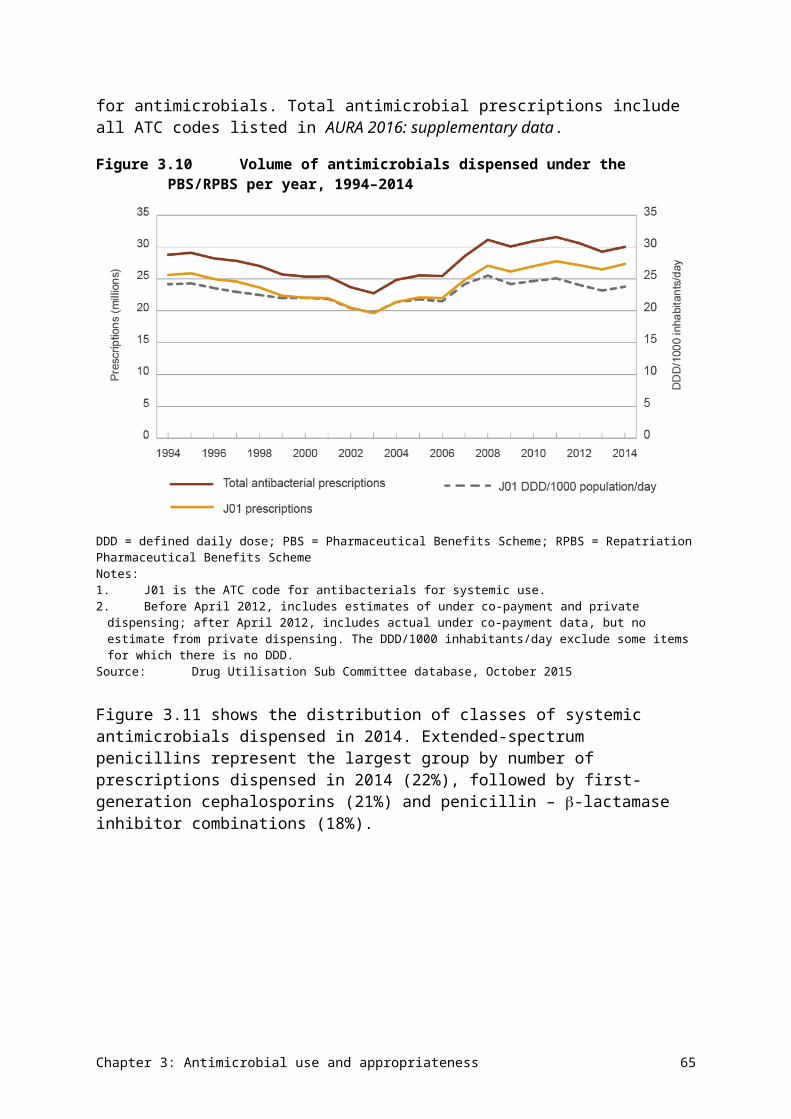
Chapter 4 Antimicrobial resistance
Key messages
• Acinetobacter baumannii – rates of resistance are low overall (<5%), and higher in hospitals than in the community.
• Enterobacteriaceae – extended-spectrum -lactamase-producing Escherichia coli, which are resistant to third-generation cephalosporins, are now a problem in community infections, as strains are often multidrug resistant.
• Enterococcus species – Australia has one of the highest rates of vancomycin resistance in Enterococcus faecium in the world. Rates of resistance to key antimicrobial agents are very low (<1%) in E. faecalis, but high (45–94.5%) in E. faecium.
• Mycobacterium tuberculosis – overall resistance rates have not changed significantly in the past decade. The rate of multidrug resistance is low, but has been gradually increasing (1.7% in 2014); extremely drug-resistant strains are occasionally found but remain rare.
• Neisseria gonorrhoeae – rates of resistance to benzylpenicillin and ciprofloxacin remain steady at around 30%. Rates of resistance to azithromycin and decreased susceptibility to ceftriaxone are low but gradually increasing.
• Neisseria meningitidis – rates of resistance to the four key antimicrobials remain very low (0–2%).
• Pseudomonas aeruginosa – overall rates of resistance to key antimicrobials are 10% or less; rates are higher in public hospitals than in other settings.
• Salmonella species – rates of resistance to fluoroquinolones are very low (1%) in nontyphoidal Salmonella species, but more than 12% in typhoidal Salmonella species.
• Shigella species – although data is limited, the presence of ciprofloxacin resistance in almost 10.6% of Shigella sonnei isolates is of concern.
• Staphylococcus aureus – between 15.8% and 17.4% of isolates are methicillin-resistant S. aureus (MRSA). Community strains of MRSA now cause a significant proportion of infections in both the community and hospitals.
• Streptococcus agalactiae – no isolates were resistant to benzylpenicillin, but resistance to erythromycin exceeds 20%. This means that protocols for prophylaxis may need to be reconsidered.
• Streptococcus pneumoniae – resistance (as defined for strains causing infections other than meningitis) to benzylpenicillin is low (around 2%), but resistance to other key antimicrobials is 21–26%.
• Streptococcus pyogenes – resistance to key antimicrobials used for treatment is absent or very low (3%).
This chapter analyses data collected from passive and targeted surveillance systems for hospitals, residential aged care facilities and the community, for 13 priority organisms, as determined through the AURA project.
Chapter 4: Antimicrobial resistance 73
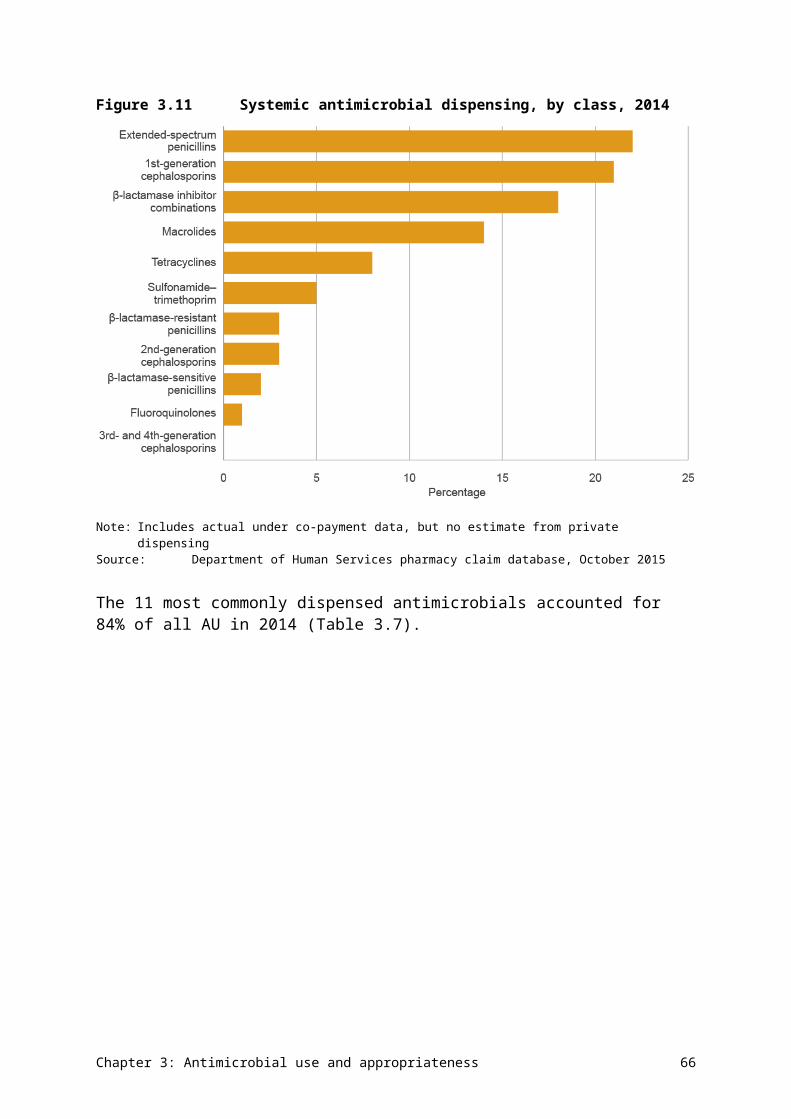
4.1 Introduction
Resistant bacteria and their resistance genes can spread readily between people in the community, primary care services, hospitals and residential aged care facilities. This often happens quickly and can sometimes be unnoticed. The spread of these bacteria can have a significant impact on patients, health services and the health system. Therefore, it is critical that resistant bacteria with the highest risk of harm to humans are identified and monitored through enhanced surveillance, and managed appropriately.
Priority organisms for surveillance
To help focus Australia’s antimicrobial resistance (AMR) surveillance efforts, the Australian Commission on Safety and Quality in Health Care (the Commission) developed a list of organisms and key antimicrobials that are high priorities for Australia. Key experts involved in the Antimicrobial Use and Resistance in Australia (AURA) project helped to develop this list.
Priority organisms are those of high public health importance and/or common pathogens where the impact of resistance is substantial in both the hospital and community settings.
Surveillance of these organisms is being undertaken by a number of programs. In this report, the data on these organisms is being brought together for the first time at a national level, to give a clearer picture of the rates of resistance, an indication of some related outcome measures and, where available, an indication of trends over time. This work is being coordinated and reported on by the Commission to help improve Australia’s capacity to detect and respond to emerging AMR threats.
Four sets of organisms are currently in the priority organism list (see Appendix 2). This first report on AMR and antimicrobial use (AU) for Australia provides data on the highest priority organisms. The organisms are:
• Acinetobacter baumannii
• Enterobacteriaceae
• Enterococcus species
• Mycobacterium tuberculosis
• Neisseria gonorrhoeae
• Neisseria meningitidis
• Pseudomonas aeruginosa
• Salmonella species
• Shigella species
• Staphylococcus aureus
• Streptococcus agalactiae
• Streptococcus pneumoniae
• Streptococcus pyogenes.
Chapter 4: Antimicrobial resistance 74
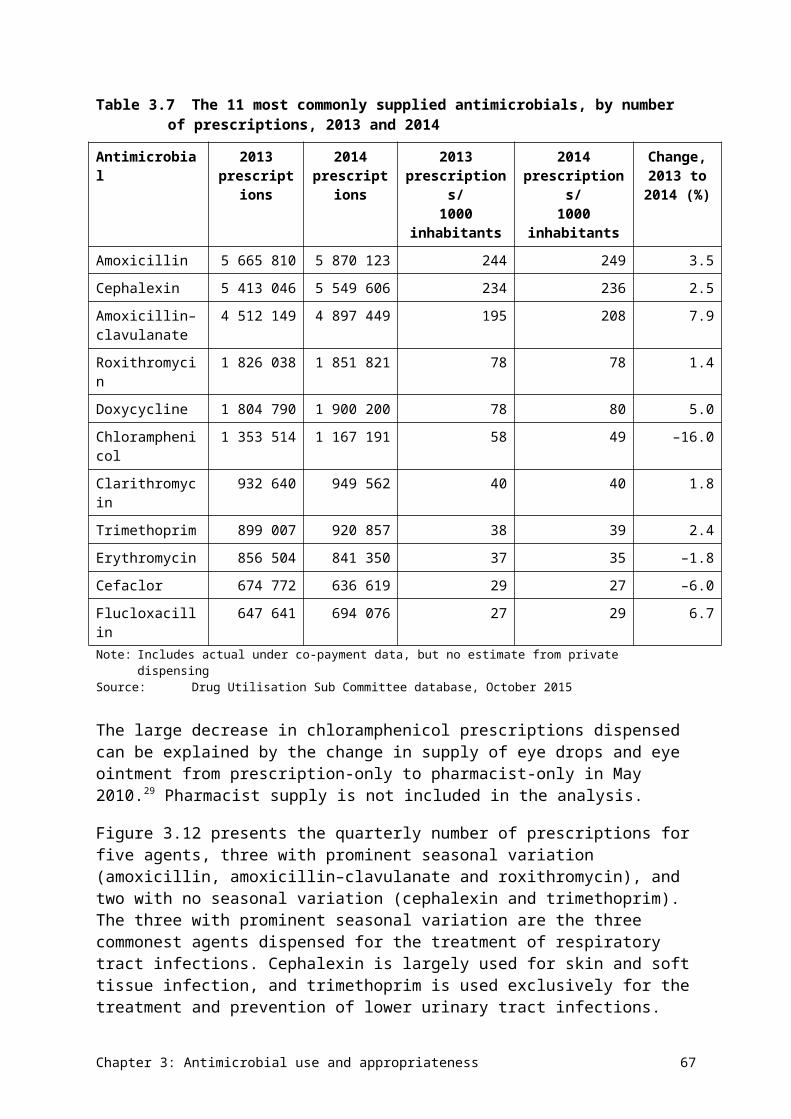
Sets 3 and 4 include organisms that require further development of surveillance capacity and/or are identified for potential inclusion in future surveillance activity.
The priority list will be regularly reviewed by the Commission, and new priority organisms may be added or changed across the sets as new data becomes available.
Data on priority organisms
This report includes data from:
• the Queensland Health OrgTRx system, which collects data from Queensland-based public hospitals and health services
• the Sullivan Nicolaides Pathology information system, which collects data from its own laboratories in Queensland and northern New South Wales; these laboratories service private hospitals, community-based services and residential aged care facilities
• the Australian Group on Antimicrobial Resistance (AGAR), which collects data on minimum inhibitory concentrations (MICs) of antimicrobials from laboratories across Australia for targeted organisms, a limited amount of demographic and outcome data, and undertakes additional characterisation of strains
• the National Neisseria Network, which collects data and undertakes confirmatory testing for all N. gonorrhoeae and N. meningitidis cases across Australia
• the National Notifiable Diseases Surveillance System, which collects data for all confirmed M. tuberculosis cases across Australia.
Additional tables with more detailed information are provided in AURA 2016: supplementary data.
The AURA Surveillance System will monitor changes in the nature of the AMR for each organism and include this information in future reporting.
Table 4.1 provides a summary of the data sources for each organism, and Table 4.2 summarises the priority organisms and their AMR prevalence.
Chapter 4: Antimicrobial resistance 75
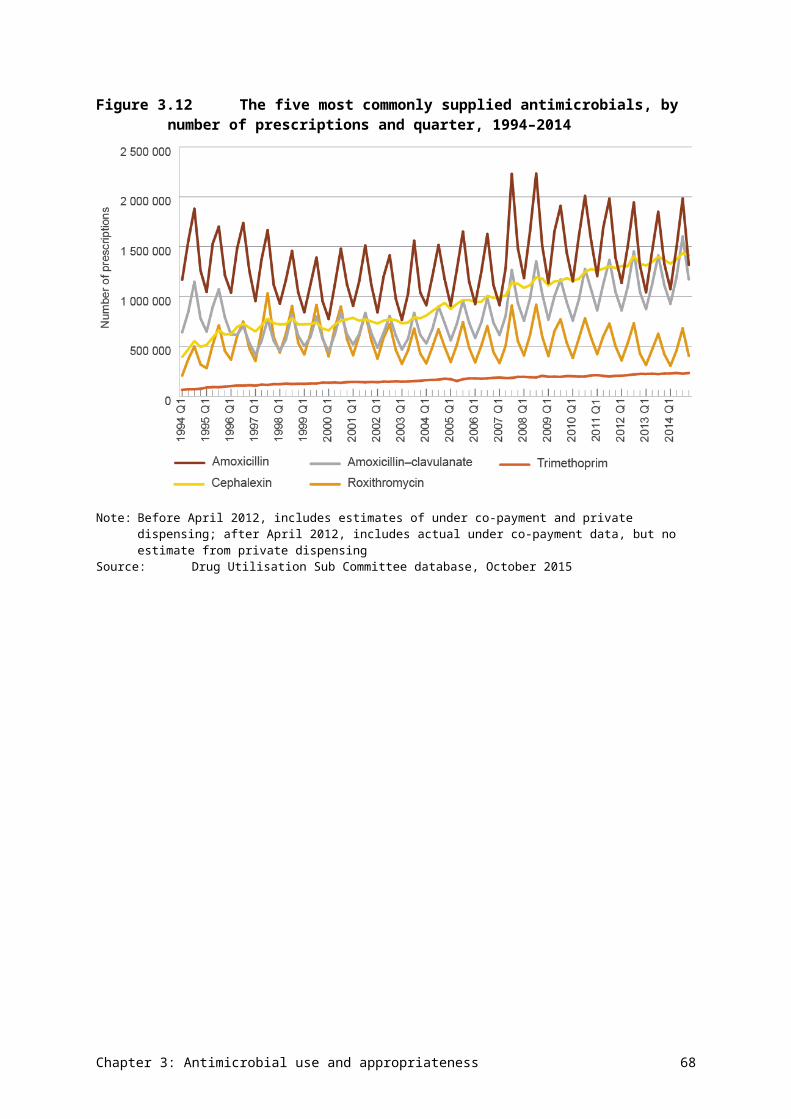
Table 4.1 Data sources for priority organisms included in this report
Chapter 4: Antimicrobial resistance 76
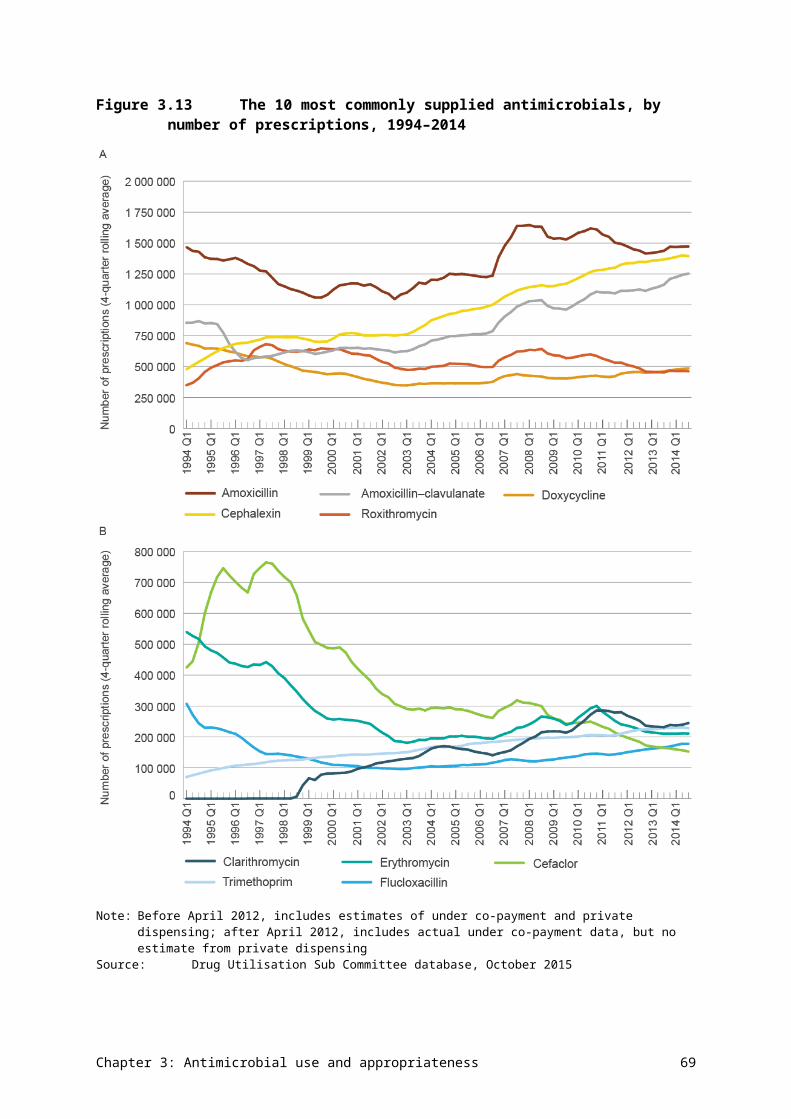
Section of report
Organism Data source
4.2 Acinetobacter baumannii • OrgTRxa – Queensland public hospitals and health services
• SNPa – Queensland and northern NSW communities, private hospitals and residential aged care facilities
4.3 Enterobacteriaceae • OrgTRxa – Queensland public hospitals and health services
• SNPa – Queensland and northern NSW communities, private hospitals and residential aged care facilities
• AGARb – national public and private hospitals
4.4 Enterococcus faecalis and E. faecium
• OrgTRxa – Queensland public hospitals and health services
• SNPa – Queensland and northern NSW communities, private hospitals and residential aged care facilities
• AGARb – national public and private hospitals
4.5 Mycobacterium tuberculosis • NNDSSc,d – national hospitals and community health services
4.6 Neisseria gonorrhoeae • NNNe – national hospitals and community health services
4.7 Neisseria meningitidis • NNN – national hospitals and community health services
4.8 Pseudomonas aeruginosa • OrgTRxa – Queensland public hospitals and health services
• SNPa – Queensland and northern NSW communities, private hospitals and residential aged care facilities
4.9 Salmonella species • OrgTRxa – Queensland public hospitals and health services
• SNPa – Queensland and northern NSW communities, private hospitals and residential aged care facilities
• AGARb – national public and private hospitals
4.10 Shigella species • OrgTRxa – Queensland public hospitals and health services
• SNPa – Queensland and northern NSW communities, private hospitals and residential aged care facilities
4.11 Staphylococcus aureus • OrgTRxa – Queensland public hospitals and health services
• SNPa – Queensland and northern NSW communities, private hospitals and residential aged care facilities
• AGARb – national public and private hospitals
4.12 Streptococcus agalactiae • OrgTRxa – Queensland public hospitals and health services
• SNPa – Queensland and northern NSW community, private hospitals and residential aged care facilities
4.13 Streptococcus pneumoniae • OrgTRxa,f – Queensland public hospitals and health services
• SNPa,f – Queensland and northern NSW communities, private hospitals and residential aged care facilities
Chapter 4: Antimicrobial resistance 77
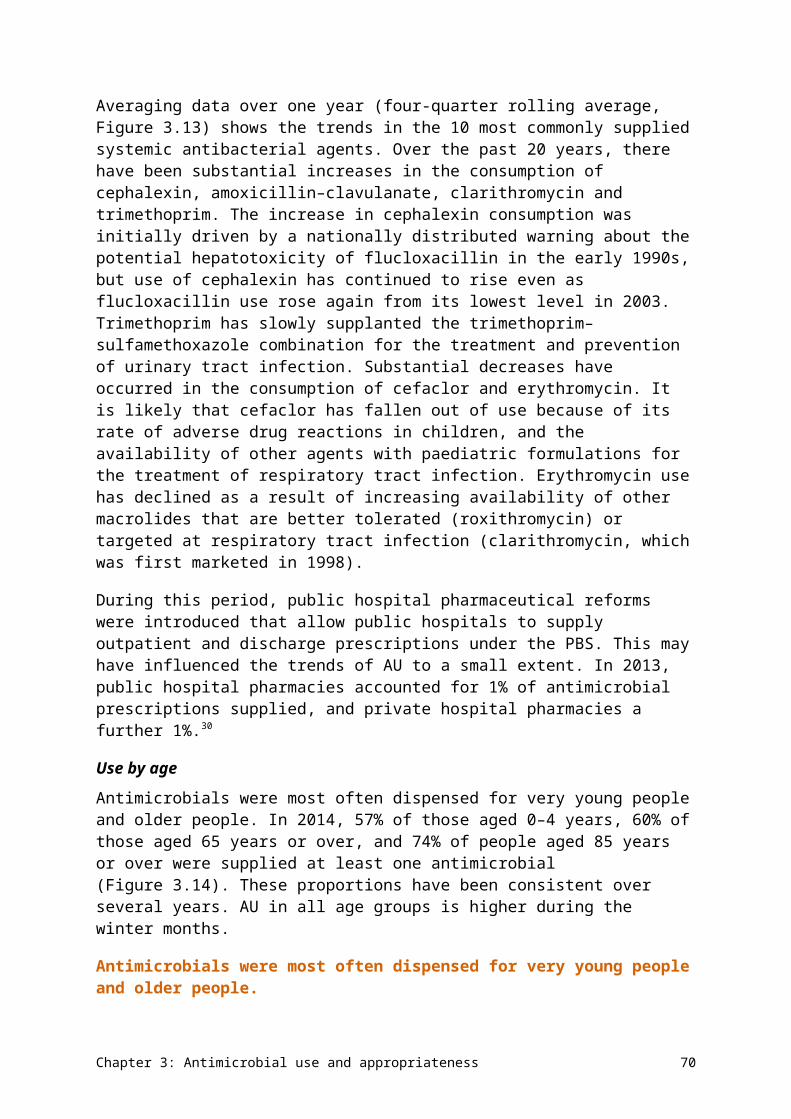
Section of report
Organism Data source
4.14 Streptococcus pyogenes • OrgTRxa – Queensland public hospitals and health services
• SNPa – Queensland and northern NSW communities, private hospitals and residential aged care facilities
AGAR = Australian Group on Antimicrobial Resistance; NNDSS = National Notifiable Diseases Surveillance System; NNN = National Neisseria Network; NSW = New South Wales; OrgTRx = Queensland Health passive antimicrobial resistance surveillance system in hospitals; SNP = Sullivan Nicolaides Pathologya For antimicrobials where ≥75% of isolates were tested using the European Committee on Antimicrobial Susceptibility
Testing (EUCAST) interpretive criteriab National data from AGAR using EUCAST interpretive criteria (except for cefazolin, where Clinical and Laboratory
Standards Institute [CLSI] interpretive criteria were used)c All Australian Mycobacterium Reference Laboratory Network laboratories that provide data to the NNDSS now use the
same commercial broth system for susceptibility testing for Mycobacterium tuberculosis, but different susceptibility testing methods have been used in the past in some laboratories. For the purposes of reporting historical trend data, the results of other methods have been assumed to be equivalent.
d All laboratories in the network test every isolate against the four first-line agents. Tests against additional antimycobacterial agents are conducted when (1) resistance to isoniazid and rifampicin is detected, (2) resistance to two or more first-line agents is detected, and (3) patients experience severe adverse reactions to first-line agents. Interpretive criteria for resistance are currently those of the CLSI.
e Most cases of gonococcal infection are now diagnosed using nucleic acid techniques, and specimens for culture are not collected. Because current susceptibility testing methods depend on obtaining a culture of the organism, only a minority of cases undergo susceptibility testing.
f There was insufficient data to report the prevalence of resistance for strains causing meningitis.
Chapter 4: Antimicrobial resistance 78
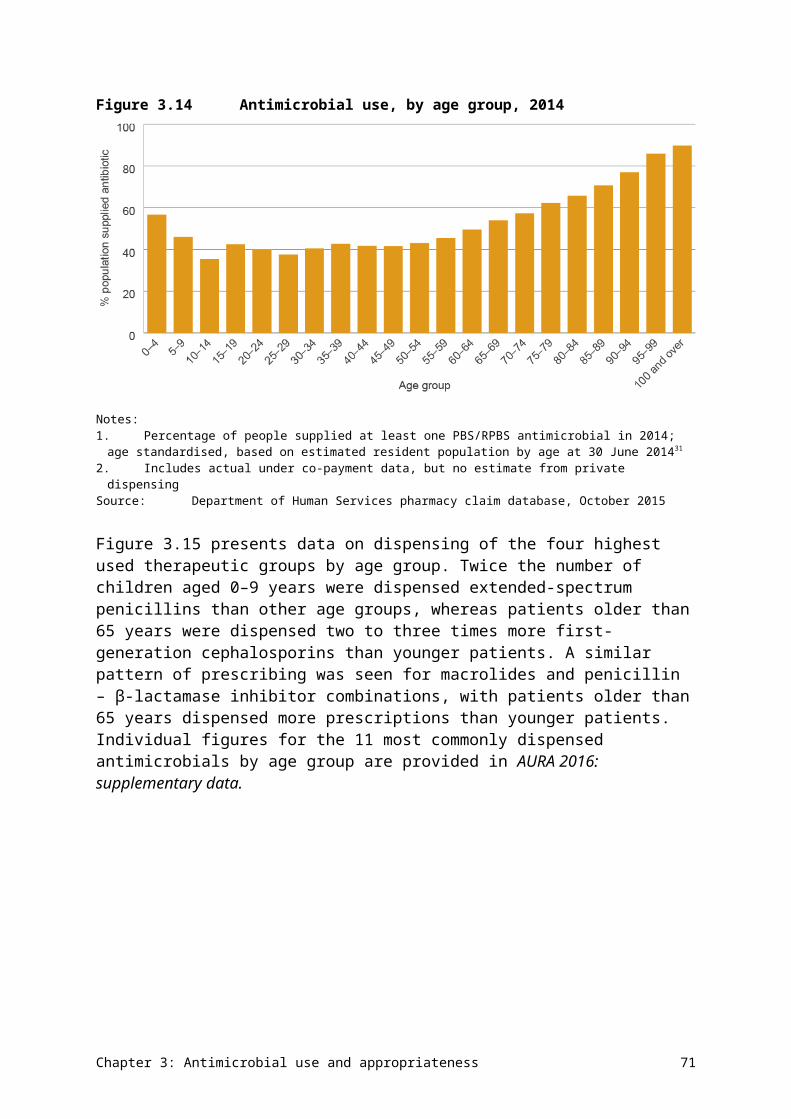
Table 4.2 Summary of antimicrobial resistance for the high-priority organisms
Chapter 4: Antimicrobial resistance 79
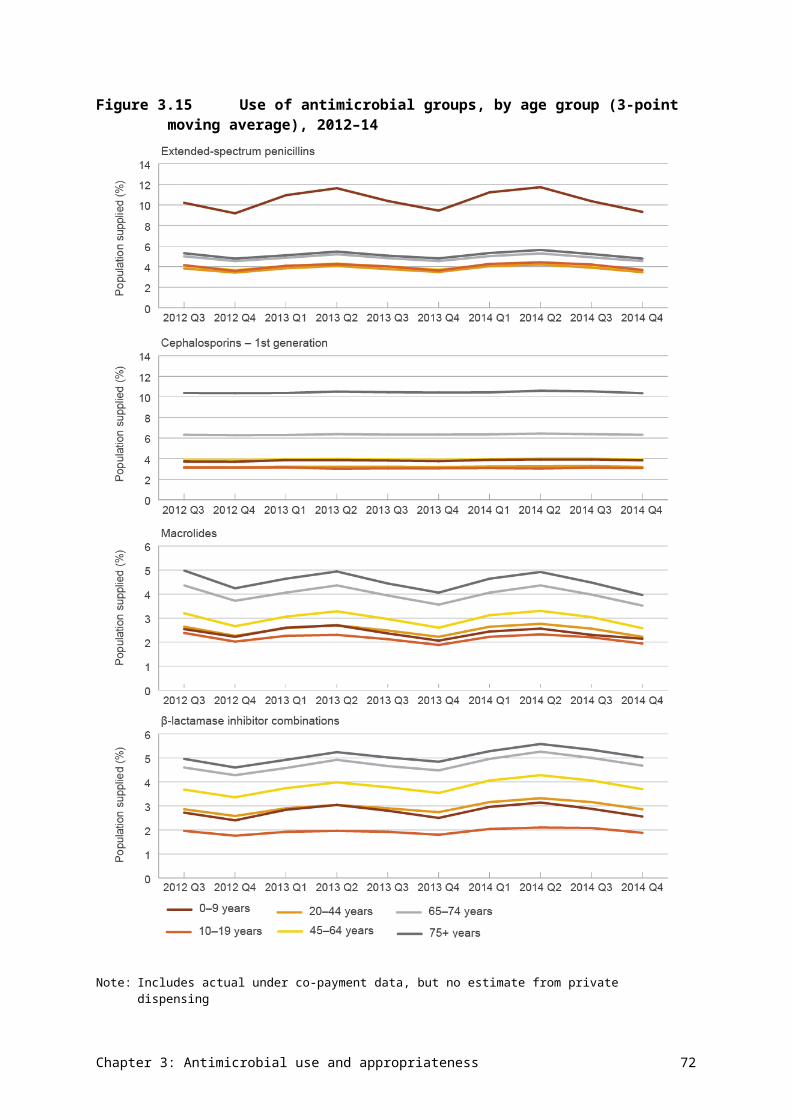
Organism Main types of infection Where seen Important antimicrobials for treatment and % resistant, 2014
Acinetobacter baumannii
Ventilator-associated pneumonia, severe burn infections
Intensive care units, burns units
• Ciprofloxacin: 4.1• Gentamicin: 2.4• Meropenem: 3.6
Escherichia coli Urinary tract infections, biliary tract infections, other intra-abdominal infections, septicaemia
Community, hospitals
• Amoxicillin–clavulanate: 18.2–21.1
• Ampicillin/amoxicillin: 42.3–51.3
• Cefazolin: 15.2–25.0• Ceftriaxone: 5.1–12.4• Ciprofloxacin: 6.2–8.7• Gentamicin: 4.5–7.0• Piperacillin–tazobactam: 5.3–9.4• Trimethoprim: 21.0–29.4• Multidrug resistant: 13.1
Enterobacter cloacae
Urinary tract infections, other intra-abdominal infections, septicaemia
Hospitals • Ceftriaxone: 23.8–28.5• Piperacillin–tazobactam: 24.3–
32.2• Trimethoprim: 18.3–21.3• Gentamicin: 7.2–7.8• Ciprofloxacin: 3.7–5.2• Meropenem: 1.1–2.6• Multidrug resistant: 13.4
Enterococcus faecalis
Urinary tract infections, biliary tract infections, other intra-abdominal infections, septicaemia, endocarditis (heart valve infections)
Community, hospitals
• Ampicillin: 0.3–0.6• Vancomycin: 0.3–0.4
Enterococcus faecium
Urinary tract infections, biliary tract infections, other intra-abdominal infections, septicaemia
Hospitals • Ampicillin: 83.3–94.5• Linezolid: 0.2–1.1• Vancomycin: 45.7–49.9
Klebsiella pneumoniae
Urinary tract infections, other intra-abdominal infections, septicaemia
Community • Amoxicillin–clavulanate: 6.2–9.4• Ceftriaxone: 4.3–6.6• Ciprofloxacin: 4.5–6.2• Gentamicin: 3.1–4.9• Piperacillin–tazobactam: 7.6–8.9• Trimethoprim: 12.3–16.6• Multidrug resistant: 9.0
Mycobacterium tuberculosis
Pulmonary tuberculosis, extrapulmonary tuberculosis
Community • Ethambutol: 1.2• Isoniazid: 8.5• Pyrazinamide: 2.1• Rifampicin: 2.4• Multidrug resistant: 1.7
Chapter 4: Antimicrobial resistance 80
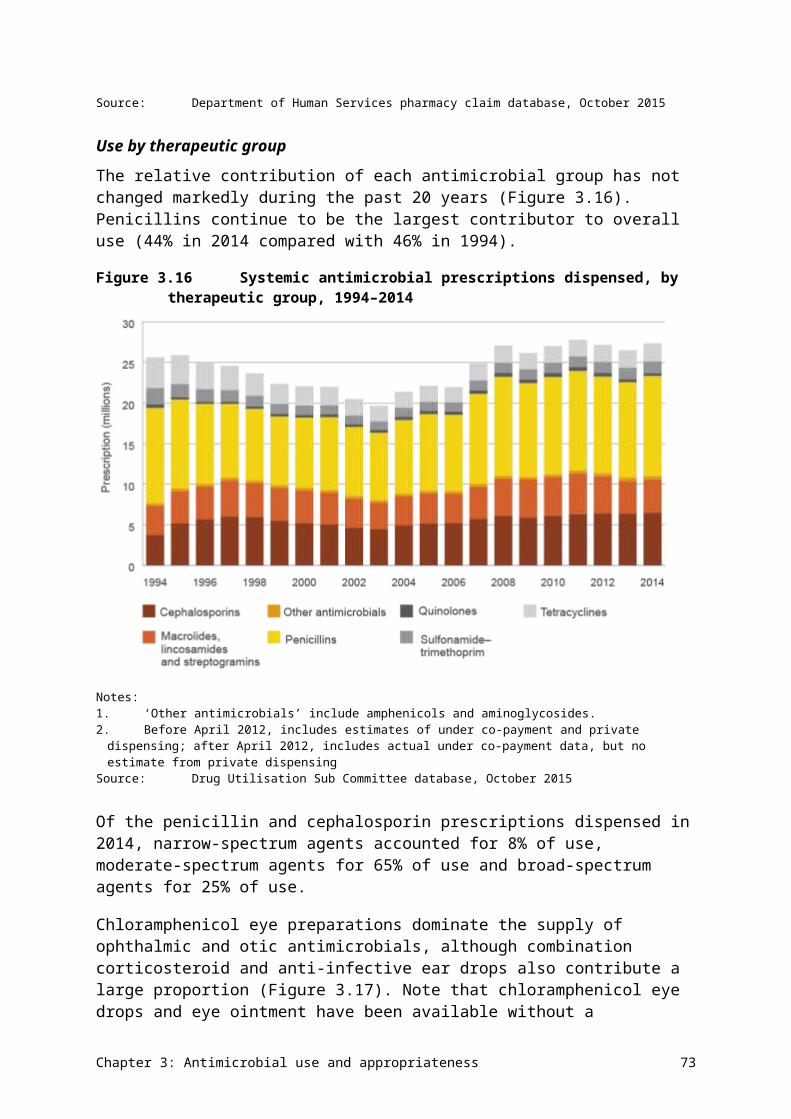
Organism Main types of infection Where seen Important antimicrobials for treatment and % resistant, 2014
Neisseria gonorrhoeae
Gonorrhoea Community • Azithromycin: 2.5• Benzylpenicillin: 28.5• Ceftriaxone: 5.4 (decreased
susceptibility)• Ciprofloxacin: 36.4
Neisseria meningitidis
Septicaemia Community • Benzylpenicillin: 15.8 (decreased susceptibility)
• Ceftriaxone: 0.0• Ciprofloxacin: 0.0• Rifampicin: 2.1
Pseudomonas aeruginosa
Urinary tract infections, burn infections, cystic fibrosis exacerbations
Community, hospitals
• Ceftazidime: 4.5• Ciprofloxacin: 6.7• Gentamicin: 5.3• Meropenem: 4.0• Piperacillin–tazobactam: 10.3
Salmonella species (nontyphoidal)
Gastroenteritis, septicaemia Community • Ampicillin: 6.7–7.7• Ceftriaxone: 0.6–1.9• Ciprofloxacin: 0–1.1
Salmonella Typhi/Paratyphi
Typhoid fever (septicaemia) Community • Ceftriaxone: 0• Ciprofloxacin: 12.2
Shigella sonnei Bacillary dysentery Community • Ampicillin: 10.6• Ceftriaxone: 3.1• Ciprofloxacin: 9.4
Shigella flexneri Bacillary dysentery Community • Ampicillin: 57.1• Ceftriaxone: 0• Ciprofloxacin: 0
Staphylococcus aureus
Skin, wound and soft tissue infections; bone and joint infections; device-related infections; septicaemia; endocarditis (heart valve infections)
Community, hospitals
• Benzylpenicillin: 83.1–88.7• Clindamycin: 7.1–10.0• Erythromycin (and other
macrolides): 16.5–17.0• Oxacillin (methicillin): 15.8–17.4
Staphylococcus aureus (methicillin resistant)
Skin, wound and soft tissue infections; bone and joint infections; device-related infections; septicaemia; endocarditis (heart valve infections)
Community, hospitals
• Clindamycin: 14.2–19.6• Fusidic acid: 4.6–5.9• Linezolid: 0.1–0.3• Rifampicin: 0.8–0.9• Trimethoprim–sulfamethoxazole:
2.5–11.9• Vancomycin: 0.0
Chapter 4: Antimicrobial resistance 81
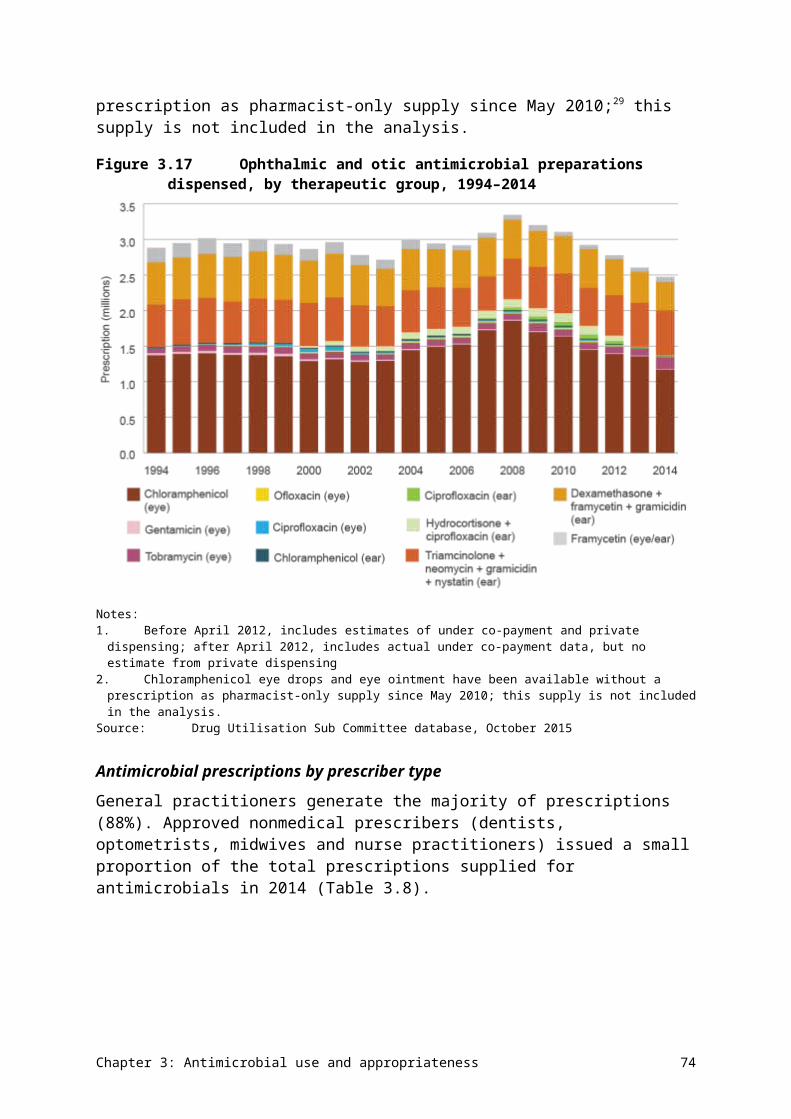
Organism Main types of infection Where seen Important antimicrobials for treatment and % resistant, 2014
Streptococcus agalactiae
Skin and soft tissue infections, urinary tract infections, newborn septicaemia
Community • Benzylpenicillin: 0.0• Clindamycin: 17.1• Erythromycin (and other
macrolides): 22.7• Trimethoprim: 17.2
Streptococcus pneumoniae
Otitis media (middle ear infections), sinusitis, acute exacerbation of chronic obstructive lung disease, pneumonia, meningitis, septicaemia
Community • Benzylpenicillin (outside the central nervous system): 2.0–2.3
• Erythromycin (and other macrolides): 21.1–25.9
• Tetracycline (and doxycycline): 21.1–25.6
Streptococcus pyogenes
Skin, wound and soft tissue infections; septicaemia
Community • Benzylpenicillin: 0.0• Erythromycin (and other
macrolides): 3.4
4.2 Acinetobacter baumannii
Health impact
Acinetobacter baumannii is an environmental organism that causes infections in patients with compromised physical barriers and immunity. The most common infections caused by this species are ventilator-associated pneumonia, and traumatic and burn wound infections. The species can cause sustained outbreaks in certain clinical settings, such as intensive care and burns units.
Treatment
Because of its pattern of intrinsic resistances, the preferred agents to treat serious A. baumannii infections are carbapenems.
Types and impact of resistance
A. baumannii and related species have a high propensity for developing resistance to multiple antimicrobial agents, including broad-spectrum agents such as carbapenems. Sometimes, they are only susceptible to potentially toxic antimicrobials, such as colistin.
A. baumannii and related species have a high propensity for developing resistance to multiple antimicrobial agents.
Key findings (Queensland)
Rates of resistance to key antimicrobial agents were low in Queensland in 2014 (Figure 4.1). Resistance rates were higher in hospitals than in the community (Figure 4.2), which might be attributable to more resistant strains being established in some hospital units.
Chapter 4: Antimicrobial resistance 82
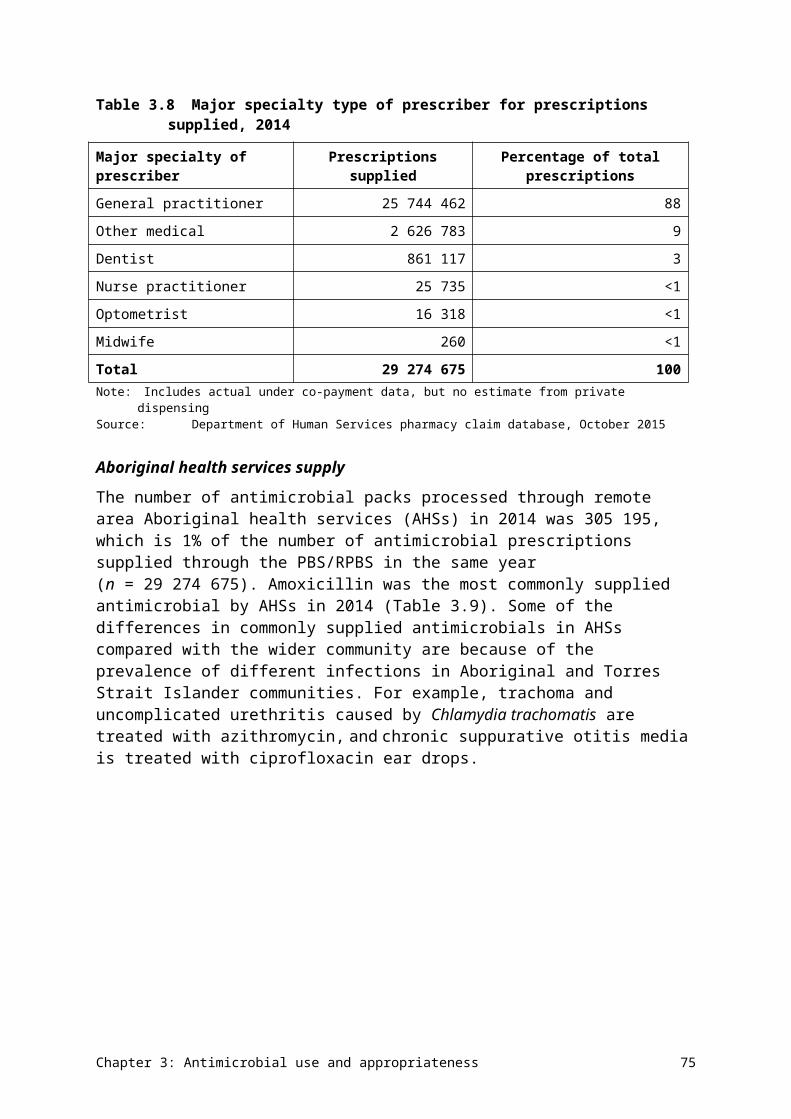
Figure 4.1 Acinetobacter baumannii resistance to individual agents, 2014
Sources:OrgTRx (Queensland); Sullivan Nicolaides Pathology (Queensland and northern New South Wales)
Figure 4.2 Acinetobacter baumannii resistance, by clinical setting, 2014
na = not available (either not tested or tested against an inadequate number of isolates)Sources:OrgTRx (public hospitals and health services); Sullivan Nicolaides Pathology (private hospitals and community)
Data table: Figure 4.2
Agent Public hospitals and health services (n = 573), % resistant
Private hospitals(n = 54), % resistant
Community(n = 165), % resistant
Gentamicin 2.8 1.9 1.2
Ciprofloxacin 4.2 2.4 na
Meropenem 3.5 4.4 na
Chapter 4: Antimicrobial resistance 83
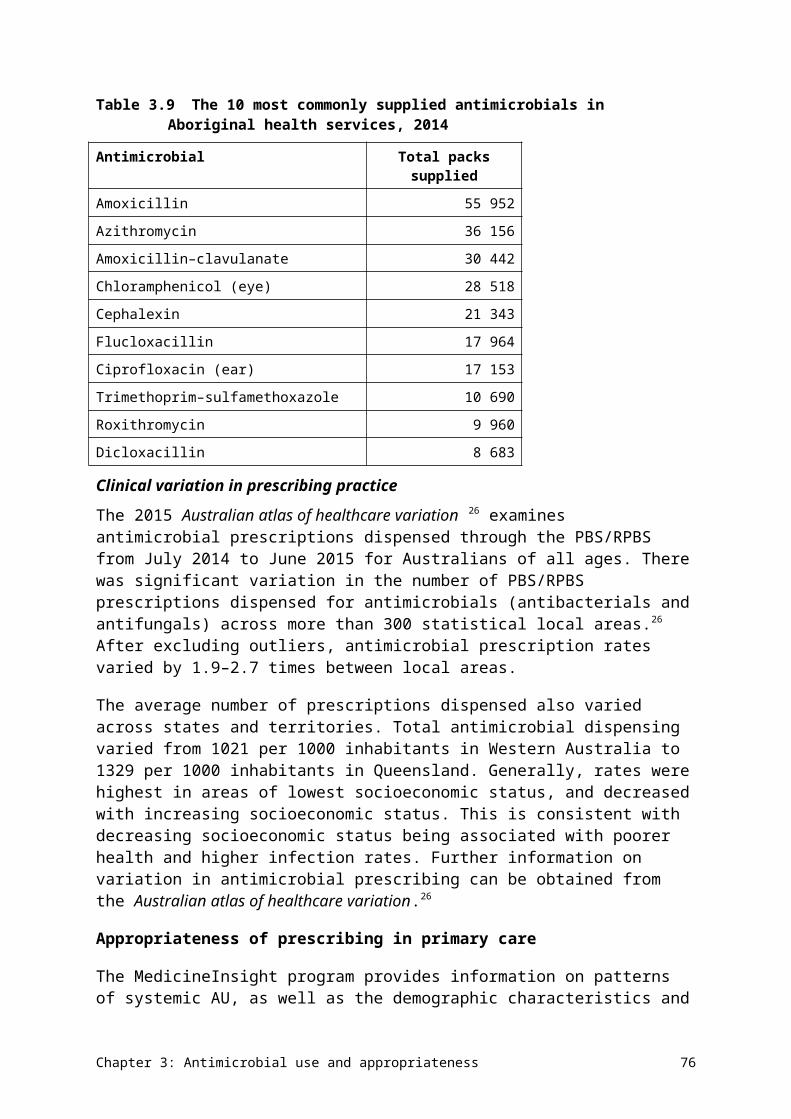
4.3 Enterobacteriaceae
Health impact
The Enterobacteriaceae is a large family of related bacteria. Many of its members are associated with infections in humans. Of these, Escherichia coli and Klebsiella pneumoniae are the most common and important species, and cause community- and hospital-associated infections. Enterobacter cloacae complex is a common pathogen in hospital care. The Enterobacteriaceae family also includes Salmonella and Shigella species; these are reported on separately in Sections 4.9 and 4.10.
E. coli, K. pneumoniae and Enterobacter cloacae are associated with a range of infections, including urinary tract infections, biliary infections, other intra-abdominal infections (including those following surgery, and often mixed with other pathogens) and septicaemia. Less frequently, these species are a cause of bacteraemia from intravascular lines and meningitis. E. coli is the most common cause of urinary tract infection and septicaemia.
Table 4.3 shows AGAR data for the most common clinical syndromes associated with Enterobacteriaceae. Urinary tract infections with these organisms are more common in females, while other clinical manifestations are more common in males.
Table 4.3 Principal clinical manifestations of infections with Enterobacteriaceae (all species, blood culture isolates), 2014
Clinical manifestation Male Female Total Males per 100
females
Urinary tract infection 834 1141 1975 73
Biliary tract infection (including cholangitis) 441 294 735 150
No focus (e.g. febrile neutropenia) 343 257 600 133
Intra-abdominal infection other than biliary tract 315 195 510 162
Other clinical syndrome 188 134 322 140
Device-related infection without metastatic focus 132 108 240 122
Skin and skin structure infection 90 45 135 200
Osteomyelitis/septic arthritis 24 15 39 160
Device-related infection with metastatic focus 9 5 14 180
Total 2376 2194 4570 108Source: Australian Group on Antimicrobial Resistance (national)
Treatment
β-lactam agents, including those combined with β-lactamase inhibitors, are preferred for treatment of infections caused by these species. The aminoglycosides (especially gentamicin) are also recommended, usually for empirical use, pending the results of culture and susceptibility testing. In Australia, fluoroquinolones are recommended only for strains that are resistant to other classes of antimicrobials. Trimethoprim and cotrimoxazole (trimethoprim–sulfamethoxazole) are recommended for treatment of lower urinary tract infection.
Chapter 4: Antimicrobial resistance 84
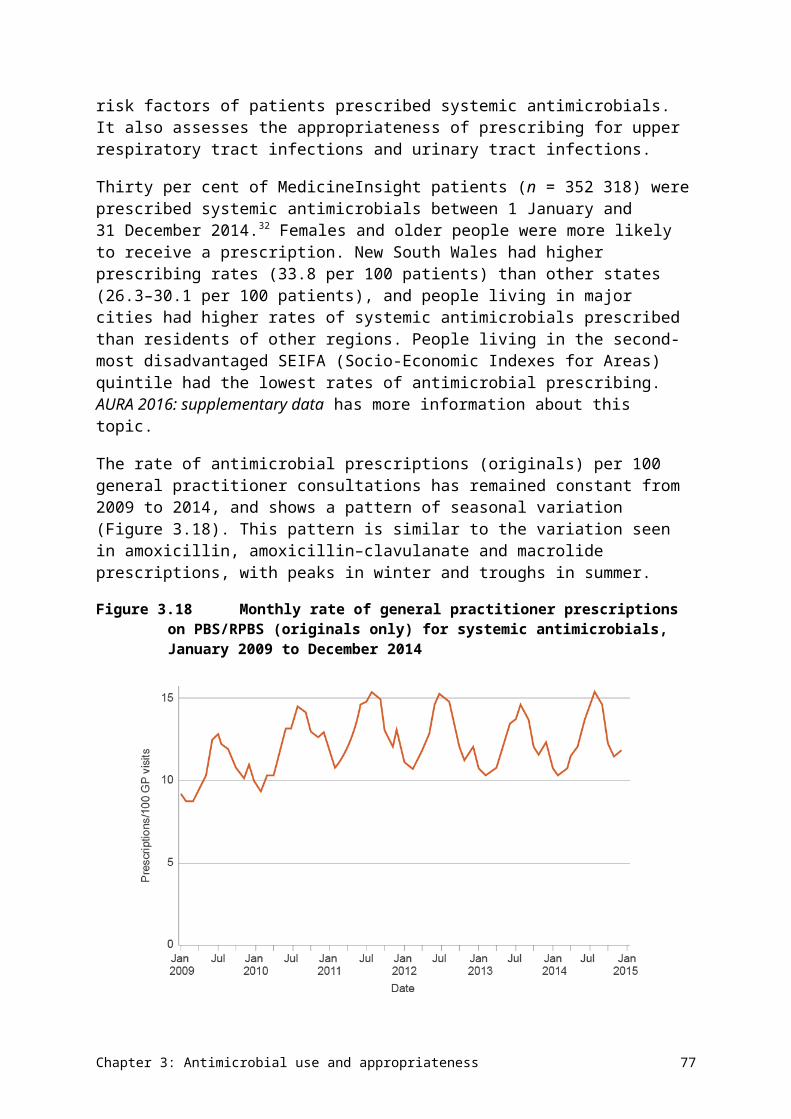
Types and impact of resistance
The most common resistance mechanisms in Enterobacteriaceae are β-lactamases. The acquired TEM-1 β-lactamase has become so common worldwide that it is found in at least half of the strains isolated from humans in Australia, making them resistant to ampicillin and amoxicillin. Both K. pneumoniae and E. cloacae complex contain intrinsic β-lactamases that make them naturally resistant to ampicillin/amoxicillin. In addition, the intrinsic β-lactamase of E. cloacae complex makes this species resistant to first-generation cephalosporins such as cefazolin and cephalexin, and the enzyme can be easily upregulated to make the species resistant to third-generation cephalosporins such as ceftriaxone, cefotaxime and ceftazidime. The β-lactam/β-lactamase inhibitor combinations amoxicillin–clavulanate and piperacillin–tazobactam are the usual treatments for TEM-1–producing E. coli, K. pneumoniae and E. cloacae complex, along with third-generation cephalosporins.
The acquired β-lactamases of greatest interest are the extended-spectrum β-lactamases (ESBLs), the plasmid-borne AmpC enzymes (pAmpCs) and the carbapenemases. ESBLs and pAmpCs render Enterobacteriaceae resistant to third-generation cephalosporins, and carbapenemases confer resistance to carbapenems and almost all other β-lactams. Carbapenemase-producing Enterobacteriaceae (CPE) are almost always highly multidrug resistant. Meropenem is the most widely used option for infections caused by strains that produce ESBLs and pAmpCs; the suitability of piperacillin–tazobactam as a ‘carbapenem sparing’ agent for strains with ESBLs is under investigation. Infections caused by CPE require ‘last line’ reserve agents such as colistin, an agent with significant toxicity.
Other resistance mechanisms in Enterobacteriaceae that have clinical impact include the aminoglycoside-modifying enzymes, which render strains resistant to gentamicin and tobramycin (but susceptible to amikacin), and the ribosomal methylases, which confer resistance to gentamicin, tobramycin and amikacin. Resistance to fluoroquinolones is usually through mutations at the target sites (the topoisomerases), but, recently, plasmid-borne resistance has emerged. Resistance to trimethoprim and sulfamethoxazole is common and occurs through a variety of mechanisms.
E. coli, K. pneumoniae and E. cloacae complex are noted for their capacity to acquire and transmit resistance genes among themselves and to some other genera through horizontal gene transfer. In addition, this family has specialised mechanisms (integrons) for capturing and accumulating resistance genes, giving them great capacity to become multidrug resistant. The number of agents available for treatment of highly multidrug-resistant strains is limited, and all these agents have greater toxicity than the β-lactams.
E. coli, K. pneumoniae and E. cloacae complex are noted for their capacity to acquire and transmit resistance genes among themselves and to some other genera through horizontal gene transfer.
Key findings (national)
There were no substantial differences in resistances between specimen sources for any of the three reported species. Resistance to ampicillin (and amoxicillin) was the most common resistance in E. coli, and intrinsic in K. pneumoniae and E. cloacae complex. Resistance to amoxicillin–clavulanate occurred in around 20% of E. coli and 10% of K. pneumoniae (Figures 4.3 and 4.5). Resistance to cefazolin and trimethoprim (with or without
Chapter 4: Antimicrobial resistance 85
sulfamethoxazole) is common in E. coli but less so in K. pneumoniae. The ESBL phenotype was found in 7–12% of E. coli and 4–7% of K. pneumoniae. Resistance to third-generation cephalosporins (ceftriaxone) in E. cloacae complex was 24–28% (Figure 4.7), mostly due to stably derepressed mutants of its intrinsic cephalosporinase. The lower resistance rate to cefepime in this species (3.2%) is an indication of the proportion of this species that harbours ESBLs. Fluoroquinolone (ciprofloxacin, norfloxacin) resistance was detected in 6–10% of E. coli, 4–6% of K. pneumoniae and 4–5% of E. cloacae complex. Resistance to carbapenems (meropenem) was less than 0.5% in E. coli and K. pneumoniae, but 1–3% in E. cloacae complex (Figures 4.3, 4.5 and 4.7).
Rates of resistance were lower in the community for most agents where data was available, compared with hospitals and residential aged care facilities (Figures 4.4, 4.6 and 4.8).
Figure 4.3 Escherichia coli resistance, by specimen source, 2014
AMC = amoxicillin–clavulanate; AMP = ampicillin; CIP= ciprofloxacin; CTR = ceftriaxone; CZL = cefazolin; GEN = gentamicin; MER = meropenem; na = not available (either not tested or tested against an inadequate number of isolates); NOR = norfloxacin; PTZ = piperacillin–tazobactam; SXT = trimethoprim–sulfamethoxazole; TMP = trimethoprim Sources:OrgTRx (Queensland); Australian Group on Antimicrobial Resistance (national); Sullivan Nicolaides Pathology
(Queensland and northern New South Wales)
Chapter 4: Antimicrobial resistance 86
Data table: Figure 4.3
Agent Blood (n=5,937), % resistant
Urine (n=82,429), % resistant
Other (n=2,685), % resistant
AMP 51.3 42.3 49.8
AMC 20.9 18.2 21.1
CZL 19.4 15.2 25.0
CTR 7.5 5.1 12.4
PTZ 6.3 5.3 9.4
TMP 29.4 21.0 na
SXT 26.8 19.9 18.9
GEN 7.0 4.5 6.0
CIP 8.7 6.2 9.7
NOR na 6.6 na
MER 0.1 0.0 0.0
Figure 4.4 Escherichia coli resistance, by clinical setting, 2014
AMC = amoxicillin–clavulanate; AMP = ampicillin; CIP= ciprofloxacin; CTR = ceftriaxone; CZL = cefazolin; GEN = gentamicin; MER = meropenem; na = not available (either not tested or tested against an inadequate number of isolates); NOR = norfloxacin; PTZ = piperacillin–tazobactam; SXT = trimethoprim–sulfamethoxazole; TMP = trimethoprim Sources:Australian Group on Antimicrobial Resistance (AGAR) (public hospitals); OrgTRx (public hospitals and health
services); AGAR and Sullivan Nicolaides Pathology (SNP) (private hospitals); SNP (community and residential aged care facilities)
Chapter 4: Antimicrobial resistance 87
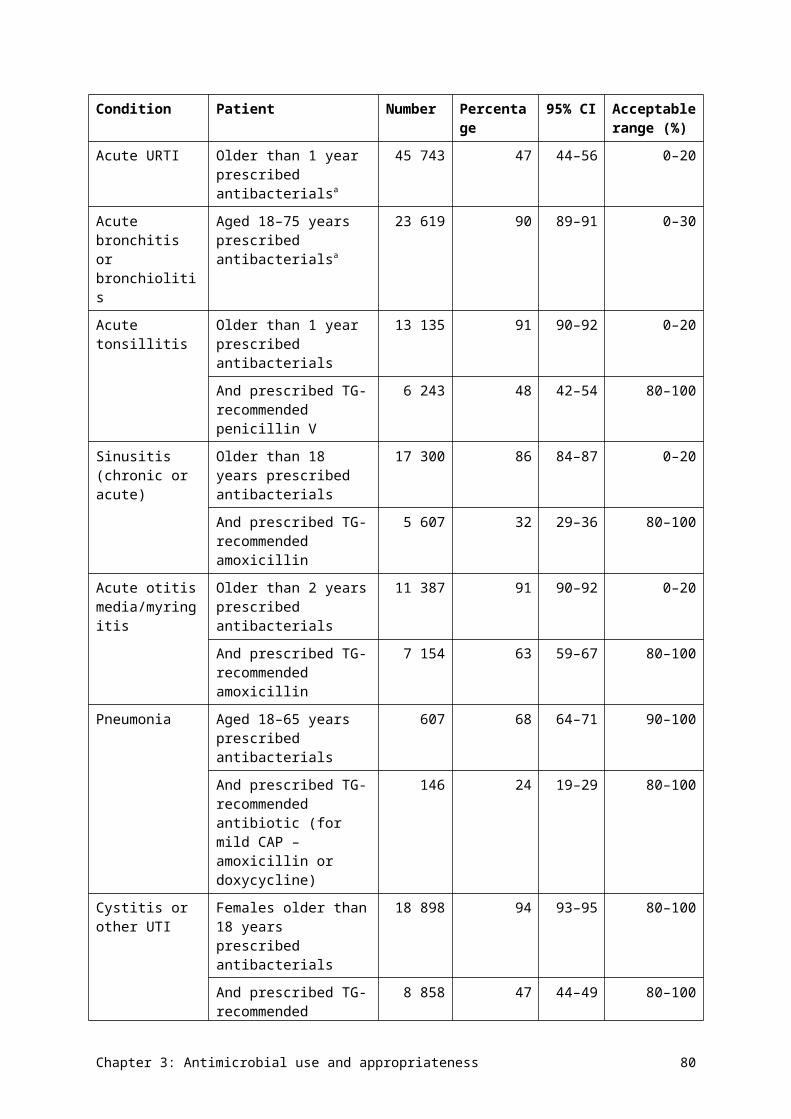
Data table: Figure 4.4
Agent Public hospitals (n=3,352), % resistant
Public hospitals and health services (n=31,542), % resistant
Private hospitals (n=4,549), % resistant
Community (48,702), % resistant
Residential aged care facility (n=2,906), % resistant
AMP 51.9 45.9 47.3 40.2 46.2
AMC 21.0 18.5 18.4 na na
CZL 20.3 15.9 26.7 19.1 41.0
CTR 8.9 4.9 10.4 0.0 na
PTZ 6.5 5.6 9.0 3.7 na
TMP 29.5 22.3 25.3 19.5 27.3
SXT 27.6 20.1 25.9 16.6 23.1
GEN 7.4 4.4 7.2 2.5 10.3
CIP 10.6 6.3 10.8 3.3 na
NOR 16.4 9.6 10.0 4.4 11.7
MER 0.1 0.0 0.0 0.0 na
Figure 4.5 Klebsiella pneumoniae resistance, by specimen source, 2014
AMC = amoxicillin–clavulanate; CIP= ciprofloxacin; CTR = ceftriaxone; CZL = cefazolin; GEN = gentamicin; MER = meropenem; na = not available (either not tested or tested against an inadequate number of isolates); NOR = norfloxacin; PTZ = piperacillin–tazobactam; SXT = trimethoprim–sulfamethoxazole; TMP = trimethoprim Sources:OrgTRx (Queensland); Australian Group on Antimicrobial Resistance (national); Sullivan Nicolaides Pathology
(Queensland and northern New South Wales)
Chapter 4: Antimicrobial resistance 88
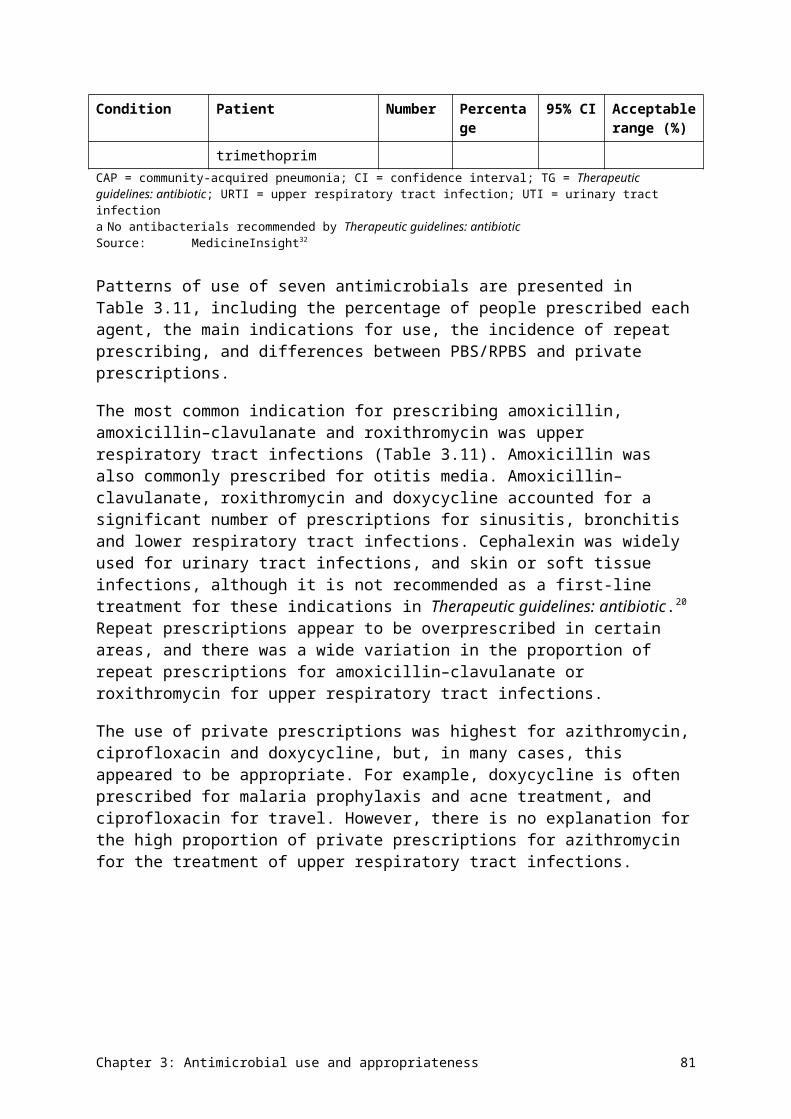
Data table: Figure 4.5
Agent Blood (n=1,466), % resistant
Urine (n=10,689), % resistant
Other (n=1,108), % resistant
CZL 10.6 6.6 9.2
AMC 9.4 6.2 6.6
CTR 6.6 4.3 6.1
PTZ 7.6 8.9 8.9
TMP 16.6 12.3 na
SXT 14.0 8.2 8.0
GEN 4.6 3.1 4.9
CIP 4.5 4.5 6.2
NOR na 5.6 na
MER 0.5 0.1 0.0
Figure 4.6 Klebsiella pneumoniae resistance, by clinical setting, 2014
AMC = amoxicillin–clavulanate; CIP= ciprofloxacin; CTR = ceftriaxone; CZL = cefazolin; GEN = gentamicin; MER = meropenem; na = not available (either not tested or tested against an inadequate number of isolates); NOR = norfloxacin; PTZ = piperacillin–tazobactam; SXT = trimethoprim–sulfamethoxazole; TMP = trimethoprim Sources:Australian Group on Antimicrobial Resistance (AGAR) (public hospitals); OrgTRx (public hospitals and health
services); AGAR and Sullivan Nicolaides Pathology (SNP) (private hospitals); SNP (community and residential aged care facilities)
Chapter 4: Antimicrobial resistance 89
Data table: Figure 4.6
Agent Public hospitals (n=836), % resistant
Public hospitals and health services (n=5,873), % resistant
Private hospitals (n=912), % resistant
Community (n=5,102), % resistant
Residential aged care facility (n=540), % resistant
CZL 13.1 6.9 15.5 6.2 11.1
AMC 10.6 6.3 7.5 na na
CTR 8.0 4.0 8.5 0.0 na
PTZ 7.0 9.0 6.1 na na
TMP 16.6 13.1 17.4 10.1 20.0
SXT 14.7 8.2 18.8 6.2 11.1
GEN 5.6 2.8 7.3 6.2 0.0
CIP 5.0 4.5 10.2 0.0 na
NOR 12.1 8.5 9.1 2.7 6.4
MER 0.8 0.1 0.0 0.0 na
Figure 4.7 Enterobacter cloacae complex resistance, by specimen source, 2014
CIP = ciprofloxacin; CTR = ceftriaxone; CPM = cefepime; GEN = gentamicin; MER = meropenem; na = not available (either not tested or tested against an inadequate number of isolates); NOR = norfloxacin; PTZ = piperacillin–tazobactam; SXT = trimethoprim–sulfamethoxazole; TMP = trimethoprim Sources:OrgTRx (Queensland); Australian Group on Antimicrobial Resistance (national); Sullivan Nicolaides Pathology
(Queensland and northern New South Wales)
Chapter 4: Antimicrobial resistance 90
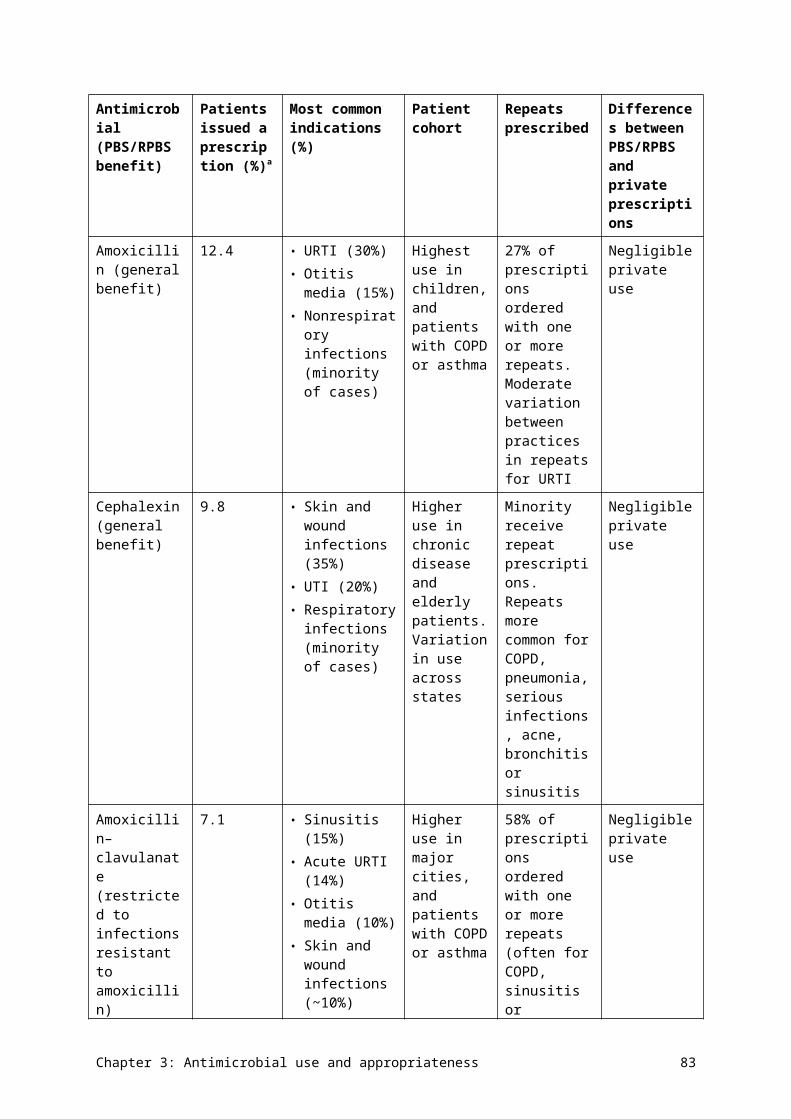
Data table: Figure 4.7
Agent Blood (n=574), % resistant
Urine (n=2,776), % resistant
Other (n=1,263), % resistant
CTR 24.2 28.5 23.8
CPM 3.2 na na
PTZ 24.3 na 32.2
TMP 18.3 21.3 na
SXT 19.9 21.8 13.6
GEN 7.2 7.5 7.8
CIP 4.7 5.2 3.7
NOR na 6.4 na
MER 2.6 1.1 1.4
Figure 4.8 Enterobacter cloacae complex resistance, by clinical setting, 2014
CIP = ciprofloxacin; CTR = ceftriaxone; GEN = gentamicin; MER = meropenem; na = not available (either not tested or tested against an inadequate number of isolates); NOR = norfloxacin; PTZ = piperacillin–tazobactam; SXT = trimethoprim–sulfamethoxazole; TMP = trimethoprimSources:Australian Group on Antimicrobial Resistance (AGAR) (public hospitals); OrgTRx (public hospitals and health
services); AGAR and Sullivan Nicolaides Pathology (SNP) (private hospitals); SNP (community and residential aged care facilities)
Chapter 4: Antimicrobial resistance 91
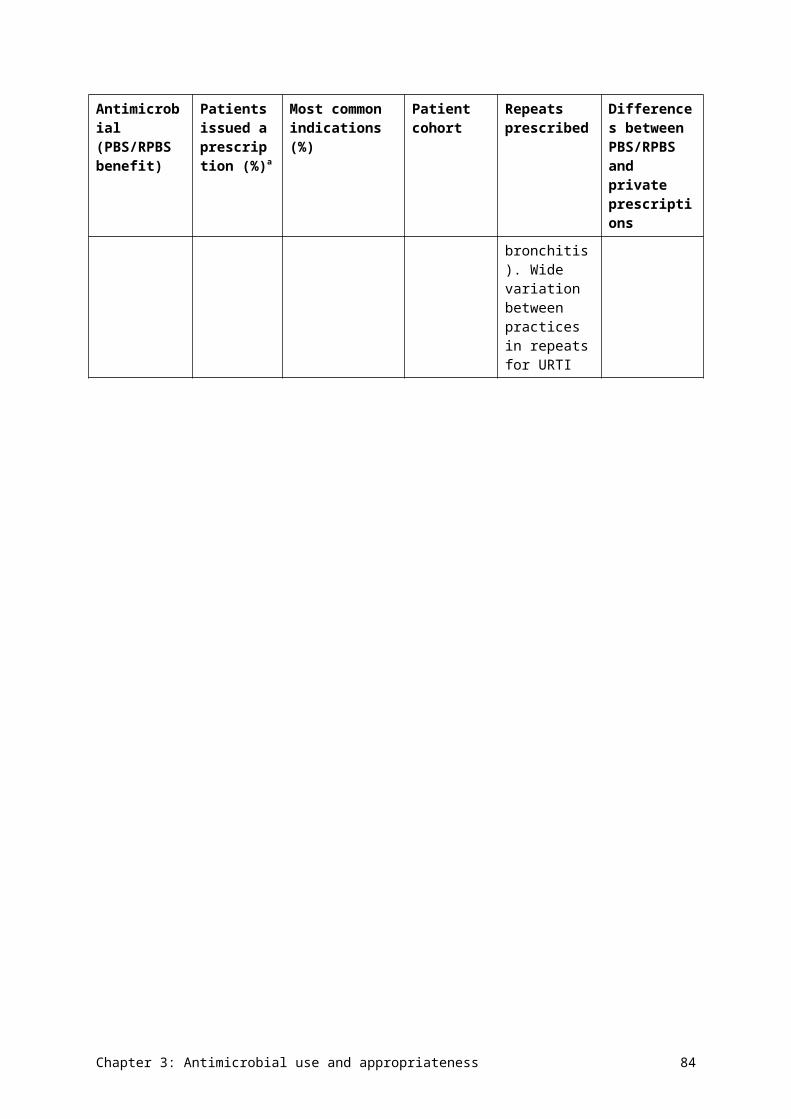
Data table: Figure 4.8
Agent Public hospitals (n=324), % resistant
Public hospitals and health services (n=2,275), % resistant
Private hospitals (n=553), % resistant
Community (n=1,270), % resistant
Residential aged care facility (n=191), % resistant
CTR 27.6 24.0 35.6 12.5 22.2
PTZ 24.7 na 30.2 0.0 0.0
TMP 17.5 24.2 22.9 16.4 32.6
SXT 17.4 18.4 21.5 3.9 10.0
GEN 6.5 6.9 11.0 1.6 13.0
CIP 3.4 4.9 4.2 1.0 0.0
NOR 11.8 8.9 4.9 3.3 9.9
MER 1.9 1.3 2.9 0.0 0.0
Jurisdictional rates
Data on resistance rates across the jurisdictions is available to AURA through the AGAR program, from blood culture isolates. Tables 4.4–4.6 show the resistance rates to all drugs tested. There were some notable differences between jurisdictions in the prevalence of some important resistances.
For E. coli, resistance to ceftriaxone ranged from 6.2% in South Australia to 12.9% in Victoria; resistance to gentamicin ranged from 5.1% in Tasmania to 9.1% in Victoria; and resistance to ciprofloxacin ranged from 6.3% in Tasmania to 14.0% in Victoria.
For K. pneumoniae, resistance to ceftriaxone ranged from 4.1% in South Australia and Western Australia to 12.1% in New South Wales; resistance to gentamicin ranged from 1.4% in South Australia to 12.9% in the Northern Territory; and resistance to ciprofloxacin ranged from 2.4% in Queensland to 12.9% in the Northern Territory.
For E. cloacae complex, resistance to gentamicin ranged from 0.0% in the Northern Territory, South Australia and Tasmania to 16.0% in the Australian Capital Territory; and resistance to ciprofloxacin ranged from 0.0% in the Northern Territory, South Australia and Tasmania to 5.6% in New South Wales.
Chapter 4: Antimicrobial resistance 92
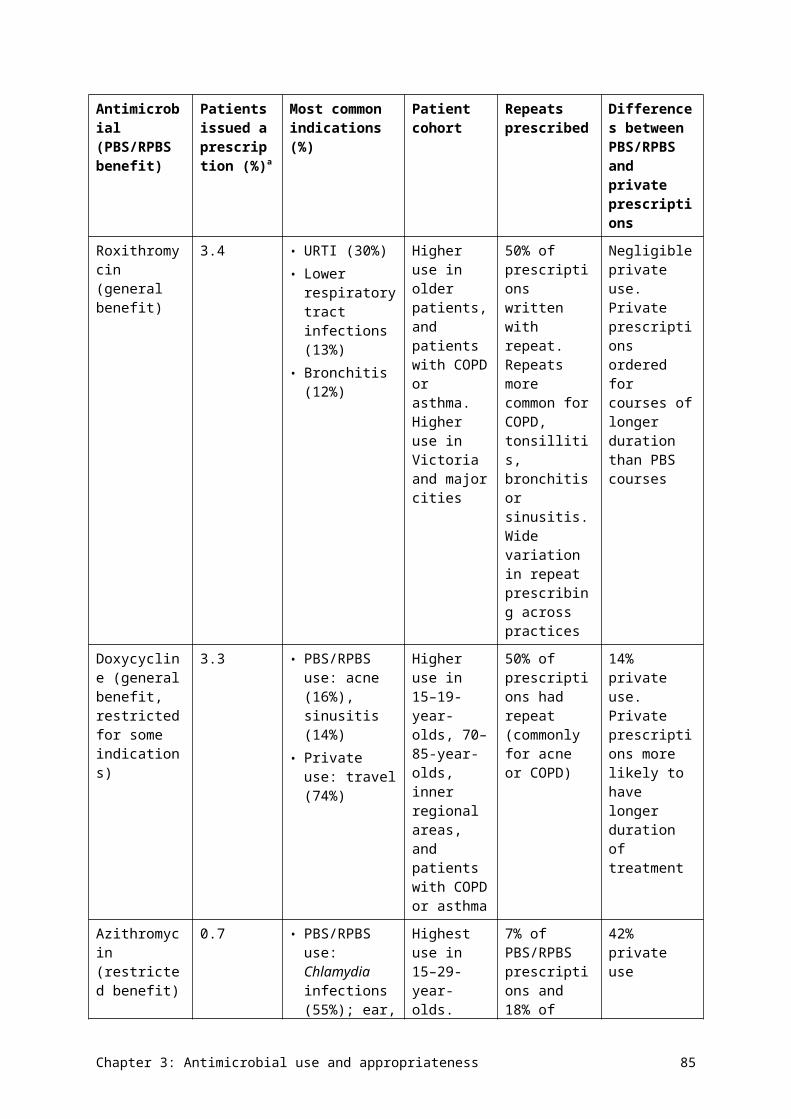
Table 4.4 Percentage of Escherichia coli resistance, by jurisdiction of testing (blood culture isolates), 2014
Antimicrobial ACT,n = 168
NSW,n = 781
NT,n = 97
Qld,n = 742
SA,n = 386
Tas,n = 79
Vic,n = 722
WA,n = 510
Australia (n)
Amikacin 0.0 0.0 0.0 0.4 0.0 0.0 0.0 0.0 0.1 (3485)
Amoxicillin–clavulanate 25.0 19.6 24.7 22.0 15.0 16.5 23.1 21.4 20.9 (3477)
Ampicillin 56.9 49.2 66.0 51.5 44.0 34.2 56.8 53.9 51.9 (3483)
Cefazolin 21.4 21.3 26.8 20.5 15.0 – 25.2a 16.0b 19.9 (2217)
Cefepime 1.8 2.9 1.0 1.2 4.4 6.3 4.8 1.6 2.9 (3485)
Ceftazidime 2.4 4.2 4.1 3.8 3.9 8.9 6.8 2.5 4.4 (3485)
Ceftriaxone 8.9 9.6 9.3 6.9 6.2 10.1 12.9 6.3 8.8 (3485)
Ciprofloxacin 11.9 10.8 8.2 6.5 9.8 6.3 14.0 11.6 10.4 (3485)
Gentamicin 8.9 8.3 13.4 5.9 5.7 5.1 9.1 6.3 7.5 (3486)
Meropenem 0.0 0.0 0.0 0.3 0.0 0.0 0.0 0.0 0.1 (3484)
Nitrofurantoin 1.8 0.6 2.1 1.4 1.3 0.0 2.1 2.5 1.5 (3462)
Norfloxacin 21.4 14.7 22.7 12.8 13.5 10.1 21.2 18.4 16.5 (3485)
Piperacillin–tazobactam 6.6 6.0 10.3 8.0 4.9 3.8 6.4 6.1 6.5 (3474)
Ticarcillin–clavulanate 22.0 20.7 20.6 18.5 18.1 15.2 19.7 17.8 19.2 (3451)
Tobramycin 7.7 8.2 14.4 5.9 6.0 8.9 10.4 6.9 7.9 (3482)
Trimethoprim 28.0 27.5 42.3 28.7 25.6 19.0 33.0 30.4 29.4 (3485)
Trimethoprim–sulfamethoxazole
27.5 25.6 39.2 26.8 24.4 17.7 30.9 28.6 27.6 (3483)
– = no data available; ACT = Australian Capital Territory; n = number of isolates tested; NSW = New South Wales; NT = Northern Territory; Qld = Queensland; SA = South Australia; Tas = Tasmania; Vic = Victoria; WA = Western Australiaa n = 485b n = 332Notes:1. Resistance determined using European Committee on Antimicrobial Susceptibility Testing interpretive criteria.
Chapter 4: Antimicrobial resistance 93
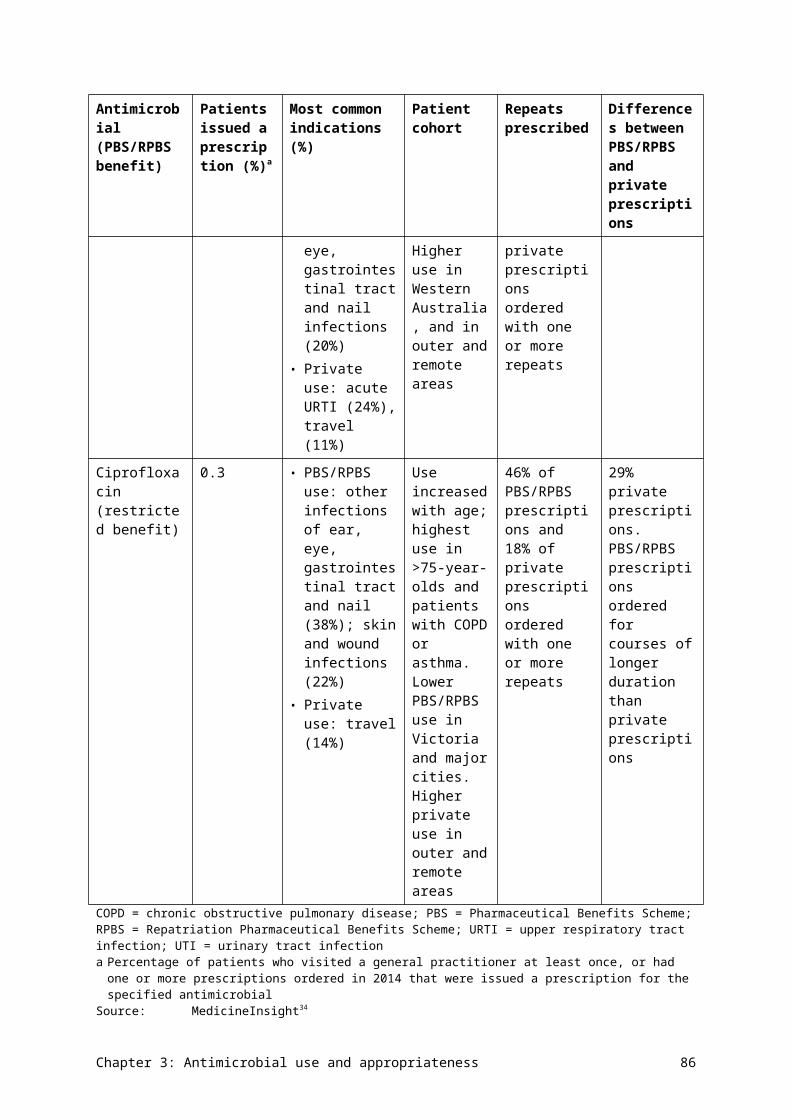
2. Not all antimicrobial agents were reported for all species.Source: Australian Group on Antimicrobial Resistance
Table 4.5 Percentage of Klebsiella pneumoniae resistance, by jurisdiction of testing (blood culture isolates), 2014
Antimicrobial ACT,n = 26
NSW,n = 206
NT,n = 31
Qld,n = 208
SA,n = 74
Tas,n = 9
Vic,n = 174
WA,n = 147
Australia (n)
Amikacin 0.0 1.9 0.0 0.0 0.0 0.0 2.3 0.0 0.9 (875)
Amoxicillin–clavulanate 23.1 12.6 9.7 11.5 5.4 0.0 11.0 6.1 10.4 (873)
Ampicillin 96.2 93.2 100.0 96.6 91.9 100.0 98.3 93.2 95.3 (875)
Cefazolin 26.9 15.5 16.1 10.1 6.8 – 16.5a 10.4b 13.1 (750)
Ceftazidime 11.5 10.2 3.2 2.9 4.1 0.0 8.0 2.0 5.8 (875)
Cefepime 7.7 8.3 0.0 1.4 0.0 0.0 2.9 1.4 3.3 (875)
Ceftriaxone 11.5 12.1 6.5 4.3 4.1 11.1 10.9 4.1 7.8 (875)
Ciprofloxacin 3.8 7.8 12.9 2.4 2.7 11.1 5.7 3.4 5.0 (874)
Gentamicin 3.8 9.7 12.9 2.9 1.4 11.1 6.9 2.0 5.5 (875)
Meropenem 3.8 1.0 0.0 0.0 0.0 0.0 1.7 0.7 0.8 (875)
Nitrofurantoin 34.6 32.5 58.1 32.7 35.1 33.3 39.1 29.9 34.6 (875)
Norfloxacin 11.5 13.6 22.6 10.1 10.8 11.1 14.9 10.9 12.6 (875)
Piperacillin–tazobactam 19.2 8.3 9.7 6.8 1.4 0.0 6.9 5.4 6.9 (872)
Ticarcillin–clavulanate 23.1 14.1 16.1 12.0 6.8 0.0 11.5 6.6c 11.4 (865)
Tobramycin 7.7 9.7 6.5 4.3 1.4 11.1 9.2 2.7 6.3 (875)
Trimethoprim 15.4 19.9 19.4 17.8 13.5 11.1 19.5 8.2 16.6 (875)
Trimethoprim–sulfamethoxazole
15.4 19.4 19.4 15.9 5.4 11.1 17.2 6.1 14.5 (874)
Chapter 4: Antimicrobial resistance 94
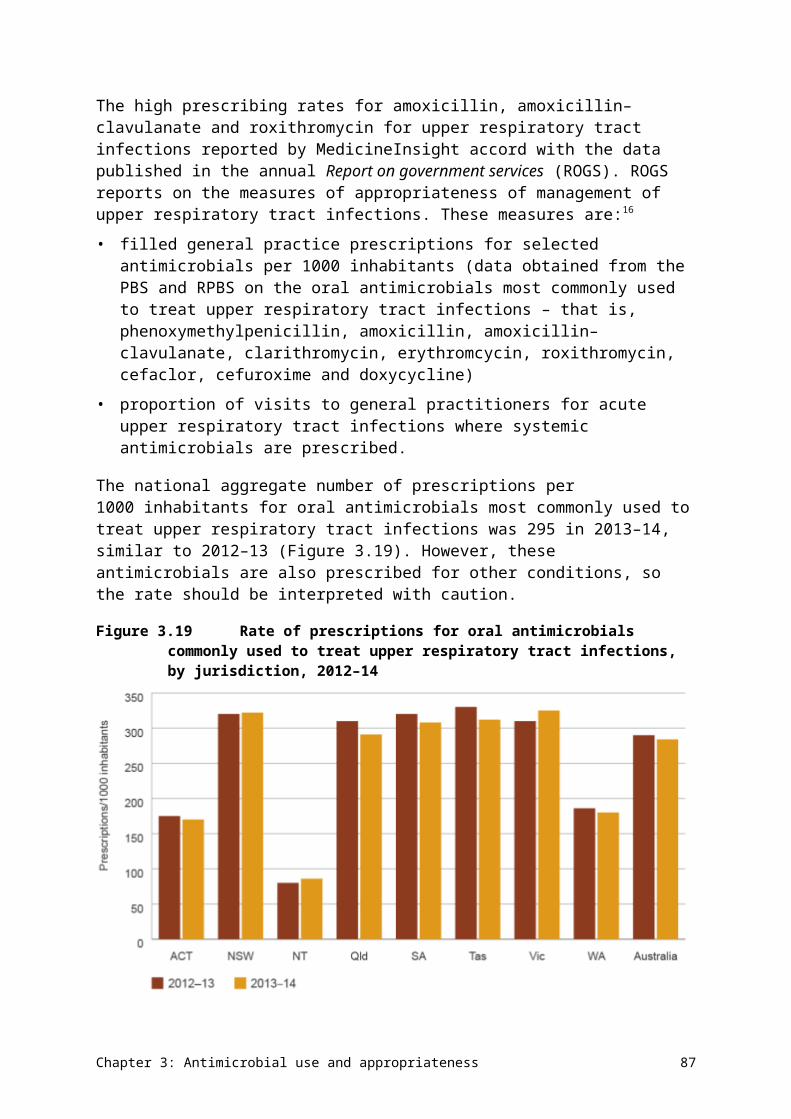
– = no data available; ACT = Australian Capital Territory; NSW = New South Wales; n = number of isolates tested; NT = Northern Territory; Qld = Queensland; SA = South Australia; Tas = Tasmania; Vic = Victoria; WA = Western Australia a n = 109b n = 96c n = 137Notes:1. Resistance determined using European Committee on Antimicrobial Susceptibility Testing interpretive criteria.2. Not all antimicrobial agents were reported for all species.Source: Australian Group on Antimicrobial Resistance
Chapter 4: Antimicrobial resistance 95
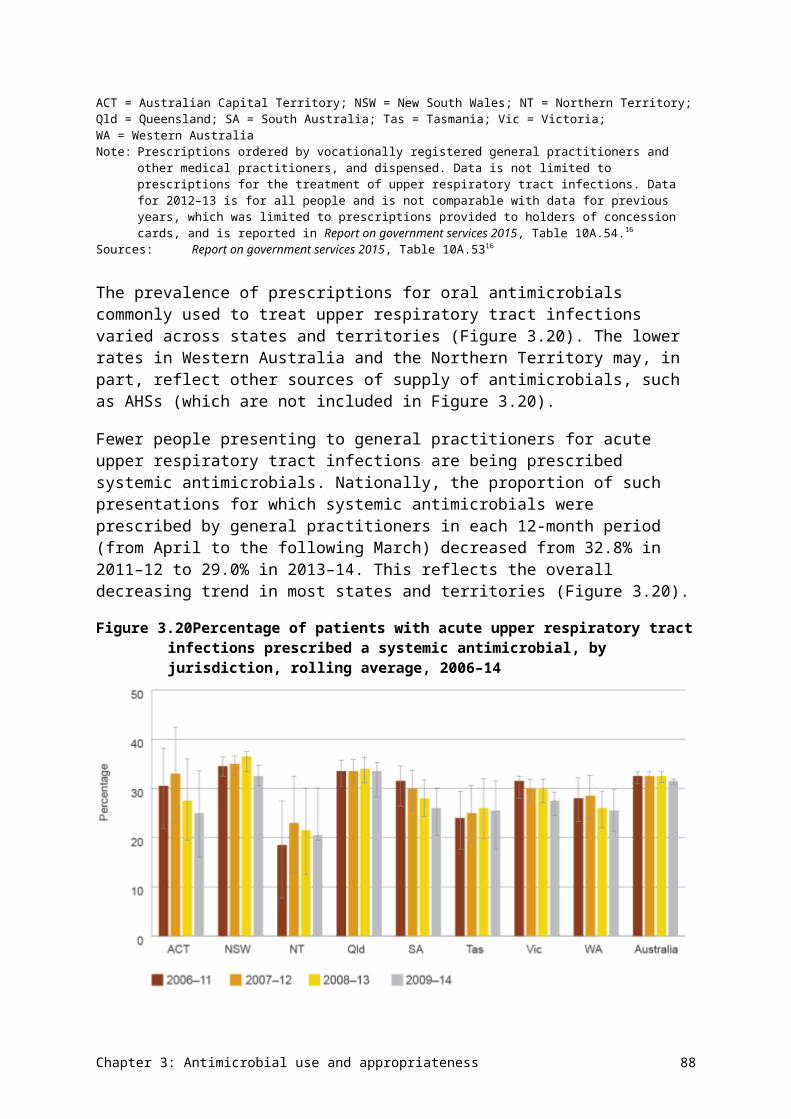
Table 4.6 Percentage of Enterobacter cloacae complex resistance, by jurisdiction of testing (blood culture isolates), 2014
Antimicrobial ACT,n = 25
NSW,n = 72
NT,n = 5
Qld,n = 101
SA,n = 20
Tas,n = 5
Vic,n = 64
WA,n = 48
National (n)
Amikacin 0.0 0.0 0.0 0.0 0.0 0.0 0.0 0.0 0.0 (340)
Amoxicillin–clavulanate 96.0 91.7 100 92.1 85.0 100 90.6 85.4 90.9 (340)
Ampicillin 92.0 86.1 100 87.1 75.0 100 90.6 85.4 87.4 (340)
Cefazolin 100.0 93.1 100 99.0 95.0 – 95.1a 90.9b 96.0 (297)
Cefepime 12.0 2.8 0.0 3.0 5.0 0.0 3.1 0.0 3.2 (339)
Ceftazidime 44.0 20.8 0.0 24.8 30.0 20.0 25.0 18.8 24.4 (340)
Ceftriaxone 44.0 23.6 0.0 26.7 30.0 20.0 28.1 25.0 27.1 (340)
Ciprofloxacin 4.0 5.6 0.0 4.0 0.0 0.0 1.6 4.2 3.5 (340)
Gentamicin 16.0 8.3 0.0 9.9 0.0 0.0 1.6 2.1 6.5 (340)
Meropenem 4.0 1.4 0.0 4.0 0.0 0.0 0.0 0.0 1.8 (340)
Nitrofurantoin 8.0 25.0 20.0 23.0 45.0 0.0 21.9 14.6 21.8 (339)
Norfloxacin 24.0 9.7 0.0 15.8 5.0 0.0 9.4 6.3 11.5 (340)
Piperacillin–tazobactam 47.6 20.6 0.0 22.8 36.8 20.0 23.8 20.8 24.2 (330)
Ticarcillin–clavulanate 48.0 29.2 0.0 26.7 35.0 20.0 29.7 27.7 29.5 (339)
Tobramycin 16.0 9.7 0.0 10.9 0.0 0.0 1.6 2.1 7.1 (340)
Trimethoprim 32.0 20.8 0.0 29.7 10.0 0.0 4.7 8.7 18.3 (338)
Trimethoprim–sulfamethoxazole
32.0 19.4 0.0 29.7 10.0 0.0 4.7 10.4 18.2 (340)
– = no data available; ACT = Australian Capital Territory; n = number of isolates tested; NSW = New South Wales; NT = Northern Territory; Qld = Queensland; SA = South Australia; Tas = Tasmania; Vic = Victoria; WA = Western Australiaa n = 41b n = 33Notes:
Chapter 4: Antimicrobial resistance 96
1. Resistance determined using European Committee on Antimicrobial Susceptibility Testing interpretive criteria.2. Not all antimicrobial agents were reported for all species.Source: Australian Group on Antimicrobial Resistance
Chapter 4: Antimicrobial resistance 97
Additional findings from targeted surveillance
AGAR also captured data on 30-day all-cause mortality (Tables 4.7 and 4.8). Unless otherwise stated, these findings apply to all species of Enterobacteriaceae detected.
Significantly higher 30-day all-cause mortality occurred when the bacteraemia had its onset in the hospital. For E. coli and K. pneumoniae, the impact of multidrug resistance on 30-day all-cause mortality was small or negligible, but there was a noticeable impact on mortality with E. cloacae complex. This may be due to the smaller range of remaining effective antimicrobials available for treatment of E. cloacae complex.
For E. coli and K. pneumoniae, the impact of multidrug resistance on 30-day all-cause mortality was small or negligible, but there was a noticeable impact on mortality with E. cloacae complex.
Full data from AGAR surveys of gram-negative bacteria can be found on the AGAR website (see Appendix 3).
Chapter 4: Antimicrobial resistance 98
Table 4.7 Onset setting and 30-day all-cause mortality for the 12 most commonly isolated Enterobacteriaceae species (blood culture isolates), 2014
Species Community, n
Community mortality, % (n)
Hospital, n
Hospital mortality, % (n)
Total, n Total mortality, % (n)
Escherichia coli 2060 8.3 (170) 453 17.0 (77) 2513 9.8 (247)
Klebsiella pneumoniae 454 12.3 (56) 210 17.6 (37) 664 14.0 (93)
Enterobacter cloacae complex 132 15.2 (20) 142 13.4 (19) 274 14.2 (39)
Klebsiella oxytoca 115 6.1 (7) 58 24.1 (14) 173 12.1 (21)
Proteus mirabilis 103 21.4 (22) 33 12.1 (4) 136 19.1 (26)
Serratia marcescens 47 14.9 (7) 53 15.1 (8) 100 15.0 (15)
Enterobacter aerogenes 37 8.1 (3) 39 23.1 (9) 76 15.8 (12)
Salmonella species (nontyphoidal)
66 7.6 (5) 2 0.0 (0) 68 7.4 (5)
Morganella morganii 29 13.8 (4) 14 21.4 (3) 43 16.3 (7)
Citrobacter freundii 25 16.0 (4) 11 9.1 (1) 36 13.9 (5)
Citrobacter koseri 26 19.2 (5) 8 0.0 (0) 34 14.7 (5)
Salmonella species (typhoidal) 22 0.0 (22) 0 0.0 (0) 22 0.0 (22)
Total (all species) 3181 9.8 (311) 1060 16.4 (174) 4241 11.4 (485)Source: Australian Group on Antimicrobial Resistance (national)
Chapter 4: Antimicrobial resistance 99
Table 4.8 Onset setting and 30-day all-cause mortality for the three most commonly isolated Enterobacteriaceae species, by multidrug resistance (blood culture isolates), 2014
Species Category Community, n
Community mortality, % (n)
Hospital (n)
Hospital mortality, % (n)
Total (n)
Total mortality, % (n)
Escherichia coli
Total 2025 8.3 (168) 445 17.1 (76) 2470 9.9 (244)
Non-multidrug resistant
1781 8.3 (147) 364 17.3 (63) 2145 9.8 (210)
Multidrug resistant 244 8.6 (21) 81 16.0 (13) 325 10.5 (34)
Klebsiella pneumoniae
Total 448 12.5 (56) 208 17.3 (36) 656 14.0 (92)
Non-multidrug resistant
416 12.3 (51) 181 17.1 (31) 597 13.7 (82)
Multidrug resistant 32 15.6 (5) 27 18.5 (5) 59 16.9 (10)
Enterobacter cloacae complex
Total 124 14.5 (18) 130 14.6 (19) 254 14.6 (37)
Non-multidrug resistant
115 14.8 (17) 115 10.4 (12) 230 12.6 (29)
Multidrug resistant 13 15.4 (2) 21 33.3 (7) 34 26.5 (9)Note: Multidrug-resistant strains are resistant to three or more antimicrobial classes. Intrinsic resistances were excluded from the definition of multidrug resistance in K. pneumoniae and
E. cloacae. Cefazolin was excluded from the definition because minimum inhibitory concentration data is not recorded by some institutions. The antimicrobials used to define multidrug resistance were:1. E. coli: ampicillin, amoxicillin–clavulanate, piperacillin–tazobactam, ceftriaxone, ceftazidime, cefepime, gentamicin, amikacin, ciprofloxacin, nitrofurantoin, trimethoprim, meropenem2. K. pneumoniae: amoxicillin–clavulanate, piperacillin–tazobactam, ceftriaxone, ceftazidime, cefepime, gentamicin, amikacin, ciprofloxacin, nitrofurantoin, trimethoprim, meropenem3. E. cloacae: piperacillin–tazobactam, ceftriaxone, ceftazidime, cefepime, gentamicin, amikacin, ciprofloxacin, nitrofurantoin, trimethoprim, meropenem.
Source: Australian Group on Antimicrobial Resistance
Chapter 4: Antimicrobial resistance 100
This report defines multidrug-resistant organisms as those that have acquired resistance to three or more antimicrobial classes, where all agents have been tested.
E. coli and K. pneumoniae strains that are resistant to ceftriaxone and/or ceftazidime (MIC >1 mg/L), and their variation across jurisdictions, are shown in Figure 4.9. In E. coli, a significant amount of resistance to ceftriaxone and ceftazidime encoded by pAmpC enzymes was found in Queensland institutions, and a lower amount in some other institutions scattered across Australia. The distribution of β-lactamase types in K. pneumoniae was very institution dependent.
Figure 4.9 Percentage of Escherichia coli and Klebsiella pneumoniae with extended-spectrum -lactamase phenotype, by jurisdiction, 2014
ACT = Australian Capital Territory; NSW = New South Wales; NT = Northern Territory; Qld = Queensland; SA = South Australia; Tas = Tasmania; Vic = Victoria; WA = Western AustraliaNote: The extended-spectrum -lactamase phenotype has a minimum inhibitory concentration >1 mg/mL for ceftriaxone
or ceftazidime.Source: Australian Group on Antimicrobial Resistance (public and private hospitals)
Chapter 4: Antimicrobial resistance 101
Data table: Figure 4.9
Jurisdiction E. coli (n=3,493), % with extended-spectrum beta-lactamase phenotype
K. pneumoniae (n=876), % with extended-spectrum beta-lactamase phenotype
ACT 9.5 15.4
NSW 10.7 12.1
NT 10.3 6.5
Qld 8.1 5.3
SA 7.0 4.1
Tas 11.4 11.1
Vic 14.2 11.5
WA 6.7 4.8
Australia 9.8 8.3
4.4 Enterococcus species
Health impact
Enterococcus species are opportunistic pathogens that cause a range of infections in patients whose physical barriers are compromised through surgery or invasive devices.
They are a cause of urinary tract infection in patients with catheters or structural abnormalities, and are associated with other intestinal organisms in many intra-abdominal infections, especially those of the biliary tract. These infections can be complicated by septicaemia. Enterococci are also a less common but important cause of endocarditis. Two species dominate in human infection: E. faecalis and E. faecium. According to AGAR data, the 30-day all-cause mortality was significantly higher for E. faecium than for E. faecalis, and vancomycin resistance in E. faecalis appeared to be associated with increased 30-day mortality. The most common clinical syndromes associated with enterococcal bacteraemia were biliary and urinary tract infections (Table 4.9). Apart from infections without a definite focus, all infections were more common in males.
Chapter 4: Antimicrobial resistance 102
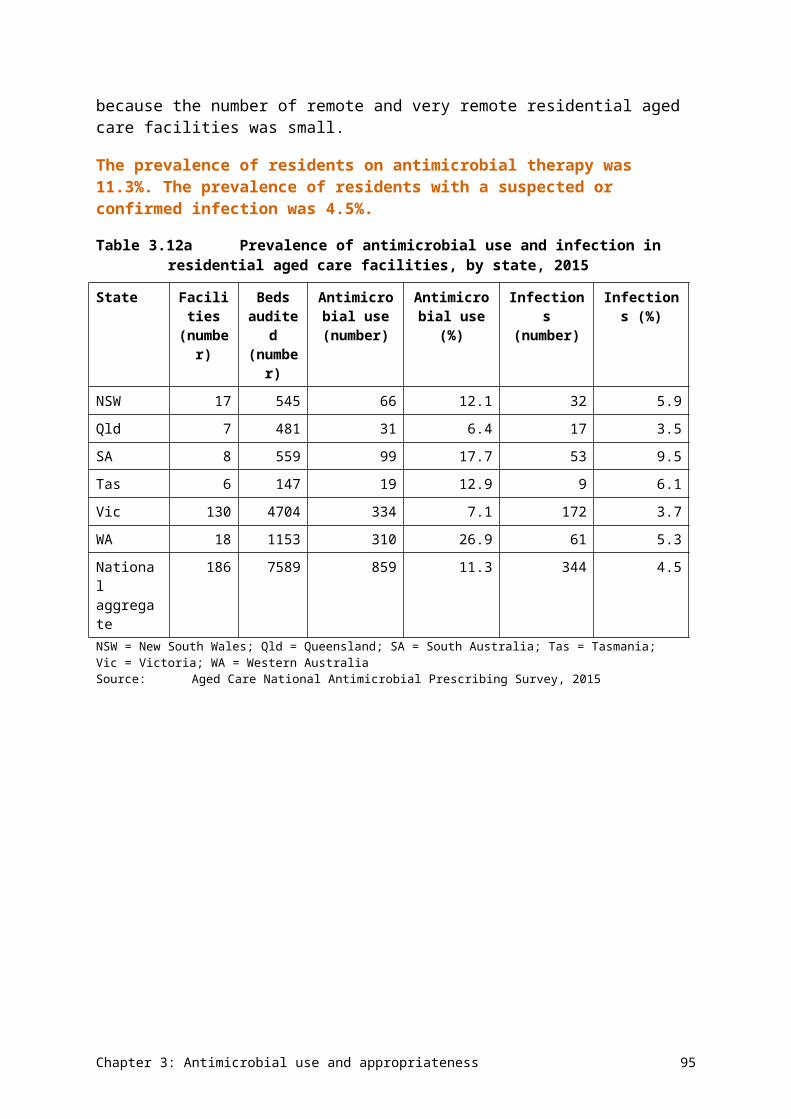
Table 4.9 Principal clinical manifestations of infection with Enterococcus species (blood culture isolates), 2014
Clinical manifestation Male Female Total Males per 100 females
Biliary tract infection (including cholangitis) 123 47 170 262
Urinary tract infection 109 48 157 227
No focus (e.g. febrile neutropenia) 76 75 151 101
Intra-abdominal infection other than biliary tract 83 51 134 163
Device-related infection without metastatic focus 56 36 92 156
Other clinical syndrome 38 26 64 146
Endocarditis, left-sided 38 19 57 200
Skin and skin structure infection 24 10 34 240
Osteomyelitis/septic arthritis 19 4 23 475
Device-related infection with metastatic focus 6 2 8 300
Endocarditis, right-sided 4 2 6 200
Total 576 320 896 180Source: Australian Group on Antimicrobial Resistance (national)
Treatment
Enterococci are naturally resistant to a range of common antimicrobial classes, including β-lactamase-resistant penicillin, cephalosporins, macrolides and lincosamides. Amoxicillin administered orally is the most common treatment for minor infections. More serious infections are treated with intravenous ampicillin or amoxicillin, and, for endocarditis, one of these agents is combined with low-dose gentamicin. Vancomycin is used instead of ampicillin/amoxicillin for serious infections in patients who are allergic to penicillins.
Types and impact of resistance
Ampicillin resistance has emerged worldwide at quite high levels in E. faecium during the past 20 years, including in Australia, increasing the use of vancomycin for treatment. More recently, vancomycin-resistant enterococci (VRE) have also emerged, most notably in E. faecium, but also in E. faecalis. The gene complexes responsible are of two main types, vanA and vanB. In Australia, unlike in most other countries, VRE have been dominated by the vanB, rather than the vanA, genotype. VRE require treatment with agents that are usually reserved, such as teicoplanin or daptomycin.
Key findings (national)
Rates of resistance to key antimicrobials in E. faecalis were very low – in 2014, less than 1% of isolates from blood (n = 839), urine (n = 4258) and other sites (n = 1027) were resistant to ampicillin, vancomycin or linezolid (Figure 4.10). Rates of resistance showed some differences by clinical setting (Figure 4.11).
Chapter 4: Antimicrobial resistance 103
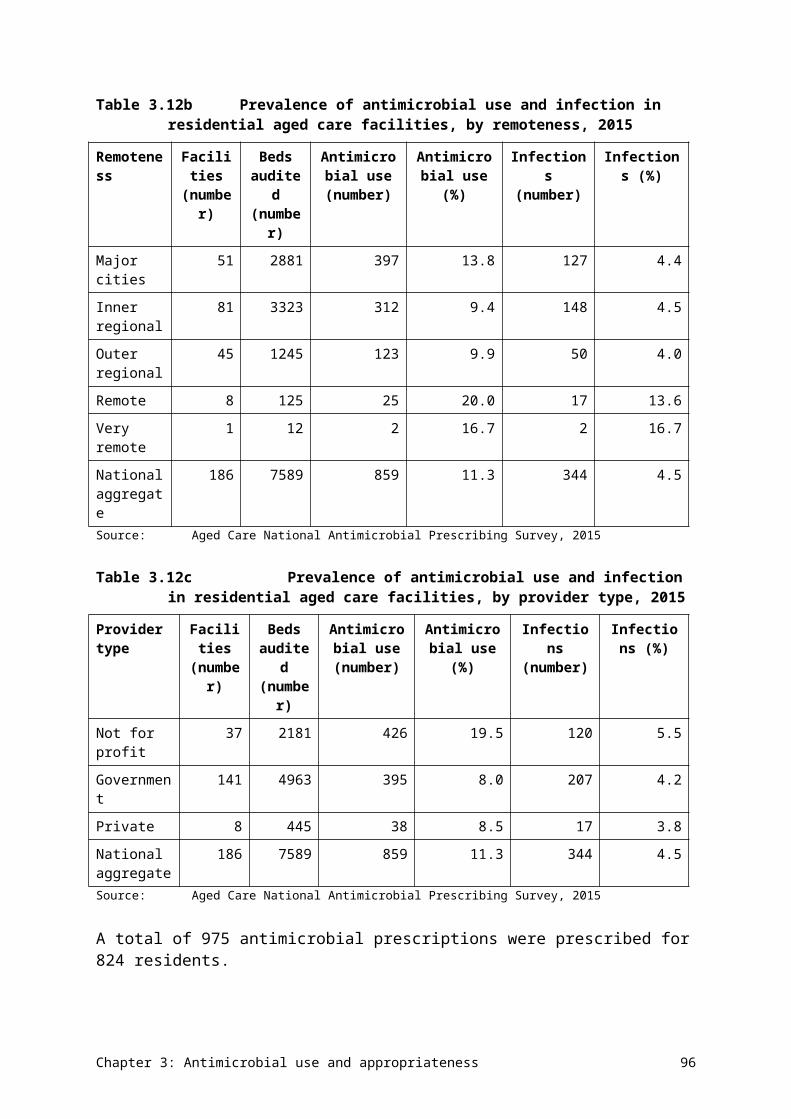
Rates of resistance to key antimicrobials in E. faecalis were very low, but rates of resistance in E. faecium to ampicillin and vancomycin were high.
In contrast, rates of resistance in E. faecium to ampicillin and vancomycin were high (Figures 4.12 and 4.13). Linezolid resistance was rare. Specimen source did not substantially influence rates of resistance (Figure 4.12). There was some variation in the rates of vancomycin resistance in E. faecium, depending on the setting. Rates were higher in the private hospital and community sectors than in the public hospital sector. This may have been a sampling issue, given that most data came from Queensland.
Figure 4.10Enterococcus faecalis resistance, by specimen source, 2014
Sources:OrgTRx (Queensland); Australian Group on Antimicrobial Resistance (national); Sullivan Nicolaides Pathology (Queensland and northern New South Wales)
Data table: Figure 4.10
Agent Blood (n = 839), % resistant
Urine (n= 4,258), % resistant
Other (n = 1,027), % resistant
Ampicillin 0.4 0.6 0.3
Vancomycin 0.4 0.3 0.3
Linezolid 0.0 0.5 0.1
Chapter 4: Antimicrobial resistance 104
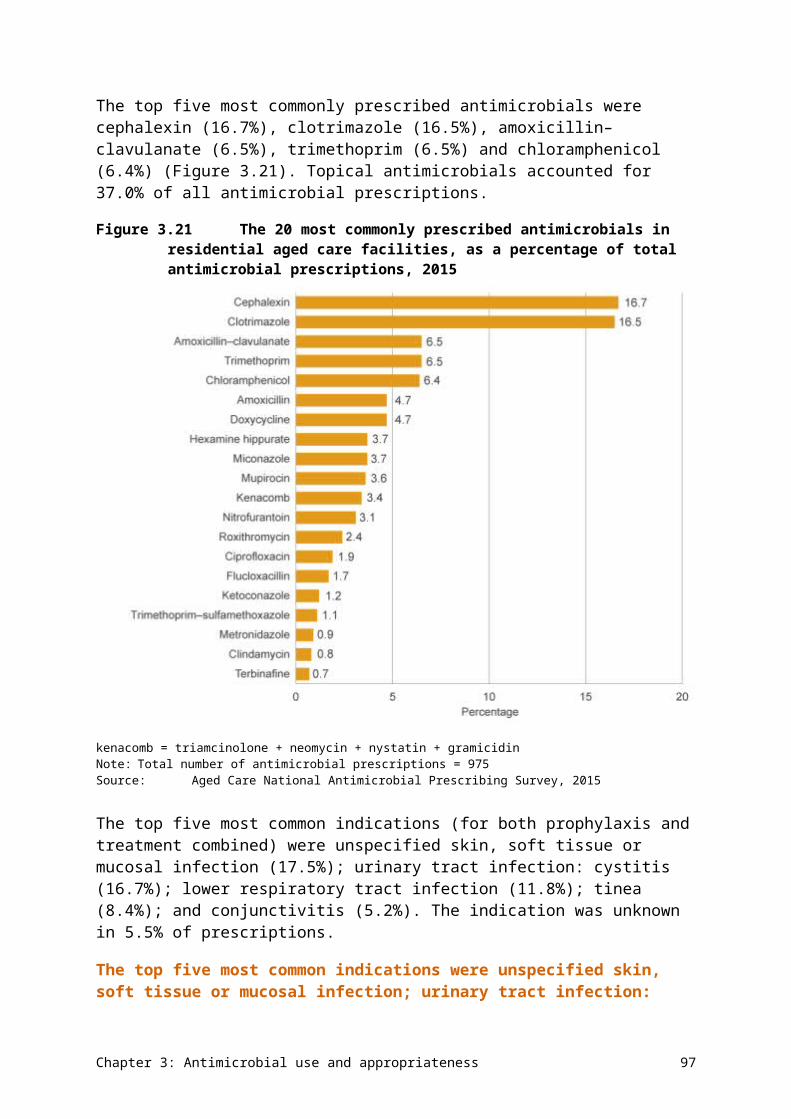
Figure 4.11Enterococcus faecalis resistance, by clinical setting, 2014
Sources:Australian Group on Antimicrobial Resistance (AGAR) (public hospitals); OrgTRx (public hospitals and health services); AGAR and Sullivan Nicolaides Pathology (SNP) (private hospitals); SNP (community)
Data table: Figure 4.11
Agent Public hospitals (n = 505), % resistant
Public hospitals and health services (n = 5,135), % resistant
Private hospitals (n = 338), % resistant
Community (n = 130), % resistant
Ampicillin 0.6 0.4 1.3 1.3
Vancomycin 0.2 0.2 1.6 0.0
Linezolid 0.0 0.4 0.4 0.0
Chapter 4: Antimicrobial resistance 105
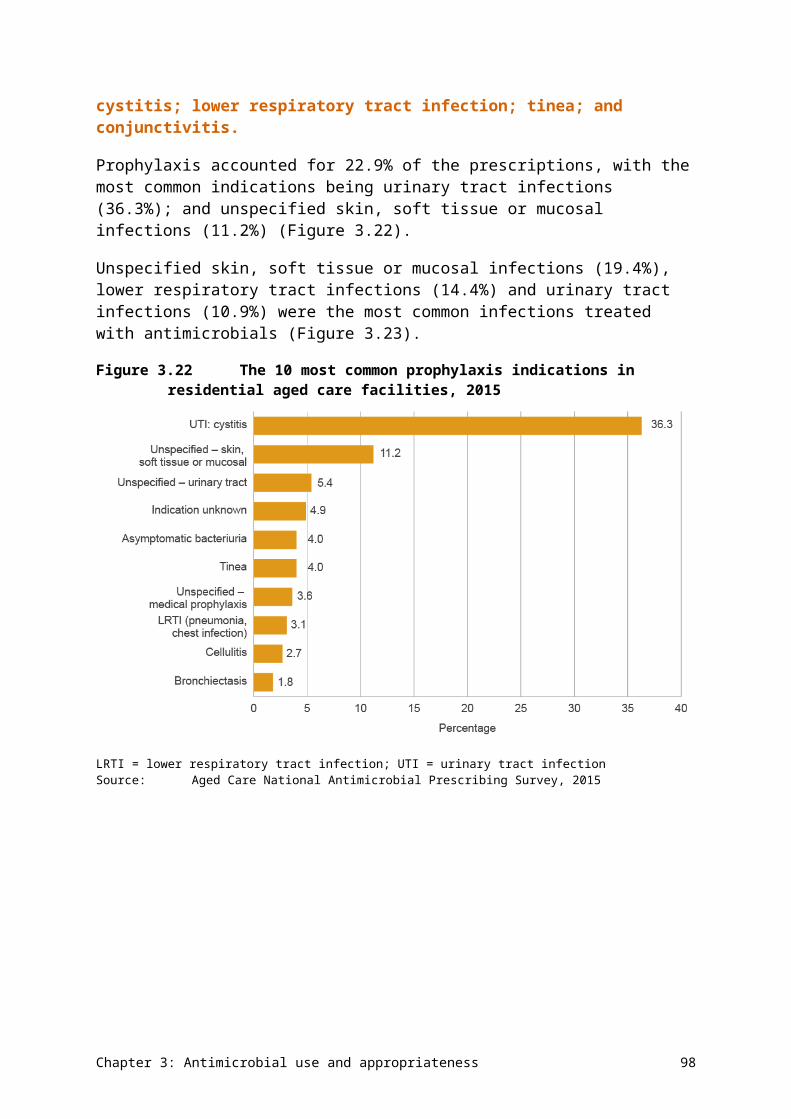
Figure 4.12Enterococcus faecium resistance, by specimen source, 2014
Sources:OrgTRx (Queensland); Australian Group on Antimicrobial Resistance (national); Sullivan Nicolaides Pathology (Queensland and northern New South Wales)
Data table: Figure 4.12
Agent Blood (n = 471), % resistant
Urine (n = 518), % resistant
Other (n = 237), % resistant
Ampicillin 89.0 94.5 83.3
Vancomycin 45.7 49.9 48.5
Linezolid 0.2 0.6 1.1
Chapter 4: Antimicrobial resistance 106
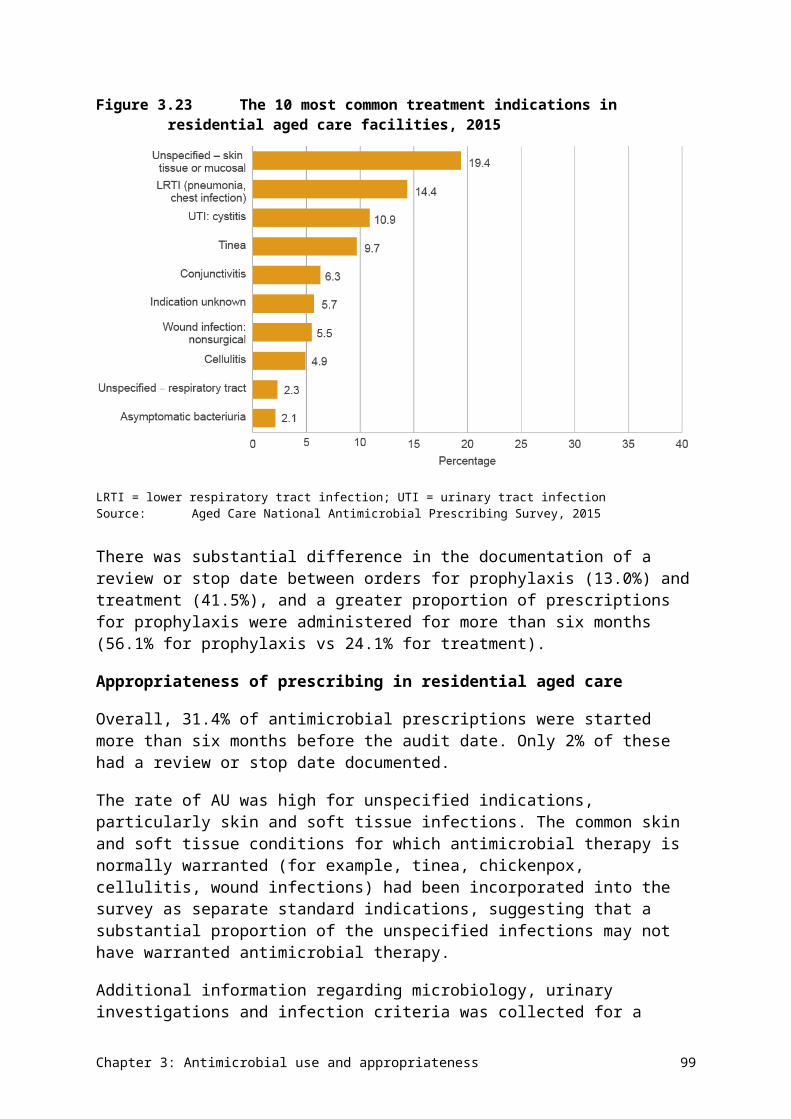
Figure 4.13Enterococcus faecium resistance, by clinical setting, 2014
Sources:Australian Group on Antimicrobial Resistance (AGAR) (public hospitals); OrgTRx (public hospitals and health services), AGAR and Sullivan Nicolaides Pathology (SNP) (private hospitals); SNP (community)
Data table: Figure 4.13
Agent Public hospitals (n = 369), % resistant
Public hospitals and health services (n = 652), % resistant
Private hospitals (n = 109), % resistant
Community (n = 66), % resistant
Ampicillin 89.4 90.2 95.3 90.5
Vancomycin 45.3 44.3 69.4 66.1
Linezolid 0.3 0.7 0.0 0.0
Jurisdictional rates
The percentages of Enterococcus species that are resistant to key antimicrobials are shown in Tables 4.10 and 4.11.
Chapter 4: Antimicrobial resistance 107
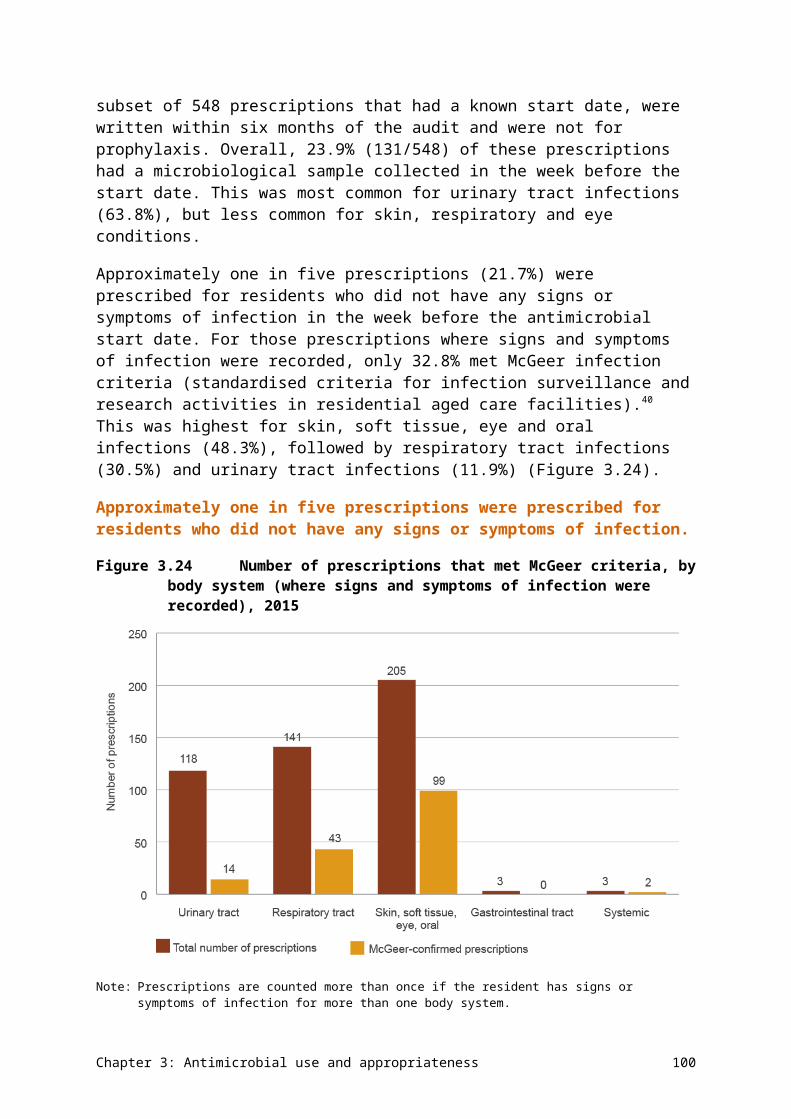
Table 4.10 Percentage of Enterococcus faecium resistance, by jurisdiction of testing (blood culture isolates), 2014
Antimicrobial ACT,n = 41
NSW,n = 103
NT,n = 1
Qld,n = 37
SA,n = 46
Tas,n = 7
Vic,n = 94
WA,n = 50
Australia(n)
Ampicillin 87.8 89.3 na 81.1 89.1 71.4 93.6 94.0 89.4 (379)
Ciprofloxacin 90.2 64.1 na 71.4a 0.0 – 92.6 94.0 73.2 (351)
Linezolid 0.0 1.0 na 0.0 0.0 0.0 0.0 0.0 0.3 (378)
Trimethoprim–sulfamethoxazole
75.6 46.6 na 64.9 27.9 – 66.7b 82.0 57.9 (311)
Vancomycin 24.4 50.5 na 40.5 56.5 14.3 66.0 18.0 46.2 (379)– = no data available; ACT = Australian Capital Territory; na = not applicable; NSW = New South Wales; NT = Northern Territory; Qld = Queensland; SA = South Australia; Tas = Tasmania; Vic = Victoria; WA = Western Australia a n = 34b n = 36Notes:1. Resistance determined using European Committee on Antimicrobial Susceptibility Testing interpretive criteria.2. Not all antimicrobial agents were reported for all species.Source: Australian Group on Antimicrobial Resistance (national)
Table 4.11 Percentage of Enterococcus faecalis resistance, by jurisdiction of testing (blood culture isolates), 2014
Antimicrobial ACT,n = 33
NSW,n = 134
NT,n = 6
Qld,n = 102
SA,n = 51
Tas,n = 13
Vic,n = 121
WA,n = 63
Australia(n)
Ampicillin 0.0 0.0 0.0 2.0 2.0 0.0 0.0 0.0 0.6 (522)
Ciprofloxacin 42.4 17.2 50.0 15.7a 0.0b – 22.0 11.1 17.8 (477)
Linezolid 0.0 0.0 0.0 0.0 0.0 0.0 0.0 0.0 0.0 (522)
Trimethoprim–sulfamethoxazole
36.4 21.6 50.0 21.6 26.0 – 22.7c 12.7 22.5 (463)
Vancomycin 0.0 0.0 0.0 1.0 0.0 0.0 0.0 0.0 0.2 (523)
Chapter 4: Antimicrobial resistance 108
– = no data available; ACT = Australian Capital Territory; NSW = New South Wales; NT = Northern Territory; Qld = Queensland; SA = South Australia; Tas = Tasmania; Vic = Victoria; WA = Western Australiaa n = 89b n = 32c n = 75Notes:1. Resistance determined using European Committee on Antimicrobial Susceptibility Testing interpretive criteria.2. Not all antimicrobial agents were reported for all species.Source: Australian Group on Antimicrobial Resistance (national)
Chapter 4: Antimicrobial resistance 109
Vancomycin-resistant E. faecium is the main AMR issue for Enterococcus species. Figure 4.14 confirms that the main type of vancomycin-resistant E. faecium circulating in Australia is of the vanB type. In New South Wales, vanA is now also prominent.
Figure 4.14Vancomycin-resistant Enterococcus faecium genotype, by jurisdiction of testing (blood culture isolates), 2014
ACT = Australian Capital Territory; NSW = New South Wales; NT = Northern Territory; Qld = Queensland; SA = South Australia; Tas = Tasmania; Vic = Victoria; WA = Western AustraliaSource: Australian Group on Antimicrobial Resistance (national)
Data table: Figure 4.14
Jurisdiction vanB (n = 137), % of all E. faecium
vanA (n = 31), % of all E. faecium
not vanA or vanB (n = 4), % of all E. faecium
Not determined (n = 3), % of all E. faecium
ACT (n=41) 19.5 2.4 2.4 0.0
NSW (n=104) 16.3 27.9 2.9 2.9
NT (n=1) 0.0 0.0 0.0 0.0
Qld (n=37) 40.5 0.0 0.0 0.0
SA (n=46) 56.5 0.0 0.0 0.0
Tas (n=7) 14.3 0.0 0.0 0.0
Vic (n=94) 66.0 0.0 0.0 0.0
WA (n=50) 16.0 2.0 0.0 0.0
Australia (n=380) 36.1 8.2 1.1 0.8
Chapter 4: Antimicrobial resistance 110
Additional findings from targeted surveillance
Data from AGAR is available for 30-day all-cause mortality. The all-cause mortality at 30 days was significantly higher for E. faecium infections than for E. faecalis infections, and vancomycin resistance in E. faecalis appeared to have an even greater association with 30-day mortality (Table 4.12).
The all-cause mortality at 30 days was significantly higher for E. faecium infections than for E. faecalis infections, and vancomycin resistance in E. faecalis appeared to have an even greater association with 30-day mortality.
Chapter 4: Antimicrobial resistance 111
Table 4.12 Onset setting and 30-day all-cause mortality for infections with Enterococcus (blood culture isolates), 2014
Enterococcus species Community, n
Community mortality, % (n)
Hospital, n
Hospital mortality, % (n)
Total, n Total mortality,
% (n)
Enterococcus faecalis 292 12.3 (36) 178 14.6 (26) 470 13.2 (62)
Enterococcus faecium 95 20.0 (19) 246 30.5 (75) 341 27.6 (94)
Vancomycin-susceptible E. faecium 67 19.4 (13) 112 25.0 (28) 179 22.9 (41)
Vancomycin-resistant E. faecium 27 22.2 (6) 134 35.1 (47) 161 32.9 (53)Source: Australian Group on Antimicrobial Resistance (national)
Chapter 4: Antimicrobial resistance 112
Vancomycin-resistant enterococci were typed using multilocus sequence typing. Different sequence types had established in different jurisdictions (although Tasmania aligned with Victoria), consistent with rapid local or regional spread rather than national spread (Figure 4.15).
Full data from AGAR surveys of Enterococcus species can be found on the AGAR website (see Appendix 3).
Figure 4.15Distribution of vancomycin-resistant Enterococcus faecium sequence types, by jurisdiction of testing (blood culture isolates), 2014
ACT = Australian Capital Territory; NSW = New South Wales; NT = Northern Territory; Qld = Queensland; SA = South Australia; Tas = Tasmania; Vic = Victoria; WA = Western AustraliaSource: Australian Group on Antimicrobial Resistance (national)
Data table: Figure 4.15
Jurisdiction ST796 (%)
ST203 (%)
ST17 (%)
ST555 (%)
ST341 (%)
ST80 (%)
Nontypeable (%)
Not determined (%)
ACT (n = 10) 0 40 0 0 20 0 0 40
NSW (n = 52)
0 26.92 44 0 1.92 9.62 1.92 15.38
NT (n = 0) 0 0 0 0 0 0 0 0
Qld (n = 15) 0 86.67 0 6.67 0 0 0 6.67
SA (n = 26) 7.69 61.54 0 30.77 0 0 0 0
Tas (n = 1) 100 0 0 0 0 0 0 0
Vic (n = 62) 91.94 1.61 0 0 0 0 0 6.45
WA (n = 9) 0 11.11 0 77.78 0 11.11 0 0
Australia (n = 175)
34.29 28 13.14 9.14 1.71 3.43 0.57 9.71
Chapter 4: Antimicrobial resistance 113
4.5 Mycobacterium tuberculosis
Health impact
M. tuberculosis is the bacterium that causes tuberculosis, an infection that has a range of clinical manifestations, but most commonly presents as lung disease. Once acquired, M. tuberculosis can remain quiescent in the body for many years (even decades) as latent tuberculosis. When the body’s defences wane, it reactivates and causes active disease. Tuberculosis is a significant public health issue in many countries. Australia is fortunate in having one of the lowest rates of tuberculosis in the world; however, continued vigilance is required to maintain or improve on this low rate. About 85% of all notified cases in Australia are found in the overseas-born population, who have mostly migrated from high-prevalence countries.
Treatment
M. tuberculosis is not susceptible to most conventional antibacterial agents. Instead, it requires treatment with specially designed antimycobacterial agents. Four of these – isoniazid, rifampicin, ethambutol and pyrazinamide – are the first-line agents and comprise the standard oral treatment regimen for tuberculosis caused by fully susceptible strains. When the strain is susceptible, isoniazid is considered the mainstay of therapy. Combinations of antimycobacterial agents are always required for treatment because resistance to any of them can emerge during treatment. Treatment is required for a minimum of six months.
Types and impact of resistance
Because such a high proportion of Australian cases occur in people born overseas, changes in antimicrobial susceptibility observed in Australia reflect patterns of resistance in these other countries. The most common forms of resistance worldwide are resistance to isoniazid and rifampicin. When strains are resistant to one or both of these, additional antimycobacterial agents are added to, or substituted into, the treatment combination. For most of these additional agents, side effects are more likely or more severe. Longer courses of treatment are needed for resistant strains.
Strains that are resistant to isoniazid and rifampicin, with or without resistance to the other two first-line agents, are considered to be multidrug-resistant tuberculosis (MDR-TB). If these strains are also resistant to fluoroquinolones and at least one injectable agent (amikacin, capreomycin, kanamycin), they are considered to be extremely drug-resistant tuberculosis (XDR-TB). Treatment success is significantly lower, and costs are significantly higher, for MDR-TB, and even more so for XDR-TB.
Treatment success is significantly lower, and costs are significantly higher, for MDR-TB, and even more so for XDR-TB.
Key findings (national)
In 2014, 1339 cases of tuberculosis were notified nationally (5.7 cases per 100 000 population). Of these cases, 1027 had positive laboratory cultures and susceptibility test results available. Overall rates of resistance to the four first-line agents and selected additional agents are shown in Figure 4.16.
Chapter 4: Antimicrobial resistance 114
Figure 4.16Mycobacterium tuberculosis resistance to individual first-line agents and selected additional agents, 2014
AMI = amikacin; CAP = capreomycin; EMB = ethambutol; FLQ = fluoroquinolones; INH = isoniazid; INN = ethionamide; KAN = kanamycin; PZA = pyrazinamide; RIF = rifampicinNotes: 1. First-line agents (dark columns) reported against (almost) all strains: isoniazid, rifampicin, ethambutol and pyrazinamide;
selected additional agents (light columns) tested against isolates with resistance to first-line agents or from patients with severe adverse reactions to first-line agents.
2. Fluoroquinolones tested were ciprofloxacin, ofloxacin, moxifloxacin or levofloxacin.Source: National Notifiable Diseases Surveillance System (national)
Data table: Figure 4.16
Agent Type of agent % resistant
Isoniazid (n = 1004) First line 8.5
Rifampicin (n = 1027) First line 2.4
Ethambutol (n = 1014) First line 1.2
Pyrazinamide (n = 971) First line 2.1
Fluoroquinolones (n = 54) Selected additional 9.3
Kanamycin (n = 44) Selected additional 9.1
Capreomycin (n = 53) Selected additional 1.9
Amikacin (n = 52) Selected additional 1.9
Ethionamide (n = 53) Selected additional 35.8
Jurisdictional rates
There was some variation in resistance rates to first-line agents across states and territories (Figure 4.17).
Chapter 4: Antimicrobial resistance 115
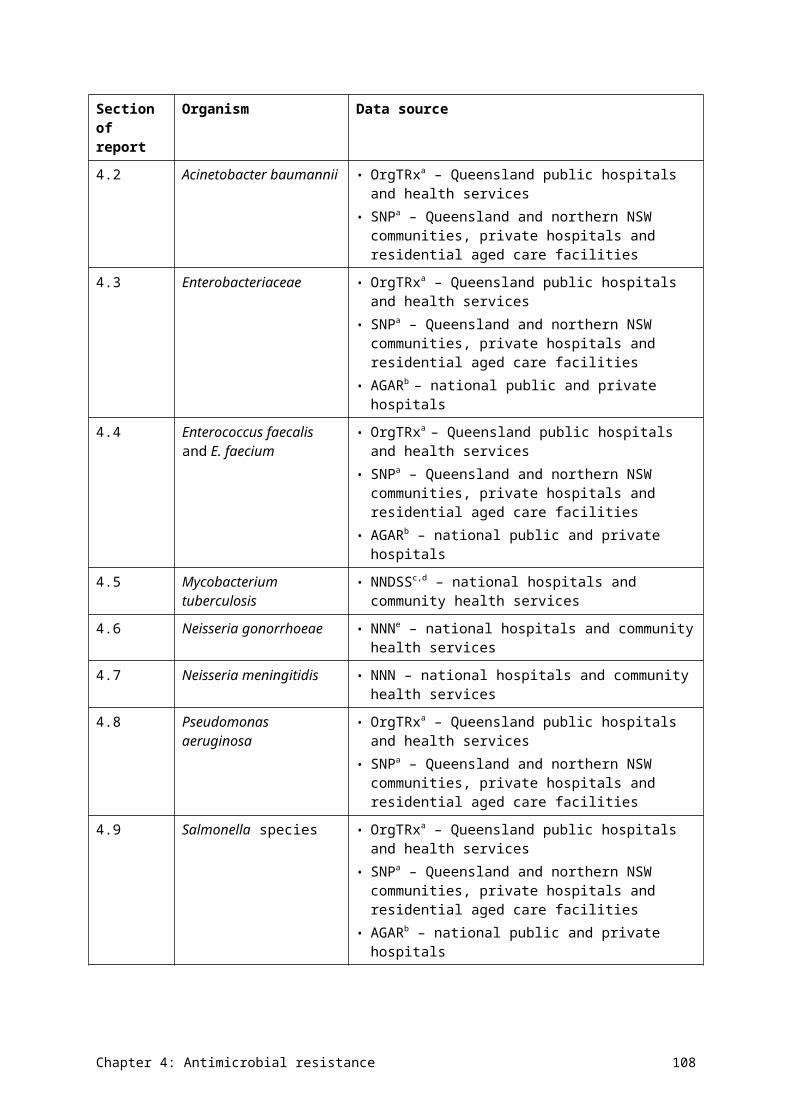
Figure 4.17Mycobacterium tuberculosis resistance to first-line agents, by jurisdiction, 2014
ACT = Australian Capital Territory; NSW = New South Wales; NT = Northern Territory; Qld = Queensland; SA = South Australia; Tas = Tasmania; Vic = Victoria; WA = Western AustraliaSource: National Notifiable Diseases Surveillance System (national)
Data table: Figure 4.17
Jurisdiction Isoniazid (% resistant)
Rifampicin (% resistant)
Ethambutol (% resistant)
Pyrazinamide (% resistant)
ACT (n = 30) 13.6 4.5 0 0
NSW (n = 472) 9.7 1.5 2.1 2.4
NT (n = 28) 4.5 0 0 0
Qld (n = 165) 11.4 4.9 1.4 4.2
SA (n = 48) 5.4 5 0 0
Tas (n = 9) 0 0 0 12.5
Vic (n = 448) 6.7 2 0.6 0.3
WA (n = 139) 7.5 2.8 0.9 3.8
National trends
Overall, rates of resistance have not changed significantly over the past decade. There has been a small trend upwards in the percentage of MDR-TB strains (resistance to at least isoniazid and rifampicin) (Figure 4.18). XDR-TB strains have remained rare (1 of 1027 strains tested in 2014).
Chapter 4: Antimicrobial resistance 116
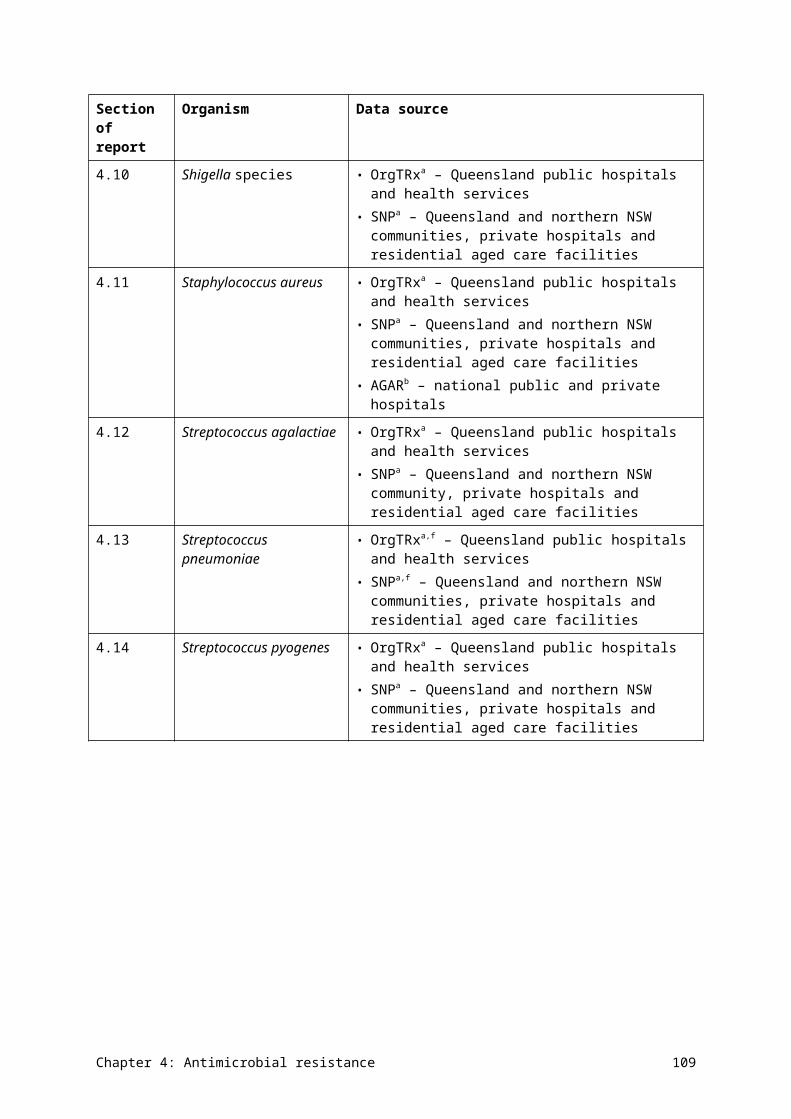
Figure 4.18Ten-year trends in resistance and multidrug-resistance patterns in Mycobacterium tuberculosis
XDR-TB = extremely drug-resistant tuberculosisa Multidrug-resistant tuberculosis strainsSource: National Notifiable Diseases Surveillance system (public and private hospitals and health services)
Data table: Figure 4.18
Percentage of strains resistant to agents and combinations
2005 (n = 706)
2006 (n = 775)
2007 (n = 782)
2008 (n = 913)
2009 (n = 966)
2010 (n = 1023)
2011 (n = 1059)
2012 (n = 984)
2013 (n = 936)
2014 (n = 1027)
Isoniazid only 5.9 9.5 7.5 6.2 9.7 6.5 6.1 7.4 7.2 6.3
Rifampicin only 0.3 0.1 0.4 0.2 0.6 0.3 0.1 0.3 0.3 0.7
Isoniazid + rifampicina
0.8 1.4 1.4 1.3 1.6 1.3 1.7 1.4 1.1 0.7
Isoniazid + rifampicin + ethambutola
0.6 0.3 0.1 0.7 0.1 0.1 0.2 0.2 0.4 0.1
Isoniazid + rifampicin + pyrazinamidea
0.1 0.0 0.9 0.3 0.8 1.6 0.2 0.1 0.2 0.3
Isoniazid + rifampicin + ethambutol + pyrazinamidea
0.1 0.4 0.0 0.1 0.0 0.1 0.5 0.3 0.7 0.6
XDR-TB 0.0 0.0 0.0 0.0 0.0 0.2 0.0 0.0 0.0 0.1
Detailed reports of susceptibility data for M. tuberculosis from 1996 onwards can be found on the Australian Government Department of Health website. Guidelines for Australian mycobacteriology laboratories have been published in Communicable Diseases Intelligence (see Appendix 3).
Chapter 4: Antimicrobial resistance 117
4.6 Neisseria gonorrhoeae
Health impact
N. gonorrhoeae causes gonorrhoea, an infection that is usually sexually transmitted. Most infections are asymptomatic, but common symptoms are urethritis in men and cervicitis in women. In some women, the infection ascends to the uterus and fallopian tubes, which can result in infertility if not treated promptly. Women who become infected in late pregnancy can spread the infection to the newborn during birth.
Treatment
Treatment of most gonorrhoea is empirical, and does not depend on the results of culture and susceptibility testing. This is because immediate empirical treatment is the most effective tool in preventing further transmission. Treatment is based on standard treatment protocols, which are guided by the prevalence of resistances determined in national surveillance programs.
Treatment of most gonorrhoea is empirical, and does not depend on the results of culture and susceptibility testing. This is because immediate empirical treatment is the most effective tool in preventing further transmission.
The most important agent for treating gonorrhoea is ceftriaxone, a third-generation cephalosporin. This is effective as a single dose in uncomplicated infections such as urethritis or cervicitis. Ceftriaxone has superseded penicillin and ciprofloxacin for first-line treatment because resistance to these latter agents has emerged. Azithromycin, an antimicrobial used for many years for the treatment of sexually transmitted infections caused by Chlamydia trachomatis and included in standard gonorrhoeae treatment regimens, is now considered as having additional value because it can treat strains with reduced susceptibility and resistance to ceftriaxone.
Types and impact of resistance
Resistance to ceftriaxone is an emerging concern globally. Failures of ceftriaxone treatment have been documented in Australia in strains that have decreased susceptibility to it (MICs above those of the wild-type; wild-type strains have no acquired resistance mechanisms).
Key findings (national)
In 2014, 15 703 cases of gonococcal infection were notified nationally (66.8 per 100 000 population). Of these cases, 4804 had positive laboratory cultures that were submitted for susceptibility testing. Most other cases would have been diagnosed without culture, using nucleic acid testing. Overall rates of resistance or decreased susceptibility to the main agents used for treatment are shown in Figure 4.19. In this and subsequent data, all ceftriaxone percentages are presented as decreased susceptibility, rather than full resistance.
Chapter 4: Antimicrobial resistance 118
Figure 4.19Neisseria gonorrhoeae resistance to individual antimicrobials used for treatment, 2014
Note: Decreased susceptibility to ceftriaxone = minimum inhibitory concentrations above those of the wild type; wild-type strains have no acquired resistance mechanisms.
Source: National Neisseria Network (national)
Data table: Figure 4.19
Agent % resistant
Benzylpenicillin
28.5
Ciprofloxacin 36.4
Azithromycin 2.5
Ceftriaxone 5.4 (decreased susceptibility)
Jurisdictional rates
There was some variation in resistance to first-line agents across states and territories (Figure 4.20). Most noticeable are the low rates of resistance in the remote areas of the Northern Territory and Western Australia, where a high proportion of the population is Indigenous. Rates of decreased susceptibility to ceftriaxone exceed 5% in New South Wales and Victoria.
Chapter 4: Antimicrobial resistance 119
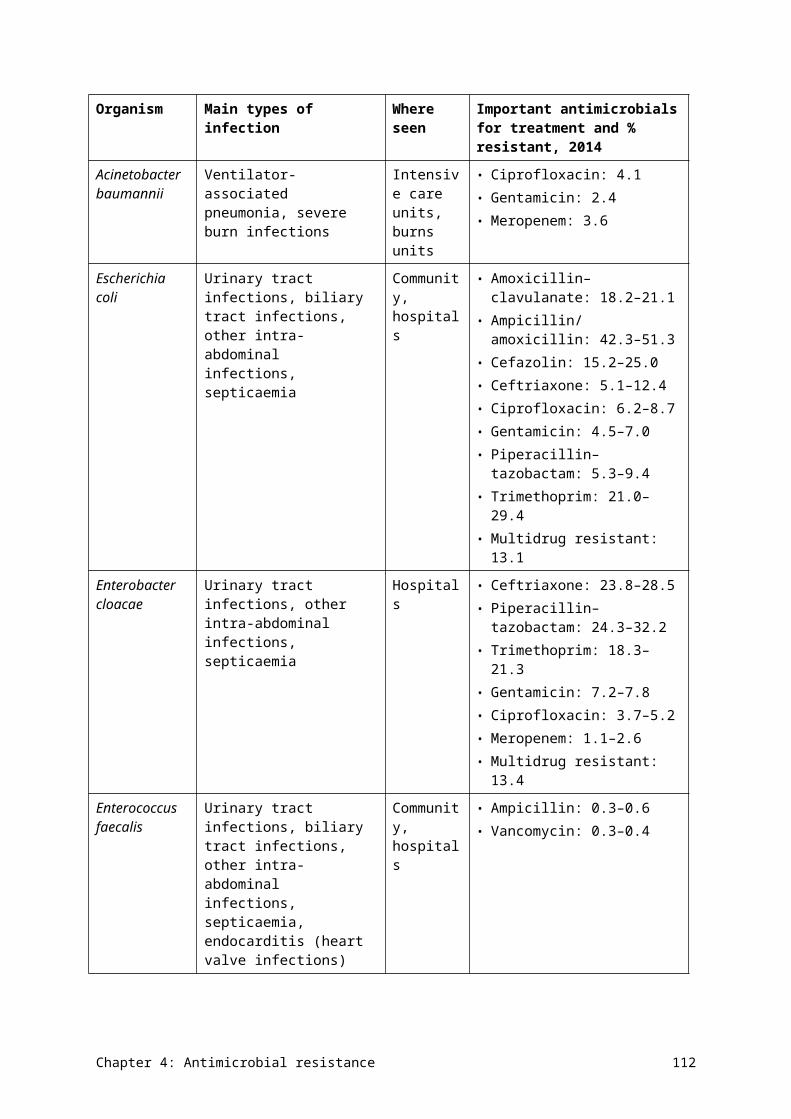
Figure 4.20Neisseria gonorrhoeae resistance to individual antimicrobials used for treatment, by jurisdiction, 2014
ACT = Australian Capital Territory; NSW = New South Wales; NT = Northern Territory; Qld = Queensland; SA = South Australia; Tas = Tasmania; Vic = Victoria; WA = Western AustraliaNote: Decreased susceptibility to ceftriaxone = minimum inhibitory concentrations above those of the wild type; wild-type
strains have no acquired resistance mechanisms.Source: National Neisseria Network (national)
Data table: Figure 4.20
Jurisdiction Benzylpenicillin (% resistant)
Ciprofloxacin (% resistant)
Ceftriaxone (% decreased susceptibility)
Azithromycin (% resistant)
ACT (n = 75) 12.0 44.0 2.7 9.3
NSW (n = 1672) 43.4 43.4 7.1 2.0
NT urban and rural (n = 99) 21.2 27.3 3.0 0.0
NT remote (n = 130) 1.5 3.1 0.8 0.0
Qld (n = 650) 23.5 28.3 3.2 3.5
SA (n = 207) 10.6 41.5 1.0 0.5
Tas (n = 30) 23.3 26.7 0.0 3.3
Vic (n = 1440) 22.4 38.8 6.6 2.3
WA urban and rural (n = 393) 26.5 29.8 3.6 5.3
WA remote (n = 108) 4.6 5.6 0.9 0.0
Chapter 4: Antimicrobial resistance 120
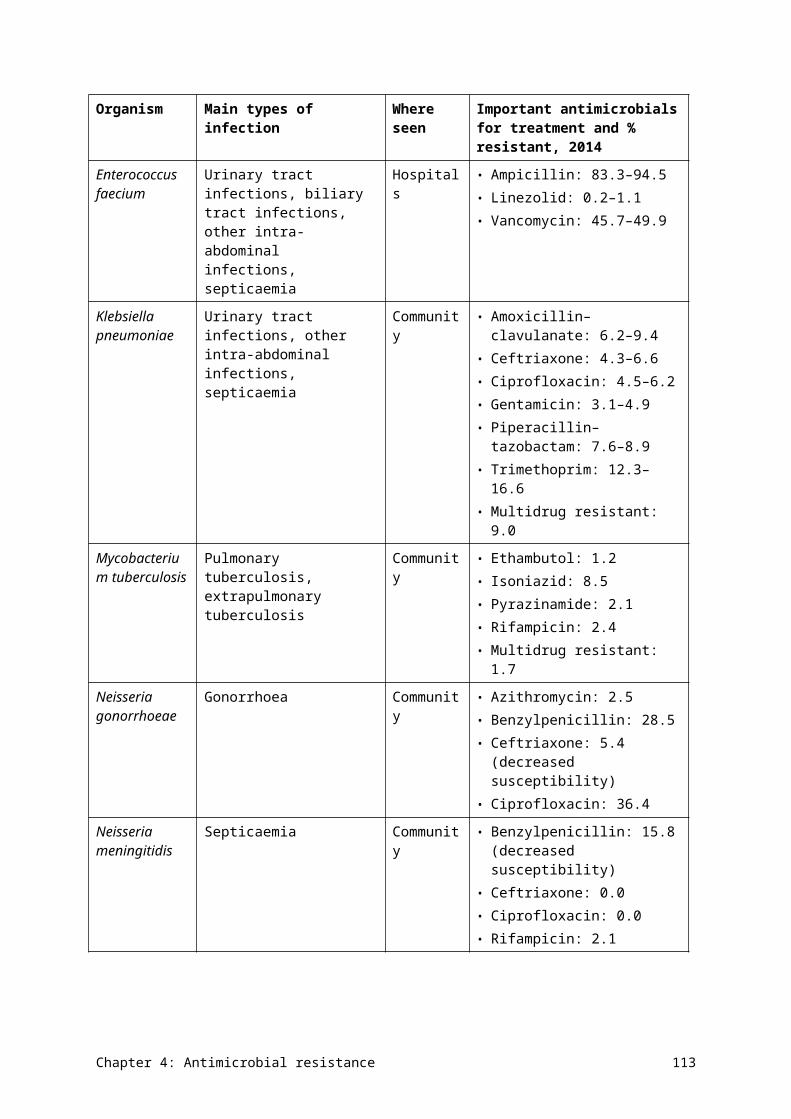
National trends
Over the past 15 years, resistance rates to the four main antimicrobials have evolved in different ways. Resistance to benzylpenicillin and ciprofloxacin trended upwards from 2003 to 2008, then declined somewhat, to stabilise at about 30%; this rate is not low enough to consider the reintroduction of these agents into standard treatment protocols. Rates of reduced susceptibility to ceftriaxone and resistance to azithromycin are low, but slowly trending upwards (Figure 4.21).
Figure 4.21Trends in resistance and multidrug-resistance patterns, and decreased susceptibility to ceftriaxone, in Neisseria gonorrhoeae, 2000–14
Notes: Decreased susceptibility to ceftriaxone = minimum inhibitory concentrations above those of the wild type; wild-type strains have no acquired resistance mechanisms.
Source: National Neisseria Network (public and private hospitals, and health services)
Detailed reports of susceptibility data on N. gonorrhoeae from 1995 to 2013 can be found in the Australian Gonococcal Surveillance Programme annual reports (see Appendix 3).
4.7 Neisseria meningitidis
Health impact
N. meningitidis can cause invasive meningococcal disease (septicaemia and meningitis) or, rarely, more localised disease (such as conjunctivitis, arthritis or pneumonia). Most patients with invasive disease present with nonspecific symptoms, but this is treated as a medical emergency because symptoms can rapidly progress to serious disease and death.
The invasive form of the disease can be associated with outbreaks in environments where there is prolonged close contact, especially within households. Invasive meningococcal disease is very uncommon in Australia because of the availability of vaccines that provide immunity against some strains.
Chapter 4: Antimicrobial resistance 121
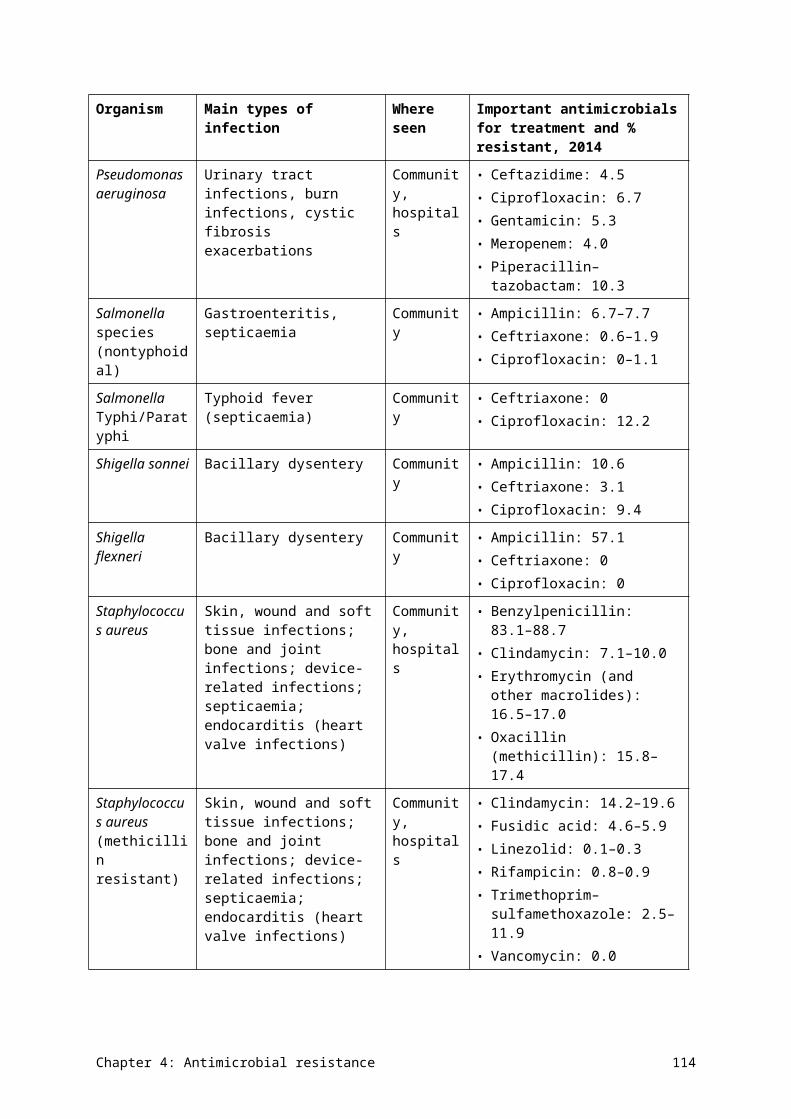
Treatment
Because invasive meningococcal disease is potentially life-threatening, most invasive infection is treated empirically (pending the results of blood cultures and, where necessary, testing of cerebrospinal fluid). The most important antimicrobials for treatment are ceftriaxone (or cefotaxime) and benzylpenicillin. Close contacts of patients with invasive meningococcal disease are given antimicrobial prophylaxis to prevent infection by clearing nasopharyngeal colonisation. The most important antimicrobials for prophylaxis are rifampicin, ciprofloxacin and ceftriaxone.
Types and impact of resistance
There is currently no international consensus on the definition of reduced susceptibility or resistance to benzylpenicillin in this species. In most test systems, wild-type strains (that is, strains with no acquired resistance mechanism) have MICs of 0.25 mg/L or less.
Resistance to benzylpenicillin has been slow to develop in Australia. Ceftriaxone resistance has not yet been documented. Non wild-type strains that have reduced susceptibility to these two agents are now found regularly, but are not yet associated with treatment failure. Occasional strains are found with resistance to rifampicin or reduced susceptibility to ciprofloxacin.
Resistance to benzylpenicillin has been slow to develop in Australia. Ceftriaxone resistance has not yet been documented.
Key findings (national)
In 2014, 169 cases of invasive meningococcal infection were notified nationally (0.7 per 100 000 population). From these cases, 95 isolates were submitted for susceptibility testing. Figure 4.22 shows the national rates of resistance to the four key agents used for treatment or prophylaxis.
Figure 4.22Neisseria meningitidis resistance to individual antimicrobials used for treatment and prophylaxis, 2014
Note: Decreased susceptibility or resistance to benzylpenicillin: in most test systems, wild-type strains (i.e. with no acquired resistance mechanism) have minimum inhibitory concentrations of ≤0.25 mg/L.
Source: National Neisseria Network (public and private hospitals, and health services)
Chapter 4: Antimicrobial resistance 122
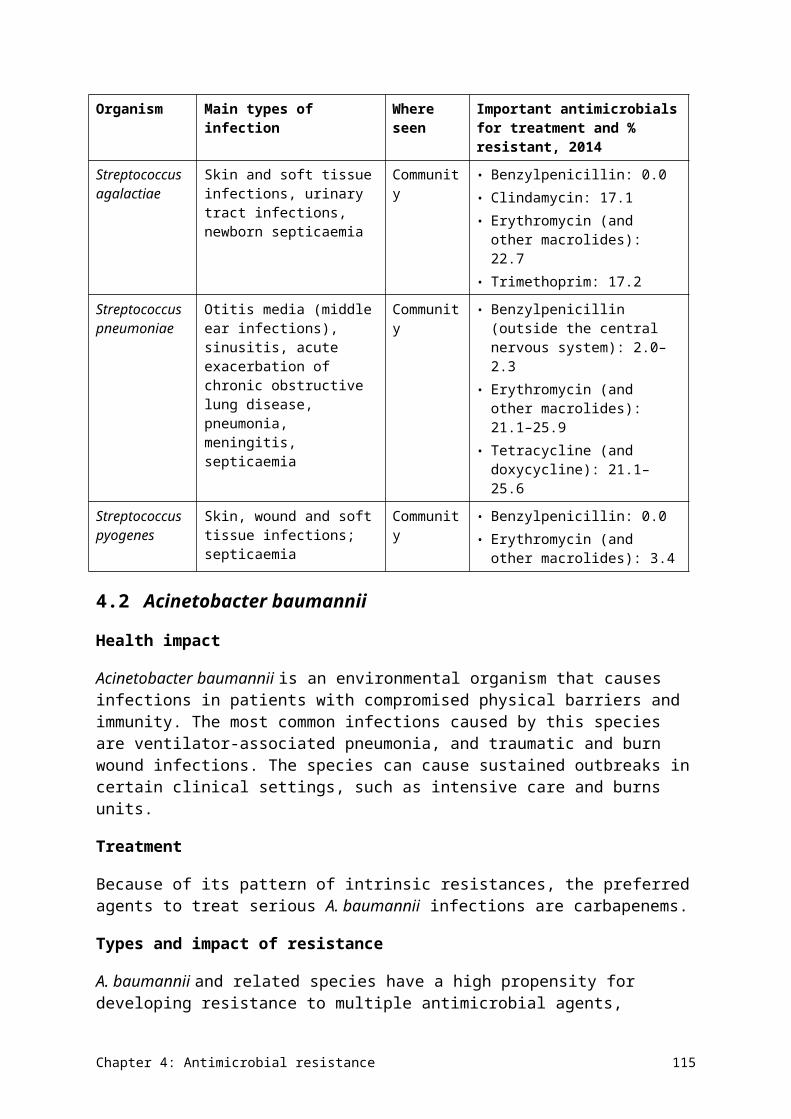
National trends
During the past 15 years, there has been no change in the (very low or zero) rates of resistance to any of the four key agents (Figure 4.23). In this context, resistance to benzylpenicillin is defined as an MIC of 1 mg/L or more.
Figure 4.23Fifteen-year trends in resistance in Neisseria meningitidis
Source: National Neisseria Network (public and private hospitals, and health services)
Detailed reports of susceptibility data on N. meningitidis from 1997 to 2013 can be found in the Australian Meningococcal Surveillance Programme annual reports (see Appendix 3).
4.8 Pseudomonas aeruginosa
Health impact
P. aeruginosa is an opportunistic, nosocomial pathogen that primarily affects hospitalised or immunocompromised patients. It is a ubiquitous organism found in moist environments, which act as a reservoir. It is naturally resistant to many chemicals, including most common antimicrobials and some antiseptics. As a consequence, it frequently causes infections in patients who are receiving antimicrobial treatments for other purposes.
P. aeruginosa can cause urinary tract infection in catheterised patients and patients with structural abnormalities of the urinary tract. It is associated with burn and other wound infections, and has a strong propensity to cause airway infection in patients with cystic fibrosis. It also frequently causes septicaemia, especially in neutropenic patients.
Treatment
P. aeruginosa is susceptible to only a limited range of antimicrobials:
• specialised β-lactams such as piperacillin (with or without tazobactam), ceftazidime and meropenem
• aminoglycosides such as gentamicin and tobramycin
Chapter 4: Antimicrobial resistance 123
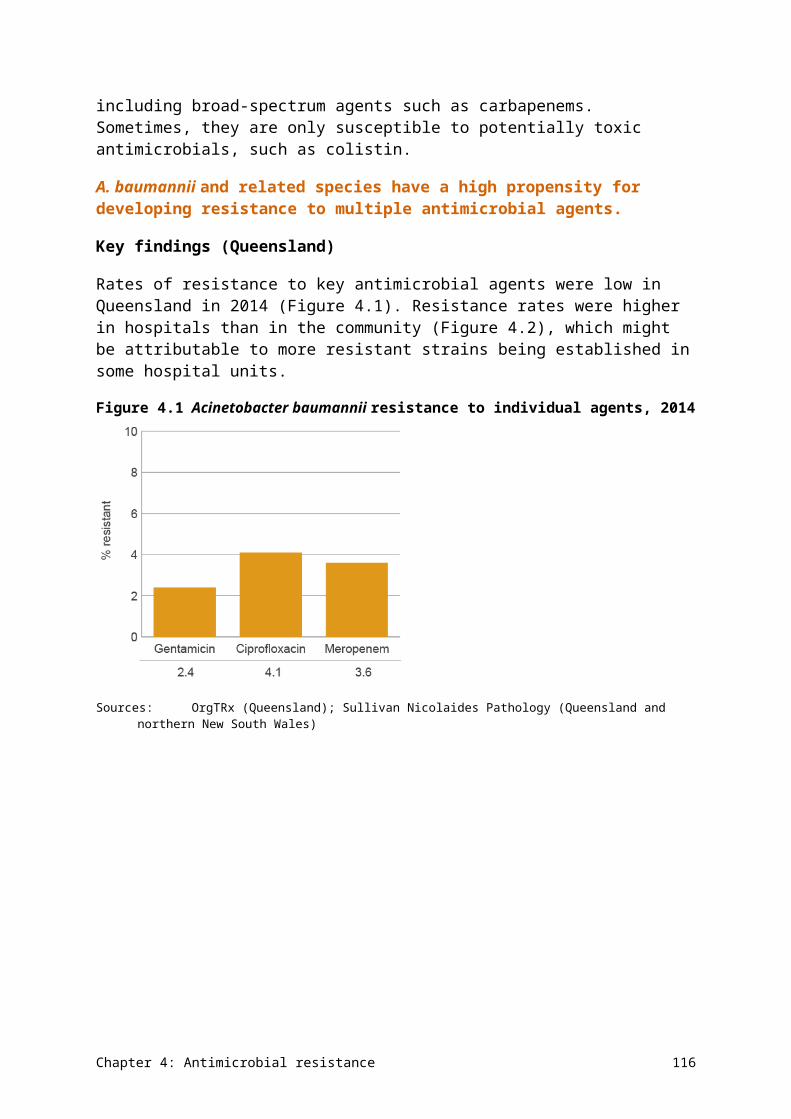
• some fluoroquinolones such as ciprofloxacin.
Urinary tract infections can often be managed with oral fluoroquinolones; more serious infections must be treated with β-lactams, which are usually used in combination with aminoglycosides for the most serious infections. The effective β-lactams and the aminoglycosides can only be administered intravenously.
Types and impact of resistance
This species is intrinsically resistant to many antimicrobial classes as a result of the presence of several efflux pumps in its cell wall and cell membrane. It is notorious for its capacity to become resistant during treatment to the limited range of effective agents, mainly due to the upregulation of these efflux pumps. It also has the capacity to become resistant to β-lactams through porin loss and the acquisition of β-lactamases. Multidrug-resistant strains with acquired resistance to two or three of the effective antimicrobial classes will require other treatments, such as the potentially toxic colistin.
Pseudomonas aeruginosa is intrinsically resistant to many antimicrobial classes.
Key findings (Queensland)
Resistance of P. aeruginosa to key antimicrobial agents is shown in Figure 4.24. Only resistance to piperacillin–tazobactam exceeded 10%. Rates of resistance were significantly higher in public hospitals (Figure 4.25), possibly due in part to the influence of isolates from patients with cystic fibrosis who are managed in the public sector. These patients are known to have isolates with higher rates of resistance to all effective agents because they are likely to have been treated multiple times for acute infective exacerbations of cystic fibrosis lung disease.
Figure 4.24Pseudomonas aeruginosa resistance to individual agents, 2014
CAZ = ceftazidime; CIP = ciprofloxacin; GEN = gentamicin; MER = meropenem; PTZ = piperacillin–tazobactamSources:OrgTRx (Queensland); Sullivan Nicolaides Pathology (Queensland and northern New South Wales)
Chapter 4: Antimicrobial resistance 124
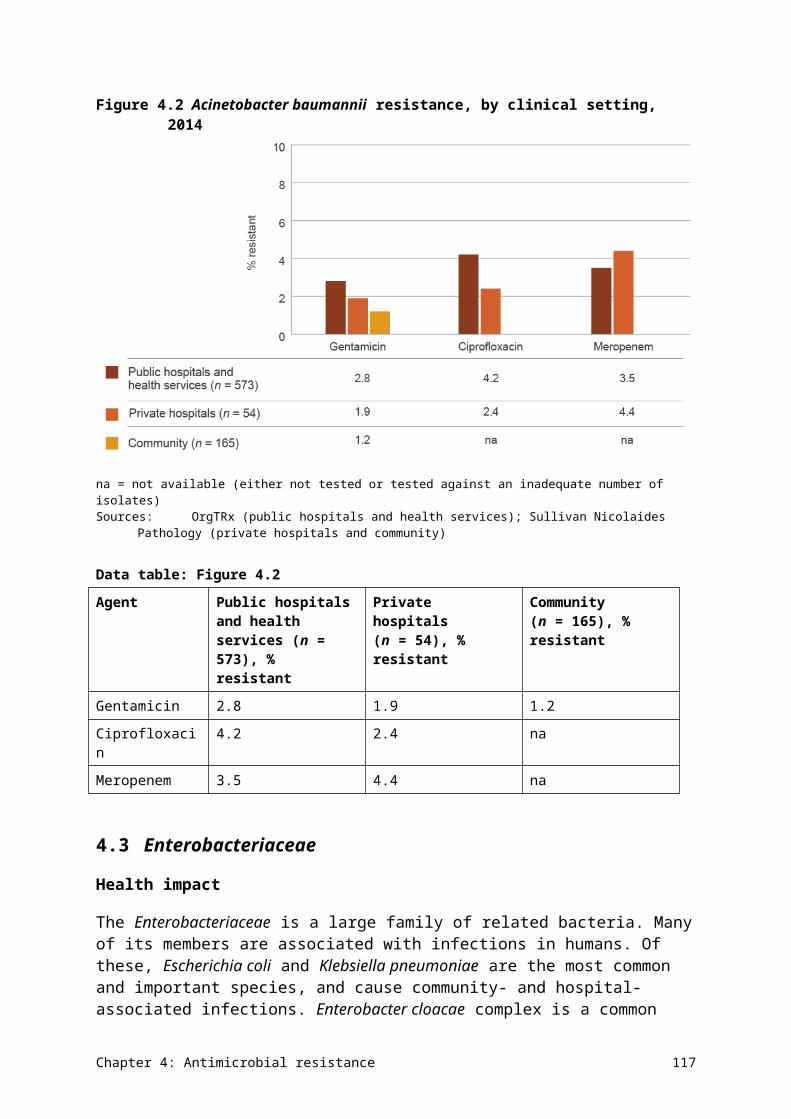
Data table: Figure 4.24
Agent % resistant
PTZ 10.3
CAZ 4.5
MER 4.0
GEN 5.3
CIP 6.7
Figure 4.25Pseudomonas aeruginosa resistance, by clinical setting, 2014
CAZ = ceftazidime; CIP = ciprofloxacin; GEN = gentamicin; MER = meropenem; na = not available (either not tested or tested against an inadequate number of isolates); PTZ = piperacillin–tazobactamSources:OrgTRx (public hospitals and health services); Australian Group on Antimicrobial Resistance and Sullivan
Nicolaides Pathology (SNP) (private hospitals); SNP (community and residential aged care facilities)
Data table: Figure 4.25
Agent Public hospitals and health services (n = 9,256), % resistant
Private hospitals (n = 2,570), % resistant
Community (n = 8,475), % resistant
Residential aged care facility (n = 1,216), % resistant
PTZ 10.3 na na na
CAZ 7.1 4.6 1.8 2.5
MER 6.4 na 0.6 na
GEN 8.9 2.5 2.6 2.5
CIP 9.4 na 2.8 na
Chapter 4: Antimicrobial resistance 125
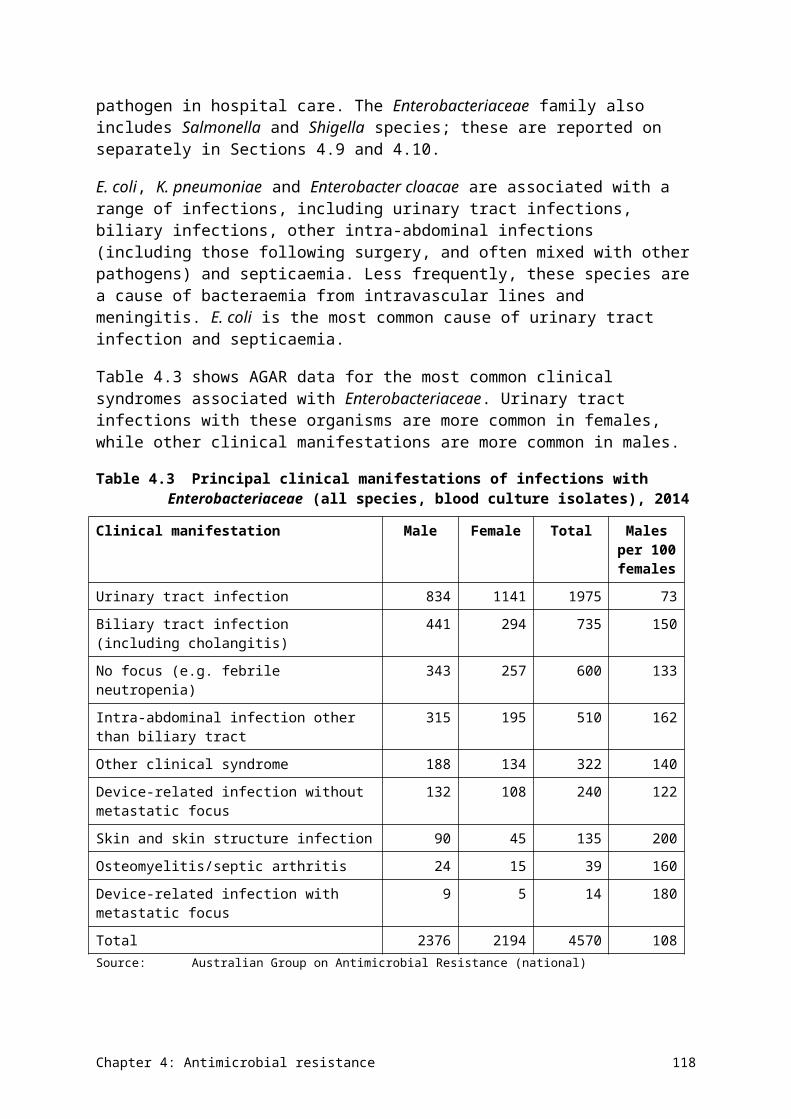
4.9 Salmonella species
Health impact
Salmonella species are important causes of bacterial gastroenteritis. Most cases arise through foodborne transmission. Occasionally, gastroenteritis is complicated by septicaemia, although this is usually self-limiting. Two serotypes, Salmonella Typhi and Salmonella Paratyphi (together called ‘typhoidal Salmonella’), cause a distinct syndrome called enteric fever, where the organism is always invasive (causing septicaemia), and causes significant morbidity and mortality if untreated. Salmonella gastroenteritis is endemic in Australia, but almost all cases of enteric fever are seen in returned overseas travellers.
Treatment
Salmonella gastroenteritis is self-limiting. Antimicrobial therapy is generally contraindicated because it does not affect the course of the disease and will prolong intestinal carriage of the organism after disease resolution, increasing the risk of transmission. Antimicrobial therapy is indicated in patients with severe disease or septicaemia, and patients who have prosthetic vascular grafts. Ciprofloxacin, azithromycin and ceftriaxone are the standard treatments. These are also the agents of choice for patients with enteric fever.
Types and impact of resistance
Resistance to older treatment agents, such as ampicillin and chloramphenicol, has been seen for many years, but, so far, resistance to the newer agents has only been a problem with ciprofloxacin and other fluoroquinolones, such as norfloxacin. This has resulted in recent reassessment of the definition of fluoroquinolone resistance. Not all susceptibility testing systems are yet capable of applying the new definitions.
Key findings (national)
In nontyphoidal Salmonella species, rates of resistance were low for ampicillin, and very low for ceftriaxone and the fluoroquinolones (Figure 4.26). In contrast, rates of resistance in typhoidal Salmonella species to the fluoroquinolone ciprofloxacin were above 10% for blood isolates (Figure 4.27).
In nontyphoidal Salmonella species, rates of resistance were low for ampicillin, and very low for ceftriaxone and the fluoroquinolones. In contrast, rates of resistance in typhoidal Salmonella species to the fluoroquinolone ciprofloxacin were above 10% for blood isolates.
Chapter 4: Antimicrobial resistance 126
Figure 4.26Nontyphoidal Salmonella species resistance, by specimen source, 2014
na = not available (either not tested or tested against an inadequate number of isolates)Sources:OrgTRx (Queensland); Australian Group on Antimicrobial Resistance (national); Sullivan Nicolaides Pathology
(Queensland and northern New South Wales)
Data table: Figure 4.26
Agent Blood (n = 182), % resistant
Faeces (n = 2,426), % resistant
Other (n = 115), % resistant
Ampicillin 6.7 7.7 7.0
Ceftriaxone 0.6 0.8 1.9
Ciprofloxacin 1.1 0.2 0.0
Norfloxacin na 1.4 0.9
Figure 4.27Typhoidal Salmonella species resistance (blood culture isolates), 2014
Sources:OrgTRx (Queensland); Australian Group on Antimicrobial Resistance (national); Sullivan Nicolaides Pathology (Queensland and northern New South Wales)
Chapter 4: Antimicrobial resistance 127
Data table: Figure 4.27
Agent Blood (n = 44), % resistant
Ampicillin 2.3
Ceftriaxone 0.0
Ciprofloxacin 12.2
Additional findings from targeted surveillance on blood culture isolates
Additional data on 30-day all-cause mortality for strains causing septicaemia and enteric fever is available from AGAR. There was no mortality at 30 days for typhoidal strains, and a modest mortality for nontyphoidal strains (Table 4.13).
Chapter 4: Antimicrobial resistance 128
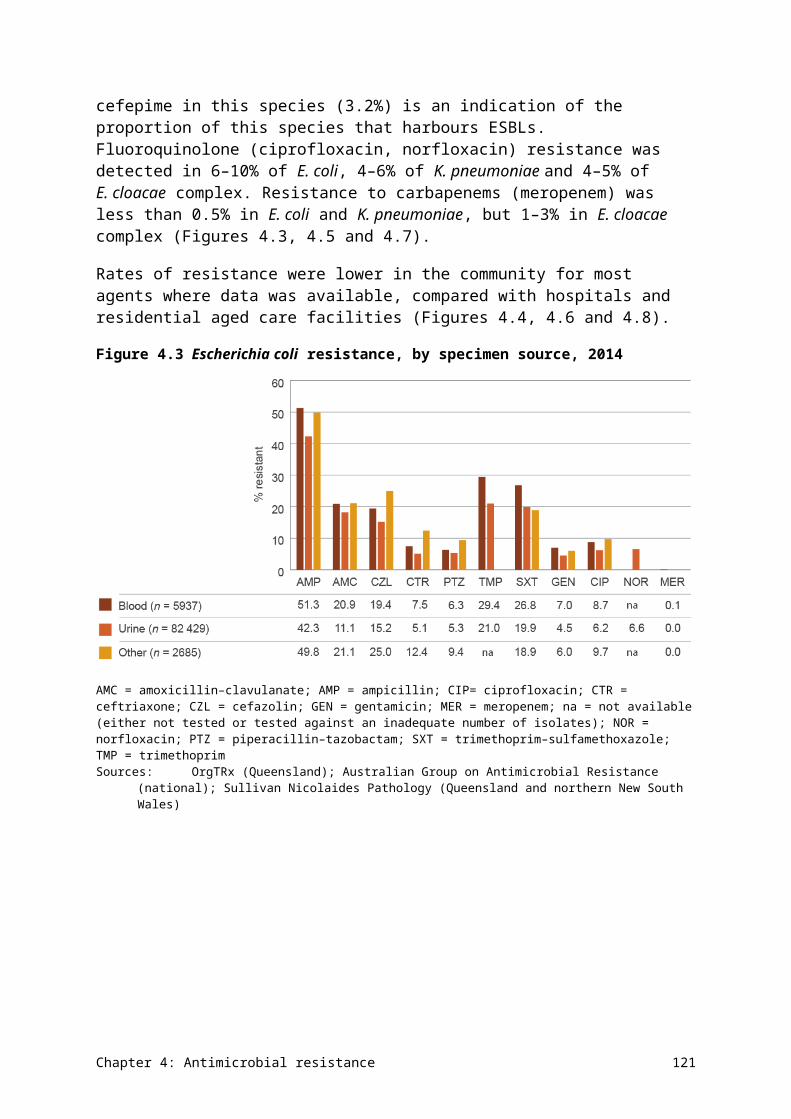
Table 4.13 Onset setting and 30-day all-cause mortality for infections with Salmonella species (blood culture isolates), 2014
Species Community, n
Community mortality, % (n)
Hospital, n
Hospital mortality, % (n)
Total, n Total mortality, %
(n)
Salmonella species (nontyphoidal)
66 7.6 (5) 2 0.0 (0) 68 7.4 (5)
Salmonella species (typhoidal) 22 0.0 (0) 0 0.0 (0) 22 0.0 (0)
Total 88 5.7 (5) 2 0.0 (0) 90 5.6 (5)Source: Australian Group on Antimicrobial Resistance (national)
Chapter 4: Antimicrobial resistance 129
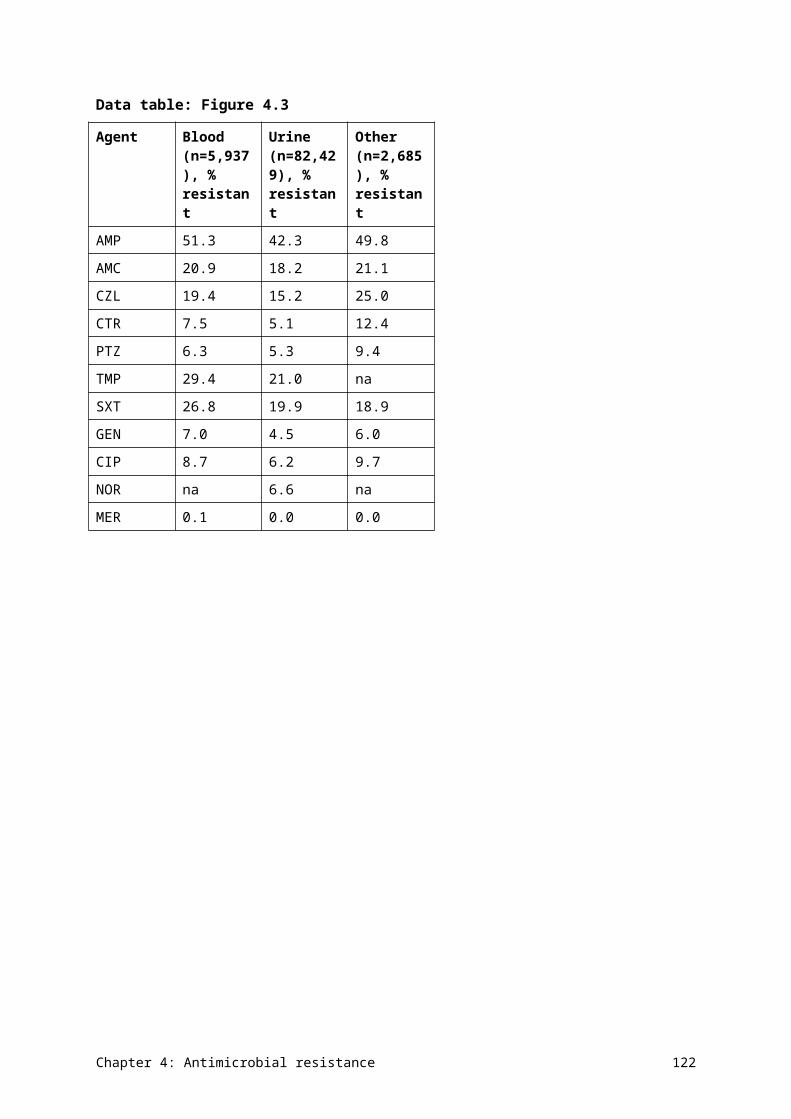
4.10 Shigella species
Health impact
Shigella species are an uncommon but important cause of gastroenteritis. They are genetically almost identical to E. coli, and have a similar capacity to acquire AMR. They also have the capacity to cause outbreaks if there is a common source(s) that infects people, or through person-to-person transmission.
Treatment
Treatment is usually administered when the infection is confirmed to be due to Shigella. The main aim of treatment is to prevent transmission of the organism, rather than to treat symptoms. The drugs of choice are fluoroquinolones (ciprofloxacin and norfloxacin) and trimethoprim–sulfamethoxazole.
Types and impact of resistance
Resistance and multidrug resistance to conventional treatments are well documented in other countries. Azithromycin is considered a suitable option for infections caused by strains that are resistant to standard treatments. Definitions of resistance to azithromycin are under development and not yet available.
Key findings (Queensland)
Resistance to ampicillin was common in S. flexneri. The prevalence of resistance to ciprofloxacin and ceftriaxone was very low in both S. flexneri and S. sonnei (Figure 4.28).
The significance of these findings is unclear because data is from a single state in Australia and only a small number of antimicrobials are reported. For this reason, it is not possible to report on multidrug resistance in Australia. However, the presence of any resistance to ciprofloxacin in Australia is of concern, given the capacity of this organism to cause outbreaks.
The presence of any resistance to ciprofloxacin in Shigella species is of concern, given the capacity of this organism to cause outbreaks.
Chapter 4: Antimicrobial resistance 130
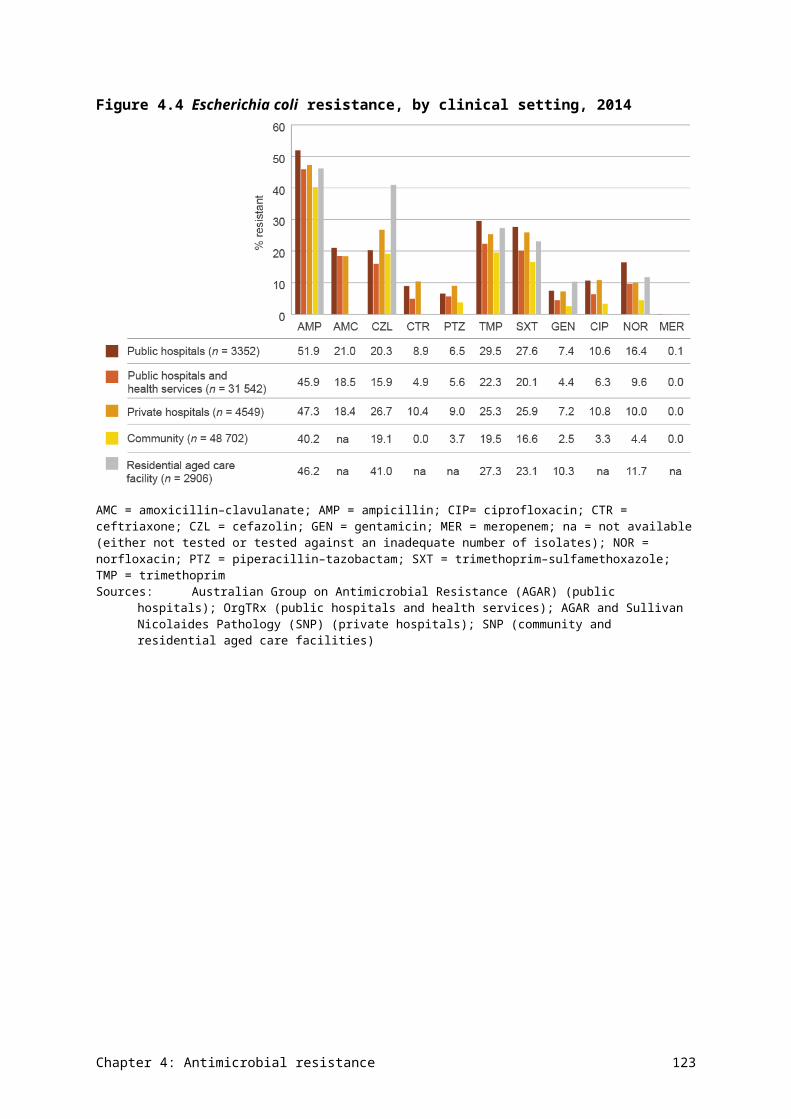
Figure 4.28Shigella species resistance (faecal isolates), 2014
Sources:OrgTRx (Queensland); Australian Group on Antimicrobial Resistance (national); Sullivan Nicolaides Pathology (Queensland and northern New South Wales)
Data table: Figure 4.28
Agent S. sonnei (n = 73), % resistant
S. flexneri (n = 22), % resistant
Ampicillin 10.6 57.1
Ceftriaxone 3.1 0.0
Ciprofloxacin 9.4 0.0
4.11 Staphylococcus aureus
Health impact
S. aureus is a common human pathogen that causes a wide range of infections, including minor infections such as boils, impetigo and wound infections; moderate infections such as cellulitis; and serious infections such as bone and joint infections, pneumonia, endocarditis and septicaemia. Infections associated with bacteraemia (positive blood cultures) have a 30-day crude mortality of 15–30%. S. aureus is also a common cause of healthcare-associated infections, especially surgical site infections, intravascular line infections with bacteraemia, and infections of prosthetic devices.
According to AGAR data, the overall 30-day all-cause mortality rate for S. aureus bacteraemia in 2014 was 16.1%, and was higher in hospital-onset bacteraemia than in the community. Thirty-day all-cause mortality was lowest with methicillin-susceptible strains, higher for community-associated bacteraemia, and highest for hospital-associated bacteraemia. Common clinical manifestations of staphylococcal bacteraemia were skin and skin structure infections, device-related infections, and bone and joint infections (Table 4.14). With the exception of right-sided endocarditis, all infections are more common in males.
Chapter 4: Antimicrobial resistance 131
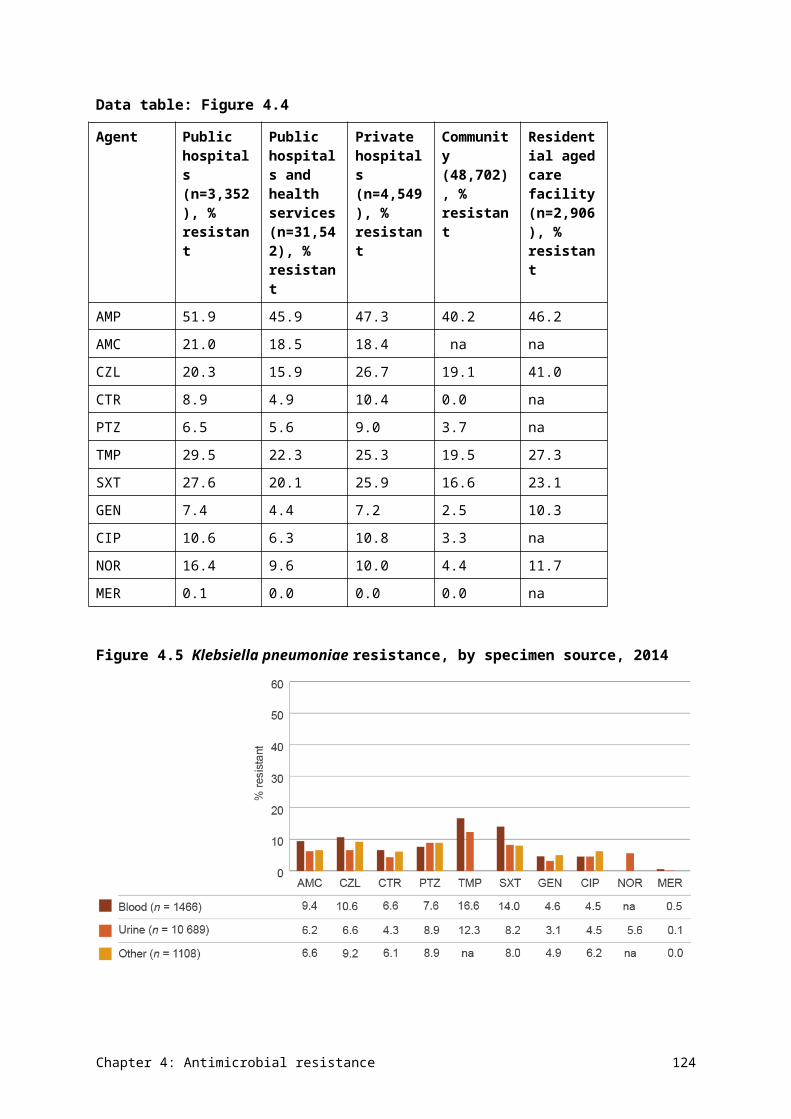
Table 4.14 Principal clinical manifestations of Staphylococcus aureus infection (blood culture isolates), 2014
Clinical manifestation Male Female Total Males per 100 females
Skin and skin structure infection 265 135 400 196
Device-related infection without metastatic focus 235 145 380 162
Osteomyelitis/septic arthritis 238 115 353 207
No focus (e.g. febrile neutropenia) 152 94 246 162
Other clinical syndrome 81 52 133 156
Endocarditis, left-sided 78 40 118 195
Deep abscesses, excluding those in the central nervous system
65 48 113 135
Pneumonia/empyema 59 42 101 140
Central nervous system infection (meningitis, abscesses) 34 19 53 179
Device-related infection with metastatic focus 27 16 43 169
Endocarditis, right-sided 18 22 40 82
Total 1252 728 1980 172Source: Australian Group on Antimicrobial Resistance (national)
Treatment
Minor staphylococcal skin infections can often be managed without antimicrobial therapy, but moderate and serious infections require treatment. The preferred agent for ‘susceptible’ strains is flucloxacillin (or dicloxacillin), which can be replaced with first-generation cephalosporins such as cefazolin or cephalexin in penicillin-allergic patients.
Types and impact of resistance
In the pre-antibiotic era, S. aureus was susceptible to penicillin, but resistance emerged rapidly in the 1950s and 1960s, to a point where 85–90% of strains in the community are now resistant. Healthcare-associated strains that are resistant to flucloxacillin and first-generation cephalosporins, commonly called methicillin-resistant S. aureus (MRSA), emerged in the 1970s and are now common in many parts of Australia. These healthcare-associated clones are multidrug resistant and require treatment with reserve antimicrobials such as vancomycin, rifampicin and fusidic acid. Community-associated clones of MRSA are distinct from healthcare-associated clones and emerged in the 1980s. These clones are usually not multidrug resistant, and moderate infections may be treated with trimethoprim–sulfamethoxazole or clindamycin. All serious MRSA infections require initial treatment with vancomycin. Resistance to vancomycin appears to be uncommon, but is difficult to detect in the diagnostic laboratory. There are very few alternative treatments to vancomycin.
Key findings (national)
Overall, more than 80% of S. aureus isolates were resistant to (benzyl)penicillin in 2014 (Figure 4.29). Oxacillin (methicillin) resistance exceeded 17% in isolates from blood and
Chapter 4: Antimicrobial resistance 132
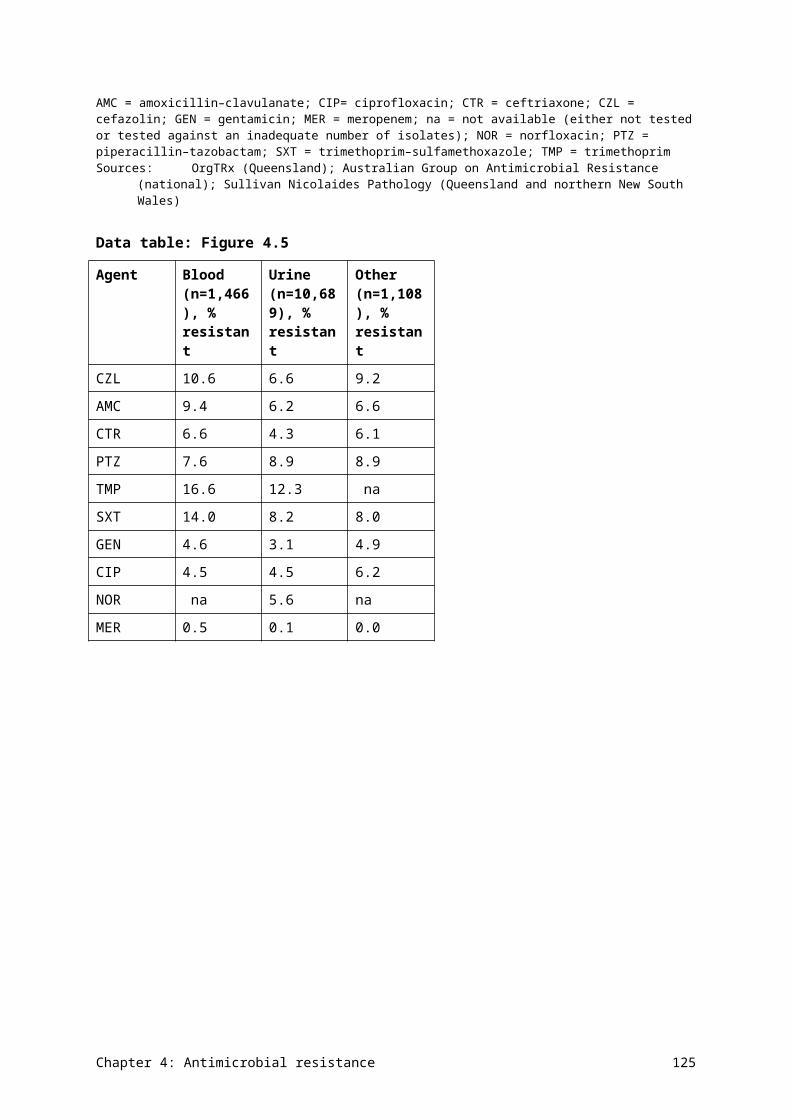
15% in isolates from other specimens. There was little difference in rates of resistance between different clinical settings, apart from oxacillin resistance, which was higher in public hospitals and health services, and residential aged care facilities, but lower in private hospitals and lowest in the community (Figure 4.30).
Oxacillin (methicillin) resistance in S. aureus exceeded 17% in isolates from blood and 15% in isolates from other specimens.
Figure 4.29Staphylococcus aureus resistance, by specimen source, 2014
Sources:OrgTRx (Queensland); Australian Group on Antimicrobial Resistance (national); Sullivan Nicolaides Pathology (Queensland and northern New South Wales)
Data table: Figure 4.29
Agent Blood (n=3,676), % resistant Other (n=68,563), % resistant
Penicillin 83.1 88.7
Oxacillin 17.4 15.8
Erythromycin 17.0 16.5
Clindamycin 7.1 10.0
Tetracycline 5.0 3.4
Chapter 4: Antimicrobial resistance 133
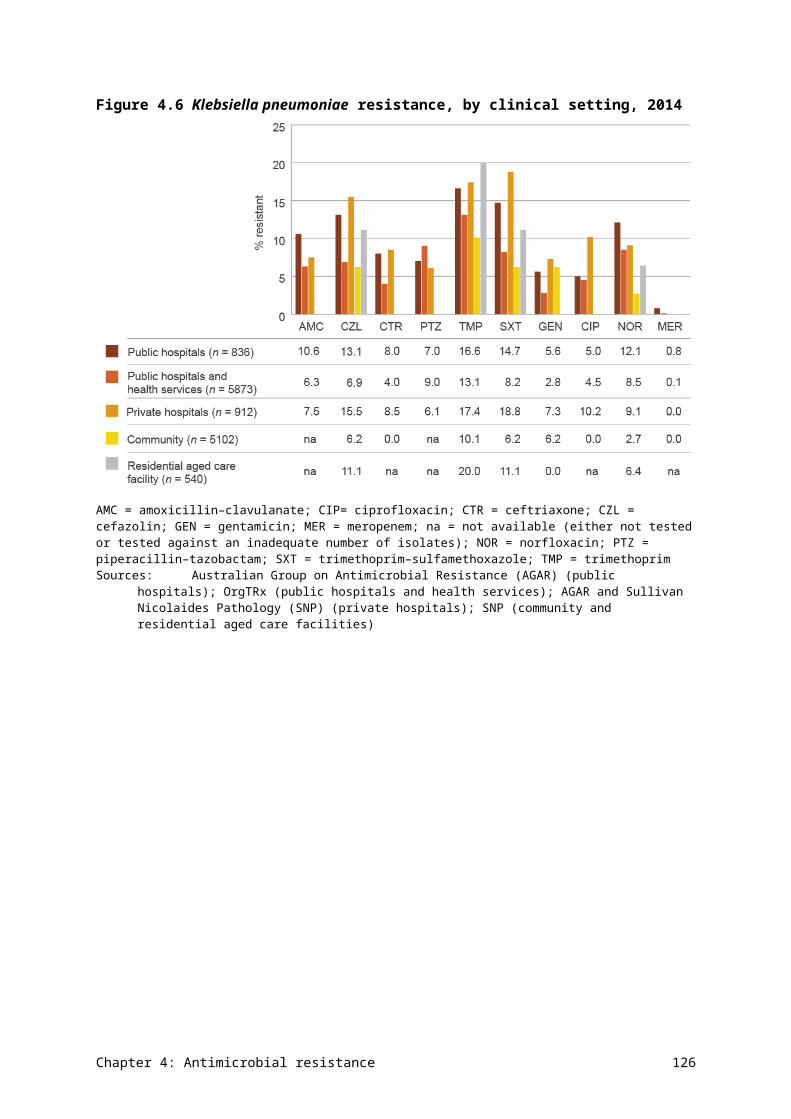
Figure 4.30Staphylococcus aureus resistance, by clinical setting, 2014
na = not available (either not tested or tested against an inadequate number of isolates)Sources:Australian Group on Antimicrobial Resistance (AGAR) (public hospitals); OrgTRx (public hospitals and health
services); AGAR and Sullivan Nicolaides Pathology (SNP) (private hospitals); SNP (community and residential aged care facilities)
Data table: Figure 4.30
Agent Public hospitals (n=2,091), % resistant
Public hospitals and health services (n=29,840), % resistant
Private hospitals (n=3,591), % resistant
Community (n=34,703), % resistant
Residential aged care facility (n=2,014), % resistant
Penicillin 82.7 88.9 84.5 84.6 na
Oxacillin 19.6 20.7 15.7 10.8 27.7
Erythromycin
17.3 14.7 19.6 17.3 22.2
Clindamycin 4.5 10.1 0.0 na na
Tetracycline 6.2 3.3 4.5 3.2 5.0
Resistance to ciprofloxacin and erythromycin is high in MRSA, especially in blood isolates. A small number of MRSA strains exhibited resistance to linezolid and daptomycin (Figure 4.31). There were noticeable differences in resistance to ciprofloxacin, erythromycin and gentamicin in MRSA strains between clinical settings (Figure 4.32), possibly related to variation in the distribution of healthcare-associated clones compared with community-associated clones (Figures 4.33 and 4.34).
Chapter 4: Antimicrobial resistance 134
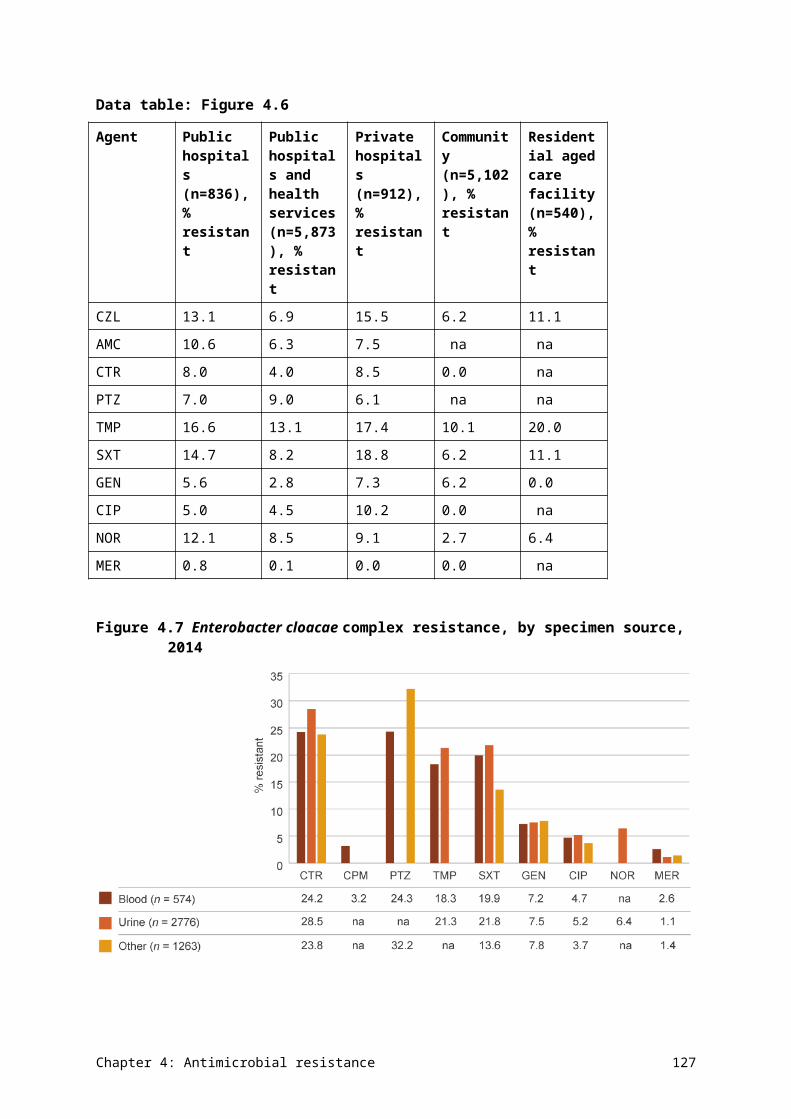
Figure 4.31Methicillin-resistant Staphylococcus aureus resistance to non-β-lactam agents, by specimen source, 2014
CIP = ciprofloxacin; CLN = clindamycin; DAP = daptomycin; ERY = erythromycin; FUS = fusidic acid; GEN = gentamicin; LNZ = linezolid; RIF = rifampicin; SXT = trimethoprim–sulfamethoxazole Sources:OrgTRx (Queensland); Australian Group on Antimicrobial Resistance (national); Sullivan Nicolaides Pathology
(Queensland and northern New South Wales)
Data table: Figure 4.31
Agent Blood (n=636), % resistant
Other (n=10,675), % resistant
CIP 43.0 12.6
ERY 45.2 23.7
CLN 19.6 14.2
SXT 11.9 5.2
GEN 15.0 4.1
RIF 0.8 0.9
FUS 4.6 5.9
LNZ 0.3 0.1
DAP 1.0 0.5
Chapter 4: Antimicrobial resistance 135
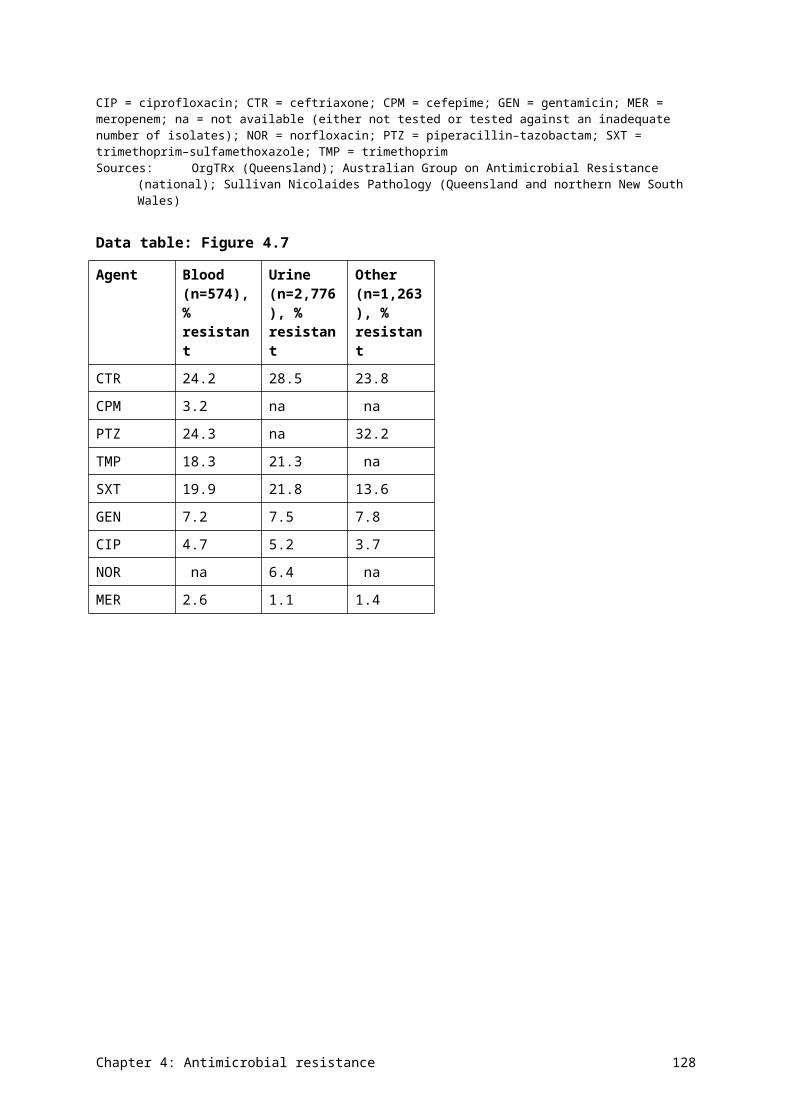
Figure 4.32Methicillin-resistant Staphylococcus aureus resistance to non-β-lactam agents, by clinical setting, 2014
CIP = ciprofloxacin; CLN = clindamycin; DAP = daptomycin; ERY = erythromycin; FUS = fusidic acid; GEN = gentamicin; LNZ = linezolid; na = not available (either not tested or tested against an inadequate number of isolates); RIF = rifampicin; SXT = trimethoprim–sulfamethoxazoleSources:Australian Group on Antimicrobial Resistance (AGAR) (public hospitals); OrgTRx (public hospitals and health
services), AGAR and Sullivan Nicolaides Pathology (SNP) (private hospitals): SNP (community and residential aged care facilities)
Data table: Figure 4.32
Agent Public hospitals (n=406), % resistant
Public hospitals and health services (n=6,141), % resistant
Private hospitals (n=563), % resistant
Community (n=3,639), % resistant
Residential aged care facility (n=562), % resistant
CIP 51.7 13.0 0.0 na na
ERY 49.0 20.6 46.0 24.1 41.3
CLN 16.5 14.6 0.0 na na
SXT 12.8 5.3 10.5 4.5 5.2
GEN 18.0 4.2 0.0 na na
RIF 1.2 0.7 1.6 1.0 1.3
FUS 4.2 4.6 9.7 6.7 11.1
LNZ 0.5 0.1 0.0 na na
DAP 1.5 0.5 0.0 na na
Chapter 4: Antimicrobial resistance 136
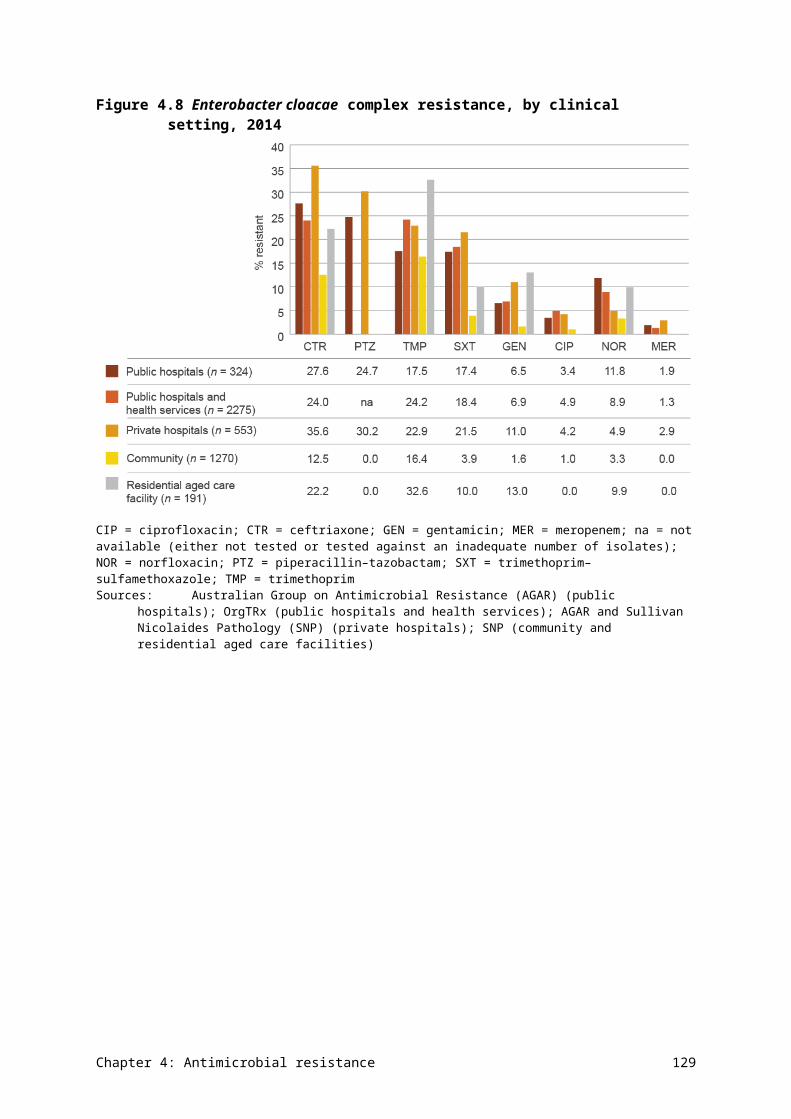
Healthcare-associated clones of MRSA had high rates of resistance to ciprofloxacin and erythromycin, and moderate levels of resistance to clindamycin, trimethoprim–sulfamethoxazole and gentamicin (Figure 4.33). Rates of resistance to other ‘anti-MRSA’ agents are low. Rates of resistance to ciprofloxacin and erythromycin were much lower in community-associated clones than in healthcare-associated clones (Figure 4.34).
Figure 4.33Resistance to other antimicrobials of healthcare-associated clones of methicillin-resistant Staphylococcus aureus (blood culture isolates), 2014
CIP = ciprofloxacin; CLN = clindamycin; DAP = daptomycin; ERY = erythromycin; FUS = fusidic acid; GEN = gentamicin; LNZ = linezolid; RIF = rifampicin; SXT = trimethoprim–sulfamethoxazoleSource: Australian Group on Antimicrobial Resistance (national)
Data table: Figure 4.33
Agent % resistant
CIP 98.2
ERY 71.2
CLN 29.4
SXT 22.1
GEN 28.8
RIF 1.2
FUS 2.5
LIN 0.0
DAP 3.1
Chapter 4: Antimicrobial resistance 137
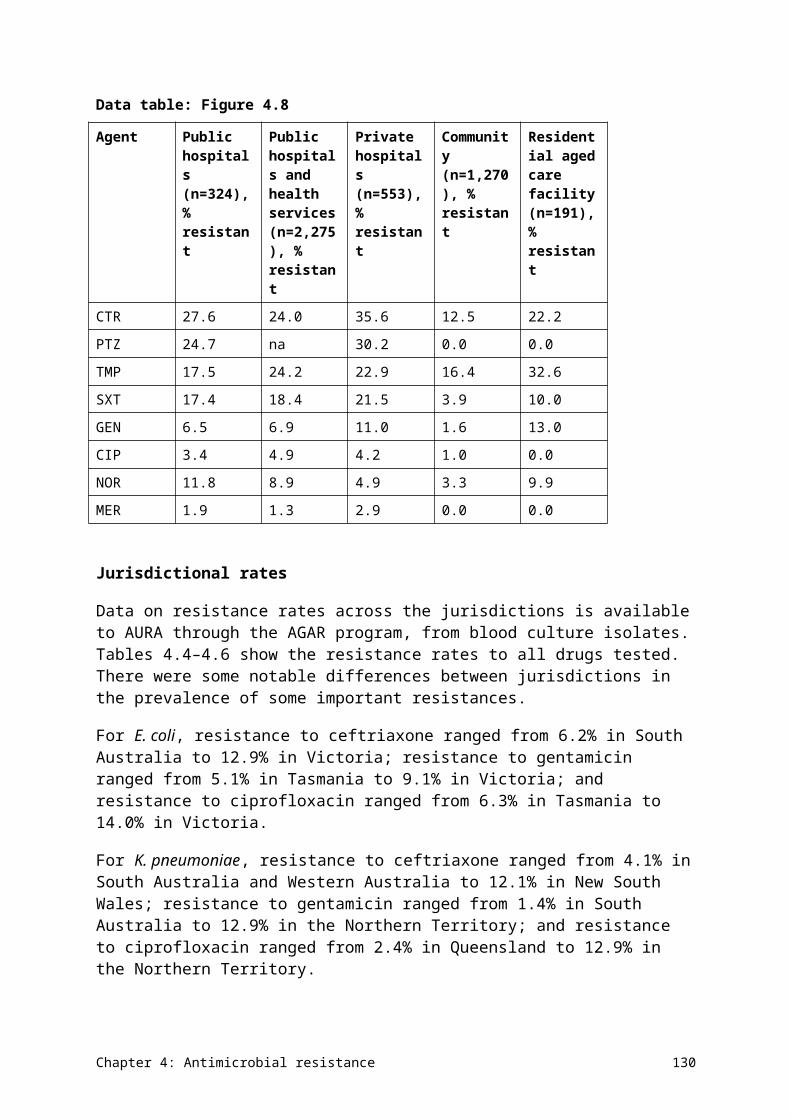
Figure 4.34Resistance to other antimicrobials of community-associated clones of methicillin-resistant Staphylococcus aureus (blood culture isolates), 2014
CIP = ciprofloxacin; CLN = clindamycin; ERY = erythromycin; FUS = fusidic acid; LNZ = linezolid; RIF = rifampicin; SXT = trimethoprim–sulfamethoxazoleSource: Australian Group on Antimicrobial Resistance (national)
Data table: Figure 4.34
Agent % resistant
CIP 19.2
ERY 33.1
CLN 7.1
SXT 5.9
RIF 0.8
FUS 5.4
LNZ 0.8
Table 4.15 shows the multilocus sequence types of MRSA clones across Australia. Community-associated clones now dominate in staphylococcal bacteraemia.
Chapter 4: Antimicrobial resistance 138
Table 4.15 Methicillin-resistant Staphylococcus aureus clones (blood culture isolates), 2014
MRSA type MRSA clone n %
Healthcare associated ST22-MRSA-IV 119 29.5
Healthcare associated ST239-MRSA-III 43 10.7
Healthcare associated ST5-MRSA-II 1 0.2
Healthcare associated Total 163 40.4
Community associated ST93-MRSA-IV 60 14.9
Community associated ST1-MRSA-IV 45 11.2
Community associated ST45-MRSA-V 30 7.4
Community associated ST5-MRSA-IV 30 7.4
Community associated ST30-MRSA-IV 20 5.0
Community associated ST78-MRSA-IV 11 2.7
Community associated ST5-MRSA-V 8 2.0
Community associated ST188-MRSA-IV 5 1.2
Community associated ST1-MRSA-V 5 1.2
Community associated ST8-MRSA-IV 5 1.2
Community associated ST72-MRSA-IV 4 1.0
Community associated ST835-MRSA-novel 4 1.0
Community associated ST45-MRSA-IV 3 0.7
Community associated ST953-MRSA-IV 3 0.7
Community associated ST1420-MRSA-IV 2 0.5
Community associated ST59-MRSA-IV 2 0.5
Community associated ST2974-MRSA-V 1 0.2
Community associated ST6-MRSA-IV 1 0.2
Community associated ST75-MRSA-IV 1 0.2
Community associated Total 240 59.6MRSA = methicillin-resistant Staphylococcus aureusSource: Australian Group on Antimicrobial Resistance (national)
Jurisdictional rates
Jurisdictional data is available from the AGAR targeted surveillance program on blood culture isolates. There are significant differences among the states and territories in the prevalence and types of MRSA. Overall rates range from 3.8% in Tasmania to 42.2% in the Northern Territory (Figure 4.35 and AURA 2016: supplementary data). Community-associated MRSA clones dominate in all states except the Australian Capital Territory, New South Wales and Tasmania. Multilocus sequence type analysis reveals a great diversity of clones across the states and territories (Figure 4.36).
Chapter 4: Antimicrobial resistance 139
There are significant differences among the states and territories in the prevalence and types of MRSA. Overall rates range from 3.8% in Tasmania to 42.2% in the Northern Territory.
Figure 4.35Methicillin-resistant Staphylococcus aureus as a percentage of all S. aureus isolates, by jurisdiction (blood culture isolates), 2014
ACT = Australian Capital Territory; MRSA = methicillin-resistant Staphylococcus aureus; NSW = New South Wales; NT = Northern Territory; Qld = Queensland; SA = South Australia; Tas = Tasmania; Vic = Victoria; WA = Western AustraliaSource: Australian Group on Antimicrobial Resistance (national)
Data table: Figure 4.35
Jurisdiction Healthcare associated infections, % MRSA
Community associated infections, % MRSA
ACT 11.4 1.3
NSW 13.2 11.0
NT 7.8 34.4
Qld 5.5 12.0
SA 7.7 11.2
Tas 1.9 1.9
Vic 6.3 8.0
WA 2.5 11.5
Australia 7.4 10.9
Chapter 4: Antimicrobial resistance 140
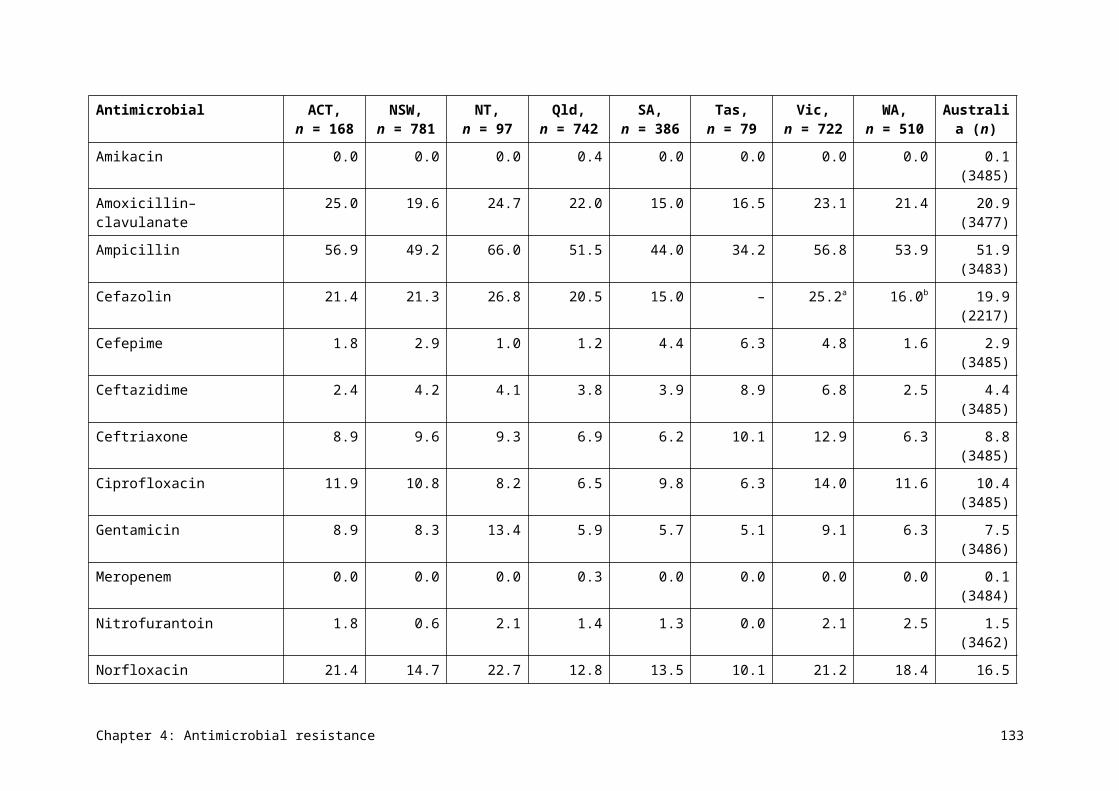
Figure 4.36Distribution of methicillin-resistant Staphylococcus aureus clones, by jurisdiction (blood culture isolates), 2014
ACT = Australian Capital Territory; MRSA = methicillin-resistant Staphylococcus aureus; NSW = New South Wales; NT = Northern Territory; Qld = Queensland; SA = South Australia; Tas = Tasmania; Vic = Victoria; WA = Western Australiaa Healthcare-associated clonesSource: Australian Group on Antimicrobial Resistance (national)
Chapter 4: Antimicrobial resistance 141
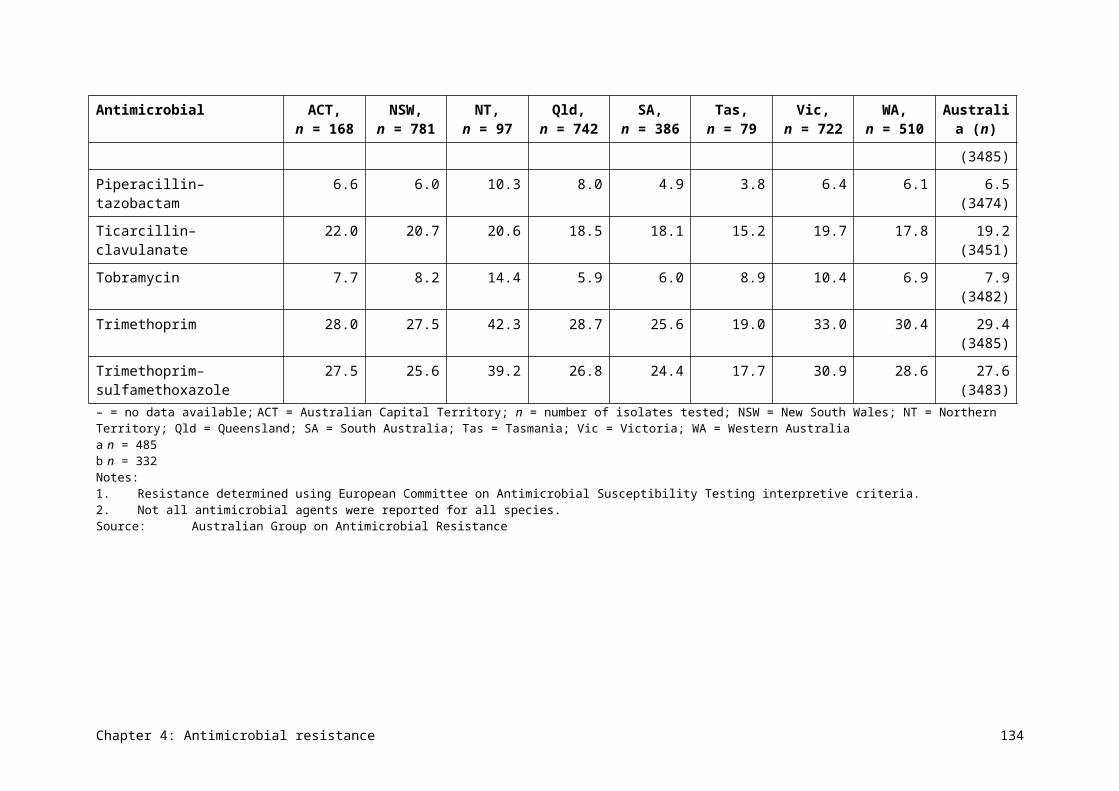
Data table: Figure 4.36
Chapter 4: Antimicrobial resistance 142
Clone ACT (n = 10), %
NSW (n = 125), %
NT (n = 27), %
Qld (n = 96), %
SA (n = 37), %
Tas (n = 2), %
Vic (n = 61), %
WA (n = 45), %
ST22-MRSA-IV
60 41.6 0 22.11 32.43 50 31.15 18.18
ST239-MRSA-III
30 12 17.86 9.47 8.11 0 13.11 0
ST5-MRSA-II
0 0.8 0 0 0 0 0 0
ST93-MRSA-IV
0 5.6 46.43 21.05 16.22 0 9.84 18.18
ST1-MRSA-IV
10 5.6 14.29 10.53 13.51 0 9.8 27.27
ST45-MRSA-V
0 12.8 3.57 0 10.81 0 13 2.27
ST5-MRSA-IV
0 10.4 7.14 8.42 5.41 0 3.28 6.82
ST30-MRSA-IV
0 2.4 0 14.74 0 0 3.28 2.27
ST78-MRSA-IV
0 1.6 0 2.11 5.4 0 3.28 4.55
ST5-MRSA-V
0 2.4 0 3.16 0 0 0 4.55
ST188-MRSA-IV
0 0 0 0 5.4 0 4.92 0
ST1-MRSA-V
0 0 0 5.26 0 0 0 0
ST8-MRSA-IV
0 0 0 0 0 0 6.56 2.3
ST72-MRSA-IV
0 3.2 0 0 0 0 0 0
ST835-MRSA-NOVEL
0 0 0 1.05 0 50 0 4.6
ST45-MRSA-IV
0 0.8 0 0 0 0 1.64 2.3
ST953-MRSA-IV
0 0 3.6 0 0 0 0 4.6
ST1420-MRSA-IV
0 0 0 1.05 0 0 0 2.3
ST59-MRSA-IV
0 0 0 1.05 2.7 0 0 0
ST2974-MRSA-V
0 0 3.6 0 0 0 0 0
Chapter 4: Antimicrobial resistance 143
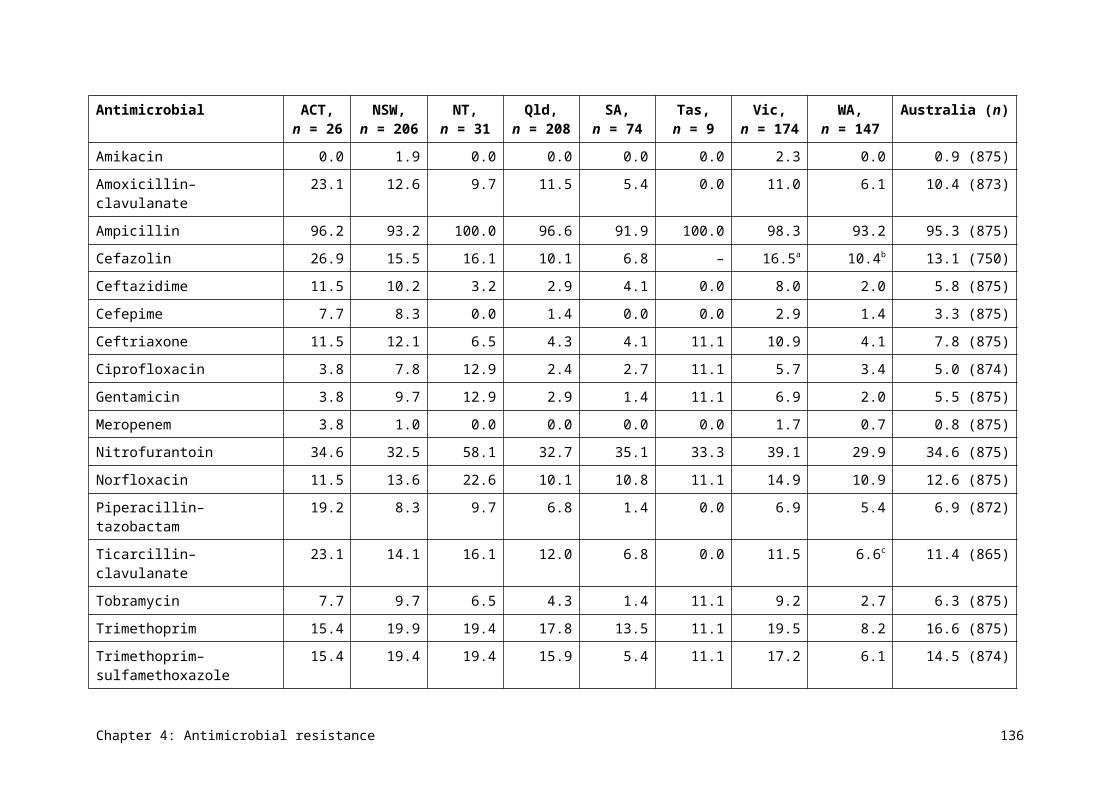
Clone ACT (n = 10), %
NSW (n = 125), %
NT (n = 27), %
Qld (n = 96), %
SA (n = 37), %
Tas (n = 2), %
Vic (n = 61), %
WA (n = 45), %
ST6-MRSA-IV
0 0.8 0 0 0 0 0 0
ST75-MRSA-IV
0 0 3.6 0 0 0 0 0
The overall 30-day all-cause mortality rate was 16.1%, and was higher in hospital-onset bacteraemia than in community-onset bacteraemia (Table 4.16). Thirty-day all-cause mortality was lowest with methicillin-susceptible strains, somewhat higher for bacteraemia caused by community-associated MRSA clones, and highest for bacteraemia caused by hospital-associated MRSA clones.
Full data from AGAR surveys of S. aureus can be found on the AGAR website (see Appendix 3).
Chapter 4: Antimicrobial resistance 144
Table 4.16 Onset setting and 30-day all-cause mortality for infections with Staphylococcus aureus (blood culture isolates), 2014
Staphylococcus aureus strain Total, n
Total mortality, % (n)
Community-onset, n
Community mortality, % (n)
Hospital-onset, n
Hospital mortality, % (n)
Methicillin susceptible 1525 14.4 (220) 1130 12.9 (146) 395 18.7 (74)
MRSA 361 23.3 (84) 229 22.7 (52) 132 24.2 (32)
– Community-associated MRSA clones
196 16.8 (33) 141 18.4 (26) 55 12.7 (7)
– Hospital-associated MRSA clones
155 32.3 (50) 82 31.7 (26) 73 32.9 (24)
– Not determined 10 10.0 (1) 6 0.0 (0) 4 25.0 (1)
Total 1886 16.1 (304) 1359 14.6 (198) 527 20.1 (106)MRSA = methicillin-resistant Staphylococcus aureusSource: Australian Group on Antimicrobial Resistance (national)
Chapter 4: Antimicrobial resistance 145
4.12 Streptococcus agalactiae
Health impact
S. agalactiae, also called group B Streptococcus (GBS), occasionally causes infections similar to those caused by S. pyogenes. These include skin and soft tissue infections, as well as more serious infections, such as septicaemia and bone and joint infections. Its greatest significance is as the main cause of neonatal septicaemia and meningitis, which is associated with high morbidity and mortality. The neonate acquires the organism from the mother’s vaginal flora, where it is carried asymptomatically. The organism is carried by up to 30% of healthy women of childbearing age.
Treatment
Screening mothers in late pregnancy for carriage of GBS is now widespread practice in Australia. If the mother tests positive for GBS, antimicrobials are administered to her during delivery to prevent transmission to the baby, regardless of the delivery mode. Benzylpenicillin is the recommended agent for this purpose; cefazolin or lincomycin/clindamycin are recommended for women with penicillin allergy, depending on the type and severity of the allergy.
Types and impact of resistance
Resistance to benzylpenicillin and cefazolin is emerging but still uncommon in Australia, but resistance to erythromycin/lincomycin/clindamycin is common at around 20%. Lincomycin/clindamycin resistance is strongly linked to resistance to macrolides such as erythromycin, which is often used in the laboratory as the test agent to predict resistance to lincomycin/clindamycin. Mothers who carry GBS that is resistant to erythromycin/lincomycin/clindamycin, but who would otherwise be treated with lincomycin/clindamycin, will require prophylaxis with vancomycin.
Key findings (Queensland)
Resistance to (benzyl)penicillin was not found, but resistance to erythromycin exceeded 20% (Figure 4.37). This is important, because an erythromycin resistance rate of 20% is the threshold at which protocols may need to be reconsidered and alternative agents used.
Resistance to (benzyl)penicillin was not found in S. agalactiae, but resistance to erythromycin exceeded 20%.
Chapter 4: Antimicrobial resistance 146
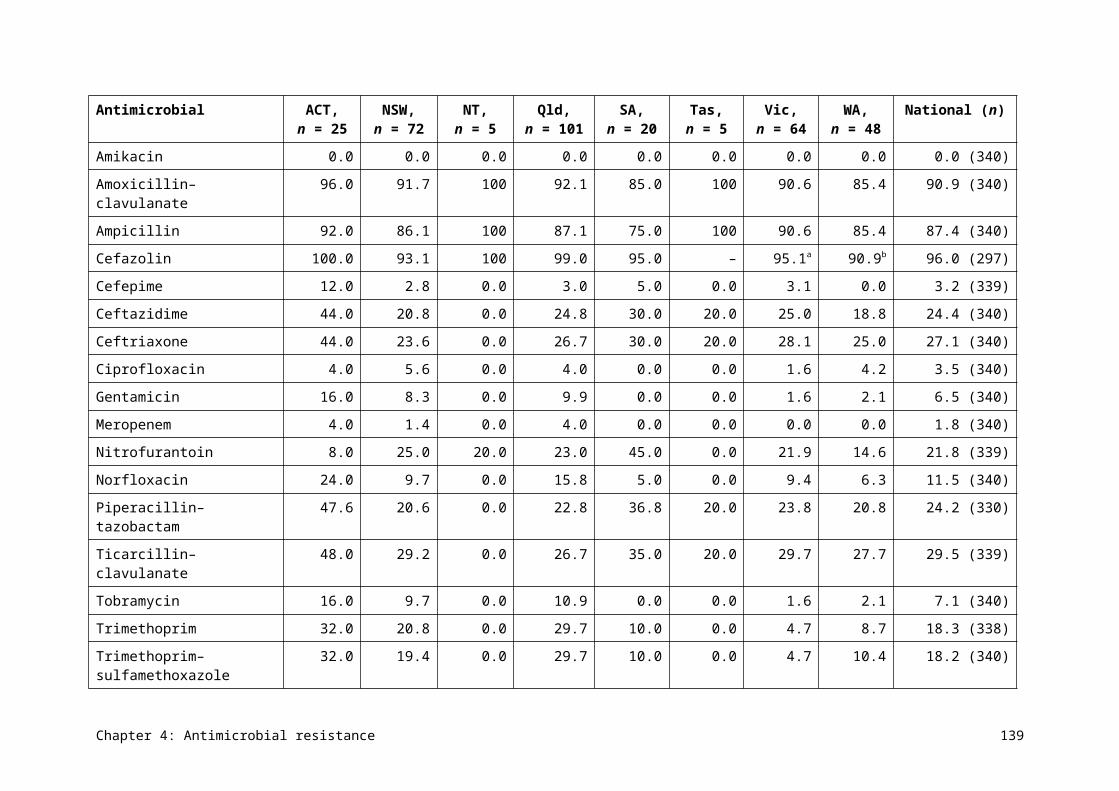
Figure 4.37Streptococcus agalactiae resistance to individual agents, 2014
Sources:OrgTRx (Queensland); Sullivan Nicolaides Pathology (Queensland and northern New South Wales)
4.13 Streptococcus pneumoniae
Health impact
S. pneumoniae is an important pathogen that commonly causes acute otitis media, acute sinusitis and pneumonia. It can also cause septicaemia (especially in young children) and bacterial meningitis. Its capacity to cause disease is linked to its polysaccharide capsule, of which there are more than 90 serotypes.
In Australia, two pneumococcal vaccines are included in the National Immunisation Program. Infants receive a conjugated vaccine that covers 13 of the most common serotypes, and older people and those with risk factors receive a polysaccharide vaccine that covers 23 of the most common serotypes. Hence, not all pneumococcal infection is preventable.
Treatment
Otitis media and sinusitis are normally treated with oral amoxicillin, cefuroxime (in penicillin-allergic patients) or doxycycline (for people older than eight years). Macrolides and trimethoprim–sulfamethoxazole are sometimes used for oral treatments. Pneumonia and meningitis are generally treated with benzylpenicillin if the strain is proven to be susceptible, or ceftriaxone (or cefotaxime) for penicillin-nonsusceptible strains. Strains causing pneumonia or meningitis that are nonsusceptible to penicillin and ceftriaxone (rare) require treatment with vancomycin or meropenem, or sometimes both.
Types and impact of resistance
Reduced susceptibility to benzylpenicillin emerged in S. pneumoniae some decades ago and has continued to increase. This resistance can mostly be managed with increased dosing regimens of benzylpenicillin, or amoxicillin when oral treatment is appropriate. However, strains with reduced susceptibility causing meningitis are resistant to treatment with benzylpenicillin due to the relatively poor penetration of this antimicrobial into the subarachnoid space (where the infection is located). Meningitis caused by these strains
Chapter 4: Antimicrobial resistance 147
requires treatment with ceftriaxone (or cefotaxime), unless the strains also have reduced susceptibility to these agents.
Resistance to tetracycline predicts resistance to doxycycline, and is a feature of multidrug-resistant strains.
Key findings (Queensland)
Resistance to (benzyl)penicillin was low, but rates of resistance to macrolides (erythromycin), tetracycline and trimethoprim–sulfamethoxazole were all above 20% (Figure 4.38). Rates of resistance were somewhat lower for blood isolates than isolates from other specimens. There were no major differences in resistance rates in different clinical settings (Figure 4.39).
Resistance to (benzyl)penicillin was low, but rates of resistance to erythromycin, tetracycline and trimethoprim–sulfamethoxazole were all above 20%.
Figure 4.38Streptococcus pneumoniae resistance to individual agents used in treatment, 2014
ERY = erythromycin; PEN = benzylpenicillin; SXT = trimethoprim–sulfamethoxazole; TET = tetracycline Note: Benzylpenicillin resistance is defined as a minimum inhibitory concentration of >2 mg/L (infections other than
meningitis) (European Committee on Antimicrobial Susceptibility Testing). Sources:OrgTRx (Queensland); Sullivan Nicolaides Pathology (Queensland and northern New South Wales)
Data table: Figure 4.38
Agent Blood (n = 175), % resistant
Other (n = 2,291), % resistant
PEN 2.3 2.0
ERY 21.1 25.9
TET 21.1 25.6
SXT 21.1 29.9
Chapter 4: Antimicrobial resistance 148
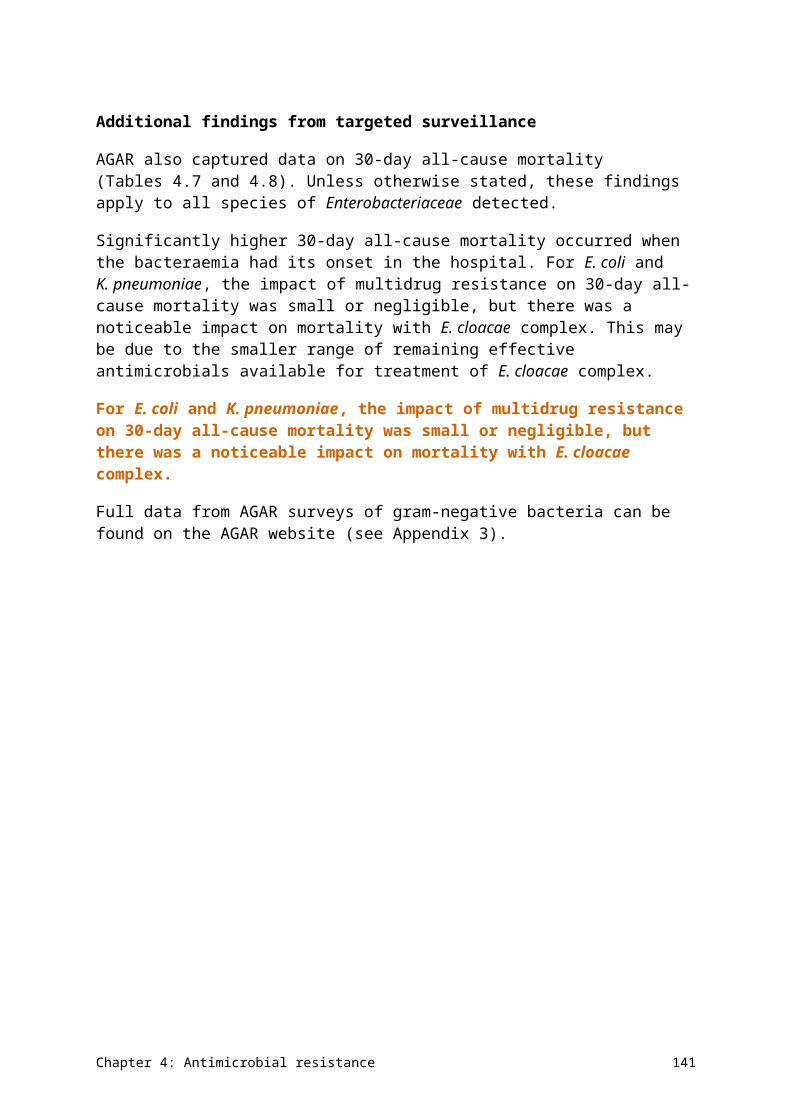
Figure 4.39Streptococcus pneumoniae resistance, by clinical setting, 2014
ERY = erythromycin; na = not available (either not tested or tested against an inadequate number of isolates); PEN = benzylpenicillin; SXT = trimethoprim–sulfamethoxazole; TET = tetracycline Note: Benzylpenicillin resistance is defined as a minimum inhibitory concentration of >2 mg/L (infections other than
meningitis) (European Committee on Antimicrobial Susceptibility Testing).Sources:OrgTRx (public hospitals and health services); Sullivan Nicolaides Pathology (private hospitals and community)
Data table: Figure 4.39
Agent Public hospitals and health services (n = 1,333), % resistant
Private hospitals (n = 131), % resistant
Community (n = 1,001), % resistant
Penicillin 2.6 3.1 1.3
Erythromycin 22.1 30.0 29.6
Tetracycline na 26.6 0.0
Trimethoprim-sulfamethoxazole
na 27.5 30.0
4.14 Streptococcus pyogenes
Health impact
S. pyogenes, also called group A Streptococcus, is an important human pathogen. It most commonly causes skin and soft tissue infections, and acute pharyngitis, but can cause serious and life-threating infections such as scarlet fever, septicaemia, bone and joint infections, toxic shock syndrome, necrotising fasciitis and pneumonia. This organism is also associated with two ‘poststreptococcal’ syndromes: acute glomerulonephritis and rheumatic fever. These syndromes are now rare in most parts of Australia, but are still seen frequently in remote Aboriginal and Torres Strait Islander communities, contributing to substantial long-term morbidity in these populations.
Chapter 4: Antimicrobial resistance 149
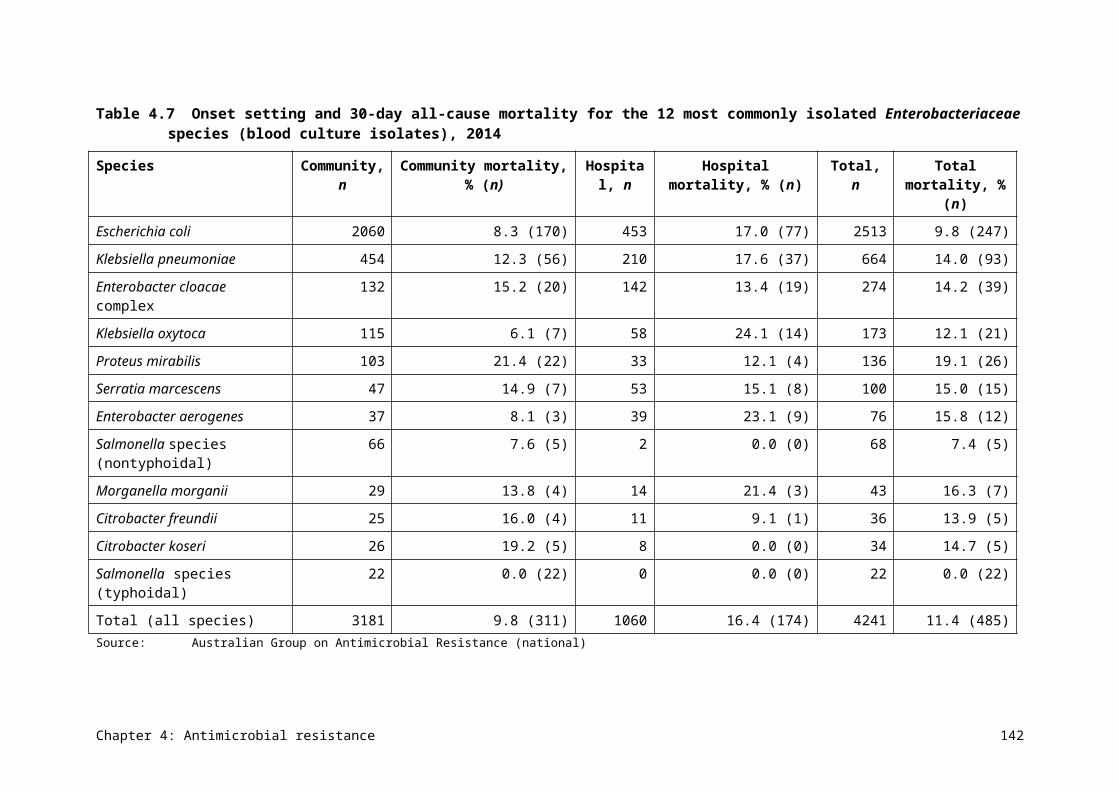
Treatment
Benzylpenicillin remains the treatment of choice for S. pyogenes infections. In patients who are allergic to penicillins, macrolides such as erythromycin and first-generation cephalosporins are treatment options. Although antimicrobial treatment is usually administered as part of the treatment for poststreptococcal syndromes, other non-antimicrobial treatments are the mainstay of management. Patients who have experienced one episode of acute rheumatic fever are prone to further episodes and worsening organ damage; as a consequence, they are administered long-term prophylaxis (usually over decades) with benzathine penicillin (intramuscularly) or phenoxymethylpenicillin (orally).
Types and impact of resistance
Confirmed resistance to benzylpenicillin has never been reported anywhere in the world in this species, but the consequences of its emergence would be substantial. It is expected that, based on observations of other members of the Streptococcus genus, resistance to benzylpenicillin would also affect susceptibility to first-generation cephalosporins. In contrast, acquired resistance to macrolide antimicrobials has been present in S. pyogenes for many years, with levels of resistance seeming to fluctuate in line with changes in circulating clones. First-generation cephalosporins are treatment options for penicillin-allergic patients who are infected with macrolide-resistant strains.
Key findings (Queensland)
Resistance to key antimicrobial agents is low, apart from tetracyclines, which are rarely used for treatment (Figure 4.40). Resistance to erythromycin (and therefore other macrolides) is low. There was some variation in macrolide resistance rates among clinical settings (Figure 4.41).
Resistance to key antimicrobial agents in S. pyogenes is low, apart from tetracyclines, which are rarely used for treatment.
Figure 4.40Streptococcus pyogenes resistance to individual agents, 2014
ERY = erythromycin; PEN = benzylpenicillin; SXT = trimethoprim–sulfamethoxazole; TET = tetracycline Sources:OrgTRx (Queensland); Sullivan Nicolaides Pathology (Queensland and northern New South Wales)
Chapter 4: Antimicrobial resistance 150
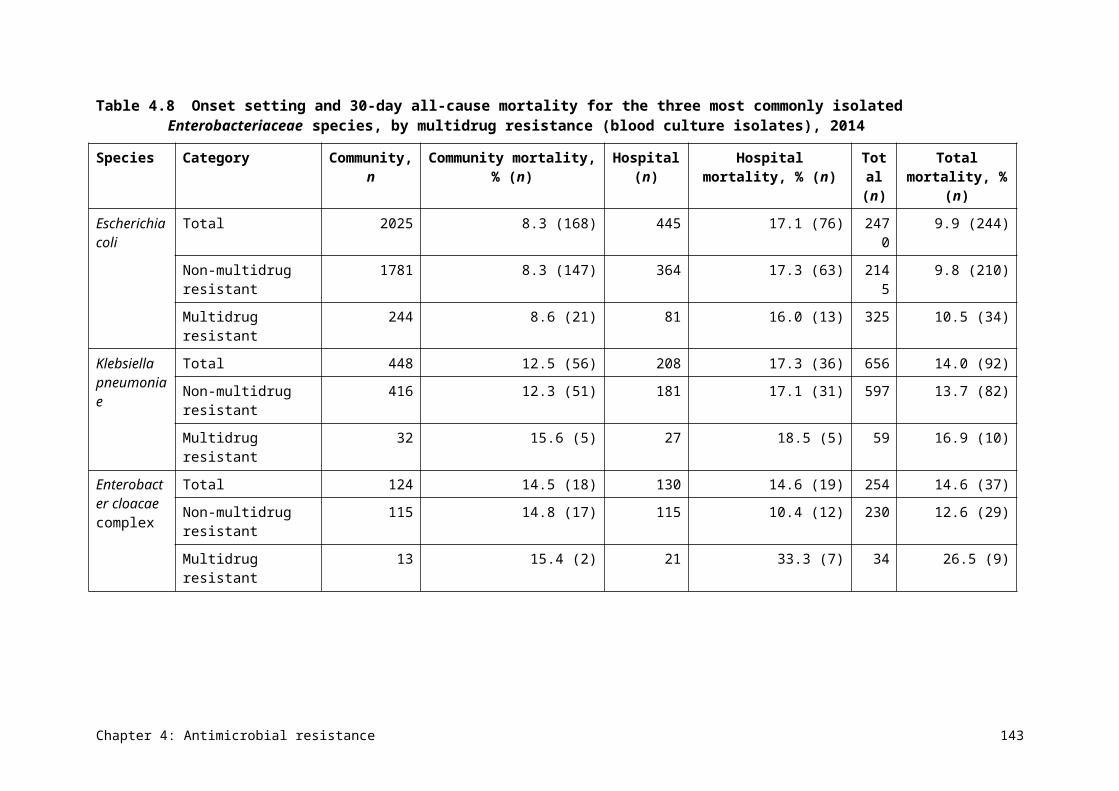
Figure 4.41Streptococcus pyogenes resistance, by clinical setting, 2014
ERY = erythromycin; na = not available (either not tested or tested against an inadequate number of isolates); PEN = benzylpenicillin; SXT = trimethoprim–sulfamethoxazole; TET = tetracycline Sources:OrgTRx (public hospitals and health services); Sullivan Nicolaides Pathology (private hospitals and community)
Data table: Figure 4.41
Agent Public hospitals and health services (n = 5,155), % resistant
Private hospitals (n = 102), % resistant
Community (n = 4,689), % resistant
PEN 0.0 0.0 0.0
ERY 2.3 7.0 4.4
TET na 14.9 na
SXT na 4.1 1.1
Chapter 4: Antimicrobial resistance 151
Chapter 5 International comparisons
Key messages
• Antimicrobial use (AU) in the Australian community is higher than in many other countries.
• AU in Australian hospitals can appear high or low in comparison with other countries, depending on the measure used. These differences may reflect different healthcare practices (for example, hospital care versus community care) in different countries.
• Rates of antimicrobial resistance (AMR) in gram-negative organisms (Escherichia coli and Klebsiella pneumoniae) in Australia are lower than in other countries, but rates of AMR in gram-positive organisms (Staphylococcus aureus and Enterococcus faecium) are high to very high.
• Australia has low rates of resistance to fluoroquinolones compared with other countries, reflecting the restricted use of this antimicrobial class in Australia.
Many countries, particularly in Europe, have established systems for reporting country-wide data on AU and AMR. This first national report on AU and AMR in Australia allows us to make comparisons between Australia and other countries. Such comparisons provide a benchmark that can help to inform practices in Australia.
5.1 Antimicrobial use
Data is available for comparison from a range of countries, including England, Scotland, Canada, the United States, Sweden, Denmark, the Netherlands and Norway. There is also a Europe-wide program, European Surveillance of Antimicrobial Consumption Network (ESAC-Net), which publishes annual data from 28 European countries. Each country has chosen to report using specific, and often different, measures. The most widely used, and the one preferred by ESAC-Net, is defined daily doses (DDDs) per 1000 inhabitants per day. Some countries also report data on the number of dispensed prescriptions per 100 or 1000 inhabitants; this is the only information available from the United States.
Many contributing countries are able to capture all, or almost all, of the prescribing data to generate these statistics. Where data is not available, sophisticated algorithms have been developed to extrapolate from large samples. Nevertheless, factors in individual countries make the comparisons indicative rather than absolute. In Australia, data on private prescriptions is not captured; in 2011, private prescriptions were estimated to contribute an additional 5% to antimicrobial use (AU).
A notable variation between countries is whether they report on the ‘antimicrobial’ methenamine (called hexamine hippurate in Australia). This is not a true antimicrobial agent, but a prophylactic agent used for recurrent urinary tract infections. Many countries choose to omit this agent, even though it is classed as a systemic antimicrobial (J01 class) under the Anatomical Therapeutic Chemical (ATC) system and has a DDD. In some countries, it can account for 5% of all prescribing. Methenamine is included in the Australian statistics. Australia also reports data on topical AU in the community, but all of the following comparisons are for agents in the J01 ATC class.
Chapter 5: International comparisons 152
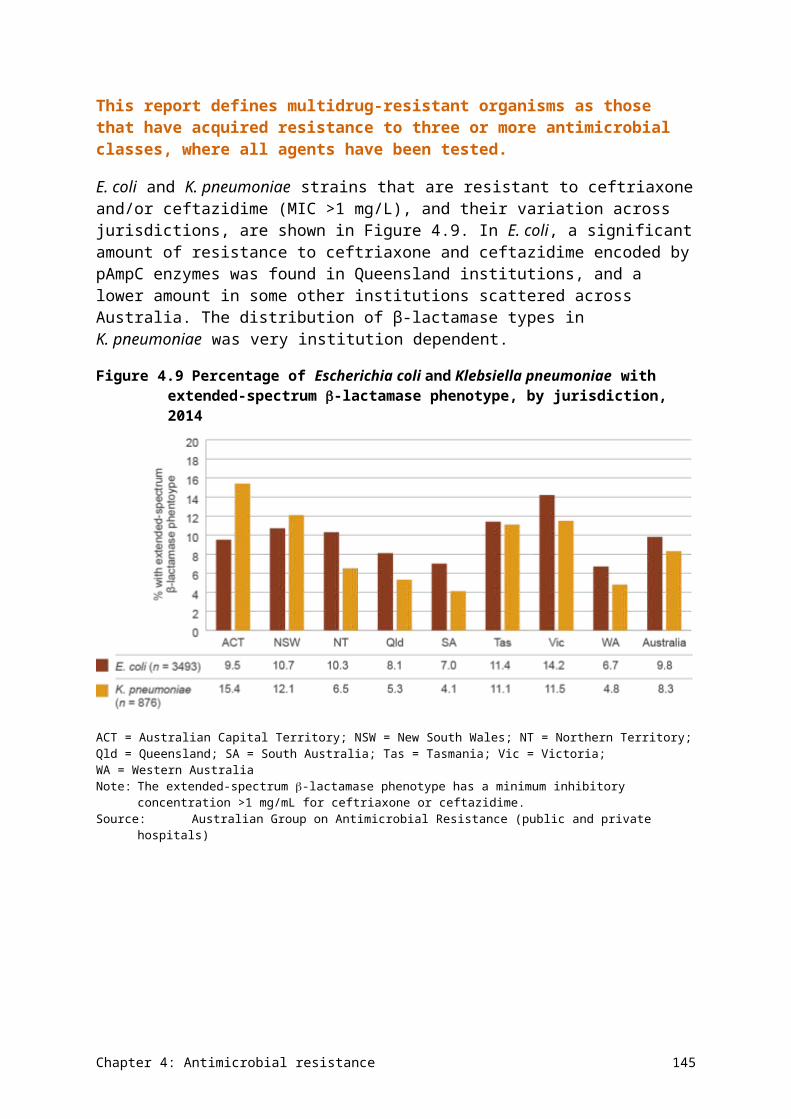
Community use
AU is higher in the Australian community than in many other countries. Figure 5.1 highlights the comparison with European countries based on DDD/1000 inhabitants/day – Australia ranks between the fifth and sixth highest in this group.
AU is higher in the Australian community than in many other countries.
Figure 5.1 Comparison of community antimicrobial use in Australia and 28 European countries, 2014
Sources:Pharmaceutical Benefits Scheme (Australia); European Surveillance of Antimicrobial Consumption Network (Europe)
Figure 5.2 shows a more detailed comparison with four northern European countries, England and Canada. These countries have been selected because they have readily accessible and comparable data. AU in the community in Australia is higher than in any of these countries.
Chapter 5: International comparisons 153
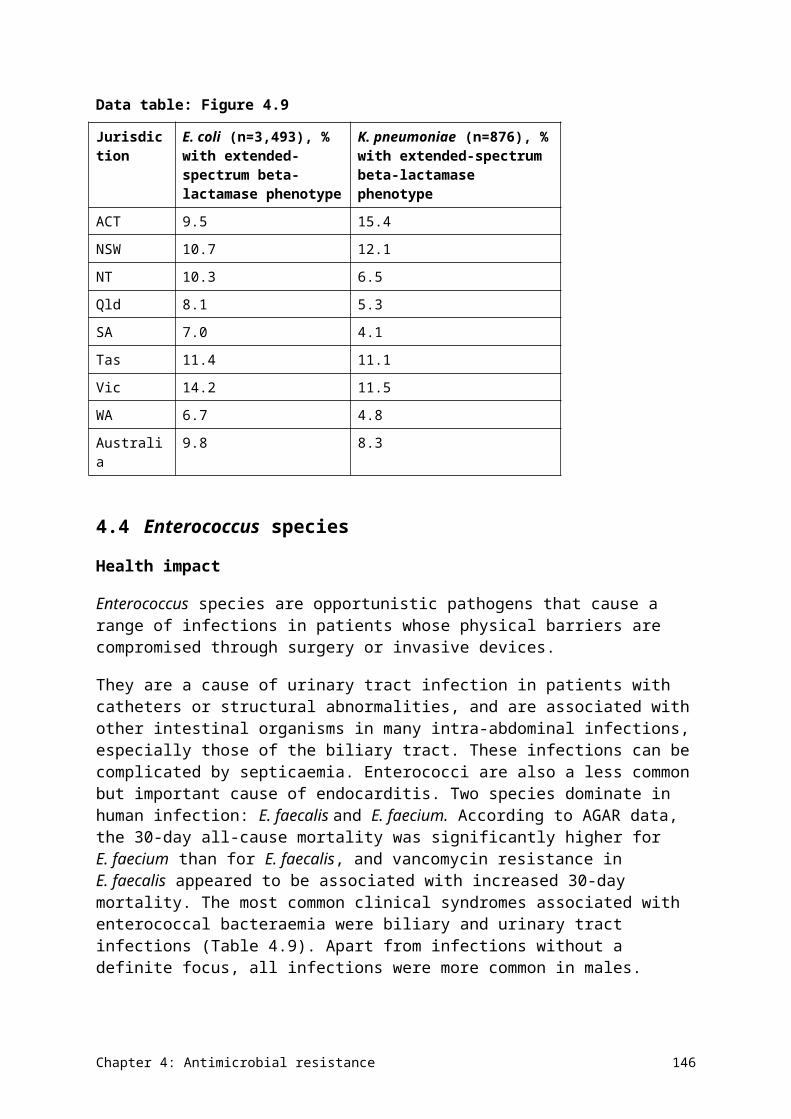
Figure 5.2 Comparison of community antimicrobial use in Australia and other similar countries
Sources: Pharmaceutical Benefits Scheme (Australia); CIPARS (Canada); DANMAP (Denmark); ESPAUR (England); NethMAP (Netherlands); SWEDRES (Sweden)
Figure 5.3 compares the volume of prescriptions with one northern European country, two parts of the United Kingdom, Canada and the United States. When controlled for population, Australia’s AU is higher than all of these countries.
Chapter 5: International comparisons 154
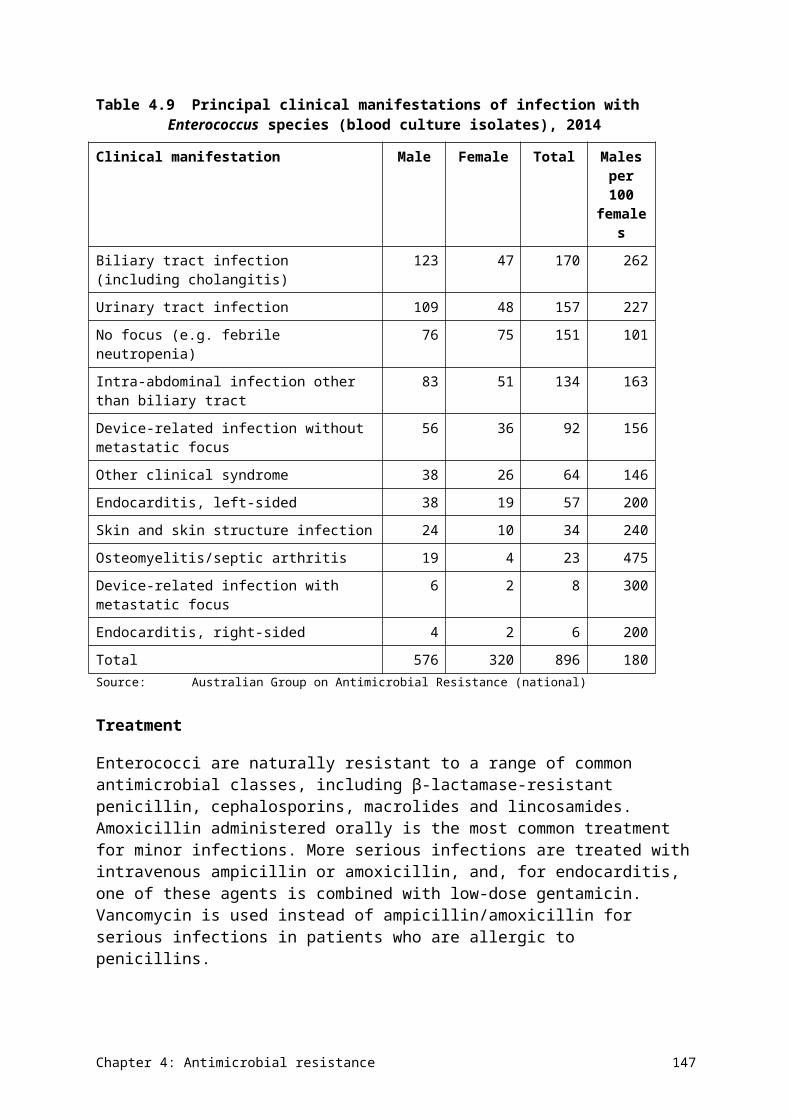
Figure 5.3 Comparison of community antimicrobial use in Australia and other countries
Sources:Pharmaceutical Benefits Scheme (Australia); CIPARS (Canada); ESPAUR (England); SAPG (Scotland); SWEDRES (Sweden); NARMS (United States)
Notable differences also exist between Australia and other countries in the patterns of AU in the community (Figure 5.4). Compared with Scandinavian countries, Australia uses fewer narrow-spectrum penicillins (β-lactamase-sensitive penicillins; ATC class J01CE) and a far greater proportion of β-lactamase inhibitor combinations and cephalosporins. The Netherlands is similar to Scandinavia, apart from having similar use of β-lactamase inhibitor combinations to Australia. Australia uses far fewer fluoroquinolones than comparator countries – this stems from the conservative restrictions placed on their prescription under the Pharmaceutical Benefits Scheme (PBS) and the Repatriation Pharmaceutical Benefits Scheme (RPBS) in the 1990s. With the exception of fluoroquinolones, patterns of use in Australia are closer to those of Canada. Use of tetracyclines varies widely from country to country.
Australia uses far fewer fluoroquinolones than comparator countries – this stems from the conservative restrictions placed on their prescription under the PBS and the RPBS in the 1990s.
Chapter 5: International comparisons 155
Figure 5.4 Patterns of use of antimicrobial classes in Australia and other countries
DDD = defined daily doseSources:Pharmaceutical Benefits Scheme (Australia); CIPARS (Canada); DANMAP (Denmark); NethMAP (Netherlands);
NORM (Norway); SWEDRES (Sweden)
Hospital use
Data on AU in hospitals in 2013 or 2014 is available from the Netherlands, Norway, Sweden, Denmark, England and Scotland. All these countries have close to 100% data capture and very dominant to near-universal care in public hospitals. Data is also available from Canada in 2011, also with high capture (only 3 of 13 provinces and territories are excluded).
In Australia, the national coverage of the National Antimicrobial Utilisation Surveillance Program (NAUSP) was estimated using actual DDDs and occupied-bed days (OBDs) from all contributors for 2014, and the actual number of patient days and separations. Coverage was estimated at 57.4% capture of the national DDDs and OBDs. These estimates allowed comparison of Australian hospital AU data on a range of measures reported by other countries.
Two measures of comparison (DDD/1000 OBD and DDD/1000 inhabitants/day) are presented in Figure 5.5. For some countries, neither measure was available. The former statistic is more widely used for intercountry comparisons. The latter statistic allows comparison between use in hospitals and the community in each country.
Chapter 5: International comparisons 156
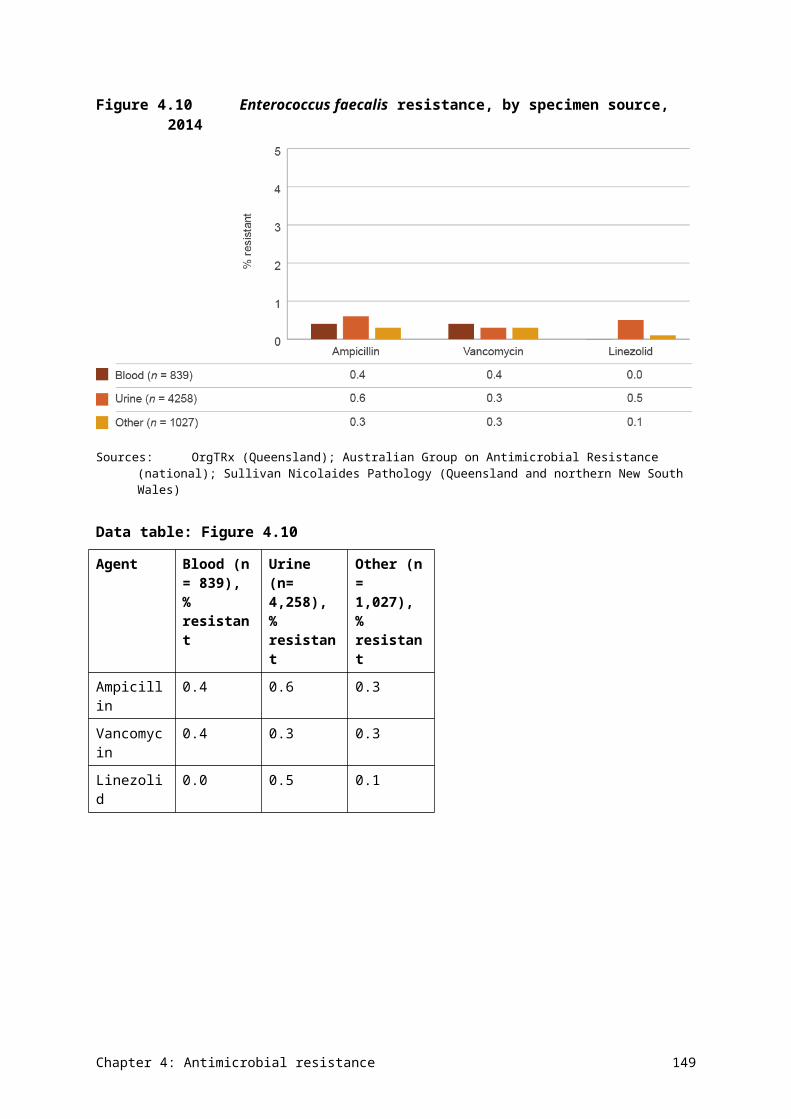
Figure 5.5 Antimicrobial use by (A) occupied-bed days and (B) inhabitants in Australian hospitals and other countries
A
B
Sources:National Antimicrobial Utilisation Surveillance Program (Australia); CIPARS (Canada); DANMAP (Denmark); ESPAUR (England); NethMAP (Netherlands); SAPG (Scotland); NORM (Norway); SWEDRES (Sweden)
Chapter 5: International comparisons 157
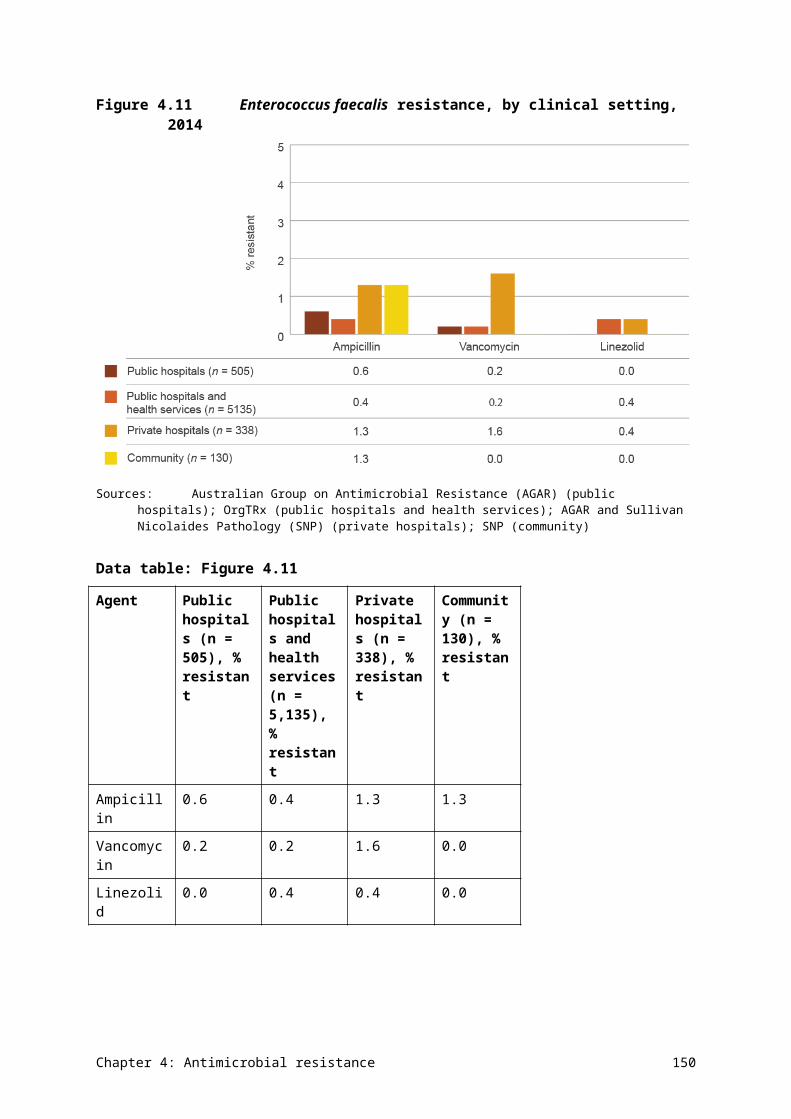
There are some caveats to interpretation of the data; therefore, any comparisons made here should be considered indicative rather than absolute. Importantly, hospital AU in Australia was extrapolated on an OBD basis from the NAUSP 2014 data set, which covered 57% of the national OBD data. Nearly all comparator countries had at least 90% data capture. There were also variable exclusions in each country, such as psychiatric and rehabilitation ‘hospitals’.
On an OBD basis, Australia’s hospital AU:
• exceeded that of Sweden and the Netherlands
• was similar to that in Denmark
• was significantly lower than in England.
However, on a population basis, Australia’s AU was higher than that of the Netherlands, Norway, Sweden, Canada and Denmark, but lower than that of England and Scotland. Hospital use comprised approximately 11% of total AU in Australia, compared with a range of 8% in Canada, Norway and the Netherlands to 12% in Denmark.
5.2 Antimicrobial resistance
Comparisons can be made between rates of resistance in Australia and other countries for a selected number of priority organisms and antimicrobials. The selection is mandated by the availability of representative and comparable national data from national or regional surveillance programs, and data for 2014 or 2013 (but not earlier). Directly comparable data was available from the Australian Group on Antimicrobial Resistance programs in Australia, the European antimicrobial resistance surveillance system (EARS-Net) and a single publication from the United States. All of these sources provided resistance data on isolates from blood and/or cerebrospinal fluid.
Escherichia coli
Figures 5.6–5.8 compare resistance rates in invasive isolates of Escherichia coli from Australia and Europe to fluoroquinolones and third-generation cephalosporins, and combined resistance to fluoroquinolones, third-generation cephalosporins and aminoglycosides.
Chapter 5: International comparisons 158
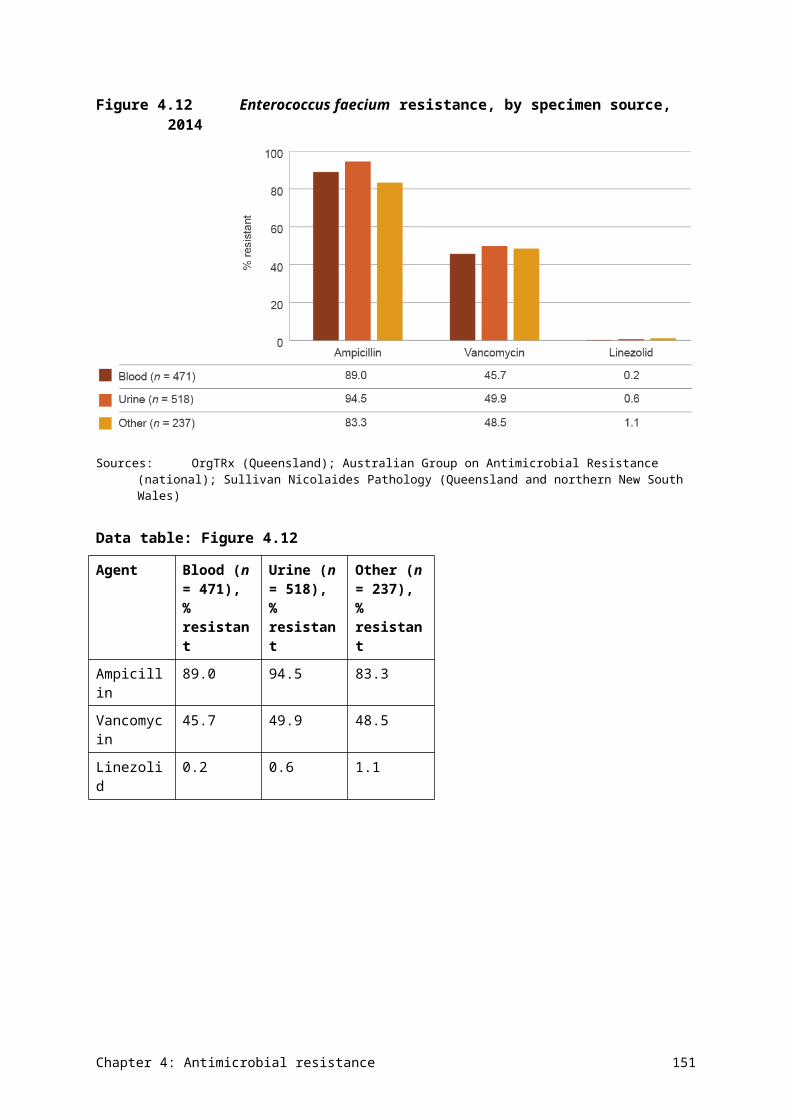
Figure 5.6 Resistance to fluoroquinolones in invasive isolates of Escherichia coli in Australia and European countries, 2014
Note: In Australia, ciprofloxacin resistance is used to represent resistance to the fluoroquinolone class.Sources:Australian Group on Antimicrobial Resistance, 2014; EARS-Net, 2014 (Polish data is from 2013)
Rates of resistance to fluoroquinolones in Australia are very low. This can be attributed to the restricted access to fluoroquinolones in Australia, on a background of high use of other antimicrobials.
Chapter 5: International comparisons 159
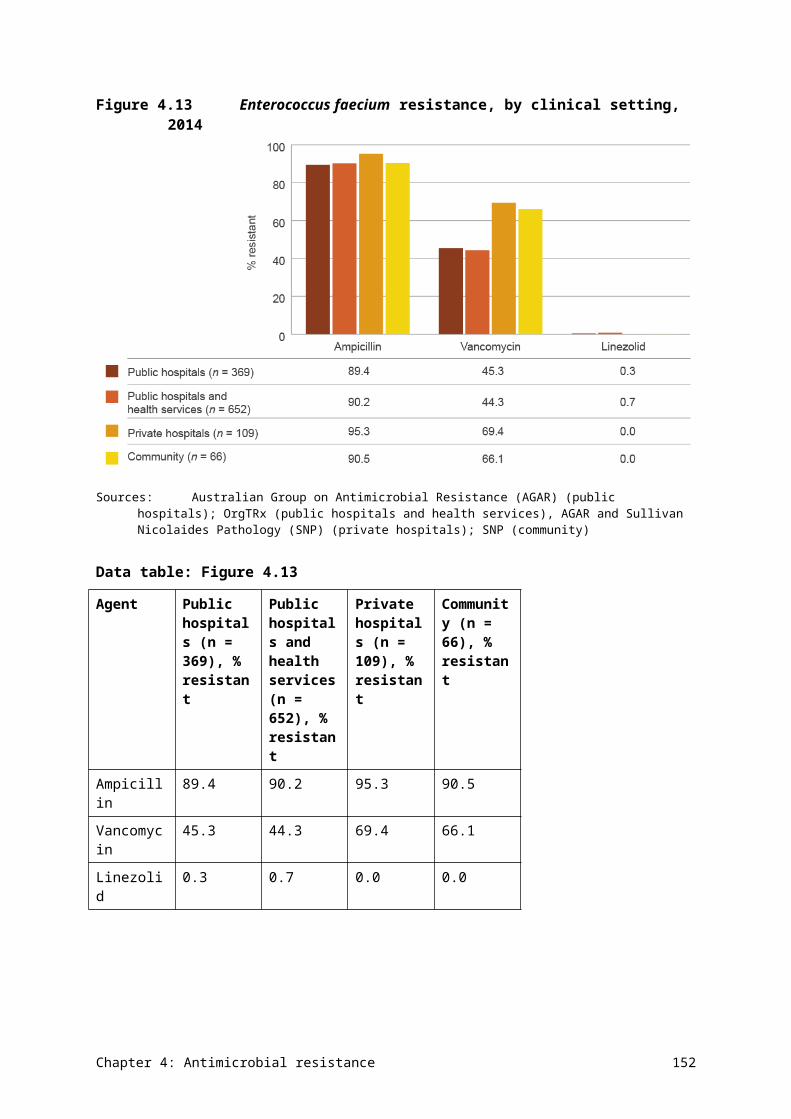
Resistance to third-generation cephalosporins is also comparatively low in Australia. In part, this may be attributed to the high frequency with which resistance to third-generation cephalosporins (~50%) is linked to fluoroquinolone resistance (~50%). In keeping with the findings for these two antimicrobial classes, rates of combined resistance to fluoroquinolones, third-generation cephalosporins and aminoglycosides are also comparatively low.
Figure 5.7 Resistance to third-generation cephalosporins in invasive isolates of Escherichia coli in Australia and European countries, 2014
Note: In Australia, ceftriaxone resistance is used to represent resistance to the cephalosporin class.Sources:Australian Group on Antimicrobial Resistance, 2014; EARS-Net, 2014 (Polish data is from 2013)
Chapter 5: International comparisons 160
Figure 5.8 Combined resistance to fluoroquinolones, third-generation cephalosporins and aminoglycosides in invasive isolates of Escherichia coli in Australia and European countries, 2014
Note: In Australia, ciprofloxacin resistance (fluoroquinolones), ceftriaxone resistance (cephalosporins) and gentamicin resistance (aminoglycosides) are used to represent resistance to their respective classes.
Sources:Australian Group on Antimicrobial Resistance, 2014; EARS-Net 2014 (Polish data is from 2013)
Chapter 5: International comparisons 161
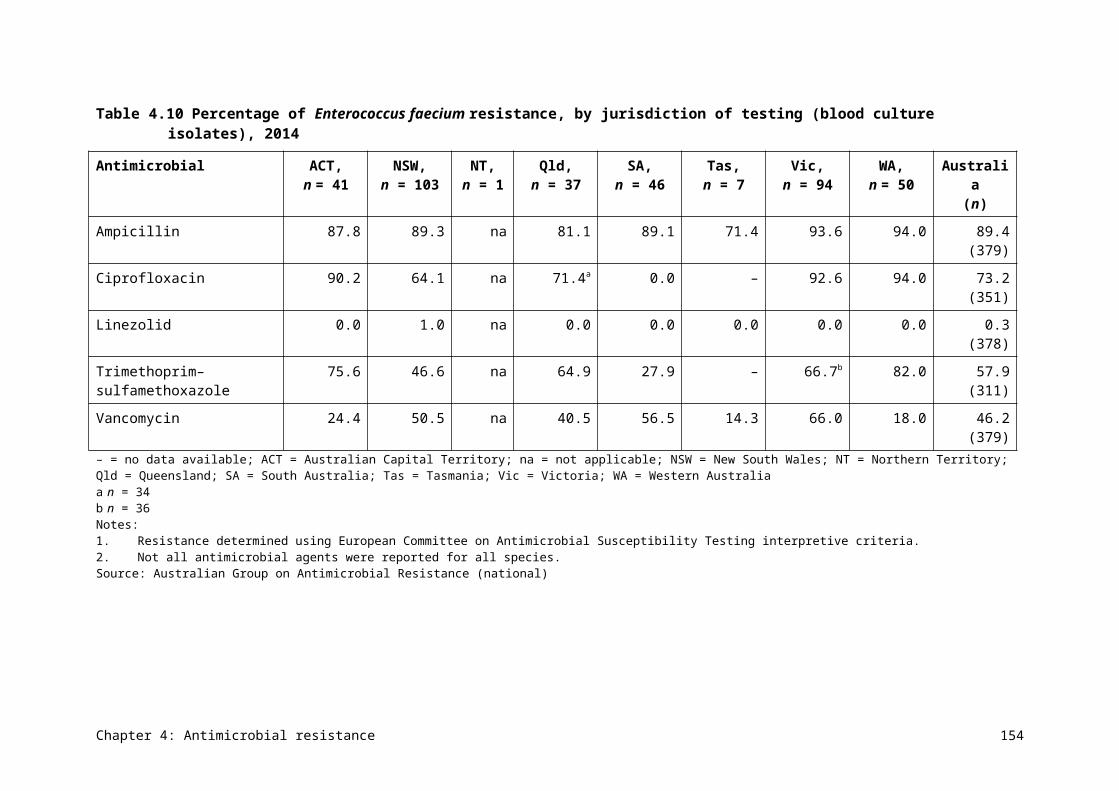
Klebsiella pneumoniae
The comparative rates of resistance in Klebsiella pneumoniae are similar to those for E. coli. Figures 5.9–5.11 compare resistance rates in invasive isolates from Australia and Europe to fluoroquinolones and third-generation cephalosporins, and combined resistance to fluoroquinolones, third-generation cephalosporins and aminoglycosides.
Figure 5.9 Resistance to fluoroquinolones in invasive isolates of Klebsiella pneumoniae in Australia and European countries, 2014
Note: In Australia, ciprofloxacin resistance is used to represent resistance to the fluoroquinolone class.Sources:Australian Group on Antimicrobial Resistance, 2014; EARS-Net, 2014 (Polish data is from 2013)
Chapter 5: International comparisons 162
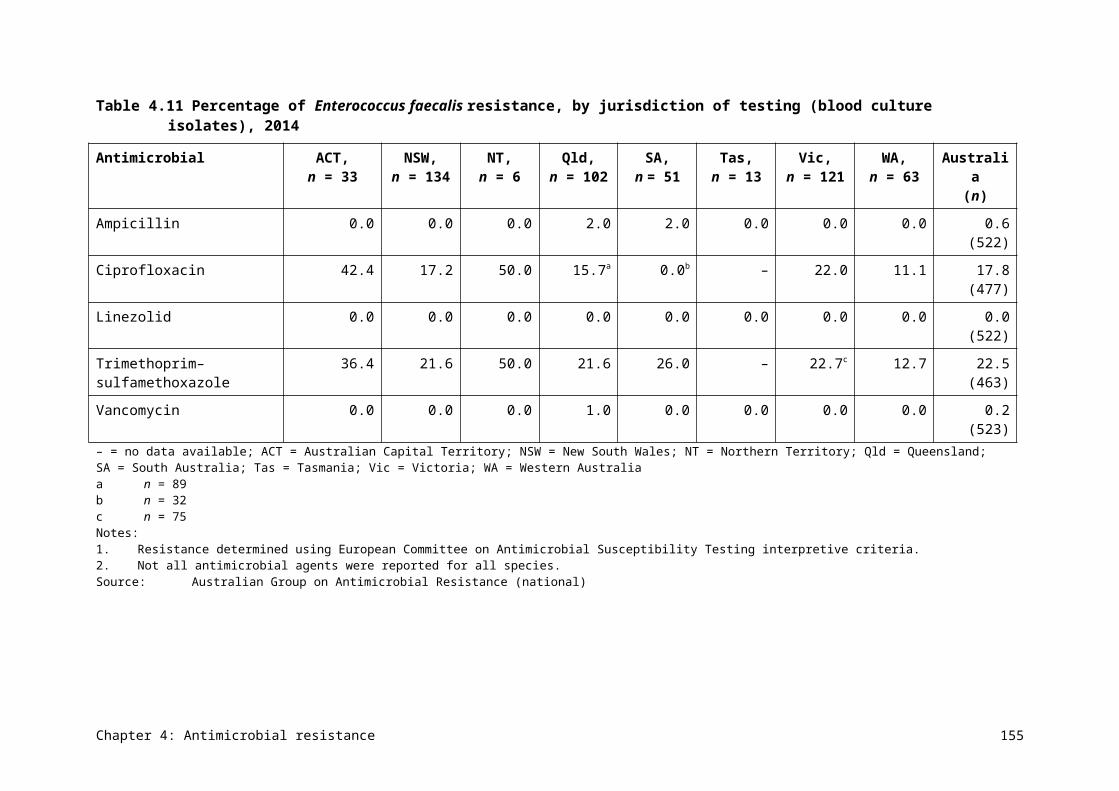
Figure 5.10Resistance to third-generation cephalosporins in invasive isolates of Klebsiella pneumoniae in Australia and European countries, 2014
Notes: In Australia, ceftriaxone resistance is used to represent resistance to the cephalosporin class.Sources:Australian Group on Antimicrobial Resistance, 2014; EARS-Net, 2014 (Polish data is from 2013)
Chapter 5: International comparisons 163
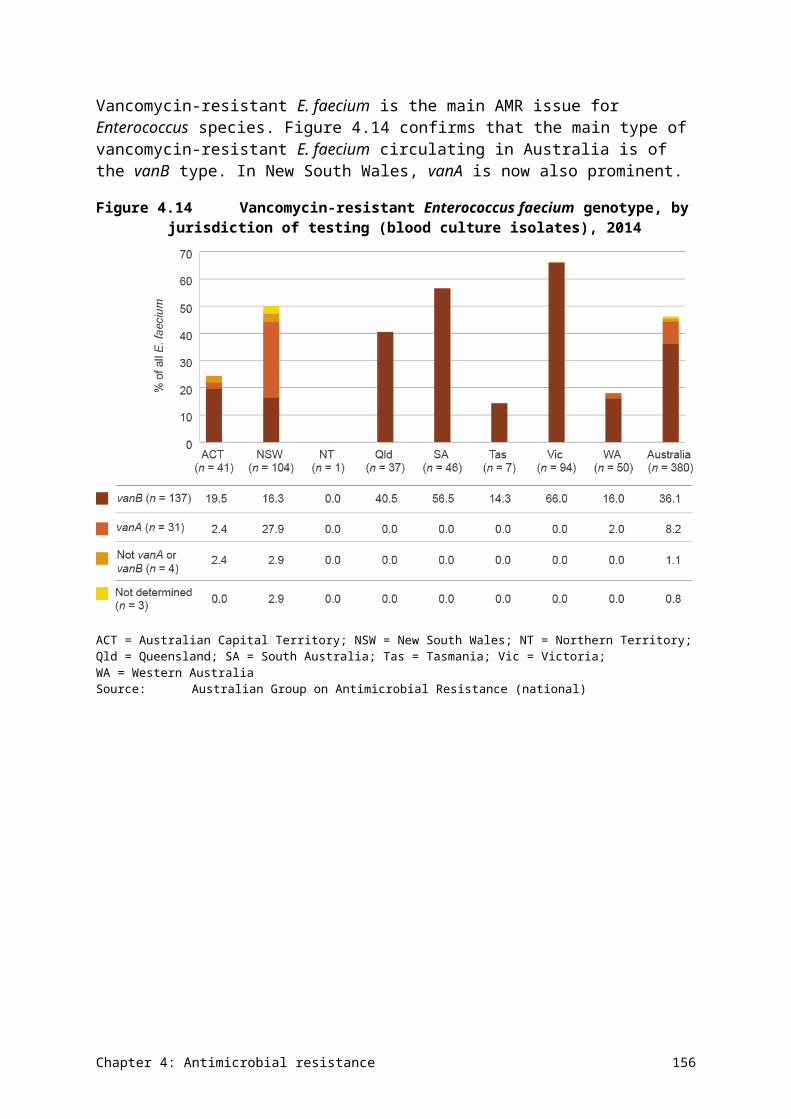
Figure 5.11Combined resistance to fluoroquinolones, third-generation cephalosporins and aminoglycosides in invasive isolates of Klebsiella pneumoniae in Australia and European countries, 2014
Note: In Australia, ciprofloxacin resistance (fluoroquinolones), ceftriaxone resistance (cephalosporins) and gentamicin resistance (aminoglycosides) are used to represent resistance to their respective classes.
Sources:Australian Group on Antimicrobial Resistance, 2014; EARS-Net, 2014 (Polish data is from 2013)
Chapter 5: International comparisons 164
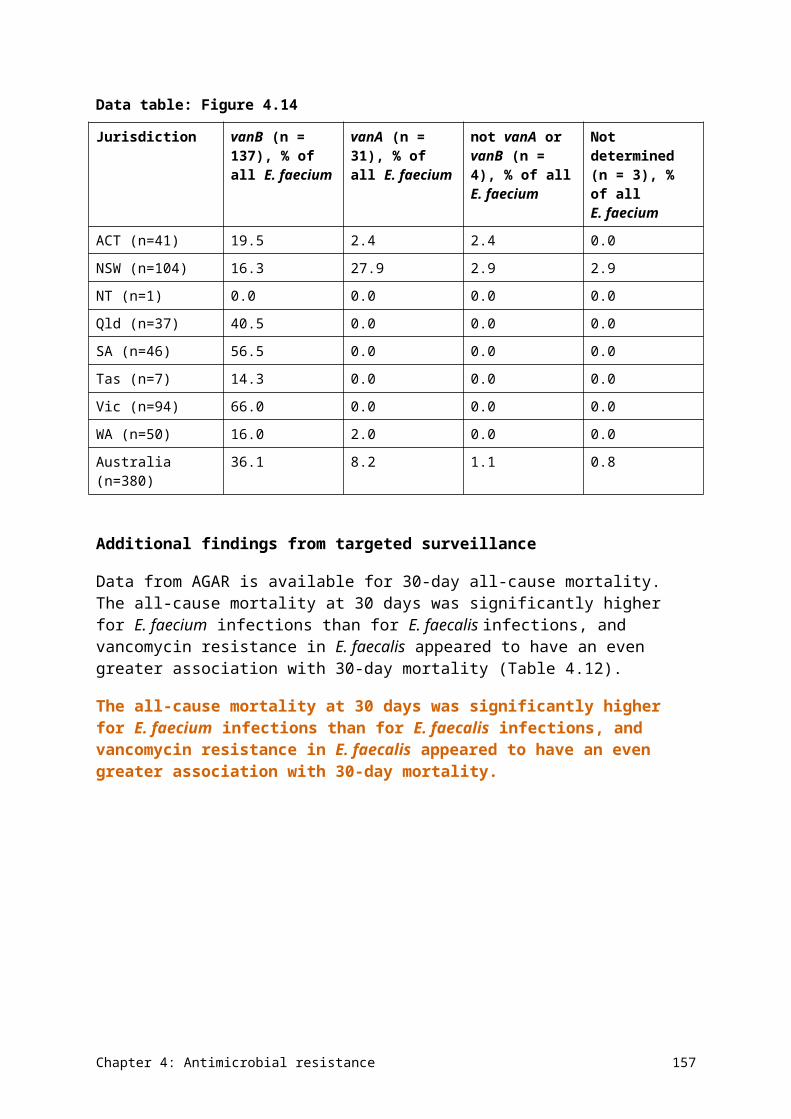
Staphylococcus aureus and Enterococcus faecium
In contrast to the gram-negative pathogens discussed above, comparative rates of resistance to methicillin in Staphylococcus aureus and to vancomycin in Enterococcus faecium are high to very high in Australia compared with other countries (Figures 5.12 and 5.13). Resistance rates to vancomycin for E. faecium exceed those of any of the European countries contributing to EARS-Net. The reasons for the major difference between comparative rates of resistance in gram-positive bacteria and gram-negative bacteria in Australia are not clear, but it is likely that the drivers for these types of resistance are different. For instance, an analysis of AU in hospitals and hospital-onset enterococcal bacteraemia rates showed that, while certain antimicrobials were associated with enterococcal bacteraemia, other factors such as casemix and infection control practices played a strong role in driving rates of hospital-onset bacteraemia.
Rates of resistance to methicillin in Staphylococcus aureus and to vancomycin in Enterococcus faecium are high to very high in Australia compared with other countries.
Chapter 5: International comparisons 165
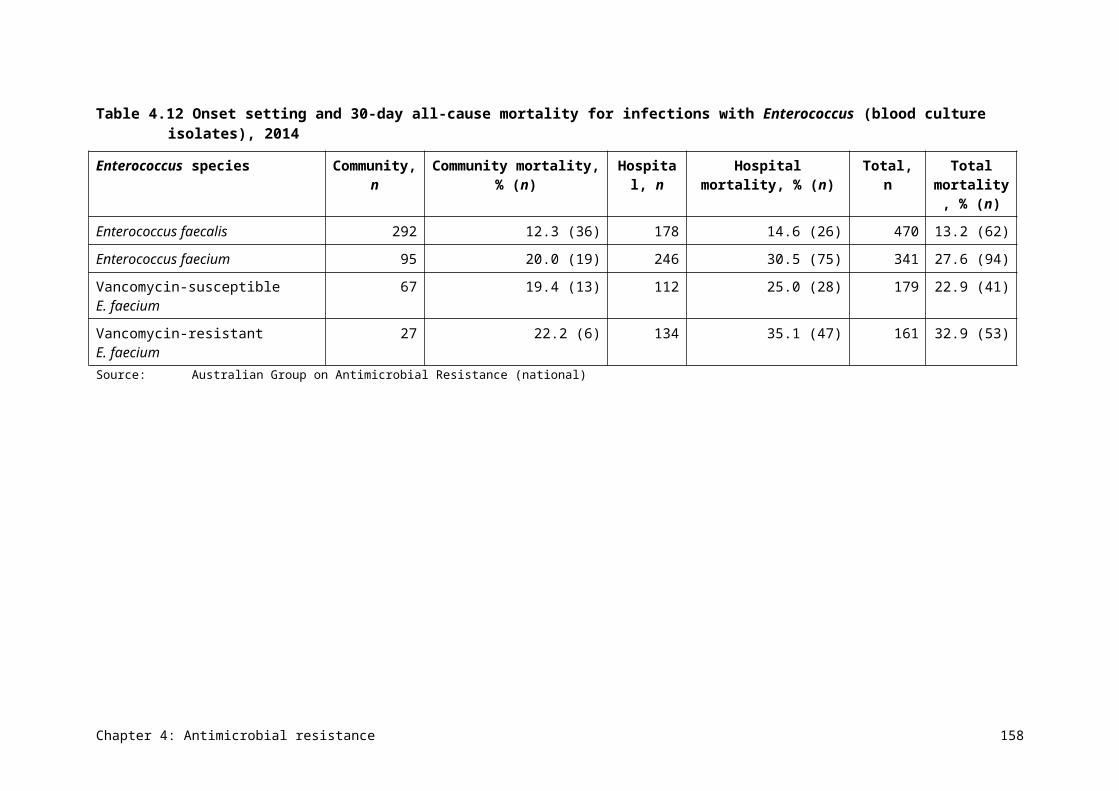
Figure 5.12Methicillin resistance in Staphylococcus aureus in Australia, European countries and the United States, 2014
Sources:Australian Group on Antimicrobial Resistance, 2014; EARS-Net, 2014 (Polish data is from 2013); Sader et al.62
Chapter 5: International comparisons 166
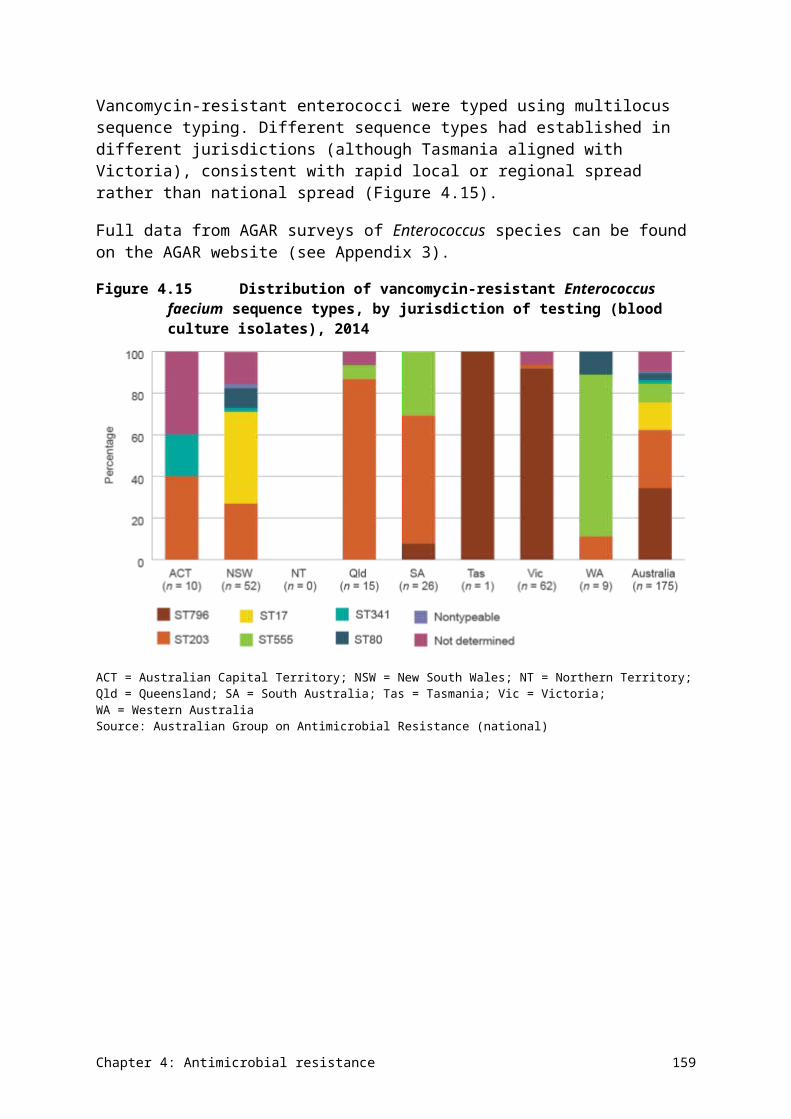
Figure 5.13Vancomycin resistance in Enterococcus faecium in Australia and European countries, 2014
Sources:Australian Group on Antimicrobial Resistance, 2014; EARS-Net, 2014 (Polish data is from 2013)
5.3 Commentary
Australia has high rates of AU in both hospitals and the community, but our rates of antimicrobial resistance (at least for gram-negative organisms) are low compared with European countries and the United States. For hospital use, Australia can rank well or poorly compared with other countries, depending on which measure is used. The reasons for these
Chapter 5: International comparisons 167
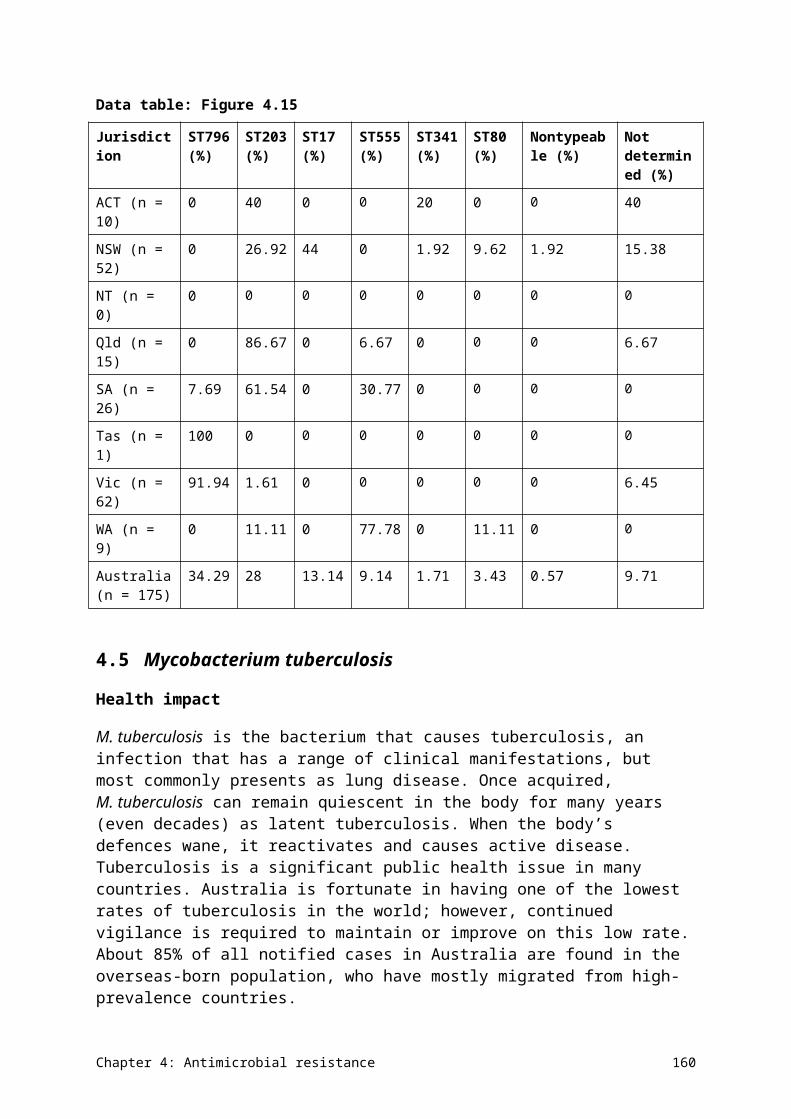
differences are unclear at present. Improving coverage of NAUSP to include more hospitals will help to provide a more accurate picture of AU and antimicrobial resistance in Australian hospitals.
Restrictions on fluoroquinolone use in Australia mean that the use of this class of antimicrobials is lower than in many other countries. These restrictions may also contribute to the low rates of resistance to this class seen in Australia compared with other countries.
Chapter 5: International comparisons 168
Chapter 6 Emerging issues
Key messages
• Data indicates that carbapenems – the last-line antimicrobials for infections with multidrug-resistant Enterobacteriaceae, Escherichia coli and Klebsiella species – are being used suboptimally in Australian hospitals. Continued monitoring and revision of prescribing practices are needed to reduce inappropriate use.
• Carbapenemase-producing organisms are present in Australia at low levels, but are widely disseminated across the country in humans, animals and the environment. These organisms have high epidemic potential, and healthcare services and microbiology laboratories need to be vigilant in detecting and responding to them. The Australian Commission on Safety and Quality in Health Care is developing a national alert system to provide assistance for the early identification and spread of these types of organisms.
• Surgical prophylaxis is a key area of inappropriate antimicrobial use. The Surgical National Antimicrobial Prescribing Survey (sNAPS) was piloted in 2015, and identified high levels of inappropriate use in both perioperative and postoperative management. Further work is under way to address these issues.
This chapter explores some key issues for antimicrobial use and antimicrobial resistance that highlight the importance of surveillance and the action that may be required. The organisms and antimicrobials identified in this section are regarded as currently posing a risk to human health, or likely to pose a risk in the near future.
6.1 Carbapenem use in Australian hospitals
Carbapenems are the last-line treatment for serious infections caused by multidrug-resistant Escherichia coli, Klebsiella species and other Enterobacteriaceae. It is important that carbapenem use in hospitals is minimised and reserved for treatment of serious gram-negative infections in cases where other antimicrobials are not effective or appropriate.
Hospitals that contribute data to the National Antimicrobial Utilisation Surveillance Program (NAUSP) show wide variation in the use of carbapenems, indicating the possibility of suboptimal use in some settings. Individual hospital carbapenem use, expressed as defined daily doses per 1000 occupied-bed days, is presented in Figures 6.1–6.3. Among the principal referral hospitals, there is a six-fold difference between the highest and lowest carbapenem users (excluding the lowest outlier). Similar variations are seen in the other hospital peer groups, although their overall usage rates are much lower.
Chapter 6: Emerging issues 169
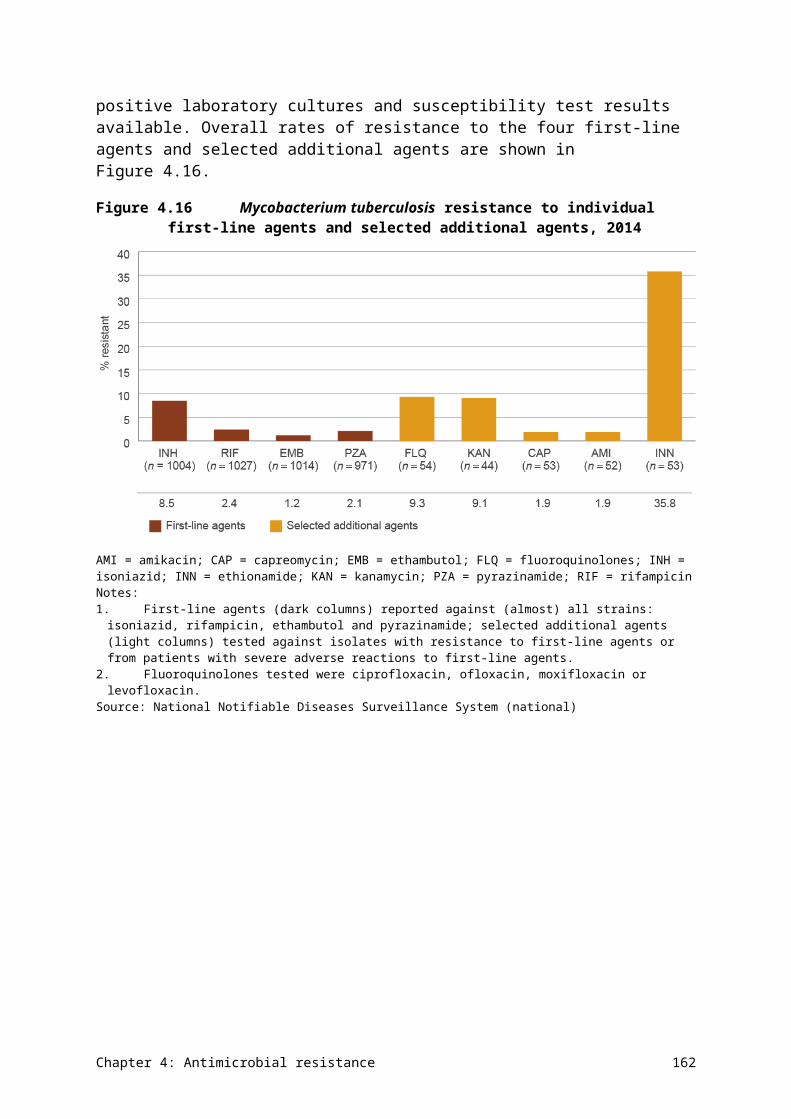
Figure 6.1 Carbapenem use in principal referral hospitals, 2014–15
DDD/1000 OBD = defined daily doses per 1000 occupied-bed daysSource: National Antimicrobial Utilisation Surveillance Program
Chapter 6: Emerging issues 170
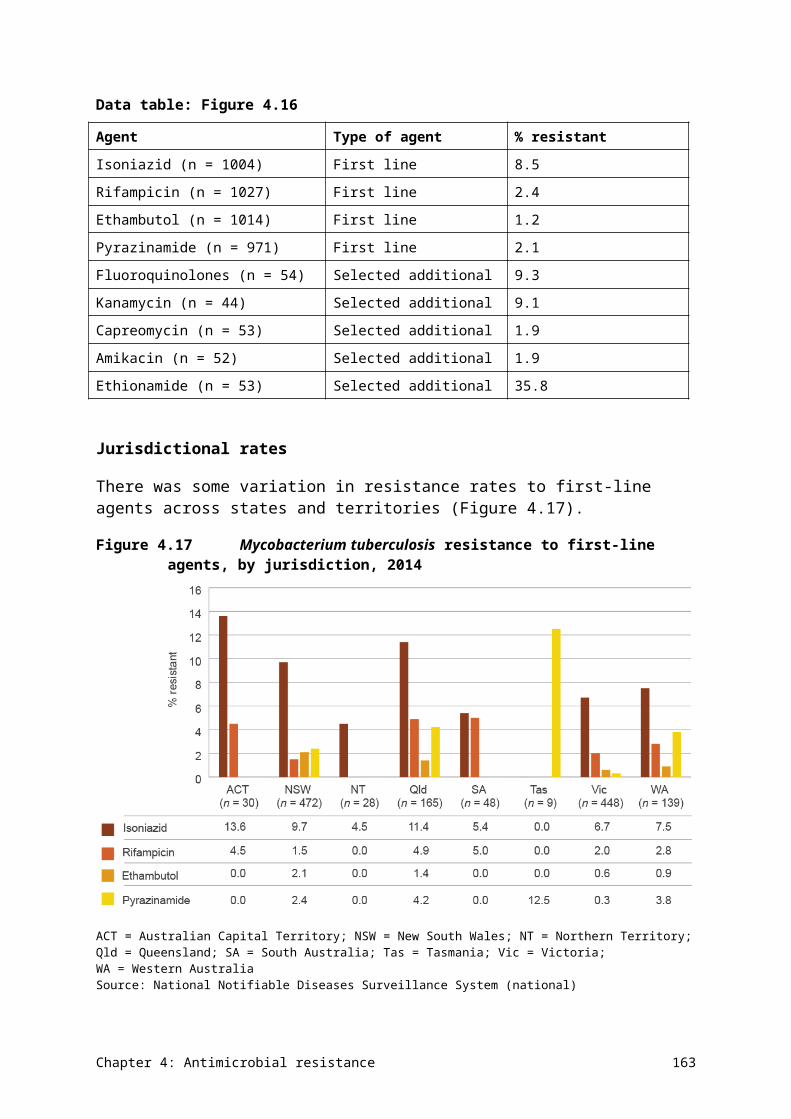
Figure 6.2 Carbapenem use in large public acute hospitals, 2014–15
DDD/1000 OBD = defined daily doses per 1000 occupied-bed daysSource: National Antimicrobial Utilisation Surveillance Program
Chapter 6: Emerging issues 171
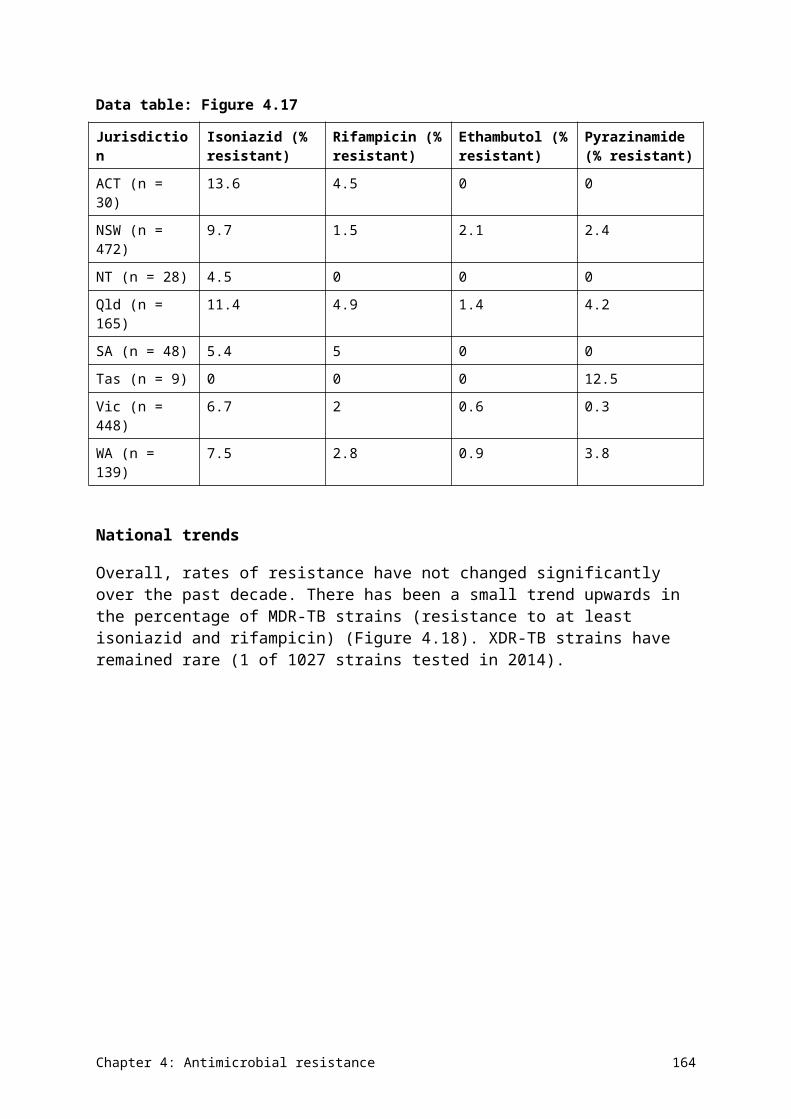
Figure 6.3 Carbapenem use in medium public acute hospitals, 2014–15
DDD/1000 OBD = defined daily doses per 1000 occupied-bed daysSource: National Antimicrobial Utilisation Surveillance Program
If carbapenems are being used optimally – that is, to treat infections caused by organisms that produce extended-spectrum -lactamases (ESBLs) – there should be a positive relationship between carbapenem use and the rate of isolation of ESBL-producing strains. This was analysed in data from a subset of 23 hospitals that participated in NAUSP and the Australian Group on Antimicrobial Resistance in 2014. Figure 6.4 shows that there was no relationship between the amount of meropenem supplied and the rates of ESBL-producing strains isolated in these hospitals. This means there is probably suboptimal use in some hospitals.
Chapter 6: Emerging issues 172
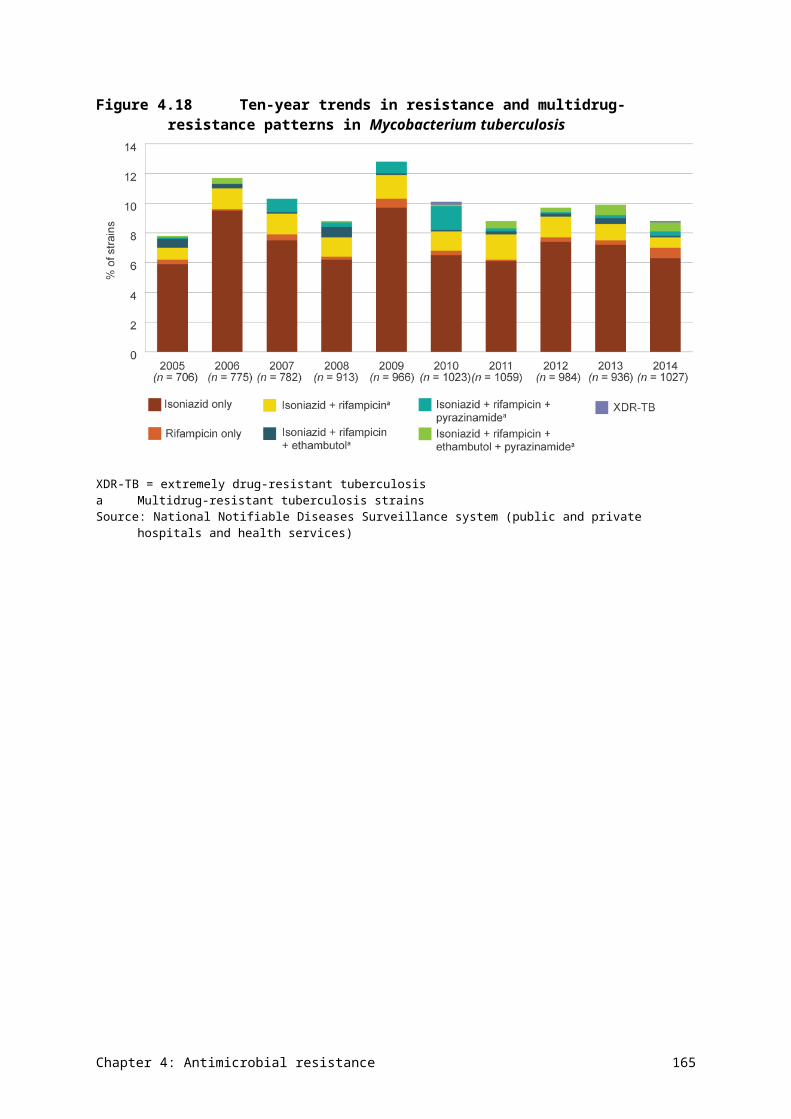
Figure 6.4 Meropenem supplied versus extended-spectrum β-lactamase-producing strains isolated in hospitals, 2014
DDD/1000 OBD = defined daily doses per 1000 occupied-bed days; ESBL = extended-spectrum β-lactamaseSource: National Antimicrobial Utilisation Surveillance Program
Current guidelines
The Australian Commission on Safety and Quality in Health Care (the Commission) has published an information sheet for clinicians on carbapenemase-producing Enterobacteriaceae (CPE).63 The information sheet outlines measures that should be taken to minimise overall antimicrobial use (AU) and optimise use of key gram-negative antimicrobials, such as carbapenems. The measures include:
• ensuring that AU is consistent with Therapeutic guidelines: antibiotic,20 taking into consideration local susceptibility information
• monitoring the use of antimicrobials and aiming to reduce overall use of cephalosporins, carbapenems and quinolone classes in intensive-care units (ICUs) and non-ICU settings
• avoiding the empirical use of broad-spectrum -lactam antimicrobials (including third- and fourth-generation cephalosporins and carbapenems) for respiratory tract infections, surgical prophylaxis and urinary tract infections.
Potential actions
Hospitals with high carbapenem use should review their use in line with current guidelines. Participation in the National Antimicrobial Prescribing Survey (NAPS) can help hospitals to identify areas for improvement and design strategies to reduce inappropriate use. The more hospitals that participate in NAPS, the more we will understand about prescribing practices in individual hospitals and throughout Australia. It may be informative to establish a national target or indicator for appropriate carbapenem use in Australia, and use NAPS to monitor this every year.
Chapter 6: Emerging issues 173
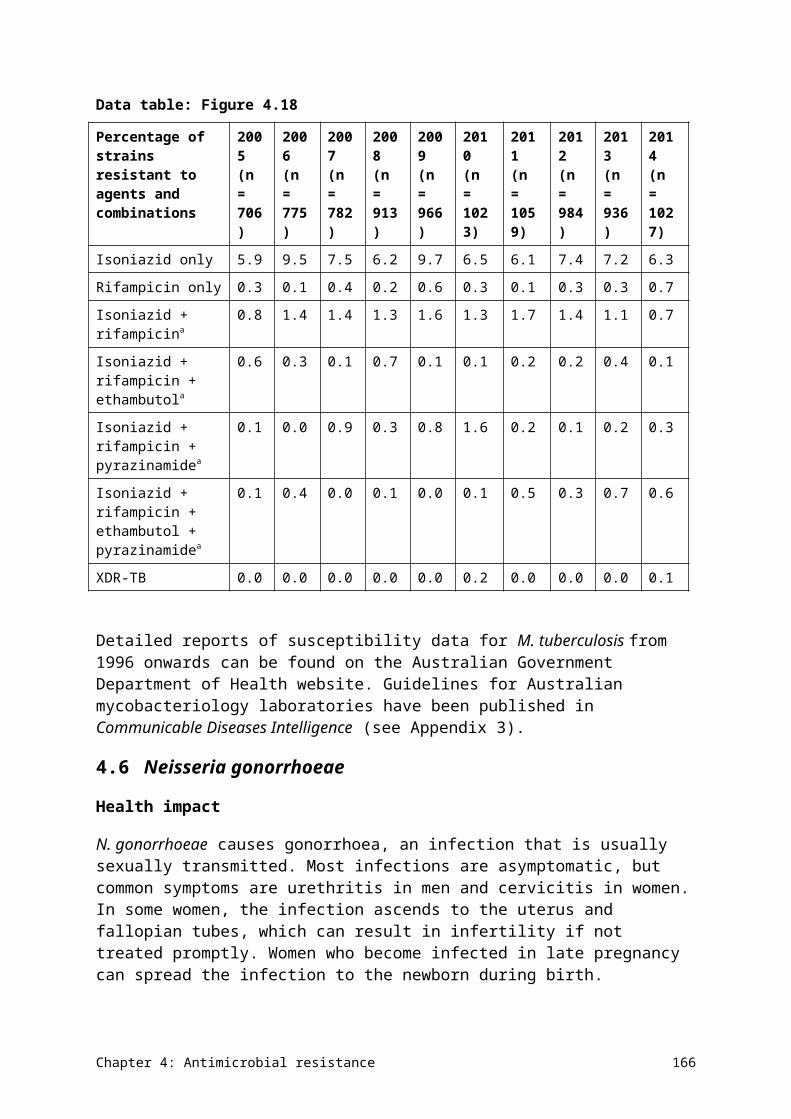
6.2 Carbapenemase-producing Enterobacteriaceae and carbapenem resistance
Contributor: Associate Professor Thomas Gottlieb, Clinical Associate Professor Medicine (Immunology & Infectious Diseases), Concord Clinical School
The threat to public health from the spread of multidrug-resistant bacteria has received increasing attention. Measuring the extent of antimicrobial resistance (AMR) is crucial to defining the current and future problem. Of foremost concern is the potential spread of carbapenemase-producing organisms in the community and healthcare facilities.
Carbapenems (including meropenem and imipenem) are the broadest-spectrum antimicrobials available. They are usually reserved for treatment of the most severely ill patients, and those with infections caused by bacteria that are resistant to multiple other antimicrobial classes.
If an organism is resistant to carbapenems, it effectively means that it is resistant to all β-lactam antimicrobials – the key group of antimicrobials in therapeutic use in Australia.
Management of carbapenemase-producing Enterobacteriaceae infections
Colonisation with CPE usually occurs in the patient’s gastrointestinal system. Most patients do not develop any associated illness, but they can spread the resistant bacteria to others. Some patients may develop clinical signs of CPE infection, such as urinary tract or biliary infections.
CPE management in a hospital or long-term care setting depends on effective infection control practices to limit the establishment and spread of the organisms. This requires significant policy development, planning, and physical and human resources to pre-emptively screen for CPE carriage and to isolate at-risk or colonised patients.
Impact and spread of carbapenemases
Some bacteria that are resistant to carbapenems produce an enzyme called a carbapenemase. In gram-negative bacteria (such as Pseudomonas aeruginosa, Acinetobacter baumannii and the Enterobacteriaceae), different groups of acquired genes code for carbapenemases. The main groups of carbapenemases are KPC, VIM, IMP, NDM and OXA.
Carbapenemases are ‘promiscuous’ – that is, the genes encoding these enzymes can be highly transmissible within and between species of bacteria. Carbapenemase genes are found on plasmids or parts of bacterial chromosomes that also encode other bacterial resistance factors, such as those coding for ESBLs, and fluoroquinolone and aminoglycoside resistance. This means that bacteria that have acquired carbapenemases are highly multidrug resistant, leaving very few – if any – antimicrobial options for therapy.
CPE have high epidemic potential. Internationally, the development and spread of CPE are promoted by use – and overuse – of antimicrobials in health care, agriculture and food production. In the long term, reducing the proliferation of known or new carbapenemase enzymes depends on effective regulation of AU internationally, and prescribers’ willingness to conform to antimicrobial treatment guidelines and antimicrobial stewardship.
Chapter 6: Emerging issues 174
International spread of carbapenemase-producing Enterobacteriaceae
Data indicates that Enterobacteriaceae with KPC carbapenemases are spreading in the United States, Israel and South America. Greece and Italy have recently reported outbreaks in which 50% of K. pneumoniae bacteraemia isolates were KPC producers. Recent reports from Italy also indicate that KPC-producing K. pneumoniae has become resistant to colistin, following the use of this agent as a last-line antimicrobial in critically ill patients.
The carbapenemase NDM-1 was first recognised on the Indian subcontinent. It has spread widely in both hospitals and the community. Data from 2011 estimates that 100–200 million people could be colonised by Enterobacteriaceae that possess this enzyme. NDM-1 has since been recognised in other parts of Asia, and has spread through international travel, resulting in multiple sporadic cases in Australia.
The OXA-48 enzyme has been documented in north Africa, Turkey and areas of the Middle East, and has also disseminated widely through travel and patient transfer. A large hospital outbreak was documented in Rotterdam, and OXA-48 is the most common CPE identified in French laboratories. An OXA-48-type variant (OXA-181) has been isolated in India, and is often associated with NDM-1.
Carbapenemase-producing organisms in Australia
To date, the rates of reported CPE in Australia have been low. Active surveillance through the Australian Group on Antimicrobial Resistance detected only rare isolates in surveys until 2012. In 2013 and 2014, 14 of 4958 (0.28%) and 14 of 5796 (0.24%) isolates of Enterobacteriaceae from Australian patients with bacteraemia produced carbapenemases.
The 14 isolates in 2014 included the enzyme groups IMP-4 (seven isolates), KPC-2 (three isolates), VIM-1 (two isolates), NDM-4 (one isolate) and OXA-181 (one isolate). All isolates were individual sporadic cases, except for the three cases of KPC-2, which were part of a sustained local hospital outbreak.
Implications for Australia
Carbapenemases are present in Australia at low levels, but seem to be widely disseminated throughout the country. The enzyme group IMP-4 is the most commonly reported CPE in Australia. Molecular analysis of these isolates has found that the gene for the enzyme is located on a range of plasmids in different isolates, suggesting that multiple recombination events have taken place over time. Recently, IMP-4 was identified in a pandemic strain of E. coli ST131 (a high-risk, highly transmissible clone), and also in animal and environmental isolates, suggesting low-level but extensive dissemination of this carbapenemase in Australia. The combination of wide dissemination and genetic recombination means that IMP-4 has a high likelihood of becoming more common and very widespread in the future.
A recent outbreak of a KPC-producing K. pneumoniae in a Victorian hospital led to sustained hospital cases for more than 12 months and secondary cases presenting to other hospitals. The strain was not initially recognised as a CPE. This highlights the need for vigilance, and for up-to-date methods of detection to be in place in all routine microbiology laboratories.
Chapter 6: Emerging issues 175
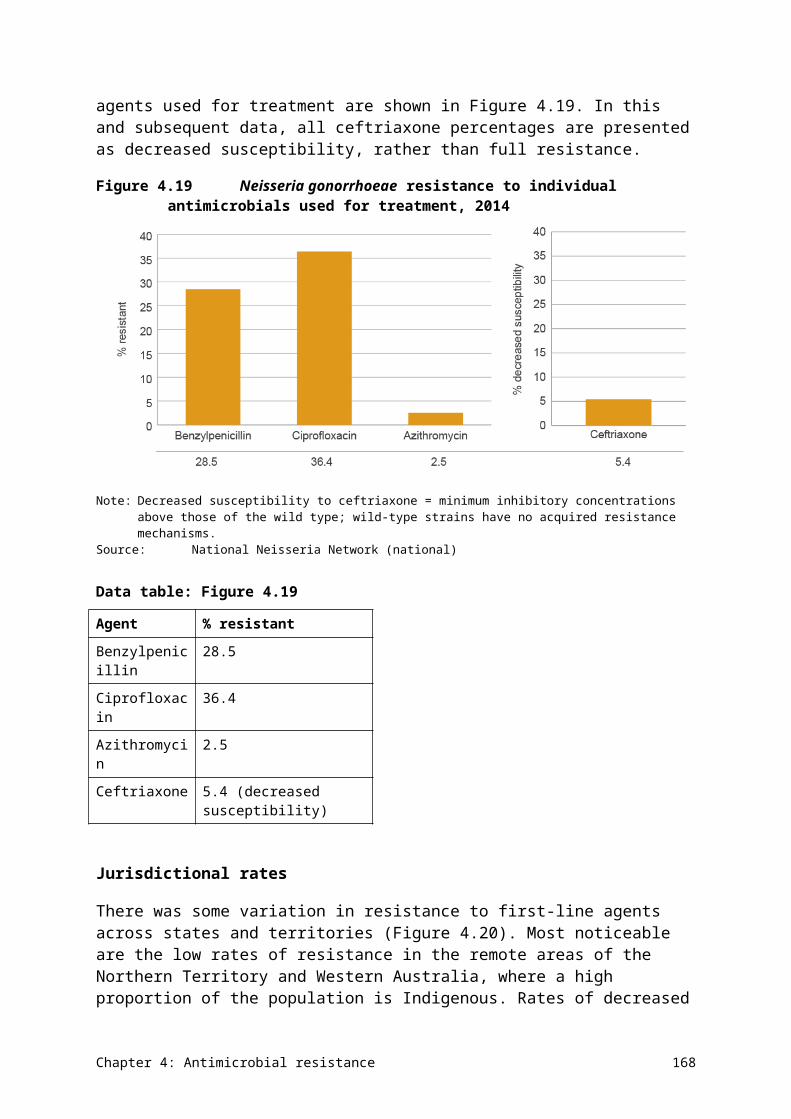
Potential actions
Containment of CPE has become a national priority. The Commission is building a national alert system (CARAlert) for critical AMR, with CPE being the most important of these. The alert system will provide near-immediate information on confirmed CPE around Australia, allowing more coordinated action should an outbreak(s) be identified.
The Commission has produced guidance on the detection and containment of CPE at the individual institution level. This guidance should be reviewed and updated regularly as new information comes to light.
The outbreak of a KPC-producing K. pneumoniae in Victoria has shown that a statewide ‘public health’ approach – that is, an approach that is beyond the single institution – is essential to the containment of CPE, because strains do not remain confined to a single hospital. The Victorian Department of Health and Human Services has recently drafted guidelines for statewide containment. Other states and territories should consider similar actions.
6.3 Antimicrobial use and appropriateness in surgical prophylaxis
Contributor: Dr Trisha Peel, Infectious Diseases Physician and NHMRC Clinical Research Fellow, Department of Surgery, University of Melbourne
One of the key issues identified in the 2014 NAPS was the high level of inappropriate use of antimicrobials for surgical prophylaxis. Surgical prophylaxis was the most common recorded indication for use of all antimicrobials in hospitals (13.1%). Slightly more than 40% of these prescriptions were deemed inappropriate, and the most commonly cited reasons were incorrect duration (39.7%), antimicrobial not indicated (22.9%), and incorrect dose or frequency (15.7%). NAPS found that almost 36% of prescriptions lasted for more than 24 hours – the best practice target is 5% or less.14
Surgical National Antimicrobial Prescribing Survey
Following these results, the National Centre for Antimicrobial Stewardship (NCAS) has been developing a new surgical NAPS (sNAPS) audit tool to quantify surgical antimicrobial prophylaxis. sNAPS will involve the public and private sectors, and capture comprehensive data on the dosing, timing and duration of antimicrobial prophylaxis, and patient outcomes, including surgical site infections and Clostridium difficile infections. This new audit tool captures data on patients undergoing a broad range of surgical procedures, including procedures where surgical prophylaxis is not indicated.
The sNAPS tool was piloted at 11 sites in May 2015, including public and private hospitals in the Northern Territory, Queensland, South Australia, Western Australia and Victoria. A total of 668 procedures were included: 78% (n = 519) were elective, and 21% (n = 142) were emergency procedures. A total of 592 antimicrobials were prescribed during the perioperative period; 180 procedures had no antimicrobials prescribed.
Results
The results of the pilot showed that 25% of antimicrobial prophylaxis was noncompliant with any guidelines, and 27% of perioperative use was deemed to be inappropriate. In addition,
Chapter 6: Emerging issues 176
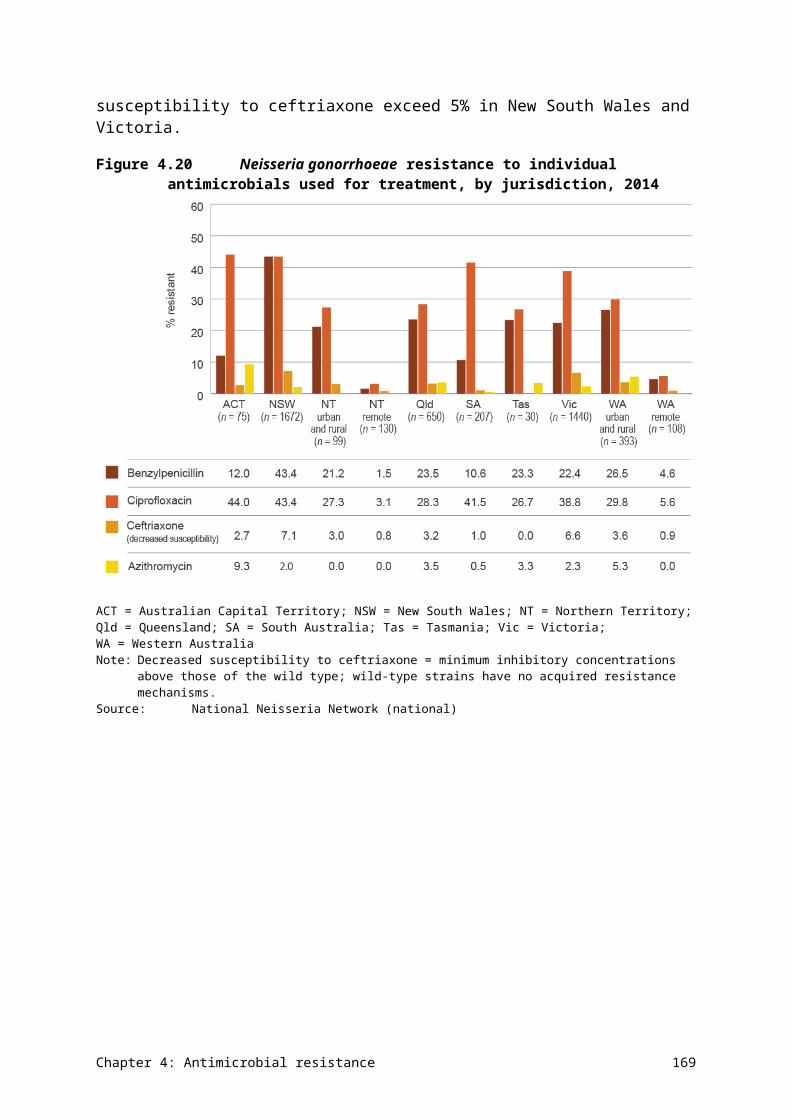
only 17% of procedures involving antimicrobials had the exact time of administration documented.
In the postoperative period, 310 antimicrobials were prescribed: 76% were for prophylaxis, 18% were for treatment, and 6% were not assessable or not specified. Of concern is the 55% of postoperative prescriptions that were deemed to be inappropriate.
In the preoperative and postoperative settings, the most common reason for inappropriate prescription was the use of antimicrobial prophylaxis when it was not indicated (11% of preoperative and 46% of postoperative inappropriate prescriptions). Given the number of patients undergoing surgery each year, this represents a major source of inappropriate antimicrobial consumption, and a serious challenge for preventing and containing AMR.
Potential actions
NCAS is undertaking research to better understand the behavioural drivers of antimicrobial prescribing in the surgical context. This research builds on work undertaken as part of a National Health and Medical Research Council Partnership Grant, which explored potential barriers and facilitators to antimicrobial stewardship in surgeons, anaesthetists and nursing staff. The work will inform research strategies to improve appropriate antimicrobial prescriptions for surgical prophylaxis.
The Commission is also exploring options to address the issue of inappropriate surgical antimicrobial prophylaxis. The Commission will be working with key stakeholders, including the Royal Australasian College of Surgeons and NCAS, to identify strategies and policies that can be implemented at the local, state and territory, and national levels to improve appropriate AU in surgical settings, particularly relating to duration of prophylaxis.
Chapter 6: Emerging issues 177
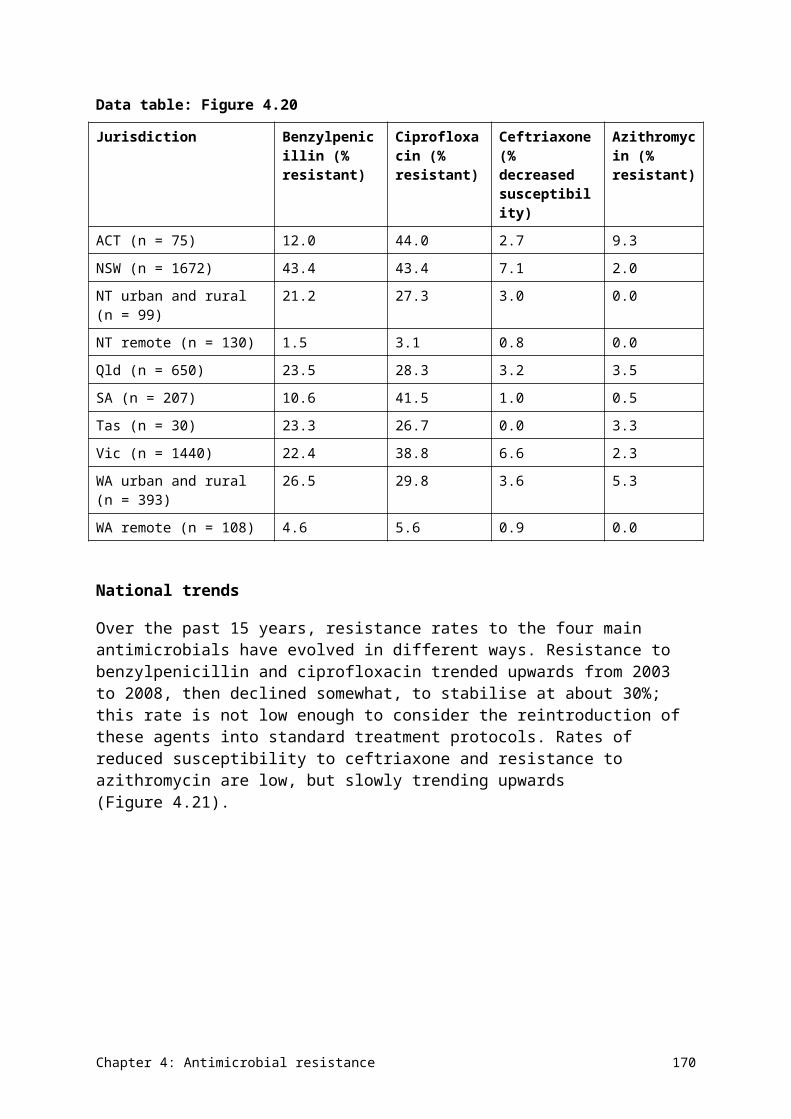
Chapter 7 Conclusions and future developments
Key messages
• Effective surveillance systems should be more than just data collections. Surveillance should provide links between data sources, and appropriate analyses that deliver meaningful and accessible information for actions to prevent and contain antimicrobial resistance (AMR).
• This AURA 2016 report provides valuable data and comprehensive analyses of AMR, antimicrobial use (AU) and appropriateness of prescribing in Australia, and sets a baseline that will allow AMR and AU trends to be monitored over time.
• This report highlights areas where additional work would improve understanding and inform further action. The Australian Commission on Safety and Quality in Health Care, in partnership with a number of organisations and the states and territories, is undertaking a range of activities to strengthen the Antimicrobial Use and Resistance in Australia (AURA) Surveillance System.
• A national alert system for critical AMRs has been established in 2016.
• Future AURA reports will continue to improve and expand, in line with the development of the AURA Surveillance System, the implementation of the National Antimicrobial Resistance Strategy, and the achievement of a better understanding of where investment in research and data collection is most valuable.
This chapter provides an overview of the next phases of work in the development of the AURA Surveillance System. The focus of future work is to:
• increase the validity and comparative value of data included for surveillance
• increase the range of data captured, to improve representativeness
• improve consistency of approach across the elements of AURA, to improve comparability
• provide a base for comparative reporting over time.
Each of these elements will strengthen the value of the AURA Surveillance System as a catalyst for action to prevent and contain AMR.
7.1 Lessons from AURA 2016
This report provides a comprehensive analysis of available surveillance data for antimicrobial resistance (AMR), antimicrobial use (AU) and appropriateness of prescribing in Australia, in both hospitals and the community. It is the first Australian report to collate and analyse surveillance data to provide a foundation for informing prevention and containment strategies, and for allowing comparisons and monitoring of AMR strategies over time. The report was informed by several longstanding international surveillance reports, such as DANMAP and NethMap.64,65 Future Antimicrobial Use and Resistance in Australia (AURA) reports will be informed by Australia’s National Antimicrobial Resistance Strategy, and will also continue to consider international reports.
The data shows that AU is very high in the Australian community, with more than 30 million antimicrobial prescriptions dispensed each year. Prescribing rates across states and territories
Chapter 7: Conclusions and future developments 178
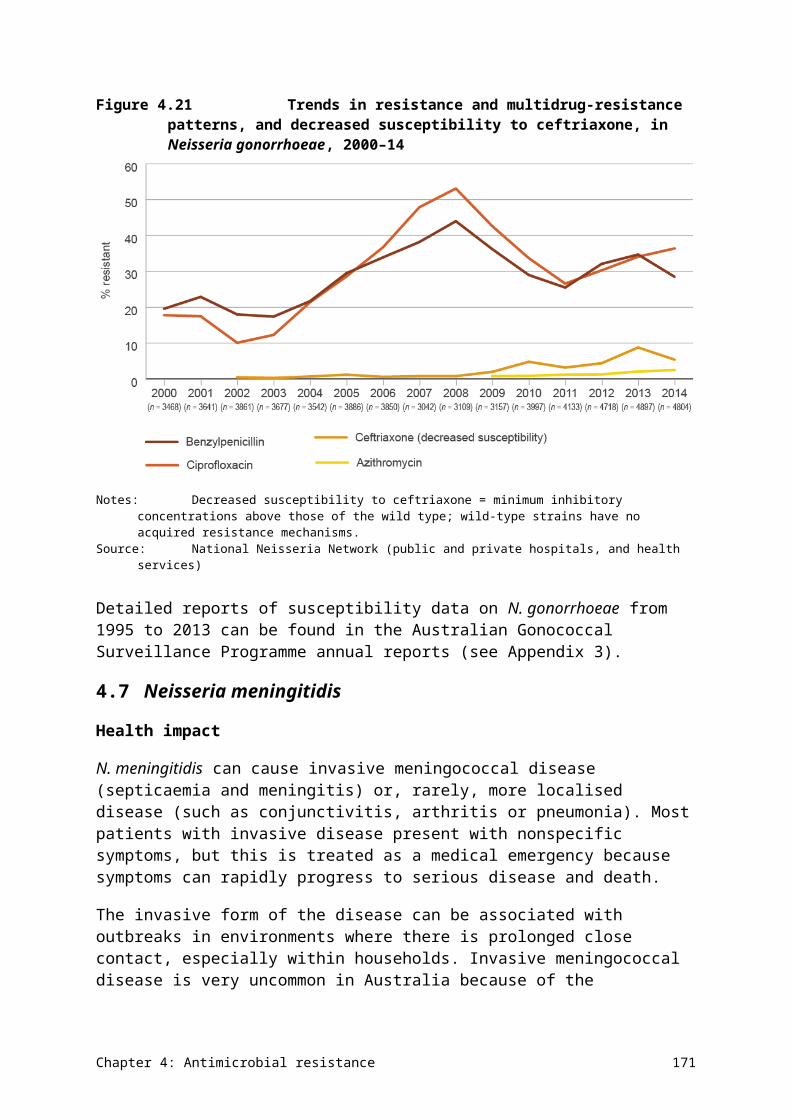
varied widely. The most commonly prescribed class of antimicrobial was β-lactams – almost 30% of patients presenting to the MedicineInsight group of general practitioners received a prescription for amoxicillin, cephalexin or amoxicillin–clavulanate.
The types and volume of antimicrobials prescribed in hospitals and residential aged care facilities vary widely. There are high usage rates of cephalosporin and penicillin – β-lactamase inhibitor combinations, and concerning rates of inappropriate AU for surgical prophylaxis.
There are changing and emerging issues for AMR in Australia. Extended-spectrum β-lactamase-producing Escherichia coli are becoming a greater problem within the community, as are community-acquired strains of methicillin-resistant Staphylococcus aureus. Australia’s pattern of AMR is also notably different from other countries. For example, Australia has comparatively low rates of resistance among gram-negative pathogens, yet one of the highest rates of vancomycin-resistant enterococci in the world.
Effective surveillance systems should be more than just data collections – it is essential that they also provide meaningful and accessible information to those who can act on it to prevent and contain AMR. AURA 2016 shines a light on gaps in surveillance coverage; jurisdictional differences in data collection, analysis and reporting; and the use of different diagnostic systems for susceptibility testing as factors contributing to the currently fragmented picture of AMR and AU in Australia.
Effective surveillance systems should be more than just data collections – they must also provide meaningful and accessible information to those who can act on it to prevent and contain AMR.
AURA 2016 provides a baseline that will allow AU and AMR trends to be monitored over time. This will help to guide actions under the National Strategy to ensure that prevention and containment activities are targeted to best effect. As successive reports are released, the impact of specific strategies can also be tracked.
AURA’s aim is to provide an appropriate balance of information for immediate action, and information for monitoring progress on the prevention and containment of AMR over time. This will be assisted by better integration of AMR and AU surveillance across jurisdictions and existing programs, to provide coordination of data and reports from a single, trusted source of information. Achieving these objectives will support the objectives of the National Strategy by informing strategic planning for coordinated and integrated action. In turn, this will result in the prevention and containment of AMR, and improved health outcomes for Australians.
AURA’s aim is to provide an appropriate balance of information for immediate action, and information for monitoring progress on the prevention and containment of AMR over time.
Surveillance data and reporting are important at the local, state and territory, and national levels. Publications from the AURA Surveillance System will be mindful of these different data needs, and reports will be developed in a way that is useful and valuable to all levels.
Chapter 7: Conclusions and future developments 179
7.2 Next steps for the AURA Surveillance System
Additional reports on specific focus areas for AMR and AU will supplement AURA 2016 and will be released throughout the year. The Australian Commission on Safety and Quality in Health Care (the Commission) will continue a multifaceted, collaborative approach to achieving a comprehensive AU and AMR surveillance system that provides valuable data to inform action to prevent and contain AMR. Work is already under way through the Commission’s AURA coordinating unit to improve data analysis and interpretation at the national level, and to respond to issues, such as inappropriate surgical prophylaxis, that have been highlighted in this report.
The Commission will work with its partners to increase surveillance coverage across geographical areas (states and territories; and urban, regional, rural and remote areas), patient settings (primary care, residential aged care and hospitals) and hospital types.
The work undertaken to establish the AURA Surveillance System, and to develop AURA 2016, has also provided a focus for activity that will achieve greater representativeness, acceptability, comparability and quality of the data.
Key activities to enhance the system and reporting include:
• continuing work with stakeholders on the harmonisation of susceptibility testing systems to improve data quality and comparability; similar challenges are reported in the development of the World Health Organization’s Global Antimicrobial Resistance Surveillance System
• increasing hospital participation and scope of surveillance for the Australian Group on Antimicrobial Resistance (AGAR), the National Antimicrobial Prescribing Survey (NAPS) and the National Antimicrobial Utilisation Surveillance Program (NAUSP)
• reviewing defined daily doses and other measures, to improve opportunities for reports to compare surveillance and allow benchmarking between hospitals
• reviewing options for casemix and infection rate adjustments for occupied-bed days in hospitals; this might be achieved by assessing the proportion of cases with pneumonia, sepsis or specific types of surgery
• facilitating increased access to NAUSP reports by all participating hospitals, as well as identifying opportunities to improve benchmarking at the state and territory level, and potentially in clinical settings such as oncology/haematology and renal units
• benchmarking and comparing peer group hospitals or healthcare networks to improve appropriate AU
• reviewing specific aspects of antimicrobial prescribing under the Pharmaceutical Benefits Scheme to assess opportunities for improving appropriateness of AU in the community, in partnership with NPS MedicineWise
• continuing to develop best practice in data governance, and ethics and privacy issues, as key enablers of a sustainable surveillance system.
National alert system for critical antimicrobial resistances
A priority component of AURA is to improve the utility of surveillance data, where gaps have been identified. The surveillance of critical antimicrobial resistances (CARs) and timely
Chapter 7: Conclusions and future developments 180
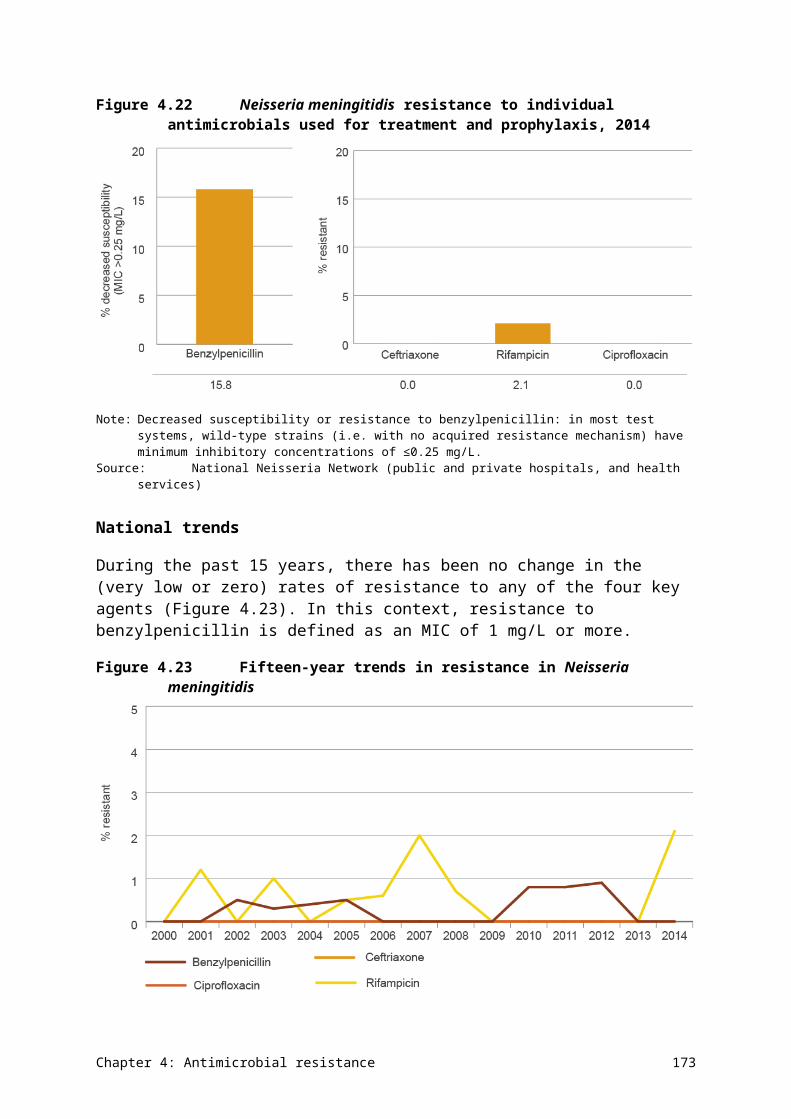
reporting of these resistances is one such gap, as there is no formal means to inform health systems of these developments. The Commission has therefore established a national alert system for CARs.
CARs are resistance mechanisms that are known to have a high impact on the effectiveness of last-line antimicrobial agents. CARs are currently relatively low in number across Australia, but they can result in significant illness and death in healthcare facilities and in the community when they do emerge. The emergence and spread of KPC-2-producing Klebsiella pneumoniae in Victoria has highlighted the challenge of timely recognition of the location and spread of CARs in Australia. Overseas experience has shown that this particular CAR has high capacity for amplification and spread, and can cause significant mortality.66,67
Susceptibility data for some CARs has been captured through a small number of state-based surveillance programs for multidrug-resistant organisms. Data is also captured through existing national programs, such as the National Notifiable Diseases Surveillance System and AGAR. However, none of these systems provide comprehensive data on all of the relevant CARs that should be monitored, nor do they provide timely or structured advice to health services and jurisdictions to minimise the spread of organisms with CARs.
A structured and coordinated system to identify and communicate information about CARs is a key requirement for managing the emergence and spread of AMR in Australia. The system provides an efficient and responsive mechanism to describe the common protocols for testing isolates of potential CARs, as well as processes for recording and transferring information about confirmed CARs through a web portal for reporting, in near real time.
The CARs to be reported are listed in Table 7.1, and are drawn from the list of priority organisms and antimicrobials for targeted surveillance and national reporting under the AURA Surveillance System. The list was developed by the Commission, in consultation with members of the AURA Project Reference Group. The CARs will be reviewed and updated regularly in the context of the latest available evidence on critical resistances to emerge in Australia and overseas.
How the alert system works
If an initial laboratory test indicates a possible CAR, an isolate is sent to a designated confirming laboratory for testing. Confirming laboratories have clear definitions of resistance, based on genotypic or phenotypic testing methods. A handbook has been provided to confirming laboratories to detail all aspects of the alert system processes.
The confirming laboratory notifies the originating laboratory of both positive and negative results in the usual manner. In addition, it uses the web portal to record and send organism data and some demographic data on confirmed CARs to the Commission. The system then communicates CAR alerts to designated stakeholders by email or SMS so that appropriate local, state or territory, and national responses can be initiated. This allows timely action to be taken for appropriate infection control and containment, as well as proactive prevention strategies across the health system.
Chapter 7: Conclusions and future developments 181
Table 7.1 Critical antimicrobial resistances for Australia
Organism Critical resistance
Enterobacteriaceae Carbapenemase production or ribosomal methylase production
Enterococcus species Linezolid nonsusceptibility
Mycobacterium tuberculosis Multidrug resistance (rifampicin resistance)
Neisseria gonorrhoeae Ceftriaxone or azithromycin nonsusceptibility
Salmonella species Ceftriaxone nonsusceptibility
Shigella species Multidrug resistance
Staphylococcus aureus Vancomycin, linezolid or daptomycin nonsusceptibility
Streptococcus pyogenes Penicillin reduced susceptibility
The Commission is responsible for coordination and oversight of the system. In addition to the alerts, it will produce analytic reports to inform policy and program development. These reports will be provided to the states and territories, and will also be available in future national reports on AU and AMR.
The Commission began operating this system in March 2016, and is currently working with the states and territories, as well as public and private laboratories, to ensure that the system is fully operational and achieving its potential by mid-2016.
7.3 Future AURA reports
AURA 2016 is the first report of its kind in Australia. It is anticipated that regular reports will continue to be produced, with increasing capability to provide greater reach of surveillance, along with improved analyses and data reporting.
The Commission continues to partner with the foundation data collection programs, such as AGAR, NAUSP, NAPS and OrgTRx, to improve capacity and participation. Since the start of the AURA Surveillance System, the Commission has facilitated a significant increase in participation and representativeness for all the core data collections, as well as improvements in the timeliness, accessibility and availability of data and reports on these collections. Each of these dimensions contributes to improved safety and quality of health care.
The Commission has also invested in improving the complexity and utility of analysis of this data, and has established mechanisms to collect new and valuable surveillance data not previously available, such as through the establishment of the national alert system for CARs.
AU and AMR surveillance in Australia is building a better foundation for action. The information in this report will be improved and expanded, in line with:
• the growth and development of the AURA Surveillance System
• the implementation of the National Antimicrobial Resistance Strategy
• the achievement of a better understanding of where investment in research and data collection is most valuable.
Chapter 7: Conclusions and future developments 182
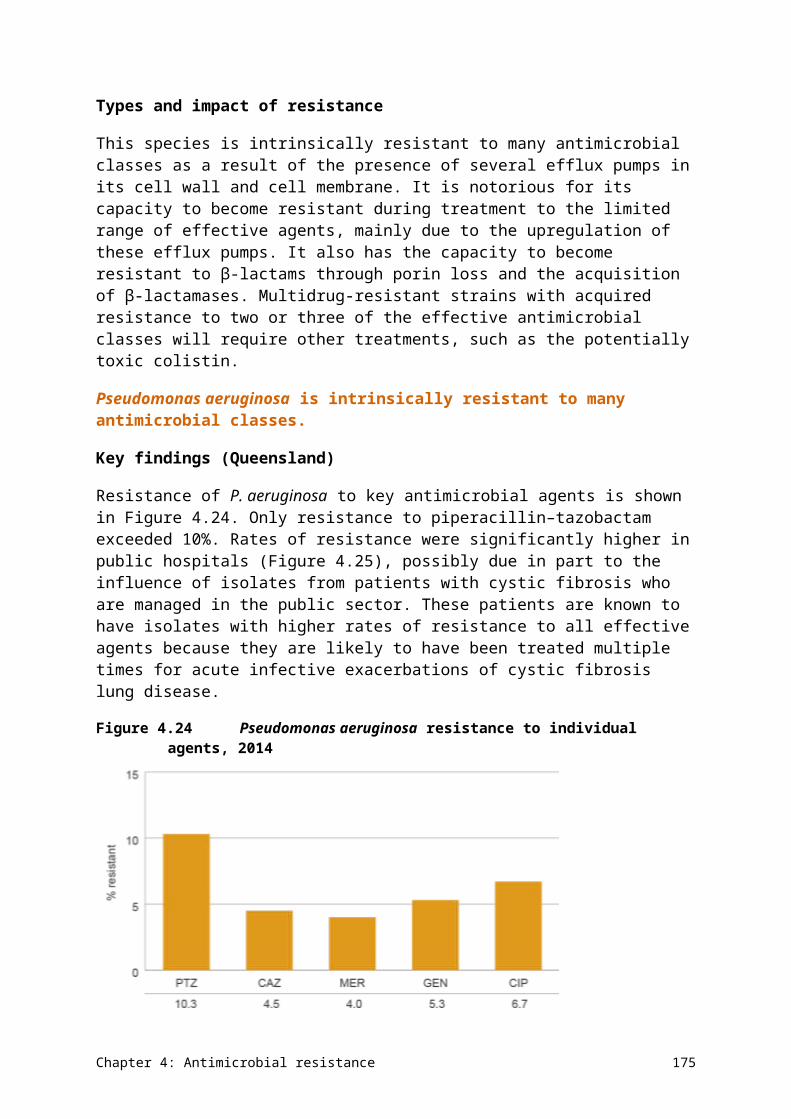
A number of improvements are already in place. Future national reports on AU and AMR will have the capacity to include reporting using time series and trending data, greater national coverage of passive surveillance of AMR, and some preliminary analysis of the relationship between AU and AMR.
The Commission’s approach to effective surveillance is multifaceted. It includes establishing a comprehensive and robust AMR and AU system, alongside the review of research, development of policy, and supporting coordination and collaboration of action through work on antimicrobial stewardship and infection control. This work will continue to be implemented collaboratively with the states and territories, and other key stakeholders in the private sector, to promote a sustainable and integrated approach to tackling AMR. Continued collaboration and cooperation across the public and private sectors, and all jurisdictions will be key to reliability and sustainability.
Chapter 7: Conclusions and future developments 183
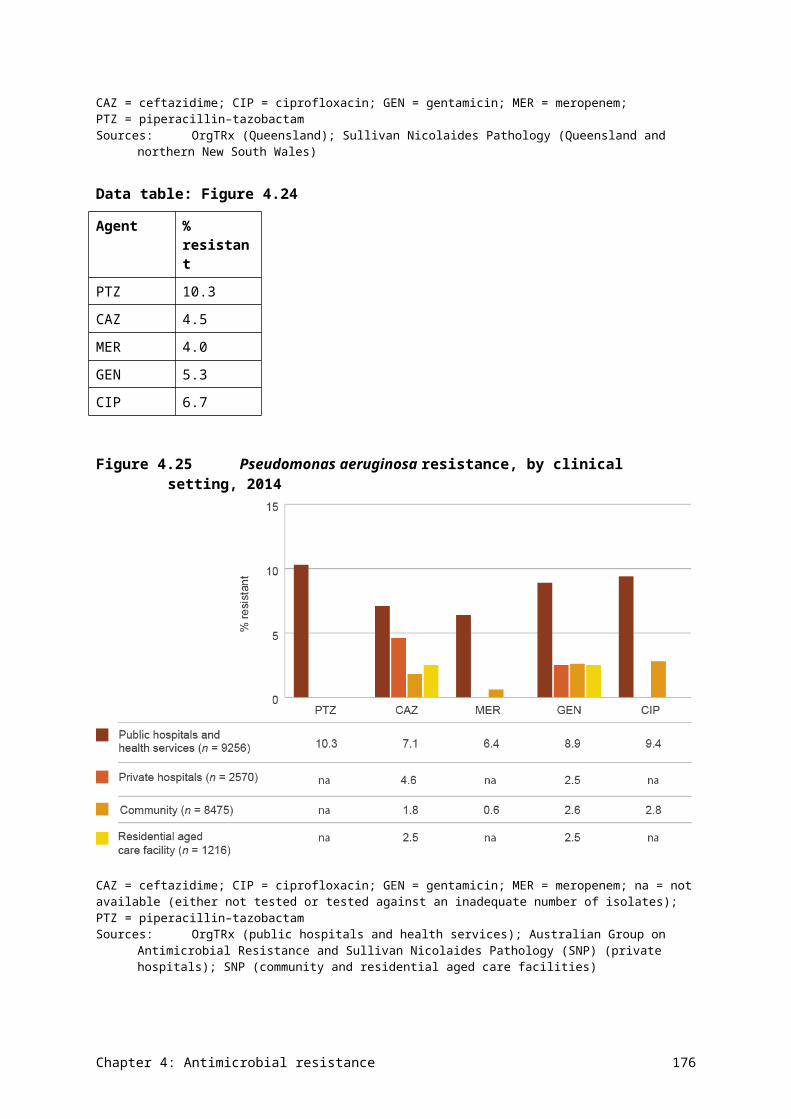
Appendix 1 Data source description
A1.1 Antimicrobial use collections
This section provides information on the methods used by each of the data sources for antimicrobial use (AU) used in this report, including information on processes and limitations.
National Antimicrobial Utilisation Surveillance Program
The National Antimicrobial Utilisation Surveillance Program (NAUSP) started in July 2004, with the aim of providing a national picture of AU in Australian hospitals.
Participation in NAUSP is voluntary. Pharmacy departments of participating hospitals supply NAUSP with aggregated monthly data for antimicrobials issued to individual inpatients and ward imprest supplies (ward stock managed by the pharmacy), through dispensing reports.
NAUSP uses standardised usage density rates, based on the World Health Organization’s (WHO’s) Anatomical Therapeutic Chemical (ATC) standards for defined daily doses (DDDs). The denominator is the frequently used metric of inpatient overnight occupied-bed days. Reporting on AU based on DDDs enables assessment and comparison of total hospital use as a rate, and also allows international comparisons.
NAUSP’s annual report covers total in-hospital AU data collected from participating hospitals across Australia. Participating hospitals also receive individualised bimonthly reports that provide benchmarking data to inform local quality improvement activities.
Participants
NAUSP has had a substantial increase in participation, from 89 hospitals in 2012 to 129 in 2014 (111 public and 18 private). Hospitals participating in 2014 represented more than 90% of principal referral hospital beds, and 82% of total beds in hospitals across Australia that had more than 50 beds. Since 2008, all Australian states and territories have been represented in the program.
The Australian Commission on Safety and Quality in Health Care (the Commission) has partnered with NAUSP to increase participation, increase the power of surveillance of antimicrobial resistance (AMR) and AU, and continue to support the implementation of the National Safety and Quality Health Service Standards.
Considerations
Data provided to NAUSP does not include:
• the indication for which antimicrobials are used, or any patient-level data
• AU for paediatric populations, because this cannot be translated to a standard-use density rate based on DDDs
• pharmacy issues of antimicrobials to individuals and wards classified as specialty areas (such as psychiatric, rehabilitation, dialysis and day-surgery units), or AU for outpatient, discharge and external services
Appendix 1: Data source description 184
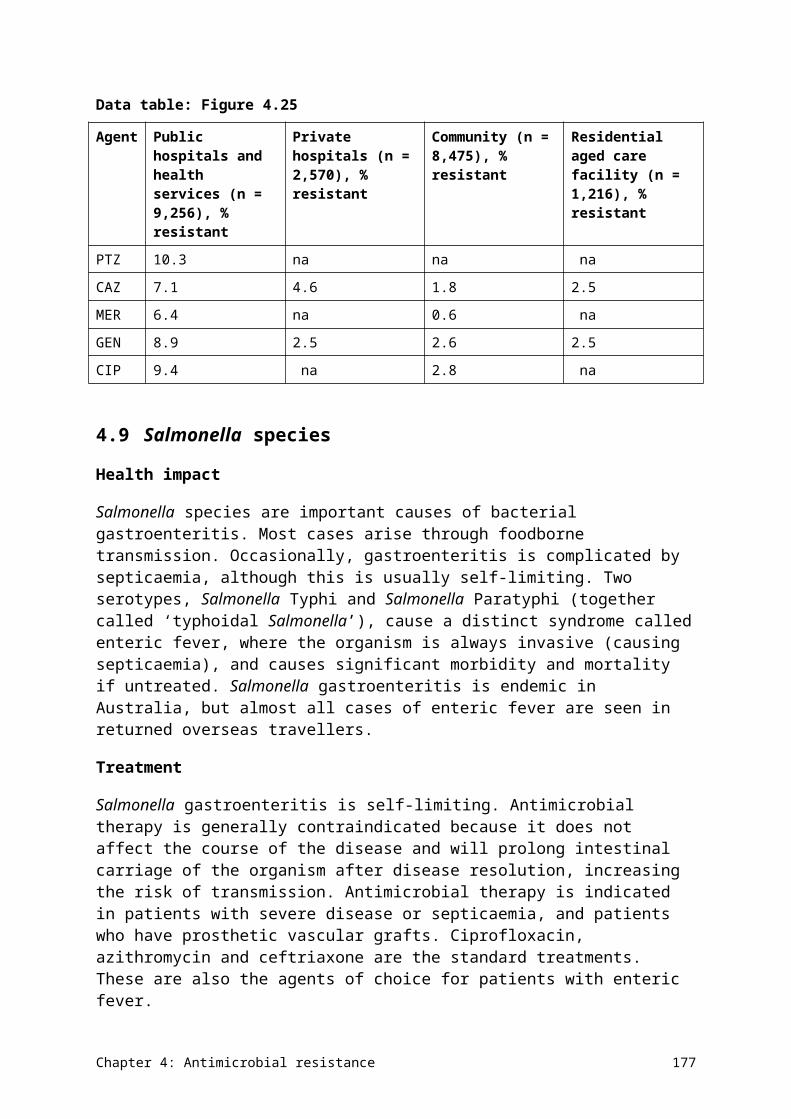
• most topical antimicrobial formulations (except some inhalation ones), antimycobacterials (except rifampicin), antifungals, antivirals, antiparasitics, or infuser packs of antimicrobials.
Additional issues that need to be considered when interpreting the NAUSP data include the following:
• Participation is voluntary, and representation is currently heavily weighted towards principal referral and large public hospitals, where antimicrobial stewardship (AMS) activities may already be established. This should be taken into account when making inferences from NAUSP data.
• There is debate about the accuracy of the use of DDDs in the Australian context. For some antimicrobials, the WHO DDD is not representative of dosage regimens used in Australian hospitals.
Further information on NAUSP can be found on the SA Health website.
National Antimicrobial Prescribing Survey
The National Antimicrobial Prescribing Survey (NAPS) is a web-based auditing tool and antimicrobial survey program developed by the National Centre for Antimicrobial Stewardship (NCAS). The tool is designed to assist healthcare facilities to assess the quantity and quality of antimicrobial prescribing. The program provides remote support for hospitals without onsite expertise. It is used by public and private hospitals across all classifications, including paediatric.
The most recent published data was for the 2014 NAPS. For hospitals to participate in benchmarking, they are required to use a whole-hospital point prevalence survey, repeated point prevalence surveys or a random sample (recommended to be based on at least 30 prescriptions, to detect performance against key indicators).
NCAS has developed guidance to assist facilities in assessing the appropriateness of antimicrobial prescriptions for the survey. This guidance outlines several criteria that are required to be met (such as guideline concordance, dosing, allergy and microbiology mismatch, and spectrum) for a prescription to be considered appropriate, as well as exclusion criteria when appropriateness is not able to be assessed.
Participants
NAPS has seen a steady growth in participation from 2012 (76 participating hospitals) to 2013 (151 hospitals) and 2014 (248 hospitals). This represents a more than 200% increase between 2012 and 2014. Seven of the eight states and territories were represented by participating hospitals in 2014; approximately 80% of participating hospitals were public, and 20% were private.14
Considerations
Issues that need to be considered when interpreting the NAPS data include the following:
• Participation is voluntary; therefore, it is not a random sample, and results might not be representative.
• Individual auditors at each participating facility were responsible for assessing the appropriateness of antimicrobial prescribing and compliance with guidelines, with
Appendix 1: Data source description 185
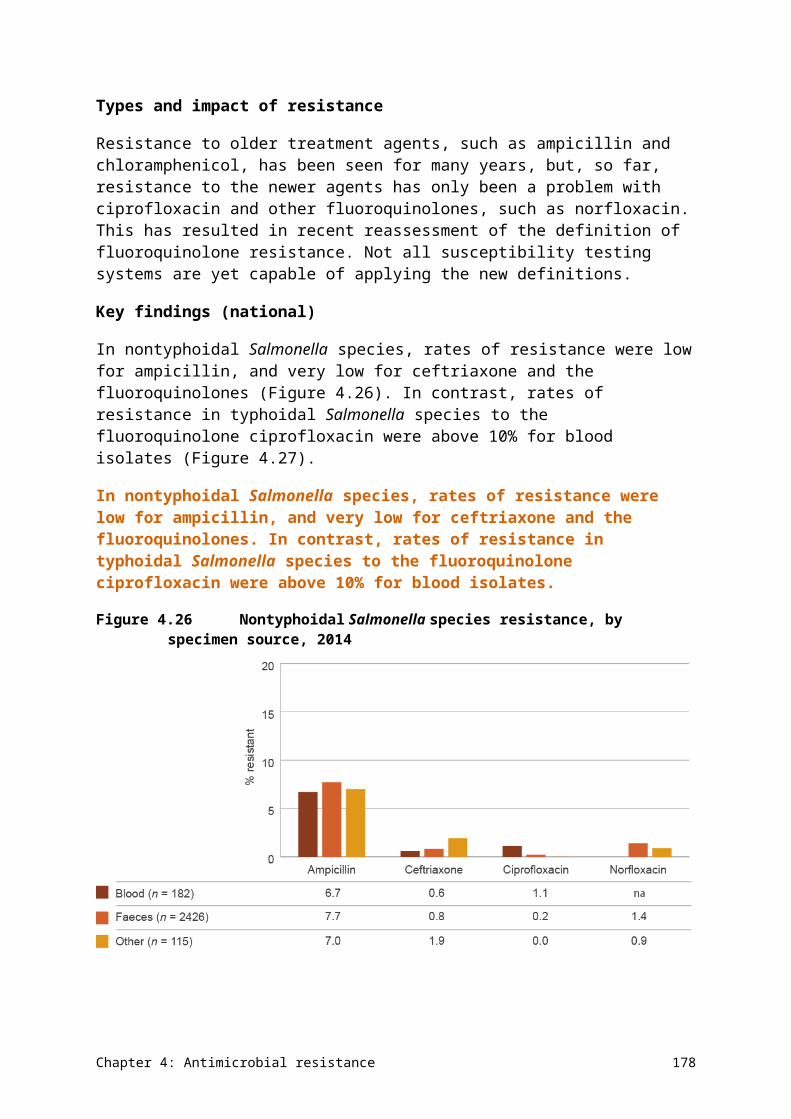
assistance from the NAPS team. The 2014 NAPS was predominantly conducted by pharmacists (60.8%), infection control practitioners and nurses (18.8% combined), and doctors (16.1%). Inter-rater reliability indicates that appropriateness assessments are best undertaken by onsite or remote AMS teams or clinical pharmacists.
• Some changes in methodology occurred between the 2013 and 2014 surveys, and not all data fields were the same in the two surveys; therefore, caution is required when directly comparing results for these years.
Further information on NAPS can be found on the NAPS website.
Pharmaceutical Benefits Scheme
The Australian Government Department of Human Services (DHS) collects data, in the Medicare pharmacy claims database, on antimicrobial dispensing in the community through the Pharmaceutical Benefits Scheme (PBS) and the Repatriation Pharmaceutical Benefits Scheme (RPBS). Data is submitted to DHS directly by community pharmacies or by eligible patients who have been prescribed a PBS/RPBS medicine through Medicare service centres.
The Australian Government Department of Health analyses PBS/RPBS data to inform economic analyses and policy development. Comprehensive medicine usage data is required for a number of purposes, including pharmacosurveillance and targeting, and evaluation of initiatives for quality use of medicines. It is also needed by regulatory and financing authorities, and the pharmaceutical industry.
Data captured by the PBS/RPBS is extensive. Around 30 million prescriptions were supplied for antimicrobials in 2014,30 which is approximately 13% of the total PBS and RPBS prescriptions (214 962 311).68
The Department of Health recently published Antibiotics: Pharmaceutical Benefits Scheme/Repatriation Pharmaceutical Benefits Scheme utilisation (2013) (Antibiotics: PBS/RPBS 2013 report), which provided the framework for analysis of the 2014 data included in the AURA 2016 report.30
Additional data and analysis
As part of the development of the AURA 2016 report, the Commission engaged the University of South Australia to provide an update of the Antibiotics: PBS/RPBS 2013 report using PBS/RPBS patient-level pharmacy prescription claims data from 1 July 2012 to 30 June 2015, which was extracted from the Medicare pharmacy claims database. This update includes actual under co-payment prescriptions, but no estimate of private prescriptions. Under co-payment prescriptions are prescriptions priced below the co-payment threshold as defined in the National Health Act 1953.
The analyses vary from the Antibiotics: PBS/RPBS 2013 report because they include analyses of data for prescriptions and DDDs per 1000 inhabitants per day for all antibacterials subsidised under the PBS/RPBS. The antimicrobials included in the analysis are listed in AURA 2016: supplementary data.
Data for this analysis was retrieved from three sources: the database of the Drug Utilisation Sub Committee (DUSC) of the Pharmaceutical Benefits Advisory Committee, the DHS pharmacy claims database and the Aboriginal health services (AHSs) database.
Appendix 1: Data source description 186
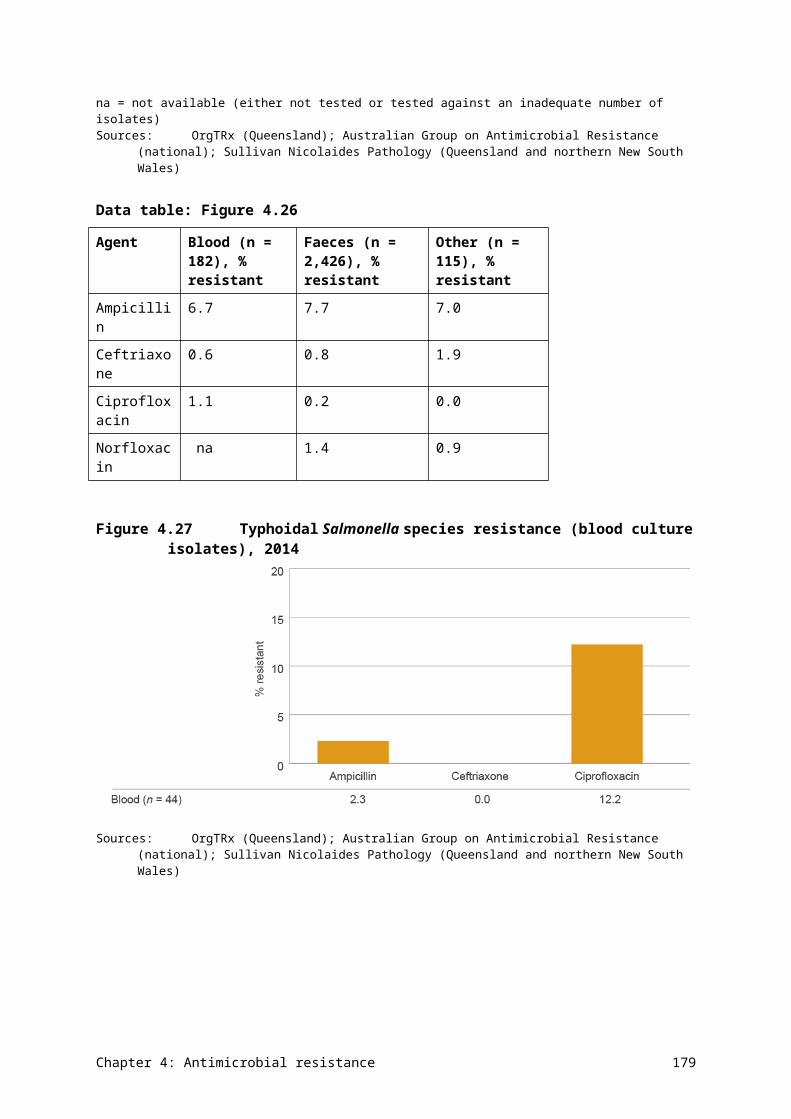
Drug Utilisation Sub Committee database, October 2015
Aggregated data containing the quarterly number of prescriptions and DDD/1000 inhabitants/day for each antibacterial, based on date of supply from 1 January 1994 to 30 June 2015, was extracted from the DUSC database. The DUSC database includes an estimate of private prescriptions and under co-payment prescriptions up to April 2012, based on data from a survey of community pharmacies. From April 2012 onwards, it contains actual under co-payment data, but no longer includes estimates of private prescriptions.
Small differences in ATC classifications used by DUSC mean that total prescription numbers differ from those reported by the PBS by around 3%.
Department of Human Services pharmacy claims database, October 2015
PBS/RPBS data containing patient-level pharmacy prescription claims from 1 July 2012 to 30 June 2015 was extracted from the DHS pharmacy claims database. It includes actual under co-payment prescriptions, but no estimate of private prescriptions. This data was used to determine:
• the number of antibacterial prescriptions or antibacterial drugs supplied per person
• the count of people supplied an antibacterial based on de-identified patient numbers
• the use of antibacterials by age of patients
• the major specialty of the prescriber.
Aboriginal health services database, based on item level by date of processing
Data on antibacterials supplied by AHSs was extracted for 2014. This data was accessed to determine the number of packs of antibacterials and the most common antibacterials provided through these services.
Considerations
Issues that need to be considered when interpreting the PBS/RPBS data include the following:
• Data includes antimicrobials dispensed through the PBS and the RPBS. Therefore, antimicrobials dispensed from some inpatient or outpatient services and some community health services may not be captured.
• Private prescriptions are not included in this data set.
• This data does not indicate the diagnosis or condition of the patient.
In addition, dispensing through the PBS/RPBS does not necessarily equate to consumption. Antimicrobial consumption can be overestimated because patients may not comply with therapy recommendations.69
Further information on the PBS can be found on the PBS website.
MedicineInsight program
NPS MedicineWise currently operates a national program called MedicineInsight, which collects longitudinal clinical data from general practices. The data includes use of medicines, switching of medicines, indications for prescribing, adherence to guidelines, and
Appendix 1: Data source description 187
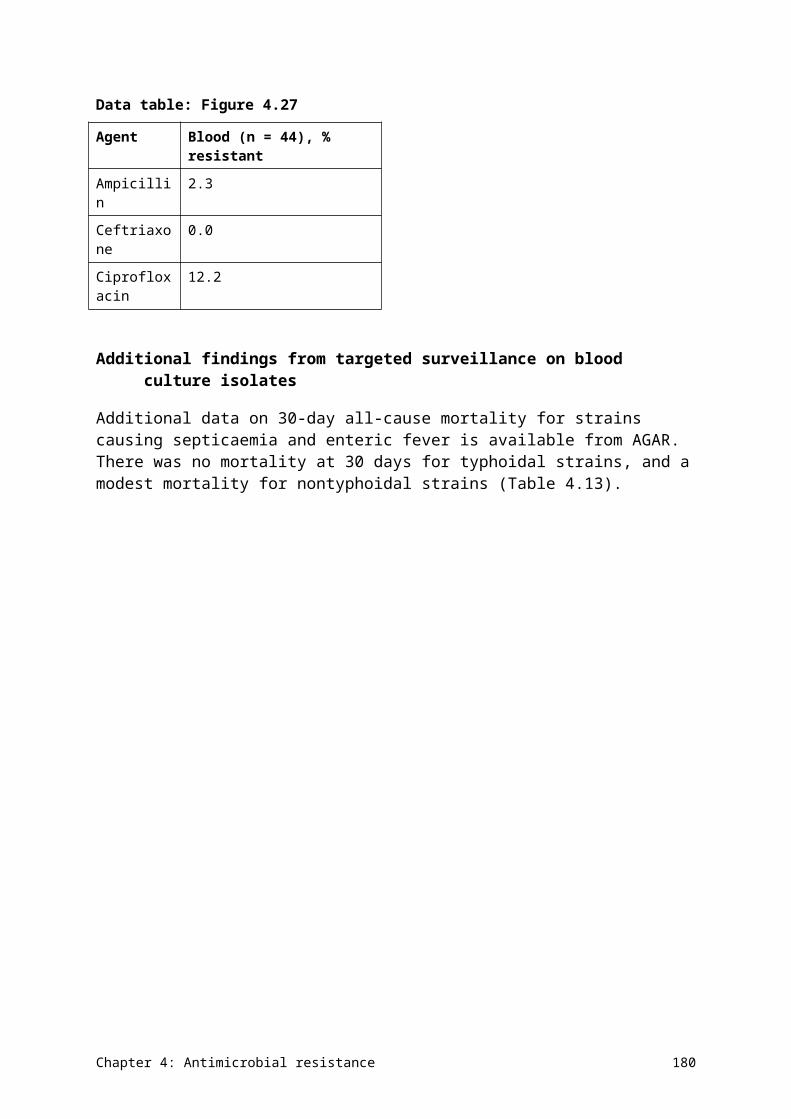
pharmacovigilance to support postmarket surveillance of medicine use in primary care, and to support general practices’ improvement in quality use of medicines and medical tests.
The program aims to support changes in prescribing patterns by providing local data to general practices, to better understand where there may be variation and opportunity for improvement.
The MedicineInsight program is a voluntary program, which collects de-identified general practitioner desktop clinical data. An independent data governance committee oversees the project. This report uses data collected on antimicrobials through this program.
Participants
The information presented in this report is based on general practice clinical data collected from volunteer practices recruited to the MedicineInsight program. The program’s data set is in development, and work is in progress to further develop capabilities and capacity in data analytics and report presentation.
For this report, the results are based on 182 practices, comprising 1005 general practitioners and 1 264 232 patients, from the first recording of clinical data in their clinical systems until 31 December 2014.
The program has significantly expanded, and a preliminary evaluation has shown that the data is nationally representative.
Considerations
Issues that need to be considered when interpreting the MedicineInsight data include the following:
• Participation is voluntary; therefore, the general practices included are not a randomised sample.
• Data is sourced from medical records, and relies on an appropriate level of completeness and accuracy within the records.
• Infrequently attending patients, specialist prescriptions and samples are not included.
• Prescribing data can vary from dispensing data, as not all prescriptions are dispensed; therefore, this data may not correlate completely with PBS data.
Further information on the NPS MedicineWise MedicineInsight program can be found on the MedicineInsight website.
Report on government services 2015
Some data on AU in the AURA 2016 report has been taken from the Report on government services 2015. This report includes a volume on health, which includes data and analyses on prescribing of antimicrobials for upper respiratory tract infection using unpublished PBS data, and data from the Bettering the Evaluation and Care of Health (BEACH) program. PBS data is described above.
Further information on the Report on government services 2015 can be found on the Productivity Commission website.
Appendix 1: Data source description 188
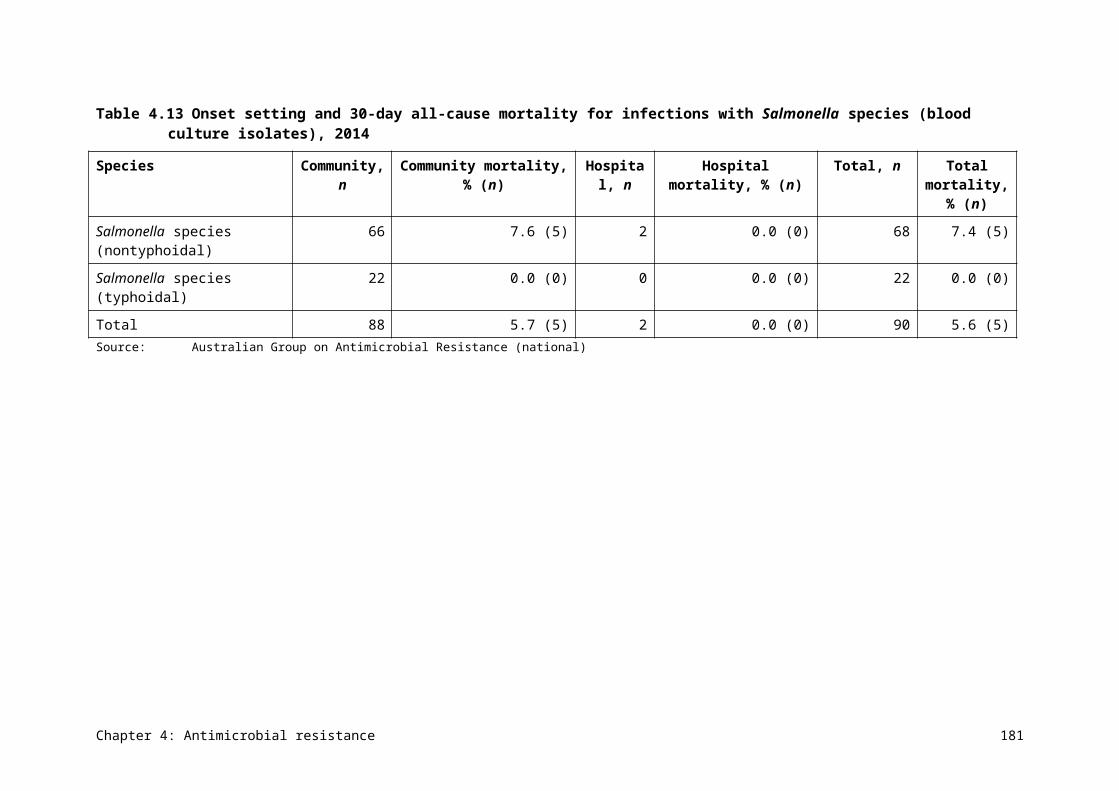
Bettering the Evaluation and Care of Health program
The BEACH program has been operated by the Family Medicine Research Centre at the University of Sydney since 1998. The program aims to collect a breadth of general practitioner–patient encounter information that can be used to inform policy and program development, as well as clinical practice.
The data collection is an ongoing process. A random sample of 1000 general practitioners each year complete a form for each of 100 consecutive patient encounters, describing the characteristics of the patient and activity during that encounter. Data collected on the form includes why the patient has sought medical care, diagnosis, problems managed, screening, medications prescribed, treatment and procedures, referrals, and tests ordered. The BEACH database holds data on approximately 1.7 million general practitioner–patient encounters, and national reports on BEACH data are published annually.
Considerations
Participation in the BEACH program is voluntary. Data is not necessarily representative of the prescribing behaviour of nonparticipating general practitioners.
Further information on the BEACH program can be found on the Family Medicine Research Centre website.
Aged Care National Antimicrobial Prescribing Survey
In 2015, NCAS developed and piloted a NAPS module for residential aged care facilities, called Aged Care NAPS (acNAPS). This module is based on the same survey approach as NAPS. Questions were modified to be more appropriate for residential aged care services, and used the McGeer infection criteria70 as a proxy for assessment of appropriateness.
The majority of auditors were infection control practitioners (57.5%) or nurses (35.6%), followed by pharmacists (11.0%). More than one-third (39%) of auditors were registered to conduct the survey across more than one facility.
Participants
A total of 186 facilities contributed data, with representation across all remoteness areas and provider types (not for profit, government owned and private) in the six states. Neither the Australian Capital Territory nor the Northern Territory participated in the pilot. The majority of facilities were government owned (75.8%).
A large proportion of participating facilities were based in Victoria (69.9%). Although the Commission partnered with NCAS to promote uptake of acNAPS across Australia, the Victorian network’s previous exposure to a similar Victoria-based point prevalence study resulted in greater participation from this state. The Commission will work with acNAPS to promote increased participation beyond the pilot.
Considerations
Following consultation with participants during the pilot stage, modifications have been undertaken to improve the tool.
Further information on NAPS can be found on the NAPS website.
Appendix 1: Data source description 189
A1.2 Antimicrobial resistance collections
This section provides information on the methods used by each of the data sources for AMR used in this report, including information on processes and limitations.
Australian Group on Antimicrobial Resistance
The Australian Group on Antimicrobial Resistance (AGAR) is a collaboration of clinicians and scientists, with involvement from microbiology laboratories in all Australian states and territories. AGAR has been in operation since 1985, with voluntary participation from key microbiology laboratories.
AGAR undertakes targeted surveillance of selected organisms with AMR. Data primarily comes from hospitals, but, more recently, capacity has developed to identify resistances present in community settings.
AGAR operates a series of survey programs each year across a range of selected organisms, gathering and reporting information on levels of AMR in species of clinical importance in isolates from blood cultures. This provides information on resistances in serious infections, and aligns with the European AMR surveillance system (EARS-Net).71 Microbiology laboratories provide laboratory and demographic data, and isolates to two central AGAR reference laboratories, which undertake molecular testing on selected isolates and prepare reports on the data for the following three programs:
• Enterobacteriaceae Sepsis Outcome Program (EnSOP)
• Staphylococcus aureus Sepsis Outcome Program (ASSOP)
• Australian Enterococcus Sepsis Outcome Program (AESOP).
In addition to data on resistances, most participants provide demographic and limited outcome data on each episode of bacteraemia.
Participants
In 2014, 27 laboratories participated in ASSOP, 26 laboratories participated in EnSOP and 27 laboratories participated in AESOP. For ASSOP and AESOP, this comprised 25 public and 2 private laboratories; for EnSOP, it comprised 24 public and 2 private laboratories.
Each of the three collections includes laboratories from all states and territories. There are varying numbers of laboratories in each jurisdiction, providing services for different types of hospitals.
Considerations
Issues that need to be considered when interpreting the AGAR data include the following:
• Data is not denominator controlled because there is no consensus on an appropriate denominator for these types of surveys.
• The surveys are voluntary. Institution size, throughput, patient complexity and local AU patterns contribute to the types of resistance likely to be observed.
• The program does not currently have capacity to obtain sufficient detailed clinical information to judge the clinical significance of resistance.
Appendix 1: Data source description 190
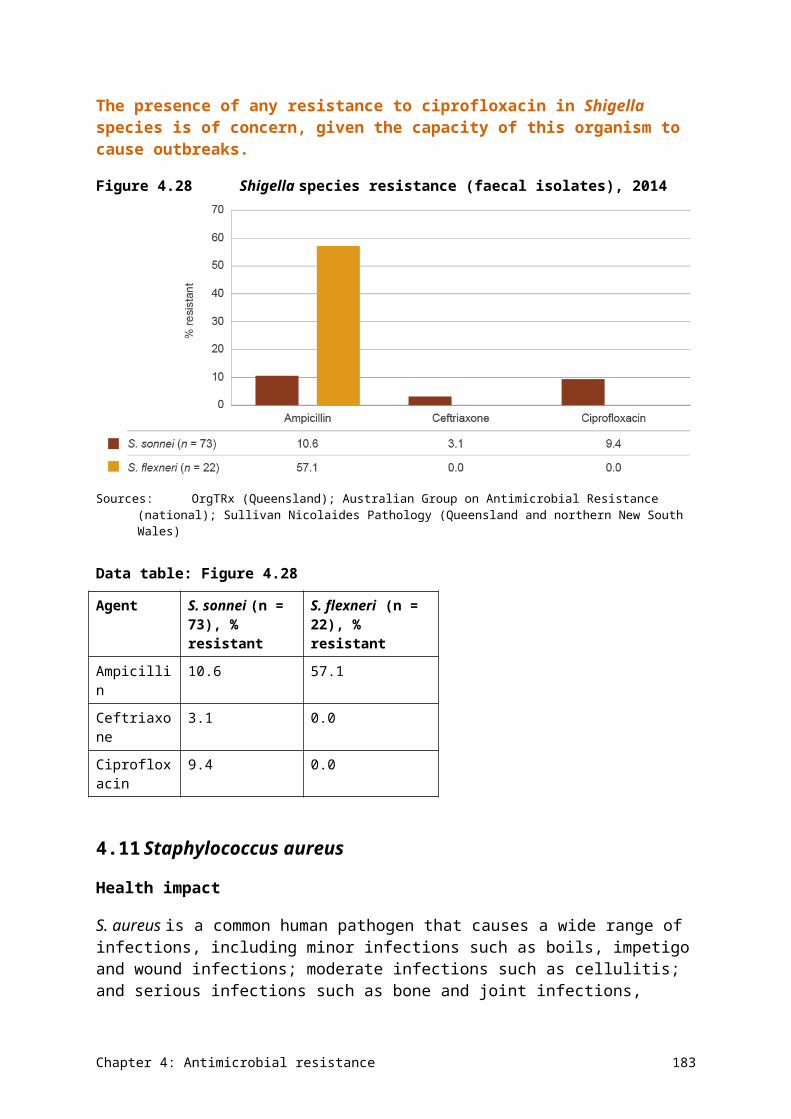
• The collection requires manual data entry, which can increase the chance of recording errors.
Further information on AGAR can be found on the AGAR website.
National Neisseria Network
The National Neisseria Network (NNN) is a collaborative association of 10 laboratories that contribute to passive laboratory surveillance of the pathogenic Neisseria species, N. gonorrhoeae and N. meningitidis. The NNN conducts two programs: the Australian Gonococcal Surveillance Programme (AGSP) and the Australian Meningococcal Surveillance Programme (AMSP).
Infections caused by N. gonorrhoeae and N. meningitidis are notifiable diseases under the National Notifiable Diseases Surveillance System (NNDSS). Through this system, notifications are made to state and territory health authorities under the provisions of the public health legislation in their jurisdiction. Computerised, de-identified unit records of notifications are supplied to the Australian Government Department of Health daily for collation, analysis and publication on the department’s website and in the quarterly journal Communicable Diseases Intelligence (see Appendix 3).
Australian Gonococcal Surveillance Programme
The AGSP has monitored AMR in clinical isolates of N. gonorrhoeae from public and private laboratories across all Australian states and territories since 1981. It is the longest-running national surveillance program for gonococcal AMR in the world.
The NNN laboratories report data on gonococcal susceptibility for an agreed core group of antimicrobial agents, on a quarterly basis, to the WHO Collaborating Centre for Sexually Transmitted Diseases. This laboratory is based in Sydney and produces an annual report, published in Communicable Diseases Intelligence. The antibacterials that are currently routinely surveyed are azithromycin, ceftriaxone, ciprofloxacin, penicillin and spectinomycin.
Although the majority of information gathered and reported by the AGSP is based on resistance surveillance of clinical samples, sentinel surveillance is also undertaken in a very limited number of settings in Australia. The sentinel surveillance activity involves patient follow-up and ‘test of cure’ cultures following treatment, particularly for oropharyngeal infections and in high-risk populations. This program is important in detecting treatment failure and informing therapeutic strategies.72
ConsiderationsLimitations of the AGSP data used for this report are largely process issues relating to data contributors not fully complying with data quality requirements. An additional possible technical limitation is that susceptibility testing can only be done on specimens sent for gonococcal culture, whereas most cases of gonococcal infection are confirmed based on specimens sent only for nucleic acid testing.
Australian Meningococcal Surveillance Programme
The AMSP, established in 1994,73 provides a national laboratory-based program for the examination of invasive meningococcal disease caused by N. meningitidis.
Appendix 1: Data source description 191
The AMSP collects data on the phenotypic (serogroup, serotype and subserotype) strains and antibacterial sensitivity of invasive meningococcal isolates,74 as well as nonculture-based laboratory testing (nucleic acid amplification assays and serological examination). The AMSP links the laboratory information with clinical information to provide a comprehensive epidemiological survey.75
The incidence of invasive meningococcal disease has significantly and sustainably decreased since 2004, following introduction to the National Immunisation Program in 2003 of a publicly funded serogroup C meningococcal conjugate vaccine. Despite this, invasive meningococcal disease remains a significant public health concern in Australia, and detailed analysis of locally circulating N. meningitidis strains continues to be a priority.76
ConsiderationsLimitations of the AMSP data used for this report are largely process issues relating to data contributors not fully complying with data quality requirements. An additional possible technical limitation is that a small proportion of cases of meningococcal infection are detected only using nucleic acid tests and remain culture negative. Therefore, susceptibility results are not available.
Further information on the NNN can be found on the NNN website.
National Notifiable Diseases Surveillance System
Australia has a well-established Mycobacterium tuberculosis surveillance program. Susceptibility testing is undertaken by the Australian Mycobacterium Reference Laboratory Network (AMRLN), and data on resistance is provided to the NNDSS for publication.
The AMRLN started M. tuberculosis reporting in 1986. It comprises five state-based Mycobacterium reference laboratories, which undertake testing for all states and territories. These laboratories use nucleic acid amplification tests to detect the presence of M. tuberculosis complex.
M. tuberculosis is notifiable under the NNDSS. Notifications are made to state and territory health authorities under the provisions of the public health legislation in their jurisdiction. Computerised, de-identified unit records of notifications are supplied to the Australian Government Department of Health daily for collation, analysis and publication on the department’s website and in the quarterly journal Communicable Diseases Intelligence (see Appendix 3).
Data on M. tuberculosis notifications and drug resistance has been publicly available since 1994. Since 2012, M. tuberculosis resistance has been reported, together with national notification data, in Communicable Diseases Intelligence. The data is also reported annually to the WHO global M. tuberculosis surveillance program.
Considerations
Limitations of the NNDSS data used for this report are largely process issues relating to data contributors not fully complying with data quality requirements. In addition, the contributing laboratories have not always used the same susceptibility testing methods, which affects the reliability of historical data.
Appendix 1: Data source description 192
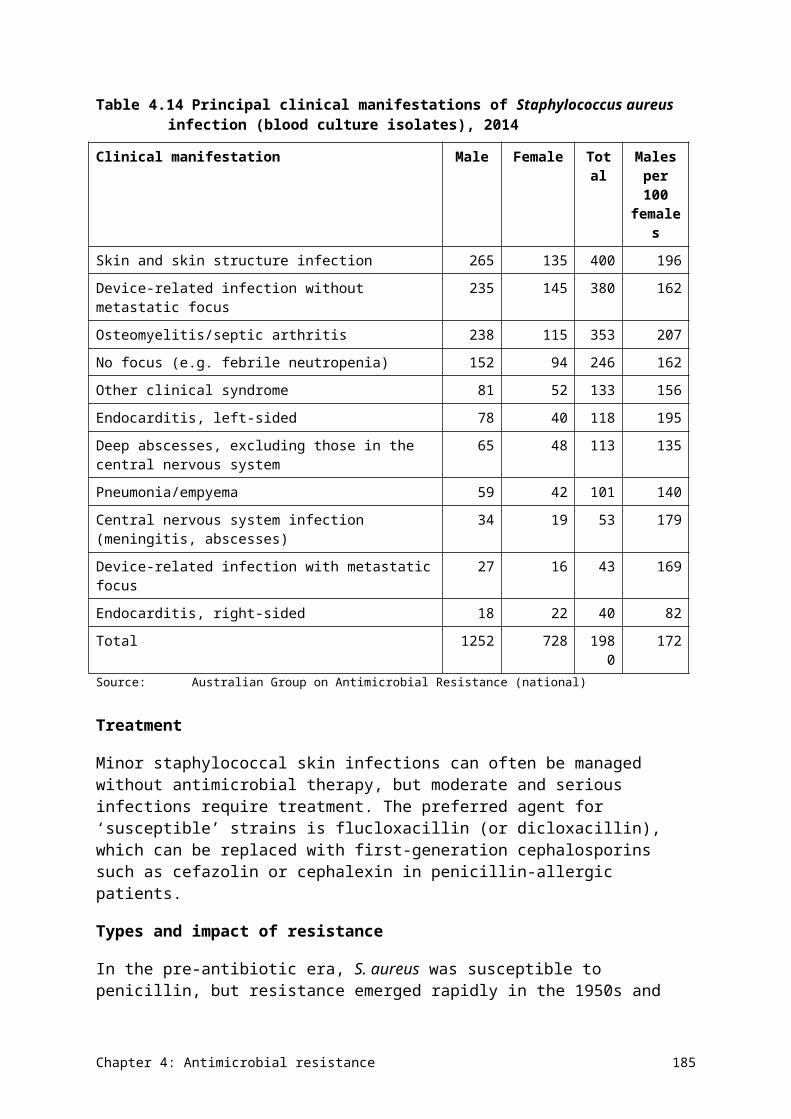
Further information on the NNDSS and the AMRLN can be found on the Department of Health website (NNDSS annual reports and a report from the AMRLN).
OrgTRx and Pathology Queensland
The OrgTRx program was developed by Pathology Queensland and the then Centre for Healthcare Related Infection Surveillance and Prevention. It began operation in 2010 and is currently managed by the Communicable Diseases Unit at the Queensland Department of Health, in consultation with Pathology Queensland.
Pathology Queensland provides a coordinated laboratory service for all public hospitals and clinics in Queensland, and provides the OrgTRx database with susceptibility data for all public patient samples. The Pathology Queensland data originates from the statewide laboratory information system, and is regularly transferred electronically to OrgTRx.
Within OrgTRx, a range of filtering and reporting mechanisms allow exclusion of more than one isolate of the same species from the same patient–site combination within a time period. The system also identifies unlikely results, for verification by the originating laboratory.
OrgTRx has the capacity to generate and report AMR data in the form of:
• longitudinal data sets for specified organism–antimicrobial combinations
• cumulative antibiograms showing rates of resistance for a range of organisms from a specified specimen type within a time period
• tabulations showing the resistance profiles of organism strains isolated during a time period.
OrgTRx has the ability to report on combinations of individual units within hospitals or health services, or at a statewide level.
Participants
OrgTRx data presented in the AURA 2016 report has been provided by the Queensland Health Communicable Diseases Unit and Pathology Queensland, and represents individual Queensland hospitals and health services.
The Commission is currently undertaking expansion of the OrgTRx system in the Australian Capital Territory. Detailed data preparatory work is also under way in New South Wales, Tasmania, the Northern Territory and Victoria, and the Queensland private sector.
Considerations
Some of the issues that need to be considered when interpreting the OrgTRx data include the following:
• Data provided through the OrgTRx system for this report includes Queensland-based public hospitals and health services. Some public laboratories undertake testing for private facilities and in the community. This is complemented by data from Sullivan Nicolaides Pathology (SNP), which has provided equivalent data for Queensland private hospitals, the community and residential aged care facilities.
• Not all antimicrobials are tested against all organisms – smaller laboratories may test more limited panels, and only test a greater number of antimicrobials for selected isolates.
Appendix 1: Data source description 193
Further information on OrgTRx can be found on the Queensland Health website.
Sullivan Nicolaides Pathology
SNP is one of the largest members of the Sonic Healthcare group. As part of its practice, SNP collects passive surveillance data on AMR identified through its laboratory network. Similar to OrgTRx, resistance data is held centrally, and a range of filtering and reporting mechanisms allow inclusion or exclusion of multiple isolates from the same patient–site combination within a time period.
Similar to OrgTRx, SNP has the capacity to generate and report AMR data in the form of:
• longitudinal data sets for specified organism–antimicrobial combinations
• cumulative antibiograms showing rates of resistance for a range of organisms from a specified specimen type within a time period
• tabulations showing the resistance profiles of organism strains isolated during a time period.
Participants
SNP data presented in this report is from SNP services provided to private hospitals, residential aged care facilities and general practices. This is the first time that information of this kind has been made available as part of a national report on AU and AMR.
Considerations
Some of the issues that need to be considered when interpreting the SNP data include the following:
• Data provided through SNP for this report is from Queensland and northern New South Wales–based private hospitals, residential aged care facilities and general practices only. This is balanced by data from the OrgTRx system, which has provided equivalent data for Queensland public hospitals and health services.
• Not all antimicrobials are tested against all organisms, as different laboratories may have their own protocols and undertake selective testing of antimicrobials.
Further information on SNP can be found on the SNP website.
Appendix 1: Data source description 194
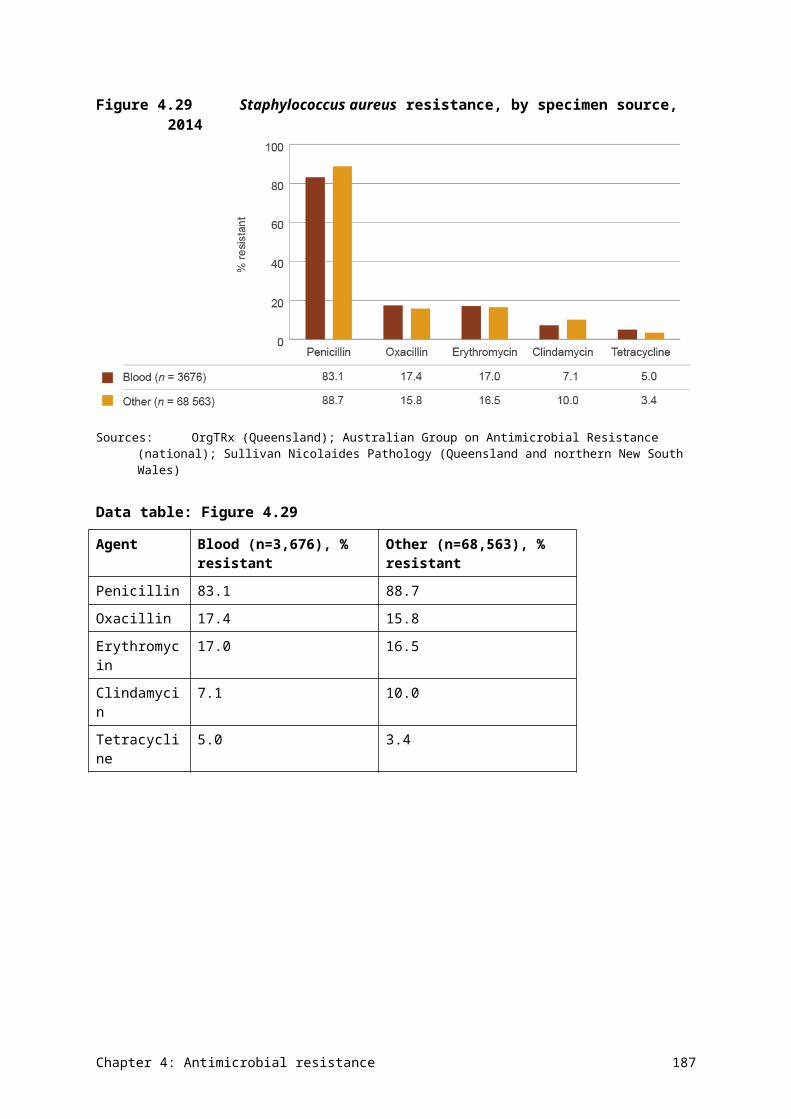
Appendix 2 Priority organisms
Table A2.1 Priority organisms and their associated antimicrobials for national reporting in targeted surveillance programs
Priority set 1: Organisms with high public health importance and/or common pathogens where the impact of resistance is substantial in both the hospital and community settings
Species Core reportable agents
Enterobacteriaceae (mainly Escherichia coli, Klebsiella species and Proteus mirabilis)
Ampicillin, piperacillin–tazobactam, cefazolin, ceftriaxone/cefotaxime, ciprofloxacin, gentamicin, meropenem
Enterococcus species Ampicillin, vancomycin, linezolid
Mycobacterium tuberculosis Isoniazid, ethambutol, pyrazinamide, rifampicin
Neisseria gonorrhoeae Benzylpenicillin, ceftriaxone/cefotaxime, ciprofloxacin
Neisseria meningitidis Benzylpenicillin, ceftriaxone/cefotaxime, ciprofloxacin, rifampicin
Salmonella species Ampicillin, azithromycin, ceftriaxone/cefotaxime, ciprofloxacin
Shigella species Ampicillin, ciprofloxacin, trimethoprim–sulfamethoxazole, azithromycin
Staphylococcus aureus Oxacillin (MRSA), cefoxitin (MRSA), ciprofloxacin, clindamycin (including inducible resistance), trimethoprim–sulfamethoxazole, erythromycin, gentamicin, tetracycline, vancomycin, linezolid (if tested), daptomycin (if tested)
Streptococcus pneumoniae Benzylpenicillin, ceftriaxone/cefotaxime, meropenemMRSA = methicillin-resistant Staphylococcus aureus
Priority set 2: Organisms where the impact of resistance is substantial in hospital settings
Species Core reportable agents
Acinetobacter baumannii complex Meropenem
Enterobacter cloacae complex or E. aerogenes
Ceftriaxone/cefotaxime, ciprofloxacin, gentamicin, meropenem
Pseudomonas aeruginosa Ceftazidime, ciprofloxacin, gentamicin/tobramycin, piperacillin–tazobactam
Priority set 3: Organisms where resistance is a marker of epidemiological resistance and/or use
Species Core reportable agents
Campylobacter jejuni or C. coli Ciprofloxacin
Appendix 2: Priority organisms 195
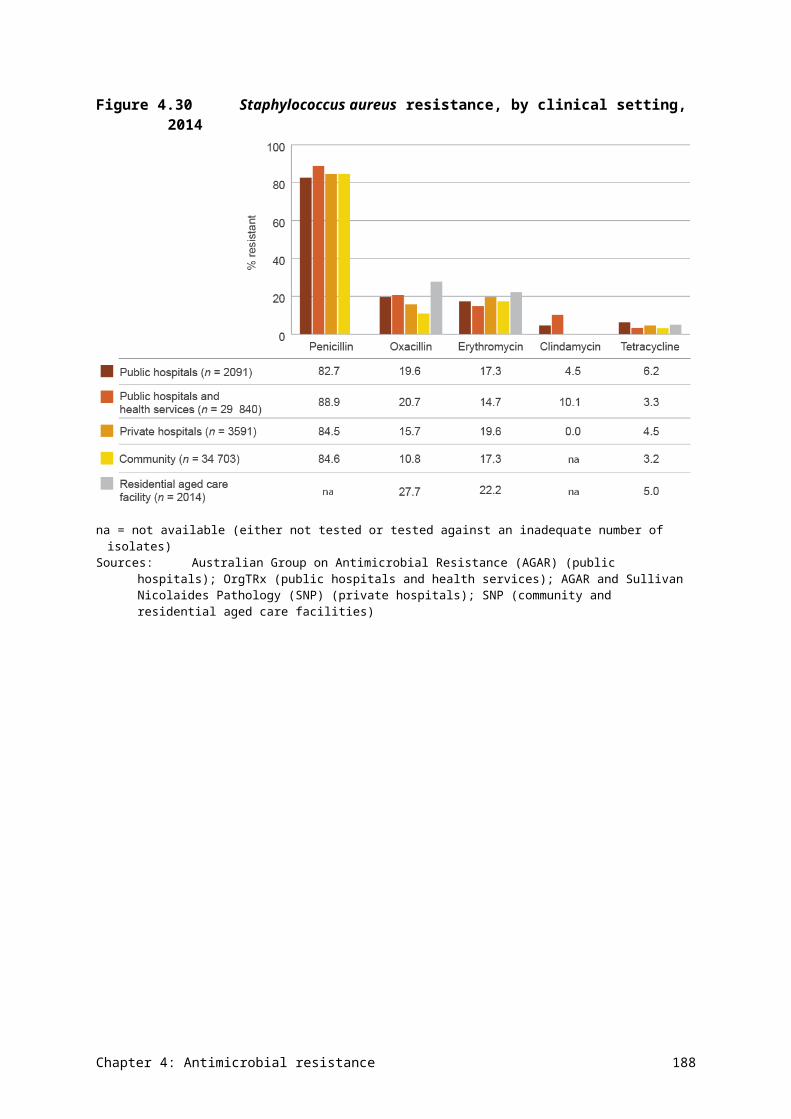
Priority set 4: Organisms where resistance will be monitored through passive surveillance, and will be prioritised for targeted surveillance if a signal emerges
Species Core reportable agents
Clostridium difficile Moxifloxacin
Haemophilus influenzae type b Ampicillin, ceftriaxone/cefotaxime, ciprofloxacin
Streptococcus agalactiae Benzylpenicillin, erythromycin, clindamycin
Streptococcus pyogenes Benzylpenicillin, erythromycin, clindamycin
Appendix 2: Priority organisms 196
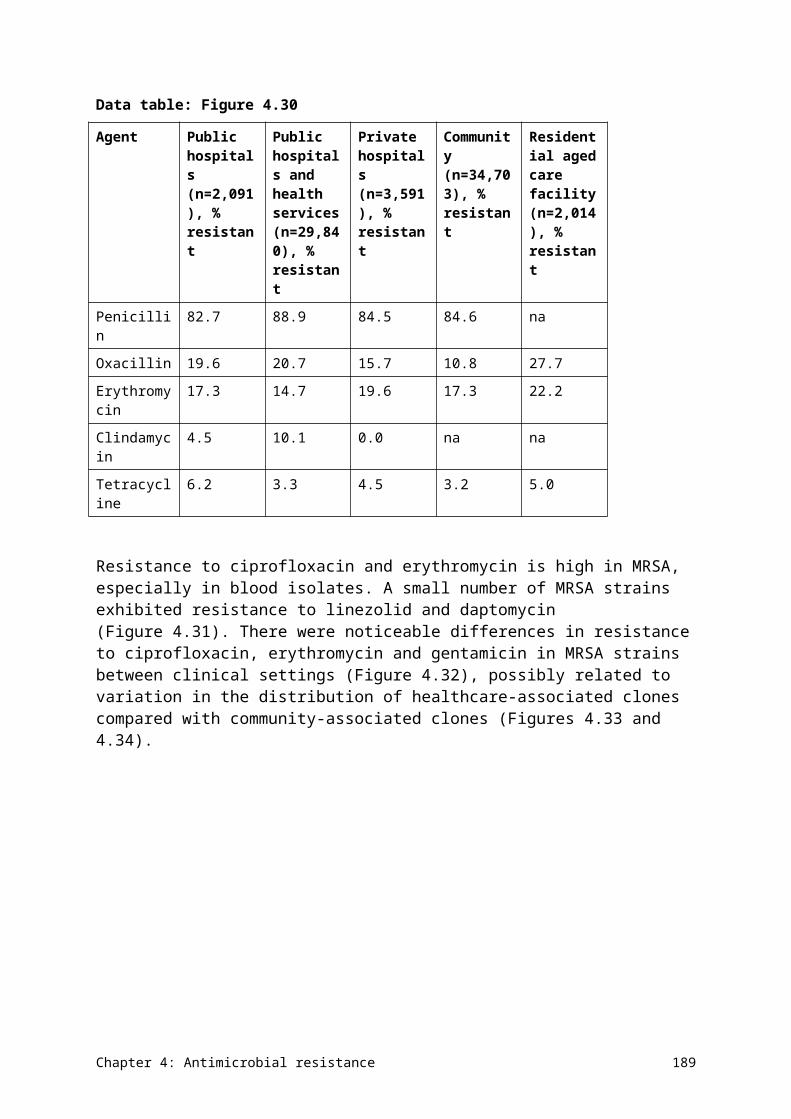
Appendix 3 Resources
A3.1 Australian reports and resources
Australian atlas of healthcare variation
Australian Gonococcal Surveillance Programme annual reports
Australian Group on Antimicrobial Resistance reports
Australian Meningococcal Surveillance Programme annual reports
Communicable Diseases Intelligence journal
National Antimicrobial Prescribing Survey 2014 report [PDF, 2 MB]
National Antimicrobial Resistance Strategy [PDF, 4.5 MB]
National Antimicrobial Utilisation Surveillance Program 2014 report [PDF, 4.7 MB]
National Neisseria Network
National Notifiable Diseases Surveillance System
Tuberculosis notifications in Australia annual reports
A3.2 International surveillance reports
CIPARS (Canada)
DANMAP (Denmark)
ESPAUR (England) [PDF, 2.8 MB]
NARMS (United States) [PDF, 10.3 MB]
NethMap (Netherlands) [PDF, 8.3 MB]
Organisation for Economic Co-operation and Development
SAPG (Scotland)
SWEDRES (Sweden) [PDF, 4.9 MB]
World Health Organization
Appendix 3: Resources 197
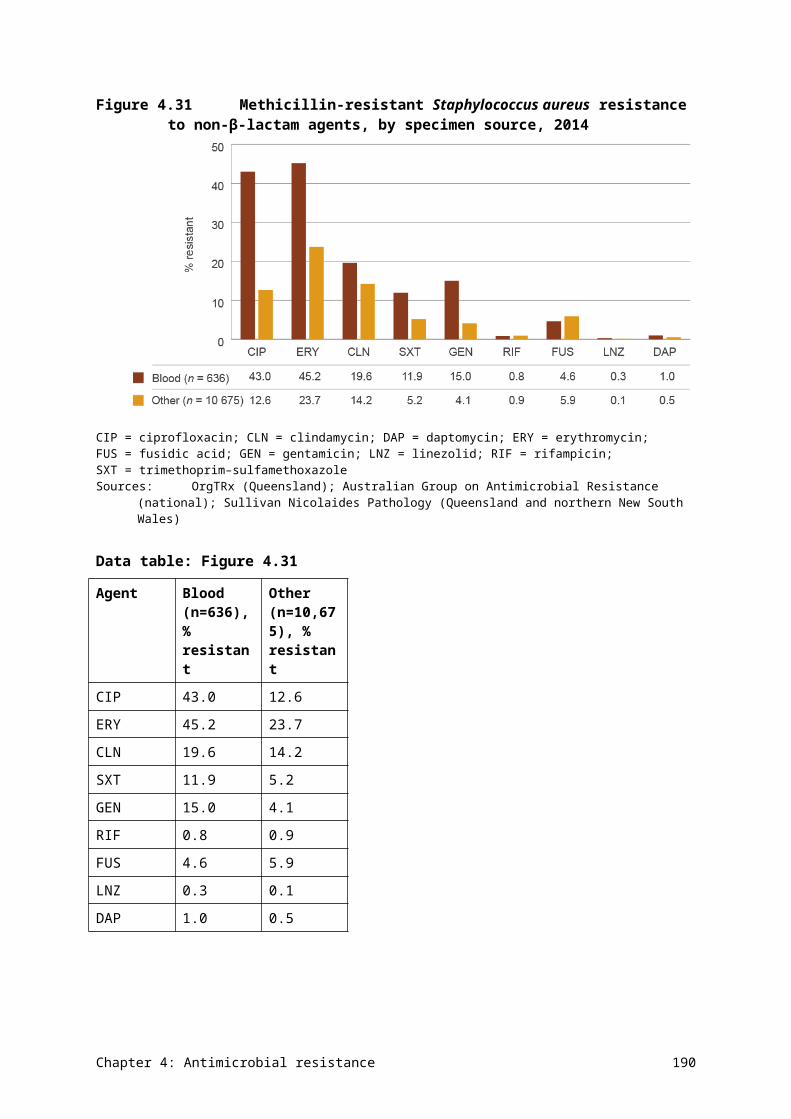
Appendix 4 Terminology
A4.1 Acronyms
Acronym Definition
acNAPS Aged Care National Antimicrobial Prescribing Survey
AGAR Australian Group on Antimicrobial Resistance
AHS Aboriginal health service
AIHW Australian Institute of Health and Welfare
AMR antimicrobial resistance
AMS antimicrobial stewardship
ATC Anatomical Therapeutic Chemical
AU antimicrobial use
AURA Antimicrobial Use and Resistance in Australia
CAR critical antimicrobial resistance
CPE carbapenemase-producing Enterobacteriaceae
DDD defined daily dose
ESAC European Surveillance of Antimicrobial Consumption
ESBL extended-spectrum β-lactamase
MDR-TB multidrug-resistant tuberculosis
MIC minimum inhibitory concentration
MRSA methicillin-resistant Staphylococcus aureus
NAPS National Antimicrobial Prescribing Survey
NAUSP National Antimicrobial Utilisation Surveillance Program
NCAS National Centre for Antimicrobial Stewardship
OBD occupied-bed day
PBS Pharmaceutical Benefits Scheme
RPBS Repatriation Pharmaceutical Benefits Scheme
WHO World Health Organization
XDR-TB extremely drug-resistant tuberculosis
Appendix 4: Terminology 198
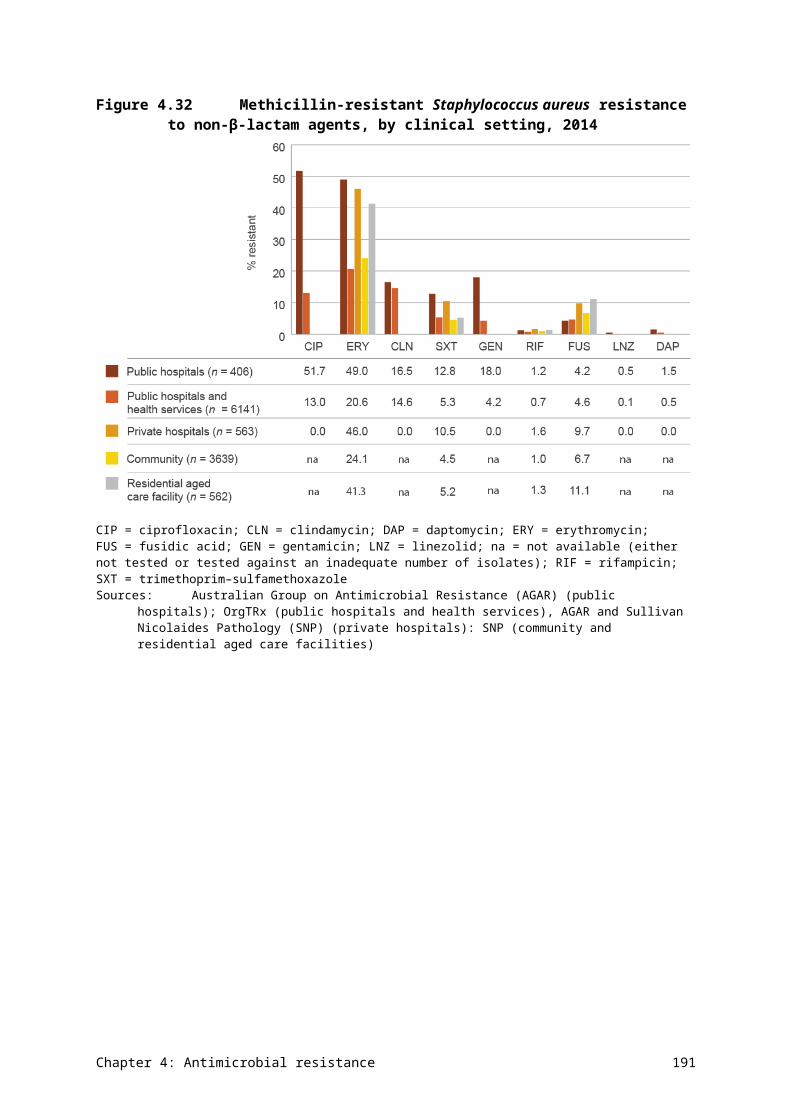
A4.2 Common terms
Appendix 4: Terminology 199
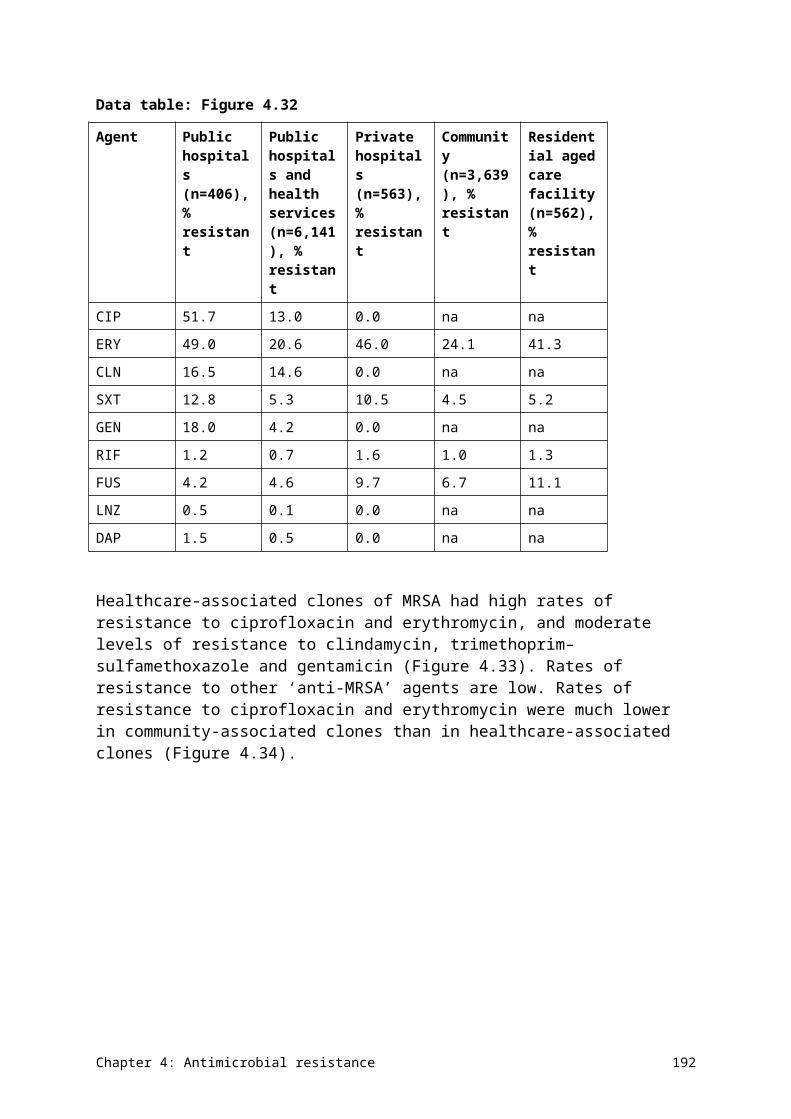
Term Definition
acquired resistance Reduction in susceptibility through the acquisition of genes encoding resistance from other bacteria, or through mutation.
antimicrobial A chemical substance that inhibits or destroys bacteria, parasites, viruses or fungi, and that can be safely administered to humans or animals. In this report:• ‘antimicrobial’ is used when it implies that data on all, or almost all, the
classes of agents has been captured in a surveillance program. Since this report is confined to systemic antibacterial agents, ‘antibacterial’ is used when referring to the output of analyses, and when comparisons are made with data reported by other countries
• ‘antimicrobial’ is used when broadly referring to agents used to treat or prevent infections caused by microbes. The term embraces antibacterial, antifungal, antiviral and antiparasitic agents.
antimicrobial resistance (AMR)
Failure of an antimicrobial to inhibit a microorganism at the antimicrobial concentrations usually achieved over time with standard dosing regimens.
antimicrobial stewardship (AMS)
An ongoing effort by a health service to reduce the risks associated with increasing antimicrobial resistance and to extend the effectiveness of antimicrobial treatments. It may incorporate a broad range of strategies, including monitoring and review of antimicrobial use.
broad-spectrum antimicrobials
A class of antimicrobials that affects many organisms.
community onset An organism that is acquired by a patient at least 48 hours before being admitted to a hospital, or specimens collected in the community, outpatient clinics or emergency departments.
community services Health services provided outside a hospital. In this report, the primary focus is on general practice and residential aged care facilities.
defined daily dose (DDD)
The average dose per day to treat the main indication for an average adult patient, as defined by the World Health Organization.
extended-spectrum β-lactamase
An enzyme that is produced by some gram-negative bacteria. These bacteria are usually found in the bowel and urinary tract, and are considered to be multidrug-resistant organisms because they are resistant to a large number of antimicrobials.
hospital All public, private, acute and psychiatric hospitals; free-standing day hospital facilities; and alcohol and drug treatment centres. Includes hospitals specialising in dentistry, ophthalmology and other acute medical or surgical care. May also include hospitals run by the Australian Defence Force and corrections authorities, and those in Australia’s offshore territories. Excludes outpatient clinics and emergency departments.
hospital onset An organism that is acquired by a patient at least 48 hours after being admitted to a hospital.
hospital peer group Grouping according to similarity to enable fair comparisons of performance across hospitals. A peer group can consist of hospitals of a similar size (major, large, medium or small) or geographical location. Hospital size is determined by the number of admissions and, in some cases, the number of emergency department presentations annually. Hospitals may move between peer groups due to changes in the nature of their activity.
intrinsic resistance Natural lack of susceptibility to the antimicrobial as used for treatment.
McGeer criteria A set of infection surveillance definitions for use in long-term care facilities.
Appendix 4: Terminology 200
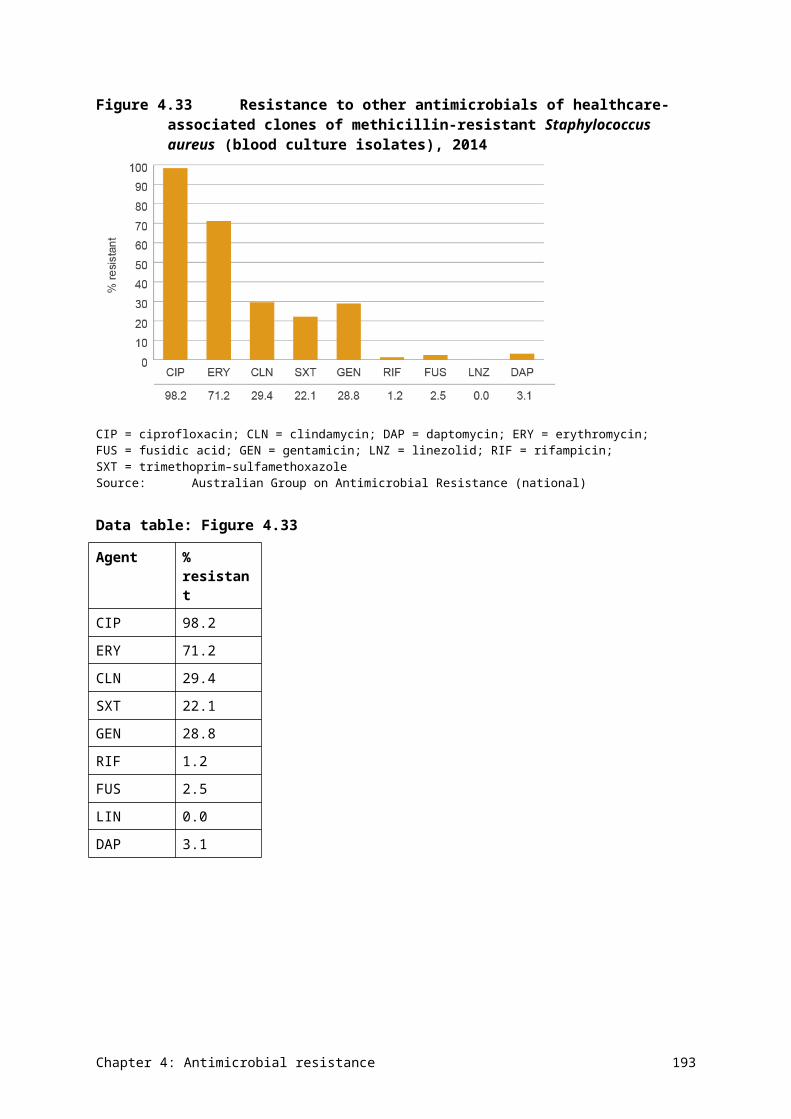
Term Definition
National Safety and Quality Health Service (NSQHS) Standards
Standards developed by the Australian Commission on Safety and Quality in Health Care to drive the implementation of safety and quality systems, and improve the quality of health care in Australia. The NSQHS Standards provide a nationally consistent statement about the level of care consumers can expect from health service organisations.
occupied-bed days (OBDs)
The total number of bed days of all admitted patients accommodated during the reporting period, taken from a count of the number of inpatients at about midnight each day.
passive surveillance Data collection designed for a broader purpose, but where a subset of the data can be used for secondary analysis. In this report, it refers to broader collections from which data on antimicrobial use and resistance can be extracted.
Pharmaceutical Benefits Scheme (PBS)
An Australian Government program that subsidises medicines.
principal referral hospital
Major city hospitals with more than 20 000 acute casemix-adjusted separations per year, and regional hospitals with more than 16 000 acute casemix-adjusted separations per year.
Repatriation Pharmaceutical Benefits Scheme (RPBS)
An Australian Government program that subsidises medicines for veterans.
targeted surveillance Data collection designed for a specific and targeted purpose. In this report, it refers to collections specifically designed for the surveillance of antimicrobial-resistant organisms.
therapeutic group or class
Categorisation of drugs that have similar chemical structure and spectrum.
topical (medication) A medication that is applied to body surfaces such as the skin or mucous membranes; includes creams, foams, gels, lotions and ointments.
Appendix 4: Terminology 201
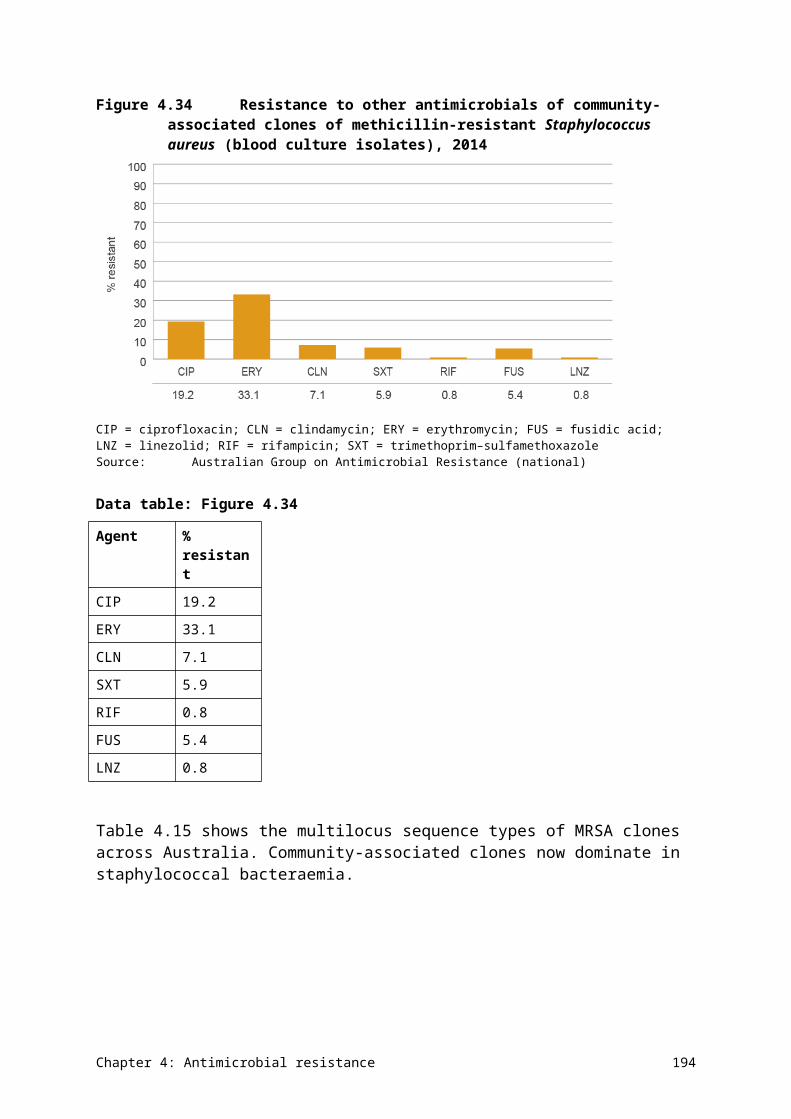
References
1. Australian Commission on Safety and Quality in Health Care. Australian one health antimicrobial resistance colloquium background paper. Sydney: ACSQHC, 2013.
2. Australian Government Department of Health. First National Antimicrobial Resistance Strategy 2015–19: responding to the threat of antimicrobial resistance. Canberra: DoH, 2015.
3. Frimodt-Møller N, Hammerum A, Bagger-Skjot L, et al. Global development of resistance – secondary publication. Danish Medical Bulletin. 2007; 54: 160–2.
4. Hunter P and Reeves D. The current status of surveillance of resistance to antimicrobial agents: report on a meeting. Journal of Antimicrobial Chemotherapy. 2002; 49: 17–23.
5. Kern W, de With K, Steib-Bauert M, et al. Antibiotic use in non-university regional acute care general hospitals in southwestern Germany; 2001–2002. Infection. 2005; 33: 333–9.
6. Smith R and Coast J. The economic burden of antimicrobial resistance: why is it more serious than current studies suggest. Technical report. London: London School of Hygiene and Tropical Medicine, 2012.
7. Howard DH, Scott RD, Packard R and Jones D. The global impact of drug resistance. Clinical Infectious Diseases. 2003; 36: S4–S10.
8. O'Neill J. Antimicrobial resistance: tackling a crisis for the health and wealth of nations. The Review on Antimicrobial Resistance. London: UK Government, 2014.
9. Cox R, Conquest C, Mallaghan C and Marples R. A major outbreak of methicillin-resistant Staphylococcus aureus caused by a new phage-type (EMRSA-16). Journal of Hospital Infection. 1995; 29: 87–106.
10. Australian Institute of Health and Welfare. Australia's health 2014. Australia's health series no. 14. Cat. no. AUS 178. Canberra: AIHW, 2014.
11. Healy J, Sharman E and Lokuge B. Australia: health system review [Health Systems in Transition]. European Observatory on Health Care Systems. Copenhagen: WHO Regional Office for Europe, 2006.
12. Shaban RZ, Cruickshank M, Christiansen K and Antimicrobial Resistance Standing Committee. National surveillance and reporting of antimicrobial resistance and antibiotic usage for human health in Australia. Canberra: Antimicrobial Resistance Standing Committee, Australian Heath Protection Principal Committee, 2013.
13. Duguid M and Cruickshank M. Antimicrobial stewardship in Australian hospitals. Sydney: Australian Commission on Safety and Quality in Health Care, 2010.
References 202
14. Australian Commission on Safety and Quality in Health Care. Antimicrobial prescribing practice in Australian hospitals: results of the 2014 National Antimicrobial Prescribing Survey. Sydney: ACSQHC, 2015.
15. Australian Commission on Safety and Quality in Health Care and SA Health. Antimicrobial use in hospitals: 2014 report of the National Antimicrobial Utilisation Surveillance Program. Sydney: ACSQHC, 2015.
16. Productivity Commission. Report on government services 2015. Canberra: Productivity Commission, 2015.
17. Australian Institute of Health and Welfare. Australian hospital peer groups. Cat. no. HSE170. Canberra: AIHW, 2015.
18. Antibiotic Expert Groups. Therapeutic guidelines: antibiotic, version 15. Melbourne: Therapeutic Guidelines Limited, 2014.
19. Suetens C, Hopkins S, Kolman J and Diaz Högberg L. Point prevalence survey of healthcare associated infections and antimicrobial use in European acute care hospitals. Stockholm: European Centre for Disease Prevention and Control, 2013.
20. Antibiotic Expert Group. Therapeutic guidelines: antibiotic, version 14. Melbourne: Therapeutic Guidelines Limited, 2010.
21. Spanos PA. Finding into death without inquest. Coroners Court of Victoria, 2012.
22. de With K, Bestehorn H, Steib-Bauert M and Kern W. Comparison of defined versus recommended versus prescribed daily doses for measuring hospital antibiotic consumption. Infection. 2009; 37: 349–52.
23. Muller A, Monnet DL, Talon D, Hénon T and Bertrand X. Discrepancies between prescribed daily doses and WHO defined daily doses of antibacterials at a university hospital. British Journal of Clinical Pharmacology. 2006; 61: 585–91.
24. Berrington A. Antimicrobial prescribing in hospitals: be careful what you measure. Journal of Antimicrobial Chemotherapy. 2010; 65: 163–8.
25. SA Health. Antimicrobial utilisation surveillance statistics. Accessed 17 December 2015.
26. Australian Commission on Safety and Quality in Health Care and National Health Performance Authority. Australian atlas of healthcare variation. Sydney: ACSQHC, 2015.
27. NPS MedicineWise. MedicineInsight – improved prescribing and medicine use for Australia. Accessed 8 December 2015.
28. Adriaenssens N, Coenen S, Tonkin-Crine S, Verheij TJ, Little P and Goossens H. European Surveillance of Antimicrobial Consumption (ESAC): disease-specific quality indicators for outpatient antibiotic prescribing. BMJ Quality & Safety. 2011; 20: 764–72.
References 203
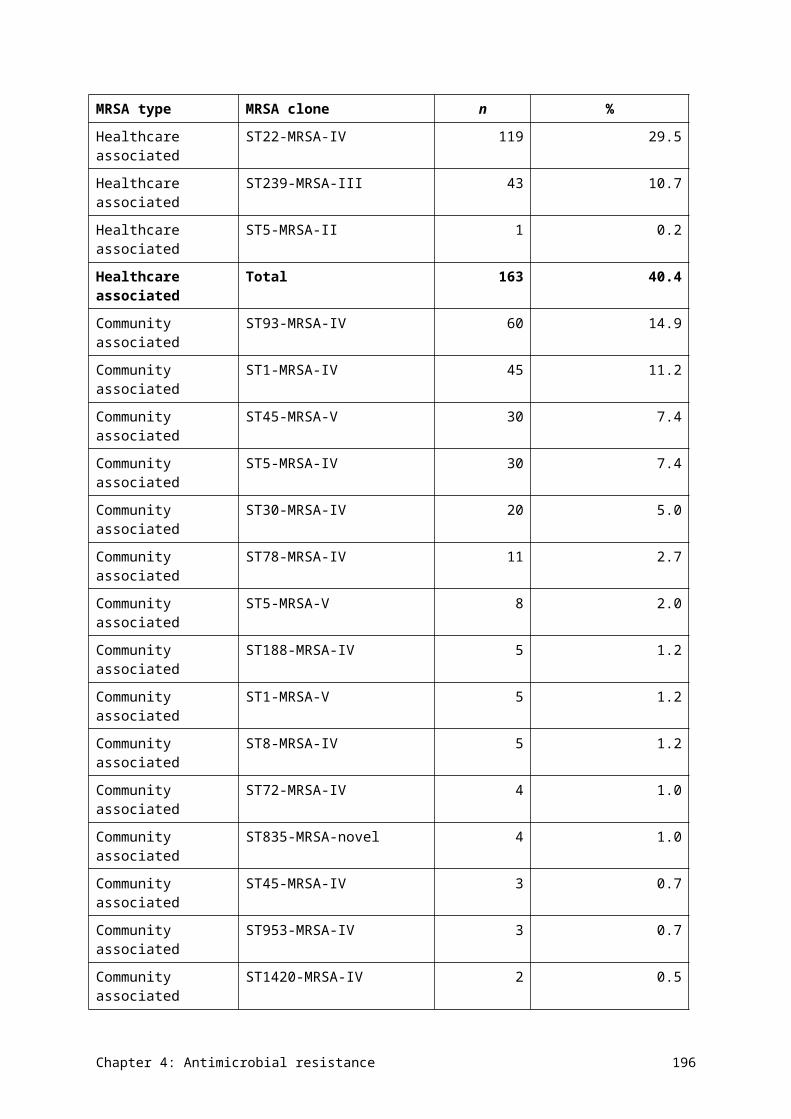
29. Therapeutic Goods Administration. Consultation: chloramphenicol, propamidine, dibromopropamidine and sulfacetamide for ophthalmic use: proposed advisory statements for medicines. Canberra: TGA, 2013.
30. Drug Utilisation Sub Committee. Antibiotics: Pharmaceutical Benefits Scheme/Repatriation Pharmaceutical Benefits Scheme utilisation: October 2014 and February 2015. Canberra: Australian Government Department of Health, 2015.
31. Australian Bureau of Statistics. Australian demographic statistics December 2014. Cat. no. 3101.0. Canberra: ABS.
32. NPS MedicineWise. MedicineInsight post market review report 3: antibiotics (unpublished). 2015.
33. European Centre for Disease Prevention and Control. European Surveillance of Antimicrobial Consumption Network. Accessed 16 December 2015.
34. NPS MedicineWise. MedicineInsight post market review report 4: antibiotics (unpublished). 2015.
35. Roughead L and Gadzhanova S. Analysis of 2014 PBS data for National Report on Antimicrobial Use and Resistance (unpublished). Australian Commission on Safety and Quality in Health Care.
36. Organisation for Economic Co-operation and Development. Health at a glance 2015. Paris: OECD Publishing, 2015.
37. NPS MedicineWise. Antibiotics. Accessed 18 December 2015.
38. NPS MedicineWise. 1 in 5 Australians expect antibiotics for coughs or colds: new NPS campaign. Accessed 4 December 2015.
39. Australian Commission on Safety and Quality in Health Care. Antimicrobial Stewardship Clinical Care Standard. Sydney: ACSQHC, 2014.
40. McGeer A, Campbell B, Emori TG, et al. Definitions of infection for surveillance in long-term care facilities. American Journal of Infection Control. 1991; 19: 1–7.
41. VICNISS Coordinating Centre. Aged Care Healthcare Associated Infection and Antimicrobial Use Point Prevalance Survey 2014 (Victoria). Melbourne: VICNISS Coordinating Centre, 2015.
42. Health Protection Scotland. Healthcare Associated Infections in European Long Term Care Facilities (HALT) Prevalence Study 2010 in Scotland. Glasgow: Health Protection Scotland, 2011.
43. Latour K, Jans B and HALT Management Team. Healthcare associated infections in long term care facilities: results of the pilot point prevalence survey. Brussels: Scientific Institute of Public Health, 2009.
References 204
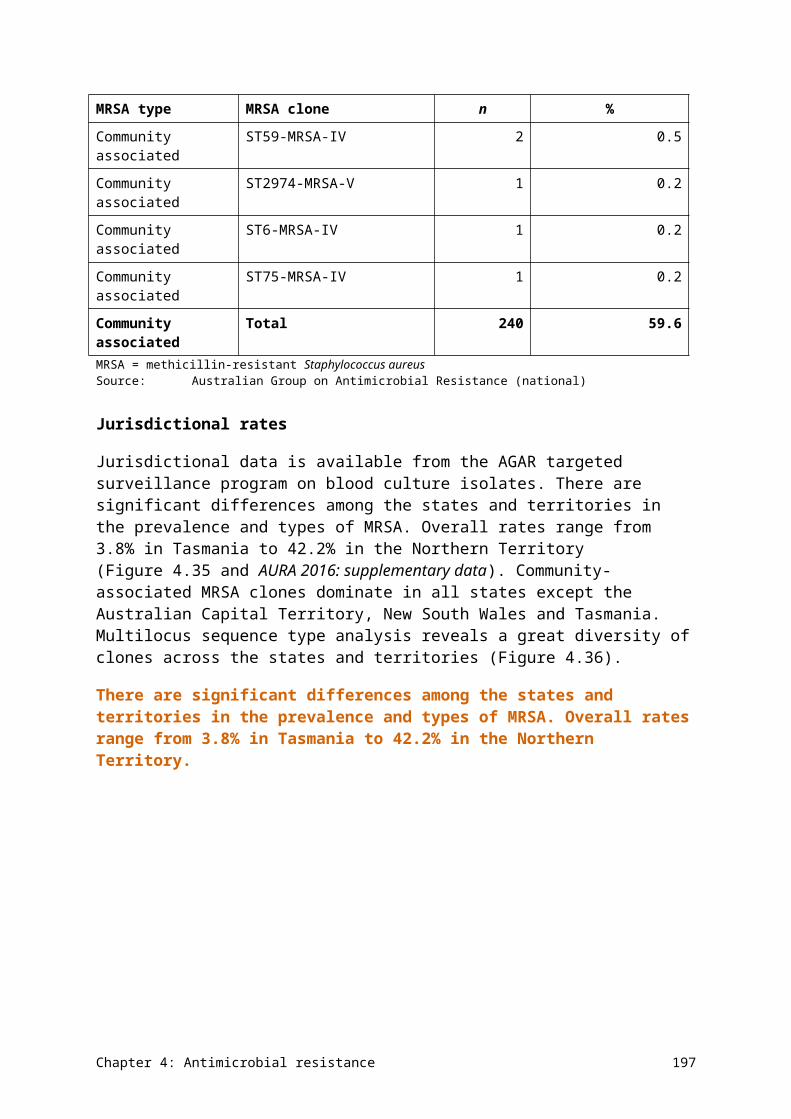
44. Mullings A, Murdoch F, MacKenzie A, Cairns S and Reilly J. Healthcare associated infection in care homes for older people in Scotland: results from a pilot survey. Journal of Infection Prevention. 2011; 12: 26–30.
45. Broex E, Jans B, Latour K, Goosens H and ESAC Management Team. Report on point prevalence survey of antimicrobial consumption in European nursing homes. Brussels: ESAC, 2009.
46. Cotter M, Donlon S, Roche F, Byrne H and Fitzpatrick F. Healthcare-associated infection in Irish long-term care facilities: results from the First National Prevalence Study. Journal of Hospital Infection. 2012; 80: 212–6.
47. Latour K, Catry B, Broex E, et al. Indications for antimicrobial prescribing in European nursing homes: results from a point prevalence survey. Pharmacoepidemiology and Drug Safety. 2012; 21: 937–44.
48. McClean P, Hughes C, Tunney M, et al. Antimicrobial prescribing in European nursing homes. Journal of Antimicrobial Chemotherapy. 2011; 66: 1609–16.
49. McClean P, Tunney M, Gilpin D, Parsons C and Hughes C. Antimicrobial prescribing in nursing homes in Northern Ireland. Drugs & Aging. 2011; 28: 819–29.
50. Nicolle LE, Bentley DW, Garibaldi R, Neuhaus EG and Smith PW. Antimicrobial use in long-term–care facilities. Infection Control & Hospital Epidemiology. 2000; 21: 537–45.
51. Warren JW, Palumbo FB, Fitterman L and Speedie SM. Incidence and characteristics of antibiotic use in aged nursing home patients. Journal of the American Geriatrics Society. 1991; 39: 963–72.
52. Zimmer JG, Bentley DW, Valenti WM and Watson NM. Systemic antibiotic use in nursing homes: a quality assessment. Journal of the American Geriatrics Society. 1986; 34: 703–10.
53. Andersen B, Ringertz S, Gullord TP, et al. A three-year survey of nosocomial and community-acquired infections, antibiotic treatment and re-hospitalization in a Norwegian health region. Journal of Hospital Infection. 2000; 44: 214–23.
54. Eilers R, Veldman-Ariesen M, Haenen A and Van Benthem B. Prevalence and determinants associated with healthcare-associated infections in long-term care facilities (HALT) in the Netherlands, May to June 2010. Eurosurveillance. 2012; 17: 20252.
55. Eriksen H, Iversen B and Aavitsland P. Prevalence of nosocomial infections and use of antibiotics in long-term care facilities in Norway, 2002 and 2003. Journal of Hospital Infection. 2004; 57: 316–20.
56. Garibaldi RA, Brodine S and Matsumiya S. Infections among patients in nursing homes: policies, prevalence, and problems. New England Journal of Medicine. 1981; 305: 731–5.
References 205
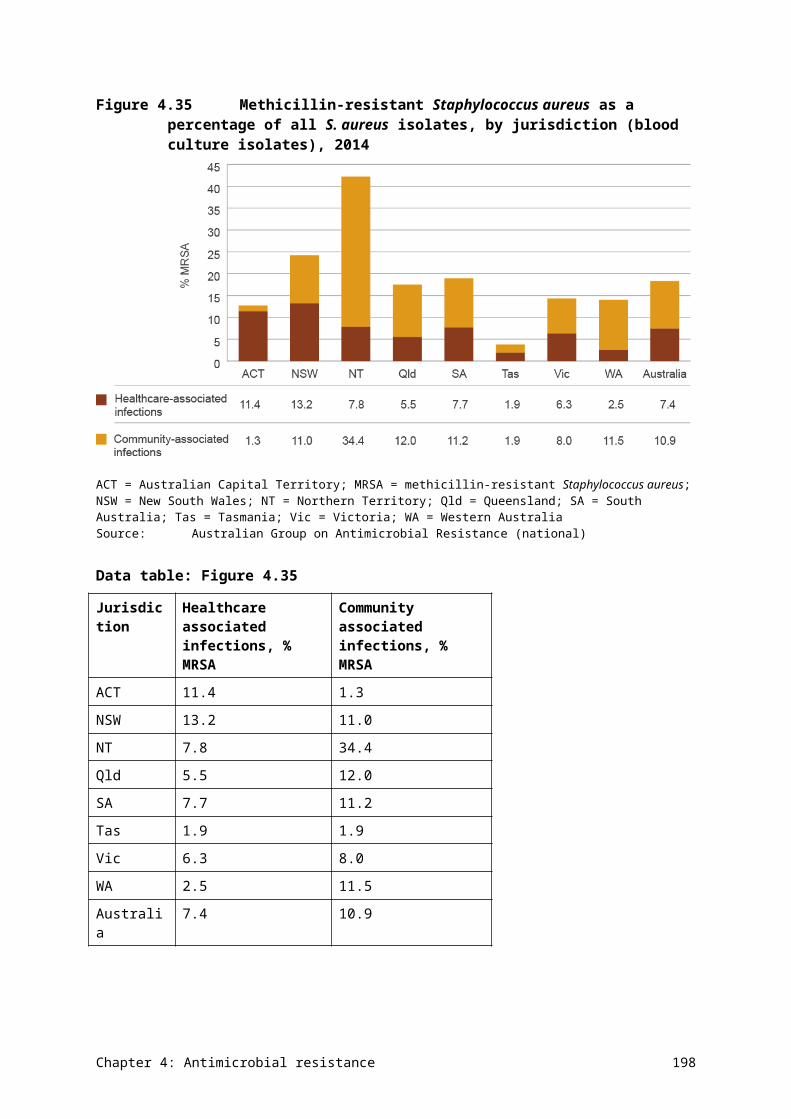
57. Heudorf U, Boehlcke K and Schade M. Healthcare-associated infections in long-term care facilities (HALT) in Frankfurt am Main, Germany, January to March 2011. Eurosurveillance. 2012; 17: 20256.
58. Marchi M, Grilli E, Mongardi M, Bedosti C, Nobilio L and Moro M. Prevalence of infections in long-term care facilities: how to read it? Infection. 2012; 40: 493–500.
59. Moro M, Mongardi M, Marchi M and Taroni F. Prevalence of long-term care acquired infections in nursing and residential homes in the Emilia-Romagna region. Infection. 2007; 35: 250–5.
60. Moro ML, Ricchizzi E, Morsillo F, et al. Infections and antimicrobial resistance in long term care facilities: a national prevalence study. Annali di igiene: medicina preventiva e di comunita. 2013; 25: 109–18.
61. Smith M, Atkins S, Worth L, Richards M and Bennett N. Infections and antimicrobial use in Australian residential aged care facilities: a comparison between local and international prevalence and practices. Australian Health Review. 2013; 37: 529–34.
62. Sader H, Farrell D, Flamm R and Jones R. Activity of ceftaroline and comparator agents tested against Staphylococcus aureus from patients with bloodstream infections in US medical centres (2009–13). Journal of Antimicrobial Chemotherapy. 2015; 70: 2053–6.
63. Australian Commission on Safety and Quality in Health Care. Information for clinicians: carbapenem resistant Enterobacteriaceae. Sydney: ACSQHC, 2013.
64. National Food Institute SSI. DANMAP 2013: use of antimicrobial agents and occurence of antimicrobial resistance in bacteria from food animals, food and humans in Denmark. Soborg/Copenhagen: Statens Serum Institute, National Vetinary Institute, National Food Institute, 2014.
65. de Greeff ISC and Mouton JW (eds). NethMap 2014: consumption of antimicrobial agents and anitimicrobial resistance among medically important bacteria in the Netherlands in 2013. Dutch Foundation of the Working Party on Antibiotic Policy (SWAB), 2014.
66. Tumbarello M, Trecarichi EM, Rosa FGD, et al. Infections caused by KPC-producing Klebsiella pneumoniae: differences in therapy and mortality in multicentre study. Journal of Antimicrobial Chemotherapy. 2015; 70: 2133–43.
67. Won SY, Munoz-Price LS, Lolans K, Hota B, Weinstein RA and Hayden MK. Emergence and rapid regional spread of Klebsiella pneumoniae carbapenemase–producing Enterobacteriaceae. Clinical Infectious Diseases. 2011; 53: 532–40.
68. Australian Government Department of Health. Australian statistics on medicines 2014. Canberra: DoH, 2015.
69. Dowden J. Is antibiotic use overestimated? Medical Observer. 9 April 2013.
References 206
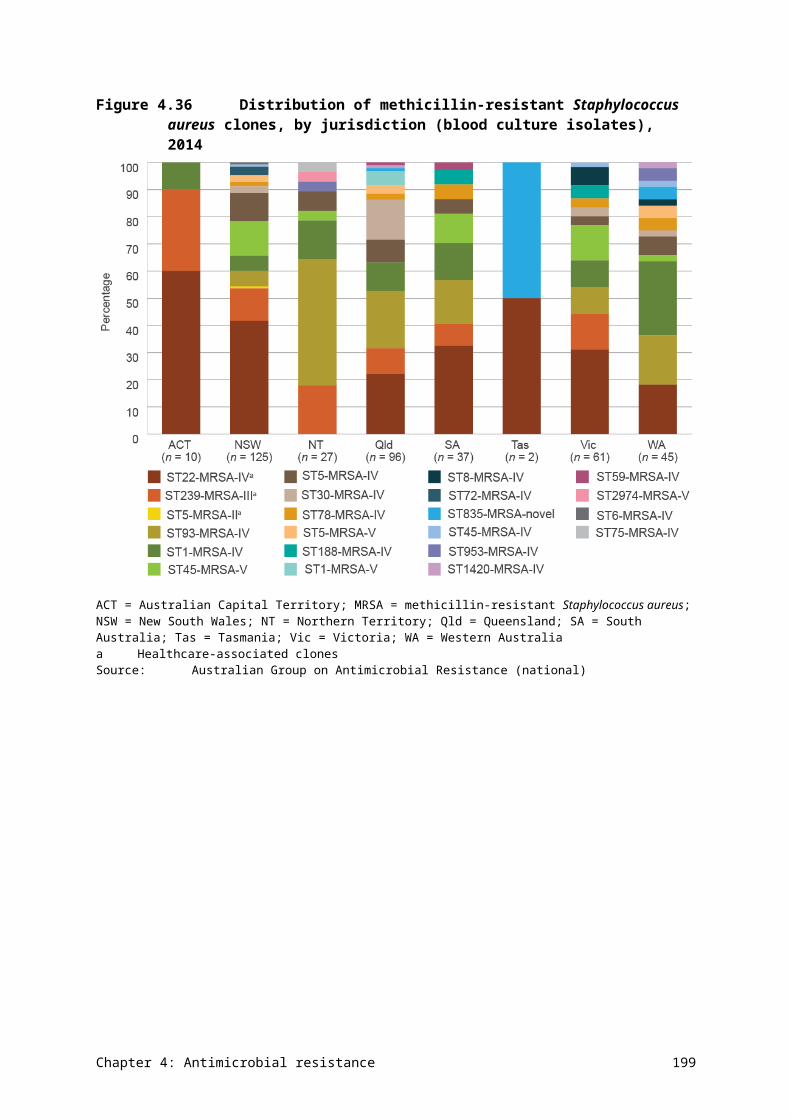
70. Stone ND, Ashraf MS, Calder J, et al. Surveillance definitions of infections in long-term care facilities: revisiting the McGeer criteria. Infection Control & Hospital Epidemiology. 2012; 33: 965–77.
71. Australian Group on Antimicrobial Resistance. AGAR: Australian Group on Antimicrobial Resistance. Accessed 12 June 2014.
72. Lahra MM and Australian Gonococcal Surveillance Programme. Annual report of the Australian Gonococcal Surveillance Programme, 2012. Communicable Diseases Intelligence. 2013; 37: 233–9.
73. National Neisseria Network. The National Neisseria Network 1979–200? Communicable Diseases Intelligence. 1979; 24: 190–3.
74. Australian Meningococcal Surveillance Programme. Annual report of the Australian Meningococcal Surveillance Program, 2009. Communicable Diseases Intelligence. 2010; 34: 291–302.
75. Australian Government Department of Health. System overview of communicable disease control in Australia 2012. Canberra: DoH, 2012.
76. Lahra MM and Enriquez RP. Annual report of the Australian Meningococcal Surveillance Programme, 2012. Communicable Diseases Intelligence. 2013; 37: E224–E32.
References 207