aus-tex exploration inc. for personal use · pdf fileaus-tex exploration inc. resource...
TRANSCRIPT

1 | P a g e
AUSTIN EXPLORATION LTD
Aus-Tex Exploration Inc.
Resource Evaluation Report
Prepared According To National Instrument 51-101
Birch Prospect Burleson County, Texas
EVALUATION REPORT
WILLIAM M. MITCHELL Registered Professional Geologist, State of Kentucky, #1426
RICHARD F. BRAUN Registered Member of Society of Petroleum Engineers, #3517494
July 6, 2011
For
per
sona
l use
onl
y

2 | P a g e
1 INTRODUCTION ............................................................................................................................................. 4
1.1. AUTHORIZATION .......................................................................................................................................... 4 1.2. INTENDED PURPOSE AND USERS OF THIS REPORT ....................................................................................... 4 1.3. OWNER CONTACT AND PROPERTY INSPECTION .......................................................................................... 4 1.4. SCOPE OF WORK ........................................................................................................................................... 4 1.5. APPLICABLE STANDARDS .............................................................................................................................. 4 1.6. ASSUMPTIONS AND LIMITING CONDITIONS ................................................................................................ 4 1.7. INDEPENDENCE / DISCLAIMER OF INTEREST ................................................................................................ 4
EXECUTIVE SUMMARY .......................................................................................................................................... 6
2 REQUIRED DISCLOSURES REGARDING PROSPECTS ...................................................................................... 13
2.1. OVERVIEW OF AUS-TEX EXPLORATION INC. EXPLORATION LEASE HOLDINGS, LOCATION, BASIN NAMES .................... 13 2.2. EXPIRY DATE OF INTEREST .......................................................................................................................... 13 2.3. DESCRIPTION OF TARGET ZONE - GEOLOGIC SETTING ............................................................................... 14 2.4. REGIONAL GEOLOGY ........................................................................................................................................ 14 2.5. BIRCH AREA ................................................................................................................................................... 23 2.6. DISTANCE TO THE NEAREST COMMERCIAL PRODUCTION ......................................................................... 23 2.7. BIRCH PROSPECT ............................................................................................................................................. 23 2.8. PRODUCT TYPES REASONABLY EXPECTED .................................................................................................. 25 2.9. RANGE OF POOL OR FIELD SIZES ................................................................................................................. 25 2.9.1. BIRCH PROSPECT ........................................................................................................................................ 25 2.10. DEPTH OF THE TARGET ZONE ..................................................................................................................... 27 2.11. ESTIMATED DRILLING AND COMPLETION COSTS ....................................................................................... 27 2.12. ESTIMATED TIMING OF COMPLETION ........................................................................................................ 27 2.13. ......................................................................................................................................................................... 27 2.14. EXPECTED PRICES ....................................................................................................................................... 27 2.15. EXPECTED MARKETING AND TRANSPORTATION ARRANGEMENTS............................................................ 27 2.16. RISKS AND PROBABILITY OF SUCCESS ......................................................................................................... 28
3 PROBABILISTIC RESOURCE ESTIMATES ........................................................................................................ 28
3.1. INPUT PARAMETERS ................................................................................................................................... 28 3.2. ASSUMPTIONS ............................................................................................................................................ 28
4 TYPE WELL ECONOMICS .............................................................................................................................. 31
4.1. SUMMARY FOR EAGLE FORD WELLS: ................................................................................................................. 31
5 FORM-51-101F2 ........................................................................................................................................... 57
6 CONSENT LETTER ......................................................................................................................................... 61
7 CERTIFICATE OF QUALIFICATION ............................................................................................................... 62
For
per
sona
l use
onl
y

3 | P a g e
Appendix 1 Selected H.H. Howell, Inc. Documents Appendix 2 Abbreviations, Conversions, and Definitions
Appendix 3 Data on Eagle Ford Shale Play obtained from Texas RR Commission Appendix 4 Eagle Ford Production plots from H.H. Howell, Inc Appendix 5 Resume of William M. Mitchell Appendix 6 Resume of Richard F. Braun
For
per
sona
l use
onl
y

4 | P a g e
1 INTRODUCTION 1.1. AUTHORIZATION This report was authorized by Aus-Tex Exploration Inc. to provide an independent estimate of the value of the Aus-Tex Exploration Inc. lease interests located in Burleson County, Texas. This evaluation is based on information either provided by Aus-Tex Exploration Inc., H.H. Howell Inc., or acquired from the Texas Railroad Commission, the Texas Bureau of Economic Geology and other published sources. Aus-Tex Exploration Inc. is currently engaged in acquiring leasehold interests within the Eagle Ford Shale play in Burleson County, Texas.
1.2. INTENDED PURPOSE AND USERS OF THIS REPORT This Report is to assess the value of the Texas properties and potential for the 2011 / 2012 well drilling program based on application of current geologic, engineering and operational technology and practices.
1.3. OWNER CONTACT AND PROPERTY INSPECTION The consultants have had frequent contact with the Client including contact up to the date of this report. Mr. Braun has personally inspected the subject properties in the Birch, Texas area.
1.4. SCOPE OF WORK
This Report is intended to describe and quantify the potential value and oil resources contained within the Birch Prospect, Burleson County, Texas, USA.
1.5. APPLICABLE STANDARDS
This Report has been prepared in accordance with Canadian National Instrument 51-101. The National Instrument requires disclosure of specific aspects of the prospects.
1.6. ASSUMPTIONS AND LIMITING CONDITIONS
Aus-Tex Exploration Inc. has negotiated attractive terms for acquiring their interest in the Birch Prospect. Aus-Tex Exploration Inc. will have a majority working (93.5% WI/70.125NRI) interest in the Birch Prospect. This Report is limited to a report on the value and potential of oil resources of the property. The accuracy of any estimate is a function of time, data, geological information, engineering and commercial interpretation and judgment.
1.7. INDEPENDENCE / DISCLAIMER OF INTEREST
The consultants have acted independently in the preparation of this Report. The consultants have no direct or indirect ownership in the property appraised or the area of study described. Mr. William M.
For
per
sona
l use
onl
y

5 | P a g e
Mitchell and Mr. Richard F. Braun are signing off on this report which they have prepared as qualified persons. The consultants’ fee for this report and the other services that may be provided are not dependent on the amount of resources estimated.
For
per
sona
l use
onl
y

6 | P a g e
EXECUTIVE SUMMARY In 2011 Aus-Tex Exploration Inc. acquired working interest in 915.9353 Acres of oil and gas leases
located in the Birch area of Burleson County, Texas and is in the process of acquiring 4085 additional
acres for a total of approximately 5000 acres by July 31, 2011. Birch is located approximately half way
between Houston and Austin Texas. The Birch Prospect is divided into three units, Krueger, Stern, and
Tschoerner. There are multiple formations with potential for commercial production of hydrocarbons.
These are the Taylor, Austin Chalk, Eagle Ford, Buda and Georgetown formations. The primary targets
are the Eagle Ford and the Austin Chalk. The Taylor, Buda and Georgetown are productive in other parts
of the State and represent tertiary targets in the Birch Prospect area. The Eagle Ford formation is one of
the most prolific oil/natural gas/liquid fields in the U.S. Estimates indicate it holds 5,000 to 15,000
barrels of oil equivalents per acre in some areas. The Eagle Ford trends North East from South West
Texas well beyond the Birch area and has been a known hydrocarbon bearing formation for nearly 100
years. The development of the Eagle Ford is coincidental with the recent innovations in horizontal
drilling and fracturing technology. Much of the past drilling and completion work did not have the
advantage of new horizontal drilling and fracing technology and in some instances outdated stimulation
techniques were used, resulting in an underdevelopment of the formation. The Eagle Ford is currently
under development throughout its length by both major and independent oil companies. Four of the
biggest leaseholders in the Eagle Ford shale play are Chesapeake Energy Corp. (CHK), EOG Resources Inc.
(EOG), Apache Corp. (APA) , and EV Energy Partners LP (EVEP). Similar improvements in technology
make the Austin Chalk formation attractive for development through the potential for infill drilling.
The Eagle Ford is pervasive throughout the Birch area as demonstrated by the cross sections presented
below and in the appendix (Appendix 1, page 69 and 70). The risk of a dry hole is virtually non- existent.
The Eagle Ford and Austin Chalk represent roughly equivalent potential reservoirs. Risk is related to the
effectiveness of completion techniques. The available data supports a conclusion that the Eagle Ford
Shale and Austin Chalk throughout the extent of the geographic region in which the Birch Prospect exists
can be very prolific hydrocarbon producing zones.
Evidence of hydrocarbon potential in Burleson County has been found on multiple wells within the
county limits, the key for economic success relies on efficient horizontal drilling and state of the art
stimulation techniques for shale reservoirs. Successful economic hydrocarbon recoveries have been
found in wells in Burleson County such as the Smalley-Robinson Unit #1, operated by Clayton Williams
Energy having an initial production rate of 492 barrels of oil per day. Another relevant well is the Fojtik
For
per
sona
l use
onl
y

7 | P a g e
Unit 1, drilled in the 1980’s, obtaining an IP of 267 BOPD. Below, more information on how
performance of wells located within, around or far from the Birch prospect.
“A-A’” line can be seen at page (appendix 1, page 70 & 71) of appendix and it represents wells that are
located west-east across the prospect. These wells produced from the Austin Chalk formation have an
average initial production of approximately 280 BOPD.
Figure 1 Birch Prospect A-A’ line-Production Data
Similarly, B-B’ was generated with wells within Burleson County, and the only one within the Birch
Prospect is the Knesek, J., having an IP of 394 BOPD. Going South-West towards the North East the rest
of the wells are located between 10 and 20 miles away from the prospect, these wells have an average
IP of 283 BOPD. It must be stated that Aus-Tex analysis took into to account wells that had an average
performance in order to sustain economic scenario. This is due to the fact of the uncertainties seen on
how to develop an unconventional reservoir, in our case the Eagle Ford Shale.
For
per
sona
l use
onl
y

8 | P a g e
Figure 2 Birch Prospect B-B’ line-Production Data
Similarities have been seen in logs, (check appendix 1, pg 73, type log slide between Riedel Well at
Gonzales County) from wells in the Birch Prospect with wells drilled in Gonzales County, located South
West of the prospect. The Gonzales County field has seen successful production rates from the Eagle
Ford formation as seen in the following table.
Figure 3 Birch Prospect Z-Z’ line-Production Data
Aus Tex plans to drill a vertical well through the Eagle Ford, thoroughly analyze the data gained from the
vertical well and based on the vertical well data make a decision concerning horizontal completion. This
procedure will be followed on each unit. It cannot be determined whether the Eagle Ford or Austin
Chalk will be the most productive formation prior to drilling the vertical well. It is entirely possible both
will be attractive candidates for horizontal completions. The evaluations in this report assume the
vertical well data evaluation will demonstrate the presence of reservoir characteristics and hydrocarbon
Birch ProspectZ-Z’ Strike line Production Summary
Average Initial production of 211 BOPDEagle Ford production 575 BOPD, a vertical well
STRIKE
LINE Cum Cum
BOPD MCFGPD BWPD Gas (MCF) Oil (BO)
Z RIEDEL, B.J. 575 661 0 Eagle Ford 10957 196678
Z MAGEE, M. 50 15 21 Austin Chalk 20 627
Z' BRELSFORD, H.J. 8 1 6 Austin Chalk 8 417
Initial ProductionWell Name Formation
For
per
sona
l use
onl
y

9 | P a g e
content sufficient to achieve the expected results from the investment in horizontal completion before
such completions are attempted.
The economics in this evaluation reflect well cost estimates prepared by Aus Tex Exploration and Alamo
Operating Company. These estimates are considered quite conservative. We believe that careful cost
control by Alamo and Aus Tex may materially reduce the drilling and completion costs. A reduction in
drilling and completion costs will favorably impact the well economics.
The history of wells drilled within and around the Birch Prospect dates to the late 1970’s and 1980’s.
This history indicates three things. One, the completion technologies were not as efficient as the
current completion technologies. Two, due to low production rates (and also oil prices) for the time the
Austin Chalk formation lost allure generating a lack of interest in development. Three, in the 1980’s
shale type reservoirs were not considered economically viable. Taking those three matters into account
and adding current technological development, the Eagle Ford shale is an attractive element of the Birch
Prospect. The Austin Chalk also shows potential due to remaining oil pockets not developed in the past.
The Buda, Georgetown and Taylor formations also give potential to the project.
F
or p
erso
nal u
se o
nly

10 | P a g e
Within the Birch prospect acreage no Eagle Ford Wells have been perforated, so no production data is available. What is seen is correlation on logs throughout the Birch Prospect units. The wells that were drilled through the Eagle Ford saw oil kicks that suggest that the Eagle Ford has oil potential within the acreage. We as independent analysts believe all well data should be taken into account in case some of the new technology does not work and therefore we came up with a more conservative analysis which is reflected in the following: To fully assess this project we have studied two cases the 1st limits the data to that available from the lease units. This is primarily data from Austin Chalk wells, the 2nd case takes available data from all wells drilled in Burleson County. Both data sets yield favorable economics for the project. Summary for Eagle Ford Wells:
Table 1 All Burleson County Well Data Economics
Table 2 Burleson County Production Economics (Excluding probable dry hole equivalence)
Table 3 Wells drilled within Birch Unit only
Pessimistic Base Optimistic
$327,333.84 $1,853,748.32 $3,380,162.79
7% 18% 28%
$848,203.31 $2,480,732.16 $4,113,261.01
Aus Tex NPV 4%
100% Net Present Value (NPV) @4%
Eagle Ford Horizontal Well
IRR
Pessimistic Base Optimistic
$2,615,829.50 $4,438,167.46 $6,260,505.43
29% 44% 58%
$3,295,792.24 $5,244,816.80 $7,193,841.37
Aus Tex NPV 4%
100% Net Present Value (NPV) @4%
Eagle Ford Horizontal Well
IRR
Pessimistic Base Optimistic
$4,057,014.54 $5,574,523.11 $7,092,031.68
25% 34% 42%
$4,837,166.62 $6,460,170.44 $8,083,174.26
Aus Tex NPV 4%
100% Net Present Value (NPV) @4%
Eagle Ford Horizontal Well
IRR
For
per
sona
l use
onl
y

11 | P a g e
Summary for Austin Chalk Wells
Table 4 All Burleson County Well Data Economics
For details see tables pages 32 – 56. Under the acquisition agreement Aus-Tex Exploration Inc. will drill three wells. The initial well will test the Eagle Ford shale formation on the Krueger Unit. Vertical depth of the initial well will be approximately 8500 feet. If data derived from the initial vertical well warrants, a 5,000 foot horizontal leg will be drilled and completed with 10 frac stages. The term of each of the lease tracts is 2 years. The acquisition agreement requires a well to be drilled on each of the three tracts by January till March of 2013. The two additional wells, one on each of the additional tracts, will be drilled to the Eagle Ford if it proves to be commercially viable. If the Eagle Ford proves to be not commercially viable the subsequent wells will be drilled to test one or more of the other potential formations based on findings from the first well. Alamo Operating Inc., an experienced operator, with offices in San Antonio Texas, will be the contract operator for the Birch Prospect. The Birch Prospect was acquired from H.H. Howell of San Antonio, Texas. Initially Howell was to receive a 15% carried working interest through the tanks. Aus Tex negotiated an 8.5% reduction in Howell’s carried working interest to 6.5%. Aus-Tex Exploration Inc. authorized this investigation to establish an independent evaluation of the Burleson County, Texas holdings of Aus-Tex Exploration Inc. and to derive a creditable estimate of resources. The primary focus of this report is on the value of the property and reasonable estimate of the production to be realized from a planned three well drilling program. A minimum of three vertical wells are contractually required. (Cost per well $1,650,000.00, total $4,950,000.00) The vertical well data justifies the wells will subsequently be drilled horizontally. Economics have been based on horizontal wells. Aus-Tex Exploration Inc. has invested a total of $ 366,345 in the Birch Prospect located in Burleson County, Texas. Additional costs will be incurred to acquire an estimated 4100 additional acres in Burleson County at a cost of approximately $400.00 per Acre. In addition Aus Tex is obligated to drill three wells. The investment is broken down as follows:
Pessimistic Base Optimistic
$10,075,862.80 $11,977,535.52 $13,879,208.24
90% 107% 123%
$11,079,122.98 $13,112,997.54 $15,146,872.11100% Net Present Value (NPV) @4%
Austin Chalk Horizontal Well
Aus Tex NPV 4%
IRR
For
per
sona
l use
onl
y

12 | P a g e
Acquisition Three Tracts ------------------------------------------------------------------------------------------ $ 366,345 Drill Three Horizontal Eagle Ford Wells ($6,868,000 Per Well) -- -------------- $17,270,250 (with 8.5% carry) Acquire additional Leases (4100 Acres @$400 Per Acre) ----------------------------------------------- $1,640,000 Total ------------------------------------------------------------------------$19,276,595 Production from wells producing from the same formation can vary significantly from well to well. Exact volumes for a given well cannot be predicted because of geologic variation and inconsistencies. Volumes typically vary from very low to quite significant. For this type of report a typical average volume is used. Actual results of the three well drilling program may vary significantly. In actual practice, not all wells will be producers.
For
per
sona
l use
onl
y

13 | P a g e
2 REQUIRED DISCLOSURES REGARDING PROSPECTS
2.1. OVERVIEW OF AUS-TEX EXPLORATION INC. EXPLORATION LEASE HOLDINGS, LOCATION, BASIN NAMES Aus-Tex Exploration Inc. has acquired from H.H. Howell, Inc. 915.9353 acres of Oil and Gas Leases in the Birch, Texas area with plans to acquire a possible additional 4100 acres. These oil and gas leases are located in the Birch area of Burleson County, Texas. The Birch Prospect is located in the southwestern part of Burleson County. The study area is located on the USGS 7.5 minute Frenstadt, and Flag Pond Quadrangle maps. The area is approximately 75 miles northwest of Houston or approximately midway between Houston and Austin, Texas. This is in the southeast part of the state near the Upper Gulf Coast region of Texas. The leases are located in a predominantly agricultural area with no unusual environmentally sensitive features present. Existing roads access the leases and Natural Gas Marketing systems are within less than a mile of the tracts. The topography is flat. There are no residences immediately adjacent to potential drill sites and the climate permits drilling 12 months of the year.
2.2. EXPIRY DATE OF INTEREST
The leases associated with the three tracts total 915.9353. These leases, acquired in early 2011, have expiration dates in January-March 2013 if no drilling occurs. Negotiations are under way to acquire up to 4100 acres of additional leases in the area. Expiration of the additional acreage is to be determined.
Birch Prospect, Burleson County, TX- Acreage Schedule Estimated
Acquisition
Delivered
Acquisition
Expire
Krueger
Unit
Acres Lessor Address Ownership Acquisition
Cost
$400 Lessee Date 2 Year
Primary
Tract 1 82.18 Dennis Krueger, Sr. & wife, Deborah Krueger 10800 County Rd 410,
Somerville, TX 77879
.3333333 $10,957.33 H.H. Howell, Inc. 1/3/2011 1/3/2013
Jeffry Krueger & wife, Jackie Krueger 9285 County Rd 405,
Somerville, TX 77879
.3333333 $10,957.33 (same doc)
James V. Kotch, Sr. 11344 County Rd 410,
Somerville, TX 77879
.3333333 $10,957.33 $32,872.00 (same doc)
Tract 2 57.674 Hunter Performance, Inc. 9302 Livernois,
Houston, TX 77080
.2500000 $5,767.40 * open (lease circulating)
Edward Schuhmann 225 Fluor Daniel Drive, Apt.
8101, Sugarland, TX 77479
.7500000 $17,302.20 $17,302.20 H.H. Howell, Inc. 1/3/2011 1/3/2013
Tract 3 105.85 Louis J. Lacina P.O. Box 557 Brenham,
TX 77834
1.0000000 $42,340.00 $42,340.00 H.H. Howell, Inc. 3/10/2011 3/10/2013
Tract 4 48.25 J W Heine 8954 FM 60 W, Somerville,
TX 77879
1.0000000 $19,300.00 $19,300.00 H.H. Howell, Inc. 1/3/2011 1/3/2013
Unit Total 293.954 $117,581.60 $111,814.20
Stern Unit Acres Lessor Address Ownership Acquisition
Cost
$400 Lessee Date 2 Year
Primary
Tract 1 141.2916 Alice Kovasovic 5795 FM 60 W, Somerville,
TX 77879
1.0000000 $56,516.64 $56,516.64 H.H. Howell, Inc. 3/14/2011 3/14/2013
Tract 2 128.883 Blanche L. Stern, Life Estate; Ronald Henry
Stern & Carol Stern Christian, Remaindermen
1302 Oakcreek, Richmond,
TX 77469
1.0000000 $51,553.20 * open (lease circulating)
Unit Total 270.1746 $108,069.84 $56,516.64
Tschoerner
Unit
Acres Lessor Address Ownership Acquisition
Cost
$400 Lessee Date 2 Year
Primary
Tract 1 80.7627 Donald Tschoerner 101 County Rd 315, Jarrell,
TX 76537
1.0000000 $32,305.08 $32,305.08 H. H. Howell, Inc. 3/9/2011 3/9/2013
Tract 2* 155.214 Dennis Krueger, Sr. & wife, Deborah Krueger 10800 County Rd 410,
Somerville, TX 77879
.3333333 $20,695.20 H. H. Howell, Inc. 3/4/2011 3/4/2013
Jeffry Krueger & wife, Jackie Krueger 9285 County Rd 405,
Somerville, TX 77879
.3333333 $20,695.20 (same doc)
James V. Kotch, Sr. 11344 County Rd 410,
Somerville, TX 77879
.3333333 $20,695.20 $62,085.60 (same doc)
Tract 3 115.83 Ann Fojtik, a widow 2483 Cumberland St.,
Houston, TX 77023
1.0000000 $46,332.00 $46,332.00 H. H. Howell, Inc. 3/10/2011 3/10/2013
Unit Total 351.8067 $140,722.68 $140,722.68
*All rights save for "shallow rights" above 7071' in southern 80 acres still HBP.
Birch Total 915.9353 $366,374.12 $309,053.52
Less Option Fee $120,000.00
Net Due 5-5-11 $189,053.52
For
per
sona
l use
onl
y

14 | P a g e
2.3. DESCRIPTION OF TARGET ZONE - GEOLOGIC SETTING 2.4. REGIONAL GEOLOGY The study area, in Burleson County is located on the upper gulf coastal plain of southeast Texas approximately midway between Austin and Houston (see FIGURE 7, Oil & Gas Map of Texas). The primary target zone is the Eagle Ford Shale. Secondary targets are provided by the Taylor, Austin Chalk, Buda and Georgetown Limestones. The study area and Aus-Tex Exploration Inc.’s lease hold interest in Burleson County, Texas are located in the Eagle Ford Shale play which extends nearly five hundred miles, in more than a fifty mile wide path, from southwestern Texas at the Mexico border, north of Laredo to the Louisiana border northeast of Houston (FIGURE 8, Eagle Ford Play map). The play involves the recent (since 2008) significant oil and gas completions in the Eagle Ford Shale of Upper Cretaceous Age by multiple operators. The Eagle Ford area is bound on the north and northwest by the Eagle Ford outcrop and the Balcones Fault system. The southern boundary with respect to technological depth limits on horizontal drilling is the Lower Cretaceous shelf edge, where Edwards and Sligo reefs are stacked; creating a silled basin in which Eagle Ford sediments were deposited. The Eagle Ford Shale Play, an unconventional reservoir play, was initiated with the discovery of the Hawkville Field, Webb County, Texas by PetroHawk Energy Corporation in October 2008. Hawkville Field is 124 miles long and 25 miles wide and is estimated to contain 68 TCF recoverable gas. The consensus of various recent publications suggest typical Eagle Ford shale completions in the southwestern part of the play, which are made in horizontal well bores with multiple stage fracture completions, to have reserves approximately 6 BCF gas or 200,000 barrels of oil. It is yet to be determined as the play develops to the northeast towards Burleson County if similar reserve volumes will be present. This play involves drilling horizontal wells (reported costs $6.0 million +/-) into the Eagle Ford shale which ranges in thickness from 100 feet to 300 feet in the areas where it is hydrocarbon productive. The unit outcrops in a crescent shape updip to the Balcones fault system (regional fault system striking NE-SW) from San Antonio to beyond Austin and to the northeast. Some of the early completions in this play have yielded impressive flow rates of either oil or gas and condensate. The horizontal completions involve long laterals of 3000 feet to 5000 feet. Multiple (up to 18) fracture stages are implemented. The Eagle Ford Shale is a pervasive marine shale unit over the geographic area currently being developed. The Eagle Ford is of Upper Cretaceous Age and is overlain by the Austin Chalk .The Eagle Ford overlies the Buda Limestone. Both the Austin Chalk and the Buda Limestone produce oil and gas in this part of Texas, and the current consensus is that the Eagle Ford serves as the source rock for both the Austin Chalk and the Buda Limestone reservoirs. Recently published data (Cusack, et el; “The Discovery, Reservoir Attributes and Significance of the Hawkville Field and the Eagle Ford
Shale Trend, Texas; 2010, CGAGS Transactions, Vol. 60, p 165-179) on the Hawkville Field located in the southwestern (Webb & Live Oak Counties) part of the trend reveals that the Eagle Ford is unique in its composition. It has a relatively high total organic carbon content (2-5.5%), low clay content (10-20%) and high calcite content (70%). The high calcite content renders the Eagle Ford shale very brittle and amenable to enhancement (for production) by manmade fracturing. It has been reported that the shale exhibits 8-10% gas filled porosity, with gas saturation exceeding 80%. Reserves in place at Hawkville Field are estimated to be 140 to 180 BCf gas in place in each square mile of surface area. Additionally, up to 200 bbls of condensate per mmcfg may be present in each square mile.
For
per
sona
l use
onl
y

15 | P a g e
The play as currently defined has three distinct hydrocarbon zones (see FIGURE 8). There is an updip band of normal pressure oil, then an intermediate band of higher pressure gas with condensate zone, and a downdip, southernmost band of dry gas only. Aus-Tex Exploration Inc. holdings in the Birch area appear to be either in the oil zone or near the transition from the updip oil band to the condensate rich gas zone. This play has been active for only three years and is in the very early stages of development. According to information released by the Texas Railroad Commission, the Eagle Ford shale production through February 2011 exceeds 3million barrels oil, 3.2 million barrels of condensate and 103 billion cubic feet of gas (see Appendix 3)
For
per
sona
l use
onl
y

16 | P a g e
Figure 4 Oil and Gas Map of Texas 2005
For
per
sona
l use
onl
y

17 | P a g e
Figure 5 Eagle Ford Shale Play, Western Gulf Basin, South Texas
For
per
sona
l use
onl
y

18 | P a g e
Figure 6 Stratigraphic Section Showing Eagle Ford Shale and Adjacent Geologic Units
For
per
sona
l use
onl
y

19 | P a g e
Figure 7 Subsurface Structural Map
For
per
sona
l use
onl
y

20 | P a g e
Figure 8 APACHE C-1 GIESENSCHLAG TYPE LOG
For
per
sona
l use
onl
y

21 | P a g e
The subsurface structural map (Fig. 10) generated for the purpose of this study is constructed on the Eagle Ford Shale. The map depicts relatively simple structural conditions with the mapped horizon dipping to the southeast approximately 500 feet per mile in the area of Aus-Tex Exploration Inc.’s leases. The map also reveals that the area of the subject leases has been heavily drilled in the past with wells densely spaced in the area. The area of interest is located on the southeast flank of Giddings Field which produces oil and gas from the Austin Chalk. Thousands of wells both vertical and horizontal have been drilled in Giddings Field which has produced over 1.2 billion barrels of oil from the Austin Chalk from 1960 to the present. The production from the chalk, like the Eagle Ford Shale beneath it, is fracture controlled, so there is high variability in the productive capacity of individual wells which range from a few hundred barrels to over one million barrels from individual wells. The same variability in producing characteristics for the Eagle Ford Shale play can be expected to be revealed as the Eagle Ford play continues to be developed regionally. The play is known to have potential in 22 Texas counties where dozens of companies ranging from multinational major oil companies to small local independents are engaged in lease acquisitions and drilling. An estimated five million acres have been leased. A total of 16 fields have been discovered as of May 2011 since the play began in 2008. Since the play’s inception in 2008, information obtained from the Texas Railroad Commission, indicates that through February 2011, over 3.6 million barrels of oil, 3.2 million barrels of condensate and 116 billion cubic feet of gas has been produced from wells completed in the Eagle Ford Shale throughout the play (see Appendix 3). Since the Eagle Ford Shale Play is in the early stages of exploration, it is highly likely, as new information is developed, that the productive capability of the play will vary to a certain extent geographically. Research published in 2010 (Adams, R.L. & Carr, J.P., 2010, “Regional depositional systems of the Woodbine, Eagle Ford, and
Tuscaloosa of the US Gulf Coast”, Gulf Coast Association of Geological Societies Transactions, v. 60, p.3-27) discusses a paleo incised valley fill (see FIGURE 12) If this interpretation is correct, the presence of this paleo feature in much of Burleson County has the possibility of impacting the productive capability of the Eagle Ford. It is anticipated that a decrease in calcite content with an increase in clay content will degrade the brittle nature of the unit and reduce the brittle nature of the shale. Thus, the Eagle Ford productive capability may not be as amenable to manmade fracture enhancement. On a positive note the probability of increase sand present in the unit could yield prolific reservoirs. Aggieland Field, in Brazos County, depicted on Figure 9, is oil productive from Woodbine sands within the Eagle Ford interval.
For
per
sona
l use
onl
y

22 | P a g e
Figure 9 Eagle Ford Paleo map
For
per
sona
l use
onl
y

23 | P a g e
2.5. BIRCH AREA
The area in which the Aus-Tex Exploration Inc. oil and gas leases are located is in the southwestern part of Burleson County, Texas near the town of Birch. The leases designated as Birch Prospect are located between Farm to Market Road 60 (FM 60) and Texas Highway 36.
2.6. DISTANCE TO THE NEAREST COMMERCIAL PRODUCTION 2.7. BIRCH PROSPECT The area in which the Aus-Tex Exploration Inc. lease block is situated is on the southeast flank of Giddings Field and has been densely drilled (Figure 8). A minimum of twelve wells have been drilled and produced from the Austin Chalk on the lease block. Records reviewed at the Texas Railroad Commission website indicate the wells have been plugged. The production bubble map shows that twenty four wells are located within 1/3 of a mile from the Aus-Tex Exploration Inc. leases were or are productive. These wells all produced from the Austin Chalk and produced a total of 1.4 million barrels of oil and 4.7 billion cubic feet of gas. Based on these production volumes, the wells around the Aus-Tex Exploration Inc. lease block averaged 59,026 barrels of oil and 196 mmcf gas per well. Many of the wells in this area and elsewhere in Burleson County had mudlog oil and gas shows in the Eagle Ford Shale. Additionally, Apache Corporation has drilled twenty wells in the Burleson County area (10 to 20 miles northeast of the Birch Prospect, Appendix 1, page 67) that have been oil and gas productive from the Eagle Ford Shale. Production decline curves, a well plot and an Eagle Ford map are located in Appendix 4. The lease area is located on gently southeast dipping strata with no recognized surface or subsurface faulting in the immediate area. Some researchers (Tucker Hentz, Texas Bureau of Economic Geology, personal
communication, 2011) believe that unfaulted areas hold more potential for ultimate Eagle Ford reserves, since the absence of faults and minimal natural fractures eliminate possible vertical conduits for reserves to migrate out of the Eagle Ford Shale. In the Aus-Tex Exploration Inc. lease area, the Eagle Ford occurs at depths of 8200 to 8900 feet and the formation is approximately 300 feet thick. The production established from the Eagle Ford in Burleson County by Apache Corporation is, with limited exceptions, vertical wells. Only two long horizontal wells have been drilled and neither has utilized state of the art fracture stimulation of the Eagle Ford Shale. A telephone conversation with a Schlumberger sales engineer in Houston determined that using the fracture technology employed by Petrohawk Energy in the southwestern part of the play at Hawkville Field, one could expect at a minimum to double production volumes over outdated fracture technology. Based on discussion with Schlumberger and a major Company engineer we believe a rate of 125 Bbl initial production per stage of horizontal fracture is reasonable. Schlumberger claims their “Hiway” fracture protocol will increase production by 35% for each fracture stage executed, thus in a horizontal well with ten fracture stages, we expect a possible 125bbl times 10 Stages times 1.35 = 1687.5 Bbl initial production. Production (through Dec 2010) from the Apache Eagle Ford wells is summarized in Table 1. F
or p
erso
nal u
se o
nly

24 | P a g e
TABLE 1- Summary of Burleson County Eagle Ford Production since 2008 (as of 12/10)
Operator
Lease Name Oil (bbls) Gas (MCF) comments
Apache Corp. D.A. Novosad 4012 3606
Apache Corp. C.O. Fick 5736 7971
Apache Corp. W.H. Giesenschlag “C”
23424 22924
Apache Corp. W. Helweg 3161 299
Apache Corp. J. R. Groce Unit 1184 1185
Apache Corp. Kovar Porter Unit
2760 2160
Apache Corp. W.H. Giesenschlag
8173 6337
Apache Corp. Willie Lee Tarver Unit C
6000 13729
Apache Corp. W.H. Giesenschlag C
12756 16258
Apache Corp. F. Boulden 410 7359
Apache Corp. Don Dillon et el 10258 10416
Apache Corp. Giesenschlag-Groce
47918 34440 Horizontal leg 3000’; 100’ frac
Apache Corp. Elsik 12796 10880 horizontal
Apache Corp. A.B. Childers 19166 8574
Apache Corp. Hazel J. Chachere oil unit
25159 8306
Apache Corp. Reveille 23847 31843
Apache Corp. Broesche Unit 16402 0
Apache Corp. Smalley-Robinson Unit
11855 0
Apache Corp. Santa Fe A
410 4552
Apache Corp. Santa Fe “A” 701 17787
Total Production 236,128 177,626
Average production
11806 8881
Ultimate average per well*
13313 10,014
* Ultimate average well production assumes 12.76% yet to be produced based on decline curves One well stands out in the above Table, the Apache Giesenschlag-Groce, which by now has made approximately 50,000 barrels of oil. It is probable that this well will produce 60,000 barrels of oil. This
well is a horizontal Eagle Ford well. It was completed using a single stage fracture of 106 feet over the interval 8944-9050 (10 to 18 stages are common) Estimates of the per well Eagle Ford
For
per
sona
l use
onl
y
25 | P a g e
production for ten stage fracture protocol in a horizontal well in the study area would range from 179,735 (conservative) to over 800,000 ( optimistic) barrels of oil .
2.8. PRODUCT TYPES REASONABLY EXPECTED Oil and Natural Gas are expected from the Austin Chalk and the Eagle Ford Shale at Birch Prospect. Additionally, oil and gas are possible from the Buda and Georgetown Limestones which underlie the Eagle Ford Shale as well as from the Taylor Formation which is located above the Austin Chalk.
2.9. RANGE OF POOL OR FIELD SIZES 2.9.1. BIRCH PROSPECT
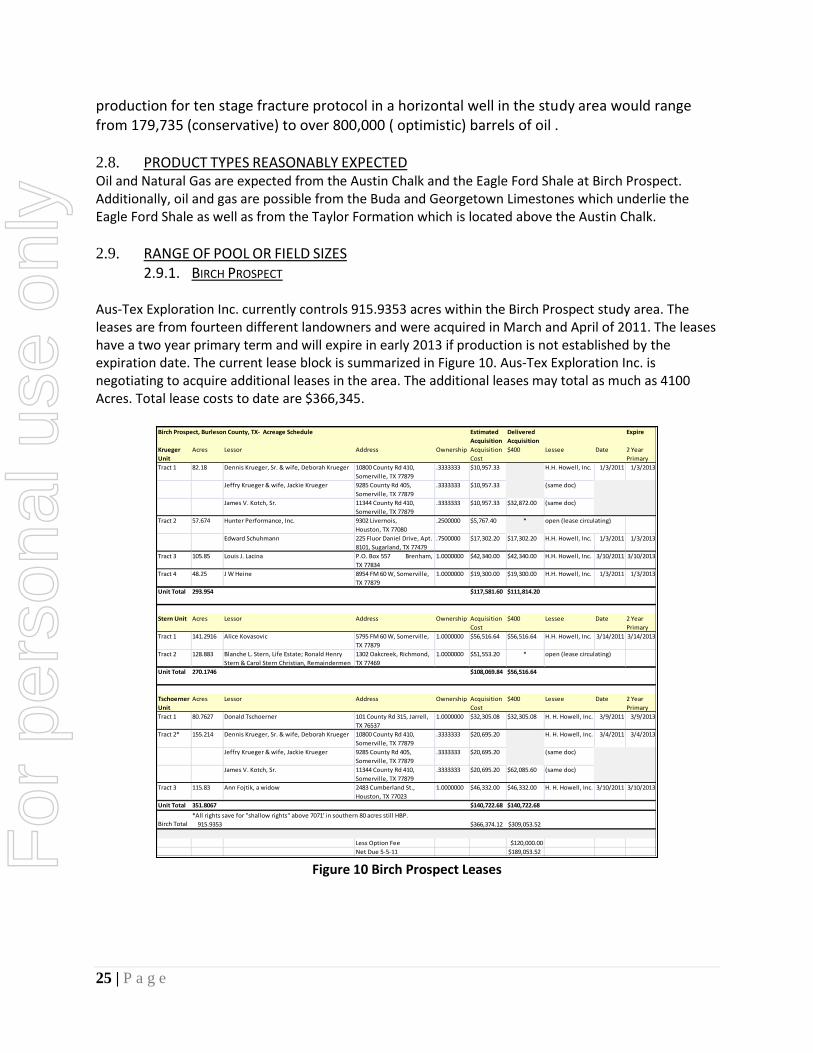
Aus-Tex Exploration Inc. currently controls 915.9353 acres within the Birch Prospect study area. The leases are from fourteen different landowners and were acquired in March and April of 2011. The leases have a two year primary term and will expire in early 2013 if production is not established by the expiration date. The current lease block is summarized in Figure 10. Aus-Tex Exploration Inc. is negotiating to acquire additional leases in the area. The additional leases may total as much as 4100 Acres. Total lease costs to date are $366,345.
Figure 10 Birch Prospect Leases
Birch Prospect, Burleson County, TX- Acreage Schedule Estimated
Acquisition
Delivered
Acquisition
Expire
Krueger
Unit
Acres Lessor Address Ownership Acquisition
Cost
$400 Lessee Date 2 Year
Primary
Tract 1 82.18 Dennis Krueger, Sr. & wife, Deborah Krueger 10800 County Rd 410,
Somerville, TX 77879
.3333333 $10,957.33 H.H. Howell, Inc. 1/3/2011 1/3/2013
Jeffry Krueger & wife, Jackie Krueger 9285 County Rd 405,
Somerville, TX 77879
.3333333 $10,957.33 (same doc)
James V. Kotch, Sr. 11344 County Rd 410,
Somerville, TX 77879
.3333333 $10,957.33 $32,872.00 (same doc)
Tract 2 57.674 Hunter Performance, Inc. 9302 Livernois,
Houston, TX 77080
.2500000 $5,767.40 * open (lease circulating)
Edward Schuhmann 225 Fluor Daniel Drive, Apt.
8101, Sugarland, TX 77479
.7500000 $17,302.20 $17,302.20 H.H. Howell, Inc. 1/3/2011 1/3/2013
Tract 3 105.85 Louis J. Lacina P.O. Box 557 Brenham,
TX 77834
1.0000000 $42,340.00 $42,340.00 H.H. Howell, Inc. 3/10/2011 3/10/2013
Tract 4 48.25 J W Heine 8954 FM 60 W, Somerville,
TX 77879
1.0000000 $19,300.00 $19,300.00 H.H. Howell, Inc. 1/3/2011 1/3/2013
Unit Total 293.954 $117,581.60 $111,814.20
Stern Unit Acres Lessor Address Ownership Acquisition
Cost
$400 Lessee Date 2 Year
Primary
Tract 1 141.2916 Alice Kovasovic 5795 FM 60 W, Somerville,
TX 77879
1.0000000 $56,516.64 $56,516.64 H.H. Howell, Inc. 3/14/2011 3/14/2013
Tract 2 128.883 Blanche L. Stern, Life Estate; Ronald Henry
Stern & Carol Stern Christian, Remaindermen
1302 Oakcreek, Richmond,
TX 77469
1.0000000 $51,553.20 * open (lease circulating)
Unit Total 270.1746 $108,069.84 $56,516.64
Tschoerner
Unit
Acres Lessor Address Ownership Acquisition
Cost
$400 Lessee Date 2 Year
Primary
Tract 1 80.7627 Donald Tschoerner 101 County Rd 315, Jarrell,
TX 76537
1.0000000 $32,305.08 $32,305.08 H. H. Howell, Inc. 3/9/2011 3/9/2013
Tract 2* 155.214 Dennis Krueger, Sr. & wife, Deborah Krueger 10800 County Rd 410,
Somerville, TX 77879
.3333333 $20,695.20 H. H. Howell, Inc. 3/4/2011 3/4/2013
Jeffry Krueger & wife, Jackie Krueger 9285 County Rd 405,
Somerville, TX 77879
.3333333 $20,695.20 (same doc)
James V. Kotch, Sr. 11344 County Rd 410,
Somerville, TX 77879
.3333333 $20,695.20 $62,085.60 (same doc)
Tract 3 115.83 Ann Fojtik, a widow 2483 Cumberland St.,
Houston, TX 77023
1.0000000 $46,332.00 $46,332.00 H. H. Howell, Inc. 3/10/2011 3/10/2013
Unit Total 351.8067 $140,722.68 $140,722.68
*All rights save for "shallow rights" above 7071' in southern 80 acres still HBP.
Birch Total 915.9353 $366,374.12 $309,053.52
Less Option Fee $120,000.00
Net Due 5-5-11 $189,053.52For
per
sona
l use
onl
y

26 | P a g e
In accordance with the Memorandum of Understanding (MOU) between Aus-Tex Exploration Inc. and H. H. Howell, Inc., Aus-Tex Exploration Inc. assumes the obligation of drilling an initial well in the Krueger Unit. The lease block is divided into three units, Krueger, Stern and Tschoerner of 293.9 acres, 270.17 acres and 351.8067 acres. Operators drilling in other geographic areas of the play have reported drilling costs in the $6,000,000 plus or minus range. Drilling the Eagle Ford beneath the Aus-Tex Exploration Inc. leases will require an approximate TVD of 8800 feet. Alamo Operating Company (Aus Tex contract operator) estimates the cost of an Eagle Ford well with 5,000 foot lateral and 10 stimulation stages to be $6,868,000. The vertical portion of the well to be $1,875,375.
Oil Production
It is anticipated that the production that will be established will be primarily oil, but considerable gas will also be produced. The Birch prospect is in an established oil and gas producing area with marketing infrastructure in place.
Gas Production Based on data from other Eagle Ford wells in the Birch area the ratio of gas to oil is expected to be 1 MCF of gas per Barrel of oil. Infrastructure maps that can be viewed online at the Texas Railroad Commission show sufficient pipelines and gathering lines. The onsite inspection confirmed the presence of natural gas gathering infrastructure in the immediate area. Reserve Analysis
Data made public indicates wells drilled in the southwestern most part of the play will be prolific, with anticipation of per well cumulative production of 6 BCF gas and 200,000 plus bbls of condensate. The available data supports a conclusion that the Eagle Ford Shale throughout the extent of the geographic region in which it exists can be a very prolific hydrocarbon producing zone. The key to a commercial success of the play in Burleson County is to minimize drilling and completion costs to the maximum extent possible and to employ the most recent generation of fracture technology. That will require close coordination with service providers and other vendors involved in the play.
Based on the average Eagle Ford production discussed in section 2.41, a conservative estimate of total oil production on an individual horizontal well basis is 179,735 barrels of oil. The Austin Chalk, Eagle Ford Shale and the Buda-Georgetown Limestone’s are considered to have a high probability of oil present. There is an additional potential objective, the Taylor sand, which when present, is found in the unit that overlies the Austin Chalk. The occurrence of this sand is only possible because of its stratigraphic nature and no reserves are attributed to that zone. In the areas in which the Taylor sand is present, individual wells have produced up to 6 BCF gas. Based on available data, a conservative and optimistic oil reserve estimate on a per well basis is as follows:
Objective Oil (bbls) Low- high
Gas (mcf)
Austin Chalk: 60,000-100,000 60,000-100,000
Eagle Ford Shale: 179,735-810,000 179,735-810,000
Buda/Georgetown Limestone: 25,000 - 40,000 25,000 - 40,000
Total potential reserves per well: 264,735 -950,000 264,735 -950,000
For
per
sona
l use
onl
y

27 | P a g e
2.10. DEPTH OF THE TARGET ZONE The Austin Chalk in the Study area ranges from subsea depth of 7800 feet to 8600 feet; the Eagle Ford Shale ranges from 8200 feet to 9000 feet, and the Buda and Georgetown limestones are at 8500 feet to 9300 feet. Deeper Potential Deeper potential in the study area is not considered significant at this time, due to the lack of evidence for structural traps to be present. As drilling increases, other geological units, particularly potential unconventional reservoirs, such as the Pearsall Formation, which occurs approximately 1800 to 2000 feet below the Eagle Ford Shale, may prove to be legitimate exploration targets. The shale interval in the Pearsall Formation has been proven to be gas (dry) productive in the southwest part of the Eagle Ford Shale Play near the border with Mexico.
2.11. ESTIMATED DRILLING AND COMPLETION COSTS
Vertical Eagle Ford
$1,365,810
Adjusted for 8.5% ORR purchase $1,481,903
Horizontal Eagle Ford$5,562,520
Adjusted for 8.5% ORR purchase $6,035,334
Vertical Austin Chalk $1,165,810
Adjusted for 8.5% ORR purchase $1,264,903
Horizontal Austin Chalk $3,662,520
Adjusted for 8.5% ORR purchase $3,973,834
2.12. ESTIMATED TIMING OF COMPLETION
The estimated timing is through 2011 and 2012.
2.13. 2.14. EXPECTED PRICES
Oil prices are estimated at $80/barrel and held constant. Natural Gas Prices are based on the 12 month average of Henry Hub futures ($5.03 / MCF) less $.50 / MCF gathering fees. Net Gas price is $4.53 / MCF.
2.15. EXPECTED MARKETING AND TRANSPORTATION ARRANGEMENTS Oil will be sold on the local market and average haulage costs are estimated at $7.25/bbl Gas will be sold into a local distribution system.
For
per
sona
l use
onl
y

28 | P a g e
2.16. RISKS AND PROBABILITY OF SUCCESS The Eagle Ford is pervasive throughout the Birch area as demonstrated by the cross sections presented in the appendix. The risk of a dry hole is virtually non- existent. The Eagle Ford and Austin Chalk represent roughly equivalent potential reservoirs. Risk is related to the effectiveness of completion techniques. Based on vertical well initial production experience we expect the initial production variance to be approximately on standard deviation or +/= 10%. Expected initial production ranges are based on a +/- 10% range.
3 PROBABILISTIC RESOURCE ESTIMATES 3.1. INPUT PARAMETERS All oil and gas wells typically decline in production rates as they produce. A 10 Year life has been assumed for the Eagle Ford and Austin Chalk evaluation. Both type of wells decline rapidly and have a fairly long stable flow at low rates. It is possible to re-stimulate the wells after the steep decline. This procedure has been used to advantage in recent years and may be adaptable to wells on the Birch Prospect. Due to the uncertainty of the recompletion technique no value has been assigned to this process.
Pricing for the evaluation is based on the assumption that the price of oil will retreat from the current high price to a conservative and more sustainable level of $80 / Barrel. Natural gas pricing is based on the average of the Henry Hub futures for the next 12 months ($5.03) less $.50 for gathering fees.
3.2. ASSUMPTIONS Overriding Royalty 25% ORR Aus Tex Working Interest
100% for Cost of First Well through tanks on each tract 93.50% after tanks and subsequent wells
Payment for increasing Aus Tex Working Interest 8.5% from 85% to 93.5%, 8.5% of well cost through tanks on first three wells Horizontal extension for Eagle Ford will be 5,000 feet 5,000 foot extension will contain 10 frac stages utilizing Schlumberger HiWay fracs Each frac stage will yield 125 Bbl per day Initial Production HiWay frac will increase initial production 35% Production from 10 Stages = 125*10*1.35 = 1350Bbl = 16.8 times increase Decline of Horizontal wells approximates decline of vertical wells For Austin Chalk wells horizontal wells horizontal extension will be 5,000 feet Austin Chalk completions will be open hole Well Cost Vertical Eagle Ford $1,481,903.00 Lease Acquisition -------------------- $122,115 $122,115.00 Vertical Drilling ----------------------- $604,405 $640,405.00 Vertical Completion -----------------$603,290 $603,290.00 Total ------------------------------------ $1,365,810.00 Adjusted for 8.5% ORR purchase $1,481,903.00 Horizontal Eagle Ford $6,053,334.00
For
per
sona
l use
onl
y

29 | P a g e
Lease Acquisition --------------------$122,115 $122,115.00 Verticle Drilling ----------------------$640,405 $640,405.00 Horizontal Drilling ------------------$2,300,000 $2,300,000.00 Horizontal Completion ------------$2,500,000 $2,500,000.00 Total ----------------------------------- $5,562,520.00 Adjusted for 8.5% ORR purchase $6,035,334.20
Vertical Austin Chalk $1,264,903.00
Lease Acquisition -------------- $122,115 $122,115.00
Vertical Drilling ---------------- $ 640,405 $640,405.00
Vertical Completion ---------- $403,290 $403,290.00
Total ----------------------------- $1,165,810.00
Adjusted for 8.5% ORR purchase $1,264,903.85
Horizontal Austin Chalk
Lease Acquisition -------------- $122,115 $122,115.00
Vertical Drilling ---------------- $ 640,405 $640,405.00
Horizontal Drilling ---------- $ 2,300,000 $2,300,000.00
Horizontal Completion-------- $600000 $600,000.00
Total ----------------------------- $3,662,520.00
Adjusted for 8.5% ORR purchase $3,973,834.20
Austin Chalk completions will increase initial production by a factor of two The initial production range for the sample wells is assumed to be +/- 10% Operating cost $3,000 / month Use average initial production from 17 Eagle Ford and 14 Austin Chalk Burleson County wells Operating days per year 340 Severance Tax Natural Gas – 7.5% Severance Tax Oil – 4.6%
Oil/Gas Price
Oil price $80 per Bbl – Conservative Gas price based on 12 month Henry Hub average less $.50 for gathering.
Henry Hub 12 Month average = $5.03 / MCF - $.50 / MCF = $4.53 / MCF
For
per
sona
l use
onl
y

30 | P a g e
Eagle Ford Decline 17 Burleson County Wells located 10 miles away from Birch Prospect:
Figure 11 Eagle Ford 17 Well Daily Ave. production Burleson County
Austin Chalk production from offset wells within and around Birch Prospect:
Figure 12 Austin Chalk Ave. Production
17 Well Average Month Bbl/Day MCF/Day
1 31.29 38.98
2 29.15 31.66
3 21.78 26.74
4 19.47 20.11
5 24.48 17.97
6 19.54 19.02
7 19.68 18.81
8 19.01 22.04
9 16.30 22.56
10 14.50 20.12
11 13.97 18.09
12 12.37 14.04
13 12.15 12.08
14 12.57 12.29
15 11.41 12.41
16 11.31 12.09
17 10.73 11.94
18 10.54 11.44
19 9.55 9.60
20 9.95 8.84
21 9.38 8.77
22 8.65 8.18
23 8.97 8.09
24 7.99 7.45 25 7.99 7.53 26 7.26 6.42 27 6.94 5.95
For
per
sona
l use
onl
y

31 | P a g e
4 TYPE WELL ECONOMICS 4.1. SUMMARY FOR EAGLE FORD WELLS:
Table 5 All Burleson County Well Data Economics
Table 6 Burleson County Production Economics (Excluding probable dry hole equivalence)
Table 7 Wells drilled within Birch Unit only
Summary for Austin Chalk Wells
Table 8 All Burleson County Well Data Economics
For details see tables below:
Pessimistic Base Optimistic
$327,333.84 $1,853,748.32 $3,380,162.79
7% 18% 28%
$848,203.31 $2,480,732.16 $4,113,261.01
Aus Tex NPV 4%
100% Net Present Value (NPV) @4%
Eagle Ford Horizontal Well
IRR
Pessimistic Base Optimistic
$2,615,829.50 $4,438,167.46 $6,260,505.43
29% 44% 58%
$3,295,792.24 $5,244,816.80 $7,193,841.37
Aus Tex NPV 4%
100% Net Present Value (NPV) @4%
Eagle Ford Horizontal Well
IRR
Pessimistic Base Optimistic
$4,057,014.54 $5,574,523.11 $7,092,031.68
25% 34% 42%
$4,837,166.62 $6,460,170.44 $8,083,174.26
Aus Tex NPV 4%
100% Net Present Value (NPV) @4%
Eagle Ford Horizontal Well
IRR
Pessimistic Base Optimistic
$10,075,862.80 $11,977,535.52 $13,879,208.24
90% 107% 123%
$11,079,122.98 $13,112,997.54 $15,146,872.11100% Net Present Value (NPV) @4%
Austin Chalk Horizontal Well
Aus Tex NPV 4%
IRRFor
per
sona
l use
onl
y

32 | P a g e
Table 1 EAGLE FORD Base Case
NET CASH FLOW HORIZONTAL Eagle Ford WELL ( 10 Year Life)Assume 100% Working Interest - Average 25% Royalty
16.8 Fold Production Increase for Horizontal well
Year Production Production Production Production AnnualRevenue Annual Revenue Annual Revenue Annual Hauling
BBL Oil/Day BBl Oil / Year MCF Gas/Day MCF Gas/Year at $80 Barrel at $4.53/MCF Total Gas Oil Cost
Per Vert Well Per Vert Well Per Vert Well Per Vert Well 4.6% Sev Tax 7.5% Sev Tax Horizontal Well $
0 0 0 0 0.00 0.00 0.00 0.00
1 21.53 7320.2 24.07 8158.28 558,677.66 34,185.23 592,862.90 53,071.45
2 10.98 3733.2 10.98 3732.65 284,917.82 15,640.74 300,558.56 27,065.70
3 4.53 1540.2 4.74 1610.96 117,548.06 6,750.33 124,298.39 11,166.45
4 2.7 918 2.00 680.00 70,061.76 2,849.37 72,911.13 6,655.50
5 2.7 918 2.00 680.00 70,061.76 2,849.37 72,911.13 6,655.50
6 2.7 918 2.00 680.00 70,061.76 2,849.37 72,911.13 6,655.50
7 2.7 918 2.00 680.00 70,061.76 2,849.37 72,911.13 6,655.50
8 2.7 918 2.00 680.00 70,061.76 2,849.37 72,911.13 6,655.50
9 2.7 918 2.00 680.00 70,061.76 2,849.37 72,911.13 6,655.50
10 2.7 918 2.00 680.00 70,061.76 2,849.37 72,911.13 6,655.50
5.594 19019.6 1451575.872 137892.1
10Year Total 19019.6 18261.89
10 Yr Prod x 16.8 256764.6 246535.52
NPV 4% $2,480,732.16
IRR 18%
AUS TEX NPV 4% $1,853,748.32
For
per
sona
l use
onl
y

33 | P a g e
Annual Operating Royalty Total Cash Total Cash Aus-Tex Cumulative Aus-Tex Cum Net
Cost At 25%Avg Flow Flow Inc Cash Flow @93.5% WI Cash Flow Cash Flow @93.5% WI
$ $ $ 16.8 $ $ $
7,451,780.00 0.00 0.00 -7,451,780.00 -7,451,780.00 -7,451,780.00 -7,451,780.00
36,000.00 148,215.72 355,575.72 5,973,672.14 5,585,383.45 -1,478,107.86 -1,382,030.85
36,000.00 75,139.64 162,353.22 2,727,534.10 2,550,244.39 1,249,426.24 1,168,213.54
36,000.00 31,074.60 46,057.34 773,763.34 723,468.73 2,023,189.59 1,891,682.26
36,000.00 18,227.78 12,027.85 202,067.84 188,933.43 2,225,257.42 2,080,615.69
36,000.00 18,227.78 12,027.85 202,067.84 188,933.43 2,427,325.26 2,269,549.12
36,000.00 18,227.78 12,027.85 202,067.84 188,933.43 2,629,393.10 2,458,482.55
36,000.00 18,227.78 12,027.85 202,067.84 188,933.43 2,831,460.94 2,647,415.98
36,000.00 18,227.78 12,027.85 202,067.84 188,933.43 3,033,528.78 2,836,349.41
36,000.00 18,227.78 12,027.85 202,067.84 188,933.43 3,235,596.61 3,025,282.83
36,000.00 18,227.78 12,027.85 202,067.84 188,933.43 3,437,664.45 3,214,216.26
For
per
sona
l use
onl
y

34 | P a g e
Table 1 EAGLE FORD Pessimistic Case
NET CASH FLOW HORIZONTAL EAGLE FORD WELL ( 10 Year Life)
PESSIMISTICAverage 25% Royalty
16.8 Fold Production Increase for Horizontal well
Year Production Production Pess Prodn Production Production Pess Prodn AnnualRevenue Annual Revenue Annual Revenue Annual Hauling
BBL Oil/Day BBl Oil / Year BBl Oil / Year MCF Gas/Day MCF Gas/Year MCF Gas/Year at $80 Barrel at $4.53/MCF Total Gas Oil Cost
Per Vert Well Per Vert Well Per Vert Well Per Vert Well Per Vert Well Per Vert Well 4.6% Sev Tax 7.5% Sev Tax Horizontal Well $
0 0 0 0 0.00 0.00 0.00 0.00
1 21.53 7320.2 6588.18 24.07 8158.28 7342.45 502,809.90 30,766.71 533,576.61 53,071.45
2 10.98 3733.2 3359.88 10.98 3732.65 3359.39 256,426.04 14,076.66 270,502.70 27,065.70
3 4.53 1540.2 1386.18 4.74 1610.96 1449.86 105,793.26 6,075.29 111,868.55 11,166.45
4 2.7 918 826.2 2.00 680.00 612.00 63,055.58 2,564.43 65,620.02 6,655.50
5 2.7 918 826.2 2.00 680.00 612.00 63,055.58 2,564.43 65,620.02 6,655.50
6 2.7 918 826.2 2.00 680.00 612.00 63,055.58 2,564.43 65,620.02 6,655.50
7 2.7 918 826.2 2.00 680.00 612.00 63,055.58 2,564.43 65,620.02 6,655.50
8 2.7 918 826.2 2.00 680.00 612.00 63,055.58 2,564.43 65,620.02 6,655.50
9 2.7 918 826.2 2.00 680.00 612.00 63,055.58 2,564.43 65,620.02 6,655.50
10 2.7 918 826.2 2.00 680.00 612.00 63,055.58 2,564.43 65,620.02 6,655.50
10Year Total 19019.6 17117.64 18261.89 16435.70
10Yr Total x16.8 Pessimistic 231088.14 231088.14
100%NRI IRR 11%
100%NRI NPV 4% $848,203.31
Aus Tex IRR 7%
Aus TexNPV 4% $327,333.84
For
per
sona
l use
onl
y

35 | P a g e
Annual Operating Royalty Total Cash Total Cash Aus-Tex Cumulative Aus-Tex Cum Net
Cost At 25%Avg Flow Flow Inc Cash Flow @93.5% WI Cash Flow Cash Flow @93.5% WI
$ $ $ 16.8 $ $ $
7,451,780.00 0.00 -7,451,780.00 -7,451,780.00 -7,451,780.00 -7,451,780.00 -7,451,780.00
36,000.00 133,394.15 311,111.01 5,226,664.89 4,886,931.67 -2,225,115.11 -2,080,482.63
36,000.00 67,625.68 139,811.33 2,348,830.32 2,196,156.35 123,715.21 115,673.72
36,000.00 27,967.14 36,734.96 617,147.37 577,032.79 740,862.58 692,706.51
36,000.00 16,405.00 6,559.51 110,199.81 103,036.83 851,062.39 795,743.34
36,000.00 16,405.00 6,559.51 110,199.81 103,036.83 961,262.21 898,780.16
36,000.00 16,405.00 6,559.51 110,199.81 103,036.83 1,071,462.02 1,001,816.99
36,000.00 16,405.00 6,559.51 110,199.81 103,036.83 1,181,661.84 1,104,853.82
36,000.00 16,405.00 6,559.51 110,199.81 103,036.83 1,291,861.65 1,207,890.64
36,000.00 16,405.00 6,559.51 110,199.81 103,036.83 1,402,061.47 1,310,927.47
36,000.00 16,405.00 6,559.51 110,199.81 103,036.83 1,512,261.28 1,413,964.30
For
per
sona
l use
onl
y
36 | P a g e
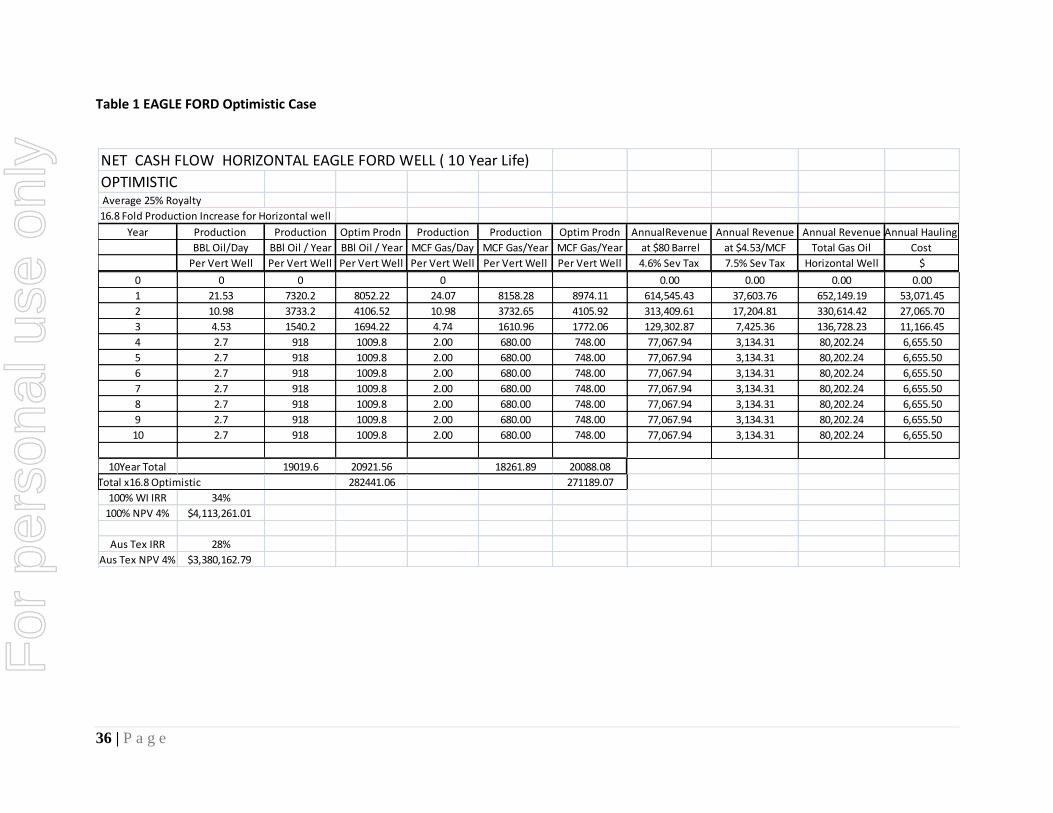
Table 1 EAGLE FORD Optimistic Case
NET CASH FLOW HORIZONTAL EAGLE FORD WELL ( 10 Year Life)
OPTIMISTIC Average 25% Royalty
16.8 Fold Production Increase for Horizontal well
Year Production Production Optim Prodn Production Production Optim Prodn AnnualRevenue Annual Revenue Annual Revenue Annual Hauling
BBL Oil/Day BBl Oil / Year BBl Oil / Year MCF Gas/Day MCF Gas/Year MCF Gas/Year at $80 Barrel at $4.53/MCF Total Gas Oil Cost
Per Vert Well Per Vert Well Per Vert Well Per Vert Well Per Vert Well Per Vert Well 4.6% Sev Tax 7.5% Sev Tax Horizontal Well $
0 0 0 0 0.00 0.00 0.00 0.00
1 21.53 7320.2 8052.22 24.07 8158.28 8974.11 614,545.43 37,603.76 652,149.19 53,071.45
2 10.98 3733.2 4106.52 10.98 3732.65 4105.92 313,409.61 17,204.81 330,614.42 27,065.70
3 4.53 1540.2 1694.22 4.74 1610.96 1772.06 129,302.87 7,425.36 136,728.23 11,166.45
4 2.7 918 1009.8 2.00 680.00 748.00 77,067.94 3,134.31 80,202.24 6,655.50
5 2.7 918 1009.8 2.00 680.00 748.00 77,067.94 3,134.31 80,202.24 6,655.50
6 2.7 918 1009.8 2.00 680.00 748.00 77,067.94 3,134.31 80,202.24 6,655.50
7 2.7 918 1009.8 2.00 680.00 748.00 77,067.94 3,134.31 80,202.24 6,655.50
8 2.7 918 1009.8 2.00 680.00 748.00 77,067.94 3,134.31 80,202.24 6,655.50
9 2.7 918 1009.8 2.00 680.00 748.00 77,067.94 3,134.31 80,202.24 6,655.50
10 2.7 918 1009.8 2.00 680.00 748.00 77,067.94 3,134.31 80,202.24 6,655.50
10Year Total 19019.6 20921.56 18261.89 20088.08
10Yr Total x16.8 Optimistic 282441.06 271189.07
100% WI IRR 34%
100% NPV 4% $4,113,261.01
Aus Tex IRR 28%
Aus Tex NPV 4% $3,380,162.79
For
per
sona
l use
onl
y

37 | P a g e
Annual Operating Royalty Total Cash Total Cash Aus-Tex Cumulative Aus-Tex Cum Net
Cost At 25%Avg Flow Flow Inc Cash Flow @93.5% WI Cash Flow Cash Flow @93.5% WI
$ $ $ 16.8 $ $ $
7,451,780.00 0.00 -7,451,780.00 -7,451,780.00 -7,451,780.00 -7,451,780.00 -7,451,780.00
36,000.00 163,037.30 400,040.44 6,720,679.39 6,283,835.23 -731,100.61 -683,579.07
36,000.00 82,653.60 184,895.11 3,106,237.89 2,904,332.43 2,375,137.28 2,220,753.36
36,000.00 34,182.06 55,379.72 930,379.31 869,904.66 3,305,516.59 3,090,658.01
36,000.00 20,050.56 17,496.18 293,935.86 274,830.03 3,599,452.46 3,365,488.05
36,000.00 20,050.56 17,496.18 293,935.86 274,830.03 3,893,388.32 3,640,318.08
36,000.00 20,050.56 17,496.18 293,935.86 274,830.03 4,187,324.18 3,915,148.11
36,000.00 20,050.56 17,496.18 293,935.86 274,830.03 4,481,260.04 4,189,978.14
36,000.00 20,050.56 17,496.18 293,935.86 274,830.03 4,775,195.90 4,464,808.17
36,000.00 20,050.56 17,496.18 293,935.86 274,830.03 5,069,131.76 4,739,638.20
36,000.00 20,050.56 17,496.18 293,935.86 274,830.03 5,363,067.63 5,014,468.23
For
per
sona
l use
onl
y

38 | P a g e
Table 2 EAGLE FORD Base Case
NET CASH FLOW HORIZONTAL Eagle Ford WELL ( 10 Year Life)Assume 100% Working Interest - Average 25% Royalty
16.8 Fold Production Increase for Horizontal well
Year Production Production Production Production AnnualRevenue Annual Revenue Annual Revenue Annual Hauling
BBL Oil/Day BBl Oil / Year MCF Gas/Day MCF Gas/Year at $80 Barrel at $4.53/MCF Total Gas Oil Cost
Per Vert Well Per Vert Well Per Vert Well Per Vert Well 4.6% Sev Tax 7.5% Sev Tax Horizontal Well $
0 0 0 0 0.00 0.00 0.00 0.00
1 32 10880 24.07 8158.28 830,361.60 34,185.23 864,546.83 78,880.00
2 11 3733.2 10.98 3732.65 284,917.82 15,640.74 300,558.56 27,065.70
3 5 1540.2 4.74 1610.96 117,548.06 6,750.33 124,298.39 11,166.45
4 2.7 918 2.00 680.00 70,061.76 2,849.37 72,911.13 6,655.50
5 2.7 918 2.00 680.00 70,061.76 2,849.37 72,911.13 6,655.50
6 2.7 918 2.00 680.00 70,061.76 2,849.37 72,911.13 6,655.50
7 2.7 918 2.00 680.00 70,061.76 2,849.37 72,911.13 6,655.50
8 2.7 918 2.00 680.00 70,061.76 2,849.37 72,911.13 6,655.50
9 2.7 918 2.00 680.00 70,061.76 2,849.37 72,911.13 6,655.50
10 2.7 918 2.00 680.00 70,061.76 2,849.37 72,911.13 6,655.50
6.641 22579.4 1723259.808 163700.65
10Year Total 22579.4 18261.89
10 Yr Prod x 16.8 304821.9 246535.52
NPV 4% $5,244,816.80
IRR 44%
AUS TEX NPV 4% $4,438,167.46
For
per
sona
l use
onl
y

39 | P a g e
Annual Operating Royalty Total Cash Total Cash Aus-Tex Cumulative Aus-Tex Cum Net
Cost At 25%Avg Flow Flow Inc Cash Flow @93.5% WI Cash Flow Cash Flow @93.5% WI
$ $ $ 16.8 $ $ $
7,451,780.00 0.00 0.00 -7,451,780.00 -7,451,780.00 -7,451,780.00 -7,451,780.00
36,000.00 216,136.71 533,530.12 8,963,306.09 8,380,691.20 1,511,526.09 1,413,276.90
36,000.00 75,139.64 162,353.22 2,727,534.10 2,550,244.39 4,239,060.20 3,963,521.28
36,000.00 31,074.60 46,057.34 773,763.34 723,468.73 5,012,823.54 4,686,990.01
36,000.00 18,227.78 12,027.85 202,067.84 188,933.43 5,214,891.38 4,875,923.44
36,000.00 18,227.78 12,027.85 202,067.84 188,933.43 5,416,959.22 5,064,856.87
36,000.00 18,227.78 12,027.85 202,067.84 188,933.43 5,619,027.05 5,253,790.30
36,000.00 18,227.78 12,027.85 202,067.84 188,933.43 5,821,094.89 5,442,723.72
36,000.00 18,227.78 12,027.85 202,067.84 188,933.43 6,023,162.73 5,631,657.15
36,000.00 18,227.78 12,027.85 202,067.84 188,933.43 6,225,230.57 5,820,590.58
36,000.00 18,227.78 12,027.85 202,067.84 188,933.43 6,427,298.41 6,009,524.01
For
per
sona
l use
onl
y

40 | P a g e
Table 2 EAGLE FORD Pessimistic Case
NET CASH FLOW HORIZONTAL EAGLE FORD WELL ( 10 Year Life)
PESSIMISTICAverage 25% Royalty
16.8 Fold Production Increase for Horizontal well
Year Production Production Pess Prodn Production Production Pess Prodn AnnualRevenue Annual Revenue Annual RevenueAnnual Hauling
BBL Oil/Day BBl Oil / Year BBl Oil / Year MCF Gas/Day MCF Gas/Year MCF Gas/Year at $80 Barrel at $4.53/MCF Total Gas Oil Cost
Per Vert Well Per Vert Well Per Vert Well Per Vert Well Per Vert Well Per Vert Well 4.6% Sev Tax 7.5% Sev Tax Horizontal Well $
0 0 0 0 0.00 0.00 0.00 0.00
1 32 10880 9792 24.07 8158.28 7342.45 747,325.44 30,766.71 778,092.15 78,880.00
2 11 3733.2 3359.88 10.98 3732.65 3359.39 256,426.04 14,076.66 270,502.70 27,065.70
3 5 1540.2 1386.18 4.74 1610.96 1449.86 105,793.26 6,075.29 111,868.55 11,166.45
4 2.7 918 826.2 2.00 680.00 612.00 63,055.58 2,564.43 65,620.02 6,655.50
5 2.7 918 826.2 2.00 680.00 612.00 63,055.58 2,564.43 65,620.02 6,655.50
6 2.7 918 826.2 2.00 680.00 612.00 63,055.58 2,564.43 65,620.02 6,655.50
7 2.7 918 826.2 2.00 680.00 612.00 63,055.58 2,564.43 65,620.02 6,655.50
8 2.7 918 826.2 2.00 680.00 612.00 63,055.58 2,564.43 65,620.02 6,655.50
9 2.7 918 826.2 2.00 680.00 612.00 63,055.58 2,564.43 65,620.02 6,655.50
10 2.7 918 826.2 2.00 680.00 612.00 63,055.58 2,564.43 65,620.02 6,655.50
10Year Total 22579.4 20321.46 18261.89 16435.70
10Yr Total x13.5 Pessimistic 274339.71 274339.71
100%NRI IRR 35%
100%NRI NPV 4% $3,295,792.24
Aus Tex IRR 29%
Aus TexNPV 4% $2,615,829.50
For
per
sona
l use
onl
y

41 | P a g e
Annual Hauling Annual Operating Royalty Total Cash Total Cash Aus-Tex Cumulative Aus-Tex Cum Net
Cost Cost At 25%Avg Flow Flow Inc Cash Flow @93.5% WI Cash Flow Cash Flow @93.5% WI
$ $ $ $ 16.8 $ $ $
0.00 7,451,780.00 0.00 -7,451,780.00 -7,451,780.00 -7,451,780.00 -7,451,780.00 -7,451,780.00
78,880.00 36,000.00 194,523.04 468,689.11 7,873,977.08 7,362,168.57 422,197.08 394,754.27
27,065.70 36,000.00 67,625.68 139,811.33 2,348,830.32 2,196,156.35 2,771,027.40 2,590,910.62
11,166.45 36,000.00 27,967.14 36,734.96 617,147.37 577,032.79 3,388,174.77 3,167,943.41
6,655.50 36,000.00 16,405.00 6,559.51 110,199.81 103,036.83 3,498,374.59 3,270,980.24
6,655.50 36,000.00 16,405.00 6,559.51 110,199.81 103,036.83 3,608,574.40 3,374,017.07
6,655.50 36,000.00 16,405.00 6,559.51 110,199.81 103,036.83 3,718,774.22 3,477,053.89
6,655.50 36,000.00 16,405.00 6,559.51 110,199.81 103,036.83 3,828,974.03 3,580,090.72
6,655.50 36,000.00 16,405.00 6,559.51 110,199.81 103,036.83 3,939,173.85 3,683,127.55
6,655.50 36,000.00 16,405.00 6,559.51 110,199.81 103,036.83 4,049,373.66 3,786,164.37
6,655.50 36,000.00 16,405.00 6,559.51 110,199.81 103,036.83 4,159,573.47 3,889,201.20
For
per
sona
l use
onl
y

42 | P a g e
Table 2 EAGLE FORD Optimistic Case
NET CASH FLOW HORIZONTAL EAGLE FORD WELL ( 10 Year Life)
OPTIMISTIC Average 25% Royalty
16.8 Fold Production Increase for Horizontal well
Year Production Production Optim Prodn Production Production Optim Prodn AnnualRevenue Annual Revenue Annual RevenueAnnual Hauling
BBL Oil/Day BBl Oil / Year BBl Oil / Year MCF Gas/Day MCF Gas/Year MCF Gas/Year at $80 Barrel at $4.53/MCF Total Gas Oil Cost
Per Vert Well Per Vert Well Per Vert Well Per Vert Well Per Vert Well Per Vert Well 4.6% Sev Tax 7.5% Sev Tax Horizontal Well $
0 0 0 0 0.00 0.00 0.00 0.00
1 32 10880 11968 24.07 8158.28 8974.11 913,397.76 37,603.76 951,001.52 78,880.00
2 11 3733.2 4106.52 10.98 3732.65 4105.92 313,409.61 17,204.81 330,614.42 27,065.70
3 5 1540.2 1694.22 4.74 1610.96 1772.06 129,302.87 7,425.36 136,728.23 11,166.45
4 2.7 918 1009.8 2.00 680.00 748.00 77,067.94 3,134.31 80,202.24 6,655.50
5 2.7 918 1009.8 2.00 680.00 748.00 77,067.94 3,134.31 80,202.24 6,655.50
6 2.7 918 1009.8 2.00 680.00 748.00 77,067.94 3,134.31 80,202.24 6,655.50
7 2.7 918 1009.8 2.00 680.00 748.00 77,067.94 3,134.31 80,202.24 6,655.50
8 2.7 918 1009.8 2.00 680.00 748.00 77,067.94 3,134.31 80,202.24 6,655.50
9 2.7 918 1009.8 2.00 680.00 748.00 77,067.94 3,134.31 80,202.24 6,655.50
10 2.7 918 1009.8 2.00 680.00 748.00 77,067.94 3,134.31 80,202.24 6,655.50
10Year Total 22579.4 24837.34 18261.89 20088.08
10Yr Total x13.5 Optimistic 335304.09 271189.07
100% WI IRR 67%
100% NPV 4% $7,193,841.37
Aus Tex IRR 58%
For
per
sona
l use
onl
y

43 | P a g e
Annual Operating Royalty Total Cash Total Cash Aus-Tex Cumulative Aus-Tex Cum Net
Cost At 25%Avg Flow Flow Inc Cash Flow @93.5% WI Cash Flow Cash Flow @93.5% WI
$ $ $ 16.8 $ $ $
7,451,780.00 0.00 -7,451,780.00 -7,451,780.00 -7,451,780.00 -7,451,780.00 -7,451,780.00
36,000.00 237,750.38 598,371.14 10,052,635.10 9,399,213.82 2,600,855.10 2,431,799.52
36,000.00 82,653.60 184,895.11 3,106,237.89 2,904,332.43 5,707,092.99 5,336,131.95
36,000.00 34,182.06 55,379.72 930,379.31 869,904.66 6,637,472.31 6,206,036.61
36,000.00 20,050.56 17,496.18 293,935.86 274,830.03 6,931,408.17 6,480,866.64
36,000.00 20,050.56 17,496.18 293,935.86 274,830.03 7,225,344.03 6,755,696.67
36,000.00 20,050.56 17,496.18 293,935.86 274,830.03 7,519,279.89 7,030,526.70
36,000.00 20,050.56 17,496.18 293,935.86 274,830.03 7,813,215.75 7,305,356.73
36,000.00 20,050.56 17,496.18 293,935.86 274,830.03 8,107,151.62 7,580,186.76
36,000.00 20,050.56 17,496.18 293,935.86 274,830.03 8,401,087.48 7,855,016.79
36,000.00 20,050.56 17,496.18 293,935.86 274,830.03 8,695,023.34 8,129,846.82
For
per
sona
l use
onl
y

44 | P a g e
Table 3 EAGLE FORD Base Case
NET CASH FLOW HORIZONTAL Eagle Ford WELL ( 10 Year Life)Assume 100% Working Interest - Average 25% Royalty
16.8 Fold Production Increase for Horizontal well
Year Production Production Production Production AnnualRevenue Annual Revenue Annual Revenue Annual Hauling
BBL Oil/Day BBl Oil / Year MCF Gas/Day MCF Gas/Year at $80 Barrel at $4.53/MCF Total Gas Oil Cost
Per Vert Well Per Vert Well Per Vert Well Per Vert Well 4.6% Sev Tax 7.5% Sev Tax Horizontal Well $
0 0 0 0 0.00 0.00 0.00 0.00
1 200 68000 24.07 8158.28 5,189,760.00 34,185.23 5,223,945.23 493,000.00
2 72 24480 10.98 3732.65 1,868,313.60 15,640.74 1,883,954.34 177,480.00
3 46 15640 4.74 1610.96 1,193,644.80 6,750.33 1,200,395.13 113,390.00
4 34 11560 2.00 680.00 882,259.20 2,849.37 885,108.57 83,810.00
5 28 9520 2.00 680.00 726,566.40 2,849.37 729,415.77 69,020.00
6 28 9520 2.00 680.00 726,566.40 2,849.37 729,415.77 69,020.00
7 24 8160 2.00 680.00 622,771.20 2,849.37 625,620.57 59,160.00
8 21 7140 2.00 680.00 544,924.80 2,849.37 547,774.17 51,765.00
9 18 6120 2.00 680.00 467,078.40 2,849.37 469,927.77 44,370.00
10 16 5440 2.00 680.00 415,180.80 2,849.37 418,030.17 39,440.00
48.7 165580 12637065.6 1200455
10Year Total 165580 18261.89
10 Yr Prod x 13.5 2235330 246535.52
NPV 4% $6,460,170.44
IRR 34%
AUS TEX NPV 4% $5,574,523.11
For
per
sona
l use
onl
y

45 | P a g e
Annual Operating Royalty Total Cash Total Cash Aus-Tex Cumulative Aus-Tex Cum Net
Cost At 25%Avg Flow Flow Inc Cash Flow @93.5% WI Cash Flow Cash Flow @93.5% WI
$ $ $ 2 $ $ $
7,451,780.00 0.00 0.00 -7,451,780.00 -7,451,780.00 -7,451,780.00 -7,451,780.00
36,000.00 1,305,986.31 3,388,958.92 6,777,917.85 6,337,353.19 -673,862.15 -630,061.11
36,000.00 470,988.58 1,199,485.75 2,398,971.50 2,243,038.36 1,725,109.35 1,612,977.25
36,000.00 300,098.78 750,906.34 1,501,812.69 1,404,194.86 3,226,922.04 3,017,172.11
36,000.00 221,277.14 544,021.43 1,088,042.86 1,017,320.07 4,314,964.90 4,034,492.18
36,000.00 182,353.94 442,041.83 884,083.66 826,618.22 5,199,048.55 4,861,110.40
36,000.00 182,353.94 442,041.83 884,083.66 826,618.22 6,083,132.21 5,687,728.61
36,000.00 156,405.14 374,055.43 748,110.86 699,483.65 6,831,243.06 6,387,212.26
36,000.00 136,943.54 323,065.63 646,131.26 604,132.72 7,477,374.32 6,991,344.99
36,000.00 117,481.94 272,075.83 544,151.66 508,781.80 8,021,525.97 7,500,126.78
36,000.00 104,507.54 238,082.63 476,165.26 445,214.51 8,497,691.23 7,945,341.30
For
per
sona
l use
onl
y

46 | P a g e
Table 2 EAGLE FORD Pessimistic Case
NET CASH FLOW HORIZONTAL EAGLE FORD WELL ( 10 Year Life)
PESSIMISTICAverage 25% Royalty
16.8 Fold Production Increase for Horizontal well
Year Production Production Pess Prodn Production Production Pess Prodn AnnualRevenue Annual Revenue Annual RevenueAnnual Hauling
BBL Oil/Day BBl Oil / Year BBl Oil / Year MCF Gas/Day MCF Gas/YearMCF Gas/Year at $80 Barrel at $4.53/MCF Total Gas Oil Cost
Per Vert Well Per Vert Well Per Vert Well Per Vert Well Per Vert Well Per Vert Well 4.6% Sev Tax 7.5% Sev Tax Horizontal Well $
0 0 0 0 0.00 0.00 0.00 0.00
1 200 68000 61200 24.07 8158.28 7342.45 4,670,784.00 30,766.71 4,701,550.71 493,000.00
2 72 24480 22032 10.98 3732.65 3359.39 1,681,482.24 14,076.66 1,695,558.90 177,480.00
3 46 15640 14076 4.74 1610.96 1449.86 1,074,280.32 6,075.29 1,080,355.61 113,390.00
4 34 11560 10404 2.00 680.00 612.00 794,033.28 2,564.43 796,597.71 83,810.00
5 28 9520 8568 2.00 680.00 612.00 653,909.76 2,564.43 656,474.19 69,020.00
6 28 9520 8568 2.00 680.00 612.00 653,909.76 2,564.43 656,474.19 69,020.00
7 24 8160 7344 2.00 680.00 612.00 560,494.08 2,564.43 563,058.51 59,160.00
8 21 7140 6426 2.00 680.00 612.00 490,432.32 2,564.43 492,996.75 51,765.00
9 18 6120 5508 2.00 680.00 612.00 420,370.56 2,564.43 422,934.99 44,370.00
10 16 5440 4896 2.00 680.00 612.00 373,662.72 2,564.43 376,227.15 39,440.00
48.7
10Year Total 165580 149022 18261.89 16435.70
10Yr Total x13.5 Pessimistic 2011797 2011797
100%NRI IRR 30%
100%NRI NPV 4% $4,837,166.62
Aus Tex IRR 25%
Aus TexNPV 4% $4,057,014.54
For
per
sona
l use
onl
y

47 | P a g e
Annual Operating Royalty Total Cash Total Cash Aus-Tex Cumulative Aus-Tex Cum Net
Cost At 25%Avg Flow Flow Inc Cash Flow @93.5% WI Cash Flow Cash Flow @93.5% WI
$ $ $ 2 $ $ $
7,451,780.00 0.00 -7,451,780.00 -7,451,780.00 -7,451,780.00 -7,451,780.00 -7,451,780.00
36,000.00 1,175,387.68 2,997,163.03 5,994,326.06 5,604,694.87 -1,457,453.94 -1,362,719.43
36,000.00 423,889.73 1,058,189.18 2,116,378.35 1,978,813.76 658,924.42 616,094.33
36,000.00 270,088.90 660,876.71 1,321,753.42 1,235,839.45 1,980,677.84 1,851,933.78
36,000.00 199,149.43 477,638.28 955,276.57 893,183.59 2,935,954.41 2,745,117.37
36,000.00 164,118.55 387,335.64 774,671.29 724,317.66 3,710,625.70 3,469,435.03
36,000.00 164,118.55 387,335.64 774,671.29 724,317.66 4,485,296.99 4,193,752.68
36,000.00 140,764.63 327,133.88 654,267.77 611,740.36 5,139,564.76 4,805,493.05
36,000.00 123,249.19 281,982.56 563,965.13 527,307.40 5,703,529.89 5,332,800.44
36,000.00 105,733.75 236,831.24 473,662.49 442,874.43 6,177,192.37 5,775,674.87
36,000.00 94,056.79 206,730.36 413,460.73 386,585.78 6,590,653.10 6,162,260.65
For
per
sona
l use
onl
y

48 | P a g e
Table 2 EAGLE FORD Optimistic Case
NET CASH FLOW HORIZONTAL EAGLE FORD WELL ( 10 Year Life)
OPTIMISTIC Average 25% Royalty
16.8 Fold Production Increase for Horizontal well
Year Production Production Optim Prodn Production Production Optim Prodn AnnualRevenue Annual Revenue Annual RevenueAnnual Hauling
BBL Oil/Day BBl Oil / Year BBl Oil / Year MCF Gas/Day MCF Gas/YearMCF Gas/Year at $80 Barrel at $4.53/MCF Total Gas Oil Cost
Per Vert Well Per Vert Well Per Vert Well Per Vert Well Per Vert Well Per Vert Well 4.6% Sev Tax 7.5% Sev Tax Horizontal Well $
0 0 0 0 0.00 0.00 0.00 0.00
1 200 68000 74800 24.07 8158.28 8974.11 5,708,736.00 37,603.76 5,746,339.76 493,000.00
2 72 24480 26928 10.98 3732.65 4105.92 2,055,144.96 17,204.81 2,072,349.77 177,480.00
3 46 15640 17204 4.74 1610.96 1772.06 1,313,009.28 7,425.36 1,320,434.64 113,390.00
4 34 11560 12716 2.00 680.00 748.00 970,485.12 3,134.31 973,619.43 83,810.00
5 28 9520 10472 2.00 680.00 748.00 799,223.04 3,134.31 802,357.35 69,020.00
6 28 9520 10472 2.00 680.00 748.00 799,223.04 3,134.31 802,357.35 69,020.00
7 24 8160 8976 2.00 680.00 748.00 685,048.32 3,134.31 688,182.63 59,160.00
8 21 7140 7854 2.00 680.00 748.00 599,417.28 3,134.31 602,551.59 51,765.00
9 18 6120 6732 2.00 680.00 748.00 513,786.24 3,134.31 516,920.55 44,370.00
10 16 5440 5984 2.00 680.00 748.00 456,698.88 3,134.31 459,833.19 39,440.00
10Year Total 165580 182138 18261.89 20088.08
10Yr Total x13.5 Optimistic 2458863.00 271189.07
100% WI IRR 48%
100% NPV 4% $8,083,174.26
Aus Tex IRR 42%
Aus Tex NPV 4% $7,092,031.68
For
per
sona
l use
onl
y

49 | P a g e
Annual Operating Royalty Total Cash Total Cash Aus-Tex Cumulative Aus-Tex Cum Net
Cost At 25%Avg Flow Flow Inc Cash Flow @93.5% WI Cash Flow Cash Flow @93.5% WI
$ $ $ 2 $ $ $
7,451,780.00 0.00 -7,451,780.00 -7,451,780.00 -7,451,780.00 -7,451,780.00 -7,451,780.00
36,000.00 1,436,584.94 3,780,754.82 7,561,509.63 7,070,011.51 109,729.63 102,597.21
36,000.00 518,087.44 1,340,782.33 2,681,564.66 2,507,262.95 2,791,294.29 2,609,860.16
36,000.00 330,108.66 840,935.98 1,681,871.96 1,572,550.28 4,473,166.25 4,182,410.44
36,000.00 243,404.86 610,404.57 1,220,809.14 1,141,456.55 5,693,975.39 5,323,866.99
36,000.00 200,589.34 496,748.01 993,496.02 928,918.78 6,687,471.41 6,252,785.77
36,000.00 200,589.34 496,748.01 993,496.02 928,918.78 7,680,967.43 7,181,704.54
36,000.00 172,045.66 420,976.97 841,953.94 787,226.93 8,522,921.37 7,968,931.48
36,000.00 150,637.90 364,148.69 728,297.38 680,958.05 9,251,218.75 8,649,889.53
36,000.00 129,230.14 307,320.41 614,640.82 574,689.17 9,865,859.57 9,224,578.70
36,000.00 114,958.30 269,434.89 538,869.78 503,843.24 10,404,729.35 9,728,421.94
For
per
sona
l use
onl
y

50 | P a g e
AUSTIN CHALK Base Case
NET CASH FLOW AUSTIN CHALK VERT WELL ( 10 Year Life)Assume 100% Working Interest - Average 25% Royalty
1 Well
Assume Three Fold Increase
Year Production Production Production Production AnnualRevenue Annual Revenue Annual Revenue Annual Hauling
BBL Oil/Day BBl Oil / Year MCF Gas/Day MCF Gas/Year at $80 Barrel at $4.53/MCF Total Cost
Per Vert Well Per Vert Well Per Vert Well Per Vert Well 4.6% Sev Tax 7.5% Sev Tax Gas Oil $
0 0 0 0 0.00 0.00 0.00 0.00
1 113.4 38556.00 370.60 126004.00 2,942,593.92 527,988.26 3,470,582.18 279,531.00
2 82.21 27951.40 267.15 90831.00 2,133,250.85 380,604.60 2,513,855.45 202,647.65
3 25.97 8829.80 219.29 74558.60 673,890.34 312,419.17 986,309.51 64,016.05
4 22.97 7809.80 191.79 65208.60 596,043.94 273,240.34 869,284.27 56,621.05
5 19.97 6789.80 164.29 55858.60 518,197.54 234,061.50 752,259.03 49,226.05
6 16.97 5769.80 136.79 46508.60 440,351.14 194,882.66 635,233.80 41,831.05
7 13.97 4749.80 109.29 37158.60 362,504.74 155,703.82 518,208.56 34,436.05
8 10.97 3729.80 81.79 27808.60 284,658.34 116,524.99 401,183.32 27,041.05
9 7.97 2709.80 54.29 18458.60 206,811.94 77,346.15 284,158.08 19,646.05
10 4.97 1689.80 26.79 9108.60 128,965.54 38,167.31 167,132.85 12,251.05
10Year Total 325757.40 1654511.40
Aus Tex NPV $11,977,535.52
IRR 107%
For
per
sona
l use
onl
y

51 | P a g e
Annual Operating Royalty Total Cash Total Cash Aus-Tex Cumulative Cumulative Net Aus-Tex Cumulative
Cost At 25%Avg Flow Flow Inc Cash [email protected] Cash Flow Net Cash [email protected]
$ $ $ 3 $ $ $
4,529,875.00 0.00 -4,529,875.00 -4,529,875.00 -4,529,875.00 -4,529,875.00 -4,529,875.00
36,000.00 867,645.55 2,287,405.64 6,862,216.91 6,416,172.81 2,332,341.91 2,180,739.68
36,000.00 628,463.86 1,646,743.93 4,940,231.80 4,619,116.74 7,272,573.71 6,799,856.42
36,000.00 246,577.38 639,716.08 1,919,148.25 1,794,403.61 9,191,721.96 8,594,260.03
36,000.00 217,321.07 559,342.15 1,678,026.46 1,568,954.74 10,869,748.42 10,163,214.77
36,000.00 188,064.76 478,968.23 1,436,904.68 1,343,505.87 12,306,653.10 11,506,720.65
36,000.00 158,808.45 398,594.30 1,195,782.89 1,118,057.01 13,502,435.99 12,624,777.65
36,000.00 129,552.14 318,220.37 954,661.11 892,608.14 14,457,097.10 13,517,385.79
36,000.00 100,295.83 237,846.44 713,539.32 667,159.27 15,170,636.42 14,184,545.06
36,000.00 71,039.52 157,472.51 472,417.54 441,710.40 15,643,053.97 14,626,255.46
36,000.00 41,783.21 77,098.59 231,295.76 216,261.53 15,874,349.72 14,842,516.99
For
per
sona
l use
onl
y

52 | P a g e
AUSTIN CHALK Pessimistic Case
NET CASH FLOW AUSTIN CHALK VERT WELL ( 10 Year Life)
PESSIMISTIC Average 25% Royalty
1 Well
Assume Three Fold Increase
Year Production Production Pess Prodn Production Production Pess Prodn AnnualRevenue Annual Revenue Annual RevenueAnnual Hauling
BBL Oil/Day BBl Oil / Year BBl Oil / Year MCF Gas/Day MCF Gas/YearMCF Gas/Year at $80 Barrel at $4.53/MCF Total Cost
Per Vert Well Per Vert Well Per Vert Well Per Vert Well Per Vert Well Per Vert Well 4.6% Sev Tax 7.5% Sev Tax Gas Oil $
0 0 0 0 0.00 0.00 0.00 0.00
1 113.4 38556.00 34700.40 370.60 126004.00 113403.60 2,648,334.53 475,189.43 3,123,523.96 279,531.00
2 82.21 27951.40 25156.26 267.15 90831.00 81747.90 1,919,925.76 342,544.14 2,262,469.90 202,647.65
3 25.97 8829.80 7946.82 219.29 74558.60 67102.74 606,501.30 281,177.26 887,678.56 64,016.05
4 22.97 7809.80 7028.82 191.79 65208.60 58687.74 536,439.54 245,916.30 782,355.84 56,621.05
5 19.97 6789.80 6110.82 164.29 55858.60 50272.74 466,377.78 210,655.35 677,033.13 49,226.05
6 16.97 5769.80 5192.82 136.79 46508.60 41857.74 396,316.02 175,394.40 571,710.42 41,831.05
7 13.97 4749.80 4274.82 109.29 37158.60 33442.74 326,254.26 140,133.44 466,387.70 34,436.05
8 10.97 3729.80 3356.82 81.79 27808.60 25027.74 256,192.50 104,872.49 361,064.99 27,041.05
9 7.97 2709.80 2438.82 54.29 18458.60 16612.74 186,130.74 69,611.53 255,742.28 19,646.05
10 4.97 1689.80 1520.82 26.79 9108.60 8197.74 116,068.98 34,350.58 150,419.56 12,251.05
10Year Total 108585.80 97727.22 1654511.40 1654511.40
10 Year Totalx 3 325757.40 293181.66 4963534.20 4963534.20
100% WI IRR 99%
NPV @4% $11,079,122.98
Aus Tex IRR 90%
Aus TexNPV @4% $10,075,862.80
For
per
sona
l use
onl
y

53 | P a g e
Annual Operating Royalty Total Cash Total Cash Aus-Tex Cumulative Net Aus-Tex Cumulative
Cost At 25%Avg Flow Flow Inc Cash [email protected] Cash Flow Net Cash [email protected]
$ $ $ 3 $ $ $
4,529,875.00 0.00 -4,529,875.00 -4,529,875.00 -4,529,875.00 -4,529,875.00 -4,529,875.00
36,000.00 780,880.99 2,027,111.97 6,081,335.92 5,686,049.08 1,551,460.92 1,450,615.96
36,000.00 565,617.48 1,458,204.78 4,374,614.33 4,090,264.40 5,926,075.24 5,540,880.35
36,000.00 221,919.64 565,742.87 1,697,228.61 1,586,908.75 7,623,303.85 7,127,789.10
36,000.00 195,588.96 494,145.83 1,482,437.50 1,386,079.06 9,105,741.35 8,513,868.16
36,000.00 169,258.28 422,548.80 1,267,646.40 1,185,249.38 10,373,387.75 9,699,117.54
36,000.00 142,927.60 350,951.76 1,052,855.29 984,419.70 11,426,243.04 10,683,537.24
36,000.00 116,596.93 279,354.73 838,064.18 783,590.01 12,264,307.22 11,467,127.25
36,000.00 90,266.25 207,757.69 623,273.08 582,760.33 12,887,580.30 12,049,887.58
36,000.00 63,935.57 136,160.66 408,481.97 381,930.64 13,296,062.27 12,431,818.22
36,000.00 37,604.89 64,563.62 193,690.87 181,100.96 13,489,753.13 12,612,919.18
For
per
sona
l use
onl
y

54 | P a g e
AUSTIN CHALK Optimistic Case
NET CASH FLOW AUSTIN CHALK VERT WELL ( 10 Year Life)
OPTIMISTIC Average 25% Royalty
1 Well
Assume Three Fold Increase
Year Production Production Optim Prodn Production Production Optim Prodn AnnualRevenue Annual Revenue Annual RevenueAnnual Hauling
BBL Oil/Day BBl Oil / Year BBl Oil / Year MCF Gas/Day MCF Gas/Year MCF Gas/Year at $80 Barrel at $4.53/MCF Total Cost
Per Vert Well Per Vert Well Per Vert Well Per Vert Well Per Vert Well Per Vert Well 4.6% Sev Tax 7.5% Sev Tax Gas Oil $
0 0 0 0 0.00 0.00 0.00 0.00
1 113.4 38556.00 42411.60 370.60 126004.00 138604.40 3,236,853.31 580,787.09 3,817,640.40 279,531.00
2 82.21 27951.40 30746.54 267.15 90831.00 99914.10 2,346,575.93 418,665.06 2,765,240.99 202,647.65
3 25.97 8829.80 9712.78 219.29 74558.60 82014.46 741,279.37 343,661.09 1,084,940.46 64,016.05
4 22.97 7809.80 8590.78 191.79 65208.60 71729.46 655,648.33 300,564.37 956,212.70 56,621.05
5 19.97 6789.80 7468.78 164.29 55858.60 61444.46 570,017.29 257,467.65 827,484.94 49,226.05
6 16.97 5769.80 6346.78 136.79 46508.60 51159.46 484,386.25 214,370.93 698,757.18 41,831.05
7 13.97 4749.80 5224.78 109.29 37158.60 40874.46 398,755.21 171,274.21 570,029.42 34,436.05
8 10.97 3729.80 4102.78 81.79 27808.60 30589.46 313,124.17 128,177.48 441,301.65 27,041.05
9 7.97 2709.80 2980.78 54.29 18458.60 20304.46 227,493.13 85,080.76 312,573.89 19,646.05
10 4.97 1689.80 1858.78 26.79 9108.60 10019.46 141,862.09 41,984.04 183,846.13 12,251.05
10Year Total 108585.80 119444.38 1654511.40 1654511.40
10 Year Totalx 3 325757.40 358333.14 4963534.20 4963534.20
100% WI IRR 134%
NPV @4% $15,146,872.11
Aus Tex IRR 123%
Aus TexNPV @4% $13,879,208.24
For
per
sona
l use
onl
y

55 | P a g e
Annual Operating Royalty Total Cash Total Cash Aus-Tex Cumulative Net Aus-Tex Cumulative
Cost At 25%Avg Flow Flow Inc Cash [email protected] Cash Flow Net Cash [email protected]
$ $ $ 3 $ $ $
4,529,875.00 0.00 -4,529,875.00 -4,529,875.00 -4,529,875.00 -4,529,875.00 -4,529,875.00
36,000.00 954,410.10 2,547,699.30 7,643,097.90 7,146,296.53 3,113,222.90 2,910,863.41
36,000.00 691,310.25 1,835,283.09 5,505,849.28 5,147,969.08 8,619,072.18 8,058,832.48
36,000.00 271,235.12 713,689.30 2,141,067.89 2,001,898.47 10,760,140.06 10,060,730.96
36,000.00 239,053.17 624,538.47 1,873,615.42 1,751,830.42 12,633,755.49 11,812,561.38
36,000.00 206,871.23 535,387.65 1,606,162.96 1,501,762.37 14,239,918.45 13,314,323.75
36,000.00 174,689.29 446,236.83 1,338,710.50 1,251,694.32 15,578,628.94 14,566,018.06
36,000.00 142,507.35 357,086.01 1,071,258.04 1,001,626.26 16,649,886.98 15,567,644.33
36,000.00 110,325.41 267,935.19 803,805.57 751,558.21 17,453,692.55 16,319,202.54
36,000.00 78,143.47 178,784.37 536,353.11 501,490.16 17,990,045.66 16,820,692.69
36,000.00 45,961.53 89,633.55 268,900.65 251,422.10 18,258,946.31 17,072,114.80
For
per
sona
l use
onl
y

56 | P a g e
Table 9 Data Source limited to prior wells drilled only on Birch Prospect lease Units
Figure 13 Decline Curve Vertical well Economics from table 5 (Birch Prospect Wells only)
Birch Prospect 10 year Well Depreciation at 200 BOPD and $80 WTI 0.04
Year Bbls/day 340 day/y WTI = $80 $ Before ORI ORI Value (25%) ORI Value (75%) Minus Cost ($36000/y) NRI = 70.125 (AKK) Discounted Cash Flow
1 200 340 80.00$ 5,440,000.00$ 1,360,000.00$ 4,080,000.00$ 4,044,000.00$ 1,160,946.00$ 1,116,294.23$
2 72 340 80.00$ 4,896,000.00$ 1,224,000.00$ 3,672,000.00$ 3,636,000.00$ 2,549,745.00$ 2,357,382.58$
3 46 340 80.00$ 4,352,000.00$ 1,088,000.00$ 3,264,000.00$ 3,228,000.00$ 2,263,635.00$ 2,012,363.27$
4 34 340 80.00$ 3,808,000.00$ 952,000.00$ 2,856,000.00$ 2,820,000.00$ 1,977,525.00$ 1,690,396.66$
5 28 340 80.00$ 3,264,000.00$ 816,000.00$ 2,448,000.00$ 2,412,000.00$ 1,691,415.00$ 1,390,219.84$
6 28 340 80.00$ 2,720,000.00$ 680,000.00$ 2,040,000.00$ 2,004,000.00$ 1,405,305.00$ 1,110,632.95$
7 24 340 80.00$ 2,176,000.00$ 544,000.00$ 1,632,000.00$ 1,596,000.00$ 1,119,195.00$ 850,496.22$
8 21 340 80.00$ 1,632,000.00$ 408,000.00$ 1,224,000.00$ 1,188,000.00$ 833,085.00$ 608,727.05$
9 18 340 80.00$ 1,088,000.00$ 272,000.00$ 816,000.00$ 780,000.00$ 546,975.00$ 384,297.38$
10 16 340 80.00$ 544,000.00$ 136,000.00$ 408,000.00$ 372,000.00$ 260,865.00$ 176,231.05$
29,920,000.00$ 7,480,000.00$ 22,440,000.00$ 22,080,000.00$ 13,808,691.00$ 11,697,041.23$
0
50
100
150
200
250
0 2 4 6 8 10 12
Bar
rels
of
Oil
Years
Birch Prospect
For
per
sona
l use
onl
y

57 | P a g e
5 FORM-51-101F2 REPORT ON RESERVES DATA
BY INDEPENDENT QUALIFIED RRESERVES EVALUATOR OR AUDITOR
This is the form referred to in item 2 of section 2.1 of National Instrument 51-101 Standards of disclosure for Oil and Gas Activities (“NI 51-101”) 1. Terms to which a meaning is ascribed in NI 51-101 have the same meaning in this form. 2. The report on reserves data referred to in item 2 of section2.1 of NI 51-101 to be executed by one or more qualified reserves evaluators
or auditors independent of the reporting issuer, shall in all respects be as follows: 5.1 Report on Reserves Data To the Board of Directors of Aus Tex Exploration Inc.
1. We have evaluated the Company’s resources data as of June 15, 2011. There is insufficient data to calculate reserves. The resources data consists of prospective oil resources.
2. The resources data is the responsibility of the Company’s management. Our responsibility is to express an opinion on the resources data based on our evaluation.
We carried out our evaluation in accordance with the standards set out in the Canadian Oil and Gas Evaluation Handbook (the “COGE Handbook”) prepared jointly by the Society of Petroleum Evaluation Engineers (Calgary Chapter) and the Canadian Institute of Mining, Metallurgy & Petroleum (Petroleum Society)
3. Those standards require that we plan and perform an evaluation to obtain reasonable assurance as to whether the resources and data
are free of material misstatement .An evaluation also includes preparing estimates of resources data in accordance with the principles
and definitions presented in the COGE Handbook.
For
per
sona
l use
onl
y

58 | P a g e
4. The following table sets forth the estimated resources of the company evaluated by us as of June 1st, 2011 and identifies the respective portions thereof we have evaluated and reported on to the Company’s management.
Eagle Ford Table 1 All Burleson County Well Data
Independent Qualities Reserves
Evaluator or Auditor
Description and date of
Report
Location of Reserves
(Country or Foreign
Geographic Area)
Audited Prospective Evaluated
Resources Reviewed
Total
William M. Mitchel
Richard F. Braun
Evaluation Report
June 1st, 2011
Burleson County,
Texas, USA
0 Low $327,333 Base $ 1,853,748 High $ 3,380,162 Spent $ 366,345
0 Low $327,333 Base $ 1,853,748 High $ 3,380,162 Spent $ 366,345
Totals 0 Low $327,333 Base $ 1,853,748 High $ 3,380,162 Spent $ 366,345
0 Low $327,333 Base $ 1,853,748 High $ 3,380,162 Spent $ 366,345
Table 2 Burleson County Production (Excluding probable dry hole equivalence)
Independent Qualities Reserves
Evaluator or Auditor
Description and date of
Report
Location of Reserves
(Country or Foreign
Geographic Area)
Audited Prospective Evaluated
Resources Reviewed
Total
William M. Mitchel
Richard F. Braun
Evaluation Report
June 1st, 2011
Burleson County,
Texas, USA
0 Low $2,615,829 Base $ 4,438,167 High $ 6,260,505 Spent $ 366,345
0 Low $2,615,829 Base $ 4,438,167 High $ 6,260,505 Spent $ 366,345
Totals 0 Low $2,615,829 Base $ 4,438,167 High $ 6,260,505 Spent $ 366,345
0 Low $2,615,829 Base $ 4,438,167 High $ 6,260,505 Spent $ 366,345
For
per
sona
l use
onl
y

59 | P a g e
Table 3 Wells drilled within Birch unit only
Independent Qualities Reserves
Evaluator or Auditor
Description and date of
Report
Location of Reserves
(Country or Foreign
Geographic Area)
Audited Prospective Evaluated
Resources Reviewed
Total
William M. Mitchel
Richard F. Braun
Evaluation Report
June 1st, 2011
Burleson County,
Texas, USA
0 Low $4,057,014 Base $ 5,547,523 High $ 7,092,031 Spent $ 366,345
0 Low $ 4,057,014 Base $ 5,547,523 High $ 7,092,031 Spent $ 366,345
Totals 0 Low $ 4,057,014 Base $ 5,547,523 High $ 7,092,031 Spent $ 366,345
0 Low $4,057,014 Base $ 5,547,523 High $7,092,031 Spent $ 366,345
Austin Chalk
Independent Qualities Reserves
Evaluator or Auditor
Description and date of
Report
Location of Reserves
(Country or Foreign
Geographic Area)
Audited Prospective Evaluated
Resources Reviewed
Total
William M. Mitchel
Richard F. Braun
Evaluation Report
June 1st, 2011
Burleson County,
Texas, USA
0 Low $10,075,862 Best $11,977,535 High $ 13,879,208 Spent $ 366,345
0 Low $10,075,862 Best $11,977,535 High $ 13,879,208 Spent $ 366,345
Totals 0 Low $10,075,862 Best $11,977,535 High $ 13,879,208 Spent $ 366,345
0 Low $10,075,862 Best $11,977,535 High $ 13,879,208 Spent $ 366,345
5. In our opinion, the resources data respectively evaluated by us have, in all material respects, been determined and are in accordance with the COGE Handbook. We express no opinion on the resources data that we reviewed but did not audit or evaluate; however, to our knowledge, all data were evaluated. 6. We have no responsibility to update our reports referred to in paragraph4 for events and circumstances occurring after their respective preparation dates. F
or p
erso
nal u
se o
nly

60 | P a g e
For
per
sona
l use
onl
y

61 | P a g e
6 CONSENT LETTER
For
per
sona
l use
onl
y

62 | P a g e
7 CERTIFICATE OF QUALIFICATION
For
per
sona
l use
onl
y

63 | P a g e
For
per
sona
l use
onl
y

64 | P a g e
Appendix 1-Selected Data from H.H. Howell, Inc
Figure 14 H.H Howell, Inc. Birch Prospect details
For
per
sona
l use
onl
y

65 | P a g e
Figure 15 Eagle Ford trend Map, South Texas
For
per
sona
l use
onl
y

66 | P a g e
Figure 16 Burleson County, Texas – Birch Prospect and adjacent wells
N
Birch Prospect
Clayton WilliamsSmalley-Robinson
Unit #1, IP=492 BOPD
Clayton WilliamsBroesche
Unit #1, IP=234 BOPD
Apache Wells
For
per
sona
l use
onl
y

67 | P a g e
Figure 17 Birch Prospect Units-Burleson County
Krueger Unit4 Tracts293.954 acres
Stern Unit2 Tracts270.1746 acres
Tschoerner Unit3 Tracts351.8067 acres
Birch Prospect – Burleson County, Texas
For
per
sona
l use
onl
y

68 | P a g e
Figure 18 Austin Chalk production Bubble Map, Burleson County
For
per
sona
l use
onl
y

69 | P a g e
Figure 19 A-A' Cross Section (West-East) Birch Prospect
For
per
sona
l use
onl
y

70 | P a g e
Figure 20 B-B' Cross Section (SouthWest-NorthEast) Birch Prospect
For
per
sona
l use
onl
y

71 | P a g e
Figure 21 Z-Z' Cross Section at Gonzales County
For
per
sona
l use
onl
y

72 | P a g e
Figure 22 Log Comparison: Log from Gonzales County vs Log at Birch Prospect
RIEDEL, BJ. #1 (IP=575 BOPD)
Gonzales County (South West of AKK Lease)
KRUEGER, L. #1
At AKK lease
Type Logs
For
per
sona
l use
onl
y

73 | P a g e
Birch Prospect – Pressure Data
From 3 wells mud log data (within AKK lease):
CHMELAR, E. . #1A
“Gas kick @ 8940’, Increasing Gas @ 9000’, High sustained gaskicks: @9090’-9116’ & @9125’-9140’.”
FOJTIK UNIT #1
“Gas kick @ 9075’-9085’, Mud weight 9.4# to 8.7# and 9095’-TD.”
RUST #1
“Gas kick @ 9760’-9800’, Mud weight 9.5# to 9.3# and 9810’-9830’.”
Pressure gradient of 0.488-0.494 psi/ft>0.465 psi/ft making the EagleFordan abnormallypressured formation.
For
per
sona
l use
onl
y

74 | P a g e
Figure 23 Well Mechanical Diagram from Apache Well Getty Giesenschlag C#1
For
per
sona
l use
onl
y

75 | P a g e
Appendix 2 - ABBREVIATIONS AND CONVERSIONS
In this document, the abbreviations set forth below have the following meanings: Oil and Natural Gas Liquids Natural Gas Natural Gas Bbl - barrel Mcf thousand cubic feet Bbls - barrels MMcf million cubic feet Mbbls - thousands of barrels Mcf/d thousand cubic feet per day MMbbls - million barrels MMcf/d million cubic feet per day Mstb - 1,000 stock tank barrels MMBTU million British Thermal Units bbls/d - barrels per day Bcf billion cubic feet bopd - barrels of oil per day GJ gigajoule NGLs - natural gas liquids stb - stock tank barrels API - American Petroleum Institute °API an indication of the specific gravity of crude oil measured on the API gravity scale. Liquid petroleum with a specified gravity of 28° API or higher is generally referred to as light crude oil. BOE barrel of oil equivalent on the basis of 1 BOE to 6 Mcf of natural gas. BOEs may be misleading, particularly if used in isolation. A BOE conversion ratio of 1 BOE for 6 Mcf is based on an energy equivalency conversion method primarily applicable at the burner tip and does not represent a value equivalency at the wellhead. BOE/d - barrel of oil equivalent per day m3 - cubic meters $000s - thousands of dollars WTI - West Texas Intermediate, the reference price paid in U.S. dollars at Cushing, Oklahoma for crude oil of standard grade
NOTES AND DEFINITIONS The determination of oil and gas reserves involves the preparation of estimates that have an inherent degree of associated uncertainty. Categories of proved, probable and possible reserves have been established to reflect the level of these uncertainties and to provide an indication of the probability of recovery. The estimation and classification of reserves requires the application of professional judgment combined with geological and engineering knowledge to assess whether or not specific reserves classification criteria have been satisfied. Knowledge of concepts including uncertainty and risk, probability and statistics, and deterministic and probabilistic estimation methods is required to properly use and apply reserves definitions. “Reserves” are estimated remaining quantities of oil and natural gas and related substances anticipated to be recoverable from known accumulations, from a given date forward, based on (a) analysis of drilling, geological, geophysical, and engineering data; (b) the use of established technology; and (c) specified economic conditions, which are generally accepted as being reasonable and shall be disclosed. Reserves are classified according to the degree of certainty associated with the estimates. “Proved” reserves are those reserves that can be estimated with a high degree of certainty to be recoverable. It is likely that the actual remaining quantities recovered will exceed the estimated proved reserves. “Developed Producing” reserves are those reserves that are expected to be recovered from completion intervals open at the time of the estimate. These reserves may be currently producing or, if shut-in, they must have previously been on production, and the date of resumption of production must be known with reasonable certainty. “Developed Non-Producing” reserves are those reserves that either have not been on production, or have previously been on production, but are shut-in, and the date of resumption of production is unknown.
For
per
sona
l use
onl
y

76 | P a g e
“Undeveloped” reserves are those reserves expected to be recovered from known accumulations where a significant expenditure (e.g., when compared to the cost of drilling a well) is required to render them capable of production. They must fully meet the requirements of the reserves classification (proved, probable, possible) to which they are assigned. In multi-well pools, it may be appropriate to allocate total pool reserves between the developed and undeveloped categories or to sub-divide the developed reserves for the pool between developed producing and developed nonproducing. This allocation should be based on the estimator’s assessment as to the reserves that will be recorded from specific wells, facilities and completion intervals in the pool and their respective development and production status. “Probable” reserves are those additional reserves that are less certain to be recovered than proved reserves. It is equally likely that the actual remaining quantities recovered will be greater or less than the sum of the estimated proved + probable reserves. “Probability” refers to the degree of certainty associated with the estimates of reserves. Reported reserves should target the following levels of certainty under a specific set of economic conditions: Pessimistic, Base and Optimistic. “Undiscovered Resources” are defined as those quantities of oil or gas estimated on a given date to be contained in accumulations yet to be discovered. The estimated potentially recoverable portion of undiscovered resources is classified as prospective resources. “Prospective Resources “are defined as those quantities of oil and gas estimated on a given date to be potentially recoverable from undiscovered accumulations. They are technically viable and economic to recover. The following terms, used in the preparation of the Report (as defined herein) and this document have the following meanings: “Associated gas” means the gas cap overlying a crude oil accumulation in a reservoir. “Constant prices and costs” means prices and costs used in an estimate that are: (a) the Company’s prices and costs as at the effective date of the estimation, held constant throughout the estimated lives of the properties to which the estimate applies; (b) if, and only to the extent that, there are fixed or presently determinable future prices or costs to which the Company is legally bound by a contractual or other obligation to supply a physical product, including those for an extension period of a contract that is likely to be extended, those prices or costs rather than the prices and costs referred to in paragraph (a). For the purpose of paragraph (a), the reporting issuer’s prices will be the posted price for oil and the spot price for gas, after historical adjustments for transportation, gravity and other factors “Company ” or “Aus-Tex .” means Aus-Tex Resources Inc. “Crude oil” or “Oil” means a mixture that consists mainly of pentanes and heavier hydrocarbons, which may contain sulphur and other non-hydrocarbon compounds, that is recoverable at a well from an underground reservoir and that is liquid at the conditions under which its volume is measured or estimated. It does not include solution gas or natural gas liquids. “Development costs” means costs incurred to obtain access to reserves and to provide facilities for extracting, treating, gathering and storing the oil and gas from the reserves. More specifically, development costs, including applicable operating costs of support equipment and facilities and other costs of development activities, are costs incurred to: (a) gain access to and prepare well locations for drilling, including surveying well locations for the purpose of determining specific development drilling sites, clearing ground, draining, road building, and relocating public roads, gas lines and power lines, to the extent necessary
For
per
sona
l use
onl
y

77 | P a g e
in developing the reserves; (b) drill and equip development wells, development type stratigraphic test wells and service wells, including the costs of platforms and of well equipment such as casing, tubing, pumping equipment and the wellhead assembly; (c) acquire, construct and install production facilities such as flow lines, separators, treaters, heaters, manifolds, measuring devices and production storage tanks, natural gas cycling and processing plants, and central utility and waste disposal systems; and (d) provide improved recovery systems. “Development well” means a well drilled inside the established limits of an oil or gas reservoir, or in close proximity to the edge of the reservoir, to the depth of a stratigraphic horizon known to be productive. “Exploration costs” means costs incurred in identifying areas that may warrant examination and in examining specific areas that are considered to have prospects that may contain oil and gas reserves, including costs of drilling exploratory wells and exploratory type stratigraphic test wells. Exploration costs may be incurred both before acquiring the related property (sometimes referred to in part as “prospecting costs”) and after acquiring the property. Exploration costs, which include applicable operating costs of support equipment and facilities and other costs of exploration activities, are geophysical crews and others conducting those studies (collectively sometimes referred to as “geological and geophysical costs”); (a) Costs of topographical, geochemical, geological and geophysical studies, rights of access to properties to conduct those studies, and salaries and other expenses of geologists, “Exploratory well” means a well that is not a development well, a service well or a stratigraphic test well. (b) costs of carrying and retaining unproved properties, such as delay rentals, taxes (other than income and capital taxes) on properties, legal costs for title defense, and maintenance of land and lease records; (c) dry hole contributions and bottom hole contributions; (d) costs of drilling and equipping exploratory wells; and (e) costs of drilling exploratory type stratigraphic test wells. “Field” means an area consisting of a single reservoir or multiple reservoirs all grouped on or related to the same individual geological structural feature and/or stratigraphic condition. There may be two or more reservoirs in a field that are separated vertically by intervening impervious strata or laterally by local geologic barriers, or both. Reservoirs that are associated by being in overlapping or adjacent fields may be treated as a single or common operational field. The geological terms “structural feature” and “stratigraphic condition” are intended to denote localized geological features, in contrast to broader terms such as “basin”, “trend”, “province”, “play” or “area of interest”. “Future prices and costs” means future prices and costs that are: (a) Generally accepted as being a reasonable outlook of the future; (b) if, and only to the extent that, there are fixed or presently determinable future prices or costs to which the Company issuer is legally bound by a contractual or other obligation to supply a physical product, including those for an extension period of a contract that is likely to be extended, those prices or costs rather than the prices and costs referred to in paragraph (a). “Future income tax expenses” means future income tax expenses estimated (generally, year-by-year): (a) Making appropriate allocations of estimated unclaimed costs and losses carried forward for tax purposes, between oil and gas activities and other business activities; (b) Without deducting estimated future costs (for example, Crown royalties) that are not deductible in computing taxable income; (c) Taking into account estimated tax credits and allowances (for example, royalty tax credits); and (d) Applying to the future pre-tax net cash flows relating to the reporting issuer’s oil and gas activities the appropriate year-end statutory tax rates, taking into account future tax rates already legislated.
For
per
sona
l use
onl
y

78 | P a g e
“Future net revenue” means the estimated net amount to be received with respect to the development and production of reserves (including synthetic oil, coal bed methane and other non-conventional reserves) estimated using constant prices and costs or forecast prices and costs. “Gross” means: (a) in relation to the Company’s interest in production or reserves, its “Company gross reserves”, are its working interest (operating or non-operating) share before deduction of royalties and without including any royalty interests of the Company; (b) in relation to wells, the total number of wells in which the Company has an interest; and (c) in relation to properties, the total area of properties in which the Company has an interest. “Natural gas” means the lighter hydrocarbons and associated non-hydrocarbon substances occurring naturally in an underground reservoir, which under atmospheric conditions are essentially gases but which may contain natural gas liquids. Natural gas can exist in a reservoir either dissolved in crude oil (solution gas) or in a gaseous phase (associated gas or non-associated gas). Non-hydrocarbon substances may include hydrogen sulphide, carbon dioxide and nitrogen. “Natural gas liquids” means those hydrocarbon components that can be recovered from natural gas as liquids including, but not limited to, ethane, propane, butanes, pentanes plus, condensate and small quantities of nonhydrocarbons. “Net” means: (a) in relation to the Company’s interest in production or reserves its working interest (operating or non operating) share after deduction of royalty obligations, plus its royalty interests in production or reserves; (b) in relation to the Company’s interest in wells, the number of wells obtained by aggregating the Company’s working interest in each of its gross wells; and (c) in relation to the Company’s interest in a property, the total area in which the Company has an interest multiplied by the working interest owned by the Company. “Non-associated gas” means an accumulation of natural gas in a reservoir where there is no crude oil. “Operating costs” or “production costs” means costs incurred to operate and maintain wells and related equipment and facilities, including applicable operating costs of support equipment and facilities and other costs of operating and maintaining those wells and related equipment and facilities. “Production” means recovering, gathering, treating, field or plant processing (for example, processing gas to extract natural gas liquids) and field storage of oil and gas. “Property” includes: (a) Fee ownership or a lease, concession, agreement, permit, license or other interest representing the right to extract oil or gas subject to such terms as may be imposed by the conveyance of that interest; (b) Royalty interests, production payments payable in oil or gas, and other non-operating interests in properties operated by others; and (c) An agreement with a foreign government or authority under which a reporting issuer participates in the operation of properties or otherwise serves as “producer” of the underlying reserves (in contrast to being an independent purchaser, broker, dealer or importer). A property does not include supply agreements, or contracts that represent a right to purchase, rather than extract, oil or gas. “Property acquisition costs” means costs incurred to acquire a property (directly by purchase or lease or indirectly by acquiring another corporate entity with an interest in the property), including: (a) Costs of lease bonuses and options to purchase or lease a property; (b) The portion of the costs applicable to hydrocarbons when land including rights to hydrocarbons is purchased in fee; (c) Brokers’ fees, recording and registration fees, legal costs and other costs incurred in acquiring properties.
For
per
sona
l use
onl
y

79 | P a g e
“Proved property” means a property or part of a property to which reserves have been specifically attributed. “Reservoir” means a porous and permeable underground formation containing a natural accumulation of producible oil or gas that is confined by impermeable rock or water barriers and is individual and separate from other reservoirs. “Service well” means a well drilled or completed for the purpose of supporting production in an existing field. Wells in this class are drilled for the following specific purposes: gas injection (natural gas, propane, butane or flue gas), water injection, steam injection, air injection, salt-water disposal, water supply for injection, observation, or injection for combustion. “Solution gas” means natural gas dissolved in crude oil. “Stratigraphic test well” means a drilling effort, geologically directed, to obtain information pertaining to a specific geologic condition. Ordinarily, such wells are drilled without the intention of being completed for hydrocarbon production. They include wells for the purpose of core tests and all types of expendable holes related to hydrocarbon exploration. Stratigraphic test wells are classified as (a) exploratory type” if not drilled into a proved property; or (b)“development type”, if drilled into a proved property. Development type stratigraphic wells are also referred to as “evaluation wells”. “Support equipment and facilities” means equipment and facilities used in oil and gas activities, including seismic equipment, drilling equipment, construction and grading equipment, vehicles, repair shops, warehouses, supply points, camps, and division, district or field offices. “Unproved property” means a property or part of a property to which no reserves have been specifically attributed. “Well abandonment costs” means costs of abandoning a well and surface lease reclamation.
For
per
sona
l use
onl
y

80 | P a g e
Appendix 3 – Select Data on Eagle Ford Play reported by Texas Railroad Commission
http://www.rrc.state.tx.us/eagleford/index.php
For
per
sona
l use
onl
y

81 | P a g e
Figure 24 Well permits 2011, Burleson County
Burleson County
Wells Permitted &
Completed29/04/2011
http://www.rrc.state.tx.us/eagleford/index.phpFor
per
sona
l use
onl
y

82 | P a g e
Figure 25 Production Increase, Texas
http://www.rrc.state.tx.us/eagleford/index.php
For
per
sona
l use
onl
y

83 | P a g e
Figure 26 Drilling Permits issued from 2008 till April 2011
http://www.rrc.state.tx.us/eagleford/index.php
For
per
sona
l use
onl
y

84 | P a g e
Figure 27 Texas Eagle Shale Condensate Production 2008-Feb. 2011
For
per
sona
l use
onl
y

85 | P a g e
Figure 28 Texas Eagle Ford Shale Gas Well Production 2008 through Feb. 2011
For
per
sona
l use
onl
y

86 | P a g e
Appendix 4 – Eagle Ford Shale production Plots-Source H. H. Howell, Inc.
For
per
sona
l use
onl
y

87 | P a g e
For
per
sona
l use
onl
y

88 | P a g e
Birch ProspectBubble map-A to A’ aerial view
For
per
sona
l use
onl
y

89 | P a g e
Birch ProspectBubble map-B to B’ aerial view
For
per
sona
l use
onl
y

90 | P a g e
Birch ProspectBubble map-Z to Z’ aerial view
For
per
sona
l use
onl
y

91 | P a g e
Appendix 5 RESUME OF WILLIAM M. MITCHELL
William M. Mitchell 859-625-1763 (h)
859-608-1517 (cell) e-mail:[email protected]
Education: BA, Geology, Hanover College
Graduate work, Geology, University of Kentucky
Summary:
Experience as environmental and petroleum consultant; inspector for US EPA; as a research scientist for a state geological survey and extensive experience with business to business sales.
Employment History ( beginning with most recent):
Geological Consultant
President, Green Hills Environmental, Somerset, Ky Full service environmental consulting & contracting company affiliated with Somerset Refinery
1.1.
Senior Environmental Employment Program of NOWCC assigned to Region 4 US Environmental Protection Agency/independent Geological Consultant
Worked four days per week as field inspector covering Eastern Kentucky in the Environmental Protection Agency’s Underground Injection Control Program. Made nearly 8000 cold calls
(inspections) in four year period.
Also provides geological consulting services to petroleum and environmental clients.
Hinkle Contracting Corp, Environmental Services Group Served as Environmental Manager, with business development responsibility for an eighteen person department. Services included underground storage tank issues, environmental & geotechnical drilling, site investigations, Phase I Site Assessments, demolition, and health and safety training. Efforts resulted in generation of $500,000 additional revenue in 2002 and 2003.
ATC Associates Inc. ( formerly ATEC Associates) Served as Project Geologist, 1994-96, Kentucky Sales Representative, 1996-98, and as Branch Manager/Business Development Manager 1998-2001.As Branch Manager, had supervisory and managerial responsibility for all sectors of ATC’s operations in Kentucky. The Louisville office of ATC had a staff of 20 to 25 professionals and one sales person. The Environmental Manager, Engineering manager, Drilling manager, sales person, and manager of construction materials testing are supervised directly by the Branch Manager. The Lexington office had an environmental staff of three
For
per
sona
l use
onl
y

92 | P a g e
and a Construction Materials Testing Staff of five. The Branch Manager had direct responsibility for profitability, constraining costs, accounts receivable collections, business development, personnel issues, and annual budget preparation for a $2,000,000 annual revenue operation. During tenure, environmental revenue increased 50%.
Research Geologist Indiana University, Indiana Geological Survey, Bloomington, Indiana Served as Principal Investigator for a groundwater investigation.
Condor Resources Inc., Slidell, Louisiana President, owner
Condor assembled oil and gas leases on the prospects and marketed the projects to firms in the petroleum industry for drilling.
Northcott Exploration, Metairie, Louisiana Senior Exploration Geologist
Job function involved the generation of oil and gas drilling projects, review of submittals from outside consultants and the marketing of assembled lease blocks to drilling companies.
Allegro Exploration, New Orleans South Louisiana Exploration Manager
Job function was to manage the New Orleans operations, generated drillable oil and gas projects and to sell the projects to operating companies in the petroleum industry.
Texaco Inc., New Orleans, Louisiana Served in various positions from staff geologist to District geologist.
Professional Geologist Registration: Kentucky #1426 Indiana #1529 Professional Society Memberships: Indiana-Kentucky Geological Society (past President) New Orleans Geological Society Houston Geological Society American Association of Petroleum Geologists Publications:
Assessment of the 3000 ppm and 10,000 ppm Total Dissolved Solid Boundaries in the Pennsylvanian Aquifers of Southwestern Indiana; Indiana Geological Survey Open File Report 94-2, 1994, 28 pages
For
per
sona
l use
onl
y

93 | P a g e
Assessment of the 3000 ppm and 10,000 ppm Total Dissolved Solid Boundaries in the Mississippian and Pennsylvanian Aquifers of Southwestern Indiana using Geophysical Logs; in Proceedings of the Illinois Basin Energy and Minerals Resources Workshop,P.25, September, 1994
Application of Petroleum Geology Techniques to an Environmental Study of Groundwater Resources in Southwestern Indiana; Proceedings of AAPG Annual Convention, P. 217, June 1994
For
per
sona
l use
onl
y

94 | P a g e
Appendix 6 RESUME OF RICHARD F BRAUN
Richard F. Braun 1723 S. Sand Lily Dr. Golden, CO 80401
Telephone (303) 526 7366 E - Mail [email protected]
RESUME
Professional Summary
15Years oil and gas prospect evaluation, project management and process development consulting experience.
15 Years oil and gas exploration and production executive management positions
15 Years operation and management Chemicals production Operations
Skilled in oil and gas prospect evaluation, development, operations and marketing
Experienced in all aspects of oil and gas business
Energetic self starter with excellent planning, evaluation and interpersonal skills
Large industry contact network
Skilled, experienced manager with excellent leadership skills
Consultative Projects
Support efforts to develop Natural gas and Coal prospects- West Hawk Development Corp. Served as Director and consulted on oil and gas development activities in Piceance Basin, Colorado.
Locate, evaluate and market oil and gas prospects. Market prospects to operating and investment groups
Locate and provide evaluation of potential natural gas supplies for Colorado and Texas Utilities. Low cost, secure natural gas prospects were located.
Managed development of new, patented technology for grinding ultra fine particles. Achieved commercial concept ahead of schedule and below budget.
For
per
sona
l use
onl
y

95 | P a g e
Professional Experience
Fuel Resources Development Co.
Executive Vice President, Chief Operating Officer, Fuel Resources Development
Co. (Fuelco). (Subsidiary of Public Service Co. of Colorado) Primary business
was oil and gas exploration, production and marketing. Leaseholds and
producing reservoirs were primarily in the Piceance Basin of western Colorado.
During my tenure assets nearly doubled to $90 Million. Fuelco took the lead on
an important alternative fuel project in Pueblo, Colorado. This project was
directed towards demonstrating the commercial feasibility of the RenTech Syngas
reactor. The goal was to utilize landfill methane and conversion of land fill
methane to diesel fuels.
SIRA Petroleum Corp.
President - Management and Consulting for West German petroleum investment
partnerships. Managed $50 Million producing oil and gas properties located in the
Rocky Mountains, Appalachian Mountains and Texas.
International Energy Funds GmbH (IEF)
Vice President - North America - International Energy Funds mission was to
invest West German limited partnership funds in oil and gas exploration and
production in North America. Developed and led the North American
organization. Investments, totaling approximately $80 Million were evaluated,
selected and managed by the North American group. Successful prospects were
acquired in New York, Pennsylvania, West Virginia, Texas, Colorado, Wyoming
and British Columbia. The extremely high success rate of the made this a leading
investment fund in West Germany, Primary areas of activity were the Piceance
Basin of Colorado and the Appalachian Basin in Western New York and
Pennsylvania.
FMC Corporation- Chemicals Group
Chief Operating Officer Oil and Gas Exploration / Production Division. Built the
organization to secure captive Natural Gas supplies for production facilities in
South Western Wyoming, Central California, Idaho, Tennessee and Iowa.
Held a series of operating, staff, management and executive positions.
Responsibilities included Hydrogen Peroxide plant management, Caustic-
Chlorine process improvement Project Management, Multiple Plant Operations
co-ordination, Specialty Chemicals Division Planning Manager, Packaging
Division Chief Operating Officer,
Willamette Iron and Steel Corp. ( Division of Guy F. Atkinson)
Design engineer. Products included mineral processing machinery, logging
machinery and hydroelectric mechanical equipment.
For
per
sona
l use
onl
y

96 | P a g e
Education
B. S. Mechanical Engineering, Stanford University
Graduate Business School, University of Oregon
Numerous technical seminars
Management Development Courses
Organizations
Society of Petroleum Engineers #3517494
Past member American Society of Mechanical Engineers
Junior Achievement Team Leader
Past President Kiwanis International
Former Volunteer Fire Fighter
Keystone Ski Area Mountain Ambassador Volunteer
Military
White Sands Proving Grounds, New Mexico. Assigned to Modifications Section. Responsible
for design, installation, operation and evaluation of special, in-flight, measurement and
monitoring devices in developmental of Corporal and Nike guided missile systems.
For
per
sona
l use
onl
y