austin, j. a., jr., schlager, w., et al., 1988 proceedings ... · austin, j. a., jr., schlager, w.,...
TRANSCRIPT
Austin, J. A., Jr., Schlager, W., et al., 1988 Proceedings of the Ocean Drilling Program, Scientific Results, Vol. 101
26. SEISMIC STRATIGRAPHIC IMPLICATIONS OF ODP LEG 101 SITE SURVEYS1
J. A. Austin, Jr.,2 J. I. Ewing,3 J. W. Ladd,4 H. T. Mullins,5 and R. E. Sheridan6
ABSTRACT
Prior to ODP Leg 101, high-resolution geophysical site surveys were conducted in three parts of the Bahamas: north of Little Bahama Bank on the southern Blake Plateau, in the central Straits of Florida southeast of Miami, and in the southeastern part of Exuma Sound. A total of approximately 2200 km of 24-trace, 12-fold water-gun reflection profiles were collected, along with 26 sonobuoy profiles, bathymetry, and magnetics. For each region, a seismic stratigraphic framework was developed, and both structure and isopach maps of prominent acoustic horizons and seismic sequences were constructed. Some of the seismic stratigraphy has been corroborated by Leg 101 drilling results, but even where such substantiation is lacking, these geophysical data provide important insights into the structural and stratigraphic evolution of the Bahamas.
North of Little Bahama Bank, the mid-Cretaceous to Holocene section sampled at Site 627 is represented by seven seismic stratigraphic sequences exhibiting a distinctive vertical succession of seismic facies. Both thrust and normal faults offset the section, which thickens to the east. Total sediment thicknesses above sequence G, a late Albian shallow-water carbonate platform, exceed 1.2 km near the modern bank edge. Thickness trends in the Cenomanian-Holocene section suggest long-term line source input from Little Bahama Bank and the smoothing effects of contour-following bottom currents.
In the Straits of Florida, 11 seismic sequences are identified above a "target" horizon believed to represent a buried platform top perhaps coeval with the top of sequence G north of Little Bahama Bank. This "target" exhibits more than 400 m of relief within the area surveyed, potentially a result of erosion, karstification, and/or the presence of patch reefs on top of a drowned "megaplatform" surface. These patch reefs may now be represented by a hummocky seismic facies immediately underlying parts of the "target" surface. Total sediment thicknesses above the "target" range from 1.0 to 1.4 km.
In southeastern Exuma Sound, site-survey profiles are interpreted within the context of a preexisting seismic stratigraphic framework for this part of the Bahamas. Another inferred mid-Cretaceous shallow-water carbonate platform top, P, exhibits a refraciion velocity in excess of 6.0 km/s. P dips to the southwest, perhaps in response to continuing compression between the Bahamas and the northern Caribbean. This hypothesis is supported by the presence of normal faults that offset the entire post-P section. Total sediment thicknesses above P range from 1.3 to 2.6 km. Distribution of Neogene sediments is controlled by long-term bank input from the south and continuing erosion along the axis of Exuma Sound.
INTRODUCTION
When the JOIDES Resolution arrived in Miami, Florida, in mid-March 1985, at the conclusion of Leg 101, the first international expedition of the Ocean Drilling Program (ODP), the drill-ship concluded a critical part of a continuing, integrated geological and geophysical field program designed to understand the evolution of the Bahamas (e.g., Sheridan et al., 1981; Van Buren and Mullins, 1983; Schlager et al., 1984; Ladd and Sheridan, 1987). The decision to make a carbonate platform the focus of initial ODP drilling activities reflected a growing awareness within the earth-sciences community of the importance of carbonates in the geologic record (e.g., Cook and Enos, 1977; COSOD, 1982), particularly with regard to their enormous hydrocarbon potential (Tator and Hatfield, 1975; Enos, 1977; Murris, 1980; Tyler et al., 1985; and others). To ensure safe drilling conditions in the Bahamas, three-dimensional geophysical coverage was essential, both for pre-cruise site selection and for real-time modification of drilling targets during Leg 101.
1 Austin, J. A., Jr., Schlager, W., et al., 1988. Proc. ODP, Sci. Results, 101: College Station, TX (Ocean Drilling Program).
2 Institute for Geophysics, University of Texas, 8701 Mopac Boulevard, Austin, TX 78759-8345.
3 Woods Hole Oceanographic Institution, Woods Hole, MA 02543. 4 Lamont-Doherty Geological Observatory, Columbia University, Palisades,
NY 10964. 5 Syracuse University, Syracuse, NY 13210. 6 Rutgers University, Piscataway, NJ 08854.
In an attempt to provide this coverage, prospective site areas in the Bahamas and on the adjacent southern Blake Plateau were surveyed by the University of Texas Institute for Geophysics (UTIG) vessel FredH. Moore in April 1984 (Fig. 1). Detailed site surveys were conducted in three areas: the southern Blake Plateau north of Little Bahama Bank, the Straits of Florida southeast of Miami, and southeastern Exuma Sound (Fig. 1).
BACKGROUND The Bahama Banks are a unique geologic feature of the At
lantic continental margin of North America. Active carbonate deposition in this region represents a low-latitude remnant of a Mesozoic carbonate province that once extended from Canada to Mexico (Emery and Uchupi, 1972; Sheridan, 1974; Jansa and Wade, 1975; Enos, 1977; Eliuk, 1978; Jansa and Weidmann, 1982; Poag, 1982, 1985). Leg 101 marked the first significant drilling activity in the Bahamas since the completion of the Great Isaac 1 borehole in 1971 (Fig. 1). Of the five deep wells drilled in this region prior to Leg 101, only the Great Isaac 1 on Great Bahama Bank penetrated a thick (more than 5 km) section of intercalated carbonates/evaporites before sampling Late Triassic(?) volcaniclastics inferred to be a product of rifting associated with early opening of the central North Atlantic (Paulus, 1972; Tator and Hatfield, 1975).
All other knowledge of Bahamian basement structure has been derived from geophysical compilations, which have tended to polarize current thinking concerning the crustal evolution of the Bahamas according to two fundamentally different concepts. The "graben" hypothesis suggests that the present bank-trough
391

J. A. AUSTIN, JR., J. I. EWING, J. W. LADD, H. T. MULLINS, R. E. SHERIDAN
morphology of the Bahamas (Fig. 1) is a faithful reflection of underlying horsts and grabens related to Mesozoic rifting of continental crust associated with the initial separation of Africa and North America (Talwani et al., 1960; Ball, 1967; Meyerhoff and Hatten, 1974; Mullins and Lynts, 1977). The potential validity of the "graben" hypothesis solves plate-reconstruction problems associated with overlap of the Bahamas onto African crust of pre-rift (Precambrian-Paleozoic) age (Dietz and Holden, 1971; Sheridan, 1971) and is consistent with hypotheses favoring the presence of continental crust beneath this region (e.g., Sheridan, 1972; Meyerhoff and Hatten, 1974; Mullins and Lynts, 1977; Shcherbakova et al., 1978; Sheridan et al., 1981; Klitgord et al., 1984). This hypothesis supports a stratigraphic framework of unbroken shallow-water deposition on the banks and deep-water deposition in the intervening troughs (i.e., grabens).
In contrast, the "megaplatform" hypothesis holds that the modern Bahamas archipelago is underlain by an extensive, buried shallow-water carbonate-platform complex, which encompassed the Bahamas, Florida, and the rim of the Gulf of Mexico until sometime in the Cretaceous, when drowning occurred (Paulus, 1972; Meyerhoff and Hatten, 1974; Sheridan, 1974; Schlager and Ginsburg, 1981). Subsequent evolution of bank-trough topography then occurred by normal processes of deposition and erosion, with perhaps only minor structural control (e.g., Andrews et al., 1970; Dietz et al., 1970; Sheridan, 1974; Schlager and Ginsburg, 1981). Although this hypothesis does not directly address the identity of the structural foundation of the drowned shallow-water carbonate complex, its verification would have fundamental implications for the stratigraphy beneath deep basins within the Bahamas, like the Straits of Florida and Exuma Sound (Fig. 1). Beneath these reentrants, Sheridan et al. (1981) used multichannel seismic (MCS) profiles and sonobuoys to identify a prominent acoustic unconformity/compressional wave velocity increase downward to more than 4 km/s which they interpret as the top of the postulated "megaplatform." A primary goal of Leg 101 was to sample this acoustic interface in at least two locations to attempt to confirm its identity (Austin, Schlager, et al., 1986). In line with this drilling objective, the "deep" goal of the site surveys was to image this sequence boundary /velocity transition in sufficient detail both to pinpoint its sub-bottom depth and to understand its local structural variations well enough to drill to and through it safely.
Leg 101 was also designed to examine the detailed sedimentological development of carbonate slopes, a set of processes addressed previously in the Bahamas predominantly by means of high-resolution single-channel seismic reflection profiles and piston cores (e.g., Schlager et al., 1976; Mullins and Neumann, 1979; Schlager and Chermak, 1979; Crevello and Schlager, 1980; Schlager and Ginsburg, 1981; Van Buren and Mullins, 1983; Droxler et al., 1983; Mullins et al., 1984; Boardman and Neumann, 1984; Droxler and Schlager, 1985; Boardman et al., 1986). According to these studies, modern Bahama slopes appeared to steepen with time (Mullins and Neumann, 1979; Schlager and Ginsburg, 1981) and be characterized by facies belts that generally paralleled adjacent bank margins (Mullins et al., 1984). Furthermore, different types of carbonate slopes could be recognized (e.g., open-ocean, closed seaway/reentrant and windward/ leeward) using both geomorphologic and sedimentologic criteria (Hine and Neumann, 1977; Mullins and Neumann, 1979; Schlager and Ginsburg, 1981). To extrapolate these results to greater depths, and at the same time to develop a more complete understanding of the controls (e.g., sea-level changes, oceanographic and meteorologic effects) of carbonate-slope development, Leg 101 was designed to compare and contrast an open-ocean, "accretionary" (i.e., gentle) slope north of Little Bahama Bank with a sheltered, "bypass" (i.e., steeper) slope in southeastern Exuma Sound with shallow (less than 300 m penetration), three-hole (HPC/XCB) transects (Austin, Schlager, et al., 1986). To
accomplish this objective, dense grids of high-resolution MCS profiles were necessary to image complex facies successions and to isolate the influence of topography and other local disturbances (i.e., slumps, faults). As a result, the Leg 101 site surveys needed to combine the detail and resolution necessary for the "shallow" slope objectives with the power and penetration required to image the inferred top of the "megaplatform."
METHODS
Acquisition To strike a balance between resolution and penetration, Leg 101 site
surveys were conducted using a 24-trace streamer with a 33.5-m group interval. The total aperture of this receiving array, 968 m, was considered sufficient to provide measurable normal moveout for velocity discrimination in the 200-2000 m water depths expected during survey operations. The array was balanced for level towing prior to the start of the surveys, and independent depth control was provided at intervals of five group lengths (approximately 167.5 m) while under way by using "birds" mechanically preset to keep the array at 10 m. Throughout data acquisition, speeds were maintained at approximately 5 kt.
Two sound sources were available for the surveys, 160-in.3 and 400-in.3 water guns. The 400-in.3 gun was used almost exclusively for the grids collected in the Straits of Florida and Exuma Sound. The 160-in.3
gun was used only for small parts of the Little Bahama Bank and Straits of Florida surveys and for portions of the tie-line connecting those grids (Fig. 1; Table 1). Unfortunately, problems with both water guns during this tie-line created numerous gaps that prohibited direct correlation between seismic stratigraphic frameworks developed for the southern Blake Plateau and the Straits of Florida.
In addition to the MCS profiles, the Moore collected continuous underway 3.5-kHz profiles (for bathymetry) and magnetics. A total of 39 sonobuoys were also deployed, resulting in the collection of 26 successful seismic refraction profiles: 7 from Little Bahama Bank (Tables 2 and 3), 8 from the Straits of Florida (Tables 4 and 5), and 11 from Exuma Sound (Tables 6 and 7). All seismic information was recorded digitally, the reflection results using a Texas Instruments® DFS-IV and the sonobuoys by a dedicated acquisition system provided by Woods Hole Oceanographic Institution (WHOI).
Navigation control was accomplished by a combination of Transit satellite fixes, LORAN C, and dead reckoning. Where possible (e.g., north of Little Bahama Bank and in Exuma Sound), radar bearings off known islands were also used to supplement and check other position information. Although discrepancies between satellite and LORAN C positions varied from grid to grid, they were systematic within each grid, thereby allowing consistent merging of the diverse navigational inputs. Similar systems aboard the JOIDES Resolution allowed reoccupation of designated site positions within the survey grids during Leg 101 with accuracies generally better than 0.1 nmi/0.2 km (see Austin, Schlager, et al., 1986).
Processing Standard processing (through stack and filter/mute/automatic-gain-
control/scale) of the MCS profiles was carried out at Lamont-Doherty Geological Observatory (LDGO), although demultiplexing of these data took place aboard ship. The sonobuoy profiles were processed at WHOI. (Note: All reflection times for sonobuoy velocities tabulated in Tables 3, 5, and 7 have been corrected for the cavity collapse time, approximately 45 ms, of the water-gun sound sources.) Editing and processing of the bathymetry, magnetics, and navigation were carried out at UTIG.
RESULTS
Northern Slope of Little Bahama Bank The first site survey was conducted on a portion of the north
ern margin of Little Bahama Bank (LBB) (Fig. 1). This carbonate slope, extending from the bank top to the southern Blake Plateau, was selected for drilling based on previous geological/ geophysical studies by Mullins and Van Buren (1981), Van Buren and Mullins (1983), and Mullins et al. (1984). The primary objective was to select sites for a transect of three shallow (HPC/ XCB) drill holes (Sites 627, 628, and 630) designed to under-
392

SEISMIC STRATIGRAPHIC IMPLICATIONS, LEG 101 SITE SURVEYS
28°N
80° W
Figure 1. Index map showing geophysical site-survey coverage and Leg 101 drilling sites in the Bahamas. The Fred H. Moore conducted surveys north of Little Bahama Bank (LBB), in the Straits of Florida (FS), and in Exuma Sound (ES). Additional MCS coverage in the region is also shown, as is the location of the Great Isaac 1 borehole. Bathymetric contours are in meters.
Table 1. Sound-source usage, Bahamas site surveys.
Area
Little Bahama Bank (LBB) Straits of Florida (FS) Exuma Sound (ES) Tie-line (LBB/FS)
Totals:
Total line-kma
503 493 599 518
2113
160-in.3 gun
6(1%) 91 (18%)
7 (1%) 314(61%)
418 (20%)
400-in.3 gun
382 (76%) 374 (76%) 563 (94%) 118(23%)
1437 (68%)
No data
115 (23%) 28 (6%) 29 (5%) 86 (17%)
258 (12%)
a These distances assume an average ship's speed of 5 knots, or approximately 9.3 km/hr. Note: The LBB survey was conducted first, followed by the FS and ES grids (see also Fig. 1).
stand the evolution of an "accretionary" slope in an open-ocean, windward-margin setting (Mullins and Neumann, 1979; Schlager and Ginsburg, 1981). A secondary objective was to image more clearly a pronounced seismic facies change and an associated velocity contrast originally identified by Van Buren and Mullins (1983) and interpreted by them to mark the buried top of a shallow-water carbonate platform beneath the southern Blake Plateau (Fig. 2).
The Fred H. Moore collected approximately 500 km of water-gun profiles north of LBB, along with continuous magnetics, 3.5-kHz (Fig. 3), and sonobuoy (Tables 2 and 3) measurements. Over the gullied upper slope, track spacing averaged 2 km, whereas over the smooth lower slope, profile density was reduced to 5-km intervals. Intermittent problems with sound sources created gaps in some of the reflection lines (see Table 1 and Fig. 3), but enough spatial coverage remained to interpret and map seismic sequences and sequence boundaries.
Bathymetry
Water depths were picked at 5-min intervals from the 3.5-kHz profiles and contoured (Fig. 3). The resultant map confirmed the earlier bathymetric compilation by Van Buren and Mullins (1983), showing that this part of the LBB slope could be divided into an upper, gullied portion and a lower, smooth apron, with the boundary between the two at approximately the 900-m contour (Fig. 3). The gullies extend across and up the slope from 900 m to approximately 500 m, and they exhibit as much as 150 m of relief. Mullins et al. (1984) ascribed existence of the gullies to intermittent slope failure (for example, see the interpreted slump/slide scar in Fig. 2). The small circular to elliptical depressions on the bathymetric map may also be slide scars (Fig. 3).
Inter-gully areas are relatively broad and flat, as is the lower slope deeper than 900 m. Where site-survey data are available,
393

J. A. AUSTIN, JR., J. I. EWING, J. W. LADD, H. T. MULLINS, R. E. SHERIDAN
Table 2. Sonobuoys, Little Bahama Bank.
Sonobuoy number
1 b2
b3
4 5
6 7 8
9 10
b l l
b12
13 14
b15
Line number
Test LBB-2
LBB-4
LBB-6 LBB-11
LBB-13 LBB-13 LBB-15
LBB-17 LBB-17
LBB-17
LBB-18
LBB-20 LBB-20 LBB-22
Start time3
(UTC)
09/04/84:1840 13/04/84:0445
13/04/84:0942
Start3
position
Gulf of Mexico 27°23.84'N 78°23.54'W 27°26.39'N 78°22.73'W
Abandoned—gun not firing 14/04/84:0540 27°23.17'N
78°24.48'W Sonobuoy caught by streamer Sonobuoy caught by magnetometer 14/04/84:1122 27°32.72'N
78°11.46'W Sonobuoy caught by streamer 15/04/84:0213
15/04/84:0330
15/04/84:0815
27°22.13'N 78°20.07'W 27°28.??'N 78°17.??'W 27°37.89'N 78°16.53'W
Sonobuoy not transmitting Sonobuoy caught by streamer 16/04/84:0817 28°06.50'N
78°58.39'W
Course
110° T
111°T
020°T
280°T (note speed change)
024°T
019°T
202°T
300°T
3 Start times and positions are provided here to ensure ease of correlation of the sonobuoy results not tabulated in this report with the LBB profiles along which they were collected. All data are available from the ODP data bank.
b Results tabulated in Table 3.
the slope above 500 m also appears to be generally smooth. This conclusion agrees with the other bathymetric information available (Van Buren and Mullins, 1983). Mullins et al. (1984) interpreted the smooth character of the uppermost slope to be a response to submarine cementation of periplatform ooze from the nearby bank.
The average declivity of the upper LBB slope is 4° (see Fig. 2). Site 630 is located on an interfluve between gullies there (Fig. 3; Austin, Schlager, et al., 1986). The lower slope apron, on which both Sites 627 and 628 are located (Fig. 3; Austin, Schlager, et al., 1986), exhibits a declivity of only l°-2° (Fig. 2).
Table 3. Selected sonobuoy results, Little Bahama Bank.
Along most of the northern margin of LBB, lower slope bathymetric contours parallel those of the upper slope and the bank edge (Van Buren and Mullins, 1983; Mullins et al., 1984). However, the lower slope contours in the site-survey area diverge from this trend to strike more northwest-southeast (Fig. 3). Mullins et al. (1980) suggested that this might be a result of the deposition of a carbonate sediment drift in response to the confluence of the Antilles Current and the Gulf Stream at the northwest corner of LBB.
Magnetics Removal of the regional magnetic field from the total-inten
sity magnetic-field values collected during the site survey reveals a residual negative anomaly of over 100 gammas oriented approximately north-northeast-south-southwest across the entire LBB slope (Fig. 4). This feature is coincident with a similar anomaly identified by Klitgord et al. (1984), whose trend generally parallels the Walkers Cay normal fault zone originally identified by Mullins and Van Buren (1981) (Fig. 2).
Seismic Stratigraphy Using the techniques originally described by Vail et al. (1977),
seven seismic stratigraphic sequences (labeled A through G from top to bottom) were identified on line LBB-18 (Fig. 5), the only dip-line to extend unbroken across the entire LBB slope (Fig. 3). Both reflector terminations and amplitude anomalies (implying strong acoustic-impedance contrasts) were used to subdivide the observed seismic section. First, the sequences were mapped over the area of the site-survey grid. Then, both isopach and structure maps of sequences and their bounding acoustic unconformities were prepared.
One of the most striking aspects of LBB-18 (Fig. 5) is the vertical succession of seismic facies on the lower slope north of LBB. The seismic facies change/velocity contrast originally inferred by Van Buren and Mullins (1983) to be a buried shallow-water platform top coincides with the boundary between sequences F and G (Fig. 5). Evenly spaced, parallel continuous reflections (sequence G) give way upward to a low-amplitude, parallel discontinuous zone (sequences E and F), and finally to
Sonobuoy number
2 (LBB-2)
3 (LBB-4)
11 (LBB-17)
12 (LBB-18)
15 (LBB-22)
Velocity, top (km/s) Velocity, bottom Time, bottom (s) Depth, bottom (km) Thickness (m) Velocity, top Velocity, bottom Time, bottom Depth, bottom Thickness Velocity, top Velocity, bottom Time, bottom Depth, bottom Thickness Velocity, top Velocity, bottom Time, bottom Depth, bottom Thickness Velocity, top Velocity, bottom Time, bottom Depth, bottom Thickness
1
1.50 1.50 0.67 0.50
500
1.51 1.51 0.85 0.64
640 1.51 1.51 1.20 0.91
910 1.52 1.52 1.32 1.00
1000 1.52 1.52 1.07 0.81
810
2
1.60 2.15 0.95 0.77
270
1.80 1.80 1.08 0.85
210 1.58 1.92 1.39 1.07
160 1.58 1.83 1.48 1.14
140 1.52 1.57 1.13 0.86
50
3
2.45 2.70 1.17 1.06
290
2.50 2.50 1.30 1.02
170 1.92 1.92 1.44 1.12
50 2.10 2.20 1.54 1.21
70 1.60 1.80 1.20 0.92
60
4
2.95 3.05 1.49 1.54
480 a2.70 a2.90
1.56 1.39
370 2.10 2.15 1.52 1.20
80 2.20 2.22 1.66 1.33
120 1.86 2.05 1.31 1.03
110
5
4.30 4.60 1.71 2.02
480 a4.20 a4.50
1.80 1.92
530 2.20 2.25 1.60 1.29
90 2.50 2.80 1.75 1.45
120 2.08 2.16 1.40 1.12
90
6
4.80 4.85 2.11 2.99
970 a4.90
2.50 2.52 1.72 1.44
150 2.90 3.00 1.79 1.51
60 2.25 2.30 1.48 1.22
100
Layer numbers 7
2.70 2.90 1.86 1.63
190 4.20 4.20 1.92 1.78
270 2.40 2.57 1.60 1.37
150
8
4.25 4.45 1.94 1.83
200 4.80 4.90 2.42 2.99
1210 2.82 2.86 1.72 1.54
170
9
4.50 4.50 2.04 2.03
200 5.50
2.88 2.88 1.82 1.69
150
10
4.51 4.51 2.44 2.93
900
2.90 2.95 1.88 1.76
70
11
5.60
3.20 3.80 1.92 1.85
90
12
4.78 4.78 2.00 2.02
170
13 14
4.85 5.60 4.85 2.40 2.99
970
Layer velocities determined by wide-angle reflections and refractions. Upper layer velocities poorly determined because of complex topography and sediment structure, so the values shown are interpolations between sonobuoys 2 and 11.
394

SEISMIC STRATIGRAPHIC IMPLICATIONS, LEG 101 SITE SURVEYS
Table 4. Sonobuoys, Straits of Florida.
Sonobuoy number
16 17
18 19
c20
21 c22
c23
24 25
26
27
28 29
Line number
FS-1 FS-1
FS-4 FS-6
FS-6
FS-8 FS-8
FS-10
FS-10 FS-10
FS-16
FS-19
FS-21 FS-21
Start time3 Start3
(UTC) position
Sonobuoy caught by streamer 16/04/84:1033 28°09.95'N
79°05.01'W Sonobuoy did not transmit 19/04/84:2140 25°44.93'N
79°36.04'W 19/04/84:2335 25°39.61'N
79°36.00'W Sonobuoy caught by streamer 20/04/84:0352 25°33.48'N
79°32.98'W 20/04/84:0735 25°42.16'N
79°29.97'W
Course
180°T
180°T
180°T
000°T
180°T
Sonobuoy did not properly deploy 20/04/84:0925 25°34.29'N
79°30.05'W 20/04/84:2350 25°40.88'N
79°34.08'W 21/04/84:1017 25°34.86'N
79°35.98'W Sonobuoy not transmitting 21/04/84:1350 25°31.65'N
79°28.02'W
180°T
115°T b( = 90°)
122°T b(=90°)
290°T b( = 270°)
3 Start times and positions are provided here to ensure ease of correlation of the sonobuoy results not tabulated in this report with the FS profiles along which they were recorded. All data are available from the ODP data bank. Note: Gulf Stream affected the speed of north-south lines and the heading of east-west lines.
c Results tabulated in Table 5.
variable-amplitude, discontinuous to hummocky reflection packages (sequences A-D). Van Buren and Mullins (1983) used similar facies information contained in single-channel, small-volume air-gun profiles to infer the presence of deep-water periplatform carbonates (sequences A-F) overlying the shallow-water platform (sequence G) (Fig. 2). Results from Site 627 confirmed these interpretations (Austin, Schlager, et al., 1986).
Another salient characteristic of LBB-18 is the presence of interpreted thrusts in the lower slope section (Fig. 5), which may be a response to a major slump on the mid-slope to the southwest (Van Buren and Mullins, 1983) (Fig. 2). Mullins et al. (1986) suggested that such catastrophic episodes of gravitational mass wasting may be very important modes of sediment dispersal on carbonate slopes where accumulation rates are high. Folds and
slumps visible in cores at Site 628 support this interpretation, although no evidence for repeated sections is apparent from that borehole's biostratigraphy, suggesting that the seismically observed thrust displacements are small (see also Austin, Schlager, et al., 1986).
LBB-17 parallels LBB-18 to the east (Fig. 3), and it obliquely crosses the interpreted Walkers Cay fault zone (Mullins and Van Buren, 1981) (Fig. 6). This normal fault is well defined on LBB-17, particularly where it offsets sequence G. Sequences A-F do not appear to be offset, but thickening of sequences A-E across the upward continuation of the fault trace implies continuing differential subsidence across the feature. This inference is further supported by normal faults mapped along LBB-18 between Sites 627 and 628, which offset the entire section from the top of sequence G to the seafloor (Fig. 5). The vertical succession of seismic facies observed on LBB-18 is also observed on LBB-17, except that amplitudes of sequence F markedly increase on the downthrown side (i.e., south) of the Walkers Cay fault (Fig. 6). Although the explanation for this seismic facies change is unknown, it may relate to an increase of interbedded pelagic material in sequence F related to a deepening of its environment of deposition. Sequence F was composed of a succession of shelf limestones and chalk at Site 627 (Austin, Schlager, et al., 1986).
LBB-13 crosses both LBB-18 and LBB-17 (Fig. 3), and it further illustrates the structural and facies changes that occur across the Walkers Cay fault zone (Fig. 7). First, all of the seismic sequences are faulted downward to the east, although throws on individual normal faults do not appear to exceed 0.05 s (approximately 70 m at the depth of the top of sequence G). Second, the distinct vertical facies succession, which reflects the shallow-water carbonate-platform to oceanic-plateau transition documented at Site 627 (Austin, Schlager, et al., 1986), becomes more chaotic. Van Buren and Mullins (1983) observe a similar facies contrast on single-channel profiles collected along the margin of LBB, and they interpret it as marking an eastward transition to deeper water carbonates, perhaps associated with the flank of a depocenter under the seaward part of the southern Blake Plateau. The existence of such a depocenter is supported by a circular free-air gravity anomaly of about - 1 0 0 mGal east of the site-survey area (Klitgord et al., 1984).
Maps As previously stated, a major goal of site surveys in the Ba
hamas was to determine sub-sea-level depths to major reflecting surfaces and to map the areal distributions of seismic sequences
Table 5. Selected sonobuoy results, Straits of Florida.
Sonobuoy number
20 (FS-6)
22 (FS-8)
23 (FS-10)
Velocity, top (km/s) Velocity, bottom Time, bottom (s) Depth, bottom (km) Thickness (m)
Velocity, top Velocity, bottom Time, bottom Depth, bottom Thickness
Velocity, top Velocity, bottom Time, bottom Depth, bottom Thickness
1
1.51 1.51 1.07 0.81
810
1.51 1.51 1.10 0.83
830
1.52 1.52 1.07 0.81
810
2
1.51 1.52 1.16 0.88
70
1.54 1.55 1.18 0.89
60
1.52 1.65 1.11 0.84
30
3
1.52 1.52 1.22 0.92
40
1.75 2.10 1.32 1.02
130
1.66 1.90 1.18 0.90
60
4
1.85 2.05 1.27 0.97
50
2.00 2.20 1.38 1.09
70
1.88 2.10 1.25 0.97
70
5
2.00 2.15 1.34 1.04
70
2.10 2.20 1.47 1.18
90
1.95 1.95 1.34 1.06
90
Layer number
6
2.10 2.65 1.44 1.16
120
2.20 2.50 1.55 1.28
100
2.20 2.65 1.40 1.14
80
7
2.40 2.80 1.61 1.38
220
2.40 3.20 1.72 1.52
240
2.40 2.50 1.48 1.24
100
8
2.80 3.35 1.78 1.64
260
3.30 3.35 1.85 1.74
220
2.50 3.30 1.74 1.61
370
9
3.35 3.36 1.83 1.73
90
3.35 3.50 2.05 2.08
340
3.30 3.32 1.84 1.78
170
10
3.40 3.40 2.06 2.12
390
4.90
3.35 3.35 2.04 2.12
340
11
a4.90
34.90
Layer velocities estimated from critical-angle evidence.
395
J. A. AUSTIN, JR., J. I. EWING, J. W. LADD, H. T. MULLINS, R. E. SHERIDAN
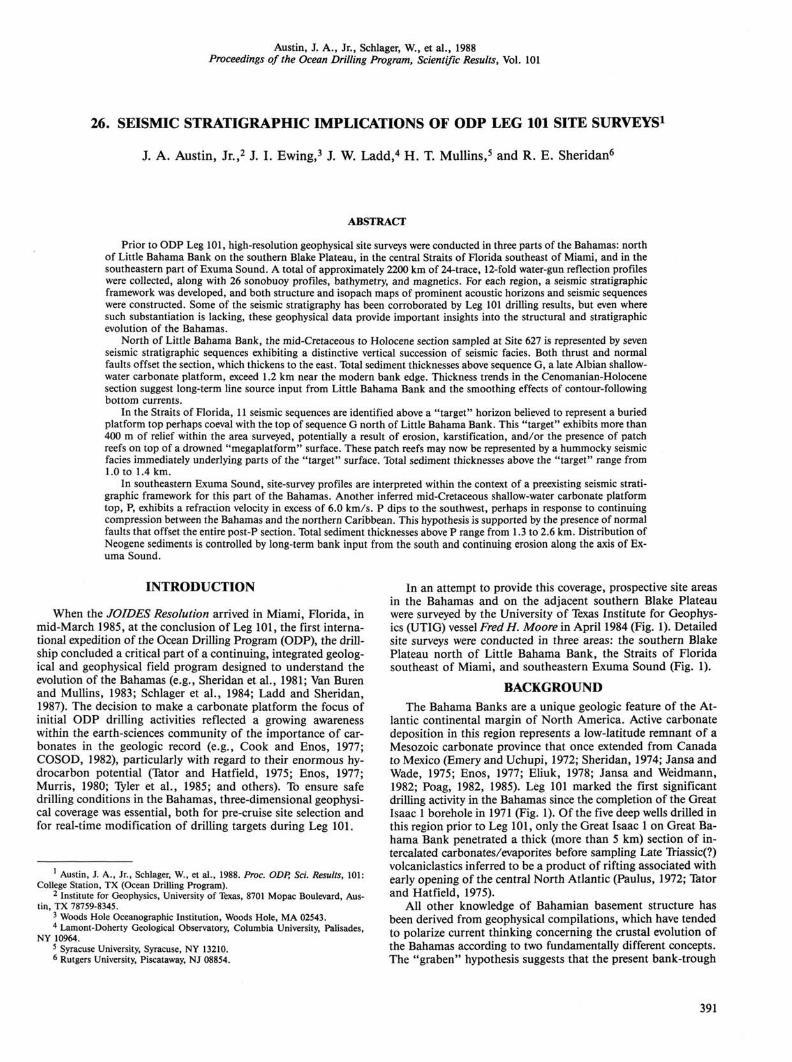
Table 6. Sonobuoys, Exuma Sound.
Sonobuoy number
30
b31
32
33
b34
b35
36
37
38
39
40
Line number
ES-4
ES-5
ES-7
ES-8
ES-10
ES-11
ES-12
ES-14
ES-15
ES-17
ES-17
Start timea
(UTC)
12/04/84:0840
23/04/84:1129
23/04/84:1926
24/04/84:0227
24/04/84:0515
24/04/84:1157
24/04/84:1715
24/04/84:2213
25/04/84:0130
25/04/84:0745
25/04/84:0900
Start3
position
23°51.67'N 75°23.85'W 23°57.04'N 75°31.40'W 23°37.80'N 75°37.50'W 23°52.30'N 75°29.03'W 23°43.31'N 75°38.99'W 23°50.80'N 75°27.60'W 23°46.65'N 75°36.19'W 23°34.30'N 75°40.35'W 23°38.50'N 75o42.01'W 23°45.28'N 75°40.08'W LORAN unreliable
Course
320°T
140°T
055°T
215°T
235°T
055°T
230°T
320°T
142°T
140°T
140°T
Start times and positions are provided here to ensure ease of correlation of the sonobuoy results not tabulated in this report with the ES profiles along which they were recorded. All data are available from the ODP data bank. Results tabulated in Table 7.
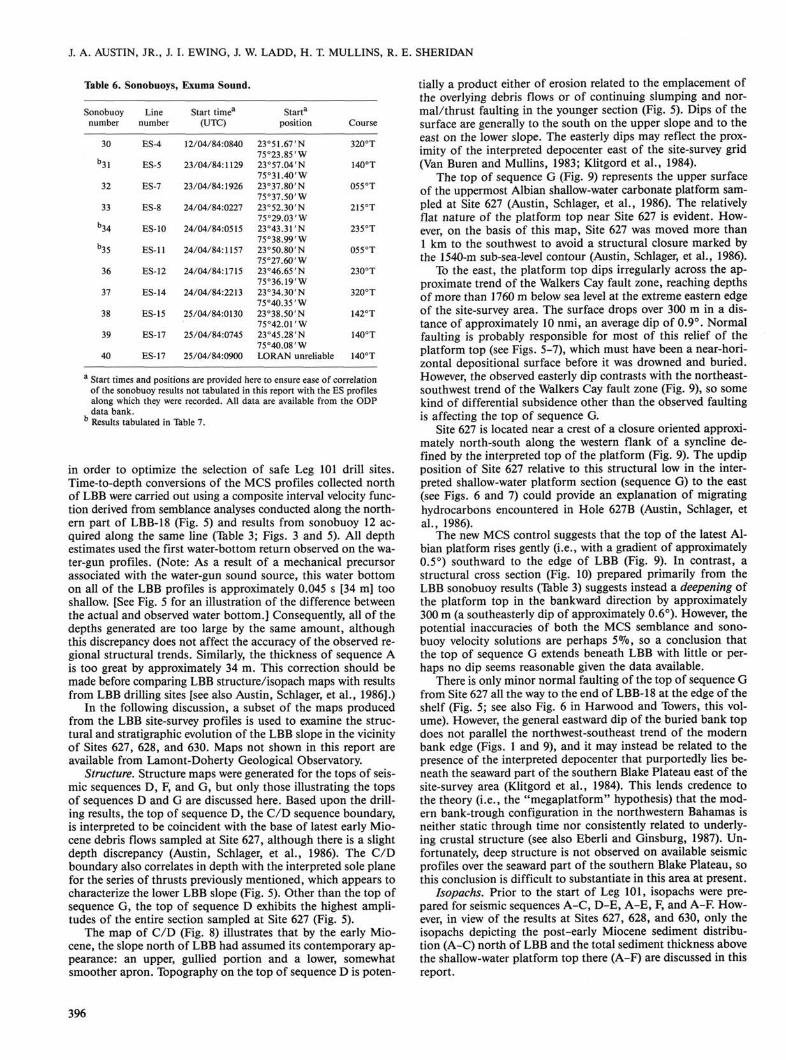
in order to optimize the selection of safe Leg 101 drill sites. Time-to-depth conversions of the MCS profiles collected north of LBB were carried out using a composite interval velocity function derived from semblance analyses conducted along the northern part of LBB-18 (Fig. 5) and results from sonobuoy 12 acquired along the same line (Table 3; Figs. 3 and 5). All depth estimates used the first water-bottom return observed on the water-gun profiles. (Note: As a result of a mechanical precursor associated with the water-gun sound source, this water bottom on all of the LBB profiles is approximately 0.045 s [34 m] too shallow. [See Fig. 5 for an illustration of the difference between the actual and observed water bottom.] Consequently, all of the depths generated are too large by the same amount, although this discrepancy does not affect the accuracy of the observed regional structural trends. Similarly, the thickness of sequence A is too great by approximately 34 m. This correction should be made before comparing LBB structure/isopach maps with results from LBB drilling sites [see also Austin, Schlager, et al., 1986].)
In the following discussion, a subset of the maps produced from the LBB site-survey profiles is used to examine the structural and stratigraphic evolution of the LBB slope in the vicinity of Sites 627, 628, and 630. Maps not shown in this report are available from Lamont-Doherty Geological Observatory.
Structure. Structure maps were generated for the tops of seismic sequences D, F, and G, but only those illustrating the tops of sequences D and G are discussed here. Based upon the drilling results, the top of sequence D, the C/D sequence boundary, is interpreted to be coincident with the base of latest early Miocene debris flows sampled at Site 627, although there is a slight depth discrepancy (Austin, Schlager, et al., 1986). The C/D boundary also correlates in depth with the interpreted sole plane for the series of thrusts previously mentioned, which appears to characterize the lower LBB slope (Fig. 5). Other than the top of sequence G, the top of sequence D exhibits the highest amplitudes of the entire section sampled at Site 627 (Fig. 5).
The map of C/D (Fig. 8) illustrates that by the early Miocene, the slope north of LBB had assumed its contemporary appearance: an upper, gullied portion and a lower, somewhat smoother apron. Topography on the top of sequence D is poten
tially a product either of erosion related to the emplacement of the overlying debris flows or of continuing slumping and normal/thrust faulting in the younger section (Fig. 5). Dips of the surface are generally to the south on the upper slope and to the east on the lower slope. The easterly dips may reflect the proximity of the interpreted depocenter east of the site-survey grid (Van Buren and Mullins, 1983; Klitgord et al., 1984).
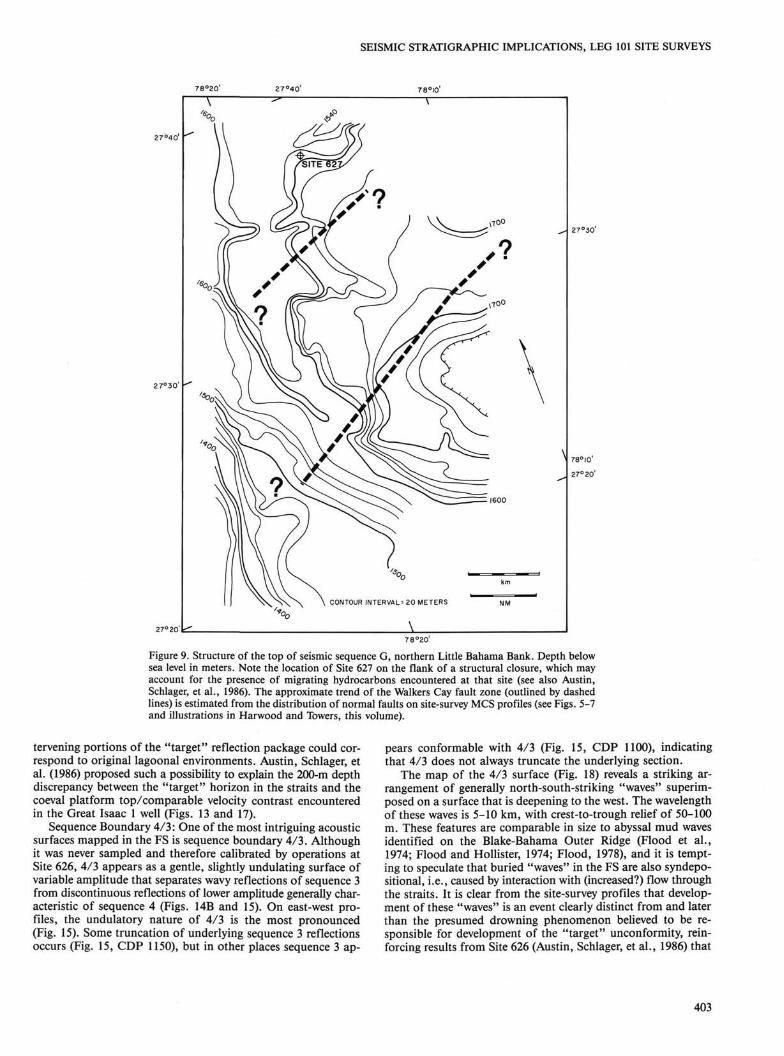
The top of sequence G (Fig. 9) represents the upper surface of the uppermost Albian shallow-water carbonate platform sampled at Site 627 (Austin, Schlager, et al., 1986). The relatively flat nature of the platform top near Site 627 is evident. However, on the basis of this map, Site 627 was moved more than 1 km to the southwest to avoid a structural closure marked by the 1540-m sub-sea-level contour (Austin, Schlager, et al., 1986).
To the east, the platform top dips irregularly across the approximate trend of the Walkers Cay fault zone, reaching depths of more than 1760 m below sea level at the extreme eastern edge of the site-survey area. The surface drops over 300 m in a distance of approximately 10 nmi, an average dip of 0.9°. Normal faulting is probably responsible for most of this relief of the platform top (see Figs. 5-7), which must have been a near-horizontal depositional surface before it was drowned and buried. However, the observed easterly dip contrasts with the northeast-southwest trend of the Walkers Cay fault zone (Fig. 9), so some kind of differential subsidence other than the observed faulting is affecting the top of sequence G.
Site 627 is located near a crest of a closure oriented approximately north-south along the western flank of a syncline defined by the interpreted top of the platform (Fig. 9). The updip position of Site 627 relative to this structural low in the interpreted shallow-water platform section (sequence G) to the east (see Figs. 6 and 7) could provide an explanation of migrating hydrocarbons encountered in Hole 627B (Austin, Schlager, et al., 1986).
The new MCS control suggests that the top of the latest Albian platform rises gently (i.e., with a gradient of approximately 0.5°) southward to the edge of LBB (Fig. 9). In contrast, a structural cross section (Fig. 10) prepared primarily from the LBB sonobuoy results (Table 3) suggests instead a deepening of the platform top in the bankward direction by approximately 300 m (a southeasterly dip of approximately 0.6°). However, the potential inaccuracies of both the MCS semblance and sonobuoy velocity solutions are perhaps 5%, so a conclusion that the top of sequence G extends beneath LBB with little or perhaps no dip seems reasonable given the data available.
There is only minor normal faulting of the top of sequence G from Site 627 all the way to the end of LBB-18 at the edge of the shelf (Fig. 5; see also Fig. 6 in Harwood and Towers, this volume). However, the general eastward dip of the buried bank top does not parallel the northwest-southeast trend of the modern bank edge (Figs. 1 and 9), and it may instead be related to the presence of the interpreted depocenter that purportedly lies beneath the seaward part of the southern Blake Plateau east of the site-survey area (Klitgord et al., 1984). This lends credence to the theory (i.e., the "megaplatform" hypothesis) that the modern bank-trough configuration in the northwestern Bahamas is neither static through time nor consistently related to underlying crustal structure (see also Eberli and Ginsburg, 1987). Unfortunately, deep structure is not observed on available seismic profiles over the seaward part of the southern Blake Plateau, so this conclusion is difficult to substantiate in this area at present.
Isopachs. Prior to the start of Leg 101, isopachs were prepared for seismic sequences A-C, D-E, A-E, F, and A-F. However, in view of the results at Sites 627, 628, and 630, only the isopachs depicting the post-early Miocene sediment distribution (A-C) north of LBB and the total sediment thickness above the shallow-water platform top there (A-F) are discussed in this report.
396

SEISMIC STRA
TIGRA
PHIC
IMPLICA
TION
S, LEG 101 SITE SURVEYS
397
Table 7. Selected sonobuoy results, Exuma Sound.
J. A. AUSTIN, JR., J. I. EWING, J. W. LADD, H. T. MULLINS, R. E. SHERIDAN
NORTH PROFILE 4
SOUTH
W%
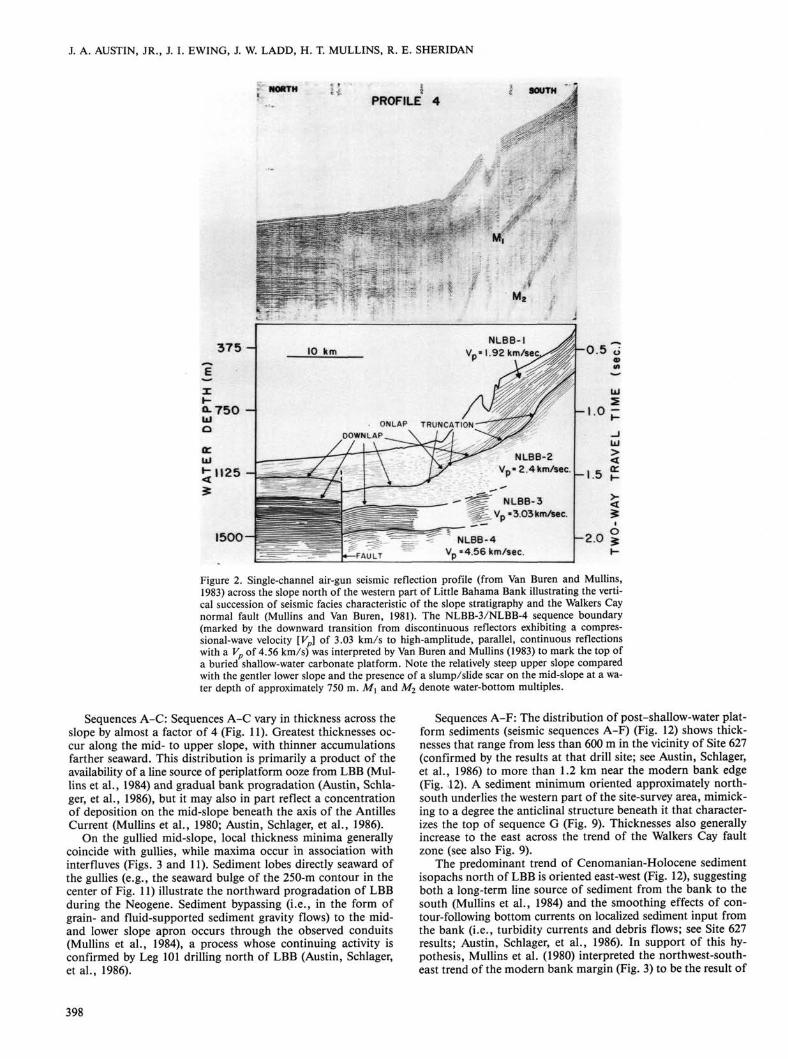
Figure 2. Single-channel air-gun seismic reflection profile (from Van Buren and Mullins, 1983) across the slope north of the western part of Little Bahama Bank illustrating the vertical succession of seismic facies characteristic of the slope stratigraphy and the Walkers Cay normal fault (Mullins and Van Buren, 1981). The NLBB-3/NLBB-4 sequence boundary (marked by the downward transition from discontinuous reflectors exhibiting a compressional-wave velocity [Vp] of 3.03 km/s to high-amplitude, parallel, continuous reflections with a Vp of 4.56 km/s) was interpreted by Van Buren and Mullins (1983) to mark the top of a buried shallow-water carbonate platform. Note the relatively steep upper slope compared with the gentler lower slope and the presence of a slump/slide scar on the mid-slope at a water depth of approximately 750 m. Mx and M2 denote water-bottom multiples.
Sequences A-C: Sequences A-C vary in thickness across the slope by almost a factor of 4 (Fig. 11). Greatest thicknesses occur along the mid- to upper slope, with thinner accumulations farther seaward. This distribution is primarily a product of the availability of a line source of periplatform ooze from LBB (Mullins et al., 1984) and gradual bank progradation (Austin, Schla-ger, et al., 1986), but it may also in part reflect a concentration of deposition on the mid-slope beneath the axis of the Antilles Current (Mullins et al., 1980; Austin, Schlager, et al., 1986).
On the gullied mid-slope, local thickness minima generally coincide with gullies, while maxima occur in association with interfluves (Figs. 3 and 11). Sediment lobes directly seaward of the gullies (e.g., the seaward bulge of the 250-m contour in the center of Fig. 11) illustrate the northward progradation of LBB during the Neogene. Sediment bypassing (i.e., in the form of grain- and fluid-supported sediment gravity flows) to the mid-and lower slope apron occurs through the observed conduits (Mullins et al., 1984), a process whose continuing activity is confirmed by Leg 101 drilling north of LBB (Austin, Schlager, et al., 1986).
Sequences A-F: The distribution of post-shallow-water platform sediments (seismic sequences A-F) (Fig. 12) shows thicknesses that range from less than 600 m in the vicinity of Site 627 (confirmed by the results at that drill site; see Austin, Schlager, et al., 1986) to more than 1.2 km near the modern bank edge (Fig. 12). A sediment minimum oriented approximately north-south underlies the western part of the site-survey area, mimicking to a degree the anticlinal structure beneath it that characterizes the top of sequence G (Fig. 9). Thicknesses also generally increase to the east across the trend of the Walkers Cay fault zone (see also Fig. 9).
The predominant trend of Cenomanian-Holocene sediment isopachs north of LBB is oriented east-west (Fig. 12), suggesting both a long-term line source of sediment from the bank to the south (Mullins et al., 1984) and the smoothing effects of contour-following bottom currents on localized sediment input from the bank (i.e., turbidity currents and debris flows; see Site 627 results; Austin, Schlager, et al., 1986). In support of this hypothesis, Mullins et al. (1980) interpreted the northwest-southeast trend of the modern bank margin (Fig. 3) to be the result of
398

SEISMIC STRATIGRAPHIC IMPLICATIONS, LEG 101 SITE SURVEYS
78°30 'W
27°40 'N
27°30 '
27020'
\
• * 0 0 ^ ^ ^ ^
3o0_
d ^ *
QC
/
78°20 ' 1
^
|K«X *Sf \
to 2B\
^ ^ A ^ S
1
^41 \ 1 m\ \ S9M \
^ ^
78°10' I
N
\ / / ? - . SCO
I
=
Figure 3. Geophysical-survey grid for Sites 627, 628, and 630 on the slope north of Little Bahama Bank superimposed on a bathymetric compilation (contour interval, 20 m) prepared from 3.5-kHz profiles collected by the Moore during the survey (see also Fig. 1). Breaks in the lines represent data gaps created by either sound-source malfunctions or processing problems. The MCS profiles are all 24-trace, 12-fold, collected primarily with a 400-in.3 water gun (see Table 1). Bold lines are sonobuoys 2, 3, 11, and 12 (Table 3). Arrows denote direction of sonobuoy acquisition.
the development and northward growth of a carbonate contourite sediment drift at the confluence of the Gulf Stream and Antilles Current systems.
Straits of Florida The Straits of Florida (FS) and the southeastern part of Ex-
uma Sound (ES) were chosen as the primary sites for deep-penetration holes designed to test the validity of the "megaplatform" hypothesis in the Bahamas. Large air-gun MCS profiles previously collected in the straits (Fig. 1) had imaged a pronounced impedance contrast associated with a velocity discontinuity of at least 1 km/s (from 4.2 km/s to 5.2 km/s), which Sheridan et al. (1981) had interpreted as a major facies boundary between mid-Upper Cretaceous(?) pelagic limestones and underlying mid-Cretaceous^) shallow-water (i.e., bank) carbonates. Sheridan et al. (1981) estimated the sub-bottom depth of this acoustic horizon to be approximately 1 km beneath the thalweg of the straits southeast of Miami, well within the anticipated drilling capability of the JOIDES Resolution. The proposed FS site survey was designed to supplement these existing seismic profiles with higher resolution, water-gun MCS records.
Initial thinking on the FS grid's placement favored a position north of the Great Isaac 1 borehole (Fig. 1) in order to acquire geophysical data as close to that ground truth as possible and to remove the disruptive effects both of ship traffic and 3-4-kt Gulf Stream currents. However, the survey was ultimately moved farther south (Fig. 13) to avoid both thick carbonate contourite de
posits at the confluence of the straits and Northeast Providence Channel (Mullins et al., 1980) and lithoherms/hardgrounds mapped in the eastern straits west of the Great Isaac 1 well (Neumann et al., 1977), which might make spudding-in difficult.
The Fred H. Moore approached the designated survey area from the north. The 400-in.3 gun was used almost exclusively for profiling in the straits (see Table 1). Over 2.5 days, approximately 500 km of reflection profiles was collected in a rectilinear grid (Fig. 13), along with sonobuoy refraction profiles (Tables 4 and 5). Continuous magnetics measurements and 3.5-kHz bathymetry were also acquired. Although ship traffic did not present problems, largely as a result of the relatively short streamer in use, the Gulf Stream did complicate both navigation and maintenance of ship's speed. For example, north-to-south profiles (into the current) were collected at ground speeds of approximately 3 kt, while south-to-north profiles were acquired at speeds up to 8 kt, with the result that fold of the processed stacks varies by more than a factor of 2. Fortunately, weather was excellent, and ambient noise did not significantly lower data quality.
Bathymetry Away from the steep modern carbonate-bank edge west of
the Bimini island group, the bottom of the straits in the site-survey area is characterized by two valleys opening to the south that exhibit relief up to 100 m (Fig. 13). They are oriented north-south, approximately parallel to local Gulf Stream surface-current directions. Bottom returns on 3.5-kHz records acquired during the survey are either hummocky and high-amplitude with no sub-bottom penetration (in the valley axes or on their flanks) or smooth with sub-bottom penetrations of up to 15 m (on in-terfluves between these channels). The bathymetry attests to the continuing erosional power of the Gulf Stream as it flows through the FS (a fact that later prevented setting a reentry cone in the straits during the shakedown cruise of the JOIDES Resolution, which immediately preceded Leg 101; see Leg 100 Shipboard Scientific Party, 1985).
Seismic Stratigraphy Stacked sections from the FS site-survey grid (Fig. 14A) were
interpreted to identify prominent sequence boundaries beneath the FS (after Vail et al., 1977). Eleven seismic sequences were delineated (Figs. 14B and 15) above an amplitude contrast/sequence boundary that coincides both with the pronounced downward velocity transition to material in excess of 5 km/s originally identified by Sheridan et al. (1981) and velocities of 4.9 km/s calculated from sonobuoy profiles 20 and 23 (Table 5; see also Fig. 14B). This acoustic surface constituted the deep "target" of Leg 101 drilling in the straits. The resolving capability of the FS MCS profiles is much improved over the large-volume air-gun profiles previously collected in the straits, which resolved only five seismic sequences above the same velocity contrast (compare Fig. 14 with profiles from the FS in Sheridan et al., 1981, and Ladd and Sheridan, 1987).
On north-south line FS-08, the top of the "target" horizon acoustic package is smooth and characterized by high-amplitude, parallel, continuous reflections at approximately 1.0 s sub-bottom (Fig. 14). In contrast, along east-west profile FS-14 (Fig. 15), the top of the "target" package occurs at approximately the same reflection time, but in places exhibits more relief associated with an underlying hummocky facies. This facies contrasts with the smoother, more parallel and continuous parts of the sub-"target" package to either side (compare Figs. 14 and 15).
Above the "target" horizon, the seismic stratigraphic succession is predominantly flat-lying and undeformed (Figs. 14 and
399

J. A. AUSTIN, JR., J. I. EWING, J. W. LADD, H. T. MULLINS, R. E. SHERIDAN
27° 40'
27°30'
78°20' 27o40' 78° I0'
RESIDUAL MAGNETIC INTENSITY
200
27°20'
27° 30'
78° I0'
27°20'
220
A. 78°20'
Figure 4. Magnetic anomaly contours north of Little Bahama Bank. This map was prepared by removing the regional-field gradient from total-intensity values measured using a proton precession magnetometer towed by the Moore. Note the general north-northeast-south-southwest trend of the anomalies, perhaps caused by basement structure related to the Walkers Cay fault zone.
15). Only sequence boundary 2/1 is consistently offset by small normal faults (Fig. 14B). Seismic facies alternate between packages of parallel, continuous reflections of variable amplitude (e.g., sequence 5, Fig. 14B) and intervals of wavy reflections (e.g., sequence 3, Fig. 15). Some hummocky clinoforms occur, both associated with the "target" horizon package already mentioned and in sequences 9 and 10 just beneath the present seafloor (Figs. 14B and 15).
Maps All seismic sequence boundaries were mapped in reflection
time. These times were converted to depth using both semblance velocity analyses from selected reflection lines (Fig. 13) and sonobuoy profiles (Table 5). Both structure and isopach maps were then prepared and deep-penetration sites chosen (see Fig. 16).
As previously stated, the primary Leg 101 goal in the FS was to penetrate and sample all 11 sequences down to and including the "target" horizon, which was believed to be the top of a buried shallow-water carbonate platform. Unfortunately, four single-bit attempts at Site 626 (see Fig. 13) succeeded in penetrating only a third of the way to the "target" surface, as a result of various drilling and geologic complications (Austin, Schlager, et al., 1986). Despite the limited success of Site 626, the site-survey maps provide valuable information on the geologic history of the FS/Gulf Stream system and the evolution of the northwestern Bahamas. Selected maps are discussed in this report, and the rest are available from Lamont-Doherty Geological Observatory.
Structure. "Target" Horizon: The top of the inferred buried shallow-water carbonate platform beneath the straits varies in
400

SEISMIC STRATIGRAPHIC IMPLICATIONS, LEG 101 SITE SURVEYS
Figure 5. Part of site-survey profile LBB-18 between Sites 627 and 628. Site 627 was located approximately 2 km off this profile (see also Fig. 3; Austin, Schlager, et al., 1986). Letters refer to individual seismic sequences (Austin, Schlager, et al., 1986). Large numbers approximately 0.5 nmi southwest of the projected position of Site 627 are interval velocities derived from LBB-18 semblance velocity analysis at that point. Smaller numbers in parentheses are an averaged set of interval velocities from sonobuoy 12, whose location coincides with the projected position of Site 627 on LBB-18. (For the complete set of sonobuoy 12 velocities, see Table 3.) Note the general similarity of the two velocity models, but that the transition to 4.2-km/s material occurs at a shallower depth in the sonobuoy solution. Possible explanations for the discrepancy are discussed in Austin, Schlager, et al. (1986). Also note the presence of interpreted thrust faults between the two sites, and a normal fault believed to be the Walkers Cay normal fault (Mullins and Van Buren, 1981) just northeast of Site 628. This fault may still be active, as it appears to offset the seafloor. (Actual position of the seafloor is indicated.) Earlier acoustic energy is a characteristic precursor of the water-gun sound source used to acquire this profile.
NORTH 1.0
.5 fe:,i
2.0 —
2 . 5 -
Figure 6. Part of line LBB-17 seaward of its tie with LBB-15, illustrating the effect that the Walkers Cay normal fault has on the stratigraphy of the lower slope north of Little Bahama Bank (see Fig. 3 for location). Sequence G (the shallow-water carbonate platform sampled at Site 627) is offset, while sequences A-F thicken across the fault trace, suggesting synsedimentary movement. On LBB-18 (Fig. 5), the fault trace extends upward to the seafloor, attesting to continuing dip-slip from the mid-Cretaceous to the present.
depth by more than 400 m within the area of the FS site-survey grid (Fig. 16). Highs of irregular dimensions appear to be associated with the hummocky seismic facies observed immediately below the "target" horizon on some of the site-survey profiles (Fig. 15). Lows correlate with the parallel, continuous seismic facies immediately below the "target" (Fig. 15).
Unfortunately, the "target" horizon was never reached at Site 626, so we can only speculate on the reasons for its local topography and for the variable acoustic signature of the sub-"target" section. The "target" horizon could be an erosional unconformity, as might be expected of at least parts of the top of a drowned shallow-water carbonate platform, although seismic evidence for truncation of the underlying section is equivocal (Fig. 14A). If erosional processes did modify the top of the
platform, then the hummocky facies might be analogous to either (1) zones of karst development on the subaerially exposed platform before its final inundation or (2) rills and furrows developed on the shallow-water(?) surface during Albian-Aptian(?) intensification of current flow through the FS (Sheridan et al., 1981).
Alternatively, the topography of the "target" horizon might have a constructional origin (Fig. 17). In this scenario, the highs observed (Fig. 16) might represent patch reefs that persisted following initial drowning of the more extensive platform. These reefs then grew upward approximately 200 m before finally succumbing to rising sea level and/or deteriorating environmental conditions. They now produce the hummocky acoustic response and the highs in the "target" surface, whereas the smoother, in-
401

J. A. AUSTIN, JR., J. I. EWING, J. W. LADD, H. T. MULLINS, R. E. SHERIDAN
WEST I .OH L B B - 1 8 SEAFLOOR
(S i te 6 2 8 )
L B B - 1 7 L B B " l 3
GH A W . / F R E Q .
EAST HIGH AMR/OTW FREQ.
2 .0^1
Figure 7. Part of LBB-13, illustrating the east-west extent of the Walkers Cay normal fault zone (see Fig. 3 for location). Note the eastward thickening of sequences A-F, and the change in sequence G seismic facies. Van Buren and Mullins (1983) ascribed these changes to a transition from a shallow-water platform/open-marine carbonate-shelf complex eastward to a deeper basin now buried beneath the southern Blake Plateau.
27°40'
27°40'
27° 30'
CONTOUR INTERVAL; 20 METERS
27°30
78°I0
27°20'
Figure 8. Structure of the top of seismic sequence D, northern Little Bahama Bank. Depth below sea level in meters. On these and subsequent structure maps, note that all depths are approximately 34 m too large, although regional trends are preserved and accurate. See the explanation in the text.
402
SEISMIC STRATIGRAPHIC IMPLICATIONS, LEG 101 SITE SURVEYS
27°40'
27°40'
27°30'
27°30'
27° 20'
Figure 9. Structure of the top of seismic sequence G, northern Little Bahama Bank. Depth below sea level in meters. Note the location of Site 627 on the flank of a structural closure, which may account for the presence of migrating hydrocarbons encountered at that site (see also Austin, Schlager, et al., 1986). The approximate trend of the Walkers Cay fault zone (outlined by dashed lines) is estimated from the distribution of normal faults on site-survey MCS profiles (see Figs. 5-7 and illustrations in Harwood and Towers, this volume).
tervening portions of the "target" reflection package could correspond to original lagoonal environments. Austin, Schlager, et al. (1986) proposed such a possibility to explain the 200-m depth discrepancy between the "target" horizon in the straits and the coeval platform top/comparable velocity contrast encountered in the Great Isaac 1 well (Figs. 13 and 17).
Sequence Boundary 4/3: One of the most intriguing acoustic surfaces mapped in the FS is sequence boundary 4/3 . Although it was never sampled and therefore calibrated by operations at Site 626, 4/3 appears as a gentle, slightly undulating surface of variable amplitude that separates wavy reflections of sequence 3 from discontinuous reflections of lower amplitude generally characteristic of sequence 4 (Figs. 14B and 15). On east-west profiles, the undulatory nature of 4/3 is the most pronounced (Fig. 15). Some truncation of underlying sequence 3 reflections occurs (Fig. 15, CDP 1150), but in other places sequence 3 ap
pears conformable with 4/3 (Fig. 15, CDP 1100), indicating that 4/3 does not always truncate the underlying section.
The map of the 4/3 surface (Fig. 18) reveals a striking arrangement of generally north-south-striking "waves" superimposed on a surface that is deepening to the west. The wavelength of these waves is 5-10 km, with crest-to-trough relief of 50-100 m. These features are comparable in size to abyssal mud waves identified on the Blake-Bahama Outer Ridge (Flood et al., 1974; Flood and Hollister, 1974; Flood, 1978), and it is tempting to speculate that buried "waves" in the FS are also syndepositional, i.e., caused by interaction with (increased?) flow through the straits. It is clear from the site-survey profiles that development of these "waves" is an event clearly distinct from and later than the presumed drowning phenomenon believed to be responsible for development of the "target" unconformity, reinforcing results from Site 626 (Austin, Schlager, et al., 1986) that
403

J. A. AUSTIN, JR., J. I. EWING, J. W. LADD, H. T. MULLINS, R. E. SHERIDAN
DISTANCE, NAUTICAL MILES SB-12 — e —
SB-15 e—
Q_ LLJ Q
NNE - * 50 n.mi. NW - ♦
BLAKE PLATEAU
1.6
2.1
2.5
2.8
2.9
^ ^ ^ ^ 4.8
4.9
A-G DENOTE SEISMIC SEQUENCES, VELOCITIES IN KM/SEC. DISCONTINUOUS DATA COVERAGE, JUMP REFLECTION CORRELATION REFLECTOR CONTINUOUS ON MCS DATA BUT VELOCITY ABOVE AND
BELOW NOT DISCRIMINATED ON SONOBUOYS Figure 10. Structure section of the southern Blake Plateau just north of LBB. This section was derived from sonobuoy velocities and inspection of site-survey profiles (primarily LBB-18). Note that dips beneath the Blake Plateau are generally flat, except for the interpreted shallow-water carbonate platform (sequence G), which dips at approximately 0.1° to the northwest. The major difference between this section and Figure 9 is the dip of the platform top toward LBB. Figure 9 indicates a rise of the top of sequence G toward the bank by 200-300 m, while the sonobuoy velocities suggest a deepening by about the same amount. However, note the lack of deep velocity control in sonobuoys 2 and 3, which may explain part of the discrepancy. In either case, Cretaceous platform dips toward the modern bank are small, on the order of 0.5°.
the Gulf Stream (Florida Current) system has been a pervasive force controlling sedimentological processes in the FS for many millions of years.
Sequence Boundary 9/8: The only well-sampled part of the section penetrated at Site 626 is a series of middle Miocene debris flows and turbidites (see Austin, Schlager, et al., 1986) coeval with the Great Abaco Member of the Blake Ridge Formation sampled during DSDP Legs 44 and 76 in the Blake-Bahama Basin to the north (Sheridan, Gradstein, et al., 1983; Bliefnick et al., 1983). These Miocene deposits correlate with seismic sequence 9 (Austin, Schlager, et al., 1986). On site-survey profile FS-08, sequence 9 is predominantly composed of hummocky clinoforms (Fig. 14). Farther west in the straits, this acoustic response gives way first to mounds, and finally to a parallel, discontinuous facies (Fig. 15). The predominance of hummocky clinoforms in the eastern part of the site-survey grid suggests the presence of debris flows (Vail et al., 1977), perhaps from the flanks of Great Bahama Bank to the east (Figs. 1 and 13). The exact cause or causes of this catastrophic shedding of debris from the carbonate bank to the straits is currently unknown, but Mullins et al. (1980), Sheridan, Gradstein, et al.
(1983), and Austin, Schlager, et al. (1986) have all suggested that a regional (tectonic?) trigger acting perhaps in concert with postulated Miocene eustatic sea-level fluctuations is responsible. The westward transition from hummocky clinoforms to mounded and then to parallel, discontinuous seismic facies in sequence 9 suggests progressive redistribution and winnowing of the debris flows by bottom currents (Mullins et al., 1980), a hypothesis substantiated by the recovery of such winnowed sediments at Site 626 (Austin, Schlager, et al., 1986).
In the vicinity of Site 626, the 9/8 sequence boundary exhibits up to 15 m of local relief (Fig. 19) and truncates underlying horizons, suggesting that the Miocene debris flows of which sequence 9 is composed could also erode the seafloor on which they were ultimately deposited (Austin, Schlager, et al., 1986). Over the extent of the FS grid, the 9/8 boundary exhibits a depth fluctuation of more than 200 m. Observable trends on this surface suggest erosion (evidenced as depressions) in both north-south and east-west directions, making conclusions about provenance of the overlying debris flows difficult to reach. Therefore, although Miocene debris flows appear to have affected an area extending from the FS to the Blake-Bahama Basin (Fig. 1),
404

SEISMIC STRATIGRAPHIC IMPLICATIONS, LEG 101 SITE SURVEYS
78°20 ' 2 7 ° 4 0 '
2 7 ° 3 0 '
CONTOUR INTERVAL^ 50 METERS
27°30 '
78° I0 '
27° 20'
7 8 ° 2 0 '
Figure 11. Isopach of seismic sequences A-C, north of Little Bahama Bank.
a distance of hundreds of kilometers, ambient currents must also have redistributed these flows pervasively, as their winnowed character at Site 626 suggests (Austin, Schlager, et al., 1986).
Isopachs. Total Sediment Thickness: Total post-"target"-ho-rizon sediment thicknesses range from less than 1000 m in the northwest corner of the grid to more than 1400 m farther south (Fig. 20). In general, sediment-thickness patterns in this part of the FS mimic the structure of the underlying "target" horizon (Fig. 16), a testimony to the smoothing effects of the Gulf Stream (Florida Current) system on sediment distribution since the inferred mid-Cretaceous(?) drowning of the shallow-water carbonate platform.
Exuma Sound Drilling objectives in ES involved both deep and shallow tar
gets. As in the FS, the primary deep objective in Exuma Sound (ES) was to penetrate the inferred top of a shallow-water carbonate "megaplatform." Existing regional MCS profiles acquired using large air guns had revealed a locally consistent and map-pable seismic stratigraphy (Fig. 21), which Sheridan et al. (1981) and Ladd and Sheridan (1987) attempted to correlate with dredge samples from southeastern ES (Schlager et al., 1984) and other
acoustic frameworks they had developed for the western Bahamas. On their line 357, the inferred "megaplatform" top coincided with sequence boundary P (Table 8; Fig. 21), associated with a downward velocity transition to material with compressional-wave velocities of 6.6 km/s (sonobuoy 90, Fig. 21; Ladd and Sheridan, 1987). Horizon P appeared to rise to the east (Fig. 21), and the site survey was consequently conducted in the southeastern part of ES partly to take advantage of this horizon's shallower depth (i.e., improved accessibility) there (Fig. 22).
Southeastern ES was also chosen as the optimal location for the second shallow-slope transect of Leg 101, which was designed to compare and contrast the evolution of the "bypass" (i.e., steeper, higher) slopes of ES with the gentler slope north of LBB (Schlager and Ginsburg, 1981; Austin, Schlager, et al., 1986). The primary drilling goal was to core inferred Neogene sequences: seafloor-Y, Y-O, and O-Br (Fig. 21; Table 8) continuously in order to assess their interpreted identity as apron wedges caused by intermittent slope input from the surrounding bank rims (Ladd and Sheridan, 1987).
The Moore approached the ES survey area from the northwest after transiting from the ES (Fig. 1). Approximately 600 km of reflection profiles was collected, spanning the entire width of
405

J. A. AUSTIN, JR., J. I. EWING, J. W. LADD, H. T. MULLINS, R. E. SHERIDAN
27°40
Figure 12. Isopach of seismic sequences A-F (equivalent to sub-bottom thickness above the top of sequence G), north of Little Bahama Bank.
the basin between Cat Island and Great Exuma Island (Fig. 22). The 400-in.3 water gun was used almost exclusively for acquiring both the reflection data (Table 1) and the sonobuoy profiles (Tables 6 and 7). Navigation using LORAN C alone was unreliable, so a combination of LORAN C, Transit satellite fixes, and radar bearings off nearby islands was used for positioning. As with the other two site areas, bathymetric and magnetic data were collected in conjunction with the seismic reflection and refraction profiles.
Seismic Stratigraphy The site-survey profiles were interpreted within the context of
the seismic stratigraphic framework developed by Sheridan et al. (1981) and Ladd and Sheridan (1987) for the MCS data previously shot in ES (Fig. 21). Unfortunately, Leg 101 operations succeeded in calibrating only seismic-sequence boundary O (Table 8). At both Sites 632 and 633 (Fig. 23), O correlated in depth with a turbidite sequence of latest Miocene age and an upward decrease in off-bank accumulation rates tentatively associated with deepening of the adjacent platform (Austin, Schlager, et
al., 1986). Ladd and Sheridan (1987) had independently estimated O to be a mid-upper Miocene unconformity (Table 8).
Maps Despite the limited success of Leg 101 in calibrating the seis
mic stratigraphic framework previously developed for ES, the site-survey MCS control is useful for improving our understanding of the geologic evolution of this part of the Bahamas. As with the other two site-survey areas, structure and isopach maps were prepared using all available profiles in conjunction with reflection time-to-depth estimates derived from semblance velocity analyses and selected sonobuoy results (Table 7; Fig. 24). Maps not discussed in this report are on file at Lamont-Doherty Geological Observatory.
Structure. "Target" Horizon: Horizon P is interpreted as the top of a buried, mid-Cretaceous(?) shallow-water carbonate platform (Table 8; Ladd and Sheridan, 1987). The structure map of this surface (Fig. 25) reveals that P dips approximately 1.4° to the southwest. Depth to P varies from 3.2 km (sub-sea level) in the northeast to more than 4.3 km in the southwest. The top of se-
406

SEISMIC STRATIGRAPHIC IMPLICATIONS, LEG 101 SITE SURVEYS
26° N 79°50'W 79°40' 79°30' 79°20' 79°10'
25°50' -
25°40' -
25°30'
Figure 13. Map of the site-survey grid in the Straits of Florida (see Fig. 1 for general location) superimposed on a bathymetric compilation (in corrected m; contour interval, 20 m) using 3.5-kHz profiles collected during the survey. Solid lines represent 24-trace, 12-fold seismic reflection profiles collected primarily using a 400-in.3 water gun (see Table 1). Inset box (upper left) details Site 626 operations (see also Austin, Schlager, et al., 1986). The Great Isaac 1 well is located about 60 km to the northeast. Dashed line is part of a regional MCS profile discussed by Sheridan et al. (1981) and Ladd and Sheridan (1987). Bold lines indicate sonobuoy profiles (see Table 5); arrows indicate acquisition direction.
quence G, the presumably coeval surface north of LBB, exhibits much less structural relief (Fig. 9). As with the top of G, if P indeed represents the top of a buried carbonate platform, it must have been almost horizontal at the time of drowning, as are the tops of the Bahama Banks today. Therefore, the observed structure must be primarily post-depositional. Although normal faults are recognized both on line 357 (Fig. 21) and on the site-survey profiles in the vicinity of Site 632 (Austin, Schlager, et al., 1986), individual throws appear small (on the order of 0.1-s reflection time, see Fig; 21). Regional tilting of P toward the southwest appears to have occurred instead, perhaps modified or accentuated by erosion. Interestingly, ES sonobuoy results image P only in the southern part of the survey area (Fig. 24). This is unexpected, as the MCS control indicates that the surface is deeper to the south.
Sequence Boundary R: Sequence boundary R is an interpreted Late Cretaceous horizon (Table 8; Ladd and Sheridan, 1987). The map of its structure (Fig. 26) indicates dips to the south and southwest. A northwest-southeast-trending set of normal faults offsets R and older sequences downward to the southwest (Fig. 21), perhaps explaining all of the regional dip observed. (However, migrating hydrocarbons encountered in upper Miocene rocks at sub-bottom depths of less than 300 m at Site 632 and interpreted normal faults on ES profiles near that site both imply that faulting also affects the Neogene section in ES [Austin,
Schlager, et al., 1986].) The causes for such faulting are unknown, but continuing northeastward movement of the Caribbean plate/Greater Antilles island arc unquestionably exerts a tectonic influence on the Bahama Banks (Malfait and Dinkel-man, 1972). Perhaps this plate convergence is causing both regional tilting of older surfaces and continuing reactivation of fault structures beneath ES, as it has north of Cuba in the FS (Angstadt et al., 1985). Similar phenomena have been observed seismically in the southeastern Bahamas (i.e., Caicos Basin) north of Hispaniola (Austin, 1983).
Neogene Section: Sequence Boundaries O and Y: Sequence boundaries O (Miocene) and Y (Plio-Pleistocene) (Figs. 27 and 28; Table 8; Ladd and Sheridan, 1987) both dip gently to the north. As is true north of LBB, this structure is consistent with a continuing line source of sediment from the carbonate platform to the south and southwest, a hypothesis confirmed by Leg 101 drilling results (Austin, Schlager, et al., 1986). Both horizons are truncated at the north and northeastern boundaries of the site-survey area by Exuma Canyon, which drains southeastward from ES to the deep Atlantic basin (Austin, Schlager, et al., 1986). Buried channels visible in the upper 0.5 s of site-survey profiles ES-05 and ES-07 (see Fig. 22 for their location and illustrations in Austin, Schlager, et al., 1986), the pervasive presence of Miocene and younger turbidites at Site 632 (Austin, Schlager, et al., 1986), and small-scale ( « 50 m) relief of the sea-
407

J. A. AUSTIN, JR., J. I. EWING, J. W. LADD, H. T. MULLINS, R. E. SHERIDAN
— 1 — 400
~ I — 300
1 ^nn 1 _
CDP 700 I
600 " ~ 1 — 500
FS - 0 8 South
& KM
FS -19 FS - 2 1
F S - 1 9 F S - 2 1 I * 3 B - 2 2
zzu/ 1.54
Figure 14. Uninterpreted (A) and interpreted (B) versions of the southern half of profile FS-08 in the Straits of Florida. The "target" horizon (interpreted top of a shallow-water carbonate platform) is indicated by arrows. Site 626 was located approximately at the tie between this profile and C2102, line 92 (see Fig. 13). Hole 626D penetrated to a sub-bottom depth of 447 m, or almost to sequence boundary 5/4 (see also Austin, Schlager, et al., 1986). On B, note the projected position of sonobuoy (SB) 22 and its tabulated interval velocities (see also Table 5).
408
SEISMIC STRATIGRAPHIC IMPLICATIONS, LEG 101 SITE SURVEYS
^i^S'-iSr"^^-???^"
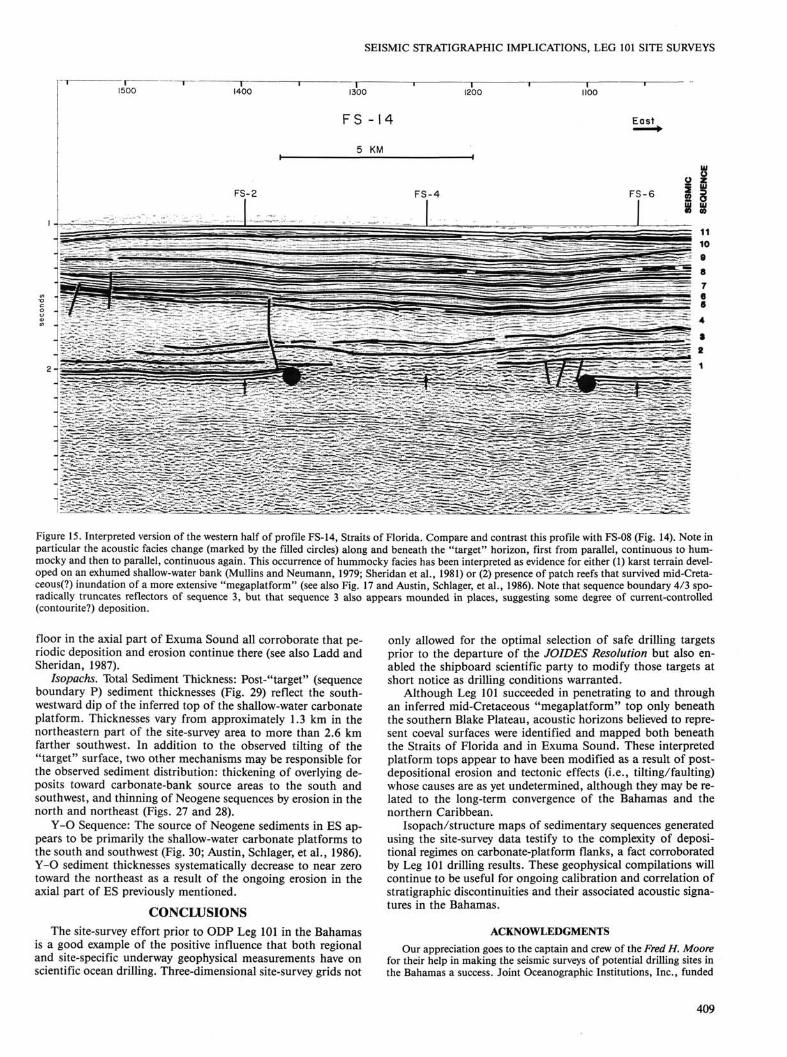
Figure 15. Interpreted version of the western half of profile FS-14, Straits of Florida. Compare and contrast this profile with FS-08 (Fig. 14). Note in particular the acoustic facies change (marked by the filled circles) along and beneath the "target" horizon, first from parallel, continuous to hummocky and then to parallel, continuous again. This occurrence of hummocky facies has been interpreted as evidence for either (1) karst terrain developed on an exhumed shallow-water bank (Mullins and Neumann, 1979; Sheridan et al., 1981) or (2) presence of patch reefs that survived mid-Cretaceous^) inundation of a more extensive "megaplatform" (see also Fig. 17 and Austin, Schlager, et al., 1986). Note that sequence boundary 4/3 sporadically truncates reflectors of sequence 3, but that sequence 3 also appears mounded in places, suggesting some degree of current-controlled (contourite?) deposition.
floor in the axial part of Exuma Sound all corroborate that periodic deposition and erosion continue there (see also Ladd and Sheridan, 1987).
Isopachs. Total Sediment Thickness: Post-"target" (sequence boundary P) sediment thicknesses (Fig. 29) reflect the south-westward dip of the inferred top of the shallow-water carbonate platform. Thicknesses vary from approximately 1.3 km in the northeastern part of the site-survey area to more than 2.6 km farther southwest. In addition to the observed tilting of the "target" surface, two other mechanisms may be responsible for the observed sediment distribution: thickening of overlying deposits toward carbonate-bank source areas to the south and southwest, and thinning of Neogene sequences by erosion in the north and northeast (Figs. 27 and 28).
Y-O Sequence: The source of Neogene sediments in ES appears to be primarily the shallow-water carbonate platforms to the south and southwest (Fig. 30; Austin, Schlager, et al., 1986). Y-O sediment thicknesses systematically decrease to near zero toward the northeast as a result of the ongoing erosion in the axial part of ES previously mentioned.
CONCLUSIONS The site-survey effort prior to ODP Leg 101 in the Bahamas
is a good example of the positive influence that both regional and site-specific underway geophysical measurements have on scientific ocean drilling. Three-dimensional site-survey grids not
only allowed for the optimal selection of safe drilling targets prior to the departure of the JOIDES Resolution but also enabled the shipboard scientific party to modify those targets at short notice as drilling conditions warranted.
Although Leg 101 succeeded in penetrating to and through an inferred mid-Cretaceous "megaplatform" top only beneath the southern Blake Plateau, acoustic horizons believed to represent coeval surfaces were identified and mapped both beneath the Straits of Florida and in Exuma Sound. These interpreted platform tops appear to have been modified as a result of postdepositional erosion and tectonic effects (i.e., tilting/faulting) whose causes are as yet undetermined, although they may be related to the long-term convergence of the Bahamas and the northern Caribbean.
Isopach/structure maps of sedimentary sequences generated using the site-survey data testify to the complexity of depositional regimes on carbonate-platform flanks, a fact corroborated by Leg 101 drilling results. These geophysical compilations will continue to be useful for ongoing calibration and correlation of stratigraphic discontinuities and their associated acoustic signatures in the Bahamas.
ACKNOWLEDGMENTS Our appreciation goes to the captain and crew of the Fred H. Moore
for their help in making the seismic surveys of potential drilling sites in the Bahamas a success. Joint Oceanographic Institutions, Inc., funded
409
J. A. AUSTIN, JR., J. I. EWING, J. W. LADD, H. T. MULLINS, R. E. SHERIDAN
*P^ FS-7
• DATA POINTS
- CONTOURS IN METERS
■■:■ HUMMOCKY FACIES 79° 30'
I
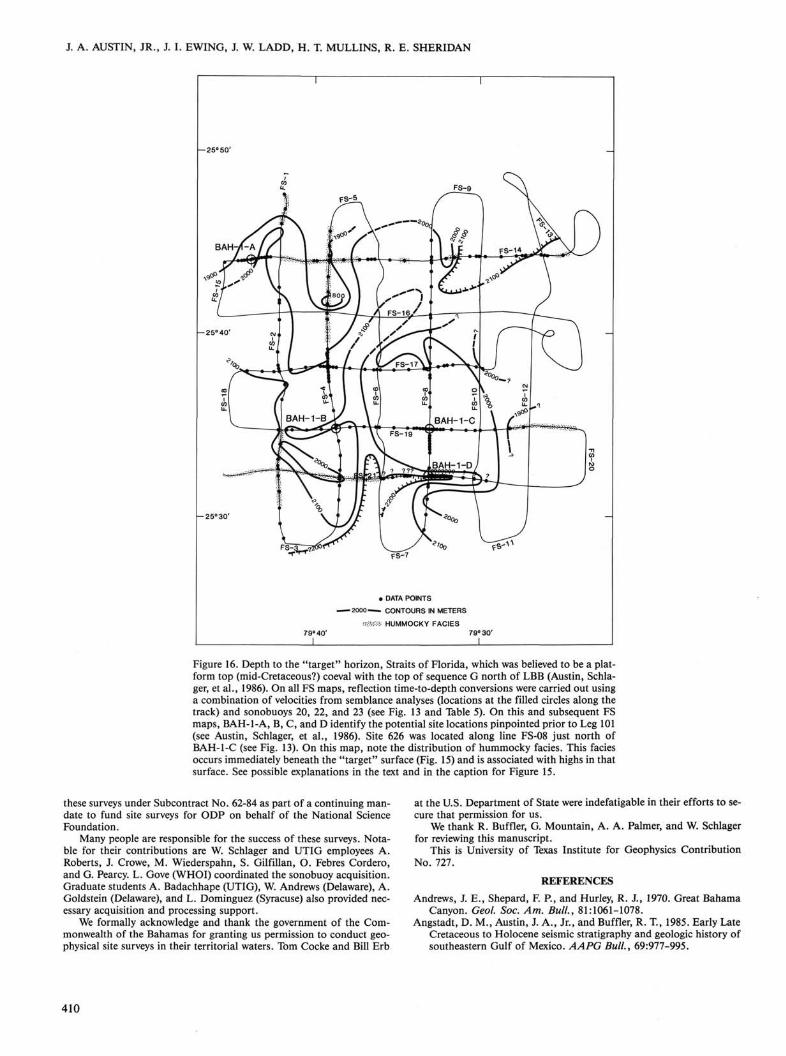
Figure 16. Depth to the "target" horizon, Straits of Florida, which was believed to be a platform top (mid-Cretaceous?) coeval with the top of sequence G north of LBB (Austin, Schlager, et al., 1986). On all FS maps, reflection time-to-depth conversions were carried out using a combination of velocities from semblance analyses (locations at the filled circles along the track) and sonobuoys 20, 22, and 23 (see Fig. 13 and Table 5). On this and subsequent FS maps, BAH-l-A, B, C, and D identify the potential site locations pinpointed prior to Leg 101 (see Austin, Schlager, et al., 1986). Site 626 was located along line FS-08 just north of BAH-l-C (see Fig. 13). On this map, note the distribution of hummocky facies. This facies occurs immediately beneath the "target" surface (Fig. 15) and is associated with highs in that surface. See possible explanations in the text and in the caption for Figure 15.
these surveys under Subcontract No. 62-84 as part of a continuing mandate to fund site surveys for ODP on behalf of the National Science Foundation.
Many people are responsible for the success of these surveys. Notable for their contributions are W. Schlager and UTIG employees A. Roberts, J. Crowe, M. Wiederspahn, S. Gilfillan, O. Febres Cordero, and G. Pearcy. L. Gove (WHOI) coordinated the sonobuoy acquisition. Graduate students A. Badachhape (UTIG), W. Andrews (Delaware), A. Goldstein (Delaware), and L. Dominguez (Syracuse) also provided necessary acquisition and processing support.
We formally acknowledge and thank the government of the Commonwealth of the Bahamas for granting us permission to conduct geophysical site surveys in their territorial waters. Tom Cocke and Bill Erb
at the U.S. Department of State were indefatigable in their efforts to secure that permission for us.
We thank R. Buffler, G. Mountain, A. A. Palmer, and W. Schlager for reviewing this manuscript.
This is University of Texas Institute for Geophysics Contribution No. 727.
REFERENCES Andrews, J. E., Shepard, F. P., and Hurley, R. J., 1970. Great Bahama
Canyon. Geol. Soc. Am. Bull., 81:1061-1078. Angstadt, D. M., Austin, J. A., Jr., and Buffler, R. T , 1985. Early Late
Cretaceous to Holocene seismic stratigraphy and geologic history of southeastern Gulf of Mexico. AAPG Bull., 69:977-995.
410

SEISMIC STRATIGRAPHIC IMPLICATIONS, LEG 101 SITE SURVEYS
Austin, J. A., Jr., 1983. OBC 5-A: Overthrusting in a deep-water carbonate terrane. In Bally, A. W. (Ed.), AAPG Studies in Geology, 3: 15:3.4.2-167-172.
Austin, J. A., Jr., Schlager, W., et al., 1986. Proc. ODP, Init. Repts., 101: College Station, TX (Ocean Drilling Program).
Ball, M. M., 1967. Tectonic control of the configuration of the Florida-Bahama Platform. Gulf Coast Assoc. Geol. Soc. Trans., 17:265-267.
Bliefnick, D. M., Robertson, A.H.F., and Sheridan, R. E., 1983. Depo-sition'and provenance of Miocene intraclastic chalks, Blake-Bahama Basin, western North Atlantic. In Sheridan, R. E., Gradstein, E M., et al., Init. Repts. DSDP, 76: Washington (U.S. Govt. Printing Office), 727-748.
Boardman, M. R., and Neumann, A. C , 1984. Sources of periplatform sediment to Northwest Providence Channel, Bahamas. J. Sediment. Petrol., 54:1110-1123.
Boardman, M. R., Neumann, A. C , Baker, P. A., Dulin, L. A., Kenter, R. J., Hunter, G. E., and Kiefer, K. B., 1986. Banktop responses to Quaternary fluctuations in sea level recorded in periplatform sediments. Geology, 14:28-31.
Cook, H. E., and Enos, P., 1977. Deep-water carbonate environments— an introduction. In Cook, H. E., and Enos, P. (Eds.), Deep-water Carbonate Environments: Soc. Econ. Paleontol. Mineral. Spec. Publ., 25:1-3.
COSOD, 1982. Report of the Conference on Scientific Ocean Drilling. JOIDES: Washington.
Crevello, P., and Schlager, W., 1980. Carbonate debris sheets and turbidites, Exuma Sound, Bahamas. J. Sediment. Petrol., 50:1121-1148.
Dietz, R. S., and Holden, J. C , 1971. Geotectonic evolution and subsidence of Bahama Platform: Reply. Geol. Soc. Am. Bull., 82:809-812.
Dietz, R. S., Holden, J. C , and Sproll, W P., 1970. Geotectonic evolution and subsidence of Bahama Platform. Geol. Soc. Am. Bull., 81: 1915-1928.
Droxler, A. W , and Schlager, W , 1985. Glacial versus interglacial sedimentation rates and turbidite frequency in the Bahamas. Geology, 13:799-802.
Droxler, A. W, Schlager, W , and Whallon, C. C , 1983. Quaternary aragonite cycles and oxygen-isotope record in Bahamian carbonate ooze. Geology, 11:235-239.
Eberli, G. P., and Ginsburg, R. N., 1987. Segmentation and coalescence of Cenozoic carbonate platforms, northwestern Great Bahama Bank. Geology, 15:75-79.
Eliuk, L. S., 1978. The Abenaki Formation, Nova Scotia shelf, Canada—A depositional and diagenetic model for a Mesozoic carbonate platform. Can. Pet. Geol. Bull., 26:424-514.
Emery, K. O., and Uchupi, E., 1972. Western North Atlantic Ocean: Topography, Rocks, Structure, Water, Life, and Sediments: AAPG Mem., 17.
Enos, P., 1977. Tamabra Limestone of the Poza Rica trend, Cretaceous, Mexico. In Cook, H. E., and Enos, P. (Eds.), Deep-water Carbonate Environments: Soc. Econ. Paleontol. Mineral. Spec. Publ., 25: 273-314.
Flood, R. D., 1978. Studies of deep-sea sedimentary microtopography in the North Atlantic Ocean [Ph.D dissert.] Mass. Inst. Technol.-Woods Hole Oceanogr. Inst.
Flood, R. D., and Hollister, C. D., 1974. Current-controlled topography on the continental margin off the eastern United States. In Burk, C. A., and Drake, C: L. (Eds.), The Geology of Continental Margins: New York (Springer-Verlag), 197-205.
Flood, R. D., Hollister, C. D., Johnson, D. A., Southard, J. B., and Lonsdale, P. F , 1974. Hyperbolic echoes and erosional furrows on the Blake-Bahama Outer Ridge. Am. Geophys. Union Trans., 55: 284. (Abstract)
Hine, A. C , and Neumann, A. C , 1977. Shallow carbonate bank margin growth and structure, Little Bahama Bank. AAPG Bull., 61: 374-406.
Jansa, L. F , and Wade, J. A., 1975. Geology of the continental margin off Nova Scotia and Newfoundland. Can. Geol. Surv. Pap. 74-30, 2: 51-105.
Jansa, L. F , and Wiedmann, J., 1982. Mesozoic-cenozoic development of the eastern North American and northwest African continental margins: A comparison. In Von Rad., U., et al. (Eds.), Geology of
the Northwest African Continental Margin: New York (Springer-Verlag), 215-269.
Klitgord, K. D., Popenoe, P., and Schouten, H., 1984. Florida: A Jurassic transform plate boundary. J. Geophys. Res., 89:7753-7772.
Ladd, J. W , and Sheridan, R. E., 1987. Seismic stratigraphy of the Bahamas. AAPG Bull., 71:719-736.
Leg 100 Shipboard Scientific Party, 1985. Ocean Drilling Program launches first cruise. Geotimes, 30(7): 12-14.
Malfait, B. T , and Dinkelman, M. G., 1972. Circum-Caribbean tectonics and igneous activity and the evolution of the Caribbean plate: Geol. Soc. Am. Bull., 83:251-272.
Meyerhoff, A. A., and Hatten, C. W , 1974. Bahamas salient of North America. In Burk, C. A., and Drake, C. L. (Eds.), The Geology of Continental Margins: New York (Springer-Verlag), 429-446.
Mullins, H. T., Gardulski, A. F , and Hine, A. C , 1986. Catastrophic collapse of the west Florida carbonate platform margin: Geology, 14:167-170.
Mullins, H. T., Heath, K. C , Van Buren, H. M., and Newton, C. R., 1984. Anatomy of a modern open-ocean carbonate slope: northern Little Bahama Bank. Sedimentology, 31:141-168.
Mullins, H. T., and Lynts, G. W., 1977. Origin of the northwestern Bahama Platform: review and reinterpretation. Geol. Soc. Am. Bull., 88:1447-1461.
Mullins, H. T., and Neumann, A. C , 1979. Deep carbonate bank margin structure and sedimentation in the northern Bahamas. In Doyle, L. J., and Pilkey, O. H. (Eds.), Geology of Carbonate Slopes: Soc. Econ. Paleontol. Mineral. Spec. Publ., 27:165-192.
Mullins, H. T., Neumann, A. C , Wilber, R. J., Hine, A. C , and Chin-burg, S. J., 1980. Carbonate sediment drifts in northern Straits of Florida. AAPG Bull., 64:1701-1717.
Mullins, H. T., and Van Buren, H. M., 1981. Walkers Cay fault, Bahamas: Evidence for Cenozoic faulting. Geo. Mar. Lett., 1:225-231.
Murris, R. J., 1980. Middle East stratigraphic evolution and oil habitat. AAPG Bull., 64:597-618.
Neumann, A. C , Kofoed, J. W , and Keller, G. H., 1977. Lithoherms in the Straits of Florida. Geology, 5:4-10.
Paulus, F. J., 1972. The geology of Site 98 and the Bahama Platform. In Hollister, C D . , Ewing, J. I., et al., Init. Repts. DSDP, 11: Washington (U.S. Govt. Printing Office), 877-897.
Poag, C. W, 1982. Stratigraphic reference section for Georges Bank— Depositional model for New England passive margin. AAPG Bull., 66:1021-1041.
, (Ed.), 1985. Geologic Evolution of the United States Atlantic Margin: New York (Van Nostrand Reinhold).
Schlager, W, Austin, J. A., Jr., Corso, W , McNulty, C. W , Fluegel, E., Renz, O., and Steinmetz, J. C , 1984. Early Cretaceous platform re-entrant and escarpment erosion in the Bahamas. Geology, 12: 147-150.
Schlager, W , and Chermak, A., 1979. Sediment facies of platform-basin transition, Tongue of the Ocean, Bahamas. In Doyle, L. J., and Pilkey, O. H. (Eds.), Geology of Continental Slopes: Soc. Econ. Paleontol. Mineral. Spec. Publ., 27:193-208.
Schlager, W, and Ginsburg, R. N., 1981. Bahama carbonate platforms— the deep and the past. Mar. Geol., 44:1-24.
Schlager, W, Hooke, R. L., and James, N. P., 1976. Episodic erosion and deposition in the Tongue of the Ocean, Bahamas. Geol. Soc. Am. Bull., 87:1115-1118.
Shcherbakova, B. Ye., Bovenko, V. G., and Ernandes, G., 1978. Crustal structure in west Cuba. Int. Geol. Rev., 20:1125-1130.
Sheridan, R. E., 1971. Geotectonic evolution and subsidence of Bahama Platform: Discussion. Geol. Soc. Am. Bull., 82:807-810.
, 1972. Crustal structure of the Bahama Platform from Ray-leigh wave dispersion. /. Geophys. Res., 77:2139-2145.
, 1974. Atlantic continental margin of North America. In Burk, C. A., and Drake, C. L. (Eds.), The Geology of Continental Margins: New York (Springer-Verlag), 391-407.
Sheridan, R. E., Crosby, J. T., Bryan, G. M., and Stoffa, P. L., 1981. Stratigraphy and structure of southern Blake Plateau, northern Florida Straits, and northern Bahama Platform from multichannel seismic reflection data: AAPG Bull., 65:2571-2593.
Sheridan, R. E., Drake, C. L., Nafe, J. E., and Hennion, J., 1966. Seismic refraction study of continental margin east of Florida. AAPG Bull., 50:1972-1990.
411
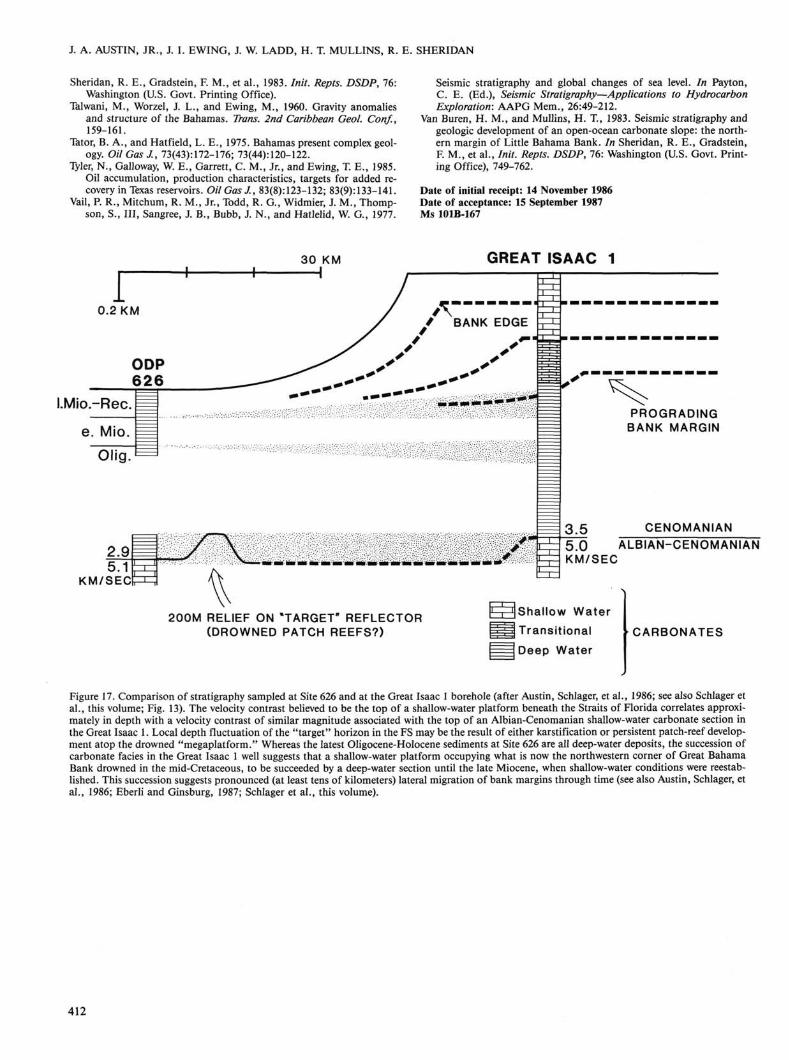
J. A. AUSTIN, JR., J. I. EWING, J. W. LADD, H. T. MULLINS, R. E. SHERIDAN
Sheridan, R. E., Gradstein, F. M., et al., 1983. Init. Repts. DSDP, 76: Washington (U.S. Govt. Printing Office).
Talwani, M., Worzel, J. L., and Ewing, M., 1960. Gravity anomalies and structure of the Bahamas. Trans. 2nd Caribbean Geol. Conf., 159-161.
Tator, B. A., and Hatfield, L. E., 1975. Bahamas present complex geology. Oil Gas J., 73(43):172-176; 73(44): 120-122.
Tyler, N., Galloway, W. E., Garrett, C. M., Jr., and Ewing, T. E., 1985. Oil accumulation, production characteristics, targets for added recovery in Texas reservoirs. Oil GasJ., 83(8):123-132; 83(9):133-141.
Vail, P. R., Mitchum, R. M., Jr., Todd, R. G., Widmier, J. M., Thompson, S., Ill, Sangree, J. B., Bubb, J. N., and Hatlelid, W. G., 1977.
Seismic stratigraphy and global changes of sea level. In Payton, C. E. (Ed.), Seismic Stratigraphy—Applications to Hydrocarbon Exploration: AAPG Mem., 26:49-212.
Van Buren, H. M., and Mullins, H. T , 1983. Seismic stratigraphy and geologic development of an open-ocean carbonate slope: the northern margin of Little Bahama Bank. In Sheridan, R. E., Gradstein, F. M., et al., Init. Repts. DSDP, 76: Washington (U.S. Govt. Printing Office), 749-762.
Date of initial receipt: 14 November 1986 Date of acceptance: 15 September 1987 Ms 101B-167
30 KM GREAT ISAAC 1
/ BANK EDGE
I.Mio.-Rec
e. Mio Olig
5.1 KM/SEC
mmmmm****! w ^ PROGRADING BANK MARGIN
CENOMANIAN 3.5 5 .0 ALBIAN-CENOMANIAN KM/SEC
200M RELIEF ON "TARGET" REFLECTOR (DROWNED PATCH REEFS?)
(Shallow Water Transitional Deep Water
►CARBONATES
Figure 17. Comparison of stratigraphy sampled at Site 626 and at the Great Isaac 1 borehole (after Austin, Schlager, et al., 1986; see also Schlager et al., this volume; Fig. 13). The velocity contrast believed to be the top of a shallow-water platform beneath the Straits of Florida correlates approximately in depth with a velocity contrast of similar magnitude associated with the top of an Albian-Cenomanian shallow-water carbonate section in the Great Isaac 1. Local depth fluctuation of the "target" horizon in the FS may be the result of either karstification or persistent patch-reef development atop the drowned "megaplatform." Whereas the latest Oligocene-Holocene sediments at Site 626 are all deep-water deposits, the succession of carbonate facies in the Great Isaac 1 well suggests that a shallow-water platform occupying what is now the northwestern corner of Great Bahama Bank drowned in the mid-Cretaceous, to be succeeded by a deep-water section until the late Miocene, when shallow-water conditions were reestablished. This succession suggests pronounced (at least tens of kilometers) lateral migration of bank margins through time (see also Austin, Schlager, et al., 1986; Eberli and Ginsburg, 1987; Schlager et al., this volume).
412

SEISMIC STRATIGRAPHIC IMPLICATIONS, LEG 101 SITE SURVEYS
• DATA POINTS
.1500 CONTOURS IN METERS
79° 40' 79° 30'
Figure 18. Structure of seismic-sequence boundary 4/3, which may represent in part the top of a series of "waves" perhaps caused by ancestral Gulf Stream (Florida Current) flow in the Straits of Florida. Contour values reflect depths below sea level.
413

J. A. AUSTIN, JR., J. I. EWING, J. W. LADD, H. T. MULLINS, R. E. SHERIDAN
Figure 19. Structure of seismic-sequence boundary 9/8, which correlates in depth with the base of a series of Miocene debris flows encountered at Site 626 (see also Austin, Schlager, et al., 1986; Fulthorpe and Melillo, this volume). Contour values reflect depths below sea level.
414
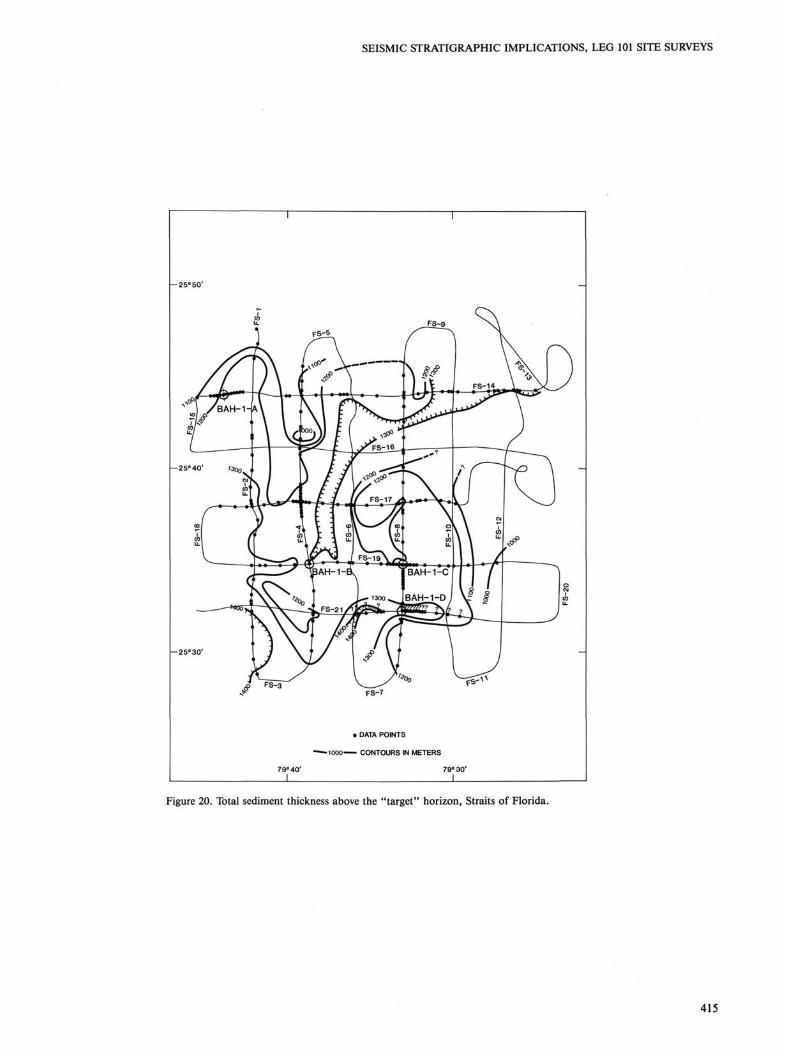
SEISMIC STRATIGRAPHIC IMPLICATIONS, LEG 101 SITE SURVEYS
-25° 50'
- 2 5 ° 3 0 '
FS-7
• DATA POINTS
■1000 CONTOURS IN METERS
79° 40' _J
79° 30'
Figure 20. Total sediment thickness above the "target" horizon, Straits of Florida.
415
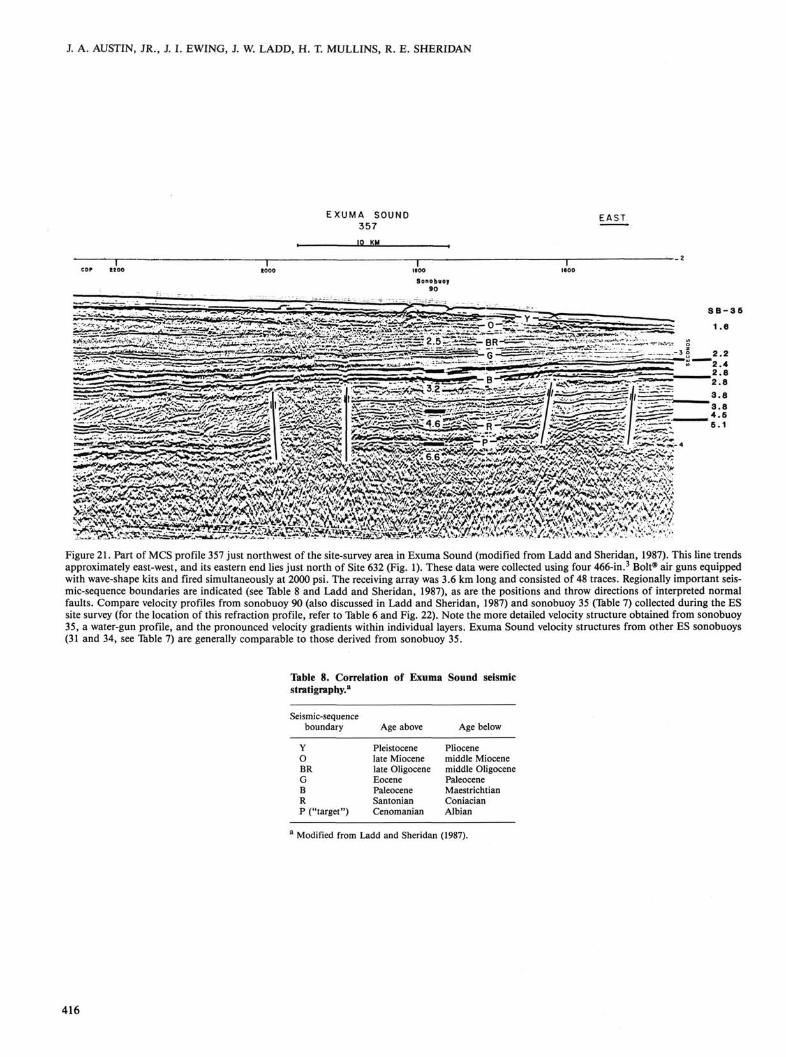
J. A. AUSTIN, JR., J. I. EWING, J. W. LADD, H. T. MULLINS, R. E. SHERIDAN
EXUMA SOUND 357
'0 KM
CDP 1200 tOOO 1800 1600
Sonobuoy 90
Figure 21. Part of MCS profile 357 just northwest of the site-survey area in Exuma Sound (modified from Ladd and Sheridan, 1987). This line trends approximately east-west, and its eastern end lies just north of Site 632 (Fig. 1). These data were collected using four 466-in.3 Bolt® air guns equipped with wave-shape kits and fired simultaneously at 2000 psi. The receiving array was 3.6 km long and consisted of 48 traces. Regionally important seismic-sequence boundaries are indicated (see Table 8 and Ladd and Sheridan, 1987), as are the positions and throw directions of interpreted normal faults. Compare velocity profiles from sonobuoy 90 (also discussed in Ladd and Sheridan, 1987) and sonobuoy 35 (Table 7) collected during the ES site survey (for the location of this refraction profile, refer to Table 6 and Fig. 22). Note the more detailed velocity structure obtained from sonobuoy 35, a water-gun profile, and the pronounced velocity gradients within individual layers. Exuma Sound velocity structures from other ES sonobuoys (31 and 34, see Table 7) are generally comparable to those derived from sonobuoy 35.
Table 8. Correlation of Exuma Sound seismic stratigraphy.8
Seismic-sequence boundary
Y O BR G B R P ("target")
Age above
Pleistocene late Miocene late Oligocene Eocene Paleocene Santonian Cenomanian
Age below
Pliocene middle Miocene middle Oligocene Paleocene Maestrichtian Coniacian Albian
Modified from Ladd and Sheridan (1987).
416
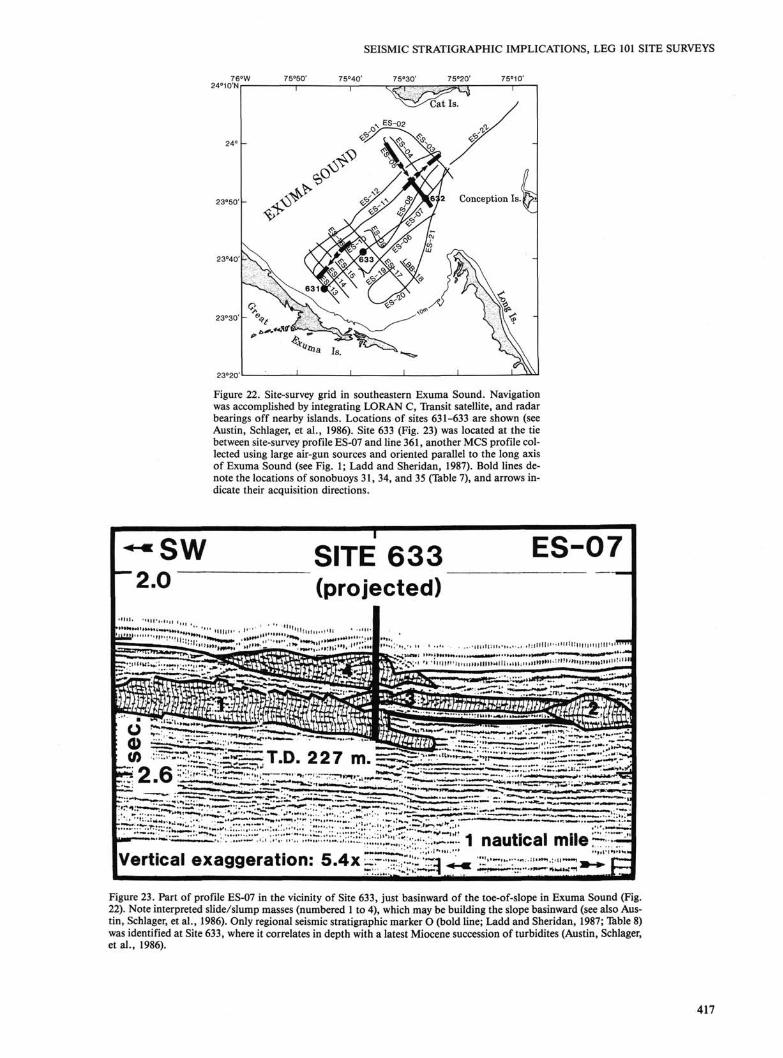
SEISMIC STRATIGRAPHIC IMPLICATIONS, LEG 101 SITE SURVEYS
76°W 75°50' 75°40' 75°30' 75°20' 75°10' I 'M , .
Figure 22. Site-survey grid in southeastern Exuma Sound. Navigation was accomplished by integrating LORAN C, Transit satellite, and radar bearings off nearby islands. Locations of sites 631-633 are shown (see Austin, Schlager, et al., 1986). Site 633 (Fig. 23) was located at the tie between site-survey profile ES-07 and line 361, another MCS profile collected using large air-gun sources and oriented parallel to the long axis of Exuma Sound (see Fig. 1; Ladd and Sheridan, 1987). Bold lines denote the locations of sonobuoys 31, 34, and 35 (Table 7), and arrows indicate their acquisition directions.
Figure 23. Part of profile ES-07 in the vicinity of Site 633, just basinward of the toe-of-slope in Exuma Sound (Fig. 22). Note interpreted slide/slump masses (numbered 1 to 4), which may be building the slope basinward (see also Austin, Schlager, et al., 1986). Only regional seismic stratigraphic marker O (bold line; Ladd and Sheridan, 1987; Table 8) was identified at Site 633, where it correlates in depth with a latest Miocene succession of turbidites (Austin, Schlager, et al., 1986).
417

J. A. AUSTIN, JR., J. I. EWING, J. W. LADD, H. T. MULLINS, R. E. SHERIDAN
OFFSET DISTANCE, KM 4 6 8 10 12 I I I
14 16
1 SONOBUOY # 3 4 EXUMA SOUND
Figure 24. Field record of sonobuoy 34 (see Fig. 22 for location, and Table 7). Note in particular the refractor (horizon P, see Table 8) at approximately 5.0 s, which exhibits a Vp in excess of 6.0 km/s. This horizon is detected only on refraction profiles shot in the southern part of the ES site-survey grid (Fig. 22), although the MCS control suggests that P is deeper there than farther to the north (see Fig. 25).
418

SEISMIC STRATIGRAPHIC IMPLICATIONS, LEG 101 SITE SURVEYS
Figure 25. Structure of the "target" horizon, Exuma Sound. This acoustic horizon is equivalent to seismic sequence boundary P (Table 8), an interpreted shallow-water carbonate platform top coeval with the top of sequence G north of LBB. P dips generally to the southwest (but see Fig. 24). Depth below sea level in meters; contour interval, 100 m.
419
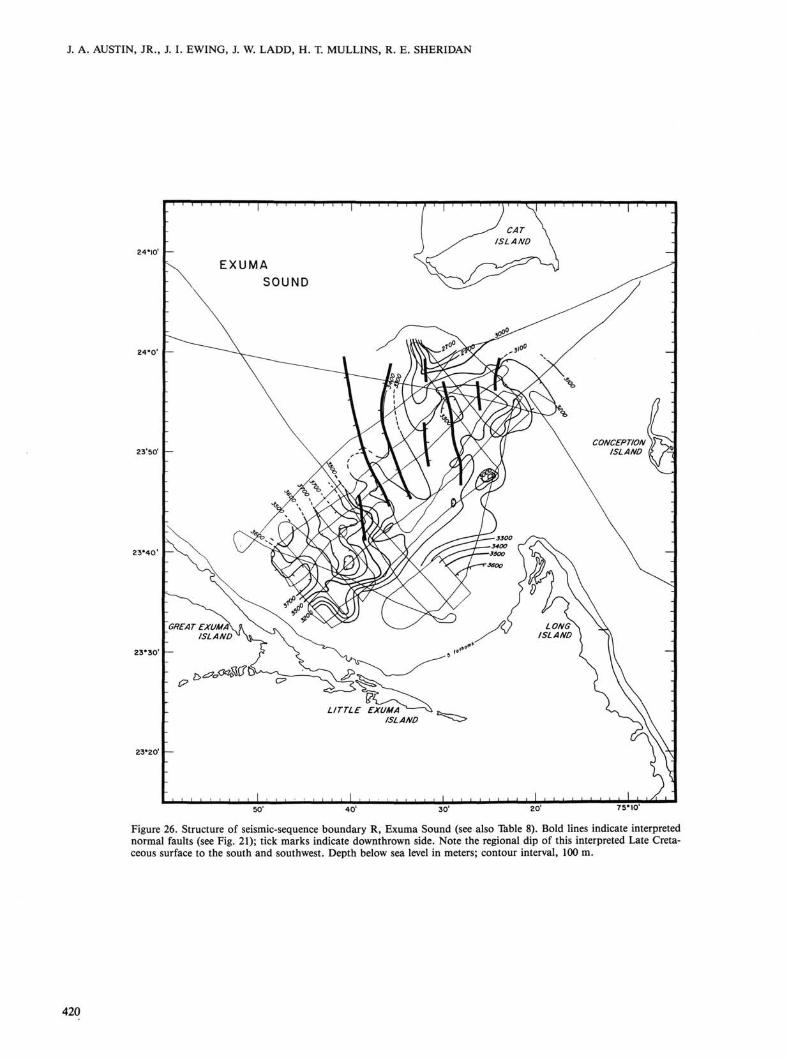
J. A. AUSTIN, JR., J. I. EWING, J. W. LADD, H. T. MULLINS, R. E. SHERIDAN
40' 30' 20' 75*10'
Figure 26. Structure of seismic-sequence boundary R, Exuma Sound (see also Table 8). Bold lines indicate interpreted normal faults (see Fig. 21); tick marks indicate downthrown side. Note the regional dip of this interpreted Late Cretaceous surface to the south and southwest. Depth below sea level in meters; contour interval, 100 m.
420
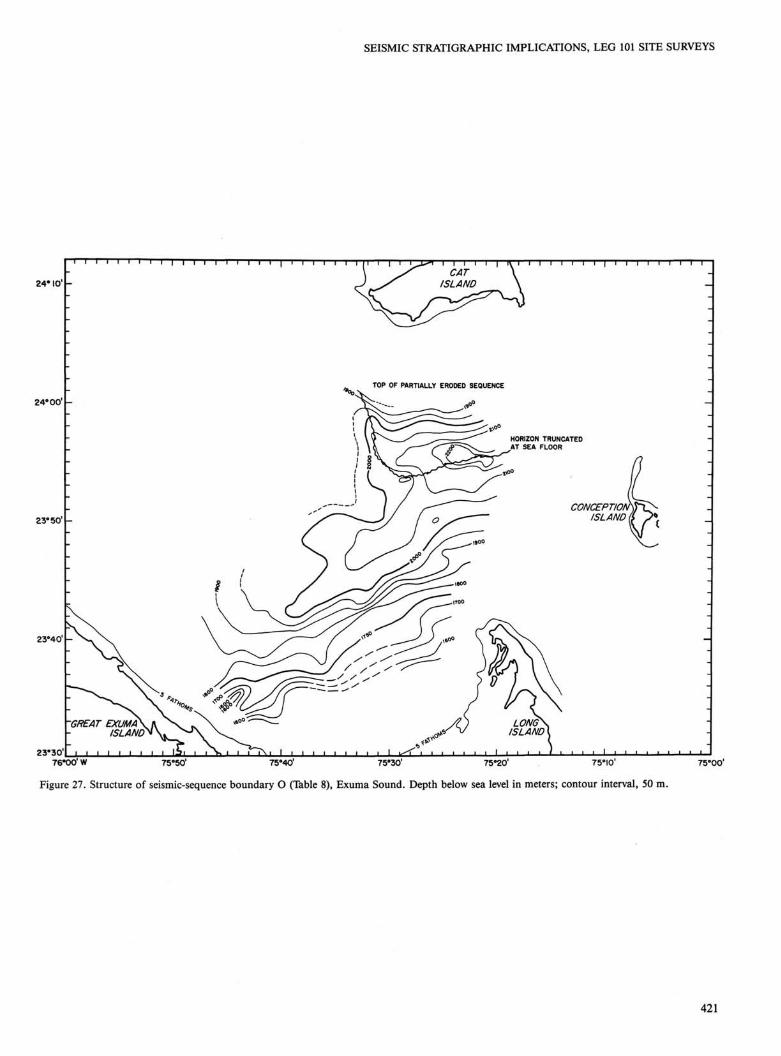
SEISMIC STRATIGRAPHIC IMPLICATIONS, LEG 101 SITE SURVEYS
i I i i i i i i l I I T i i i r ' ' I ' I I f l I | I I I I I I I—I I I I I I I I I I I
TOP OF PARTIALLY ERO0ED SEQUENCE
HORIZON TRUNCATED AT SEA FLOOR
COA/CEPT/O/V^C^ ISLAND (I p*
vV^k^T5
J I I I I I L i ^r 1 I ' ■ ■ i I ■ i i i L 76*00'W 75*50' 75*40' 75*30' 75*20' 75*10'
Figure 27. Structure of seismic-sequence boundary O (Table 8), Exuma Sound. Depth below sea level in meters; contour interval, 50 m.
75*00'
421

J. A. AUSTIN, JR., J. I. EWING, J. W. LADD, H. T. MULLINS, R. E. SHERIDAN
I I I i I I i i l I I i T—i—r—i—i—|—i—i—i—i i i—rrr i i i — I — I — i — i — i | i — i — r — 1 — i i i i i
tf*9
co/vcEPr/omJx^-ISLAND^ p*
ERODED SURFACE (REPRESENTS TOP OF "YELLOW TO ORANGE" INTERVAL)
J — I I I—I I—I I I I ' ■ ■ 76°00'W 75°50" 75"40' 75*30' 75°20' 75"I0"
Figure 28. Structure of seismic-sequence boundary Y (Table 8), Exuma Sound. Depth below sea level in meters; contour interval, 50 m.
75*00
422

SEISMIC STRATIGRAPHIC IMPLICATIONS, LEG 101 SITE SURVEYS
- 5 0 '
— I0'
EXUMA
SOUND
s*
^-24°00'
« ■ & m '*+/*&
? O O A - K V ' a
^ \
J>s
* ' ? 0 0 -
-teoo-
rftZ i ! *
£^<*$cf§
CONCEPTION)f\>~ ISLAND (f x>2
Figure 29. Total sediment thickness above the "target" (P) horizon, Exuma Sound. Isopach interval, 100 m.
423

J. A. AUSTIN, JR., J. I. EWING, J. W. LADD, H. T. MULLINS, R. E. SHERIDAN
i i i I l i i i i ■ i i I i I i i I i I i i i i I i l I I l l I | l l I l l I l I I
TOP MISSING (PARTIALLY ERODED SEQUENCE)
CONCEPTION)fx>-ISLAND « T>
1 l I 76°00'W 75°50' 75*40' 75°30'
Figure 30. Isopach map of Y-O sequence, Exuma Sound. Isopach interval, 50 m. 75"20' 75°I0' 75* 00"
424