australia-china free trade agreement : who gains and who ...€¦ · -15-10-5 0 5 10 15 20 ......
TRANSCRIPT

1
AustraliaAustralia--China Free Trade China Free Trade Agreement :Agreement :
Who Gains and Who Loses?Who Gains and Who Loses?
Prof Tran Van HoaCentre for Strategic Economic Studies, and
Director, Vietnam and ASEAN+3 Research ProgramVictoria University, Melbourne, Australia
Email: [email protected]: http://www.staff.vu.edu.au/CSESBL/
MOTIVATION 1:MOTIVATION 1:WTO & FTA ALTERNATIVESWTO & FTA ALTERNATIVES
II WTO (WTO (GATT, GATSGATT, GATS) ) –– even Doha even Doha LiteLiteOn the verge of collapsing (Pascal On the verge of collapsing (Pascal LamyLamy)?)?
IIII EEmerging: Regional Trade Agreementsmerging: Regional Trade Agreements-- NAR and FTA: accepted exceptions under NAR and FTA: accepted exceptions under Articles XIV of GATT and V of GATSArticles XIV of GATT and V of GATS-- Cover Investment & Services (outsideCover Investment & Services (outside--WTO scope)WTO scope)
Examples:Examples:AFTA, NAFTA, ASEAN+3, ASFTA, ATHFTA, AFTA, NAFTA, ASEAN+3, ASFTA, ATHFTA, Proposed ACFTA & AJPFTAProposed ACFTA & AJPFTA
2
MOTIVATION 2 MOTIVATION 2 ::WHY & WHAT GAINS FROM WTO WHY & WHAT GAINS FROM WTO
& FTAS?& FTAS?III.III. Why Why FTAsFTAs??
11 Slow WTO negotiations as at 2006Slow WTO negotiations as at 200622 Strong Recovery in Asia after 1997 Strong Recovery in Asia after 1997
despite a sick Japan over a decadedespite a sick Japan over a decade33 Benign neglect from North America Benign neglect from North America
and EU due to minor contagionand EU due to minor contagionIV.IV. When? When? 1940s and Early 2000s1940s and Early 2000sV.V. What Impact Empirically?What Impact Empirically?
Perceived or Validated Perceived or Validated National Benefits and National Benefits and SectoralSectoral LossesLosses
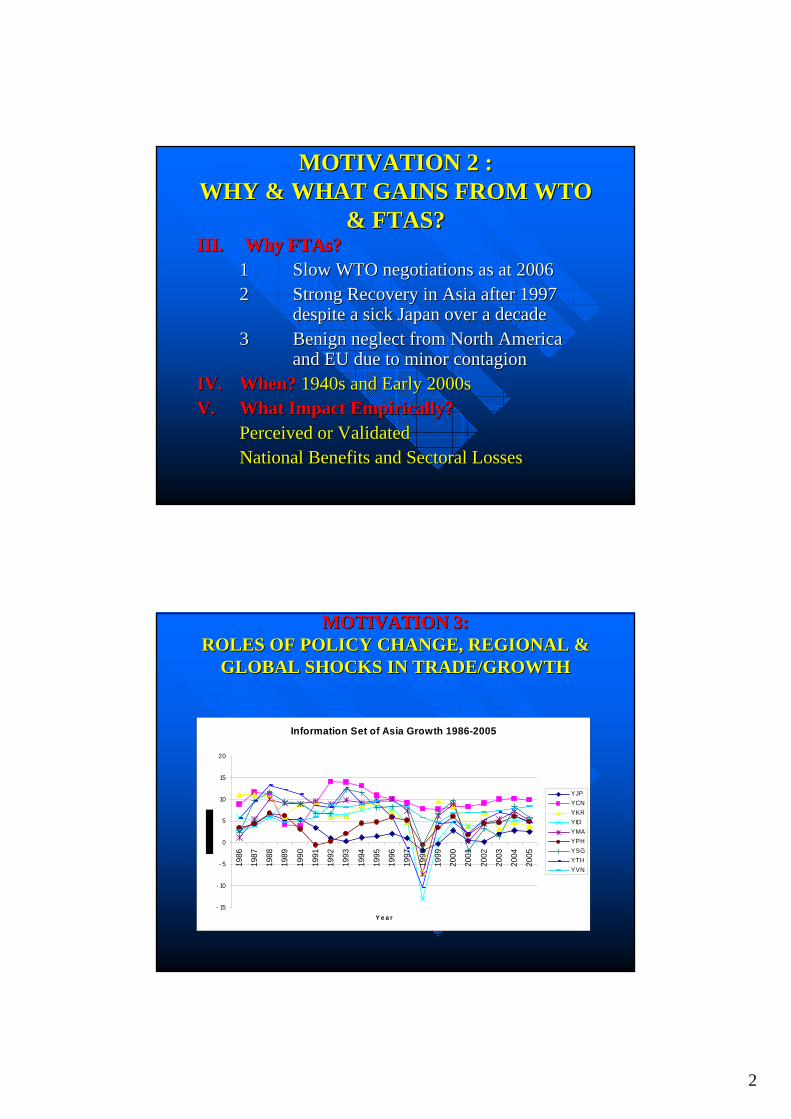
MOTIVATION 3:MOTIVATION 3:ROLES OF POLICY CHANGE, REGIONAL & ROLES OF POLICY CHANGE, REGIONAL &
GLOBAL SHOCKS IN TRADE/GROWTHGLOBAL SHOCKS IN TRADE/GROWTH
Information Set of Asia Growth 1986-2005
- 15
- 10
- 5
0
5
10
15
20
1986
1987
1988
1989
1990
1991
1992
1993
1994
1995
1996
1997
1998
1999
2000
2001
2002
2003
2004
2005
Y e a r
YJPYCNYKRYIDYMAYPHYSGYTHYVN

3
HOW TO INCORPORATE POLICY CHANGE, HOW TO INCORPORATE POLICY CHANGE, REGIONAL & GLOBAL SHOCKS IN REGIONAL & GLOBAL SHOCKS IN
TRADE/GROWTH ANALYSISTRADE/GROWTH ANALYSIS
UNIT ROOT CHARACTERISATIONUNIT ROOT CHARACTERISATION
Definition (qualitativeDefinition (qualitative--binarybinary--ternary/quantitative)ternary/quantitative)Taxonomy and Characteristics (SL & LT)Taxonomy and Characteristics (SL & LT)Econometric Implications & SupportEconometric Implications & SupportCredible Policy ImplementationCredible Policy ImplementationDo They Really Matter in Practice?Do They Really Matter in Practice?Empirical ValidationEmpirical Validation
MOTIVATION 4:MOTIVATION 4:EXISTING TOOLS AREEXISTING TOOLS ARE
INADEQUATEINADEQUATEVI.VI. General Tools General Tools ((Methodologies) to Methodologies) to
Measure ImpactMeasure Impact
11 Talkfest Talkfest ((ministerial and senior official meetingsministerial and senior official meetings))22 Graphical and Descriptive Analysis (Graphical and Descriptive Analysis (WTO,ADB,WBWTO,ADB,WB))33 Quantitative Approaches (Quantitative Approaches (CGE, Macro, PartialCGE, Macro, Partial))44 PolicyPolicy--Compliant Research (Compliant Research (commissionedcommissioned))55 ResearchResearch--Based Policy Analysis (Based Policy Analysis (independentindependent))66 Core Need:Core Need: Historical Realism and Historical Realism and
Valid Projections (Valid Projections (KydlandKydland Criterion)Criterion)
4
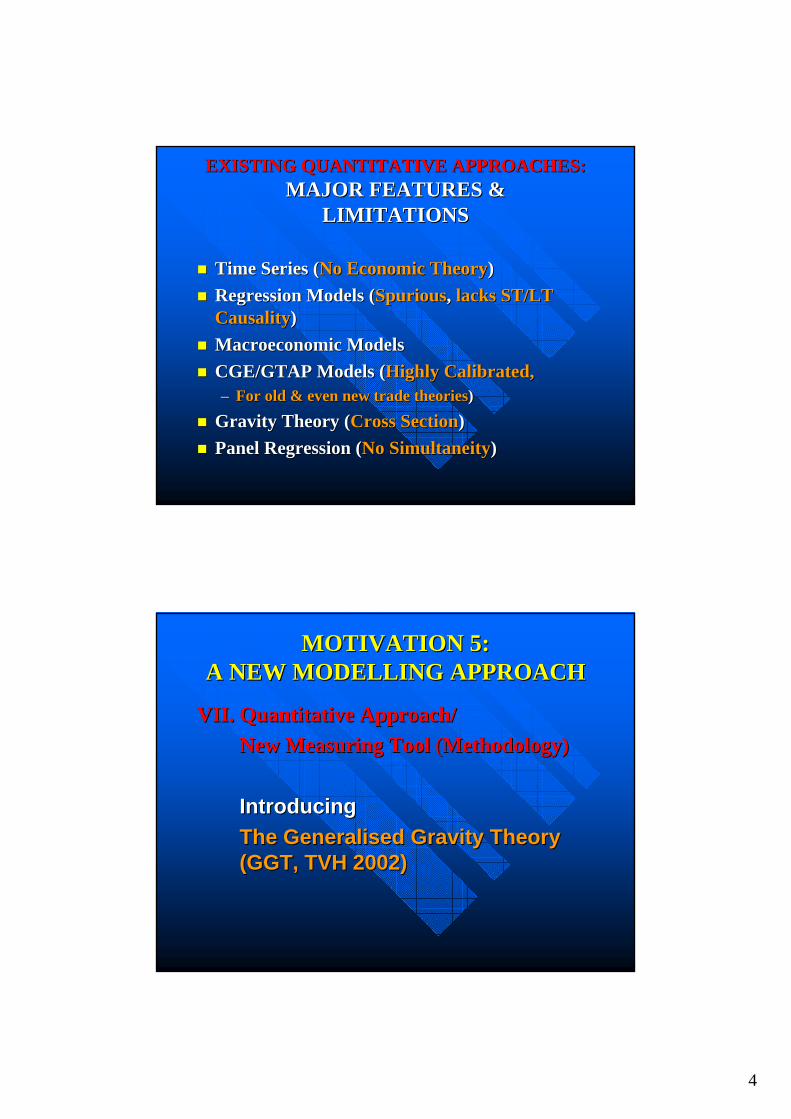
EXISTING QUANTITATIVE APPROACHES: EXISTING QUANTITATIVE APPROACHES: MAJOR FEATURES & MAJOR FEATURES &
LIMITATIONSLIMITATIONS
Time Series (Time Series (No Economic TheoryNo Economic Theory))Regression Models (Regression Models (SpuriousSpurious, , lacks ST/LT lacks ST/LT CausalityCausality))Macroeconomic ModelsMacroeconomic ModelsCGE/GTAP Models (CGE/GTAP Models (Highly Calibrated, Highly Calibrated, –– For old & even new trade theoriesFor old & even new trade theories))
Gravity Theory (Gravity Theory (Cross SectionCross Section))Panel Regression (Panel Regression (No SimultaneityNo Simultaneity))
MOTIVATION 5:MOTIVATION 5:A NEW MODELLING APPROACHA NEW MODELLING APPROACH
VII.VII. Quantitative Approach/Quantitative Approach/New Measuring Tool New Measuring Tool ((Methodology)Methodology)
IntroducingIntroducingThe Generalised Gravity Theory The Generalised Gravity Theory (GGT, TVH 2002)(GGT, TVH 2002)

5
A GGT TRADEA GGT TRADE--GROWTH GROWTH MODEL 1MODEL 1
The GGT:The GGT:FunctionFunction--Free MultiFree Multi--Equation StructureEquation Structure
–– Y = Y(T,X)Y = Y(T,X) Implicit Arbitrary FunctionImplicit Arbitrary Function–– T = T(Y,S,X,Z)T = T(Y,S,X,Z) Implicit Arbitrary FunctionImplicit Arbitrary Function
wherewhere Y=GDPY=GDPT=Trade in goods, services, FDIT=Trade in goods, services, FDIX=Other economic factorsX=Other economic factorsZ=Gravity & nonZ=Gravity & non--economic factorseconomic factorsS=Shocks, policy reforms etcS=Shocks, policy reforms etc
GGT MODELLING FEATURESGGT MODELLING FEATURES
1 1 Specifying No Specific Functional FormSpecifying No Specific Functional Form22 Macro & Micro (Disaggregated) MixtureMacro & Micro (Disaggregated) Mixture33 DataData--Consistent & NonConsistent & Non--CalibratedCalibrated44 Allowing Circular CausalityAllowing Circular Causality55 Gravity FactorsGravity Factors
66 Stochastic Structural & Policy EquationsStochastic Structural & Policy Equations77 Time Domain Time Domain

6
A GGT TRADEA GGT TRADE--GROWTH MODEL 2:GROWTH MODEL 2:Mathematical DerivationMathematical Derivation
Using Planar Taylor Series ExpansionUsing Planar Taylor Series ExpansiondYdY = (= (∂∂Y/Y/∂∂T) T) dTdT + (+ (∂∂Y/Y/∂∂X) X) dXdX + + Higher OrderHigher OrderHigher OrderdYdY//YY = = T T ((∂∂Y/Y/∂∂T) (T) (dTdT//T) / T) / YY) + ) +
XX ((∂∂Y/Y/∂∂XX) () (ddXX//X) / X) / YY))= = [([(∂∂Y/Y/YY) / () / (∂∂T/T/TT)] ()] (dTdT//TT) + ) +
[([(∂∂Y/Y/YY) / () / (∂∂X/X/XX)])] ((ddXX//XX))= E1 (= E1 (dTdT//TT) + E2 () + E2 (ddXX//XX), or), or
Y%Y% = E1 T% + E2 X% + U (stochastic)= E1 T% + E2 X% + U (stochastic). .
E1=Elasticity of Y on T, etc. And, similarly for Function of T.E1=Elasticity of Y on T, etc. And, similarly for Function of T.
ApplicationsApplications::ChinaChina--World and AustraliaWorld and Australia--China China
FTA IssuesFTA Issues
China & WTO Membership (since 2001)China & WTO Membership (since 2001)China Economic Performance (since 1980s)China Economic Performance (since 1980s)China & Its Trading PartnersChina & Its Trading PartnersCauses of China GrowthCauses of China GrowthCauses of China TradeCauses of China TradeImpact of Reform & Global Shocks on ChinaImpact of Reform & Global Shocks on ChinaAustraliaAustralia--China FTA: China FTA: Prospects and ChallengesProspects and Challenges

7
ECONOMIC AND TRADE ECONOMIC AND TRADE DATA SETSDATA SETS
FRANCE CEPII CHELEMFRANCE CEPII CHELEMUNCTADUNCTADOECDOECDWORLD BANK WORLD TABLESWORLD BANK WORLD TABLESICSEADICSEADAUSSTATSAUSSTATSDFATDFAT
FACTS AND FIGURES 1FACTS AND FIGURES 1
China's Gains from WTO Membership
0
10
20
30
40
19851987
19891991
19931995
19971999
20012003
Year
Expo
rts
and
Impo
rts/
GD
P
XY
IMY

8
DOES CHINA TRADE GAIN FROM WTO?DOES CHINA TRADE GAIN FROM WTO?SIMPLE CHOW TESTSSIMPLE CHOW TESTS
LTY= A1+A2LGDP+A3LTY(LTY= A1+A2LGDP+A3LTY(--1)+U1)+Uwhere LTY=[LOG(X+IM)/GDP]where LTY=[LOG(X+IM)/GDP]
LGDP=LOG(GDP)LGDP=LOG(GDP)
For 1986For 1986--2000 (R2000 (R--SQ=0.90)SQ=0.90)Chow=1.14Chow=1.14For 1986For 1986--2004 (R2004 (R--SQ=0.92)SQ=0.92)Chow=5.30**Chow=5.30**
FACTS AND FIGURES 2FACTS AND FIGURES 2
China Growth rate, %
0.00
5.00
10.00
15.00
Year

9
FACTS AND FIGURES 3FACTS AND FIGURES 3Chart 1: Share of China Trade/GDP with the World, 1986-2005
0
2
4
6
8
10
12
1986
1988
1990
1992
1994
1996
1998
2000
2002
2004
Y ear
TJPYTKRYTA6YTEUYTUSYTOZY
CAUSALITY ISSUES FROM CAUSALITY ISSUES FROM FACTS AND FIGURESFACTS AND FIGURES
11 Does Trade Cause Development Does Trade Cause Development andandGrowth?Growth?
22 What Causes Trade?What Causes Trade?33 What Are Major Trade Components?What Are Major Trade Components?44 Endogenous and Exogenous Causality of Endogenous and Exogenous Causality of
TradeTrade–– WTO and FTA ScopeWTO and FTA Scope–– Any Credible Empirical Support for Any Credible Empirical Support for
ACACFTA?FTA?

10
SUBSTANTIVE GGT FINDINGSSUBSTANTIVE GGT FINDINGS
China and Its Major Trading Blocs: China and Its Major Trading Blocs: ASEAN, Japan, US and EUASEAN, Japan, US and EU–– Impact of Trade, Services, FDI, Policy Change Impact of Trade, Services, FDI, Policy Change
and Global Shocks and Global Shocks on China Growthon China Growth
China and Australia (ACFTA Outcomes)China and Australia (ACFTA Outcomes)–– Impact of Trade, Services, FDI, Policy Change Impact of Trade, Services, FDI, Policy Change
and Global Shocks and Global Shocks on China/Australia on China/Australia GrowthGrowth
CHINA: CHINA: IMPACT OF TRADE ON GROWTHIMPACT OF TRADE ON GROWTH
ChinaChina--ASEANASEAN ChinaChina--JapanJapan ChinaChina--USUSVariablesVariables OLS 2SLS 2SHIOLS 2SLS 2SHI OLS 2SLSOLS 2SLS 2SHI 2SHI OLS 2SLS 2SHIOLS 2SLS 2SHI____________________________________________________________________________________________________________________________________________________________________________________ConstantConstant 10.71** 10.34** 8.78**10.71** 10.34** 8.78** 11.02** 10.97** 9.17** 11.02** 10.97** 9.17** 10.87** 10.93** 9.71**10.87** 10.93** 9.71**Openness/GDPOpenness/GDP 0.02 0.02 0.02 0.02 0.02 0.02 0.01 0.03 0.03 0.01 0.03 0.03 0.02 0.03 0.020.02 0.03 0.02Services/GDPServices/GDP 0.001 0.003 0.0020.001 0.003 0.002 0.001 0.003*0.001 0.003* 0.003* 0.003* 0.002 0.001 0.0010.002 0.001 0.001FDI/GDPFDI/GDP 0.03** 0.04** 0.03**0.03** 0.04** 0.03** 0.03** 0.03**0.03** 0.03** 0.03** 0.03** 0.03** 0.03** 0.03**0.03** 0.03** 0.03**China Turmoil 89China Turmoil 89 --6.87** 6.87** --6.56** 6.56** --5.67** 5.67** --6.97** 6.97** --6.74** 6.74** --5.64** 5.64** --7.09** 7.09** --7.19** 7.19** --6.38**6.38**Gulf War 91Gulf War 91 6.05** 5.90** 5.00**6.05** 5.90** 5.00** 5.79** 5.29**5.79** 5.29** 4.43** 4.43** 6.06** 6.15** 5.46**6.06** 6.15** 5.46**China Reform 93China Reform 93 --0.03 0.03 --0.62 0.62 --0.530.53 0.02 0.02 --0.580.58 --0.49 0.49 0.07 0.05 0.040.07 0.05 0.04Asia Crisis 97Asia Crisis 97 --1.39 1.39 --0.61 0.61 --0.52 0.52 --1.28 1.28 --0.30** 0.30** --0.25 0.25 --1.32 1.32 --1.53 1.53 --1.361.36WTO MembershipWTO Membership 0.81 0.69 0.590.81 0.69 0.59 0.81 0.64 0.530.81 0.64 0.53 0.81 0.81 0.720.81 0.81 0.72R2R2 0.92 0.89 0.94#0.92 0.89 0.94# 0.92 0.880.92 0.88 0.94# 0.94# 0.92 0.2 0.960.92 0.2 0.96FF 12.60** 4.25** 9.16** 12.60** 4.25** 9.16** 12.24** 4.41** 8.41** 12.24** 4.41** 8.41** 12.74** 8.58** 12.45**12.74** 8.58** 12.45**DWDW 2.71 2.65 0.63&2.71 2.65 0.63& 2.72 2.572.72 2.57 0.58& 0.58& 2.78 2.78 0.87&2.78 2.78 0.87&

11
CHINA:CHINA:IMPACT OF TRADE ON GROWTHIMPACT OF TRADE ON GROWTH
ChinaChina--EUEU ChinaChina--AustraliaAustralia AustraliaAustralia--ChinaChinaVariablesVariables OLS 2SLSOLS 2SLS 2SHI2SHI OLS 2SLSOLS 2SLS 2SHI2SHI OLS 2SLS 2SHIOLS 2SLS 2SHI
ConstantConstant 11.11** 11.29** 10.01** 11.16** 11.07** 9.78**11.11** 11.29** 10.01** 11.16** 11.07** 9.78** 7.43** 4.91** 4.07**7.43** 4.91** 4.07**Openness/GDPOpenness/GDP 0.02 0.03 0.03 0.02 0.03 0.03 0.02 0.030.02 0.03 0.030.03 0.11** 0.22** 0.11** 0.22**
0.18***0.18***Services/GDPServices/GDP 0.001 0.001 0.0010.001 0.001 0.001 0.002* 0.003@ 0.003@ 0.002* 0.003@ 0.003@ --003 003 --0.01* 0.01*
--0.01*0.01*FDI/GDPFDI/GDP 0.03** 0.03** 0.03**0.03** 0.03** 0.03** 0.04** 0.04**0.04** 0.04** 0.04**0.04** 0.001* 0.001** 0.001**0.001* 0.001** 0.001**Stock Market Crash 87Stock Market Crash 87 8.45** 13.45** 11.14**8.45** 13.45** 11.14**China Turmoil 89China Turmoil 89 --7.22** 7.22** --7.43** 7.43** --6.59** 6.59** --7.45** 7.45** --7.47** 7.47** --6.59**6.59** --7.11** 7.11** --10.04** 10.04** --8.31**8.31**Gulf War 91Gulf War 91 6.09** 6.27**6.09** 6.27** 5.56**5.56** 6.04** 5.81**6.04** 5.81** 5.13**5.13** --7.57** 7.57** --8.44** 8.44** --6.99**6.99**China Reform 93China Reform 93 --0.10 0.010.10 0.01 0.010.01 --0.25 0.25 --0.700.70 --0.620.62 3.89** 4.56**3.89** 4.56** 3.79**3.79**Asia Crisis 97Asia Crisis 97 --1.43 1.43 --1.77 1.77 --1.57 1.57 --0.97 0.97 --0.15 0.15 --0.140.14 --1.10 1.10 --3.14@ 3.14@
[email protected]@WTO MembershipWTO Membership 0.77 0.75 0.670.77 0.75 0.67 0.72 0.62 0.550.72 0.62 0.55RR22 0.92 0.92 0.920.92 0.96#0.96# 0.92 0.91 0.92 0.91 0.96#0.96# 0.90 0.870.90 0.87 0.940.94FF 12.81** 6.22** 12.27** 12.81** 6.22** 12.27** 13.62** 6.98**13.62** 6.98** 11.89** 11.89** 11.07**11.07** 7.887.88** **
13.2913.29****DWDW 2.75 2.72 2.75 2.72 0.84&0.84& 2.71 2.652.71 2.65 0.81&0.81& 2.21 2.40 2.21 2.40 0.99&0.99&
CHINA AND THE WORLDCHINA AND THE WORLDQUESTIONS and SUBSTANTIVE ANSWERSQUESTIONS and SUBSTANTIVE ANSWERS
11 More Trade More Trade --> Higher Growth? > Higher Growth? –– Yes (but weak) for all trading blocsYes (but weak) for all trading blocs–– Best gains from Developed Countries (Japan, US, Best gains from Developed Countries (Japan, US,
EU and Australia. Not from ASEAN)EU and Australia. Not from ASEAN)
22 More Services More Services --> Higher Growth? > Higher Growth? Yes (mild from Japan and Australia)Yes (mild from Japan and Australia)
33 More FDI More FDI --> Higher Growth? > Higher Growth? Yes (strong) for all trading blocsYes (strong) for all trading blocs

12
CHINA AND THE WORLDCHINA AND THE WORLDQUESTIONS and SUBSTATIVE ANSWERS (QUESTIONS and SUBSTATIVE ANSWERS (contdcontd))
44 Good Policy Reform 1991 Good Policy Reform 1991 --> Higher Growth? > Higher Growth? Yes (strong) all trading blocsYes (strong) all trading blocs
55 Internal Shocks Internal Shocks --> Lower Growth? > Lower Growth? Yes (strong) all trading blocsYes (strong) all trading blocs
66 Regional Crises 1997 Regional Crises 1997 --> Lower Growth? > Lower Growth? Yes (strong) all trading blocsYes (strong) all trading blocs
77 WTO Membership WTO Membership --> Higher Growth?> Higher Growth?Yes (but weak) all trading blocsYes (but weak) all trading blocs
AUSTRALIAAUSTRALIA--CHINA FTACHINA FTA
11 Who Gains More in an ACFTA?Who Gains More in an ACFTA?11 Australia more from ChinaAustralia more from China’’s Trades Trade22 China more from Services & FDIChina more from Services & FDI
22 Who Loses More in an ACFTA?Who Loses More in an ACFTA?Australia more from Australia more from 11 China Internal TurmoilChina Internal Turmoil22 ReformsReforms33 Regional Crises Regional Crises
33 Are Our Findings/Policy Recommendations Are Our Findings/Policy Recommendations Reliable?Reliable?

13
Outcomes Reliability:Outcomes Reliability:A Graphical Evaluation AnalysisA Graphical Evaluation Analysis
Reliability of Our Findings onReliability of Our Findings on
-- Trade ModellingTrade Modelling–– Growth ModellingGrowth Modelling–– Policy RecommendationsPolicy Recommendations–– Regional Strategic StudiesRegional Strategic Studies
Ex Post and Ex Ante SimulationsEx Post and Ex Ante Simulations
KydlandKydland DataData--Consistency Consistency CriterionCriterion

14
Chart 6: Modelling China-Australia Trade
-40
-30
-20
-10
0
10
20
30
40
50
19871988
19891990
19911992
19931994
19951996
19971998
19992000
20012002
20032004
Year
TOZYCCNOZTYCF
Chart 7: Modelling Australia-China Trade
-20
-10
0
10
20
30
40
50
Year
OZCNTYCOZCNTYCF

15
Chart 8: Modelling Australia Trade-to-China Growth
02468
10121416
Year
YCNC
YCNOZ2H
Chart 9: Modelling China Trade-to-Australia Growth
02468
10121416
Year
YOZC
YOZCN2H

16
ACFTA: CURRENT STATE OF PLAYACFTA: CURRENT STATE OF PLAYCHINA IMPORTS INTO AUSTRALIACHINA IMPORTS INTO AUSTRALIA
CONSUM PTION GOODS
FOOD & BEVERAGES,M AINLY FOR CONSUM PTIONHOUSEHOLD ELECTRICALITEM SNON_INDUSTRIALTRANSPORT EQUIPM ENTTEXTILES, CLOTHING &FOOTWEARTOYS, BOOKS & LEISUREGOODSCONSUM PTION GOODS NES
CAPITAL GOODS
M ACHINERY & INDUSTRIALEQUIPM ENTADP EQUIPM ENT
TELECOM M UNICATIONSEQUIPM ENTCIVIL AIRCRAFT
Consumer 24%
Inter 12%
Capital 10%
7
Textiles 6%
Process 5%
Consumer B 4%