australia dairy and products semi-annual 2014 - usda gain publications/dairy and...mondelez...
TRANSCRIPT

THIS REPORT CONTAINS ASSESSMENTS OF COMMODITY AND TRADE ISSUES MADE BY USDA STAFF AND NOT NECESSARILY STATEMENTS OF OFFICIAL U.S. GOVERNMENT POLICY
Date: GAIN Report Number:
Approved By:
Prepared By:
Report Highlights:
Australian milk production is forecast to reach 9.9 billion liters in 2014 due to above-average milk prices and increased yields. The industry is recovering from previous adverse weather conditions and cow numbers are expected to reach 1.7 million head this year. Higher domestic and foreign investment in the industry is leading to growing Australian exports of cheese and milk powder, especially to Asia. The signing of free trade agreements (FTAs) with Japan and South Korea has increased access for some dairy products, while FTA talks with China are continuing. Farm rationalization continues as higher cost producers leave the industry.
Roger Farrell, Agricultural Specialist
Hugh Maginnis, Agricultural Counselor
2014
Dairy and Products Semi-annual
Australia
AS1412
5/22/2014
Required Report - public distribution

Commodities:
Production
Australian milk production is forecast to decrease slightly from Post’s previous estimate, to 9.9 billion liters in 2014 due to above-average milk prices and increased yields. The industry is recovering from previous adverse weather conditions and cow numbers are expected to reach 1.7 million head by the end of the year. Over 2014, prices are expected to strengthen, as rainfall returns to more normal levels allowing many farms to consolidate financially. Lower irrigation water costs could also boost lucerne hay programs and increase fodder supplies to dairy farms.
The dairy industry is recovering from difficult years in 2012 and 2013 when unfavorable seasonal conditions increased water, feed and other input costs, while farmgate milk prices fell. Over these years, drought affected pasture feeding and fodder shortages occurred due to lower hay production. Since then, farm gate milk prices in southern Australia have improved by 5% in 2014 to around 50 cents a liter, reflecting the robust world price. In 2013, the average herd size in Australia was 258 cows, with an average annual milk production of 5,525 liters per cow. Around 10% of Australian dairy farms have milking herds larger than 600 cows.
Australia has a range of climactic zones used for dairy production, including a sub-tropical zone where there is little high nutrient grass, and grain supplements are necessary for feed. Tasmania is similar to New Zealand in terms of climate, with a high reliance on grass-fed dairy production due to reliable rains and better soils. Western Australia’s dairy industry is similar to that of California with dry feed dairy farming, while Victoria and Tasmania rely more on pasture feed. Overall, Victoria is the major producer with 6 billion liters of milk output, or two thirds of the national total directed mainly to the export-oriented milk manufacturing market. There are 5,000 dairy farms in Victoria, with an average herd size of around 330 head. While dairy producers in south eastern Australia are oriented towards the export market, those in Queensland and northern New South Wales (NSW) are more dependent upon the domestic market. The number of Queensland dairy farms fell from 1,500 in 2000 to below 500 in 2014 as higher cost farmers left the industry. Australian milk yields have increased as a result of improved herd genetics, technology innovations and advances in pasture management. Over the past decade up until 2014, yields rose by 10% to reach 5,400 liters a cow. On-farm productivity continues to increase through improved pasture, feed and herd management techniques. Some dairy farmers use unmanned aerial vehicles to provide precision
Dairy, Milk, Nonfat Dry
Dairy, Milk, Fluid
Dairy, Dry Whole Milk Powder
Dairy, Cheese
Dairy, Butter

maps of their soil and water resources. This can allow targeted use of inputs such as grain feed, irrigated water and fertilizers. Increased technology usually needs larger farm scale to be feasible. Murray Goulburn is the largest processor (3.2 billion liters of milk annually) while Fonterra takes in the second largest milk supply from farmers (1.8 billion liters/year), followed by National Lion (1.6 billion liters/year), Bega (0.6 million liter/year) and Warrnambool Cheese and Butter (WCB) with 0.8 million liters/year. The five major processors account for around 80% of all milk manufacturing. Production of milk powder in 2013 was 335,000 tonnes, cheese was 329,000 tonnes and butter was 117,000 tonnes. In 2014, slightly higher milk production is expected to also boost production of cheese, milk powder and related dairy products.
Consumption Dairy consumption levels in Australia increased from 104 liters per capita in 2010 to 107 liters per capita in 2013. The major consumer dairy products are drinking milk, cheese, butter and butter blends, and yogurt. Recent surveys indicate that Australians consume around 13 kg of cheese, 4 kg of butter, 7 kg of yoghurt and 107 liters of market milk per capita each year. The latter has increased slightly over recent years as supermarket competition and discounting has lowered retail milk prices. Overall cheese volumes are expected to rise slightly, although supermarket discounting of block cheese through their own brands could offset this trend. Some specialty dairy products such as yoghurt have expanded their market share as consumers focused on their health benefits. Marketing and Distribution Industry-wide marketing and dairy promotion activities are undertaken by the industry group Dairy Australia, which is funded from a dairy production levy calculated on the milk fat and protein content of milk, as well as from a contribution from the federal government. These funds are used to fund marketing services, as well as research, development and extension activities. In addition, dairy processors, distributors and retailers are involved in the marketing and distribution of dairy products. The major supermarkets in Australia have a dominant role in the marketing and distribution of many dairy products. Most milk and dairy product sales are made through large supermarket chains such as Coles and Woolworths, which in 2013 accounted for 80% of total retail sales and around half of dairy product sales. Since late 2011, the supermarkets have reduced the retail price of their plain brand fluid milk to around A$1 a liter, which has helped maintain consumption levels, but also affected the profitability of dairy producers. In 2013, Coles entered into a 10-year A$2 billion milk supply arrangement with Murray Goulburn to supply milk for the Coles store-brand private label in NSW and Victoria. Murray Goulburn is Australia’s largest dairy farmer cooperative and its 2,500 member farms process one third of national milk production. Coles also entered into a 5-year arrangement with Norco to supply Coles Brand milk in NSW, Victoria and southern Queensland from July 2014. In April 2014, Fonterra and Woolworths entered a 10-year partnership to supply Woolworths “Own Brand” milk, with a price escalation clause

tied to the retail price to give processors greater price stability. Japanese-owned Lion Dairy had previously supplied bulk milk for the Coles private label market but has now sought to focus on higher value milk products. Investment Over the last year, the dairy industry began to increase investment in plant and infrastructure to help meet growing demand for its products. In mid-2014, Murray Goulburn announced it would invest A$130 million in cheese and infant formula factories in Victoria and Tasmania, following the company’s investment of A$120 million the previous year to further expand fresh milk facilities in Melbourne and Sydney. Murray Goulburn has also proposed listing on the Australian Securities Exchange (ASX) to raise A$500 million in capital needed for rejuvenation of its manufacturing and supply chain infrastructure. The structure is designed to make Murray Goulburn less reliant on debt funding, and to encourage re-investment in the dairy industry. A number of companies have invested in UHT (Ultra High Temperature long-life milk) production, such as a A$45 million manufacturing facility in NSW which will export to China and South-East Asia. The facility has initial capacity for 100 million liters/annually of dairy milk production, with capacity of up to 300 million liters/annually in the longer term. Mondelez (previously Kraft) is investing A$66 million to increase production at its Cadbury chocolate plant in Hobart to 70,000 tonnes a year. The Australian government will also contribute A$16 million to help promote the plant as a tourist destination for Tasmania. Cadbury has a market share of around half of the Australian and New Zealand chocolate block market. Foreign investment in the Australian dairy industry has increased in recent years as demand for dairy products expands in many emerging markets. In 2014, major Victorian dairy processor WCB was acquired by the Canadian company, Saputo for A$600 million while Parmalet, a subsidiary of French dairy multinational Lactalis, acquired Western Australia’s largest dairy exporter, Harvey Fresh for $120 million. In late 2013, New Zealand dairy multinational Fonterra purchased Tasmanian yoghurt producer Tamar Valley, while a Hong Kong investor acquired Victorian milk supplier United Dairy Power for A$70 million.

Charts 1-3: Performance of the Australian Dairy Industry, 2005-2015 Source: Estimated and Forecast from ABARES and Dairy Australia .
Source: Estimated and Forecast from ABARES and Dairy Australia.
Source: Estimated and Forecast from ABARES and Dairy Australia
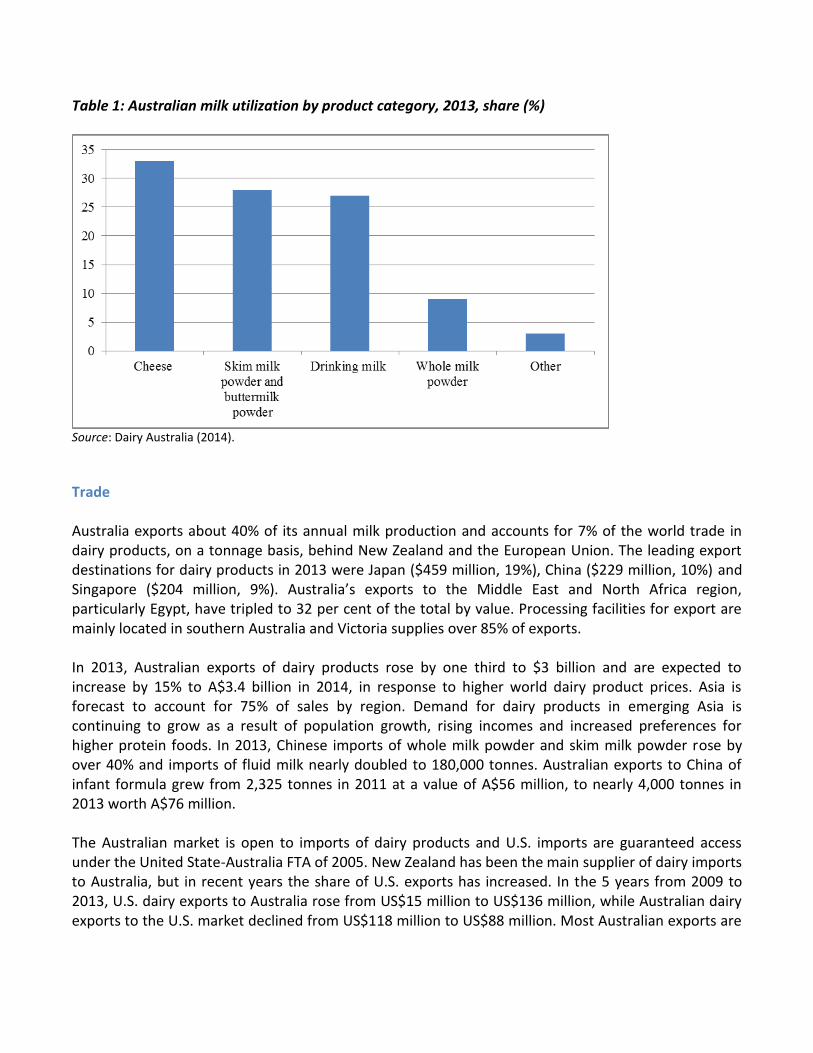
Table 1: Australian milk utilization by product category, 2013, share (%)
Source: Dairy Australia (2014).
Trade Australia exports about 40% of its annual milk production and accounts for 7% of the world trade in dairy products, on a tonnage basis, behind New Zealand and the European Union. The leading export destinations for dairy products in 2013 were Japan ($459 million, 19%), China ($229 million, 10%) and Singapore ($204 million, 9%). Australia’s exports to the Middle East and North Africa region, particularly Egypt, have tripled to 32 per cent of the total by value. Processing facilities for export are mainly located in southern Australia and Victoria supplies over 85% of exports. In 2013, Australian exports of dairy products rose by one third to $3 billion and are expected to increase by 15% to A$3.4 billion in 2014, in response to higher world dairy product prices. Asia is forecast to account for 75% of sales by region. Demand for dairy products in emerging Asia is continuing to grow as a result of population growth, rising incomes and increased preferences for higher protein foods. In 2013, Chinese imports of whole milk powder and skim milk powder rose by over 40% and imports of fluid milk nearly doubled to 180,000 tonnes. Australian exports to China of infant formula grew from 2,325 tonnes in 2011 at a value of A$56 million, to nearly 4,000 tonnes in 2013 worth A$76 million. The Australian market is open to imports of dairy products and U.S. imports are guaranteed access under the United State-Australia FTA of 2005. New Zealand has been the main supplier of dairy imports to Australia, but in recent years the share of U.S. exports has increased. In the 5 years from 2009 to 2013, U.S. dairy exports to Australia rose from US$15 million to US$136 million, while Australian dairy exports to the U.S. market declined from US$118 million to US$88 million. Most Australian exports are

bulk ingredients such as milk powders and cheese, while U.S. exports are typically packaged consumer goods such as yogurt, cheese and ice cream. Impact of recent free trade agreements Australia concluded an FTA in late 2013 with the Republic of Korea (ROK), its tenth largest dairy market. The agreement will provide additional market access for cheese, butter and infant formula. The ROK imported over 18,000 tons of dairy products from Australia during 2013 worth around US$80 million. Chart 2: Australian dairy exports, 2011-2015 (volume (‘000 tonnes, left axis) and A$ million (right axis)
Note: Skim milk powder is SKM and whole milk powder is WMP. Source: ABARES.
In April 2014, Australia signed an economic partnership agreement with Japan providing for an additional 20,000 tonnes of duty-free quota for processed cheese imports. Australian Trade Minister Robb forecast that smaller dairy sectors could expand to have annual sales of over A$100 million and concluded that “dairy is likely to be the biggest winner in China”. The additional quota which will not be subject to a current requirement that all duty-free imports must be combined with local Japanese cheese, which is likely to make the Australian imported product more competitive and recognizable to consumers. In addition, there will be a halving of the 40 per cent Japanese tariff for processed cheese over 10 years, tariff reductions on grated and powdered cheese, 20 per cent tariff reduction on blue vein cheese with no volume restrictions, tariffs on milk protein concentrates and lactose are to be eliminated. There was a halving of a 14.9% tariff for yogurt and a review trigger established for dairy concessions, if another country obtains a more advantageous agreement with China.

Prospects for the Chinese dairy market China is likely to be a long-term growth market for Australian dairy products in the future and ongoing free trade negotiations, expected to be finalized in late 2014, are likely to further open the market. Australian trade negotiators are seeking to overcome a competitive disadvantage against New Zealand (NZ) dairy products in the Chinese market as a result of the NZ-China FTA signed in 1998. As a result, China imposes a lower tariff on a range of New Zealand dairy products than for imports from Australia. One example is that China currently imposes a 5% tariff on dairy imports from New Zealand whole milk powder (WMP) compared to a 10% tariff charged on Australian WMP. Under the China-NZ FTA, the 5% tariff will be reduced to zero in 2019. In 2014, China introduced new rules requiring foreign dairy importers of infant milk formula to undergo a registration and audit process to ensure health and safety standards were complied with, as well as to verify the sources of these products given widespread mislabeling in the Chinese market because of the high price differential between domestically produced and imported formula. By mid-year, only two of the nineteen Australian companies that export infant milk formula to China had been registered under the new process. Faster Australian fresh milk exports to China became possible in April 2014 following the resolution of negotiations between Chinese quarantine authorities and the Australian dairy industry. As a result, approved companies such as dairy co-operative Norco in northern NSW, will be able to send fresh milk to Chinese consumers within seven days, compared to the previous 14-21 days required to pass quarantine protocols in China. Norco aims to export 20 million liters of fresh milk to China in 2014-15 where it will retail at A$7-9 per liter. The new quarantine clearance agreement with China could allow over 20 million liters of fresh milk to consumers in China within the first year of operation, according to industry sources. The supply chain solution incorporates quality assurance controls to ensure the fresh milk meets or exceeds China’s food health and safety standards, provides that the product is maintained at the optimal temperature during transit, and incorporates a product security system to identify and track individual units. The advent of faster airfreight milk deliveries to China could increase overall returns for the industry and especially for more geographically isolated dairy farms such as in Queensland and Western Australia.

Production supply and demand tables
Dairy, Butter 2012 2013 2014
Australia
Market Year Begin: Jan 2012
Market Year Begin: Jan 2013
Market Year Begin: Jan 2014
USDA Official
New Post
USDA Official
New Post
USDA Official
New Post
Beginning Stocks 42 42 46 46 46 46
Production 119 119 117 117 122 120
Other Imports 21 21 23 23 25 25
Total Imports 21 21 23 23 25 25
Total Supply 182 182 186 186 193 191
Other Exports 54 54 55 55 62 52
Total Exports 54 54 55 55 62 52
Domestic Consumption
82 82 85 85 86 86
Total Use 136 136 140 140 148 138
Ending Stocks 46 46 46 46 45 53
Total Distribution 182 182 186 186 193 191
1000 MT
Dairy, Cheese 2012 2013 2014
Australia
Market Year Begin: Jan 2012
Market Year Begin: Jan 2013
Market Year Begin: Jan 2014
USDA Official
New Post
USDA Official
New Post
USDA Official
New Post
Beginning Stocks 16 16 19 19 12 12
Production 330 330 329 329 360 340
Other Imports 76 76 76 76 76 76
Total Imports 76 76 76 76 76 76
Total Supply 422 422 424 424 448 428
Other Exports 163 163 180 180 190 166
Total Exports 163 163 180 180 190 166
Human Dom. Consumption
240 240 232 232 248 248
Other Use, Losses 0 0 0 0 0 0
Total Dom. Consumption
240 240 232 232 248 248
Total Use 403 403 412 412 438 414
Ending Stocks 19 19 12 12 10 14
Total Distribution 422 422 424 424 448 428
1000 MT


Dairy, Milk, Fluid 2012 2013 2014
Australia
Market Year Begin: Jan 2012
Market Year Begin: Jan 2013
Market Year Begin: Jan 2014
USDA Official
New Post
USDA Official
New Post
USDA Official
New Post
Cows In Milk 1,650 1,650 1,650 1,650 1,660 1,700
Cows Milk Production 9,811 9,811 9,570 9,400 9,880 9,900
Other Milk Production 0 0 0 0 0 0
Total Production 9,811 9,811 9,570 9,400 9,880 9,900
Other Imports 5 5 7 7 6 6
Total Imports 0 0 0 0 0 0
Total Supply 9,816 9,816 9,577 9,407 9,886 9,906
Other Exports 95 95 95 95 97 97
Total Exports 95 95 95 95 97 97
Fluid Use Dom. Consum.
2,511 2,511 2,525 2,494 2,550 2,550
Factory Use Consum. 7,210 7,210 6,957 6,818 7,239 7,259
Feed Use Dom. Consum.
0 0 0 0 0 0
Total Dom. Consumption
9,721 9,721 9,482 9,312 9,789 9,809
Total Distribution 9,816 9,816 9,577 9,407 9,886 9,906
1000 HEAD, 1000 MT
Dairy, Dry Whole Milk Powder
2012 2013 2014
Australia
Market Year Begin: Jan 2012
Market Year Begin: Jan 2013
Market Year Begin: Jan 2014
USDA Official
New Post
USDA Official
New Post
USDA Official
New Post
Beginning Stocks 38 38 18 18 24 15
Production 120 120 120 110 130 110
Other Imports 9 9 12 12 10 10
Total Imports 9 9 12 12 10 10
Total Supply 167 167 150 140 164 135
Other Exports 109 109 90 90 100 90
Total Exports 109 109 90 90 100 90
Human Dom. Consumption 40 40 36 35 40 40
Other Use, Losses 0 0 0 0 0 0
Total Dom. Consumption 40 40 36 35 40 40
Total Use 149 149 126 125 140 130
Ending Stocks 18 18 24 15 24 5

Total Distribution 167 167 150 140 164 135
1000 MT
Dairy, Milk, Nonfat Dry
2012 2013 2014
Australia
Market Year Begin: Jan 2012
Market Year Begin: Jan 2013
Market Year Begin: Jan 2014
USDA Official
New Post
USDA Official
New Post
USDA Official
New Post
Beginning Stocks 81 81 75 75 70 85
Production 235 235 225 225 235 225
Other Imports 3 3 5 5 5 5
Total Imports 3 3 5 5 5 5
Total Supply 319 319 305 305 310 315
Other Exports 168 168 155 140 165 140
Total Exports 168 168 155 140 165 140
Human Dom. Consumption
76 76 80 80 80 80
Other Use, Losses 0 0 0 0 0 0
Total Dom. Consumption
76 76 80 80 80 80
Total Use 244 244 235 220 245 220
Ending Stocks 75 75 70 85 65 95
Total Distribution 319 319 305 305 310 315
1000 MT