australia swelfare 2017
TRANSCRIPT
Australian Institute of Health and Welfare 2017. Australia’s welfare 2017. Australia’s welfare series no. 13. AUS 214. Canberra: AIHW.
Aus
tral
ia’s
wel
fare
2017
Stronger evidence, better decisions, improved health and welfare
2017Australia’s
welfare
4.1 The changing nature of work and worker wellbeing
Mark Wooden, Melbourne Institute of Applied Economic and Social Research, University of Melbourne
The Australian labour market has changed markedly over the last half century. While the overall employment rate among the ‘working-age population’ (people aged 15–64, as defined by the Australian Bureau of Statistics, or ABS), has trended upward—from around 65% as at August 1966 (ABS 2007) to 72% as at August 2016 (ABS 2016c)—the more substantial changes have been in the composition of employment.
First, females account for a much greater proportion of the workforce today than in 1966: 47% of all jobs in 2016 were held by females (ABS 2016c), compared with just 30% in 1966 (ABS 2007).
Second, and associated with the growth in female labour force participation, many more jobs today are part time: 31% of all jobs in 2016 involved part-time hours (ABS 2016c), compared with 10% in 1966 (ABS 2007).
Third, there has been a marked change in the industrial composition of jobs. Manufacturing accounted for about 25% of all jobs in 1966, while what might be loosely described as the ‘services sector’ (all industries excluding agriculture, mining, manufacturing and construction) accounted for 56% (ABS 2007). In 2016, manufacturing accounted for only around 7% of jobs, while the services sector accounted for almost 80% (ABS 2016d).
Fourth, there has been a marked growth in the proportion of high-skilled jobs, often argued to be driven by a rapid recent growth in disruptive technologies and automation (Department of Employment 2016). This, in turn, has been associated with an increased demand for a more educated and qualified workforce. As a result, around 2 in 3 (66%) people in the labour force in 2016 had a non-school qualification, with 27% having a university (Bachelor degree or higher) qualification (ABS 2016a). In contrast, in the late 1970s, only 36% of the labour force had a post-school qualification, and 6.7% had a degree (see ABS 1979 for a classification of ‘post-school qualifications’) (ABS 1979).
But are workers necessarily better off? Greater gender equality at work (at least in terms of access to jobs), more jobs that provide opportunities to use skills, and a greater proportion of jobs in industries that are inherently safer and provide more pleasant working environments would all seem to be unequivocally beneficial developments (Safe Work Australia 2002; Skills Australia 2012; WGEA 2016).

Australian Institute of Health and Welfare 2017. Australia’s welfare 2017. Australia’s welfare series no. 13. AUS 214. Canberra: AIHW.
2
Aus
tral
ia’s
wel
fare
2017
Stronger evidence, better decisions, improved health and welfare
2017Australia’s
welfare
0
20
40
60
80
100
1971 1976 1981 1986 1991 1996 2001 2006 2011 2016
Per cent
Year
Males
Zero(a)
1–34
35–44
45+
0
20
40
60
80
100
1971 1976 1981 1986 1991 1996 2001 2006 2011 2016
Per cent
Year
Females
At the same time, though, many commentators have expressed concern that the quality of many jobs has declined. The media, for example, regularly reports stories that emphasise the rise in low-wage, part-time and insecure jobs (Adonis 2016; Cleary 2016; Smith 2014). There is also evidence, both in Australia and internationally, suggesting that many of the new jobs are low quality (for example, Green et al. 2010; Kalleberg 2011; McGovern et al. 2004). In particular, it is widely believed that jobs increasingly require workers to work longer hours and/or more unsocial hours or accept non-standard employment contracts involving either part-time hours or a lack of job security (and often both).
In this article, the question of job quality in Australia is examined. In particular, the article looks at data describing recent trends in working time and the incidence of non-standard employment, and at associations with measures of worker wellbeing.
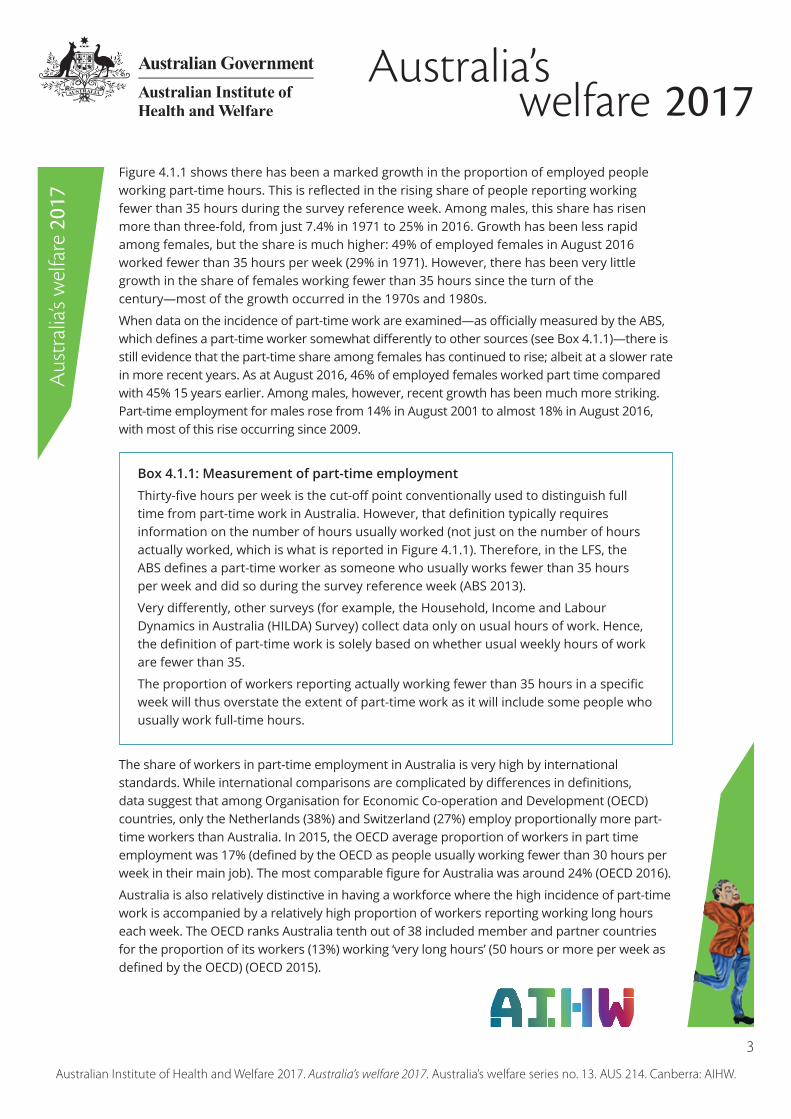
Working timeTrendsThe ABS Labour Force Survey (LFS) is the starting point for any analysis of working time trends in Australia. This survey has long included a question on the number of hours actually worked in all jobs held during the survey reference week. Figure 4.1.1 uses data for selected years from this survey to summarise the changing distribution of working hours since 1971. It shows that the notion of a standard-length work week—centred on the 8-hour day, 5-day week—has not been the norm for a long time. At the start of the period, in 1971, 58% of all employed people reported working between 35 and 44 hours a week, which is roughly equivalent to a standard work week once allowance is made for some modest level of paid overtime. By the end of the period (August 2016), this proportion was slightly less than 40% among males and less than 32% among females.
(a) Includes, for example, people on leave, on strike, and who did not work any hours during the reference week because of shift arrangements.
Sources: 1971–1986: ABS Labour force, Australia (ABS cat. no. 6202.0); 1991–2016: ABS Labour force, Australia, detailed—electronic delivery (ABS cat. no. 6291.0.55.001).
Figure 4.1.1: Composition of employment, by weekly hours actually worked and sex, 1971 to 2016
Australian Institute of Health and Welfare 2017. Australia’s welfare 2017. Australia’s welfare series no. 13. AUS 214. Canberra: AIHW.
3
Aus
tral
ia’s
wel
fare
2017
Stronger evidence, better decisions, improved health and welfare
2017Australia’s
welfareFigure 4.1.1 shows there has been a marked growth in the proportion of employed people working part-time hours. This is reflected in the rising share of people reporting working fewer than 35 hours during the survey reference week. Among males, this share has risen more than three-fold, from just 7.4% in 1971 to 25% in 2016. Growth has been less rapid among females, but the share is much higher: 49% of employed females in August 2016 worked fewer than 35 hours per week (29% in 1971). However, there has been very little growth in the share of females working fewer than 35 hours since the turn of the century—most of the growth occurred in the 1970s and 1980s.
When data on the incidence of part-time work are examined—as officially measured by the ABS, which defines a part-time worker somewhat differently to other sources (see Box 4.1.1)—there is still evidence that the part-time share among females has continued to rise; albeit at a slower rate in more recent years. As at August 2016, 46% of employed females worked part time compared with 45% 15 years earlier. Among males, however, recent growth has been much more striking. Part-time employment for males rose from 14% in August 2001 to almost 18% in August 2016, with most of this rise occurring since 2009.
Box 4.1.1: Measurement of part-time employmentThirty-five hours per week is the cut-off point conventionally used to distinguish full time from part-time work in Australia. However, that definition typically requires information on the number of hours usually worked (not just on the number of hours actually worked, which is what is reported in Figure 4.1.1). Therefore, in the LFS, the ABS defines a part-time worker as someone who usually works fewer than 35 hours per week and did so during the survey reference week (ABS 2013).
Very differently, other surveys (for example, the Household, Income and Labour Dynamics in Australia (HILDA) Survey) collect data only on usual hours of work. Hence, the definition of part-time work is solely based on whether usual weekly hours of work are fewer than 35.
The proportion of workers reporting actually working fewer than 35 hours in a specific week will thus overstate the extent of part-time work as it will include some people who usually work full-time hours.
The share of workers in part-time employment in Australia is very high by international standards. While international comparisons are complicated by differences in definitions, data suggest that among Organisation for Economic Co-operation and Development (OECD) countries, only the Netherlands (38%) and Switzerland (27%) employ proportionally more part-time workers than Australia. In 2015, the OECD average proportion of workers in part time employment was 17% (defined by the OECD as people usually working fewer than 30 hours per week in their main job). The most comparable figure for Australia was around 24% (OECD 2016).
Australia is also relatively distinctive in having a workforce where the high incidence of part-time work is accompanied by a relatively high proportion of workers reporting working long hours each week. The OECD ranks Australia tenth out of 38 included member and partner countries for the proportion of its workers (13%) working ‘very long hours’ (50 hours or more per week as defined by the OECD) (OECD 2015).

Australian Institute of Health and Welfare 2017. Australia’s welfare 2017. Australia’s welfare series no. 13. AUS 214. Canberra: AIHW.
4
Aus
tral
ia’s
wel
fare
2017
Stronger evidence, better decisions, improved health and welfare
2017Australia’s
welfareAs at August 2016, around 12% of females in paid employment reported that they worked long hours (defined here as 45 hours or more a week) during the survey reference week (Figure 4.1.1). This compares with 7.5% of females in 1971. Among employed males, the proportion working long hours is now back to where it was at the start of the period, after rising steadily for 2 decades between the mid-1970s and mid-1990s. Among females, the share of working long hours has been falling over the last 15 years or so.
In summary, the following points are noteworthy:
• The traditional 35- to 40-hour work week is less common today than 50 years ago.
• The main change in working-time patterns is growth in part-time employment.
• Much of the relative growth in part-time employment was concentrated in the 1970s and 1980s. Among males, however, growth in part-time employment has accelerated in recent years.
• During the 1980s and 1990s—and while the part-time employment share was rising—there was also a trend towards long work weeks. This trend stopped, and reversed in the 2000s.
Working-time mismatchConcerns about the relatively high incidence of both part-time and long work hours are rooted in the notion that the best jobs are those where weekly hours most closely conform to industrial norms. However, there is now strong evidence that it is not the number of hours worked that matter most for worker wellbeing, but whether, and the extent to which, those hours (often driven by employer needs and demands) are aligned with worker preferences.
Survey data consistently show that most part-time workers, and especially females, have strong preferences for part-time work. For example, 2015 HILDA Survey data show that 87% of females in part-time work prefer part-time work (that is, working fewer than 35 hours per week). Among males in part-time jobs, the proportion who prefer part-time hours, while lower than that for females, still represents a sizeable majority (74%).
Studies of job satisfaction have mostly been unable to detect sizeable negative associations with part-time work (for example, Booth & van Ours 2008; D’Addio et al. 2007; Roeters & Craig 2014). Instead, some researchers have focused on the underemployed—part-time workers working fewer hours than desired—arguing that the insufficiency of work among some part-time workers is comparable to unemployment (see Anderson & Winefield 2011). Underemployment, like unemployment, is a source of stress that has the potential to compromise health and wellbeing.
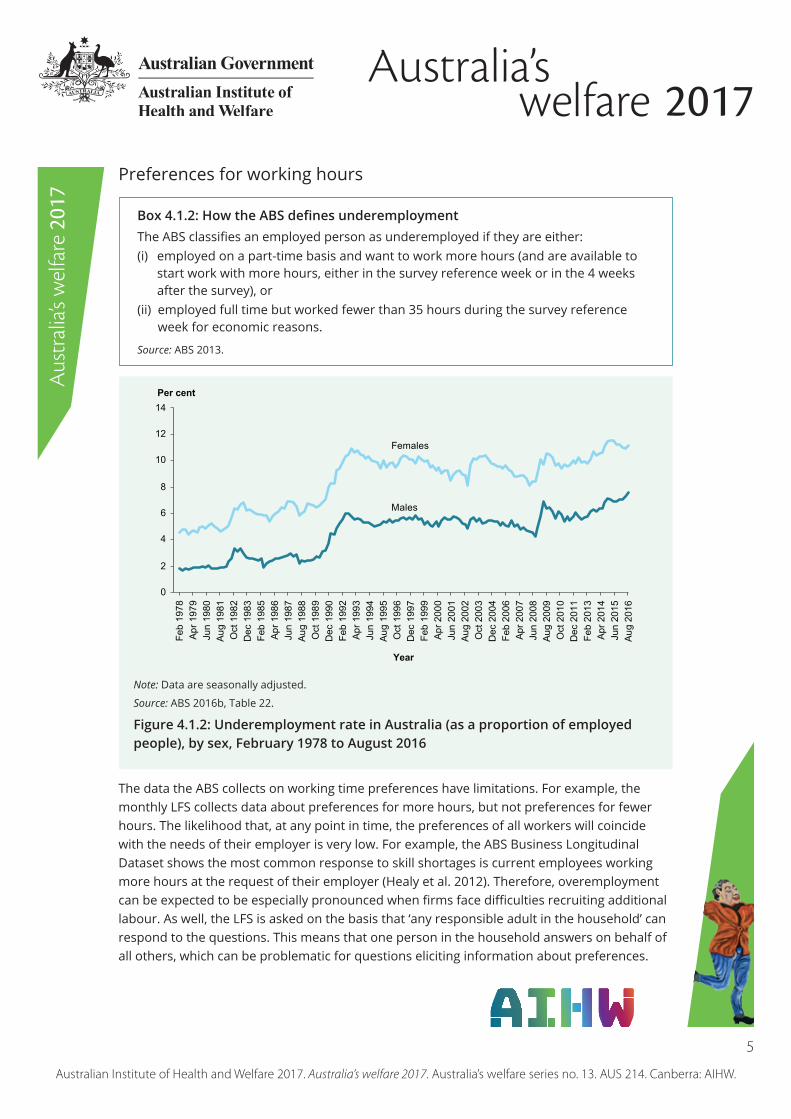
The ABS LFS estimates the number of part-time workers who would prefer more hours. These workers, along with full-time workers who worked fewer than full-time hours during the survey reference week, are defined by the ABS as underemployed workers (see Box 4.1.2). Figure 4.1.2 shows that the (seasonally adjusted) rate of underemployment has trended upward since 1978 for both males and females. It rose steeply during the recession of the early 1990s, but then did not return to pre-recession levels. Since 2011, the rate has climbed steadily upward. In 2016, the underemployment rate was at a record high, accounting for 9.3% of all employed people (or 8.7% of the labour force). This is very different from the trend in the much more well-known unemployment rate, which was 5.6% in 2016, around half its peak of 11% in 1993.
Australian Institute of Health and Welfare 2017. Australia’s welfare 2017. Australia’s welfare series no. 13. AUS 214. Canberra: AIHW.
5
Aus
tral
ia’s
wel
fare
2017
Stronger evidence, better decisions, improved health and welfare
2017Australia’s
welfare
0
2
4
6
8
10
12
14
Feb
1978
Apr 1
979
Jun
1980
Aug
1981
Oct
198
2D
ec 1
983
Feb
1985
Apr 1
986
Jun
1987
Aug
1988
Oct
198
9D
ec 1
990
Feb
1992
Apr 1
993
Jun
1994
Aug
1995
Oct
199
6D
ec 1
997
Feb
1999
Apr 2
000
Jun
2001
Aug
2002
Oct
200
3D
ec 2
004
Feb
2006
Apr 2
007
Jun
2008
Aug
2009
Oct
201
0D
ec 2
011
Feb
2013
Apr 2
014
Jun
2015
Aug
2016
Per cent
Year
Females
Males
Preferences for working hours
Box 4.1.2: How the ABS defines underemploymentThe ABS classifies an employed person as underemployed if they are either:(i) employed on a part-time basis and want to work more hours (and are available to
start work with more hours, either in the survey reference week or in the 4 weeks after the survey), or
(ii) employed full time but worked fewer than 35 hours during the survey reference week for economic reasons.
Source: ABS 2013.
Note: Data are seasonally adjusted.
Source: ABS 2016b, Table 22.
Figure 4.1.2: Underemployment rate in Australia (as a proportion of employed people), by sex, February 1978 to August 2016
The data the ABS collects on working time preferences have limitations. For example, the monthly LFS collects data about preferences for more hours, but not preferences for fewer hours. The likelihood that, at any point in time, the preferences of all workers will coincide with the needs of their employer is very low. For example, the ABS Business Longitudinal Dataset shows the most common response to skill shortages is current employees working more hours at the request of their employer (Healy et al. 2012). Therefore, overemployment can be expected to be especially pronounced when firms face difficulties recruiting additional labour. As well, the LFS is asked on the basis that ‘any responsible adult in the household’ can respond to the questions. This means that one person in the household answers on behalf of all others, which can be problematic for questions eliciting information about preferences.

Australian Institute of Health and Welfare 2017. Australia’s welfare 2017. Australia’s welfare series no. 13. AUS 214. Canberra: AIHW.
6
Aus
tral
ia’s
wel
fare
2017
Stronger evidence, better decisions, improved health and welfare
2017Australia’s
welfare
0
5
10
15
20
25
30
35
2001 2002 2003 2004 2005 2006 2007 2008 2009 2010 2011 2012 2013 2014 2015
Per cent
Year
Males—Overemployed
Males—Underemployed
Females—Overemployed
Females—Underemployed
The HILDA Survey is an alternative source of data on working-time mismatch. The annual household panel survey began in 2001. Each year, employed respondents are asked to indicate:
• how many hours they usually work each week, including any paid or unpaid overtime
• whether they would prefer to work fewer, more, or about the same hours as currently (while taking into account how any change would affect income)
• if more or fewer preferred hours are nominated, how many.
Responses to this set of questions provides measures of the incidence of both underemployment and overemployment (that is, employed people who prefer to work fewer hours each week while taking into account any effect on their income), as well as the extent of those mismatches.
Underemployment and overemploymentData from the HILDA Survey describing trends in the incidence of both underemployment and overemployment are presented in Figure 4.1.3. The figure also shows that there has been a general rise in the level of underemployment in recent years; these levels are much greater than suggested in Figure 4.1.2. This is due, in part, to full-time workers who prefer more hours being included among the underemployed in these data, and because workers have not had to be available to work the additional hours to be classified as underemployed. (The HILDA Survey started collecting data on ‘availability to work additional hours’ only in 2010.) Even if underemployment had been restricted to people who usually work part time but preferred more hours (and who were available to work those additional hours), the estimated rate of underemployment in 2015 would have been 11%. This is still 2 percentage points higher than the rate derived from the ABS data for this period.
Source: Wooden et al. 2016.
Figure 4.1.3: Underemployed and overemployed workers (as a proportion of employed people), by sex, 2001 to 2015

Australian Institute of Health and Welfare 2017. Australia’s welfare 2017. Australia’s welfare series no. 13. AUS 214. Canberra: AIHW.
7
Aus
tral
ia’s
wel
fare
2017
Stronger evidence, better decisions, improved health and welfare
2017Australia’s
welfareFigure 4.1.3 also shows that, historically, there have been many more overemployed workers (that is, people who would prefer to work fewer hours) than underemployed workers. At the same time, the incidence of overemployment has been in decline over the last 15 years. Today, the gap between the underemployment and overemployment shares is much smaller than it was at the start of the century.
The combined result of these different trends—rising underemployment but falling overemployment—is that the overall level of mismatch has fallen since 2001. In 2001, around 46% of males and 44% of females workers reported preferred hours that were different from usual hours. In 2015, the comparable proportions were 39% and 40%.
The data also show evidence of a clear time divide, with many part-time workers reporting that they work too little and many full-time workers reporting they work too much (Wooden et al. 2016). Also, the patterns in mismatch are highly gendered: females, who are much more likely to be working part time, are also much more likely to prefer part-time hours; while males, who are more likely to work long hours, are also more likely to prefer long hours.
The numbers presented in both figures 4.1.2 and 4.1.3 are based on a count of heads. As such, they are not necessarily a good guide to the overall level of mismatch. That requires extra information on the extent of mismatch (that is, the size of the difference between preferred and usual hours of work). As noted earlier, this information is collected in the HILDA Survey, with the data indicating that, for most workers reporting mismatch, the extent of mismatch is considerable. For example, in the most recent survey wave (2015), the mean level of mismatch was 13.4 hours per week among males and 12.1 hours per week among females, with mean hours (the difference between hours worked and desired hours) of overemployment slightly higher (by about 1 hour) than mean hours of underemployment. These levels have changed very little over time.
Working time and worker wellbeingSo, does working time—more specifically, working hours that are not in line with worker preferences—affect worker wellbeing? Associations between three indicators of worker wellbeing and usual weekly hours worked, cross-classified by working-time mismatch, were analysed using the HILDA survey (Table 4.1.1).
The three indicators of wellbeing used were:
1. job satisfaction: records responses, on a 0 to 10 scale, to the question: ‘All things considered, how satisfied are you with your job?’
2. life satisfaction: records responses, again on a 0 to 10 scale, to the question: ‘All things considered, how satisfied are you with your life?’
3. mental health: measured with the Mental Health Inventory, a measure that involves 5 items assessing the frequency of symptoms of anxiety and mood disturbance over a 4 week period. Scores on each item are summed and then transformed to a range from 0 to 100.

Australian Institute of Health and Welfare 2017. Australia’s welfare 2017. Australia’s welfare series no. 13. AUS 214. Canberra: AIHW.
8
Aus
tral
ia’s
wel
fare
2017
Stronger evidence, better decisions, improved health and welfare
2017Australia’s
welfareTable 4.1.1: Indicators of worker wellbeing (mean scores), by usual weekly hours worked and working-time mismatch, 2001 to 2015 (pooled)
Hours usually worked per week Well-matched Underemployed Overemployed
Job satisfaction (0–10)≤34 8.1 7.3 7.3
35–40 7.8 7.4 7.1
41–49 7.9 7.7 7.1
50+ 8.0 7.5 7.2
Total 7.9 7.3 7.2Life satisfaction (0–10)
≤34 8.1 7.7 7.8
35–40 7.9 7.7 7.7
41–49 8.0 7.8 7.7
50+ 8.0 7.5 7.6
Total 8.0 7.7 7.7Mental health (0–100)
≤34 76.0 71.7 73.7
35–40 76.3 73.2 73.8
41–49 77.4 75.1 74.7
50+ 78.4 73.0 74.7
Total 76.6 72.2 74.3
Note: Observations are drawn from the first 15 waves of the HILDA Survey and pooled, with each observation weighted by the relevant cross section weight.
Source: Wooden et al. 2016.
The data presented in Table 4.1.1 suggest four main conclusions.
• First, worker wellbeing does not vary much with the length of the usual work week. Consider, for example, job satisfaction levels among the group of workers who report that their usual work hours are consistent with preferences (the well-matched). The mean job satisfaction score within this group was 7.9, varying from 7.8 for people working a standard 35–40 work week to 8.1 for part-time workers and 8.0 for people working long work weeks (50 hours or more).
• Second, regardless of the number of hours worked, both underemployed and overemployed workers report lower levels of satisfaction and mental health than well matched workers. In the case of job satisfaction, these differences are quite large, with mean scores of 7.2 and 7.3 for the overemployed and underemployed, respectively, compared with 7.9 for workers who are well matched.

Australian Institute of Health and Welfare 2017. Australia’s welfare 2017. Australia’s welfare series no. 13. AUS 214. Canberra: AIHW.
9
Aus
tral
ia’s
wel
fare
2017
Stronger evidence, better decisions, improved health and welfare
2017Australia’s
welfare• Third, these differences are most marked with respect to job satisfaction. The differences
are smaller when examining the other two wellbeing measures, but nevertheless remain statistically significant (at a 95% confidence level). These smaller differentials for life satisfaction and mental health are to be expected, and reflect the fact that broader measures of wellbeing will depend much more on factors outside work.
• Fourth, these lower levels of wellbeing do not differ much between the underemployed and the overemployed.
In summary, it is not the number of hours worked that matters for worker wellbeing, but whether those hours accord with worker preferences. Further, other more extensive and statistically sophisticated analyses of these data have found that the conclusions reported here are robust when controlling for individual characteristics (for example, Otterbach et al. 2016; Wooden et al. 2009).
Note that very little has been said here about the forces influencing either worker or employer preferences for working hours. This lies largely beyond the scope of this article. It should not be assumed, though, that the factors driving underemployment will be the same as those driving overemployment. Indeed, there may well be very different, if not opposing, forces at work (Reynolds & Aletraris 2006).
Job security and precarious employmentAnother often expressed view is that jobs in Australia today are more insecure than at any other time in Australia’s recent (post-World War II) history, and that growth in more precarious non-standard forms of employment (such as casual work, fixed-term contracts, labour hire, and as self-employed contractors) is the major reason for this rise in insecurity (for example, see ACTU 2011). This has important consequences for worker wellbeing, with job insecurity being a source of stress and hence a negative influence on health outcomes (Benach et al. 2014). The potential adverse consequences do not just end with health consequences, however. The greater financial insecurity associated with more insecure forms of work can, for example, also affect the ability of workers to obtain loans or obtain accommodation in the rental market (Independent Inquiry into Insecure Work 2012).
Incidence of, and trends in, non-standard employmentAvailable data confirm that the incidence of non-standard forms of employment (especially casual employment) is very high in Australia. Still, there is relatively little evidence of significant growth in the share of total employment accounted for by these non-standard jobs over the last 2 decades.
For example, data collected by the ABS on the proportion of employees without either paid annual leave entitlements or paid sick leave entitlements (typically synonymous with casual employment) suggest that most of the growth in the casual employment share occurred before the late 1990s (see Figure 4.1.4 for the trend in this share between 1984 and 2016). The proportion of female employees without paid leave entitlements peaked in 1996, at about 31%, but declined to 27% by 2016. Among male employees, there has been no obvious trend decline, with the proportion reporting no paid leave entitlements fluctuating around 20–21% for most of the period since 2000. However, in 2016, there was a noticeable jump in casual employment levels among male workers (to 23%).

Australian Institute of Health and Welfare 2017. Australia’s welfare 2017. Australia’s welfare series no. 13. AUS 214. Canberra: AIHW.
10
Aus
tral
ia’s
wel
fare
2017
Stronger evidence, better decisions, improved health and welfare
2017Australia’s
welfare
0
5
10
15
20
25
30
35
1984 1986 1988 1990 1992 1994 1996 1998 2000 2002 2004 2006 2008 2010 2012 2014 2016
Per cent
Year
Females
Males
Note: All figures are for the month of August. Figures for 1984 to 1991 include employee managers of incorporated enterprises, and are therefore not directly comparable with figures for other years.
Sources: 1984–1988: Dawkins & Norris 1990; 1988–1992: ABS Employment Benefits, Australia (ABS cat. nos 6334.0 and 6310.0); 1993, 1994 and 1997: ABS Weekly Earnings of Employees (Distribution), Australia (ABS cat. no 6310.0); 1995: ABS 1995; 1996: ABS 1996; 1998–2013: ABS Employee Earnings, Benefits and Trade Union Membership, Australia (ABS cat. no 6310.0); 2014–2016: ABS Labour Force, Australia, Detailed, Quarterly (ABS cat. no 6291.0.55.003).
Figure 4.1.4: Employees without paid leave entitlements (proportion of all employees) by sex, 1984 to 2016
Similarly, there is little evidence that other forms of non-standard employment have been growing relative to more traditional forms of employment—that is, permanent wage and salary earner jobs—in recent years. For example, data collected in the HILDA Survey allow the sorting of employees into one of three main groups based on their employment contract in their main job: fixed-term contract, casual, or permanent/ongoing. Adding the self employed gives the total employed population.
Figure 4.1.5 shows how the composition of the employed workforce by contract type/employment status has changed over the last 15 years. In 2015, permanent employees accounted for 57% of all employed people—3.1 percentage points higher than in 2001. Virtually all this growth has been offset by a decline in the self-employment share, which has been steadily declining throughout this period; ABS data suggest the decline in the self employment share began in the early 1990s (see Atalay et al. 2014). In contrast, the casual employment share has been fairly stable since 2001, at around 20% of the employed workforce, while the share of workers on fixed-term contracts has increased by only 1.2 percentage points (from 7.2% to 8.4%).

Australian Institute of Health and Welfare 2017. Australia’s welfare 2017. Australia’s welfare series no. 13. AUS 214. Canberra: AIHW.
11
Aus
tral
ia’s
wel
fare
2017
Stronger evidence, better decisions, improved health and welfare
2017Australia’s
welfare
0
10
20
30
40
50
60
70
80
90
100
2001 2002 2003 2004 2005 2006 2007 2008 2009 2010 2011 2012 2013 2014 2015
Year
Self-employedOther employeeFixed-termCasualPermanent
Per cent
Source: Wooden et al. 2016.
Note: ‘Other’ employees includes people who could not be categorised elsewhere; this incorporates some apprentices, persons working on probation and some employees working on a commission basis.
Figure 4.1.5: Composition of employment, 2001 to 2015
Almost 1 in 3 employees in Australia have non-standard forms of employment, with casual and fixed-term contract employees combined accounting for 28% of the employed workforce. However, this level is nothing new, with most (if not all) of the growth in the share of non-standard jobs occurring before the turn of the century.
Non-standard employment, job insecurity and worker wellbeingHILDA Survey data show that non-standard forms of employment (that is, casual employment and fixed-term contract employment) are associated with relatively higher levels of job insecurity. This can be seen in Table 4.1.2, where employment status (and whether working full-time or part-time hours) is cross-classified by a measure of job insecurity—the expected probability of job loss during the next 12 months. The mean probability of job loss among full-time casual employees is almost 20% among males, and more than 15% among females. The comparable proportions among full-time permanent employees are about half this (10% and 8%, respectively). Rates of perceived job loss are also relatively high among fixed-term contract workers. Among females, fixed-term contract jobs are associated with the highest probabilities of job loss. However, there is little evidence of part-time jobs being more insecure than full-time jobs—the mean perceived probability of job loss was noticeably lower among part-time casual employees than among their full-time equivalents.

Australian Institute of Health and Welfare 2017. Australia’s welfare 2017. Australia’s welfare series no. 13. AUS 214. Canberra: AIHW.
12
Aus
tral
ia’s
wel
fare
2017
Stronger evidence, better decisions, improved health and welfare
2017Australia’s
welfareTable 4.1.2: Probability of job loss, employed people, by employment type and full-time/part-time status and sex, 2001 to 2015 (pooled)
Employment status
Mean probability of job loss (%)
Probability of job loss ≥50%
Males Females Males Females
Full-time permanent 9.9 7.8 8.9 7.4
Part-time permanent 10.5 7.1 10.1 7.0
Full-time casual 19.8 15.5 24.0 19.2
Part-time casual 13.1 11.9 13.0 12.8
Full-time fixed term 16.0 17.8 16.3 19.8
Part-time fixed term 19.5 17.8 20.8 22.4
Note: The probability of job loss is derived from answers to the question: ‘What do you think is the per cent chance that you will lose your job during the next 12 months? (that is, get retrenched or fired or not have your contract renewed.)’. Observations are drawn from the first 15 waves of the HILDA Survey and pooled, with each observation weighted by the relevant cross-section weight.
Source: Wooden et al. 2016.
Except for satisfaction with job security, differences in wellbeing across the different employment types are mostly very small (Table 4.1.3), with no differences for overall life satisfaction. Job satisfaction levels, on the other hand, are slightly lower among males in casual jobs than males in permanent jobs (but this difference is quite small, at 7.4 and 7.6, respectively). More sophisticated statistical analysis of the HILDA Survey data (covering the first 10 survey waves) that controls for other personal characteristics suggests that the difference is greater—perhaps twice as large (Buddelmeyer et al. 2015). This analysis, however, was unable to detect any significant differences in job satisfaction between males in fixed-term contract jobs and males who were permanent employees, nor was there any evidence that the job satisfaction of female workers varies with contract type.

Australian Institute of Health and Welfare 2017. Australia’s welfare 2017. Australia’s welfare series no. 13. AUS 214. Canberra: AIHW.
13
Aus
tral
ia’s
wel
fare
2017
Stronger evidence, better decisions, improved health and welfare
2017Australia’s
welfareTable 4.1.3: Indicators of worker wellbeing (mean scores), employed people, by employment type and sex, 2001 to 2015 (pooled)
Employment type and sex
Satisfaction with job
security (0–10)
Overall job satisfaction
(0–10)
Life satisfaction
(0–10)
Mental health (0–100)
Males
Permanent employee 8.1 7.6 7.9 76.7
Casual employee 7.3 7.4 7.9 74.7
Fixed-term contract employee 7.5 7.6 7.9 76.6
Self-employed 7.4 7.7 7.8 77.3
Females
Permanent employee 8.3 7.7 7.9 74.7
Casual employee 7.6 7.6 7.9 72.2
Fixed-term contract employee 7.0 7.6 7.8 73.3
Self-employed 7.7 8.0 8.0 75.9
All people
Permanent employee 8.2 7.6 7.9 75.8
Casual employee 7.5 7.5 7.9 73.2
Fixed-term contract employee 7.3 7.6 7.9 75.0
Self-employed 7.5 7.8 7.9 76.8
Note: Observations are drawn from the first 15 waves of the HILDA Survey and pooled, with each observation weighted by the relevant cross section weight.
Source: Wooden et al. 2016.
Both male and female casual employees report lower mental health levels than permanent employees, but the difference is again small. Further, it is not obvious in which direction the causation runs—it may be that mental health issues make it difficult for workers to both obtain and retain permanent work. Other research (also involving the HILDA Survey data) controls for reverse causation and is unable to find any evidence that casual or fixed-term contract employment is harmful for mental health (Richardson et al. 2012).
Recent research undertaken in Europe (Jahn 2015; Origo & Pagani 2009) suggests that it is not employment type that is so critical for worker wellbeing, but perceived job insecurity, which, in turn, may be only imperfectly correlated with employment type. Very few so called permanent jobs are in fact permanent. While rates of job loss are considerably lower for permanent employees than for other types of worker, when permanent employees do lose their job, the cost to those individuals, both economically and psychologically, may be considerable.
Australian Institute of Health and Welfare 2017. Australia’s welfare 2017. Australia’s welfare series no. 13. AUS 214. Canberra: AIHW.
14
Aus
tral
ia’s
wel
fare
2017
Stronger evidence, better decisions, improved health and welfare
2017Australia’s
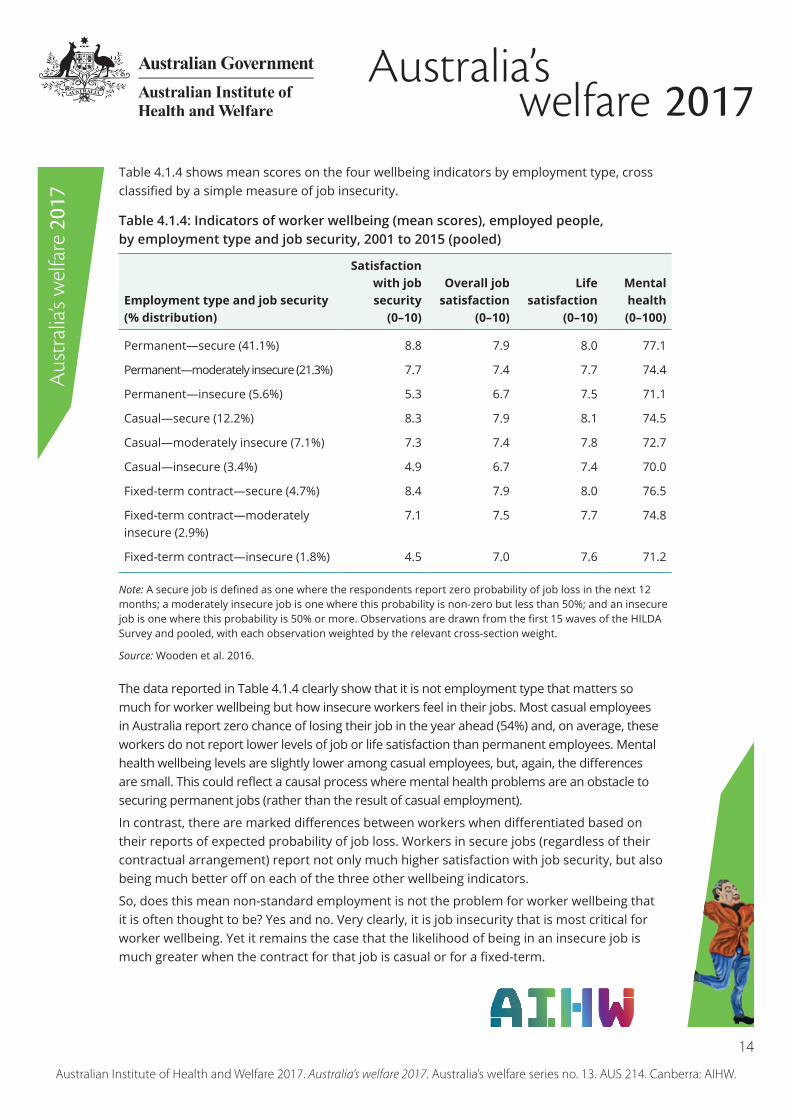
welfareTable 4.1.4 shows mean scores on the four wellbeing indicators by employment type, cross classified by a simple measure of job insecurity.
Table 4.1.4: Indicators of worker wellbeing (mean scores), employed people, by employment type and job security, 2001 to 2015 (pooled)
Employment type and job security (% distribution)
Satisfaction with job security
(0–10)
Overall job satisfaction
(0–10)
Life satisfaction
(0–10)
Mental health (0–100)
Permanent—secure (41.1%) 8.8 7.9 8.0 77.1
Permanent—moderately insecure (21.3%) 7.7 7.4 7.7 74.4
Permanent—insecure (5.6%) 5.3 6.7 7.5 71.1
Casual—secure (12.2%) 8.3 7.9 8.1 74.5
Casual—moderately insecure (7.1%) 7.3 7.4 7.8 72.7
Casual—insecure (3.4%) 4.9 6.7 7.4 70.0
Fixed-term contract—secure (4.7%) 8.4 7.9 8.0 76.5
Fixed-term contract—moderately insecure (2.9%)
7.1 7.5 7.7 74.8
Fixed-term contract—insecure (1.8%) 4.5 7.0 7.6 71.2
Note: A secure job is defined as one where the respondents report zero probability of job loss in the next 12 months; a moderately insecure job is one where this probability is non-zero but less than 50%; and an insecure job is one where this probability is 50% or more. Observations are drawn from the first 15 waves of the HILDA Survey and pooled, with each observation weighted by the relevant cross-section weight.
Source: Wooden et al. 2016.
The data reported in Table 4.1.4 clearly show that it is not employment type that matters so much for worker wellbeing but how insecure workers feel in their jobs. Most casual employees in Australia report zero chance of losing their job in the year ahead (54%) and, on average, these workers do not report lower levels of job or life satisfaction than permanent employees. Mental health wellbeing levels are slightly lower among casual employees, but, again, the differences are small. This could reflect a causal process where mental health problems are an obstacle to securing permanent jobs (rather than the result of casual employment).
In contrast, there are marked differences between workers when differentiated based on their reports of expected probability of job loss. Workers in secure jobs (regardless of their contractual arrangement) report not only much higher satisfaction with job security, but also being much better off on each of the three other wellbeing indicators.
So, does this mean non-standard employment is not the problem for worker wellbeing that it is often thought to be? Yes and no. Very clearly, it is job insecurity that is most critical for worker wellbeing. Yet it remains the case that the likelihood of being in an insecure job is much greater when the contract for that job is casual or for a fixed-term.

Australian Institute of Health and Welfare 2017. Australia’s welfare 2017. Australia’s welfare series no. 13. AUS 214. Canberra: AIHW.
15
Aus
tral
ia’s
wel
fare
2017
Stronger evidence, better decisions, improved health and welfare
2017Australia’s
welfareWhat is missing from the picture?When examining working time, the focus has been on the number of hours worked, but equally important may be when those hours are worked (for example, the time of day or week). Data to inform this question may be available from the Australian Time Use Survey (ATUS), but information is dated—the ATUS was last conducted in 2006.
Where do I go for more information?For a broader review of recent trends in the Australian labour market, see Wilkins and Wooden (2014).
More information about the HILDA Survey, including how to obtain the unit record data file, is available at http://melbourneinstitute.unimelb.edu.au/hilda.
For more detailed analyses of the relationship between working-time mismatch and measures of worker wellbeing that use HILDA Survey data, see Wooden et al. (2009) and Otterbach et al. (2016).
For a more detailed analysis of the relationship between non-standard employment and job satisfaction that uses HILDA Survey data, see Buddelmeyer et al. (2015).
AcknowledgmentThis article uses confidentialised unit record file data from the HILDA Survey (and more specifically from Beta Release 15). The HILDA Survey Project was initiated and is funded by the Department of Social Services, and is managed by the Melbourne Institute of Applied Economic and Social Research. The findings and views reported in this paper, however, are those of the author and should not be attributed to either the Department of Social Security or the Melbourne Institute.
The author gratefully acknowledges the research assistance of Markus Hahn.
ReferencesABS (Australian Bureau of Statistics) 1979. The labour force, educational attainment, Australia, February 1979. ABS cat. no. 6235.0. Canberra: ABS.ABS 1995. The labour force, Australia, December 1995. ABS cat. no. 6203.0. Canberra: ABS.ABS 1996. Trade union members, Australia, August 1995. ABS cat. no. 6325.0. Canberra: ABS.ABS 2007. Labour force historical time series, Australia, 1966 to 1984. ABS cat. no. 6204.0.55.001. Canberra: ABS.ABS 2013. Labour statistics: concepts, sources and methods. ABS cat. no. 6102.0.55.001. Canberra: ABS.ABS 2016a. Education and work, May 2016. ABS cat. no. 6227.0. Canberra: ABS.ABS 2016b. Labour force, Australia, August 2016. ABS cat. no. 6202.0. Canberra: ABS.ABS 2016c. Labour force, Australia, detailed—electronic delivery, August 2016. ABS cat. no. 6291.0.55.001. Canberra: ABS.ABS 2016d. Labour force, Australia, detailed, quarterly, August 2016. ABS cat. no. 6291.0.55.003. Canberra: ABS.ACTU (Australian Council of Trade Unions) 2011. Insecure work, anxious lives: the growing crisis of insecure work in Australia. ACTU: Melbourne.Addonis J 2016. Job insecurity: the new normal? The Sydney Morning Herald. 24 June.Anderson S & Winefield AH 2011. The impact of underemployment on psychological health, physical health, and work attitudes. In: Maynard DC and Feldman DC (eds). Underemployment: psychological, economic, and social challenges. Springer: New York. 165–86.Atalay K, Kim W-Y & Whelan S 2014. The decline of the self-employment rate in Australia. Australian Economic Review 47(4): 472–89.
Australian Institute of Health and Welfare 2017. Australia’s welfare 2017. Australia’s welfare series no. 13. AUS 214. Canberra: AIHW.
16
Aus
tral
ia’s
wel
fare
2017
Stronger evidence, better decisions, improved health and welfare
2017Australia’s
welfareBenach J, Vives A, Amable M, Vanroelen C, Tarafa G & Muntaner C 2014. Precarious employment: understanding an emerging social determinant of health. Annual Review of Public Health 35:229–53.Booth AL & Van Ours JC 2008. Job satisfaction and family happiness: the part-time work puzzle. The Economic Journal 118(526):F77–99.Buddelmeyer H, McVicar D & Wooden M 2015. Non-standard ‘contingent’ employment and job satisfaction: a panel data analysis. Industrial Relations: A Journal of Economy and Society 54(2):256–75.Cleary P 2016. Low-wage, part-time jobs the new normal in Australia. The Australian. 20 August.D’Addio AC, Eriksson T & Frijters P 2007. An analysis of the determinants of job satisfaction when individuals’ baseline satisfaction levels may differ. Applied Economics 39(19):2413–23.Dawkins P & Norris K 1990. Casual employment in Australia. Australian Bulletin of Labour 16(3):156–73.Department of Employment 2016. 2016–17 Department of Employment Corporate Plan. Canberra: Department of Employment.Green C, Kler P & Leeves G 2010. Flexible contract workers in inferior jobs: reappraising the evidence. British Journal of Industrial Relations 48(3):605–29.Healy, J, Mavromaras, K & Sloane, PJ 2012. Skill shortages: prevalence, causes, remedies and consequences for Australian businesses. Adelaide: National Centre for Vocational Education Research.Independent Inquiry into Insecure Work 2012. Lives on hold: unlocking the potential of Australia’s workforce. Melbourne: ACTU.Jahn E 2015. Don’t worry be flexible? Job satisfaction among flexible workers. Australian Journal of Labour Economics 18(2):147–68.Kalleberg A 2011. Good jobs, bad jobs: the rise of polarised and precarious employment systems in the United States, 1970s to 2000s. New York: Russell Sage Foundation.McGovern P, Smeaton D & Hill S 2004. Bad jobs in Britain: nonstandard employment and job quality. Work and Occupations 31(2):225–49.OECD (Organisation for Economic Co-operation and Development) 2015. Work–life balance. Paris: OECD Publishing. Viewed 5 January 2017, <http://www.oecdbetterlifeindex.org/topics/work-life-balance/>.OECD 2016. OECD employment outlook 2016. Paris: OECD Publishing.Origo F & Pagani L 2009. Flexicurity and job satisfaction in Europe: the importance of perceived and actual job stability for well-being at work. Labour Economics 16:547–59.Otterbach S, Wooden M & Fok YK 2016. Working-time mismatch and mental health. Melbourne Institute working paper no. 11/16. Melbourne: Melbourne Institute of Applied Economic and Social Research, University of Melbourne.Reynolds J & Aletraris L 2006. Pursuing preferences: the creation and resolution of hour mismatches in Australia. American Sociological Review 71(4):618–38.Richardson S, Lester L & Zhang G 2012. Are casual and contract terms of employment hazardous for mental health in Australia? Journal of Industrial Relations 54(5):557–78.Roeters A & Craig L 2014. Part-time work, women’s work–life conflict, and job satisfaction: a cross-national comparison of Australia, the Netherlands, Germany, Sweden, and the United Kingdom. International Journal of Comparative Sociology 55(3):185–203.Safe Work Australia 2002. National OHS Strategy 2002–2012. Canberra: Department of Finance and Administration.Skills Australia 2012. Better use of skills, better outcomes: Australian case studies. Canberra: Department of Education, Employment and Workplace Relations.Smith F 2014. Workforce casualisation: the discussion we have been avoiding. Financial Review. 22 October.WGEA (Workplace Gender Equality Agency) 2016. The business case for gender equality. Canberra: WGEA. Viewed 10 March 2017, <https://www.wgea.gov.au/sites/default/files/wgea-business-case-for-gender-equality.pdf>.Wilkins R and Wooden M 2014. Two decades of change: the Australian labour market, 1993–2014. Australian Economic Review 47(4):417–31.Wooden M, Summerfield M, Watson N, Wilkins R, Freidin S & Li N et al. 2016. Household, Income and Labour Dynamics in Australia (HILDA) Survey—beta release 15.0. Unit-record data file produced for Department of Families, Housing, Community Services and Indigenous Affairs. Melbourne: Melbourne Institute of Applied Economic and Social Research, University of Melbourne.Wooden M, Warren D & Drago R 2009. Working-time mismatch and subjective well-being. British Journal of Industrial Relations 47(1):147–79.