australian centre for international agricultural research...
TRANSCRIPT

123
Au
strade B
ud
get S
tatemen
ts
Australian Centre for International Agricultural
Research (ACIAR)
Agency Resources and Planned Performance

124
Au
strade B
ud
get S
tatemen
ts

125
Au
strade B
ud
get S
tatemen
ts
AUSTRALIAN CENTRE FOR INTERNATIONAL
AGRICULTURAL RESEARCH (ACIAR)
Section 1: Agency Overview and Resources ......................................................... 127
1.1 Strategic Direction Statement ....................................................................... 127 1.2 Agency Resource Statement ........................................................................ 129 1.3 Budget Measures .......................................................................................... 130
Section 2: Outcomes and Planned Performance ................................................... 131 2.1 Outcomes and Performance Information ...................................................... 131
Section 3: Explanatory Tables and Budgeted Financial Statements ................... 137
3.1 Explanatory Tables ....................................................................................... 137
3.2 Budgeted Financial Statements .................................................................... 138

126
Au
strade B
ud
get S
tatemen
ts

127
AUSTRALIAN CENTRE FOR INTERNATIONAL
AGRICULTURAL RESEARCH (ACIAR)
Section 1: Agency Overview and Resources
1.1 STRATEGIC DIRECTION STATEMENT
ACIAR works to improve the productivity and profitability of agricultural systems in
countries of the Asia–Pacific region and Indian Ocean rim, through international
agricultural research partnerships. ACIAR will generate new technologies, new
knowledge, greater capability and better decision-making through these research
partnerships. By focusing on impact pathways, ACIAR will deliver benefits to farmers
and consumers in developing countries and Australia.
ACIAR puts Australia’s agricultural innovation system to work to reduce poverty and
contribute to the long-term economic prosperity of developing countries. This work
contributes to stronger economies and to poverty alleviation, and is central to
Australia’s aid agenda. ACIAR contributes to economic diplomacy through improving
agricultural competitiveness and sustainability, increasing value chain efficiency and
effectiveness, and overcoming regulatory impediments in relation to both domestic
and international markets.
Stronger economies in our region assist Australian exporters and investors to access
and profit from foreign markets. Support for more-productive, market-led agricultural
systems, that engage smallholder farmers, encourages developing countries to
effectively tap into new market opportunities. In these ways, ACIAR works towards a
future of shared prosperity. Importantly, ACIAR’s support to international research
partnerships increases the numbers of skilled professionals at research, extension and
farm levels which then builds the potential for sustained agricultural innovation in the
region, an essential element for economic growth and development.
ACIAR will continue to focus research on four areas: crops; livestock and fisheries;
natural resources and forestry; and socioeconomics and policy, with a stronger focus
across all four on developing market opportunities for smallholder farmers. ACIAR
will implement interdisciplinary research approaches between these focal areas and
address key issues, such as gender inequality, that cut across these focal areas. The
research will tackle gender inequality in the design, delivery and impacts of our
projects. We will maintain our core mandate of producing excellent research, and work
through others to achieve up-scaling (institutional development) and out-scaling
(broader development).
ACIAR will deepen the existing partnerships and explore new and more diverse
partnerships, with greater emphasis on the private sector and non-government

ACIAR Budget Statements
128
organisations, and new, innovative partnerships with emerging economies. In
Australia, ACIAR will move towards more-strategic institutional partnerships, and a
more programmatic approach in delivery. ACIAR’s partnership model will also adapt
to the increasing skills and expertise in some of our partner countries. In Australia
ACIAR will seek to increase our partnership base and support efforts to increase the
involvement of young professionals in international agricultural research. In
developing countries, ACIAR will continue to develop new partnership models
increasing regional collaborations and approaches and developing greater
collaboration with the commercial sector.
ACIAR’s primary focus in 2014-15 will be in the Pacific, East Asia and South and West
Asia (including Afghanistan and Pakistan) with modest investments in Africa and the
Middle East. ACIAR’s primary global engagement will be through the CGIAR.
In line with the re-focussing of the Australian aid programme, ACIAR will increase
emphasis on the Pacific region, particularly Papua New Guinea. In Fiji, the recently
renewed engagement with Australia will open opportunities for ACIAR to broaden
collaboration aimed at sustainable economic development.
ACIAR will also marginally increase funding to East Asia, partly to be able to sustain a
young but important programme in Burma. ACIAR will need to evolve the strong
bilateral relationship with Indonesia to take account of Indonesia’s rapidly changing
institutional capacities. In Timor Leste, ACIAR will look to build on the successes of
ACIAR’s “Seeds of Life” programme to further increase the opportunity for economic
growth and linkages with the private sector.
In West and South Asia, ACIAR will reduce, slightly, the engagement and monitor the
security situation in Afghanistan that will define the future of our engagement in that
country. ACIAR will reduce the scale of our engagement in Africa, in line with both
the priorities of the Aid programme and the targets established in ACIAR’s Strategic
Plan 2014-18, but in that process consolidate our work with regional research
organisations. The programme in the Middle East and North Africa will be phased out.
On a global level, ACIAR will contribute to the Agriculture agenda of the G20 as part
of the whole of Government process and to support Australia’s presidency of this
forum. ACIAR will monitor the development of the ASEAN zone economic
cooperation by 2015, which will see pressures for cooperation on cross border issues
which intersect with ACIAR’s interests, such as biosecurity, agrifood value chains and
food safety. ACIAR will continue to engage in the CGIAR reform and monitor and
support the midterm review to guide the future directions of our investments.
ACIAR Budget Statements
129
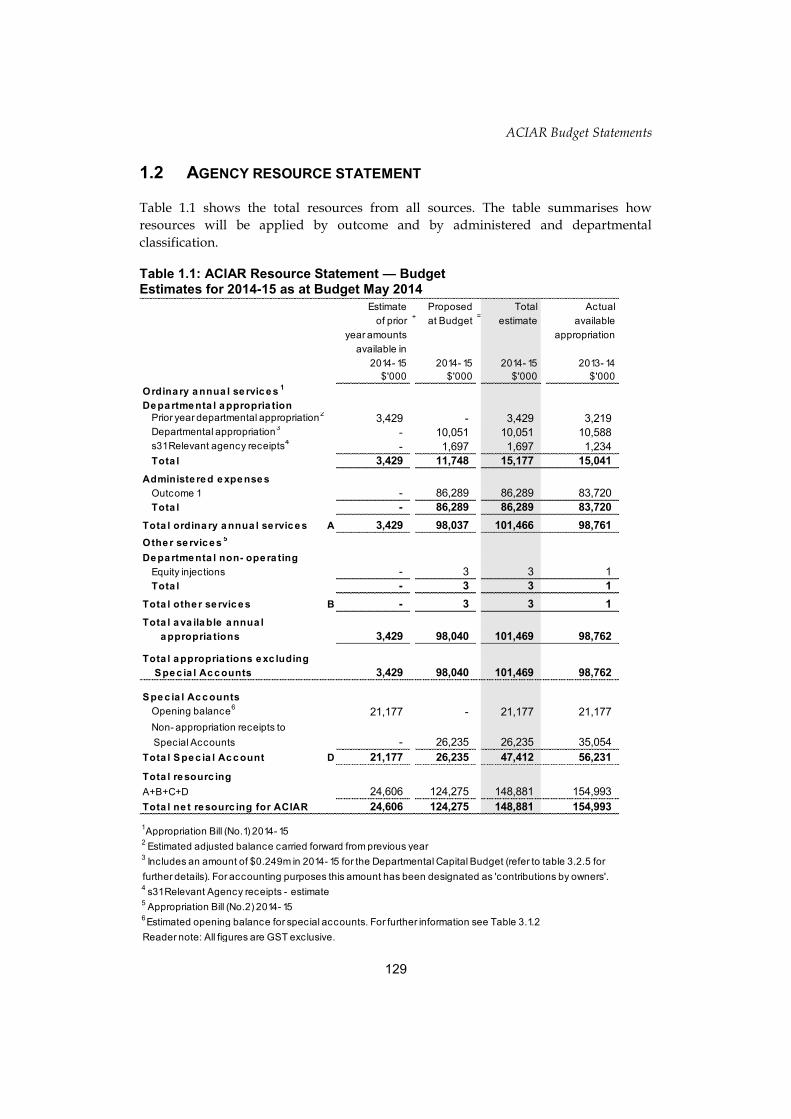
1.2 AGENCY RESOURCE STATEMENT
Table 1.1 shows the total resources from all sources. The table summarises how
resources will be applied by outcome and by administered and departmental
classification.
Table 1.1: ACIAR Resource Statement — Budget Estimates for 2014-15 as at Budget May 2014
Estimate Proposed Total Actual
of prior+
at Budget=
estimate available
year amounts appropriation
available in
2014- 15 2014- 15 2014- 15 2013- 14
$'000 $'000 $'000 $'000
Ordina ry a nnua l se rvic e s1
De pa rtme nta l a ppropria tion
Prior year departmental appropriation2
3,429 - 3,429 3,219
Departmental appropriation3
- 10,051 10,051 10,588
s31 Relevant agency receipts4
- 1,697 1,697 1,234
Tota l 3,429 11,748 15,177 15,041
Administe re d e xpe nse s
Outcome 1 - 86,289 86,289 83,720
Tota l - 86,289 86,289 83,720
Tota l ordina ry a nnua l se rvic e s A 3,429 98,037 101,466 98,761
Othe r se rvic e s5
De pa rtme nta l non- ope ra ting
Equity injections - 3 3 1
Tota l - 3 3 1
Tota l othe r se rvic e s B - 3 3 1
Tota l a va ila ble a nnua l
a ppropria tions 3,429 98,040 101,469 98,762
Tota l a ppropria tions e xc luding
Spe c ia l Ac c ounts 3,429 98,040 101,469 98,762
Spe c ia l Ac c ounts
Opening balance6
21,177 - 21,177 21,177
Non- appropriation receipts to
Special Accounts - 26,235 26,235 35,054
Tota l Spe c ia l Ac c ount D 21,177 26,235 47,412 56,231
Tota l re sourc ing
A+B+C+D 24,606 124,275 148,881 154,993
Tota l ne t re sourc ing for ACIAR 24,606 124,275 148,881 154,993
1 Appropriation Bill (No.1) 2014- 15
2 Estimated adjusted balance carried forward from previous year
3 Includes an amount of $0.249m in 2014- 15 for the Departmental Capital Budget (refer to table 3.2.5 for
further details). For accounting purposes this amount has been designated as 'contributions by owners'.4 s31 Relevant Agency receipts - estimate
5 Appropriation Bill (No.2) 2014- 15
6 Estimated opening balance for special accounts. For further information see Table 3.1.2
Reader note: All figures are GST exclusive.

ACIAR Budget Statements
130
1.3 BUDGET MEASURES
Budget measures in Part 1 relating to ACIAR are detailed in Budget Paper No. 2 and
are summarised below.
Table 1.2: Agency 2014-15 Budget measures Part 1: Measures announced since the 2013-14 MYEFO
Programme 2013-14 2014-15 2015-16 2016-17 2017-18
$'000 $'000 $'000 $'000 $'000
Expense measures
Efficiency Dividend - a further 1.
temporary increase of 0.25 per cent
Departmental expenses - (25) (50) (74) (75)
Total - (25) (50) (74) (75)
Total expense measures
Departmental - (25) (50) (74) (75)
Total - (25) (50) (74) (75)
Prepared on a Government Finance Statistics (fiscal) basis
Programme 2013-14 2014-15 2015-16 2016-17 2017-18
$'000 $'000 $'000 $'000 $'000
Measures
More efficient management structures 1.
Departmental expenses (1) (7) (15) (21) -
Total (1) (7) (15) (21) -
Revised occupational density targets 1.
Departmental expenses (15) (22) (22) (22) -
Total (15) (22) (22) (22) -
Microsoft volume sourcing 1.
Departmental expenses (6) (6) (6) - -
Total (6) (6) (6) - -
Total measures
Departmental (22) (35) (43) (43) -
Total (22) (35) (43) (43) -
Part 2: MYEFO measures not previously reported in a portfolio statement
Prepared on a Government Finance Statistics (fiscal) basis.

ACIAR Budget Statements
131
SECTION 2: OUTCOMES AND PLANNED PERFORMANCE
2.1 OUTCOMES AND PERFORMANCE INFORMATION
Government outcomes are the intended results, impacts or consequences of actions by
the Government on the Australian community. Commonwealth Programmes are the
primary vehicle by which Government agencies achieve the intended results of their
outcome statements. Agencies are required to identify the Programmes which
contribute to Government outcomes over the Budget and forward years.
ACIAR’s outcome is described below together with its related Programmes, specifying
the performance indicators and targets used to assess and monitor the performance of
ACIAR in achieving Government outcomes.
Outcome 1: To achieve more productive and sustainable agricultural systems for the benefit of developing countries and Australia through international agricultural research and training partnerships
Outcome 1 Strategy
To achieve more productive and sustainable agricultural systems for the benefit of
developing countries and Australia through international agricultural research and
training partnerships ACIAR will:
concentrate efforts in developing countries of Asia and the Pacific, while also
engaging in high-payoff partnerships in other regions in support of Australia’s
foreign policy objectives;
work through bilateral (at least 70%) and multilateral (up to 30%) modalities;
generate new technologies, new knowledge, greater capability and better
decision-making from our research partnerships;
focus research on four areas: crops; livestock and fisheries; natural resources and
forestry; and socioeconomics and policy;
develop a stronger focus on developing market opportunities for smallholder
farmers;
implement cross-disciplinary and interdisciplinary research approaches;
tackle gender inequality, in the design, delivery and impacts of projects;
maintain our core mandate of producing excellent research, and work through
others to achieve up-scaling and broader development;
deepen our existing partnerships and explore new and more diverse
partnerships, with greater emphasis on the private sector and non-government
organisations, and new, innovative partnerships with emerging economies; and

ACIAR Budget Statements
132
move towards more-strategic institutional partnerships, and a more
programmatic approach in delivery.
Outcome Expense Statement
Table 2.1 provides an overview of the total expenses for outcome 1, by programme.

ACIAR Budget Statements
133
Table 2.1: Budgeted Expenses for Outcome 1
Outcome 1: To achieve more productive and sustainable
agricultural systems for the benefit of developing countries and
Australia through international agricultural research and
training partnerships.
2013-14 2014-15
Estimated Estimated
actual expenses
expenses
$'000 $'000
Programme 1.1: International Agricultural Research and
Development
Administered expenses
Ordinary annual services (Appropriation Bill No. 1) 83,720 86,289
Special Accounts 35,054 26,235
Departmental expenses
Departmental appropriation 1 11,568 11,499
Expenses not requiring appropriation in the Budget year 2 278 277
Total for Programme 1.1 130,620 124,300
Outcome 1 Totals by appropriation type
Administered Expenses
Ordinary annual services (Appropriation Bill No. 1) 83,720 86,289
Special Accounts 35,054 26,235
Departmental expenses
Departmental appropriation 1 11,568 11,499
Expenses not requiring appropriation in the Budget year 2 278 277
Total expenses for Outcome 1 130,620 124,300
2013-14 2014-15
Average Staffing Level (number) 70 70
1 Departmental Appropriation combines "Ordinary annual services (Appropriation Bill No. 1)" and
"Revenue from independent sources (s31)".
2 Expenses not requiring appropriation in the Budget year is made up of Depreciation Expense,
Amortisation Expense, and, Audit Fees.

ACIAR Budget Statements
134
Contributions to Outcome 1
Programme 1: International agricultural research for development for more productive and sustainable agriculture
Programme Objective
ACIAR has the single administered programme of international agricultural
research for development for more productive and sustainable agriculture,
delivered through a number of initiatives aligning closely with the Australian aid
policy. The objective of the Programme is to contribute to economic diplomacy
through improving agricultural competitiveness and sustainability, increasing value
chain efficiency and effectiveness, and alleviating regulatory impediments in
relation to both domestic and international markets.
ACIAR Budget Statements
135
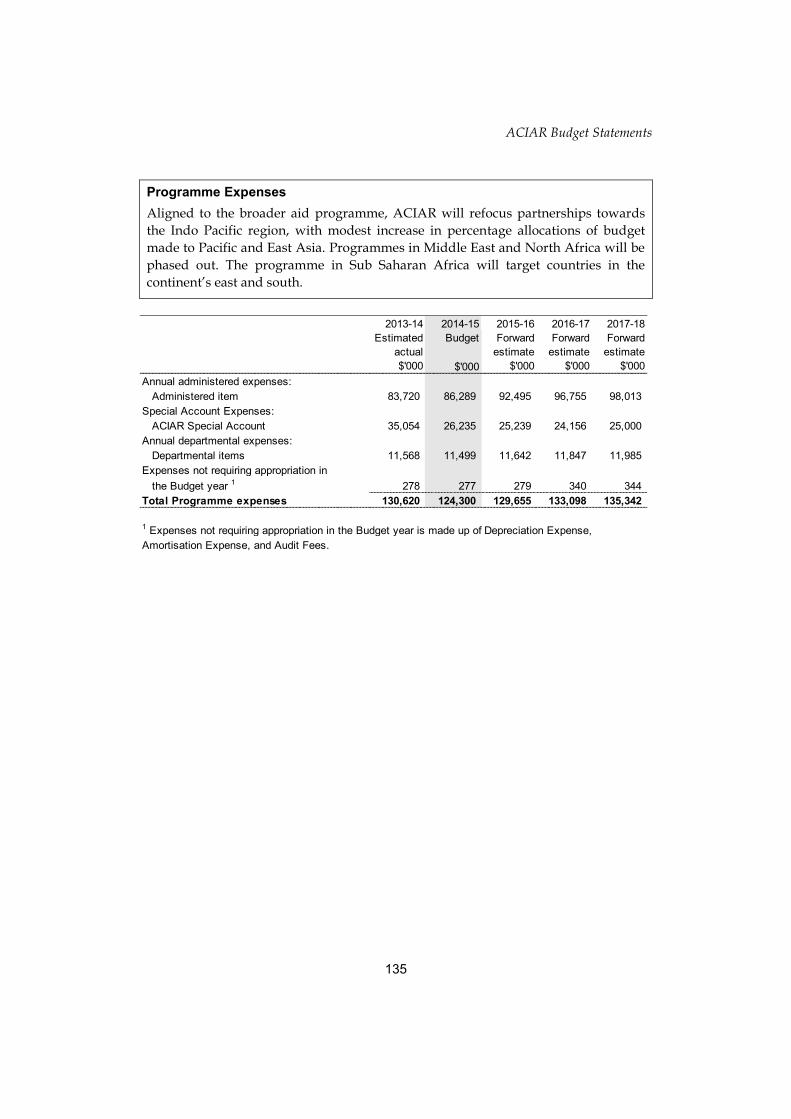
Programme Expenses
Aligned to the broader aid programme, ACIAR will refocus partnerships towards
the Indo Pacific region, with modest increase in percentage allocations of budget
made to Pacific and East Asia. Programmes in Middle East and North Africa will be
phased out. The programme in Sub Saharan Africa will target countries in the
continent’s east and south.
2013-14 2014-15 2015-16 2016-17 2017-18
Estimated Budget Forward Forward Forward
actual estimate estimate estimate
$'000 $'000 $'000 $'000 $'000
Annual administered expenses:
Administered item 83,720 86,289 92,495 96,755 98,013
Special Account Expenses:
ACIAR Special Account 35,054 26,235 25,239 24,156 25,000
Annual departmental expenses:
Departmental items 11,568 11,499 11,642 11,847 11,985
Expenses not requiring appropriation in
the Budget year 1 278 277 279 340 344
Total Programme expenses 130,620 124,300 129,655 133,098 135,342
1 Expenses not requiring appropriation in the Budget year is made up of Depreciation Expense,
Amortisation Expense, and Audit Fees.
ACIAR Budget Statements
136
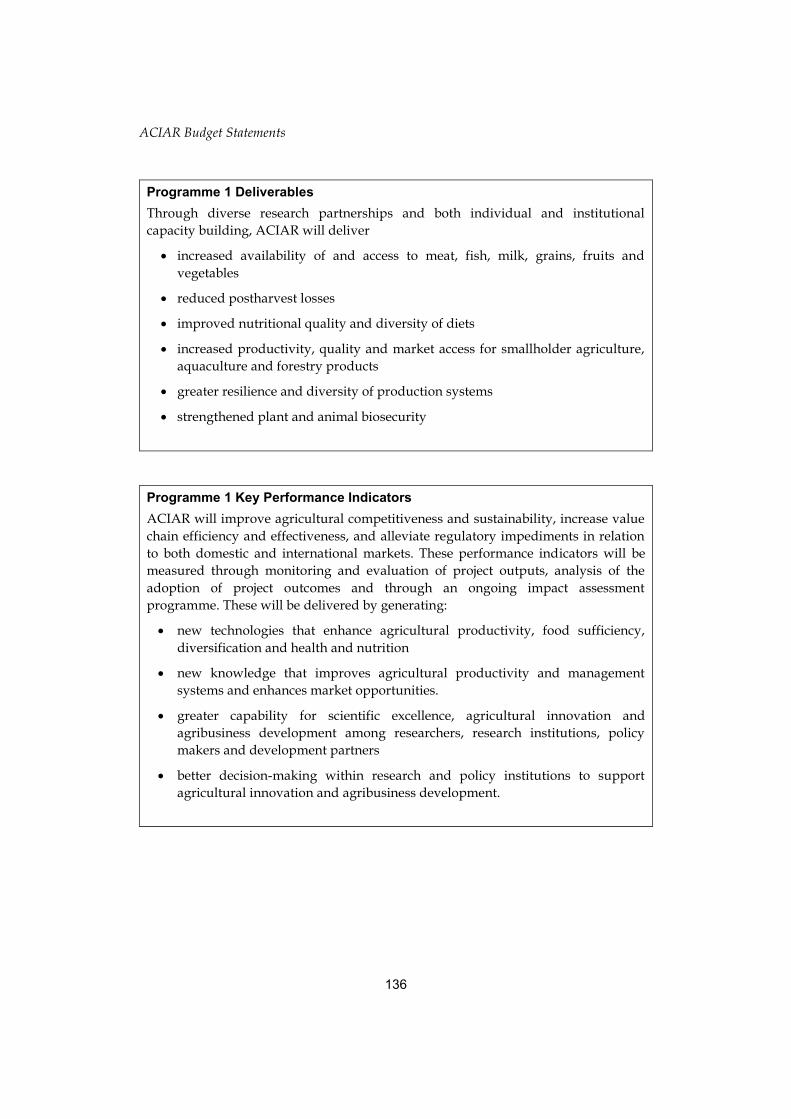
Programme 1 Deliverables
Through diverse research partnerships and both individual and institutional
capacity building, ACIAR will deliver
increased availability of and access to meat, fish, milk, grains, fruits and
vegetables
reduced postharvest losses
improved nutritional quality and diversity of diets
increased productivity, quality and market access for smallholder agriculture,
aquaculture and forestry products
greater resilience and diversity of production systems
strengthened plant and animal biosecurity
Programme 1 Key Performance Indicators ACIAR will improve agricultural competitiveness and sustainability, increase value
chain efficiency and effectiveness, and alleviate regulatory impediments in relation
to both domestic and international markets. These performance indicators will be
measured through monitoring and evaluation of project outputs, analysis of the
adoption of project outcomes and through an ongoing impact assessment
programme. These will be delivered by generating:
new technologies that enhance agricultural productivity, food sufficiency,
diversification and health and nutrition
new knowledge that improves agricultural productivity and management
systems and enhances market opportunities.
greater capability for scientific excellence, agricultural innovation and
agribusiness development among researchers, research institutions, policy
makers and development partners
better decision-making within research and policy institutions to support
agricultural innovation and agribusiness development.

ACIAR Budget Statements
137
Section 3: Explanatory Tables and Budgeted Financial Statements
Section 3 presents explanatory tables and budgeted financial statements which provide
a comprehensive snapshot of agency finances for the 2014-15 budget year. It explains
how budget plans are incorporated into the financial statements and provides further
details of the reconciliation between appropriations and Programme expenses,
movements in administered funds, special accounts and government indigenous
expenditure.
3.1 EXPLANATORY TABLES
3.1.1 Movement of Administered Funds between Years
Administered funds can be provided for a specified period, for example under annual
Appropriation Acts. Funds not used in the specified period with the agreement of the
Finance Minister may be moved to a future year. Table 3.1.1 shows the movement of
administered funds approved between years.
There has been no movement of administered funds between years for ACIAR since
the 2013-14 Budget.
3.1.2 Special Accounts
Special Accounts provide a means to set aside and record amounts used for specified
purposes. Special Accounts can be created by a Finance Minister’s Determination
under the FMA Act or under separate enabling legislation. Table 3.1.2 shows the
expected additions (receipts) and reductions (payments) for each account used by
ACIAR.
Table 3.1.2: Estimates of Special Account Flows and Balances
Opening Closing
balance Receipts Payments Adjustments balance
2014-15 2014-15 2014-15 2014-15 2014-15
2013-14 2013-14 2013-14 2013-14 2013-14
Outcome $'000 $'000 $'000 $'000 $'000
Australian Centre for
International Agricultural
Research Account (A)
1 21,177 26,235 (26,235) - 21,177
Total Special Accounts
2014-15 Budget estimate 21,177 26,235 (26,235) - 21,177
Total Special Accounts
2013-14 estimated actual 21,177 35,054 (35,054) - 21,177
(A) = Administered

ACIAR Budget Statements
138
3.2 Budgeted financial statements
3.2.1 Budgeted Financial Statements Tables
Table 3.2.1 Comprehensive Income Statement (Showing Net Cost of Services) for the period ended 30 June
Estimated Budget Forw ard Forw ard Forw ard
actual estimate estimate estimate estimate
2013-14 2014-15 2015-16 2016-17 2017-18
$'000 $'000 $'000 $'000 $'000
EXPENSES
Employee benefits 7,932 8,163 8,395 8,647 8,796
Suppliers 3,660 3,360 3,271 3,224 3,213
Depreciation and amortisation 254 253 255 316 320
Total expenses 11,846 11,776 11,921 12,187 12,329
LESS:
OWN-SOURCE INCOME
Own-source revenue
Sale of goods and rendering of services 1,234 1,697 1,958 2,225 2,274
Total own-source revenue 1,234 1,697 1,958 2,225 2,274
Gains
Other 24 24 24 24 24
Total gains 24 24 24 24 24
Total own-source income 1,258 1,721 1,982 2,249 2,298
Net cost of (contribution by)
services 10,588 10,055 9,939 9,938 10,031
Revenue from Government 10,334 9,802 9,684 9,622 9,711* * * *
Surplus (Deficit) attributable to
the Australian Government (254) (253) (255) (316) (320)
Total comprehensive income (loss)
attributable to the Australian
Government (254) (253) (255) (316) (320)
Note: Impact of Net Cash Appropriation Arrangements
Total Comprehensive Income
(loss) excluding depreciation/amortisation
expenses previously funded through
revenue appropriations. (254) (253) (255) (316) (320)
less depreciation/amortisation expenses
previously funded through revenue
appropriations1 - - - - -
Total Comprehensive Income
(loss) - as per the Statement of
Comprehensive Income (254) (253) (255) (316) (320)1 From 2010-11, the Government introduced net cash appropriation arrangements w here Bill 1
revenue appropriations for the depreciation/amortisation expenses of FMA Act agencies w ere
replaced w ith a separate capital budget (the Departmental Capital Budget, or DCB) provided
through Bill 1 equity appropriations. For information regarding DCBs, please refer to Table 3.2.5
Departmental Capital Budget Statement. Prepared on Australian Accounting Standards basis.

ACIAR Budget Statements
139
Table 3.2.2: Budgeted Departmental Balance Sheet (as at 30 June)
Estimated Budget Forw ard Forw ard Forw ard
actual estimate estimate estimate estimate
2013-14 2014-15 2015-16 2016-17 2017-18
$'000 $'000 $'000 $'000 $'000
ASSETS
Financial assets
Cash and cash equivalents 62 62 62 62 62
Trade and other receivables 3,480 3,480 3,480 3,480 3,480
Total financial assets 3,542 3,542 3,542 3,542 3,542
Non-financial assets
Land and buildings 389 318 404 273 192
Property, plant and equipment 616 688 757 814 844
Intangibles 172 170 169 175 158
Other non-financial assets 69 69 69 69 69
Total non-financial assets 1,246 1,245 1,399 1,331 1,263
Total assets 4,788 4,787 4,941 4,873 4,805
LIABILITIES
Payables
Suppliers 190 190 150 80 50
Other payables 171 86 38 17 47
Total payables 361 276 188 97 97
Provisions
Employee provisions 2,008 2,093 2,181 2,272 2,272
Total provisions 2,008 2,093 2,181 2,272 2,272
Total liabilities 2,369 2,369 2,369 2,369 2,369
Net assets 2,419 2,418 2,572 2,504 2,436 EQUITY
Parent entity interest
Contributed equity 1,486 1,738 2,147 2,395 2,647
Reserves 708 708 708 708 708
Retained surplus
(accumulated deficit) 225 (28) (283) (599) (919)
Total parent entity interest 2,419 2,418 2,572 2,504 2,436
Total Equity 2,419 2,418 2,572 2,504 2,436 Prepared on Australian Accounting Standards basis.

ACIAR Budget Statements
140
Table 3.2.3: Departmental Statement of Changes in Equity — Summary of Movement (Budget Year 2014-15)
Retained Asset Other Contributed Total
earnings revaluation reserves equity/ equity
reserve capital
$'000 $'000 $'000 $'000 $'000
Opening balance as at 1 July 2014
Balance carried forw ard from
previous period 225 708 - 1,486 2,419
Adjusted opening balance 225 708 - 1,486 2,419
Comprehensive income
Surplus (deficit) for the period (253) - - - (253)
Total comprehensive income (253) - - - (253)
of w hich:
Attributable to the Australian Government (253) - - - (253)
Transactions with owners
Contributions by owners
Equity Injection - Appropriation - - - 3 3
Departmental Capital Budget (DCBs) - - - 249 249
Sub-total transactions with owners - - - 252 252
Closing balance attributable to the
Australian Government (28) 708 - 1,738 2,418 Prepared on Australian Accounting Standards basis.

ACIAR Budget Statements
141
Table 3.2.4: Budgeted Departmental Statement of Cash Flows (for the period ended 30 June)
Estimated Budget Forw ard Forw ard Forw ard
actual estimate estimate estimate estimate
2013-14 2014-15 2015-16 2016-17 2017-18
$'000 $'000 $'000 $'000 $'000
OPERATING ACTIVITIES
Cash received
Appropriations 10,284 9,802 9,684 9,622 9,711
Sale of goods and rendering of services 1,234 1,697 1,958 2,225 2,274
Net GST received 20 20 20 20 20
Total cash received 11,538 11,519 11,662 11,867 12,005
Cash used
Employees 7,882 8,078 8,307 8,556 8,796
Suppliers 3,656 3,441 3,355 3,311 3,209
Total cash used 11,538 11,519 11,662 11,867 12,005
Net cash from (used by)
operating activities - - - - -
INVESTING ACTIVITIES
Cash used
Purchase of property, plant
and equipment 255 252 409 248 252
Total cash used 255 252 409 248 252
Net cash from (used by)
investing activities (255) (252) (409) (248) (252) FINANCING ACTIVITIES
Cash received
Contributed equity 255 252 409 248 252
Total cash received 255 252 409 248 252
Net cash from (used by)
financing activities 255 252 409 248 252
Net increase (decrease)
in cash held - - - - -
Cash and cash equivalents at the
beginning of the reporting period 62 62 62 62 62
Cash and cash equivalents at the
end of the reporting period 62 62 62 62 62 Prepared on Australian Accounting Standards basis.

ACIAR Budget Statements
142
Table 3.2.5: Departmental Capital Budget Statement Estimated Budget Forw ard Forw ard Forw ard
actual estimate estimate estimate estimate
2013-14 2014-15 2015-16 2016-17 2017-18
$'000 $'000 $'000 $'000 $'000
NEW CAPITAL APPROPRIATIONS
Capital budget - Bill 1 (DCB) 254 249 248 248 252
Equity injections - Bill 2 1 3 161 - -
Total new capital appropriations 255 252 409 248 252
Provided for:
Purchase of non-financial assets 255 252 409 248 252
Total Items 255 252 409 248 252
PURCHASE OF NON-FINANCIAL
ASSETS
Funded by capital appropriations 11 3 161 - -
Funded by capital appropriation - DCB 2254 249 248 248 252
TOTAL 255 252 409 248 252
RECONCILIATION OF CASH
USED TO ACQUIRE ASSETS
TO ASSET MOVEMENT TABLE
Total purchases 255 252 409 248 252
Total cash used to
acquire assets 255 252 409 248 252
1 Includes both current Bill 2 and prior Act 2/4/6 appropriations and special capital appropriations
2 Does not include annual f inance lease costs. Include purchase from current and previous
years' Departmental Capital Budgets (DCBs). Prepared on Australian Accounting Standards basis.
ACIAR Budget Statements
143
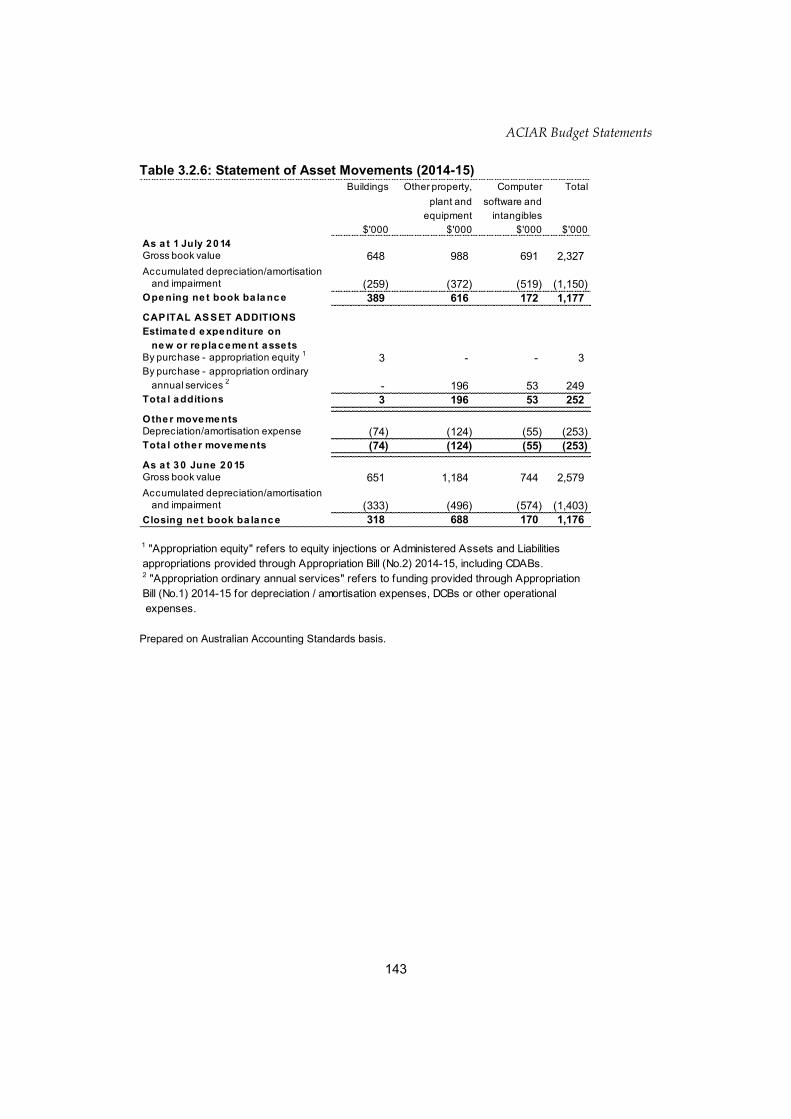
Table 3.2.6: Statement of Asset Movements (2014-15) Buildings Other property, Computer Total
plant and software and
equipment intangibles
$'000 $'000 $'000 $'000
As a t 1 July 2 0 14
Gross book value 648 988 691 2,327
Accumulated depreciation/amortisation
and impairment (259) (372) (519) (1,150)
Ope ning ne t book ba la nc e 389 616 172 1,177
CAPITAL ASSET ADDITIONS
Estima te d e xpe nditure on
ne w or re pla c e me nt a sse ts
By purchase - appropriation equity 1
3 - - 3
By purchase - appropriation ordinary
annual services 2
- 196 53 249
Tota l a dditions 3 196 53 252
Othe r move me nts
Depreciation/amortisation expense (74) (124) (55) (253)
Tota l othe r move me nts (74) (124) (55) (253)
As a t 3 0 June 2 0 15
Gross book value 651 1,184 744 2,579
Accumulated depreciation/amortisation
and impairment (333) (496) (574) (1,403)
Closing ne t book ba la nc e 318 688 170 1,176
1 "Appropriation equity" refers to equity injections or Administered Assets and Liabilities
appropriations provided through Appropriation Bill (No.2) 2014-15, including CDABs.2 "Appropriation ordinary annual services" refers to funding provided through Appropriation
Bill (No.1) 2014-15 for depreciation / amortisation expenses, DCBs or other operational
expenses. Prepared on Australian Accounting Standards basis.

ACIAR Budget Statements
144
Table 3.2.7: Schedule of Budgeted Income and Expenses Administered on Behalf of Government (for the period ended 30 June)
Estimated Budget Forw ard Forw ard Forw ard
actual estimate estimate estimate estimate
2013-14 2014-15 2015-16 2016-17 2017-18
$'000 $'000 $'000 $'000 $'000
EXPENSES ADMINISTERED ON
BEHALF OF GOVERNMENT
Employee benefits 291 303 315 328 342
Suppliers 118,483 112,221 117,419 120,583 122,671
Total expenses administered
on behalf of Government 118,774 112,524 117,734 120,911 123,013
LESS:
OWN-SOURCE INCOME
Own-source revenue
Non-taxation revenue
Sale of goods and rendering
of services 35,054 26,235 25,239 24,156 25,000
Total non-taxation revenue 35,054 26,235 25,239 24,156 25,000
Total own-source revenues
administered on behalf of
Government 35,054 26,235 25,239 24,156 25,000
Total own-sourced income
administered on behalf of
Government 35,054 26,235 25,239 24,156 25,000
Net Cost of (contribution by)
services 83,720 86,289 92,495 96,755 98,013
Surplus (Deficit) 83,720 86,289 92,495 96,755 98,013
Total comprehensive income (loss) 83,720 86,289 92,495 96,755 98,013 Prepared on Australian Accounting Standards basis.

ACIAR Budget Statements
145
Table 3.2.8: Schedule of Budgeted Assets and Liabilities Administered on Behalf of Government (as at 30 June)
Estimated Budget Forw ard Forw ard Forw ard
actual estimate estimate estimate estimate
2013-14 2014-15 2015-16 2016-17 2017-18
$'000 $'000 $'000 $'000 $'000
ASSETS
Financial assets
Cash and cash equivalents 21,177 21,177 21,177 21,177 21,177
Taxation receivables 604 604 604 604 604
Trade and other receivables 1,048 1,048 1,048 1,048 1,048
Total financial assets 22,829 22,829 22,829 22,829 22,829
Non-financial assets
Other non-financial assets 15 15 15 15 15
Total non-financial assets 15 15 15 15 15
Total assets administered
on behalf of Government 22,844 22,844 22,844 22,844 22,844
LIABILITIES
Payables
Suppliers 1,994 2,044 2,094 2,094 2,094
Other payables 487 487 487 487 487
Total payables 2,481 2,531 2,581 2,581 2,581 Provisions
Employee provisions 18 18 18 18 18
Total provisions 18 18 18 18 18
Total liabilities administered
on behalf of Government 2,499 2,549 2,599 2,599 2,599
Net assets/(liabilities) 20,345 20,295 20,245 20,245 20,245 Prepared on Australian Accounting Standards basis.

ACIAR Budget Statements
146
Table 3.2.9: Schedule of Budgeted Administered Cash Flows (for the period ended 30 June)
Estimated Budget Forw ard Forw ard Forw ard
actual estimate estimate estimate estimate
2013-14 2014-15 2015-16 2016-17 2017-18
$'000 $'000 $'000 $'000 $'000
OPERATING ACTIVITIES
Cash received
External Funds 35,054 26,235 25,239 24,156 25,000
Net GST received 4,550 4,600 4,500 4,500 4,500
Total cash received 39,604 30,835 29,739 28,656 29,500
Cash used
Suppliers 118,436 112,172 117,369 120,583 122,671
Employees 285 303 315 328 342
Total cash used 118,721 112,475 117,684 120,911 123,013
Net cash from (used by)
operating activities (79,117) (81,640) (87,945) (92,255) (93,513) Net increase (decrease) in
cash held (79,117) (81,640) (87,945) (92,255) (93,513)
Cash and cash equivalents at
beginning of reporting period 21,177 21,177 21,177 21,177 21,177
Cash from Official Public Account for:
- Appropriations 83,667 86,240 92,445 96,755 98,013
83,667 86,240 92,445 96,755 98,013
Cash to Official Public Account for:
- Appropriations (4,550) (4,600) (4,500) (4,500) (4,500)
(4,550) (4,600) (4,500) (4,500) (4,500)
Cash and cash equivalents at end
of reporting period 21,177 21,177 21,177 21,177 21,177 Prepared on Australian Accounting Standards basis.