australian electoral systems · 2008-11-25 · australian electoral systems in a national or...
TRANSCRIPT

Parliament of Australia Department of Parliamentary Services
Parliamentary Library Information, analysis and advice for the Parliament RESEARCH PAPER
www.aph.gov.au/library
21 August 2007, no. 5, 2007–08, ISSN 1834-9854
Australian electoral systems
Scott Bennett and Rob Lundie Politics and Public Administration Section
Executive summary The Australian electorate has experienced three types of voting system—First Past the Post, Preferential Voting and Proportional Representation (Single Transferable Vote).
First Past the Post was used for the first Australian parliamentary elections held in 1843 for the New South Wales Legislative Council and for most colonial elections during the second half of the nineteenth century. Since then there have been alterations to the various electoral systems in use around the country. These alterations have been motivated by three factors: a desire to find the ‘perfect’ system, to gain political advantage, or by the need to deal with faulty electoral system arrangements.
Today, two variants of Preferential Voting and two variants of Proportional Representation are used for all Australian parliamentary elections. This paper has two primary concerns: firstly, explaining in detail the way each operates, the nature of the ballot paper and how the votes are counted; and secondly, the political consequences of the use of each system. Appendix 1 gives examples of other Australian models used over the years and Appendix 2 lists those currently in use in Commonwealth elections as well as in the states and territories.
Under ‘Full’ Preferential Voting each candidate must be given a preference by the voter. This system favours the major parties; can sometimes award an election to the party that wins fewer votes than its major opponent; usually awards the party with the largest number of votes a disproportionate number of seats; and occasionally gives benefits to the parties that manufacture a ‘three-cornered contest’ in a particular seat.
With ‘Optional’ Preferential Voting the voter may allocate preferences to as few as one candidate. This system can produce similar outcomes to ‘full’ Preferential Voting, but can also produce results where the winning candidate wins with less than half of the votes. It also clearly lessens the importance of preferences in many seats.
The Proportional Representation system used in Senate elections increases the chances of minor parties and independents winning seats, produces closer results in the struggle between the major parties, and makes it difficult for a major party to gain control of the Senate.
The Hare-Clark system ensures that no seat is safe, creates an electoral system where party members fight each other as much as their external opponents, and operates in such a way that minority governments are more common than when Preferential Voting is used.
Despite parliamentary enquiries after each Commonwealth election, there is generally little call for major changes to be made to Australian electoral systems. On balance it seems that Australia has found arrangements that suit the needs of its people, its parties and its parliamentarians.

Contents
Executive summary . . . . . . . . . . . . . . . . . . . . . . . . . . . . . . . . . . . . . . . . . . . . . . . . . . . . . 1
Introduction . . . . . . . . . . . . . . . . . . . . . . . . . . . . . . . . . . . . . . . . . . . . . . . . . . . . . . . . . . 1
The first Australian elections . . . . . . . . . . . . . . . . . . . . . . . . . . . . . . . . . . . . . . . . . . . . . . 1
Preferential Voting . . . . . . . . . . . . . . . . . . . . . . . . . . . . . . . . . . . . . . . . . . . . . . . . . . . . . 3
‘Full’ Preferential Voting . . . . . . . . . . . . . . . . . . . . . . . . . . . . . . . . . . . . . . . . . . . . . . . . . 4
A single count . . . . . . . . . . . . . . . . . . . . . . . . . . . . . . . . . . . . . . . . . . . . . . . . . . . . 5
More than one count . . . . . . . . . . . . . . . . . . . . . . . . . . . . . . . . . . . . . . . . . . . . . . . . 5
The political impact of ‘full’ Preferential Voting . . . . . . . . . . . . . . . . . . . . . . . . . . . . . . 6
Favouring the major parties . . . . . . . . . . . . . . . . . . . . . . . . . . . . . . . . . . . . . . . . . . . 6
The ‘wrong’ result . . . . . . . . . . . . . . . . . . . . . . . . . . . . . . . . . . . . . . . . . . . . . . . . . 7
The ‘winner’s bonus’ . . . . . . . . . . . . . . . . . . . . . . . . . . . . . . . . . . . . . . . . . . . . . . . 8
Three-cornered contests . . . . . . . . . . . . . . . . . . . . . . . . . . . . . . . . . . . . . . . . . . . . . 8
Controlling the voter—the importance of how-to-vote cards . . . . . . . . . . . . . . . . . . . 9
Optional Preferential Voting. . . . . . . . . . . . . . . . . . . . . . . . . . . . . . . . . . . . . . . . . . . . . . 10
The political impact of Optional Preferential Voting . . . . . . . . . . . . . . . . . . . . . . . . . . 12
Fewer votes . . . . . . . . . . . . . . . . . . . . . . . . . . . . . . . . . . . . . . . . . . . . . . . . . . . . . 12
Lessening the importance of preferences . . . . . . . . . . . . . . . . . . . . . . . . . . . . . . . . 12
Proportional Representation (Single Transferable Vote) . . . . . . . . . . . . . . . . . . . . . . . . . . 12
‘Senate’ Model . . . . . . . . . . . . . . . . . . . . . . . . . . . . . . . . . . . . . . . . . . . . . . . . . . . . . . . 13
Electorates . . . . . . . . . . . . . . . . . . . . . . . . . . . . . . . . . . . . . . . . . . . . . . . . . . . . . . . . 13
Ballot paper . . . . . . . . . . . . . . . . . . . . . . . . . . . . . . . . . . . . . . . . . . . . . . . . . . . . . . . 13
Lists . . . . . . . . . . . . . . . . . . . . . . . . . . . . . . . . . . . . . . . . . . . . . . . . . . . . . . . . . . . 14
Voting . . . . . . . . . . . . . . . . . . . . . . . . . . . . . . . . . . . . . . . . . . . . . . . . . . . . . . . . . . . 14
‘Above the line’ votes . . . . . . . . . . . . . . . . . . . . . . . . . . . . . . . . . . . . . . . . . . . . . . 14
‘Below the line’ votes . . . . . . . . . . . . . . . . . . . . . . . . . . . . . . . . . . . . . . . . . . . . . . 14
Vote totals . . . . . . . . . . . . . . . . . . . . . . . . . . . . . . . . . . . . . . . . . . . . . . . . . . . . . . 14
The Count . . . . . . . . . . . . . . . . . . . . . . . . . . . . . . . . . . . . . . . . . . . . . . . . . . . . . . . . 15
Surplus votes . . . . . . . . . . . . . . . . . . . . . . . . . . . . . . . . . . . . . . . . . . . . . . . . . . . . 16
Transfer value. . . . . . . . . . . . . . . . . . . . . . . . . . . . . . . . . . . . . . . . . . . . . . . . . . . . 17

Exclusion of candidates and distribution of their preferences . . . . . . . . . . . . . . . . . . 18
The political impact of Proportional Representation (‘Senate’ model) . . . . . . . . . . . . . . 18
‘Safe’ seats . . . . . . . . . . . . . . . . . . . . . . . . . . . . . . . . . . . . . . . . . . . . . . . . . . . . . . 18
The minor parties . . . . . . . . . . . . . . . . . . . . . . . . . . . . . . . . . . . . . . . . . . . . . . . . . 19
Control of the Senate . . . . . . . . . . . . . . . . . . . . . . . . . . . . . . . . . . . . . . . . . . . . . . . 19
Hare-Clark model . . . . . . . . . . . . . . . . . . . . . . . . . . . . . . . . . . . . . . . . . . . . . . . . . . . . . 20
Electorates . . . . . . . . . . . . . . . . . . . . . . . . . . . . . . . . . . . . . . . . . . . . . . . . . . . . . . . . 20
Ballot paper . . . . . . . . . . . . . . . . . . . . . . . . . . . . . . . . . . . . . . . . . . . . . . . . . . . . . . . 20
Voting . . . . . . . . . . . . . . . . . . . . . . . . . . . . . . . . . . . . . . . . . . . . . . . . . . . . . . . . . . . 22
The quota . . . . . . . . . . . . . . . . . . . . . . . . . . . . . . . . . . . . . . . . . . . . . . . . . . . . . . . 22
The count . . . . . . . . . . . . . . . . . . . . . . . . . . . . . . . . . . . . . . . . . . . . . . . . . . . . . . . . . 22
The political impact of Proportional Representation (Hare-Clark) . . . . . . . . . . . . . . . . . 25
Minority governments . . . . . . . . . . . . . . . . . . . . . . . . . . . . . . . . . . . . . . . . . . . . . . 25
Reduced party control . . . . . . . . . . . . . . . . . . . . . . . . . . . . . . . . . . . . . . . . . . . . . . 25
No seat is safe . . . . . . . . . . . . . . . . . . . . . . . . . . . . . . . . . . . . . . . . . . . . . . . . . . . . 25
Everyone is an opponent . . . . . . . . . . . . . . . . . . . . . . . . . . . . . . . . . . . . . . . . . . . . 25
Conclusion—electoral systems that suit Australia . . . . . . . . . . . . . . . . . . . . . . . . . . . . . . 26
Appendix 1: Other voting systems used in Australia . . . . . . . . . . . . . . . . . . . . . . . . . . . . 28
Appendix 2: Electoral systems in use in Australia . . . . . . . . . . . . . . . . . . . . . . . . . . . . . . 31

Party abbreviations
AD Australian Democrats ALP Australian Labor Party FF Family First Party Grn Australian Greens Ind Independent Ind Nat Independent Nationalist Lib Liberal Party Nat Nationalist Party NCP National Country Party ON Pauline Hanson’s One Nation RSN Returned Services Nationalist Party VFU Victorian Farmers’ Union

Australian electoral systems
Introduction Australian parliamentary elections have been notable for the extent of electoral system experimentation and change over the years. Some of this change has been aimed at providing the best possible voting system; on the other hand, some of the change has been made with the aim of achieving particular political outcomes.
The Australian experience has focussed on three types of voting system:
Plurality systems are the simplest of systems, where the winner is the candidate with a plurality of votes, though not necessarily an absolute majority of votes. Such systems include First Past the Post and the Block Vote, both of which have been used in Australia.
Majority systems attempt to ensure that a candidate secures an absolute majority of votes. The Second Ballot and the Contingent Vote are examples that have been used in Australia. The best-known and most widely used in this country has been Preferential Voting (known in the UK as the Alternative Vote, and in the USA as Instant Runoff Voting) which is discussed at some length in this paper.
Proportional Representation systems (PR) are designed to allocate parliamentary seats to parties in proportion to their vote. The example in use in Australia is the Single Transferable Vote.
This paper refers to the main variants of Preferential Voting and the Single Transferable Vote that are used today, outlining the way each operates, and discussing briefly the political consequences of their use. Appendix 1 gives examples of some of the Australian systems used over the years. Appendix 2 lists the electoral systems currently in use in Australia.
The first Australian elections The first Australian parliamentary elections were held in 1843 for the New South Wales Legislative Council, a body whose members had previously all been appointed. The Legislative Council had been enlarged, with 24 of its 36 members to be elected.1 The electoral system used was First Past the Post, with the candidates who gained the highest number of votes being elected. The voting in different electorates was held over a few days, with the first being held in the electorate of Sydney—the first parliamentary election held in Australia (Election Result 1).
1. M. M. H. Thompson, The First Election: The New South Wales Legislative Council Election of
1843, Alpha Desktop Publishing, Mittagong, 1996.
1

Australian electoral systems
Election Result 1: Sydney (Legislative Council, NSW) 1843 [Two to be elected]
Candidates Votes Wentworth 1 275 (35.1%) Bland 1 261 (34.7%) O’Connell 733 (20.2%) Cooper 365 (10.0%) Total 3 634 Wentworth, Bland elected
Source: M. M. H. Thompson, The First Election: The New South Wales Legislative Council Election of 1843, Alpha Desktop Publishing, Mittagong, 1996, p. 142.
In 1851 the first elections were held in Victoria, South Australia and Tasmania, also for Legislative Councils. Western Australia first held elections for 12 of 18 Legislative Councillors in 1870.
By 1860 the achievement of what became known as ‘responsible government’ had seen elections put in place for lower houses of parliament in New South Wales (1856), Victoria (1856), South Australia (1856), Tasmania (1856) and Queensland (1860). Lower house elections were not held in Western Australia until 1890.
The pre 1856 elections were all conducted by a show of hands, with the candidate with the highest vote winning the contest—a First Past the Post electoral system. The first use of the secret ballot (soon known internationally as the ‘Australian ballot’) occurred in Victoria, South Australia and Tasmania in 1856, followed soon after by New South Wales in 1858 and Queensland in 1860. It was first used in Western Australia in 1879. Although the first electoral system used in all colonies was First Past the Post, none of the states now use this system for each eventually moved to replace it with some other system. The territories never used it.
There have been three basic motivations for making electoral system changes: idealism, the seeking of political advantage, and the need to deal with faulty electoral system arrangements.
From an early date there were some Australians concerned to explore the possibility that a better system than First Past the Post might be devised. Prominent in this were Catherine Helen Spence of South Australia, and the Tasmanian lawyer and politician, Andrew Inglis Clark. Both were impressed by Proportional Representation, devised in Britain by Thomas Hare in the mid-nineteenth century. Spence called Proportional Representation ‘effective voting’, seeing it as guaranteeing that all important minority voices could gain representation
2

Australian electoral systems
in a national or regional legislature.2 Clark pushed for the use of Proportional Representation in Tasmania, and the Hare invention was used in the Hobart and Launceston electorates in the 1897 and 1900 elections.3 After reverting briefly to First Past the Post, in 1907 the Tasmanian Parliament introduced what became known as the ‘Hare-Clark’ system (South Australians called it ‘Hare-Spence’), and it has been used ever since (for Hare-Clark, see pp. 20–5). Spence and Clark’s work has been the major instance of idealism prevailing in the introduction of an electoral system in Australia.
The more usual motivation for electoral system change has been political calculation—which could be motivated by a desire to protect or boost one’s own position, or to inflict damage upon one’s opponents.4 Such was the conservative parties’ main reason for introducing Preferential Voting prior to the 1919 Commonwealth election, and ALP governments sponsoring Optional Preferential Voting in New South Wales and Queensland.5
Some electoral changes have been made because of problems with existing systems, something that has occurred twice in relation to Senate elections. The Block Vote used in Senate elections from 1903 to 1919, and Preferential Voting used from 1919 and until 1949, both awarded a disproportionate number of seats to the party that gained a majority of a state’s vote. Both were replaced in an effort to eradicate this problem.
For the current systems in use in Australia, see Appendix 2. These show that four systems are currently in use in Australia. Two are variants of Preferential Voting and two are variants of the Single Transferable Vote example of Proportional Representation, all of which are discussed in the pages that follow.
Preferential Voting Preferential Voting, the voting system known in the United Kingdom as the ‘Alternative Vote’ and in the USA as ‘Instant Run-off Voting’, is widely used for Australian lower house elections. With Fiji and Papua New Guinea (the latter from 2007), Australia is one of only three nations to use this system for national elections. Some Australian elections use full Preferential Voting, some use optional Preferential Voting.
2. Susan Magarey, Unbridling the Tongues of Women: A Biography of Catherine Helen Spence,
Hale & Iremonger, Sydney, 1985, p. 144.
3. Scott Bennett, ‘‘These New Fangled Ideas’: Hare-Clark 1896–1901’, in Marcus Haward and James Warden (eds), An Australian Democrat: The Life, Work, and Consequences of Andrew Inglis Clark, Centre for Tasmanian Historical Studies, University of Tasmania, Hobart, pp. 145–62.
4. J. F. H. Wright, Mirror of the Nation's Mind: Australia’s Electoral Experiments, Hale & Iremonger, Sydney, 1980, p. 55.
5. James Jupp and Marian Sawer, ‘Political parties, partisanship and electoral governance’, in Marian Sawer (ed.), Elections: Full, Free & Fair’, Federation Press, Sydney, 2001, p. 218.
3
Australian electoral systems
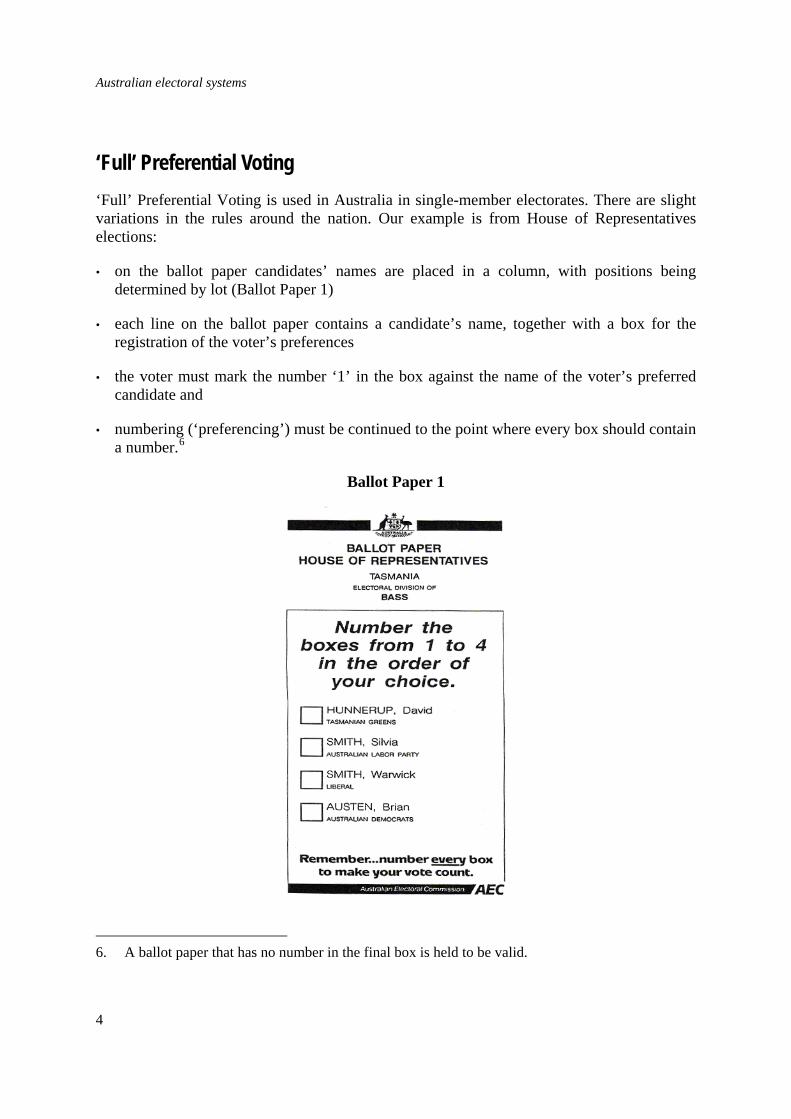
‘Full’ Preferential Voting ‘Full’ Preferential Voting is used in Australia in single-member electorates. There are slight variations in the rules around the nation. Our example is from House of Representatives elections:
• on the ballot paper candidates’ names are placed in a column, with positions being determined by lot (Ballot Paper 1)
• each line on the ballot paper contains a candidate’s name, together with a box for the registration of the voter’s preferences
• the voter must mark the number ‘1’ in the box against the name of the voter’s preferred candidate and
• numbering (‘preferencing’) must be continued to the point where every box should contain a number.6
Ballot Paper 1
6. A ballot paper that has no number in the final box is held to be valid.
4

Australian electoral systems
A single count
If a candidate receives more than 50 per cent of the number 1 votes (the ‘first preferences’), that candidate is declared elected. This occurred in the Commonwealth electorate of Bradfield (NSW) in 2004 (Election Result 2).
Election Result 2: Bradfield (House of Representatives) 2004 [One to be elected]
Candidates First and final count Nelson (Lib) 51 356 (63.6%) Neelam (ALP) 16 735 (20.7%) Goodwill (Grn) 9 249 (11.5%) Tsoulos (AD) 1 971 (2.4%) Montgomery (FF) 1 459 (1.8%) Total 80 770 Nelson elected
Source: Australian Electoral Commission, http://www.aec.gov.au/ accessed on 8 August 2007
More than one count
However, in many cases no candidate receives more than 50 per cent of first preferences. In 2004, 61 House of Representatives electorates (40.7 per cent) were not decided on the first count. If this occurs in an electorate the following procedure is followed:
• the candidate with fewest votes is excluded from the count
• this candidate’s votes are transferred to other candidates according to the second preferences shown on the excluded candidate’s papers and
• if this still does not produce a candidate with over half of the vote, other candidates are progressively excluded, and second or later preferences distributed until one candidate has more than half of the total number of votes.
An example of a full count was the by-election for the House of Representatives electorate of Corangamite in 1918—this was the first use of this electoral system in Australia (Election Result 3).
5

Australian electoral systems
Election Result 3: Corangamite, by-election (House of Representatives) 1918 [One to be elected]
Candidates First count Second count
(Leaper excluded)
Third count (Coldham excluded)
Fourth and final count (Knox
excluded) Scullin (ALP) 10 630 (42.5%) 10 732 (42.9%) 10 767 (43.0%) 10 944 (43.7%)
Gibson (VFU) 6 604 (26.4%) 6 814 (27.2%) 7 418 (29.6%) 14 096 (56.3%)
Knox (Nat) 5 737 (22.9%) 6 208 (24.8%) 6 855 (27.4%)
Coldham (Ind Nat) 1 174 (4.7%) 1 286 (5.1%)
Leaper (RSN) 895 (3.6%)
Total 25 040 25 040 25 040 25 040
Gibson elected
Source: Psephos: Adam Carr’s Election Archives, http://psephos.adam-carr.net/countries/a/australia/1917/1917repsby.txt, accessed on 9 August 2007
Once it was established in the Corangamite count that no candidate had gained over 50 per cent of the vote, the ‘distribution of preferences’ began:
• in the second count the candidate with the lowest number of first preference votes (Leaper) was eliminated, and his 895 second preferences were distributed to the other candidates
• the third count saw Coldham eliminated, with his 1286 preferences being distributed to the remaining candidates and
• the same occurred in the fourth and final count, when Knox’s 6855 preferences were distributed and Gibson won the seat comfortably, having obtained 97.4 per cent of Knox’s preferences.
Gibson thus received 56.3 per cent of the vote after the distribution of preferences. His votes were made up of his original 6604 first preferences, plus 7492 preferences from excluded candidates.
The political impact of ‘full’ Preferential Voting
Favouring the major parties
To win a House of Representatives seat a candidate needs to gain one vote more than 50 per cent of the vote which can be just first preference votes, or a combination of first preferences and preferences gained from other candidates. Therein lies a major difficulty for the minor parties that is a consequence of the use of Preferential Voting for lower house elections.
6

Australian electoral systems
Preferential Voting—whether ‘full’ or Optional—gives a disproportionate advantage to the major parties, primarily because of the size of the vote needed to challenge for a seat. A major factor in this has been the ongoing electoral strength of the Coalition parties and the ALP. Occasionally, a prominent minor party candidate may appear to have a chance of winning a seat, but invariably such candidates fail. Former Australian Democrats Senate leader, Janine Haines, was thought to have a good chance of winning Kingston (SA) in 1990. Haines did remarkably well to gain 26.4 per cent of first preferences, but was still excluded on the second-last count. In the 1998 election Pauline Hanson MP, of Pauline Hanson’s One Nation, gained 36 per cent of first preferences in Blair (Qld), but still fell short of victory due to no candidate giving her their second preferences. If such well-known candidates fail, lesser-known candidates are unlikely to succeed.
To be a factor in a House of Representatives contest, a minor party needs to be in the final count, but this is very hard to achieve because minor party candidates have difficulty in gaining even one-quarter of first preferences. In its heyday the highest Democratic Labor Party individual vote was only 30.7 per cent (Scullin 1955), whereas the Australian Democrats managed only two general election votes in excess of 20 per cent (Kingston, Mayo 1990). The best Green effort to date has been the 23 per cent in the 2002 Cunningham by-election, a result aided by the Liberal Party not nominating a candidate. In a general election the best Australian Greens result has been 21.6 per cent (Sydney 2004). By contrast, even in the worst post-war effort by the major parties (1998), between them they still managed to secure 79.8 per cent of all first preferences, a figure which did not leave much electoral space for minor parties or independents.
The major parties have thus won 99.4 per cent of all House of Representatives contests held in the 23 Commonwealth elections since 1949. No seat has been won by a minor party candidate, despite three reasonably strong minor parties—the Democratic Labor Party, the Australian Democrats and the Australian Greens—contesting elections. The exceptions have been the occasional popular local independent, such as Peter Andren, MP for Calare from 1996 until 2007. Candidates such as Andren can succeed if the major party vote is modest and if they gain the lion’s share of second preferences from other candidates. In fact, in Andren’s first victory (1996) he won despite gaining only 29.4 per cent of first preferences, but scooping the pool of second preferences.
The ‘wrong’ result
A problem with elections conducted in single-member electorates is that occasionally it is possible for a party to receive a majority of first preferences across all electorates yet fail to win government. A party can have many of its votes ‘locked up’ in safe seats, while its main opponent(s) may have votes spread much more evenly across the electoral map. In 1990 the Labor Government, with only 39.4 per cent of first preferences, retained government despite its vote being 3.8 per cent behind the Coalition parties’ combined vote. Eight years later the story was reversed, with Labor’s vote margin over the Coalition of almost one per cent being insufficient to propel it into government.
7

Australian electoral systems
The ‘winner’s bonus’
It might be supposed that a 50 per cent national vote won by a party should return it about half of the parliamentary seats being contested. In fact, majority systems used in single-member electorates are likely to award a disproportionate number of parliamentary seats to the largest vote-winner—the so-called ‘winner’s bonus’. In 1996, for example, the Coalition gained two-thirds of the seats, yet its first preference vote was less than 50 per cent. House of Representatives contests quite often illustrate this phenomenon, as can be seen in Table 1.
Table 1: The ‘winner’s bonus’ (%)
Winning party/coalition–
proportion of first preference vote
Winning party/coalition–proportion of House of Representatives seats ‘Winner’s bonus’
1993 44.9 54.4 9.5 1996 47.3 63.5 16.2 1998 39.2 54.1 14.9 2001 43.0 54.7 11.7 2004 46.4 57.3 10.9
Source: Australian Electoral Commission, http://www.aec.gov.au/ accessed on 9 August 2007
Three-cornered contests
In the early years after Federation, when First Past the Post was being used, Labor candidates were sometimes helped to victory by a split non-Labor vote. A by-election for the Commonwealth electorate of Swan in 1918, where a Labor candidate (34.4 per cent) defeated candidates from the Country (31.4 per cent) and Nationalist parties (29.6 per cent), galvanised non-Labor forces in the national parliament. Preferential Voting was introduced for House of Representatives elections in time for a by-election seven weeks after the Swan contest.7 In addition, the legislation included a requirement to fill every square on a ballot paper (‘full’ Preferential Voting). This was introduced quite deliberately because it would force voters to allocate second preferences. The anti-Labor forces believed that Nationalist voters were highly likely to give second preferences to the new farmers’ parties—and vice versa. The chances of blocking Labor candidates would thus be greater than if voters were permitted to give as few (or as many) preferences as they chose. This expectation was immediately realised in the Corangamite by-election as we have seen (see pp. 8–9).
In recent years, conservative party three-cornered contests have fallen into disfavour, and are often a sign of the Liberals and Nationals failing to agree on which party should contest a particular electorate. There is no doubt, though, that such contests can occasionally push a seat away from a Labor to either a Liberal or National (Country) candidate, as in the three- 7. B. D. Graham, ‘The choice of voting methods in federal politics, 1902–1918’, in C. A. Hughes
(ed.), Readings in Australian Government, University of Queensland Press, St Lucia, 1968, pp. 208–11.
8

Australian electoral systems
cornered contest in Riverina (NSW) in 1980. In this contest the ALP first preference vote of 46.9 per cent was insufficiently high to counter the combined National Country Party (NCP) and Liberal vote of 50 per cent, which produced a 93.1 per cent flow of preferences from the Liberal to the NCP candidate, Noel Hicks. These preferences pushed Hicks over the line (Election Result 4).
Election Result 4: Riverina (House of Representatives) 1980 [One to be elected]
Candidates First count Second count (Martin excluded)
Third count (Newman excluded)
Fourth and final count (Thornton
excluded) Smith (ALP) 30 698 (46.9%) 30 818 (47.1%) 31 564 (48.3%) 32 341 (49.5%) Hicks (NCP) 21 663 (33.1%) 21 894 (33.5%) 22 525 (34.4%) 33 055 (50.5%) Thornton (Lib) 11 072 (16.9%) 11 116 (17.0%) 11 307 (17.3 %) Newman (AD) 1 414 (2.2%) 1 568 (2.4%) Martin (Ind) 549 (0.8%) Total 65 396 65 396 65 396 65 396 Hicks elected
Source: Psephos: Adam Carr’s Election Archives, http://psephos.adam-carr.net/countries/a/australia/1980/1980repsnsw.txt, accessed 9 February 2007
Three-cornered contests are traditionally associated with the two major non-Labor parties. In the 1998 election the importance of Pauline Hanson’s One Nation Party in helping some Coalition candidates win their seats shows that the effect can be seen in other pairings from time to time. ALP and Green votes have also worked in this way as in the electorate of Melbourne Ports in 2004, when the Labor vote (39.3 per cent) and Green vote (14.1 per cent) together pushed Labor’s Michael Danby ahead of the Liberal candidate who had led on first preferences (42.9 per cent).
Controlling the voter—the importance of how-to-vote cards
Political parties seek to exert as much control as they can over voters—in Australia the how-to-vote card is symptomatic of this. The negotiation for, and argument over, preferences prior to polling day is a recognition of the importance parties place in attempting to control the voters’ behaviour. For example, the possibility of a successful three-cornered contest is strengthened not only by the requirement to fill out every square on the ballot paper, but also by the preparedness of many voters to follow their chosen party’s how-to-vote cards. The aim of the Democratic Labor Party (DLP) in the 1950s and 1960s of keeping the ALP from office was dependent not only on the splinter party gaining a reasonably healthy vote, but also on their voters being prepared to follow their cards which invariably put Labor behind the
9

Australian electoral systems
Coalition.8 In the example of the three-cornered contest given above, the National candidate turned the election around on the final count, when he gained 92.8 per cent of the preferences in the Liberal candidate’s pile of 11 307 ballot papers.
Optional Preferential Voting For many years the Labor Party thus was disadvantaged by the requirement that voters give a full set of preferences in House of Representatives and various state elections. This was particularly so during the 1950s and 1960s when Labor was hurt by the impact of DLP preferences. The ALP’s response came in two stages. For some time the party’s platform called for the reinstatement of the First Past the Post system that had been used for House of Representatives elections from 1901 until 1918—and in Queensland Legislative Assembly elections as late as 1961. However, this was a legislative change that Labor never introduced. The party later shifted its stance to accept the continuation of ‘full’ Preferential Voting, but pushed for voters to be allowed to allocate as many (or as few) preferences as they liked—what is generally called Optional Preferential Voting. A limited form of Optional Preferential Voting had been used for Tasmanian Legislative Council elections since 1907, and Labor governments introduced an unlimited model of Optional Preferential Voting for elections for the New South Wales (1979) and Queensland (1992) Legislative Assemblies—the model that is discussed in this paper.
In a Tasmanian Legislative Council limited Optional Preferential Voting election:
• if there are 2 or 3 candidates on the ballot paper, preferences must be given to each candidate
• but where there are more than 3 candidates, the voter is free to vote for as many of the remaining candidates as she or he chooses.
By contrast, when voting in a New South Wales or Queensland Legislative Assembly unlimited Optional Preferential Voting election (Ballot paper 2) an elector may:
• vote for just for one candidate, leaving all other squares blank—sometimes called ‘plumping’
• give preferences to some, but not all, candidates or
• give preferences to all candidates, as in full preferential voting.
8. James Jupp, Australian Party Politics, Melbourne University Press, Melbourne, 1964, pp. 83–4.
10

Australian electoral systems
Ballot Paper 2
The procedure for the distribution of preferences in either unlimited or limited Optional Preferential Voting elections is identical to that used for ‘full’ Preferential Voting. However, when a particular ballot paper has no more preferences to distribute that paper is declared ‘exhausted’, and is removed from the count. In the electorate of Barron River in the 1998 Queensland election, 1901 votes eventually were declared exhausted (Election Result 5).
Election Result 5: Barron River (Queensland, Legislative Assembly) 1998 [One to be elected]
Candidates First count Second count
(Dimitriou excluded)
Third count (Golding excluded)
Fourth count (Walls excluded)
Fifth and Final count (Starr excluded)
Clark (ALP) 7 118 (35.2%) 7 209 (35.7%) 7 317 (36.3%) 8 100 (40.5%) 9 287 (50.6%)
Warwick (Lib) 6 050 (29.9%) 6 084 (30.1%) 6 124 (30.4%) 6 285 (31.4%) 9 057 (49.4%)
Starr (ON) 5 457 (27.0%) 5 485 (27.2%) 5 512 (27.4%) 5 604 (28.0%)
Walls (Grn) 1 037 (5.1%) 1 087 (5.4%) 1 196 (5.9%)
Golding (AD) 313 (1.6%) 327 (1.6%)
Dimitriou (Ind) 270 (1.3%)
Exhausted votes 0 53 96 256 1 901
Total votes remaining 20 245 20 192 20 149 19 989 18 344
Clark elected
Source: Queensland Electoral Commission, http://www.ecq.qld.gov.au/asp/index.asp, accessed on 9 August 2007
11

Australian electoral systems
The political impact of Optional Preferential Voting
Fewer votes
Unlike ‘full’ Preferential Voting where the winning candidate will eventually achieve an absolute majority of votes, under Optional Preferential Voting it is possible for a winning candidate to receive fewer than half of the votes left in the count. This is because some votes are ‘exhausted’, with no more preferences to distribute, and are removed from the count. In the example of Barron River given here (Election Result 5), although the winner (Clark) had gained over half of the votes remaining in the count when counting finished (50.6 per cent), she actually had fewer than half of the original total of formal votes, having received 9287 of the total number of 20 245 first preferences (45.9 per cent). It can be argued that Optional Preferential Voting reduces the importance of the majority that is evident in ‘full’ Preferential Voting.
Lessening the importance of preferences
In the Queensland elections of 2004 and 2007 the Labor Party asked its supporters to ‘Just vote 1.’ In other words, Labor voters were asked to give the party their first preference, with no preferences given to any other candidate. In seeking to take advantage of the optional aspect of preference allocation in this way, Labor sought to minimise the impact of an exchange of preferences that might hurt the Beattie Government. As well as attempting to persuade its own voters to act in this way, it hoped that many One Nation voters would allocate just a single preference, because their second preferences were far more likely to be given to a Coalition than to a Labor candidate. The Coalition parties claimed that Labor’s tactic undermined the principle of voters being able to express preferences, but it seemed that many voters were happy to accept the party’s instruction.
Proportional Representation (Single Transferable Vote) Proportional Representation systems were devised to produce ‘proportional’ election results—parties should win parliamentary seats roughly in proportion to the size of their vote. Ideally, 50 per cent of the vote should win about 50 per cent of the seats. Proportional Representation is not a single method of election, for there are a number of variations in use, including the Single Transferable Vote, two variants of which are used in Australia. One is used in Senate elections, and the Hare-Clark version, referred to earlier, is used for elections to the Tasmanian House of Assembly and the ACT Legislative Assembly. The discussion below deals with each, illustrated by the 2004 Australian Senate election in Victoria (Election Result 6), and the 2006 Tasmanian House of Assembly election in the electorate of Denison (Election Result 7). The counting procedure for Proportional Representation is very
12
Australian electoral systems
complex—only an outline is given here. For a fuller description, see the paper written by Greg Gardiner of the Victorian Parliamentary Library.9
‘Senate’ Model
Electorates
Each state and territory acts as a single, multi-member electorate in Senate elections. In half-Senate elections six senators are elected from each state, and two from each territory. In full Senate elections, which follow a dissolution of both houses of the Parliament, 12 senators are elected from each state and two from each territory.
Ballot paper
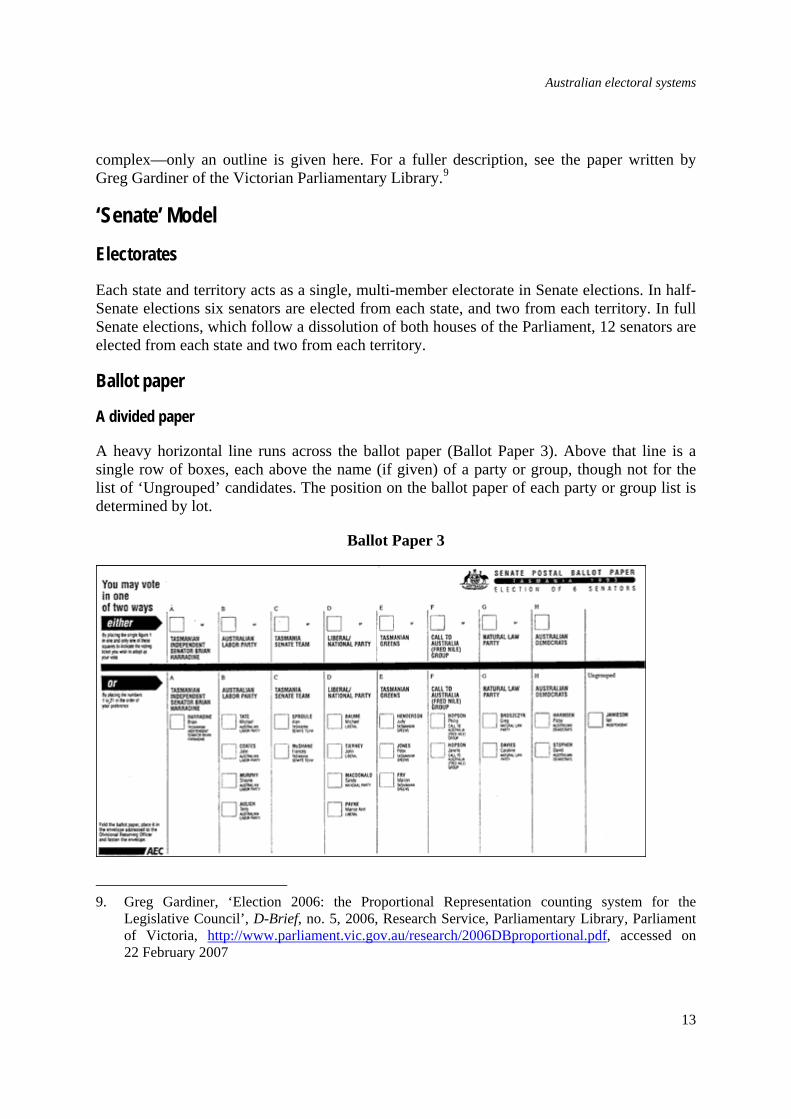
A divided paper
A heavy horizontal line runs across the ballot paper (Ballot Paper 3). Above that line is a single row of boxes, each above the name (if given) of a party or group, though not for the list of ‘Ungrouped’ candidates. The position on the ballot paper of each party or group list is determined by lot.
Ballot Paper 3
9. Greg Gardiner, ‘Election 2006: the Proportional Representation counting system for the
Legislative Council’, D-Brief, no. 5, 2006, Research Service, Parliamentary Library, Parliament of Victoria, http://www.parliament.vic.gov.au/research/2006DBproportional.pdf, accessed on 22 February 2007
13

Australian electoral systems
Lists
Below the line parties and groups list their candidates in separate vertical lists, headed by the party or group name—though here also a name is not required. Independent candidates are placed in an ‘Ungrouped’ list on the extreme right of the paper.
Voting
An elector is required to vote either above or below the line.
‘Above the line’ votes
If an elector chooses to vote above the line, the number ‘1’ must be placed in one of the boxes—all other boxes above the line must remain blank. Parties may submit a preferred order of voting (a Group Voting Ticket) to the Australian Electoral Commission which is displayed at all polling places. An above the line vote is dealt with by polling officials as if the voter had voted in the order of names on a Group Voting Ticket(s) issued by the party of their choice.10 During the count, preferences are allocated according to the order of names expressed by the party on a Group Voting Ticket.
‘Below the line’ votes
The elector can choose to vote below the horizontal line. If that option is taken the voter must fill out every square, with numbers running from 1 to the number equal to the total number of candidates on the ballot paper. Electors choosing to vote for an ungrouped candidate can vote only below the line.
Vote totals
Fifty-seven candidates in a total of 19 groups and eight ungrouped candidates were on the Victorian 2004 Senate election ballot paper. A total of 2 996 594 votes were cast. The party votes were as follows:
Party Vote (%) Liberal-Nationals (joint ticket) 44.1 ALP 36.1 Australian Greens 8.8 Family First 1.9 Other parties, groups and independents 9.1
Source: Australian Electoral Commission, http://www.aec.gov.au/ accessed on 9 August 2007
10. Parties are permitted to issue up to 3 Group Voting Tickets.
14

Australian electoral systems
The number of votes needed for a candidate to be elected (quota)
Senate candidates must secure a certain number of votes to be elected—a quota. To calculate the quota for a particular election, the total number of formal votes cast is divided by the number of candidates to be elected plus 1, and 1 is added to the result.
In our Victorian example 2 996 594 formal ballot papers were cast, from which six senators were to be elected:
Total formal votes Candidates to be elected + 1
2 996 594 = 428 084 (6 + 1)
One is added to the result 428 084 + 1
The result is the ‘quota’ (the number of votes each candidate needs to secure to be elected)
428 085
In this example, where six Senators were to be elected, the quota of 428 085 votes could be achieved by six candidates only.
The percentage of the vote needed to win a Senate seat varies according to the number of senators to be elected (Table 2).
Table 2: Quotas
Type of election Number to be elected Quota (%) Half-Senate (state) 6 14.3 Senate (territory) 2 33.3 Senate double dissolution (state) 12 7.7
The Count 11
After the counting of first preference votes, any candidate who has achieved a quota is declared elected. In elections for state senators the first candidates on each of the Liberal/Coalition and the Labor lists are invariably declared elected after this first count—these candidates are then removed from the count. In the Victoria 2004 example, Michael Ronaldson (Lib) and Kim Carr (ALP) both exceeded the quota after the count of first preferences and were declared elected (Election Result 6, Count 1).
Election Result 6: Victoria (Senate) 2004 [Six to be elected] 11. For the full details of all stages of this count from the 2004 election, see the Australian Electoral
Commission website, http://results.aec.gov.au/12246/results/External/SenateStateDop-12246-VIC.pdf, accessed on 13 April 2007.
15

Australian electoral systems
Votes 2 996 594 Quota 428 085 Count 1 Ronaldson Lib 1 318 539 1st elected Carr ALP 1 078 972 2nd elected McGauran Nat 1190 Conroy ALP 780 Troeth Lib 829 Fielding FF 55 551 Risstrom Grn 260 554 57 other candidates 280 179 Count 2 890 454 surplus votes of Ronaldson distributed McGauran Nat 890 655 3rd elected Conroy ALP 796 Troeth Lib 1436 Fielding FF 55 587 Risstrom Grn 260 554 59 other candidates 280 445 Exhausted votes 8 Loss by fraction 21 Count 3 650 887 surplus votes of Carr distributed Conroy ALP 650 968 4th elected Troeth Lib 1440 Fielding FF 55 599 Risstrom Grn 260 747 59 other candidates 280 951 Exhausted votes 18 Loss by fraction 46 Count 4 462 570 surplus votes of McGauran distributed Troeth Lib 463 771 5th elected Fielding FF 56 615 Risstrom Grn 260 761 59 other candidates 281 141 Exhausted votes 18 Loss by fraction 65 Counts 5-285 222 883 surplus votes of Conroy distributed
35 686 surplus votes of Troeth distributed
58 candidates excluded, their preferences distributed Fielding FFP 540 022 6th elected Risstrom Grn 314 734 remained in count
Source: Australian Electoral Commission, http://www.aec.gov.au/ accessed on 9 August 2007
Surplus votes
Elected candidates who gain more votes than the quota are said to have a ‘surplus’ number of votes. The surplus of each successful candidate’s votes is transferred, according to the second preferences shown on the ballot papers, to continuing candidates. In the Victoria 2004 example, Ronaldson gained 1 381 539 votes. His surplus was the total of his first preferences minus the quota: 1 318 539 – 428 085 = 890 454 surplus votes
16

Australian electoral systems
Transfer value
Which of Ronaldson’s votes were transferred? Because it is impossible to specify which votes actually elected Ronaldson, and which were surplus to that outcome, some distribution method is needed. Senate electoral arrangements originally had a random transfer of ‘surplus’ votes. In the 2004 Victoria example, a random sample of 890 454 of the 1 318 539 ballot papers would have been made. However, it was eventually realised that a potential problem was the fact that in a close election different random selections could produce different results. It has been claimed that the election of Neville Bonner (Lib) as a Queensland senator ahead of Mal Colston (ALP) in 1974 was the result of random sampling, which might have produced a Colston success had a different sample been selected.12
A simpler, fairer and uncontroversial method is to look at the second preferences of all of Ronaldson’s 1 318 539 papers, count the number of second preferences given to each candidate, and give the candidates 890 454 / 1 318 539 of the second preference votes allocated to each. The fraction enables those counting the vote to ascertain what is called the ‘transfer value’:
transfer value = candidate’s surplus votes candidate’s first preference votes
The result is taken to the eighth decimal point, without rounding.
The transfer value of Ronaldson’s preferences therefore was established by dividing his surplus by the total of his first preferences:
890 454 1 318 539 = 0.67533383
In the Victorian contest, therefore, 890 454 ‘surplus’ Ronaldson votes were distributed by a series of such calculations. Because so many voters followed the Coalition Group Voting Ticket the second candidate on the ticket, Julian McGauran, secured 889 465 surplus votes and the remaining Coalition candidates shared another 748. In addition, 22 surplus votes went to Labor candidates, 40 to the Greens, 43 to the Family First Party and 114 were scattered among the other candidates. There were also some votes omitted from the count through ‘exhaustion’13 or ‘loss by fraction’.14 In gaining most of Ronaldson’s surplus, McGauran was pushed above the quota and was declared elected (Election Result 6, Count 2).
12. David M. Farrell and Ian McAllister, The Australian Electoral System: Origins, Variations and
Consequences, UNSW Press, Sydney, 2006, p. 64.
13. Filling every square on ballot papers can cause confusion for some voters with consequential errors in their numbering of votes. As an official attempt to lessen the impact of this, voters are permitted three such errors before their ballot paper is deemed to be informal. Such papers are ‘exhausted’ and put aside, but are included in the official figures.
17

Australian electoral systems
Successive counts saw Carr’s surplus votes distributed, electing Conroy (Election Result 6, Count 3), and McGauran’s surplus distributed, bringing about the election of Troeth (Election Result 6, Count 4).
Note that when each successful candidate was elected with surplus votes, a new transfer value was established and used to calculate to which candidates the relevant surplus votes were to be transferred.
Exclusion of candidates and distribution of their preferences
The process of transferring surplus votes from successful candidates proceeds either until all positions are filled—at which point the counting ceases—or until there are no more surplus votes to distribute. In a typical Senate election for state senators the combination of first preference plus surplus votes is very likely to see the election of five senators quite early in the count. As we have seen, in the 2004 Victoria example three Coalition senators (Ronaldson, McGauran, Troeth) and two ALP senators (Carr, Conroy) had been elected by the end of the fourth count.
When no more surplus votes remain to be distributed, but a seat (or seats) remains to be filled, the process takes on the appearance of a preferential voting distribution. Candidates with the fewest votes are gradually excluded from the count, and their preferences are distributed to remaining candidates, either until another candidate is elected—with surplus votes then needing to be distributed—or the final candidate is elected. If the latter, the counting is concluded.
The preferences of excluded candidates are transferred at full value, unlike ‘surplus’ transfers. As most of the excluded candidates will have very small total votes, many counts may be necessary before the process ends. In Victoria 2004 it was only on the 285th count that the final ALP candidate, Jacinta Collins, was excluded, and 230 995 of her 240 992 votes went to Steve Fielding (Family First) who was elected as the sixth Victorian senator. Of the 59 candidates who failed to gain election, only Eric Risstrom (Green) remained in the count.
The political impact of Proportional Representation (‘Senate’ model)
‘Safe’ seats
In the 2004 Senate election, 95.9 per cent of all Australian voters cast an ‘above-the-line’ vote and, hence, relied on a party Group Voting Ticket for the ordering of their preferences. In our example of Victoria 2004, 97.7 per cent voted above the line. With 28.6 per cent guaranteeing two seats for a party, the top two candidates in each of a Coalition and an ALP
14. Application of a transfer value will cause the loss of fractions of votes, the tally of which is also
included in the official figures.
18
Australian electoral systems
ticket are certain of election. As each party’s order of candidates’ names remains fixed, there is therefore no chance of either of these four candidates failing to be elected.
The minor parties
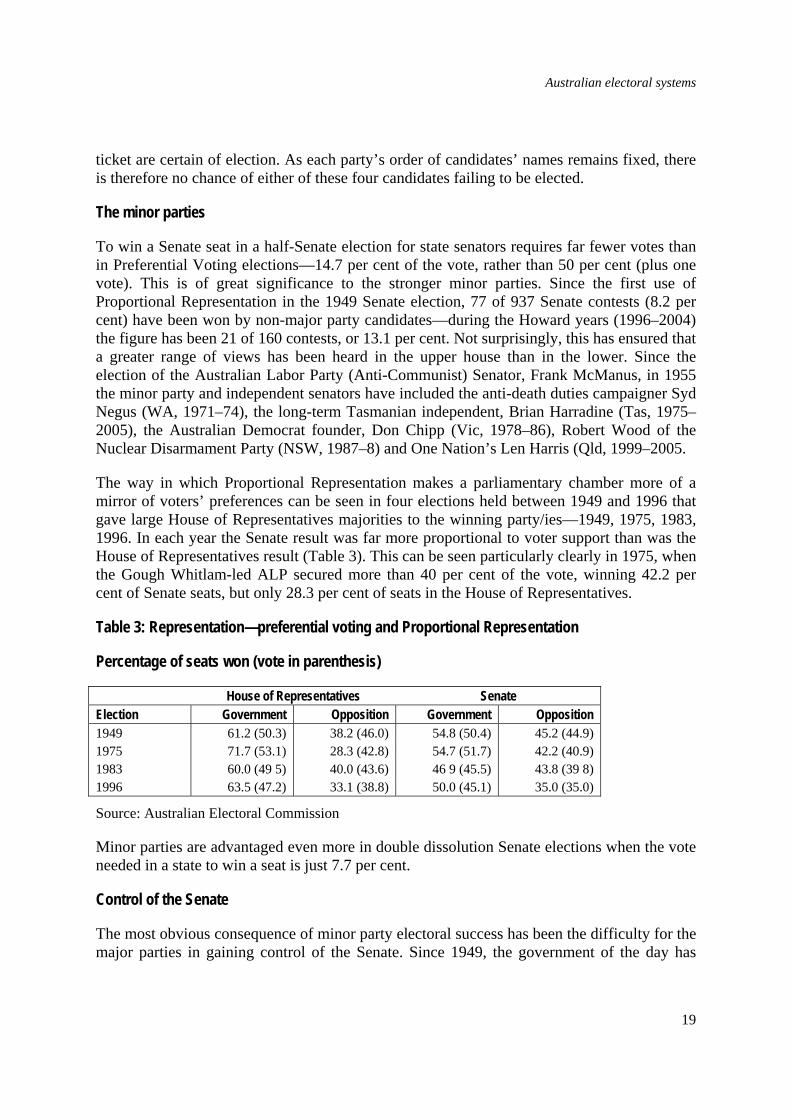
To win a Senate seat in a half-Senate election for state senators requires far fewer votes than in Preferential Voting elections—14.7 per cent of the vote, rather than 50 per cent (plus one vote). This is of great significance to the stronger minor parties. Since the first use of Proportional Representation in the 1949 Senate election, 77 of 937 Senate contests (8.2 per cent) have been won by non-major party candidates—during the Howard years (1996–2004) the figure has been 21 of 160 contests, or 13.1 per cent. Not surprisingly, this has ensured that a greater range of views has been heard in the upper house than in the lower. Since the election of the Australian Labor Party (Anti-Communist) Senator, Frank McManus, in 1955 the minor party and independent senators have included the anti-death duties campaigner Syd Negus (WA, 1971–74), the long-term Tasmanian independent, Brian Harradine (Tas, 1975–2005), the Australian Democrat founder, Don Chipp (Vic, 1978–86), Robert Wood of the Nuclear Disarmament Party (NSW, 1987–8) and One Nation’s Len Harris (Qld, 1999–2005.
The way in which Proportional Representation makes a parliamentary chamber more of a mirror of voters’ preferences can be seen in four elections held between 1949 and 1996 that gave large House of Representatives majorities to the winning party/ies—1949, 1975, 1983, 1996. In each year the Senate result was far more proportional to voter support than was the House of Representatives result (Table 3). This can be seen particularly clearly in 1975, when the Gough Whitlam-led ALP secured more than 40 per cent of the vote, winning 42.2 per cent of Senate seats, but only 28.3 per cent of seats in the House of Representatives.
Table 3: Representation—preferential voting and Proportional Representation
Percentage of seats won (vote in parenthesis)
House of Representatives Senate Election Government Opposition Government Opposition 1949 61.2 (50.3) 38.2 (46.0) 54.8 (50.4) 45.2 (44.9) 1975 71.7 (53.1) 28.3 (42.8) 54.7 (51.7) 42.2 (40.9) 1983 60.0 (49 5) 40.0 (43.6) 46 9 (45.5) 43.8 (39 8) 1996 63.5 (47.2) 33.1 (38.8) 50.0 (45.1) 35.0 (35.0)
Source: Australian Electoral Commission
Minor parties are advantaged even more in double dissolution Senate elections when the vote needed in a state to win a seat is just 7.7 per cent.
Control of the Senate
The most obvious consequence of minor party electoral success has been the difficulty for the major parties in gaining control of the Senate. Since 1949, the government of the day has
19

Australian electoral systems
controlled the Senate only during the years 1951–56, 1959–62, 1975–81 and since July 2005. When a government does not control the Senate, it soon realises that in such a scenario the Australian Senate joins the US Senate as one of the most powerful of the world’s upper houses. When a government does control the Senate, however, observers are reminded that the Senate power is a matter of potential rather than reality.15
Hare-Clark model The Hare-Clark method is used for House of Assembly elections in Tasmania and for the ACT Legislative Assembly. We have seen that it has been used in Tasmania since the election of 1909, giving it the longest continuous history of any parliamentary electoral system used in Australia.
Electorates
Tasmania has always had five House of Assembly electorates under the Hare-Clark system. Five MPs are elected from each. The ACT has one seven-member electorate and two five-member electorates.
Ballot paper
The Hare-Clark ballot paper does not have the horizontal line seen on the Senate ballot paper (Ballot papers 4a, 4b). Party candidates are placed in separate vertical groups, with ungrouped candidates included in a column to the right of the party groups.
A 1979 addition to the Tasmanian arrangements provided for the position of the names within each group to be altered by provisions of so-called ‘Robson rotation’ in which the names in each group are re-ordered from paper to paper, so as to reduce the impact of any advantageous ballot positions. Two examples from the 2004 election are shown, illustrating the shift of candidates’ names on the ballot paper.16
15. ‘Government’, in Year Book Australia 2007, Australian Bureau of Statistics, Canberra, 2007,
p. 71.
16. ‘Robson rotation’ is named after Neil Robson, the MP who devised the method for rotating candidates’ names.
20

Australian electoral systems
Ballot Paper 4 (a)
Ballot Paper (4b)
21

Australian electoral systems
Voting
In Tasmania a voter must mark preferences against at least five candidates, but may vote for more than five. Tasmanian electoral law forbids anyone from canvassing for votes, soliciting the vote of an elector, or attempting ‘to induce an elector not to vote for a particular candidate or particular candidates’ within 100 metres of a polling place.17 The consequence is that how-to-vote cards are nowhere to be seen on polling day for the Tasmanian House of Assembly.
The quota
The quota is calculated in the same way as for Senate elections. In Denison 2006 the calculation was as follows:
Total formal votes Candidates to be elected + 1
61 538 = 10 256 (5 + 1)
One is added to the result 10 256 + 1
The result is the ‘quota’ (the number of votes each candidate needs to secure to be elected)
10 257
The quota for Denison represented a vote of 16.7 per cent.
The count18
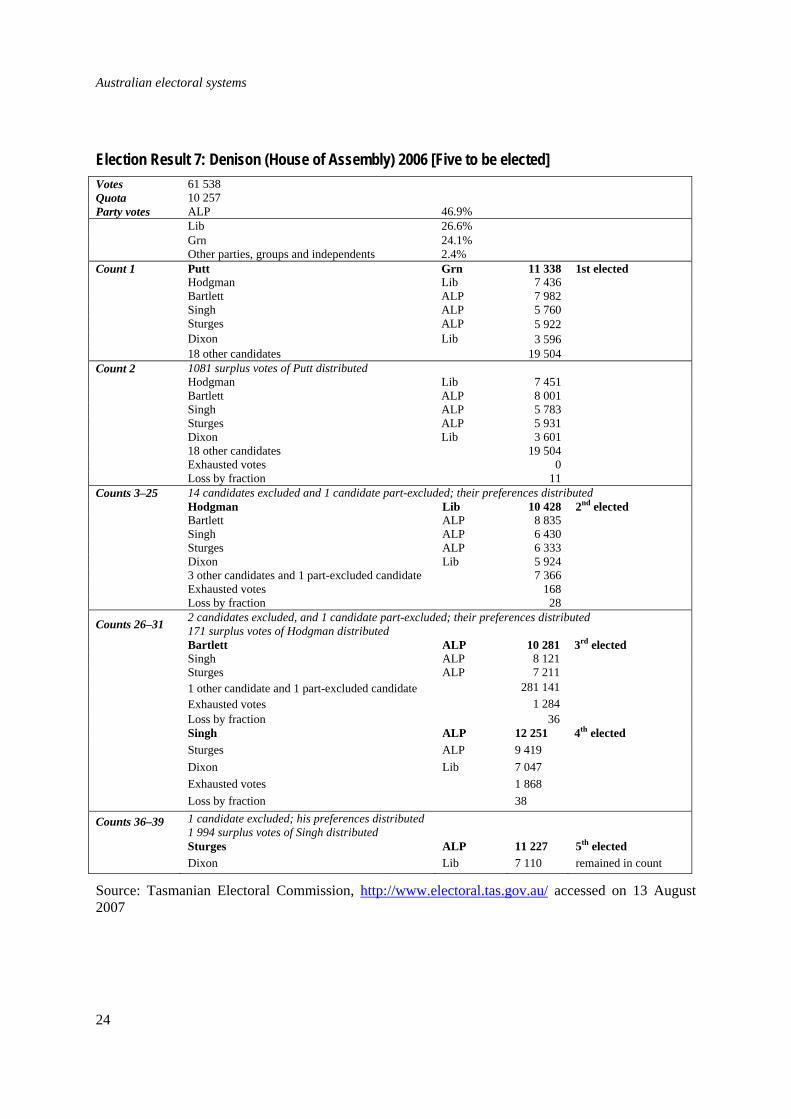
The counting of Hare-Clark elections is similar to the Senate (Election Result 7). With party tickets not applying, the process of electing MPs under Hare-Clark is far less predictable than in Senate elections.
It sometimes happens that the vote is spread so evenly that no candidate is elected on the first count (e.g. Bass, Lyons 1998). In Denison 2006, however, Peg Putt (Grn) was elected on first preferences (Election Result 7, Count 1), though her surplus votes were insufficient to help any other candidate over the line (Election Result 7, Count 2).
In fact, it took 23 more counts before the Liberals’ Michael Hodgman achieved a quota to be the second elected (Election Result 7, Count 25). Hodgman’s surplus distribution, plus more exclusions, saw the first Labor success with the election of David Bartlett (Election Result 7, Count 33). The count soon came to an end due to a combination of candidate exclusion and surplus redistribution, which saw Labor’s Lisa Singh (Election Result 7, Count 35) and
17. Electoral Act 2004 (Tas.), s. 177.
18. For the full details of all stages of the Denison 2006 count see the Tasmanian Electoral Commission website at http://www.electoral.tas.gov.au/pages/HouseMain.html, accessed on 13 April 2007.
22

Australian electoral systems
Graeme Sturges (Election Result 7, Count 39) being pushed over the line. Fabian Dixon (Lib) was the only candidate still in the count.
23
Australian electoral systems
Election Result 7: Denison (House of Assembly) 2006 [Five to be elected] Votes 61 538 Quota 10 257 Party votes ALP 46.9% Lib 26.6% Grn 24.1% Other parties, groups and independents 2.4% Count 1 Putt Grn 11 338 1st elected Hodgman Lib 7 436 Bartlett ALP 7 982 Singh ALP 5 760 Sturges ALP 5 922 Dixon Lib 3 596 18 other candidates 19 504 Count 2 1081 surplus votes of Putt distributed Hodgman Lib 7 451 Bartlett ALP 8 001 Singh ALP 5 783 Sturges ALP 5 931 Dixon Lib 3 601 18 other candidates 19 504 Exhausted votes 0 Loss by fraction 11 Counts 3–25 14 candidates excluded and 1 candidate part-excluded; their preferences distributed Hodgman Lib 10 428 2nd elected Bartlett ALP 8 835 Singh ALP 6 430 Sturges ALP 6 333 Dixon Lib 5 924 3 other candidates and 1 part-excluded candidate 7 366 Exhausted votes 168 Loss by fraction 28
Counts 26–31 2 candidates excluded, and 1 candidate part-excluded; their preferences distributed 171 surplus votes of Hodgman distributed
Bartlett ALP 10 281 3rd elected Singh ALP 8 121 Sturges ALP 7 211 1 other candidate and 1 part-excluded candidate 281 141 Exhausted votes 1 284 Loss by fraction 36 Singh ALP 12 251 4th elected Sturges ALP 9 419 Dixon Lib 7 047 Exhausted votes 1 868 Loss by fraction 38
Counts 36–39 1 candidate excluded; his preferences distributed 1 994 surplus votes of Singh distributed
Sturges ALP 11 227 5th elected Dixon Lib 7 110 remained in count
Source: Tasmanian Electoral Commission, http://www.electoral.tas.gov.au/ accessed on 13 August 2007
24

Australian electoral systems
The political impact of Proportional Representation (Hare-Clark)
Minority governments
Minority governments are much more common in Tasmania and the ACT than in jurisdictions where Preferential Voting is used. Seven Tasmanian governments since 1948 have lacked control of the House of Assembly, and the first four ACT elections after the achievement of self-government (1989) saw the return of minority governments.
Reduced party control
With Hare-Clark ballot papers lacking the ‘above-the-line’ provision of Senate elections, combined with an absence of how-to-vote cards and the rotation of party names, Hare-Clark voters are much freer to vote as they choose. The freedom that voters have can make Hare-Clark elections quite unpredictable at times. The count in the electorate of Bass in 1998, referred to above, was a case in point. There were 479 counts before the first MP gained election, and it took a total of 820 counts to see all five MPs confirmed.
No seat is safe
Party candidates are more vulnerable than in Senate elections, where we have seen how the combination of fixed-order party lists and above-the-line voting gives protection to particular candidates. In Tasmanian and ACT elections, however, parties may not rank their party lists and, hence, voters have much freedom to target a non-performing MP, even though they may continue to vote for that MP’s party: the system ‘provides no blue riband [sic] seats for complacent or tired party members’.19 In the 1979 Tasmanian election where the Labor government was returned with 54.3 per cent of the vote, and where the Premier’s vote was a record-breaking 51.2 per cent, an under-performing Minister lost his seat, against all expectations.20
Everyone is an opponent
The relative lack of safety for candidates is emphasised by the fact that individual candidates are fighting for votes not only from their party opponents, but also from members of their own party ticket. In fact some candidates will attempt to become associated with one part of their electorate, while others will work at canvassing the whole electorate, irrespective of whether they are ‘trespassing’ on the preserve of their colleagues. Some long-standing candidates can make it difficult for colleagues to develop a presence in the electorate. In the Denison contest given here (Election Result 7), the prominence of Peg Putt (Grn) and
19. W. A. Townsley, The Government of Tasmania, University of Queensland Press, St Lucia, 1976,
p. 27.
20. Scott Bennett, Affairs of State: Politics in the Australian States and Territories, Allen & Unwin, Sydney, 1992, pp. 160–1.
25

Australian electoral systems
Michael Hodgman (Lib) made it difficult for their party colleagues to gain a competitive number of votes. The votes of Labor’s trio of David Bartlett, Lisa Singh and Graeme Sturges were much more evenly spread than the votes for Liberal or Green candidates, and were sufficiently high for Labor to elect the third, fourth and final members for the seat.
Conclusion—electoral systems that suit Australia From time to time critics call for the removal of one of the four systems described here. For example, the ALP has long had doubts about Preferential Voting. In the 2006 Queensland state election Labor’s Gladstone candidate was bemused that he lost to the sitting member, despite leading her on first preferences, claiming that use of such a system ‘…makes it hard for the electorate to understand why she retains her seat when primary votes clearly show [that] I won.’21 The Queensland Nationals’ policy is for electoral systems to be consistent between state and Commonwealth jurisdictions, effectively a call for ‘full’ Preferential Voting to replace the Optional Preferential Voting used in Queensland state elections.22 Senator Andrew Bartlett of the Australian Democrats has called for the replacement of Preferential Voting for House of Representatives elections with a version of the Mixed Member Proportional system used in Germany and New Zealand.23 As the Greens became a force in Tasmania, calls were heard from various critics, including the Liberal Party, for the abolition of the Hare-Clark model of Proportional Representation.24 The journalist, David Barnett, has damned both Preferential Voting and Proportional Representation, claiming that both ‘… have long since ceased to deliver effective governments’ in Australia and therefore ‘should be scrapped.’25
However, despite such doubts being held, the four systems we have discussed appear to be widely accepted, and are not targets for widespread community frustration. When the Commonwealth Parliament’s Joint Standing Committee on Electoral Matters conducts enquiries after each Commonwealth election, there is generally little interest expressed in removing the actual electoral systems, though refinements of them are often suggested. When a significant change actually is made to Australian electoral arrangements, as in Victoria’s move to the ‘Senate’ model of Proportional Representation for its 2006 Legislative Council elections, essentially the lawmakers produce local variations on one of the four electoral systems described in this paper.
21. Lee McIvor, ‘Decision still days off’, Gladstone Observer, 12 September 2006.
22. The Nationals Queensland, The Nationals Policy Platform, 2007.
23. Andrew Bartlett, ‘A squeeze on the balance of power: using Senate “reform” to dilute democracy’, in Marian Sawer and Sarah Miskin (eds), Representation and Institutional Change: 50 years of Proportional Representation in the Senate, Australian National University and the Department of the Senate, Canberra, 1999, pp. 116–17.
24. L. Hedges, letter to Mercury (Hobart), 14 April 1990.
25. David Barnett, ‘Scrap subverted voting systems’, Canberra Times, 5 April 2007.
26

Australian electoral systems
It seems, therefore, that Australia has found electoral arrangements that suit the needs of its people, its parties and its parliamentarians.
27

Australian electoral systems
Appendix 1: Other voting systems used in Australia26
Plurality systems
First Past the Post
This was the electoral system first used in all Australian colonies. It was also used for House of Representatives elections from Federation until 1918. Each voter had a single vote, and the candidate with the highest number of votes won the seat, irrespective of the percentage of the votes.
Block Vote
This system was used for Senate elections between 1902 and 1919 and was essentially First Past the Post as adapted for multi-member electorates. The elector had as many votes as there were seats to be filled. As with First Past the Post the candidates with the highest votes were elected, irrespective of the percentage of the votes. There was a tendency for all of a state’s seats to be won by the same party, which was the major factor causing the Commonwealth Parliament to eventually abandon the system.
Cumulative Vote
This system is used to elect the Norfolk Island Legislative Assembly. Voters have the same number of votes as there are positions to fill—Norfolk Island voters have nine votes to elect the nine-person legislature. A voter may give one vote to each of nine candidates. On the other hand, the voter may give more than one vote to different candidates, though no more than two votes may be given to any one candidate. The nine candidates with the highest votes are elected, irrespective of percentage.
Majority systems
Contingent Vote
This system was used between 1892 and 1942 to elect Queensland Legislative Assembly MPs. Voters were required to rank candidates in order of preference. If no candidate received an absolute majority of first preference votes, then all but the two leading candidates were eliminated from the count, and the preferences of the eliminated candidates were distributed among the two remaining candidates.
26. See also Benjamin Reilly, ‘Preferential voting and its political consequences’, in Sawer, op. cit.,
passim.
28

Australian electoral systems
Second Ballot
This system was used for New South Wales Legislative Assembly elections from 1910 to 1918. What was essentially a First Past the Post election was conducted, with a candidate who received more than half the vote being declared elected. If no candidate received an absolute majority, a second ballot was held seven days after the poll (14–21 days in rural electorates) between the two candidates who received the highest votes. This system is used in East Timor presidential elections.
Preferential Voting (multi-member electorates)
Shortly after Preferential Voting was introduced for House of Representatives elections, it was introduced in 1919 for Senate elections. Candidates were placed vertically on the ballot paper, with voters able to vote for any candidate. The first Senate position was filled after a normal Preferential Voting count. With the successful candidate removed from the count, the same votes were reused for a second Preferential Voting count to fill the second position, and, after the second successful candidate was removed from the count, used for a third Preferential Voting count to fill the final seat. As with the Block Vote, one party tended to win all seats being contested. This system was last used for the Senate election of 1946.
Proportional systems
Proportional Representation (Single Transferable Vote – Hare Quota)
This first Australian version of Proportional Representation was limited to the two multi-member Tasmanian House of Assembly electorates of Hobart (6 members) and Launceston (4 Members). Introduced on a trial basis for the election of 1897, the system was used in the 1900 election as well. Candidates stood as individuals rather than in groups. Electors had to give preferences to at least half the number to be elected. The quota of votes needed for election was ascertained by dividing the formal vote by the number of seats to be filled—the so-called ‘Hare Quota’.
Proportional Representation (Party List)
Party List systems are used extensively in Europe, and such a system was used for South Australian Legislative Council elections between 1973 and 1981. Although candidates’ names were presented in separate group lists, voters could register a vote only for a party, rather than for an individual candidate.
Proportional Representation (List – Modified d'Hondt)
In 1989 and 1992 the Australian Capital Territory comprised one electorate for the first elections held after self-government had been achieved. The voting method—which was known as the ‘modified d’Hondt’ system—was a unique combination of aspects of the d’Hondt system (a European party list system of Proportional Representation), of the voting
29

Australian electoral systems
method used for the Senate, and of Preferential Voting. After much controversy, confusion among voters, and a failure to produce majority governments, the system was replaced by the Hare-Clark system for the 1995 election.
30
Australian electoral systems
31
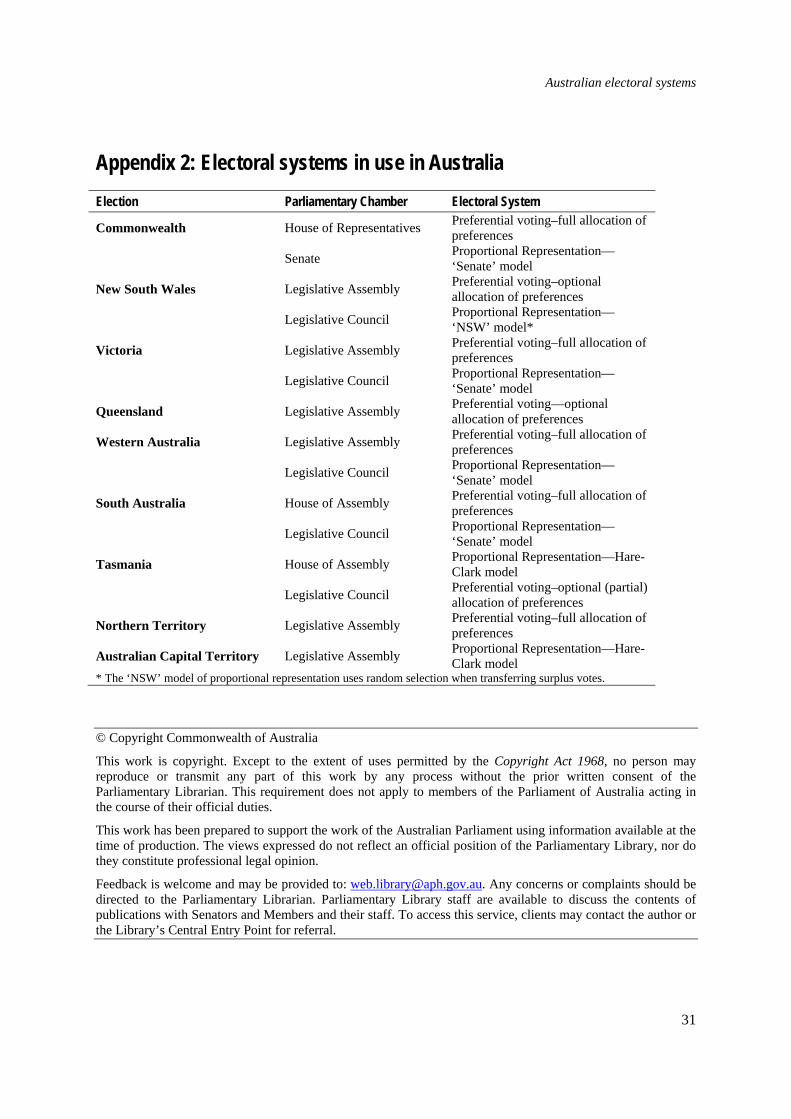
Appendix 2: Electoral systems in use in Australia Election Parliamentary Chamber Electoral System
Commonwealth House of Representatives Preferential voting–full allocation of preferences
Senate Proportional Representation—‘Senate’ model
New South Wales Legislative Assembly Preferential voting–optional allocation of preferences
Legislative Council Proportional Representation—‘NSW’ model*
Victoria Legislative Assembly Preferential voting–full allocation of preferences
Legislative Council Proportional Representation—‘Senate’ model
Queensland Legislative Assembly Preferential voting—optional allocation of preferences
Western Australia Legislative Assembly Preferential voting–full allocation of preferences
Legislative Council Proportional Representation—‘Senate’ model
South Australia House of Assembly Preferential voting–full allocation of preferences
Legislative Council Proportional Representation—‘Senate’ model
Tasmania House of Assembly Proportional Representation—Hare-Clark model
Legislative Council Preferential voting–optional (partial) allocation of preferences
Northern Territory Legislative Assembly Preferential voting–full allocation of preferences
Australian Capital Territory Legislative Assembly Proportional Representation—Hare-Clark model
* The ‘NSW’ model of proportional representation uses random selection when transferring surplus votes.
© Copyright Commonwealth of Australia
This work is copyright. Except to the extent of uses permitted by the Copyright Act 1968, no person may reproduce or transmit any part of this work by any process without the prior written consent of the Parliamentary Librarian. This requirement does not apply to members of the Parliament of Australia acting in the course of their official duties.
This work has been prepared to support the work of the Australian Parliament using information available at the time of production. The views expressed do not reflect an official position of the Parliamentary Library, nor do they constitute professional legal opinion.
Feedback is welcome and may be provided to: [email protected]. Any concerns or complaints should be directed to the Parliamentary Librarian. Parliamentary Library staff are available to discuss the contents of publications with Senators and Members and their staff. To access this service, clients may contact the author or the Library’s Central Entry Point for referral.