australian government ict trends report 2015-16
TRANSCRIPT
Australian Government ICT Trends Report
2015-16
Department of FinanceAustralian Government ICT Trends Report
2015-16
Contents1. Key Trends 4
2. Other Findings 8
3. ICT Spend 9
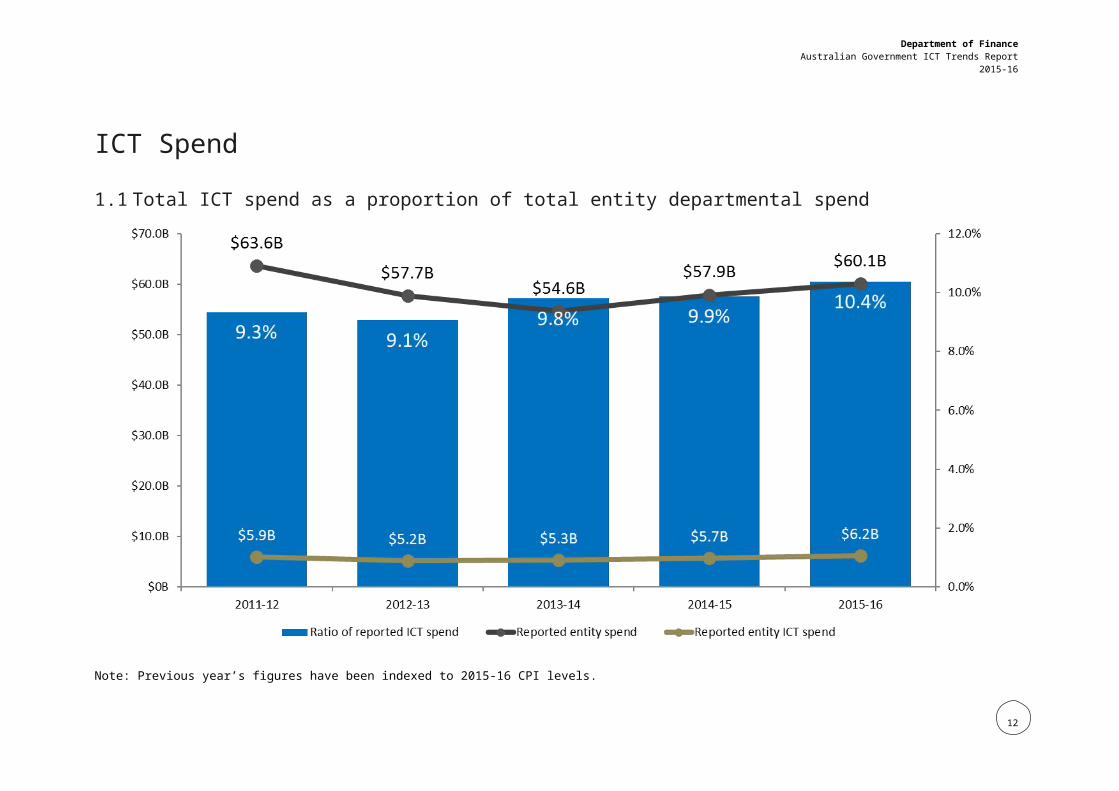
3.1 Total ICT spend as a proportion of total entity departmental spend 9
3.2 Ongoing and Project ICT spend as a proportion of Total ICT spend 10
3.3 Proportion of ICT spend by Run, Grow and Transform 11
3.4 Operating ICT spend versus capital ICT spend* 12
3.5 ICT spend by service group 13
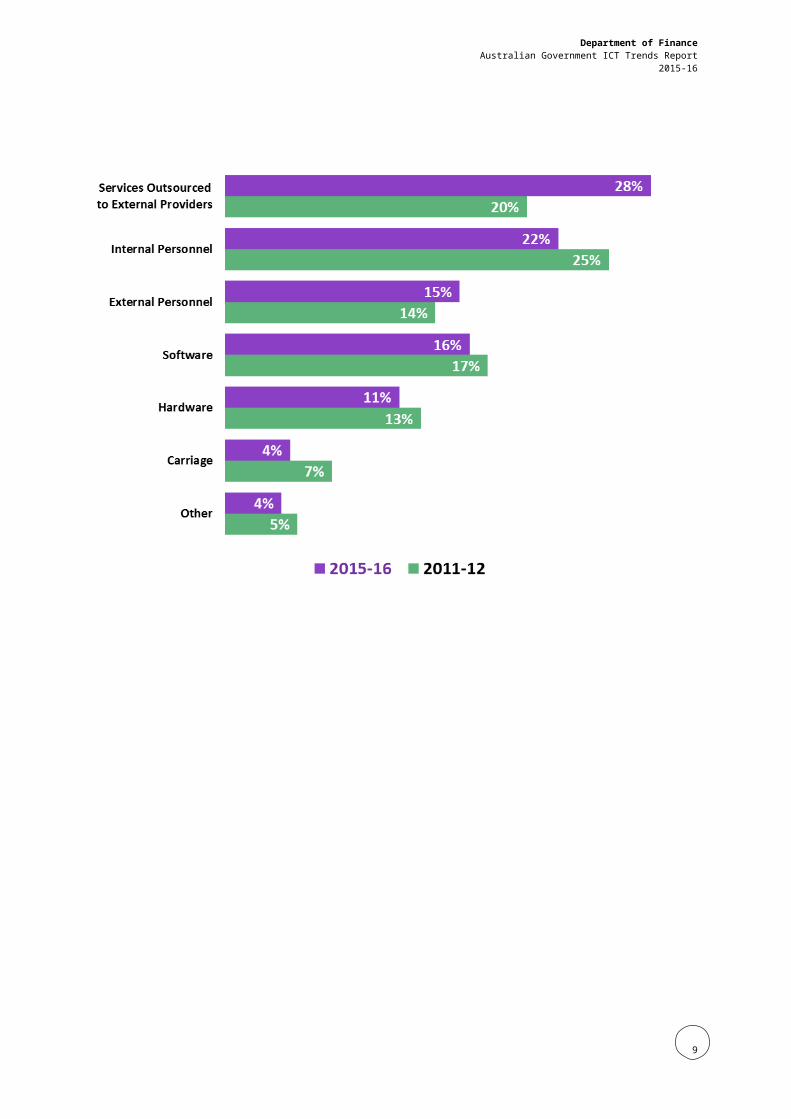
3.6 Proportion of ICT spend by cost element 14
3.7 Total spend and proportion of ICT spend on outsourced services 15
4. Major Applications 16
4.1 Proportion of major applications spend by Corporate and Business, 2015-16 16
4.2 Proportion of major applications spend by service domain, 2015-16 17
4.3 Proportion of major applications by age group, 2015-16 18
4.4 Average annual spend on major applications by type and age group, 2015-16 19
5. Infrastructure 20
5.1 End user devices – Mix of desktop, laptop, thin client and tablet devices, % of total 20
5.2 End user devices – Proportion of end user devices past planned useful life, 2015-16 21
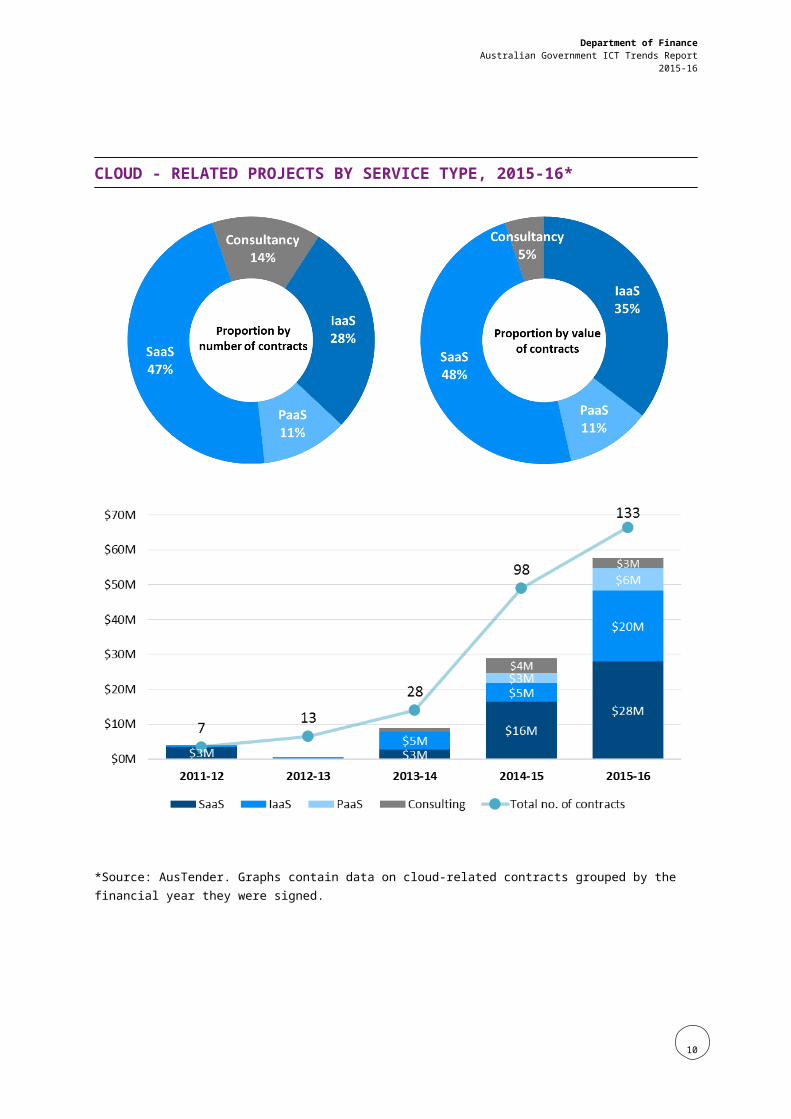
6. Cloud 22
6.1 Cloud-related contracts*: Total number and value 22
7. ICT FTE 23
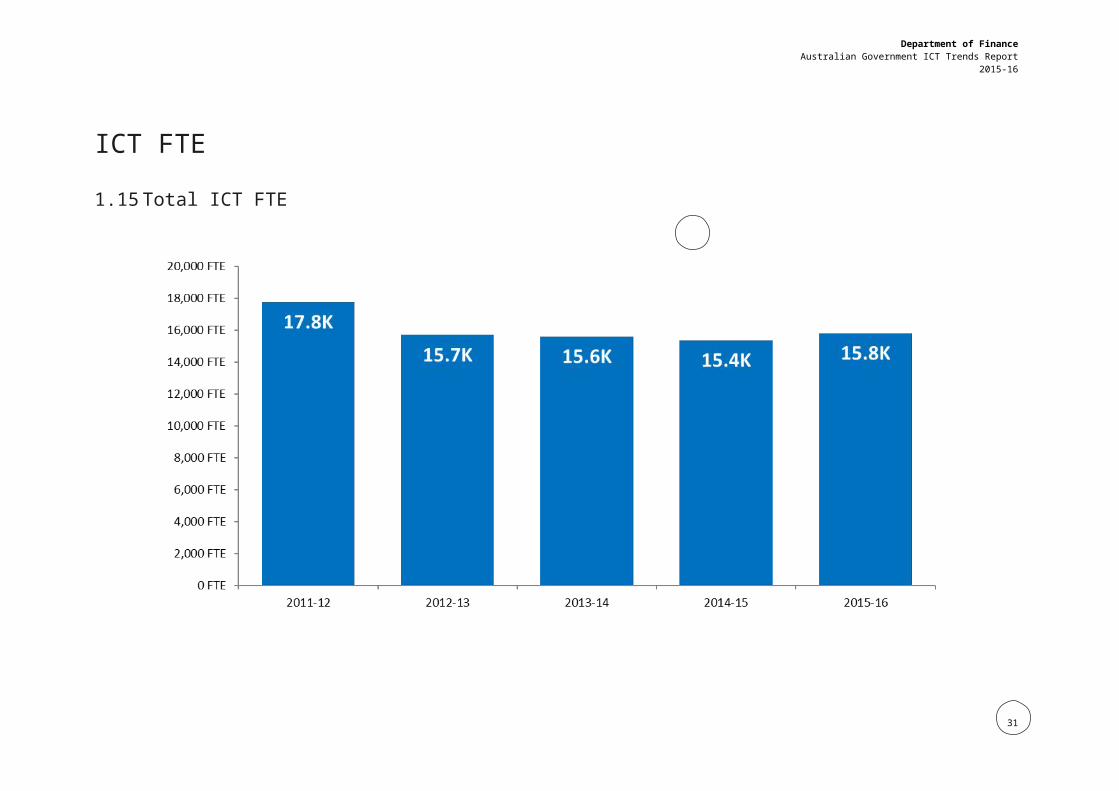
7.1 Total ICT FTE 23
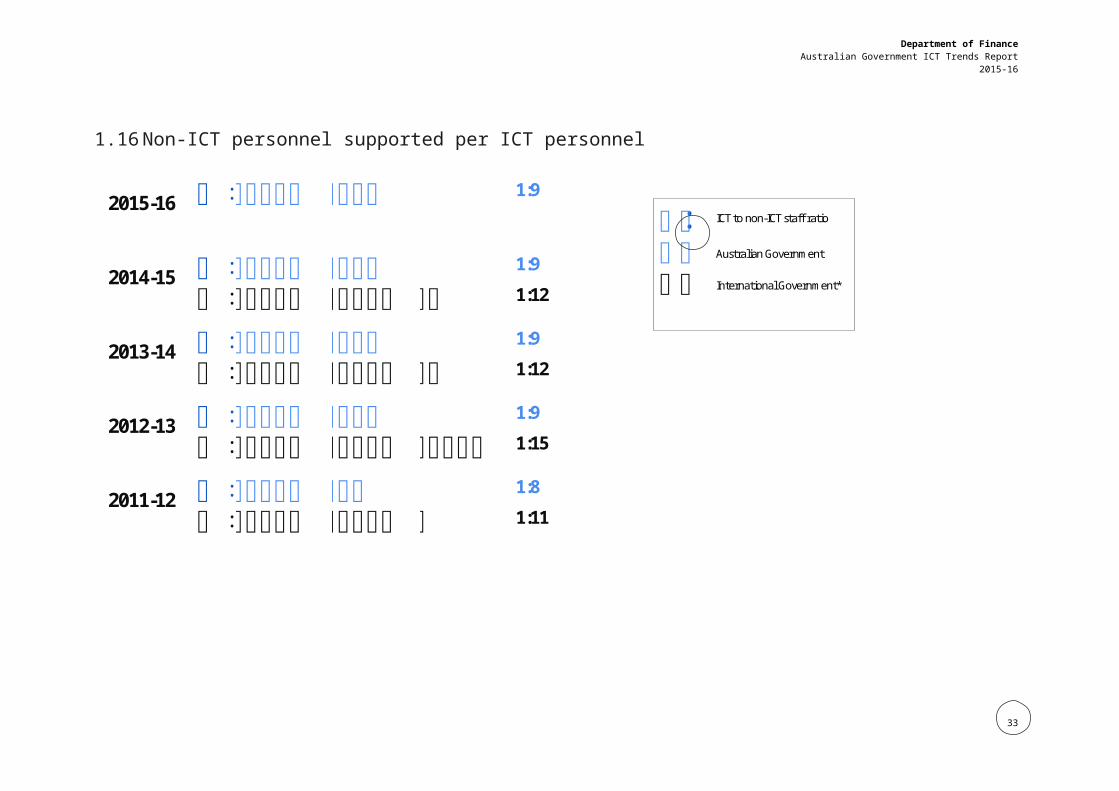
7.2 Non-ICT personnel supported per ICT personnel 24
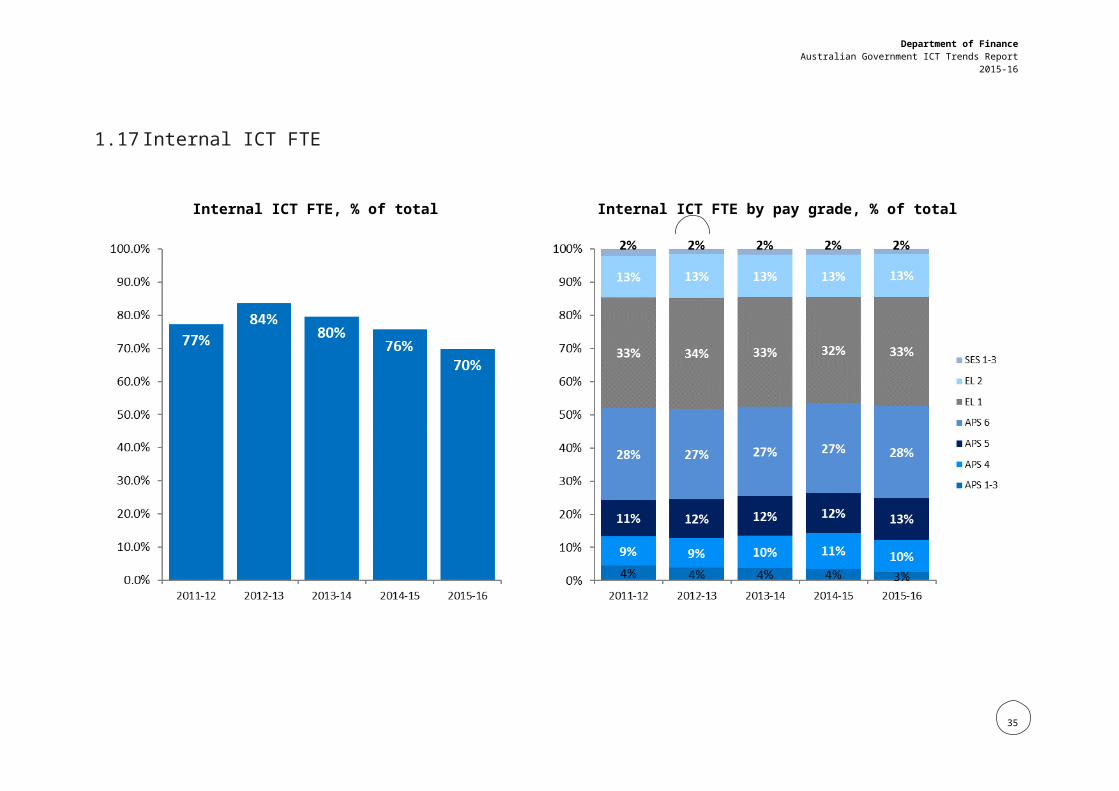
7.3 Internal ICT FTE 25
7.4 Internal ICT FTE vs. APS employees by pay grade 2015-2016 26
7.5 Internal and external ICT FTE by Ongoing and Project 27
7.6 Labour cost of internal and external ICT FTE 28
2
Department of FinanceAustralian Government ICT Trends Report
2015-16
8. Notes 29
8.1 Benchmarking objectives and purpose 29
8.2 Benchmarking data source 29
8.3 Applicable qualifications 29
8.4 Glossary 30
8.5 Definitions 30
8.6 Service Domains 31
3
Department of FinanceAustralian Government ICT Trends Report
2015-16
CopyrightThe Department of Finance is licensed to use, reproduce, adapt, modify, distribute and com-municate the information contained in this report.
With the exception of the Commonwealth Coat of Arms, and subject to any copyright notices contained in individual documents, all material presented in this report is provided under a Creative Commons Australia Licence (Attribution-NonCommercial 3.0 Unported) (http://creat-ivecommons.org/licenses/by-nc/3.0/).
To the extent that copyright subsists in a third party, permission will be required from the third party to reuse the material. The document must be attributed: “Australian Government ICT Trends Report 2015–16”.
Use of the Coat of Arms The terms under which the Coat of Arms can be used are detailed on the following website: http://www.itsanhonour.gov.au/coat-arms/.
Contact us Inquiries regarding the licence and any use of this data are welcome at:
Investment, Capability and Assurance BranchGovernance and APS TransformationDepartment of FinanceOne Canberra Avenue, Forrest ACT 2603 Email: [email protected]
4
Department of FinanceAustralian Government ICT Trends Report
2015-16
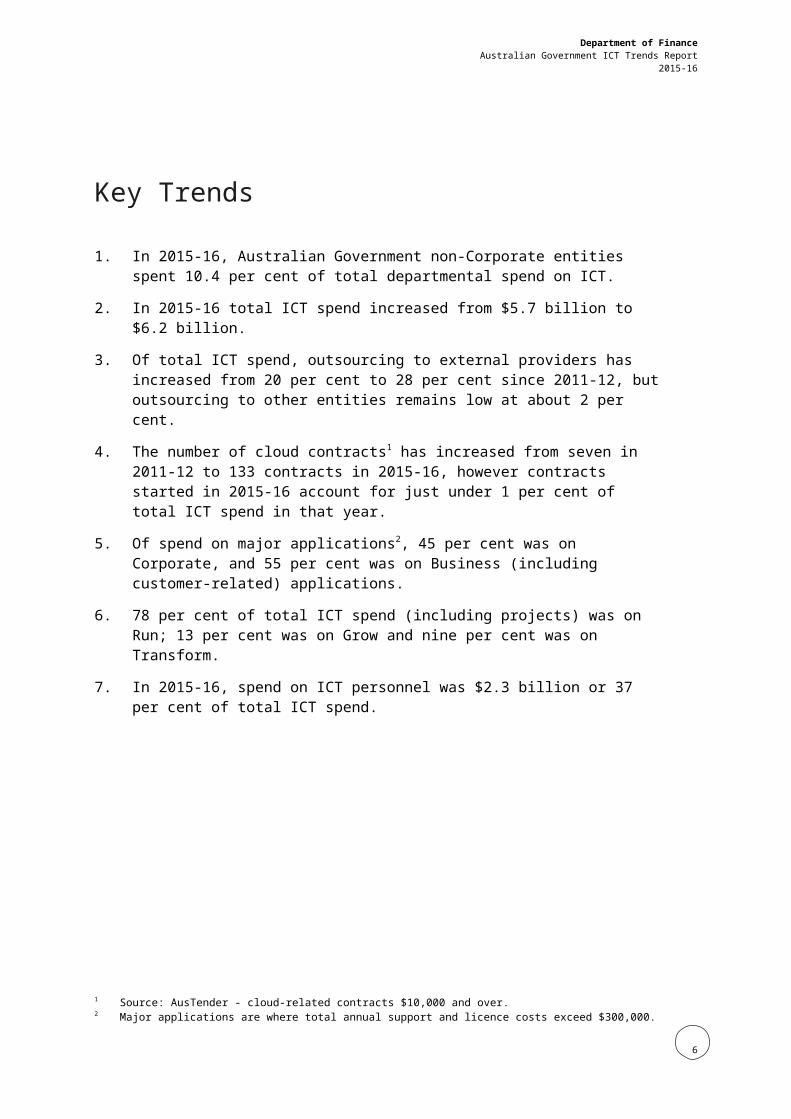
1. Key Trends
1. In 2015-16, Australian Government non-Corporate entities spent 10.4 per cent of total departmental spend on ICT.
2. In 2015-16 total ICT spend increased from $5.7 billion to $6.2 billion.
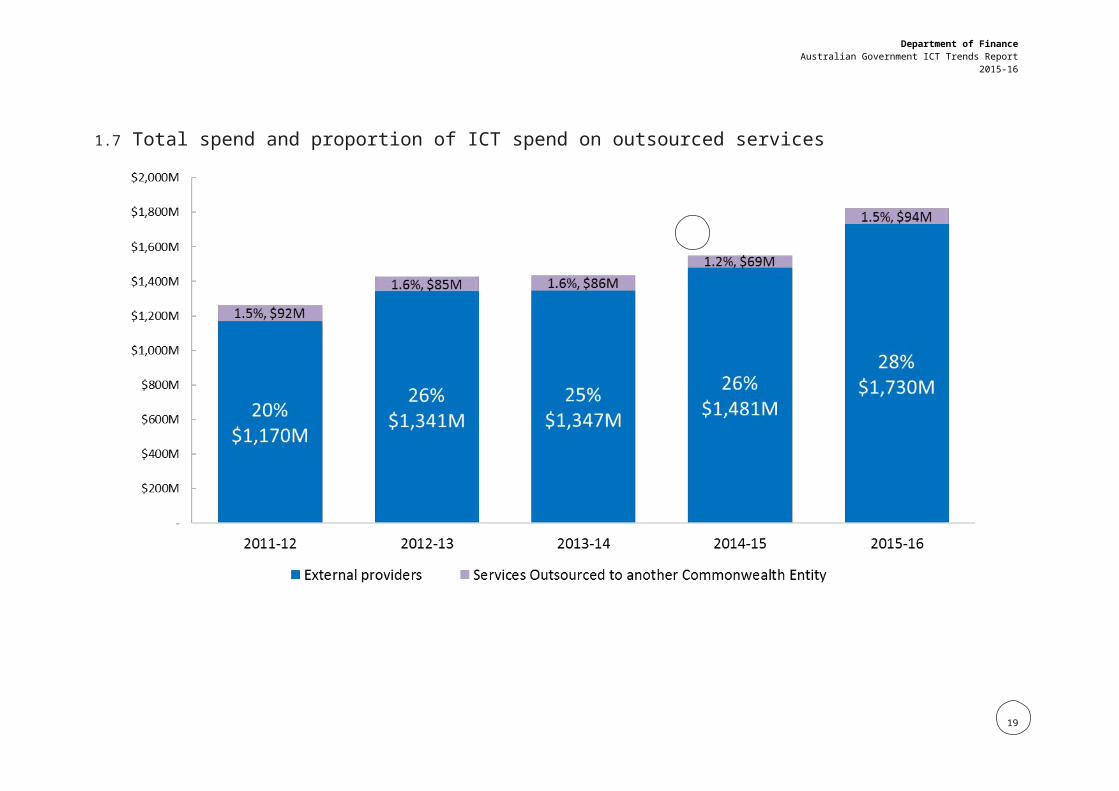
3. Of total ICT spend, outsourcing to external providers has increased from 20 per cent to 28 per cent since 2011-12, but outsourcing to other entities remains low at about 2 per cent.
4. The number of cloud contracts1 has increased from seven in 2011-12 to 133 contracts in 2015-16, however contracts started in 2015-16 account for just under 1 per cent of total ICT spend in that year.
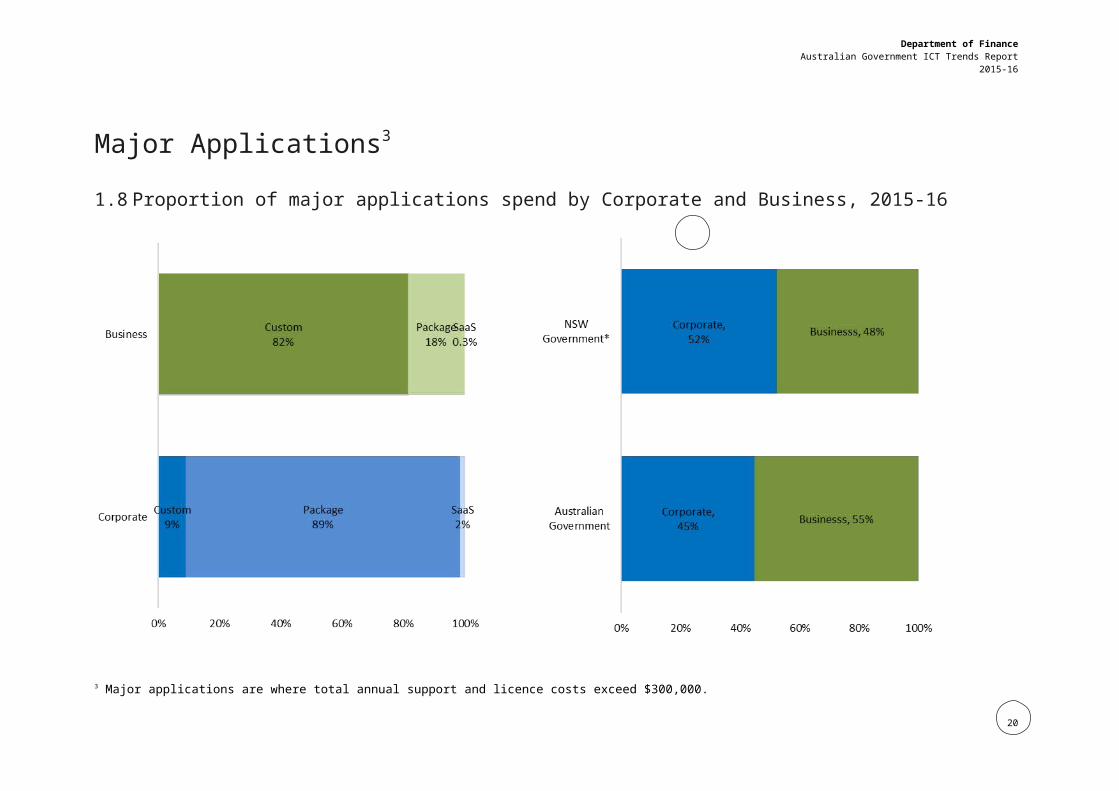
5. Of spend on major applications2, 45 per cent was on Corporate, and 55 per cent was on Business (including customer-related) applications.
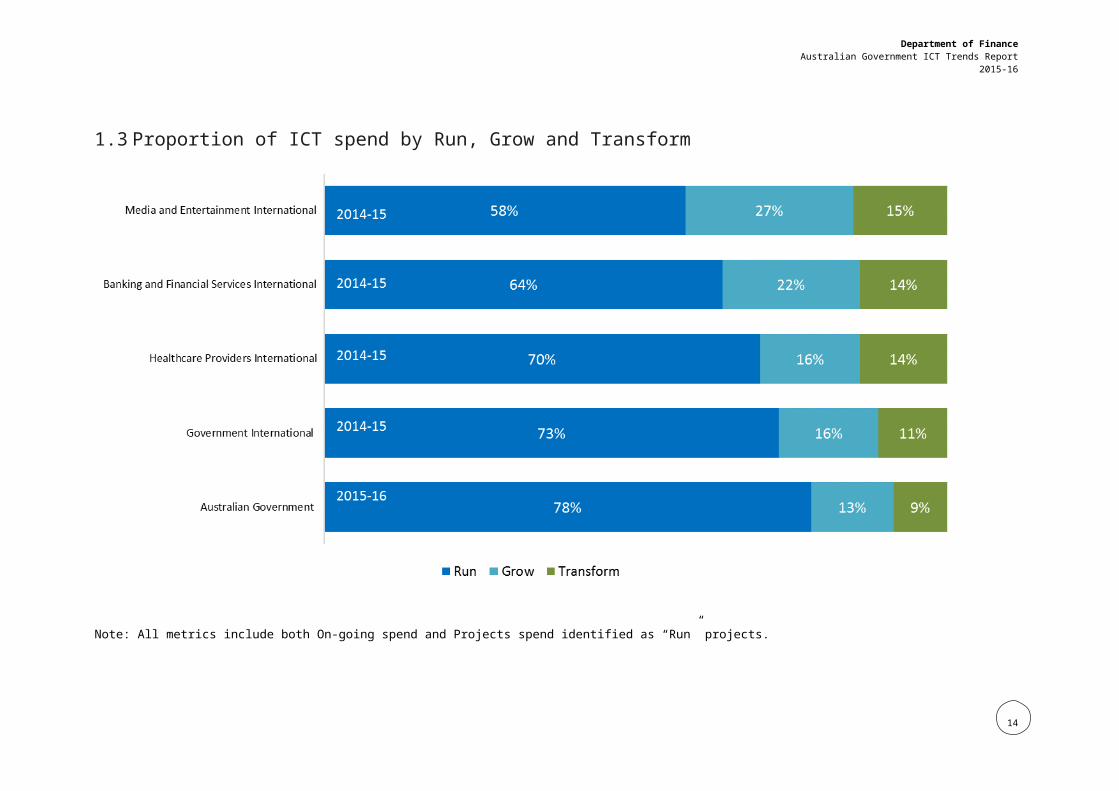
6. 78 per cent of total ICT spend (including projects) was on Run; 13 per cent was on Grow and nine per cent was on Transform.
7. In 2015-16, spend on ICT personnel was $2.3 billion or 37 per cent of total ICT spend.
1 Source: AusTender - cloud-related contracts $10,000 and over.2 Major applications are where total annual support and licence costs exceed $300,000.
5
Department of FinanceAustralian Government ICT Trends Report
2015-16
ICT SPEND ICT FTEs
END USER DEVICES NON-ICT PERSONNEL SUPPORTED PER ICT PERSONNEL
6
2011-12 2015-16 2011-12 2015-16
2011-12 2015-16 2011-12 2015-16
$6.2B$5.9B
15,80017,800
TRENDS AT A GLANCE …
Department of FinanceAustralian Government ICT Trends Report
2015-16
ICT SPEND BY SERVICE GROUP
ICT SPEND BY COST ELEMENT
7
Department of FinanceAustralian Government ICT Trends Report
2015-16
8
Department of FinanceAustralian Government ICT Trends Report
2015-16
CLOUD - RELATED PROJECTS BY SERVICE TYPE, 2015-16*
*Source: AusTender. Graphs contain data on cloud-related contracts grouped by the financial year they were signed.
9
Department of FinanceAustralian Government ICT Trends Report
2015-16
2. Other Findings
10
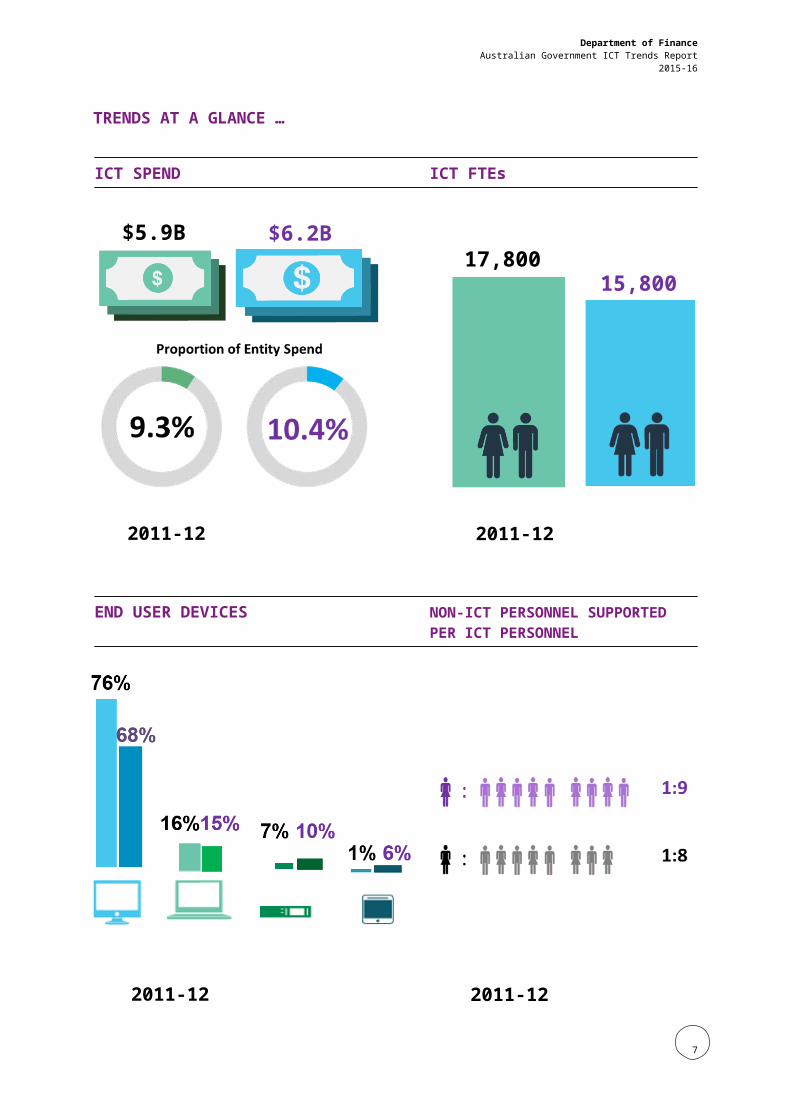
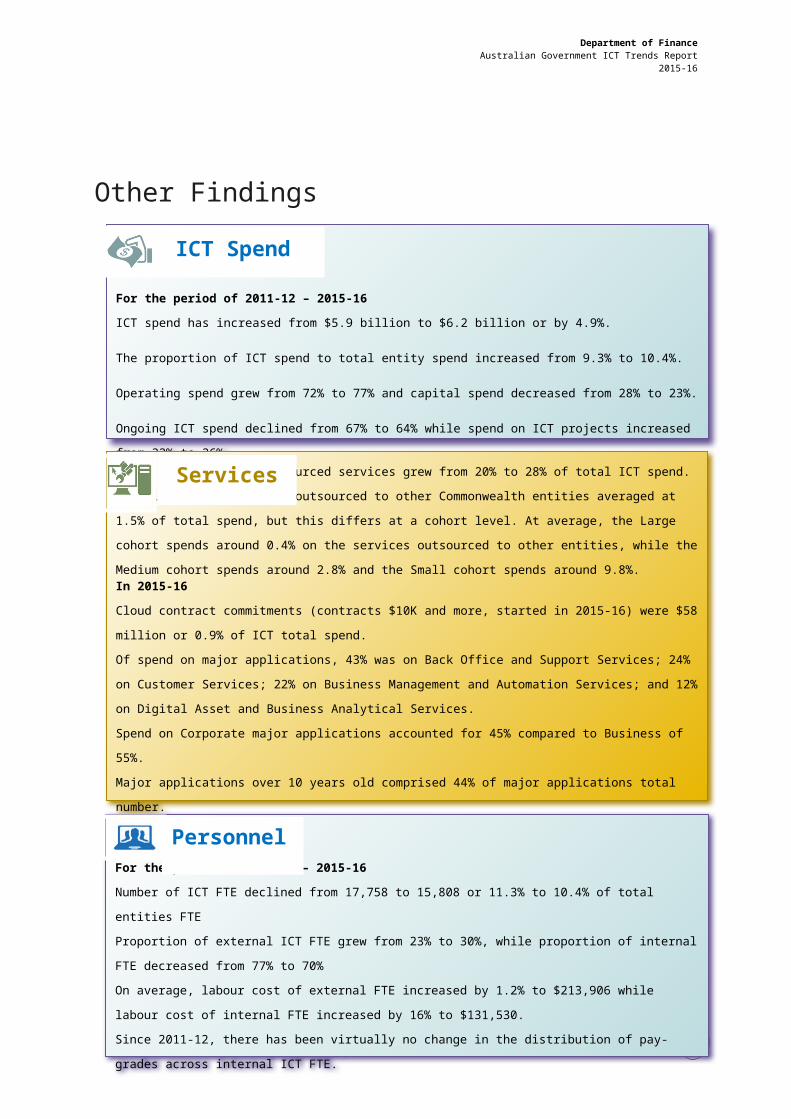
ICT SpendFor the period of 2011-12 – 2015-16 ICT spend has increased from $5.9 billion to $6.2 billion or by 4.9%.
The proportion of ICT spend to total entity spend increased from 9.3% to 10.4%.
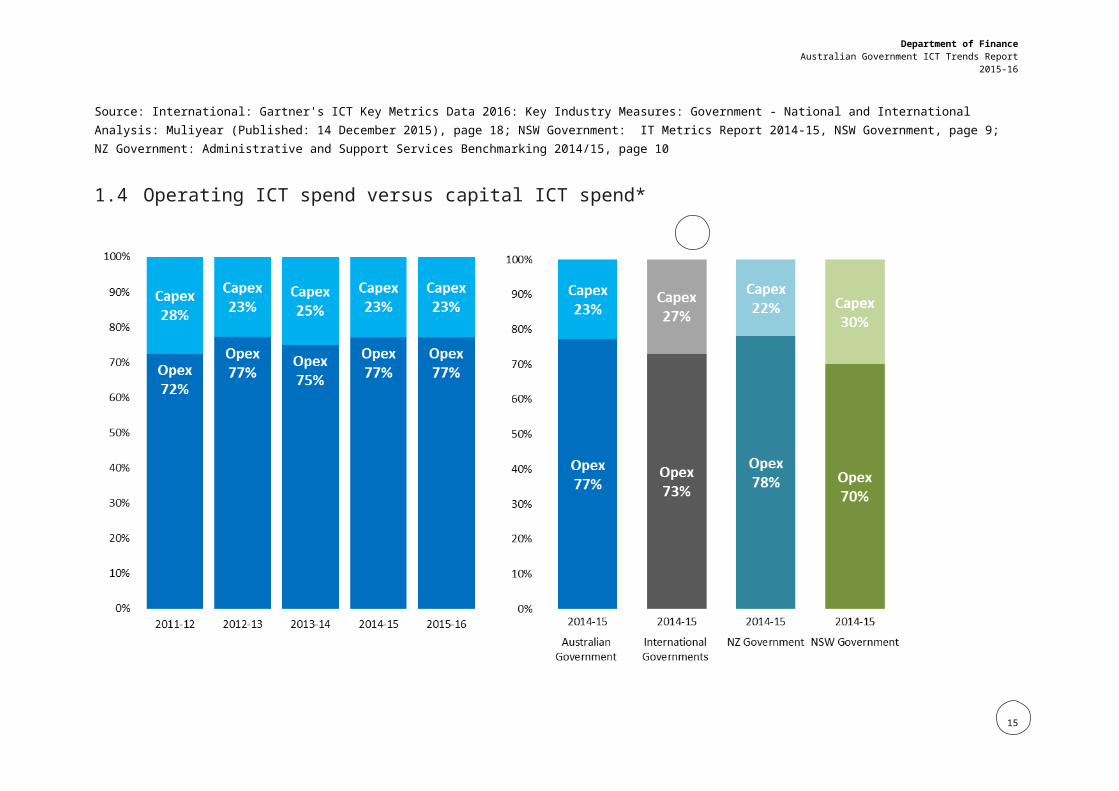
Operating spend grew from 72% to 77% and capital spend decreased from 28% to 23%.
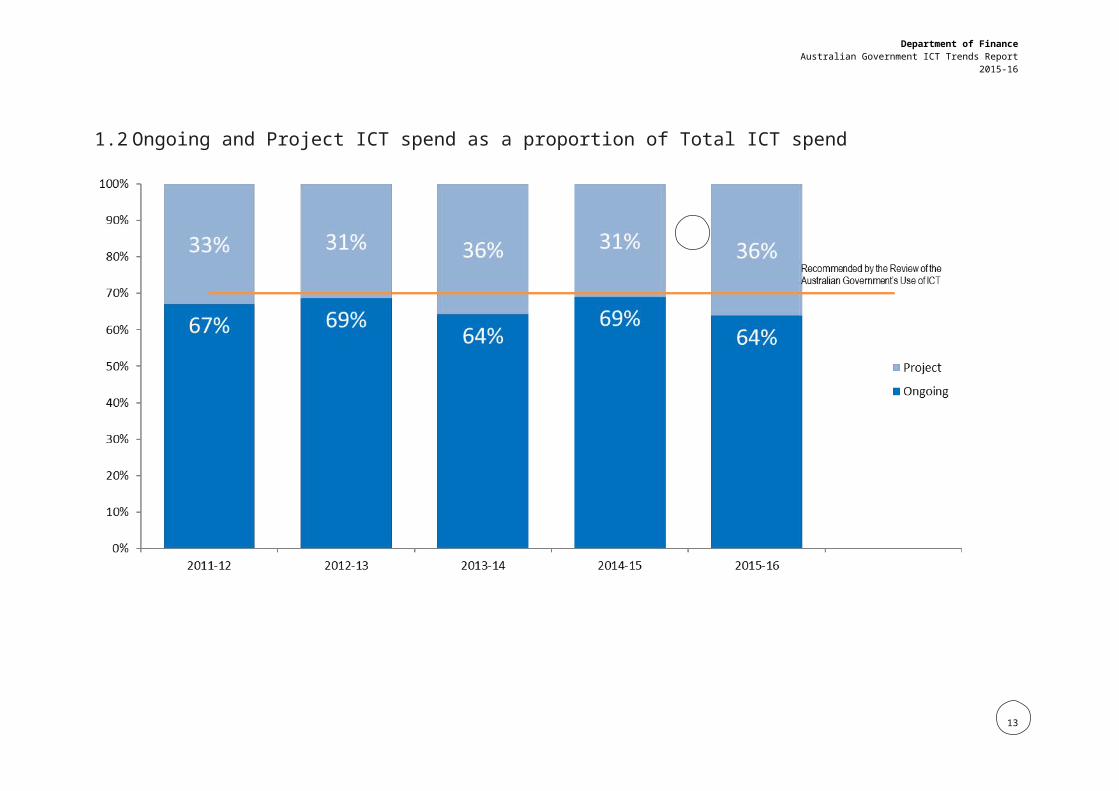
Ongoing ICT spend declined from 67% to 64% while spend on ICT projects increased from 33% to 36%.
In 2015-16, 78% of total ICT spend was on Run (On-going and Run projects); 13% was on Grow and
9% on Transform.
Services
Since 2011-12 total outsourced services grew from 20% to 28% of total ICT spend.
In 2015-16, ICT services outsourced to other Commonwealth entities averaged at 1.5% of total spend,
but this differs at a cohort level. At average, the Large cohort spends around 0.4% on the services out-
sourced to other entities, while the Medium cohort spends around 2.8% and the Small cohort spends
around 9.8%.
In 2015-16 Cloud contract commitments (contracts $10K and more, started in 2015-16) were $58 million or 0.9% of
ICT total spend.
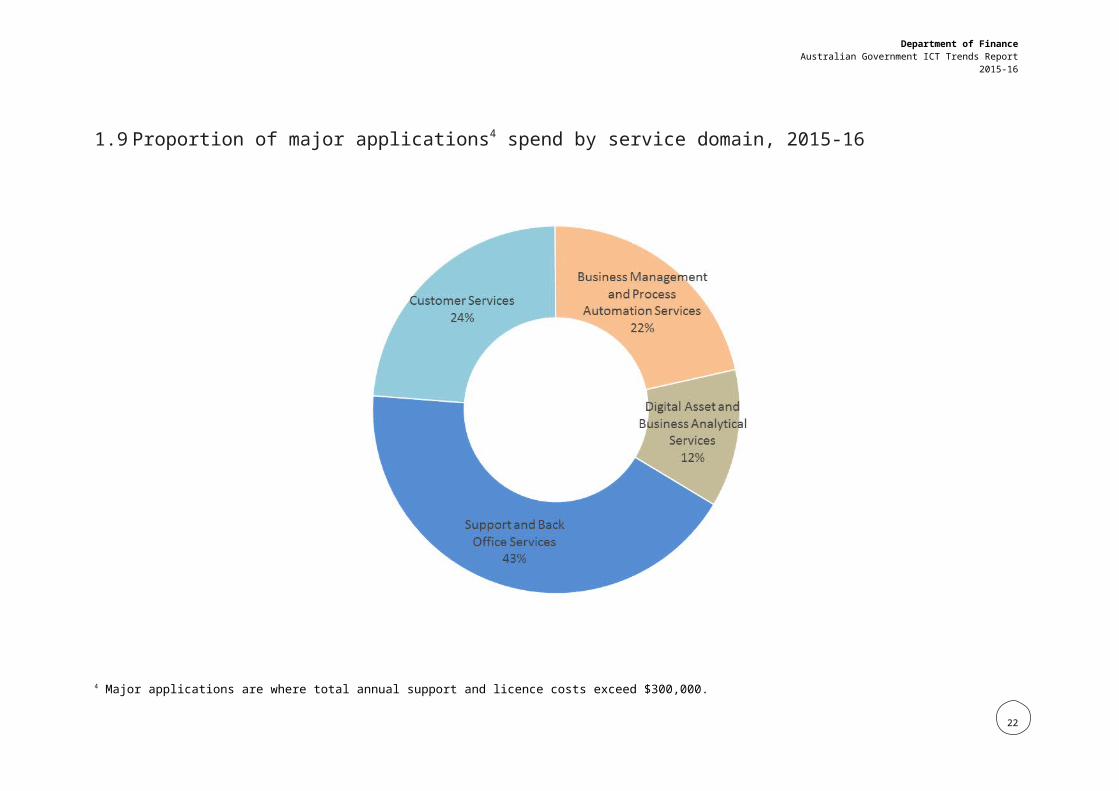
Of spend on major applications, 43% was on Back Office and Support Services; 24% on Customer Ser-
vices; 22% on Business Management and Automation Services; and 12% on Digital Asset and Business
Analytical Services.
Spend on Corporate major applications accounted for 45% compared to Business of 55%.
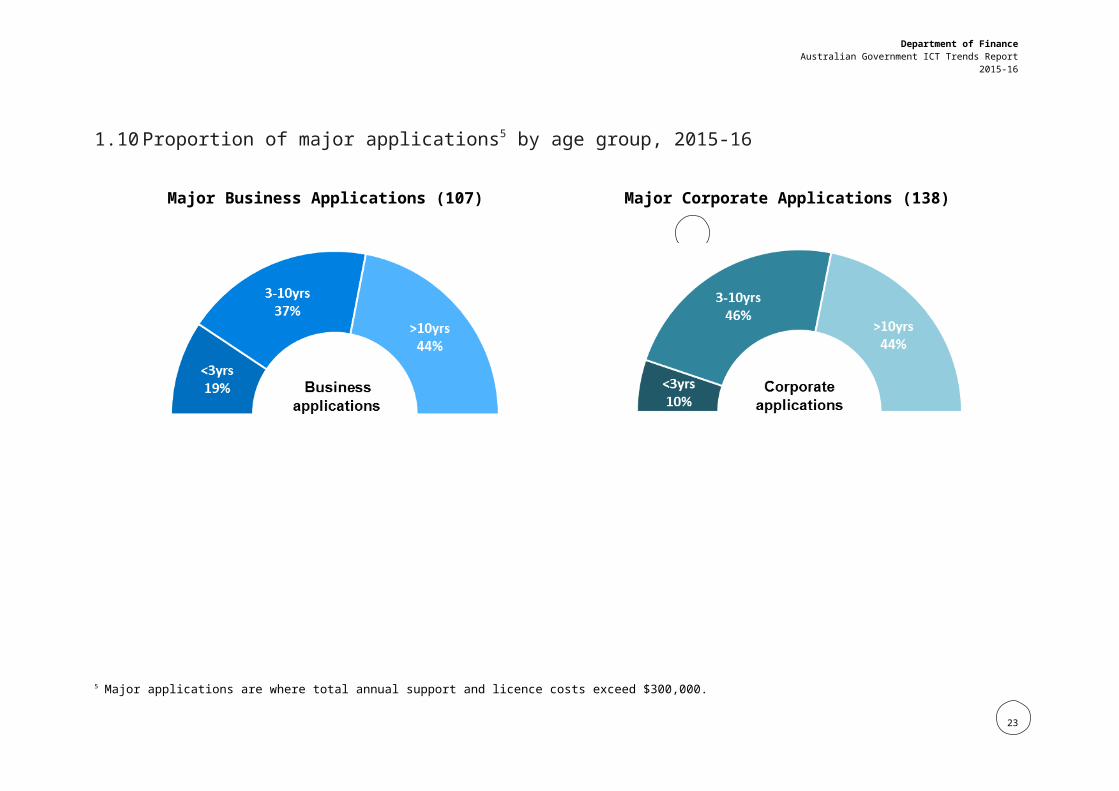
Major applications over 10 years old comprised 44% of major applications total number.
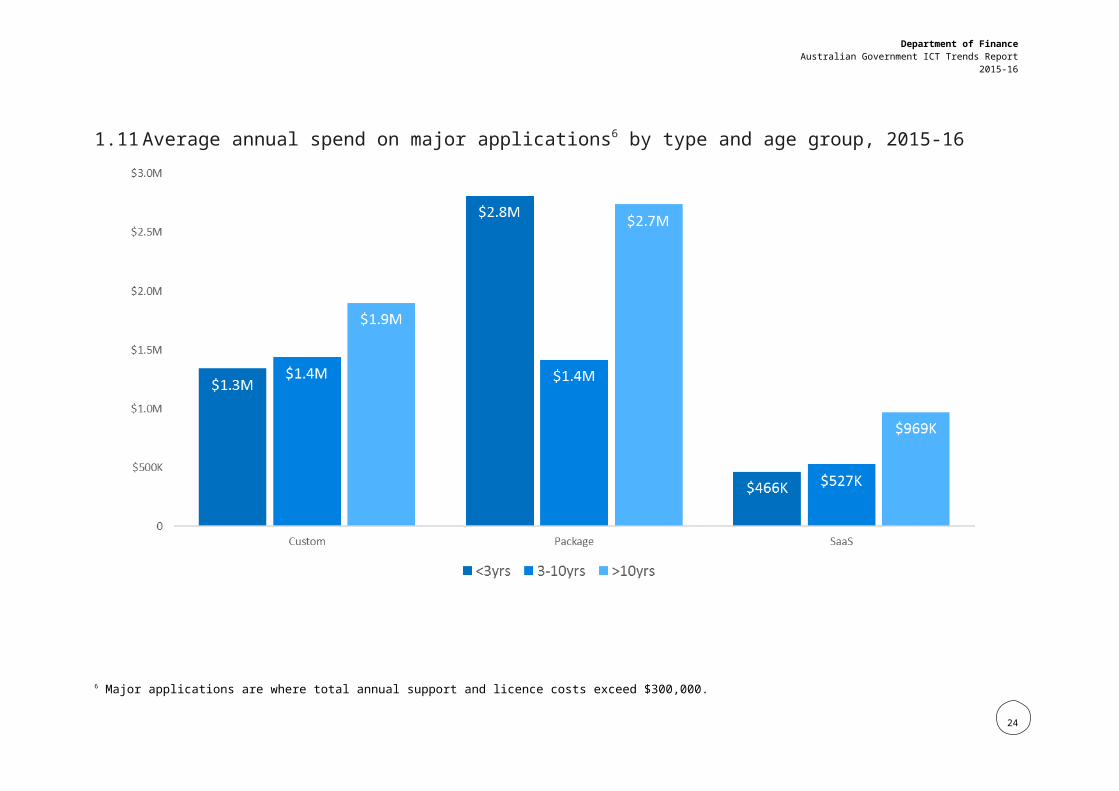
Spend on applications by type was distributed as follows: Custom - 49%; Package - 50%; SaaS - 1%.
Personnel
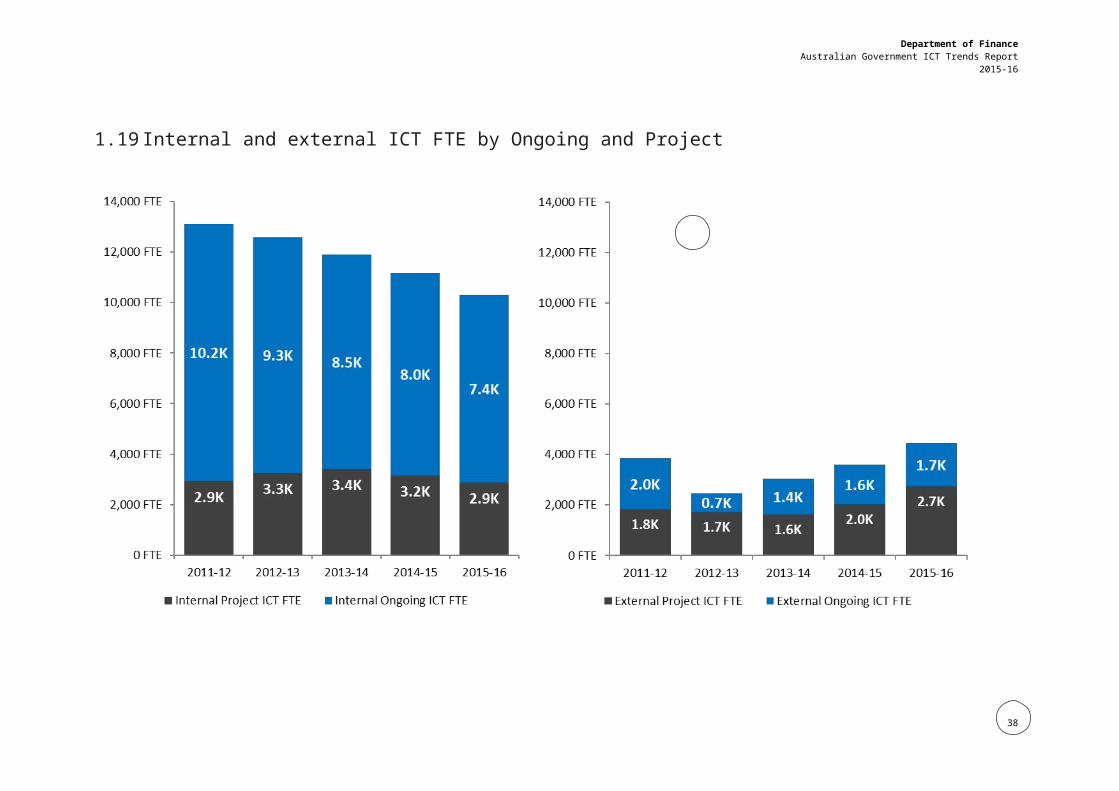
For the period of 2011-12 – 2015-16 Number of ICT FTE declined from 17,758 to 15,808 or 11.3% to 10.4% of total entities FTE
Proportion of external ICT FTE grew from 23% to 30%, while proportion of internal FTE decreased from
77% to 70%
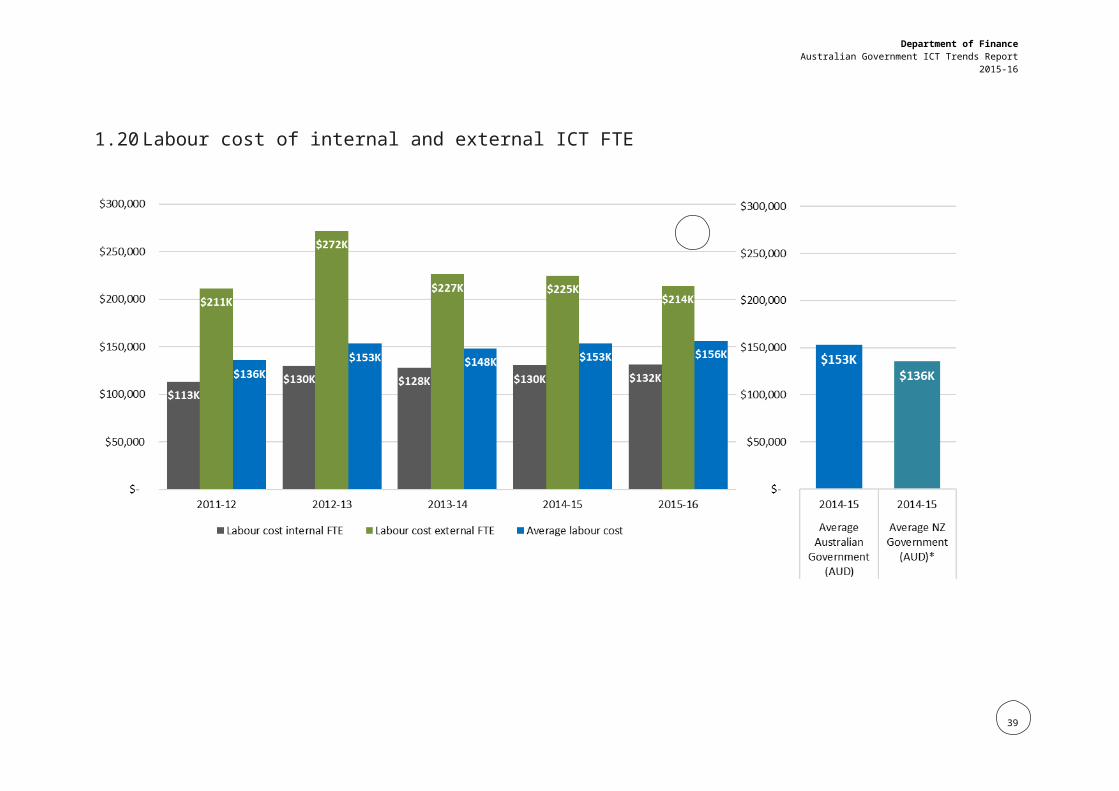
On average, labour cost of external FTE increased by 1.2% to $213,906 while labour cost of internal FTE
increased by 16% to $131,530.
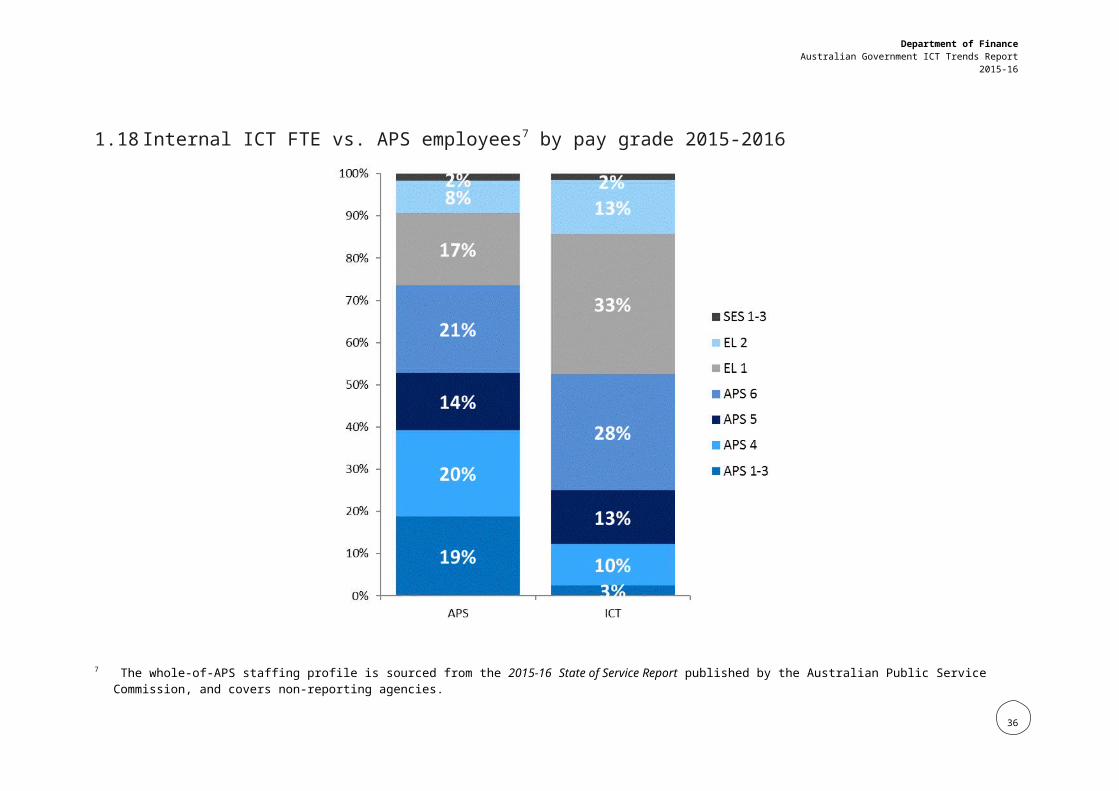
Since 2011-12, there has been virtually no change in the distribution of pay-grades across internal ICT
FTE.
Department of FinanceAustralian Government ICT Trends Report
2015-16
3. ICT Spend
3.1 Total ICT spend as a proportion of total entity departmental spend
Note: Previous year’s figures have been indexed to 2015-16 CPI levels.
11
Department of FinanceAustralian Government ICT Trends Report
2015-16
3.2 Ongoing and Project ICT spend as a proportion of Total ICT spend
12
Department of FinanceAustralian Government ICT Trends Report
2015-16
3.3 Proportion of ICT spend by Run, Grow and Transform
Note: All metrics include both On-going spend and Projects spend identified as “Run” projects.Source: International: Gartner's ICT Key Metrics Data 2016: Key Industry Measures: Government - National and International Analysis: Muliyear (Published: 14 December 2015), page 18; NSW Government: IT Metrics Report 2014-15, NSW Government, page 9; NZ Government: Administrative and Support Services Benchmarking 2014/15, page 10
13
Department of FinanceAustralian Government ICT Trends Report
2015-16
3.4 Operating ICT spend versus capital ICT spend*
*Sources: NZ – Administrative and Support Services Benchmarking, 2014/15. NSW – ICT Metrics Report, 2014-15. International – Gartner IT Key Metrics Data 2016: Key Industry Measures: Government – National and International Analysis: Multiyear
14
Department of FinanceAustralian Government ICT Trends Report
2015-16
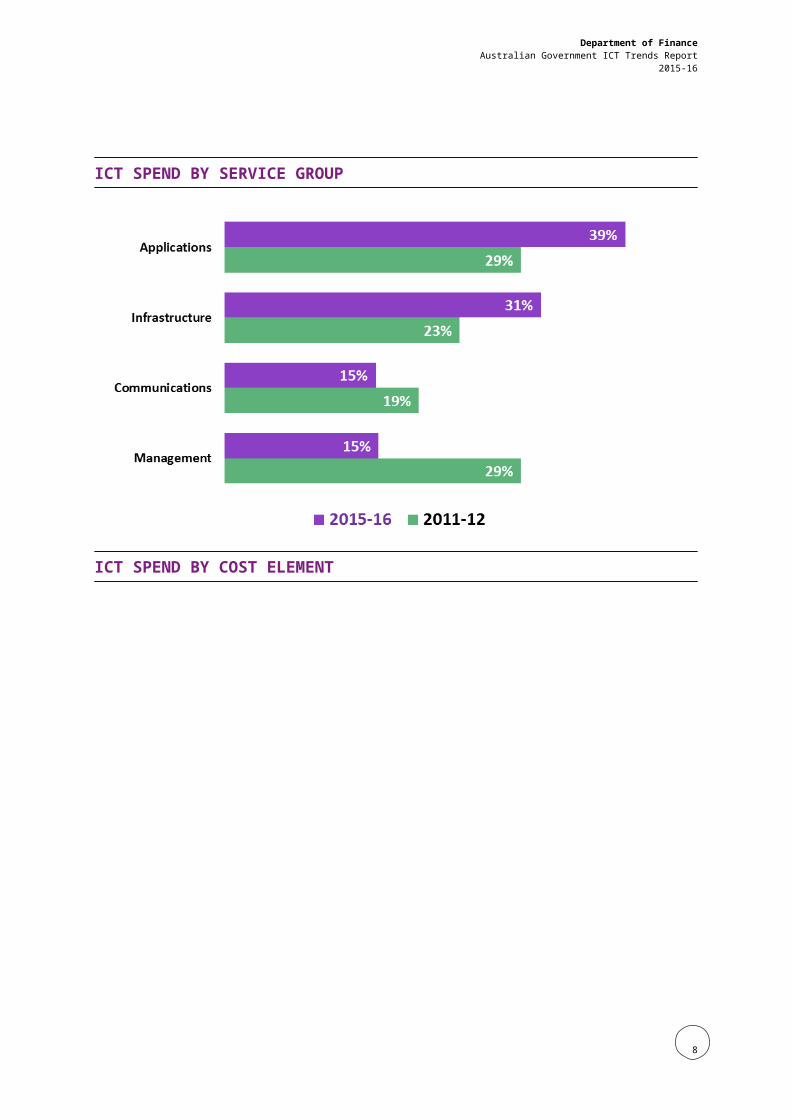
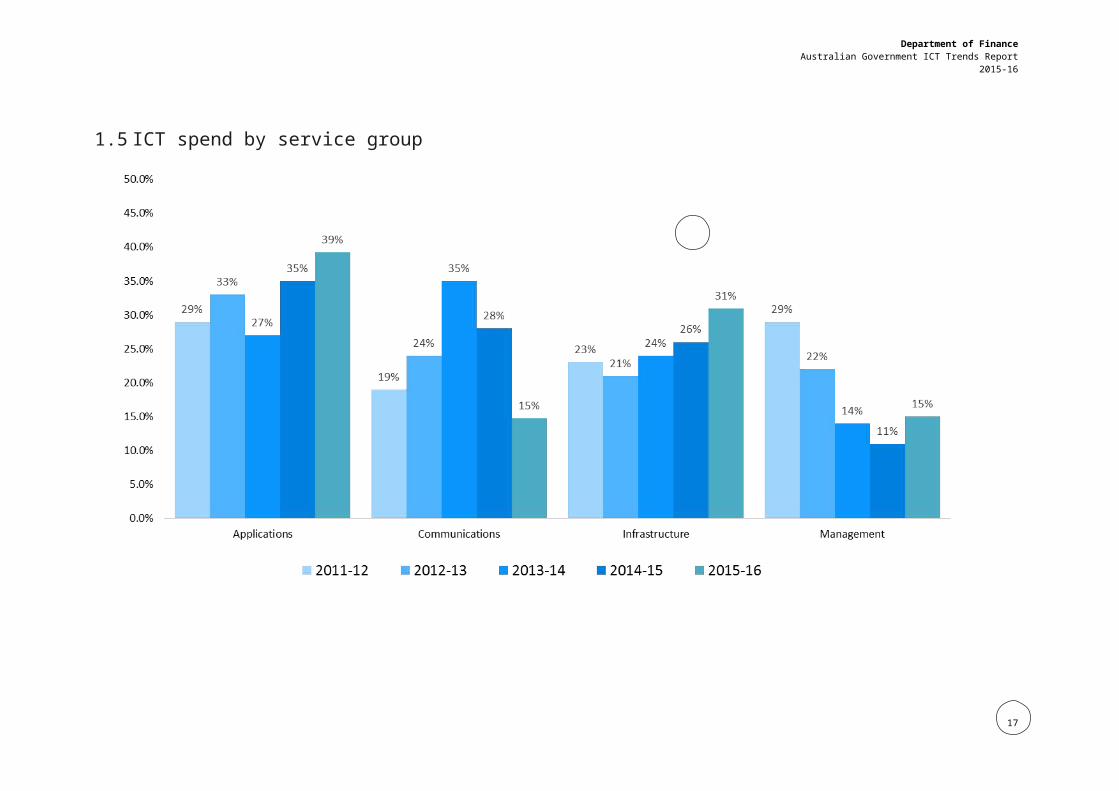
3.5 ICT spend by service group
15
Department of FinanceAustralian Government ICT Trends Report
2015-16
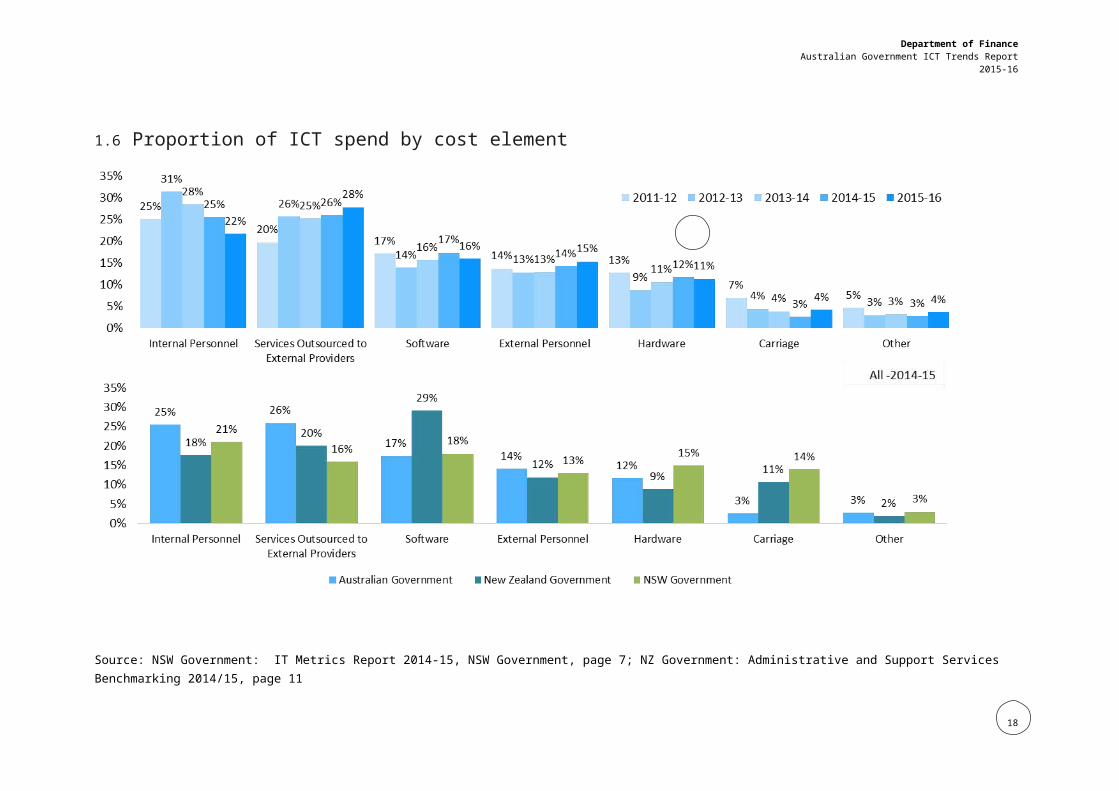
3.6 Proportion of ICT spend by cost element
Source: NSW Government: IT Metrics Report 2014-15, NSW Government, page 7; NZ Government: Administrative and Support Services Benchmarking 2014/15, page 11
16
Department of FinanceAustralian Government ICT Trends Report
2015-16
3.7 Total spend and proportion of ICT spend on outsourced services
17
Department of FinanceAustralian Government ICT Trends Report
2015-16
4. Major Applications3
4.1 Proportion of major applications spend by Corporate and Business, 2015-16
3 Major applications are where total annual support and licence costs exceed $300,000.
18
Department of FinanceAustralian Government ICT Trends Report
2015-16
*Source: NSW Government: IT Metrics Report 2014-15, NSW Government, page 8
19
Department of FinanceAustralian Government ICT Trends Report
2015-16
4.2 Proportion of major applications4 spend by service domain, 2015-16
4 Major applications are where total annual support and licence costs exceed $300,000.
20
Department of FinanceAustralian Government ICT Trends Report
2015-16
4.3 Proportion of major applications5 by age group, 2015-16
Major Business Applications (107) Major Corporate Applications (138)
5 Major applications are where total annual support and licence costs exceed $300,000.
21
Department of FinanceAustralian Government ICT Trends Report
2015-16
4.4 Average annual spend on major applications6 by type and age group, 2015-16
6 Major applications are where total annual support and licence costs exceed $300,000.
22
Department of FinanceAustralian Government ICT Trends Report
2015-16
5. Infrastructure
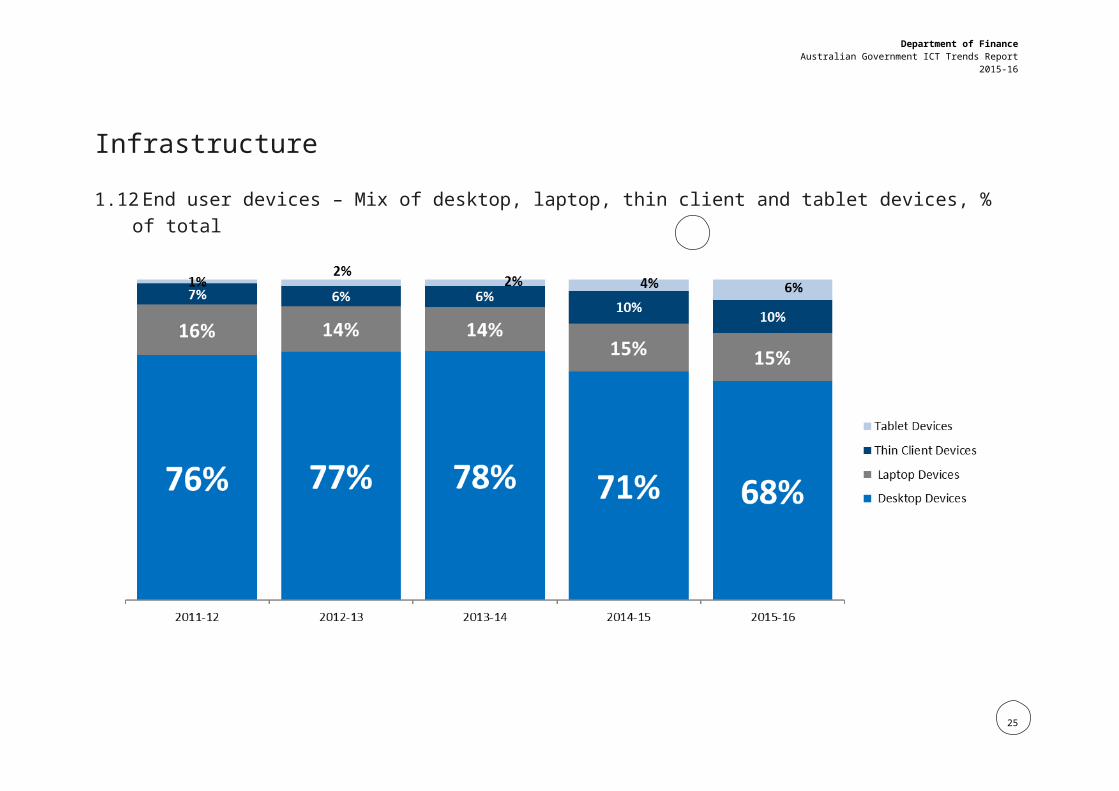
5.1 End user devices – Mix of desktop, laptop, thin client and tablet devices, % of total
23
Department of FinanceAustralian Government ICT Trends Report
2015-16
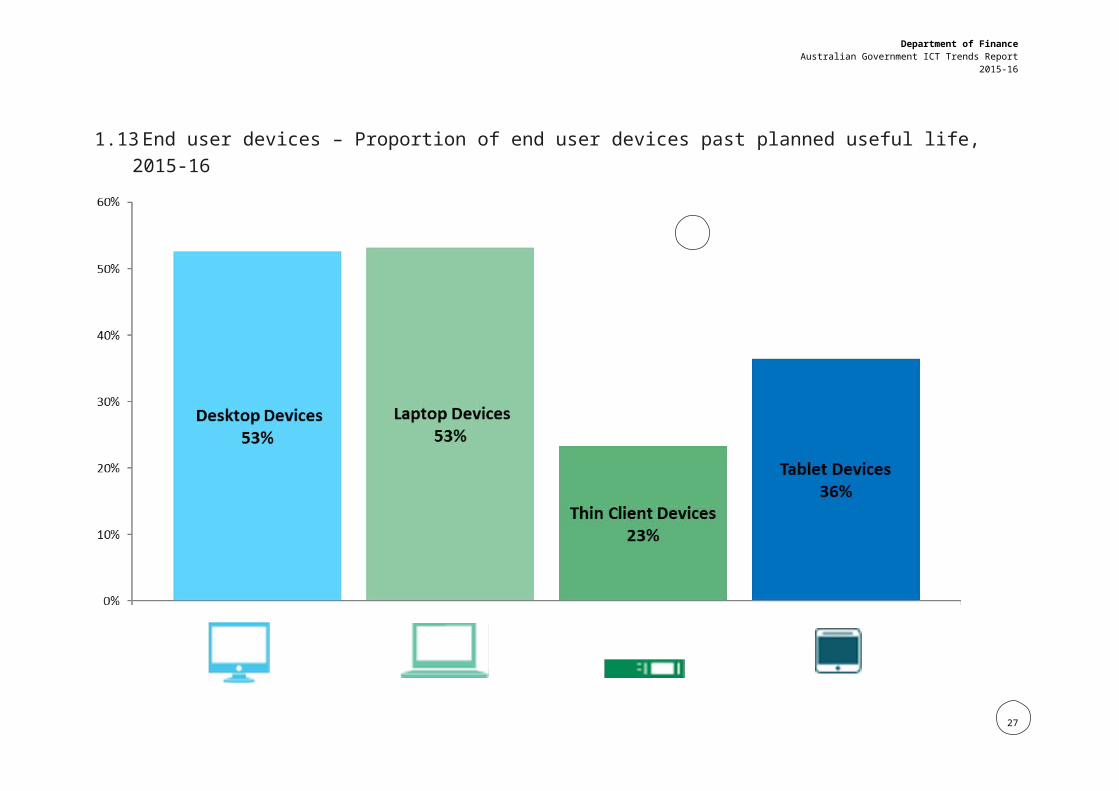
5.2 End user devices – Proportion of end user devices past planned useful life, 2015-16
24
Department of FinanceAustralian Government ICT Trends Report
2015-16
25
Department of FinanceAustralian Government ICT Trends Report
2015-16
6. Cloud
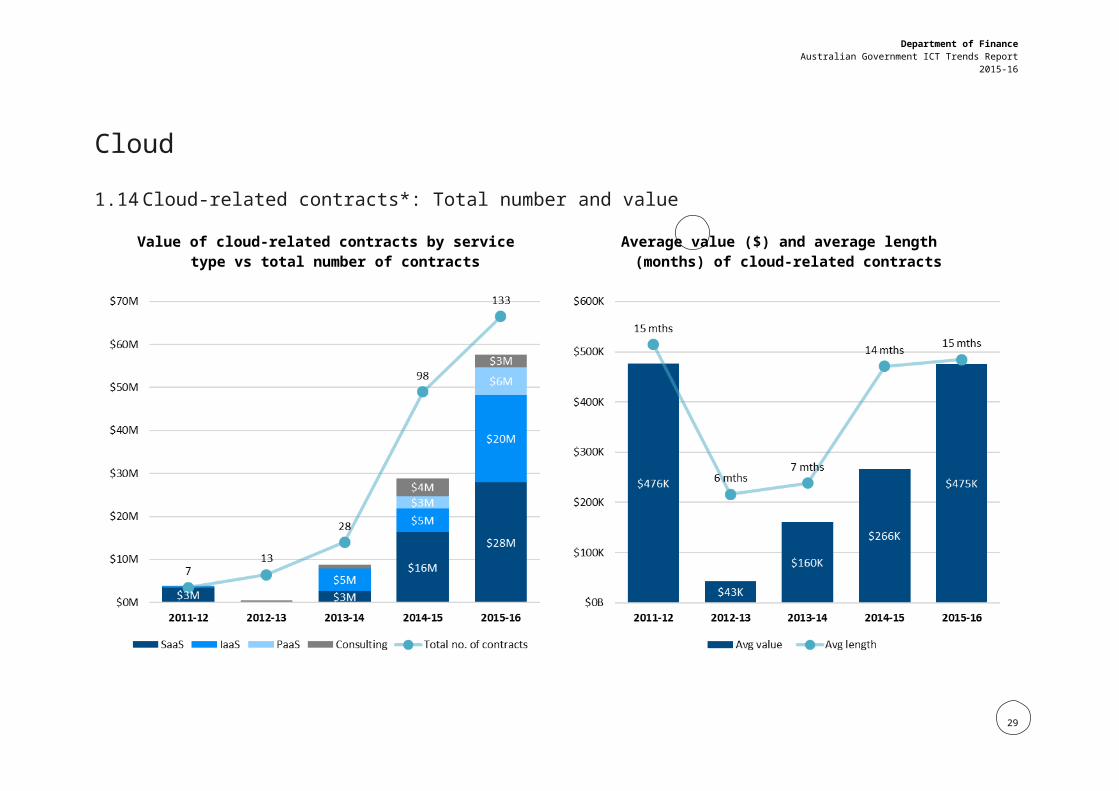
6.1 Cloud-related contracts*: Total number and value
Value of cloud-related contracts by service type vs total number of contracts
Average value ($) and average length (months) of cloud-related contracts
26
Department of FinanceAustralian Government ICT Trends Report
2015-16
*Source: AusTender.gov.au
27

Department of FinanceAustralian Government ICT Trends Report
2015-16
7. ICT FTE
7.1 Total ICT FTE
28
Department of FinanceAustralian Government ICT Trends Report
2015-16
29
: ICT to non-ICT staff ratio
Australian Government
International Government*
Department of FinanceAustralian Government ICT Trends Report
2015-16
7.2 Non-ICT personnel supported per ICT personnel
2015-16 : 1:9
2014-15 : 1:9
: 1:12 2013-14 : 1:9
: 1:12 2012-13 : 1:9
: 1:15 2011-12 : 1:8
: 1:11
Note: Calculations performed by the Australian Department of Finance. *International benchmarks source: Gartner IT Key Metrics Data 2016: Key Industry Measures: Government - National and International Analysis: Multiyear (December 2015).
30
Department of FinanceAustralian Government ICT Trends Report
2015-16
31

Department of FinanceAustralian Government ICT Trends Report
2015-16
7.3 Internal ICT FTE
Internal ICT FTE, % of total Internal ICT FTE by pay grade, % of total
32
Department of FinanceAustralian Government ICT Trends Report
2015-16
7.4 Internal ICT FTE vs. APS employees7 by pay grade 2015-2016
7 The whole-of-APS staffing profile is sourced from the 2015-16 State of Service Report published by the Australian Public Service Commission, and covers non-reporting agencies.
33

Department of FinanceAustralian Government ICT Trends Report
2015-16
34
Department of FinanceAustralian Government ICT Trends Report
2015-16
7.5 Internal and external ICT FTE by Ongoing and Project
35
Department of FinanceAustralian Government ICT Trends Report
2015-16
7.6 Labour cost of internal and external ICT FTE
Note: Labour cost for internal and external ICT FTE is calculated: the total labour expenditure divided by the number of FTE.
36

Department of FinanceAustralian Government ICT Trends Report
2015-16
*Source: NZ Government: Administrative and Support Services Benchmarking 2014/15, page 17
37
Department of FinanceAustralian Government ICT Trends Report
2015-16
8. Notes
8.1 Benchmarking objectives and purpose
The Australian Government introduced the ICT Benchmarking program to facilitate better practice and rigour in monitoring the efficiency and effectiveness of ICT investments. The Australian Government ICT Trends Report 2015–16 (the Report) informs government, industry and the general community about trends in Australian Government ICT use and expenditure.
The objectives of benchmarking are to:
measure the efficiency of ICT services;
inform policy development; and
support ICT investment decision-making at both entity and whole-of-government levels.
Finance aims to balance the need to change the metrics in response to policy and changing technology, while maintaining longitudinal trend analysis, and the effort required by entities to collect data.
Finance welcomes questions or feedback on this report via email at [email protected].
8.2 Benchmarking data source
All Non-Corporate Commonwealth entities participate in the annual ICT Benchmarking exercise. Entities provide data about their ICT costs, personnel and infrastructure. Cloud data is captured from AusTender (https://www.tenders.gov.au/).
8.3 Applicable qualifications
The following qualifications apply to the metrics presented in this Report (unless otherwise noted):
All ICT spend data excludes administered funds, except for administered funds that are used for whole-of-government operations.
All spend data are represented in real terms with the 2015-16 financial year base CPI indexation applied.
Data excludes military ICT spend.
Total spend metrics excludes intra-government spending.
Estimation of non-reporting is quantified by applying a CPI indexation to previous year’s data.
38
Department of FinanceAustralian Government ICT Trends Report
2015-16
Analysis is based on the data presented to Finance as at 7 December 2016. The findings in this report are subject to the provision of any updated data by entities after the date of this analysis.
Entities have been provided the opportunity to assure the accuracy of their data.
Small Cohort entities (representing 10% of total ICT spend) are excluded from some analyses as relevant data are not collected from them.
The report should be considered in conjunction with other efficiency indicators and the Government’s broader agenda.
8.4 Glossary
Short form Long form
APS Australian Public Service
Capex Capital Spend
FTE Full Time Equivalent
ICT Information and Communication Technology
LAN Local Area Network
Opex Operational Spend
8.5 Definitions
Cost elements
Carriage The costs of providing digital or analogue electronic impulses (including data, voice or video) over a distance.
External personnel spend External full time equivalent (FTE) personnel are staff who provide services on a time and materials basis (e.g. "body shopping"). These staff are generally contractors, but may also be described by agencies as consultants.
Hardware spend Spend on purchasing, leases, maintenance and repair for all physical ICT equipment, such as servers, PCs, terminals, printers, peripherals, printing equipment, networking and telecommunications equipment, materials/accessories and disaster recovery hardware.
Internal personnel spend For all internal FTE (e.g. Australian Public Service staff) involved in ICT activities, includes all wages and salaries, provisions for staff entitlements and staff on-costs.
Other spend Spend on occupancy, facilities, utilities and other ICT spend not captured in other cost element categories.
Services outsourced to external provider
Spend on services provided under a non-government third-party’s responsibility.
39
Department of FinanceAustralian Government ICT Trends Report
2015-16
Services outsourced to Other agencies
Spend on services provided under the responsibility of other agencies.
Software spend Spend on licences, as well as repair and maintenance for external and standard software, systems software, and standard office productivity applications as they apply to each service tower and the total agency level.
8.6 Service Domains
Service Domains
Customer Services Customer Relationship Management; Customer Preferences; and Customer Initiated Assistance
Business Management and Process Automation Services
Tracking and Workflow; Routing and Scheduling; Management of Process; Organisational Management; Investment Management; and Supply Chain Management
Digital Asset and Business Analytical Services
Content Management; Document Management; Knowledge Management; Records Management; Analyses and Statistics; Visualisation; Knowledge Discovery; Business Intelligence; and Reporting
Support and Back Office Services
Data Management; Human Resources; Financial Management; Assets/Materials Management; Development and Integration; Human Capital / Workforce Management; Security Management; Collaboration; Search; Communication; Systems Management; and Forms Management
40